

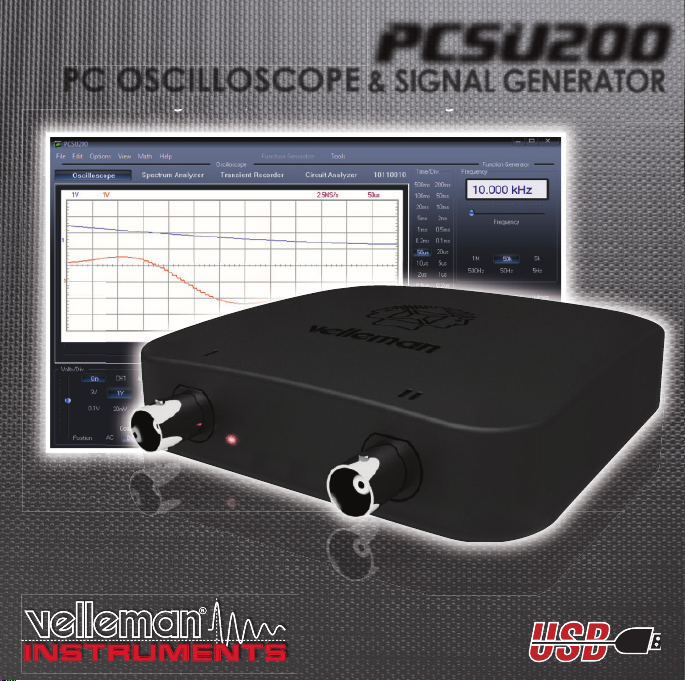
Page 1
G
PC OSCILLOSCOPE
g s
/
bref / Ratgeber / Instrucciones breves
OR
/ R
atg
r /
Getting started / Instructions en bref / Ratgeber / Instrucciones breves
etting started / Instructions en
PCSU200
& SIGNAL GENERATOR
SIGNAL GENERAT
Page 2
FR Consultez notre site www.velleman.eu pour plus d’information sur votre appareil.
NL Raadpleeg onze web site www.velleman.eu voor vertalingen en meer informatie van dit product.
UK Please check our web site www.velleman.eu for more info on this product.
S Bruksanvisning och annan information kan fi nnas på www.velleman.eu.
SF Käyttöohje sekä muuta informaatiota löytyy osoitteesta www.velleman.eu.
I La traduzione di questo manuale e tutte le informazioni con cernenti l'unità possono essere trovate sul
www.velleman.eu .
DK Oversættelsen af denne manual, samt alle øvrige informationer vedrørende enhederne, kan fi ndes på
www.velleman.eu .
D Anderen Informationen über diese Geräte fi nden Sie auf www.velleman.eu.
SP Otra información sobre los dispositivos se encuentran en www.velleman.eu
P A tradução deste Manual e toda a informação referente às uni dades pode ser encontrada em
www.velleman.eu .
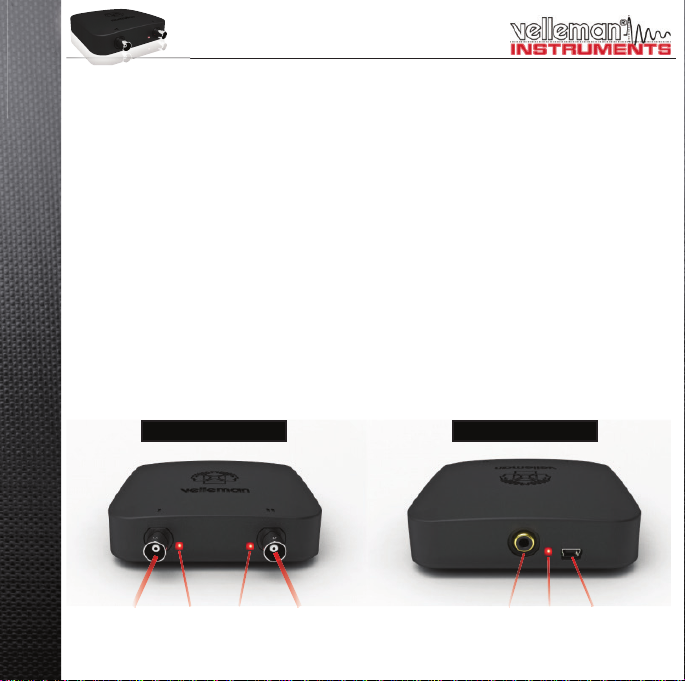
FRONT REAR
CH1 CH2
on LED
CH1
on LED
CH2
on LED
Out USB
2
Page 3

English :
Welcome ................................................................................................................................................................... 4
Safety and warnings ................................................................................................................................................. 5
Install the software.................................................................................................................................................... 5
Hardware connection & Starting the software .......................................................................................................... 6
The Function generator module ............................................................................................................................... 7
The Oscilloscope module ......................................................................................................................................... 8
The Spectrum analyser module................................................................................................................................ 9
The Transient recorder module .............................................................................................................................. 10
Bode plot module.....................................................................................................................................................11
Français:
Introduction ............................................................................................................................................................. 12
Sécurité et advertissements ................................................................................................................................... 13
Installation du logiciel ............................................................................................................................................. 13
Connexion de périphérique et Lancement du logiciel............................................................................................. 14
Le générateur de fonction....................................................................................................................................... 15
L’oscilloscope ......................................................................................................................................................... 16
L’analyseur de spectre............................................................................................................................................ 17
L’enregistreur de signaux transitoires ..................................................................................................................... 18
Le diagramme de Bode .......................................................................................................................................... 19
Deutsch:
Einführung .............................................................................................................................................................. 20
Sicherheitshinweisse .............................................................................................................................................. 21
Installation der Software ......................................................................................................................................... 21
Anschluss der Hardware und Starten der Software ............................................................................................... 22
Der Funktionsgenerator .......................................................................................................................................... 23
Das Oszilloskop ...................................................................................................................................................... 24
De Spektrumanalysator .......................................................................................................................................... 25
De Transientenrecorder .......................................................................................................................................... 26
De Bode plotter....................................................................................................................................................... 27
Español:
Introducción ............................................................................................................................................................ 28
Seguridad y advisis ................................................................................................................................................ 29
Instalar el software ................................................................................................................................................. 29
Instalar el hardware y ejecutar el software ............................................................................................................. 30
El generador de funciones...................................................................................................................................... 31
El osciloscopio ........................................................................................................................................................ 32
El analizador de espectro ....................................................................................................................................... 33
El Bode plotter ........................................................................................................................................................ 34
Informaciones adicionales ...................................................................................................................................... 35
3
Page 4

WELCOME TO PC-LAB200 SOFTWARE
For the PCSU200 unit, a complete USB-powered lab-in-a-box!
Feature-packed PCLab200 software for two channel oscilloscope, spectrum analyzer, recorder, function
generator and Bode plotter. Integrated signal wave editor and automated sequence generator, using fi le or
external input.
The hardware is not necessary to evaluate the software in Demo mode.
4
General information
markers for amplitude/voltage and frequency/time•
input coupling: DC, AC and GND•
8 bit resolution•
storage of display and data•
supply from USB port (500mA)*•
dimensions: 100x100x35mm / 3,9x3,9x1.4"•
Spectrum analyser:
frequency range: 0 .. 120Hz to 12MHz•
linear or logarithmic timescale•
operating principle: FFT (Fast Fourier Transform)•
FFT resolution: 2048 lines•
FFT input channel: CH1 or CH2•
zoom function•
Transient recorder:
timescale: 20ms/Div to 2000s/Div•
max record time: 9.4hour/screen•
automatic storage of data•
automatic recording for more than 1 year•
max. number of samples: 100/s•
min. number of samples: 1 sample/20s•
* NOTE: it is NOT recommended to use an USB - HUB device, this can cause the software to stop working.
SPECIFICATIONS ARE SUBJECT TO MODIFICATIONS - DLL available for own development - www.velleman.eu
Function generator
frequency range: sine from 0.5Hz to 1MHz•
square and triangle from 0.5Hz to 500kHz•
extended waveform library •
amplitude range: 200mVpp to 8Vpp @ 1KHz// •
output impedance: 50ohm
Oscilloscope
bandwidth: two channels DC to 12 MHz ±3dB•
input impedance: 1 Mohm / 30pF•
maximum input voltage: 30V (AC + DC)•
time base: 0.1μs to 500ms per division•
input range: 10mV to 3V/division•
readouts: True RMS, dBV, dBm, p to p, Duty •
cycle, Frequency…
record length: 4K samples / channel•
sampling frequency: 250Hz to 25MHz•
sample history and digital grab function•
Bode plotter
Automated sync between oscilloscope and •
generator
Frequency range: 1kHz , 10kHz, 100kHz, 1MHz•
Frequency start: 1Hz, 10Hz, 100Hz, 1kHz, 10kHz•
Page 5
SAFETY & WARNINGS
a
ee
a
Instruments grounds are interconnected and connected to PC ground. Max. voltage between probe tip and ground: 30V AC+DC at all
times! Before performing any measurement, make sure that the circuit is galvanically seperated from the AC power (mains)!
nected to PC ground. M
If necessary, use a safety isolation transformer.
x. voltage betw
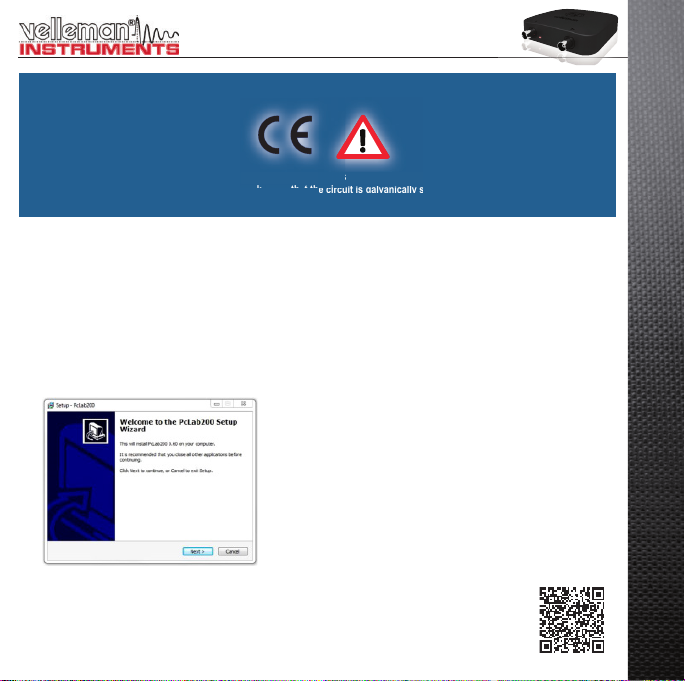
HOW TO INSTALL PC-LAB200 SOFTWARE?
Minimum system requirements :
Windows™XP/Vista/7 (*) 32 or 64bit•
VGA display card (1024x768 recommended)•
10MB free hard disk space. •
Mouse or pointing device.•
Free USB port (1.1 or 2.0) •
Download the latest software version from www.velleman.eu
Type PCSU200 in the search box and check the
download section.
Download the PcLAB200_setup.zip fi le•
Unzip the fi les in a folder on your drive•
Double click the “setup.exe” fi le•
An install wizard will guide you trough the complete installation
procedure. Shortcuts to the Pc-Lab200 software can be installed.
(*) Note: You will need local Administrator privileges to successfully complete the installation, contact
your system administrator for assistance. See also the “ReadME” fi le in the installed folder.
*Microsoft Windows™ XP/VISTA/7 (*) are registered trademarks
www.velleman.eu
5
Page 6
HARDWARE SET-UP
(CLOSE ALL PROGRAMS BEFORE CONTINUING)
USB driver install:
Connect your PCSU200 unit to a free USB port•
Follow the on screen driver installation procedure.•
If Windows asks for Windows Update, select “not at this time”•
Install the driver from a specifi c location, then browse your drive and select the folder “PCSU200Driver”. •
(press “next”)
If Windows indicate “has not passed Windows logo testing…” select “Continue Anyway”.•
After fi nishing, you can check the driver installation in the Device Manager list. •
It is possible that the PC asks to “restart” for proper installation•
Starting the software :
Locate the Pc-Lab200 software shortcuts (programs.. Pc-Lab200 …)
Click the icon to start the main program. “loading, please wait” should appear. Then the channel indicator
LEDs must go ON. (*)
The main program automatically launches the Oscilloscope and generator screen, which is shown on the next
pages. Should you receive an error (ex. If no unit is detected), disconnect and reconnect the USB cable and
try again or, if you want to access the demo mode (no unit is needed) :
- Click the Options menu, and select ‘Hardware Setup’ > demo mode
Note:
At fi rst time power-up, the oscilloscope will calibrate itself automatically.•
The actual screens can differ from the one shown in this manual. •
6
Page 7
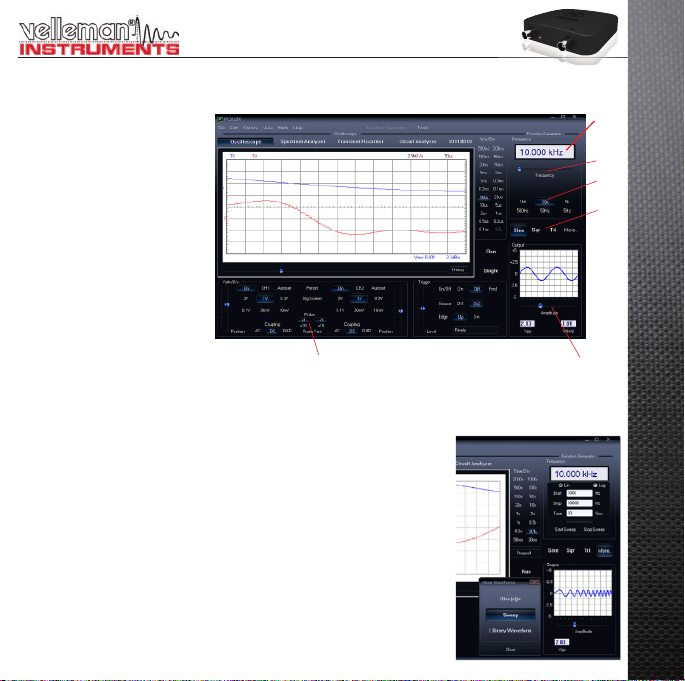
THE FUNCTION GENERATOR MODULE :
What ? :
Most common wave-forms are
accessible at the touch of a
button. A library with special
functions is provided, as well
as a Wave Editor, to create
virtually any kind of waveform.
4
3
2
1
6
How ? :
Click on the desired waveform (• 1).
Select the desired frequency range (• 2).
Set the exact frequency by sliding (• 3) or click the frequency readout (4) and enter a value.
Adjust the amplitude (• 5)
(• 6) shows a simulated preview of the output waveform
The ‘More Functions’- button :
The ‘More Functions’-button gives access to special purpose waveforms such
as arbitrary waveforms, and frequency sweeps. It also gives access to the
waveform library.
Note: The Probe test button (7) makes the generator output a signal, suitable
for your scope probe calibration at X10 setting.
7
5
7
Page 8
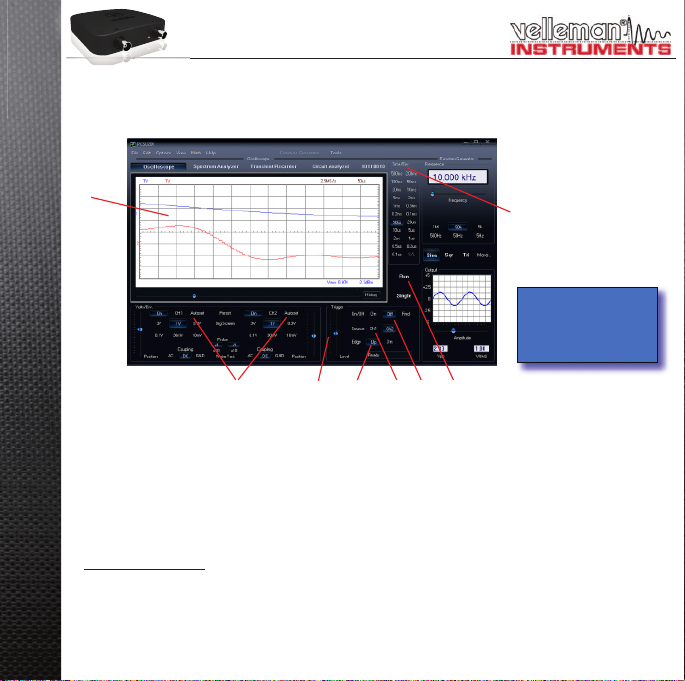
THE OSCILLOSCOPE MODULE :
What ? : The Oscilloscope module offers a feature-packed, easy to use digital storage oscilloscope.
1
2 3 4 56 7
How ? :
Connect the circuit under test to the scope input (observe the max. input rating of the scope!) or connect to •
the generator output.
Start measuring with “trigger off” (• 6)
Press ‘RUN’ (• 7)
Choose the desired channel and volts/div setting or press “Auto-set” (• 2)
Choose the appropriate time/div setting (• 8)
To enable triggering :
Select trigger channel (• 5)
Select trigger edge (• 4)
Set trigger to ‘ON’ (• 6)
Set trigger level by sliding (• 3). The trigger mark is displayed on the left hand side of the signal display (1)
8
8
Channel On / Off and
generator output are
indicated by a LED on
the unit.
Page 9

THE SPECTRUM ANALYSER MODULE :
What ? : Powerful feature which allows visualization of the frequency spectrum of a signal, using FFT (Fast
Fourier Transform) analysis.
12
How ? :
Connect the scope input to the circuit under test. (observe the max. input rating of the scope!) Or use the •
internal generator output.
First observe the signal on the scope screen (see previous page).•
Check that the signal is not over the maximum of the screen.•
Start the spectrum analyzer.•
Press ‘RUN’ (• 1)
Select the appropriate frequency range. Make sure your setting will capture any signal change of interest (• 3).
If wanted set the appropriate channel and volts/div setting (• 2)
3
9
Page 10
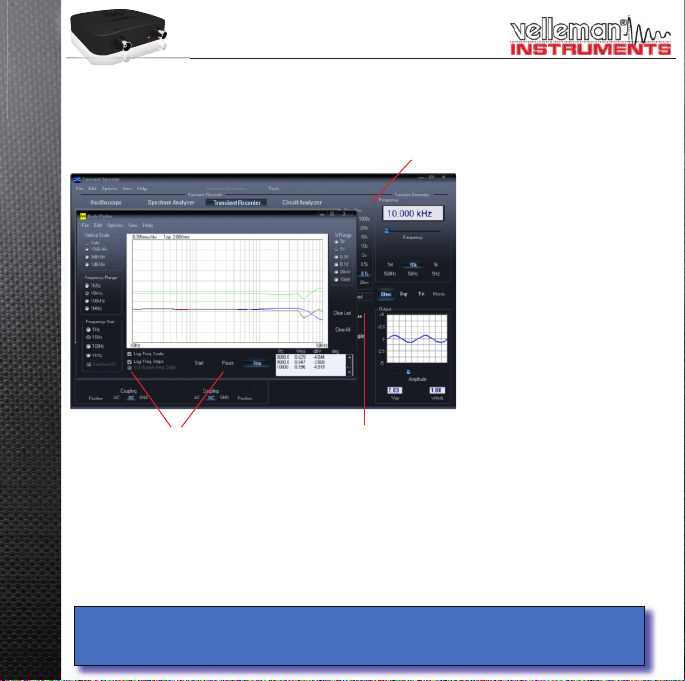
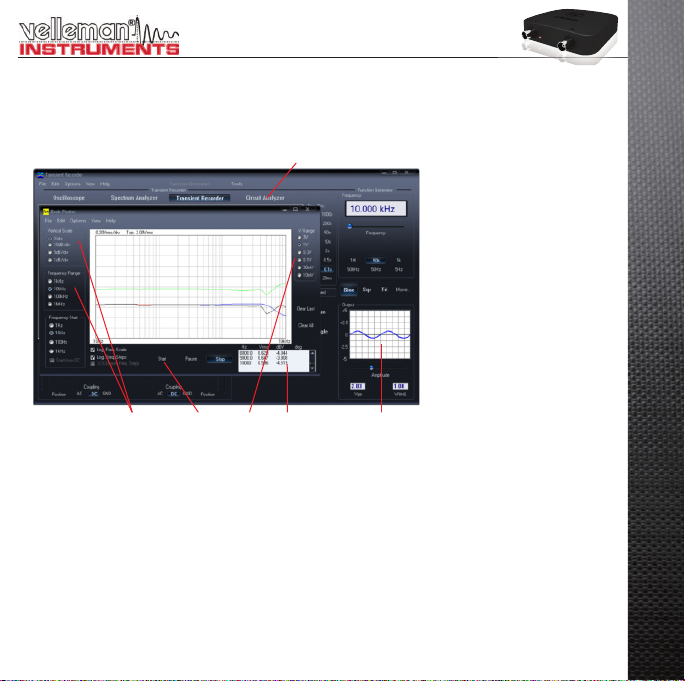
THE TRANSIENT RECORDER MODULE :
What ? : Record occasional events and log slow changing processes automatically, e.g. battery charge cycles,
temperature changes,... or track intermittent faults in electronic circuits. Automatic data storage allows over
one year of continuous recording !
3
2
How ? :
Connect the scope input to the circuit under test. (or the internal generator at a low frequency)•
Select the appropriate channel and volts/div (or volt range) setting (• 1).
Select the appropriate time/division setting (• 3).
Press RUN (• 2) to start recording.
Press RUN again, to stop the measurement, or use the “Single” button to make a single screen
measurement.
For continuous recording with auto-save to your HD, select ‘AutoSave Data’ from the ‘File’-menu.
Notes:
During recording the screen can differ from the actual measurement.•
10
Events happening between two sample acquisitions will be missed if a too slow time/div is set•
1
Page 11
THE BODE PLOTTER MODULE :
What ? : Due to the unique scope and generator combination, an automated Bode plot function is possible.
This results in a powerful tool for amplifi er or fi lter measurements.
1
54
How ? :
Enable the Circuit Analyser window (• 1)
Connect the scope CH1 input to the output of the circuit or unit under test.•
Connect the generator output to the input of the circuit or unit.•
Adjust the generator output (• 2) to a suitable level.
Adjust the setting of the Bode plot module like Volt range (• 3) Volt scale,
frequency start and stop range (4)...
Press ‘Start’ (• 5) and observe the screen and measurement window (6)
If the signal is out of the screen range, adjust the Voltage range or generator output level.•
263
11
Page 12

INTRODUCTION : LE MONDE DU PC-LAB200
Destiné au PCSU200, un petit labo USB complet !
Logiciel PcLab200 puissant pour oscilloscope deux canaux, analyseur de spectre, enregistreur, générateur
de fonction et diagramme de Bode. Éditeur d’ondes intégré et séquenceur automatisé via fi chier ou entrée PC.
L’utilisation du logiciel en mode de démonstration ne nécessite pas de périphérique.
Informations générales
marqueurs pour amplitude/tension et fréquence/•
temps
raccordement à l'entrée : CC, CA et GND•
résolution 8 bits•
possibilité de mise en mémoire de l’affi chage et •
des données
alimentation par port USB (500mA)*•
dimensions : 100x100x35mm•
Analyseur de spectre
plage de fréquence : 0 .. 120 Hz ~ 12 MHz•
échelle de temps linéaire ou logarithmique•
principe de fonctionnement : FFT (Fast Fourier •
Transform ou transformée de Fourier rapide)
résolution FFT : 2048 lignes•
canal d’entrée FFT : CH1 ou CH2•
zoom•
Enregistreur de signaux transitoires
échelle de temps : 20 ms/div ~ 2000 s/div•
temps d'enregistrement max. : 9,4 h/écran•
mise en mémoire automatique des données•
enregistrement automatique pendant plus d’un an•
nombre max. d'échantillons : 100/s•
nombre min. d'échantillons : 1 échantillon/20s•
SPÉCIFICATIONS SOUS RÉSERVE DE MODIFICATIONS - DLL disponible pour des développements personnalisés
12
Générateur de fonction
plage de fréquence: sinusoïde de 0,005Hz ~ 1MHz•
carré et triangulaire de 0,005Hz ~ 500kHz•
formes d’onde étendues•
amplitude: 100mVpp ~ 10Vpp @ 1kHz//600Ω/•
impédance de sortie: 50Ω
Oscilloscope
bande passante : 2 canaux CC à 12MHz ± 3dB•
impédance d’entrée : 1MΩ/30 pF•
tension d’entrée max. : 30V (CA + CC)•
base de temps : 0,1μs ~ 500ms par division•
plage d’entrée : 10mV ~ 3V par division•
affi chages : TRMS, dBV, dBm, P2P, rapport de •
cycle, fréquence…
longueur d’enregistrement : 4.000 échantillons/canal•
fréquence d’échantillonnage : 250Hz ~ 25MHz•
historique d’échantillonnage et fonction de capture •
d’image numérique
Diagramme de Bode
synchronisation automatique entre l’oscilloscope •
et le générateur
plage de fréquence : 1kHz, 10kHz, 100kHz, 1MHz•
départ de fréquence : 1Hz, 10Hz, 100Hz, 1kHz, •
10kHz
Remarque : Afi n d’éviter tout blocage de logiciel, l’utilisation d’un hub USB est déconseillé
Page 13

SECURITE ET AVERTISSEMENTS
e
ect
Les prises de terre des instruments sont interconnectées et connectées à la prise de terre de l’ordinateur. Courant max. entre la sonde
et la prise de terre: 30V CA + CC à tout moment! Assurez-vous que le circuit est galvaniquement isolé de l’alimentation CA (réseau
électrique) avant de commencer les mesures! Utilisez un transformateur d’isolation si nécessaire.
nectées et conn
la prise de terre d
tées à
COMMENT INSTALLER LE PC-LAB200?
Système requis :
Windows™XP/Vista/7 (*) 32 ou 64bit•
carte vidéo VGA (1024x768 recommandé)•
espace disque dur 10 Mo•
souris ou pointeur•
port USB (1.1 ou 2.0)•
Téléchargez la dernière version depuis www.velleman.eu
Saisissez PCSU200 dans le champ de recherche
et consultez la section de téléchargement
• Téléchargez le fi chier PcLAB200_setup.zip
• Décompressez les fi chiers dans un répertoire sur votre
disque dur
• Double-cliquez sur le fi chier "setup.exe".
Un assistant de confi guration vous guidera tout au long du processus
de confi guration. Des raccourcis vers le logiciel Pc-Lab200 peuvent être
installés
(*) Remarque: Enregistrez-vous comme administrateur afi n de compléter le processus d’installation
ou contactez votre administrateur systèmes pour plus de renseignements. Voir également le fi chier
"ReadME" dans le dossier installé.
* Microsoft Windows™ XP/VISTA/7 (*) est une marque déposée.
www.velleman.eu
13
Page 14

COMMENT INSTALLER LE PC-LAB200
Installation du pilote USB
Raccordez votre PCSU200 à un port USB libre.•
Suivez le processus d’installation affi ché à l’écran.•
Si Windows® vous propose de mettre à jour votre version de Windows®, choisissez "Non, pas cette fois-ci".•
Installez le pilote depuis un emplacement spécifi que, naviguez dans votre pilote et sélectionnez le répertoire •
"PCSU200Driver". Puis cliquez sur "next"..
Si Windows® indique "Ce périphérique n’est pas reconnu. Il ne sera pas installé. Veuillez trouver un autre •
pilote", sélectionnez "Voulez-vous continuer ?".
Une fois le pilote installé, contrôlez le pilote dans la liste du gestionnaire des périphériques. •
Redémarrez votre ordinateur si nécessaire.•
Lancement du logiciel:
Localisez les raccourcis du logiciel Pc-Lab200 (programs > Pc-Lab200 …)
Cliquez sur l'icône pour démarrer le programme principal. Le message "loading, please wait" apparaît.
Les indicateurs LED du canal s'allument. (*)
Le logiciel affi che automatiquement l’oscilloscope et le générateur de fonction (à la page suivante). En cas
d’erreur (unité non détectée), déconnectez et reconnectez le câble USB, et réessayez. Pour accéder au
mode de démonstration (utilisation sans périphérique), cliquez "Options", "Hardware Setup" et ensuite "Demo
Mode".
REMARQUES :
L’oscilloscope sera automatiquement étalonné lors de la première mise en marche•
Les captures d’écran peuvent différer de la réalité.•
14
Page 15

LE GÉNÉRATEUR DE FONCTION
Quoi ?
Les ondes les plus communes
sont accessibles depuis un seul
bouton. Vous disposez d’un répertoire contenant des fonctions
spéciales, tout comme un éditeur
d’ondes afi n de créer toute sorte
d’ondes.
Comment ?
Cliquez sur la forme d’onde souhaitée (• 1).
Sélectionnez la plage de fréquence (• 2).
Déterminez la fréquence à l’aide de la glissière (• 3) ou en saisissant une
fréquence dans le champ (4).
Réglez l’amplitude (• 5).
(saisissez les valeurs en cliquant dans le champ "Offset" et "Amplitude")
Le diagramme (• 6) affi che une simulation de l’onde.
Plus de fonctions "More Funct."
Le bouton 'more functions' vous donne accès aux formes d'ondes spéciales
comme des formes d'ondes arbitraires, déviations de fréquence et la bibliothèque de formes d'ondes.
Remarque : Le bouton "Probe Test" (7) permet au générateur de produire un
signal de sortie pour l’étalonnage de la sonde oscilloscope X10.
7
4
3
2
1
6
5
15
Page 16

L’ OSCILLOSCOPE
Quoi ? Cet outil est un oscilloscope numérique de stockage complet et facile à utiliser.
1
2 3 4 56 7
Comment ?
Connectez le circuit à tester à l’entrée de l’oscilloscope (observez la valeur d’entrée max. de l’oscilloscope !) •
ou à la sortie du générateur.
Mesurez avec "Trigger Off" • (6).
Cliquez sur "Run" (• 7).
Choisissez le canal et les volts/div, ou cliquez "Autoset" (• 2).
Choisissez le temps/div (• 8).
Démarrage :
Sélectionnez le canal de démarrage (• 5).
Sélectionnez le fl an de démarrage (• 4).
Cliquez sur "Trigger On" (• 6).
Paramétrez le niveau avec la glissière (• 3). Le niveau est affi ché sur la gauche du diagramme (1).
16
8
L'état du canal Marche/
Arrêt et la sortie du générateur est affi ché par
un LED sur l'appareil
Page 17

L’ ANALYSEUR DE SPECTRE
Quoi ? Outil puissant permettant de visualiser le spectre de fréquence d’un signal à l’aide d’une analyse FFT
(Fast Fourier Transform).
12
Comment ?
Connectez l’entrée de l’oscilloscope au circuit à tester (observez les valeurs maximales d’entrée de •
l’oscilloscope) ou utilisez la sortie du générateur interne.
Observez le signal sur l’écran de l’oscilloscope (référez à la page précédente).•
Assurez-vous que le signal n’excède pas la valeur maximale de l’écran.•
Démarrez l’analyseur de spectre.•
Enfoncez "Run" (• 1).
Sélectionnez la plage de fréquence appropriée. Assurez-vous que la valeur choisie soit assez large afi n •
qu’elle puisse capturer le changement de signal souhaité (3)
Choisissez le canal et les volts/div si nécessaire (• 2).
3
17
Page 18

L’ ENREGISTREUR DE SIGNAUX TRANSITOIRES
Quoi ? : Enregistrez automatiquement des événements occasionnels et des modifi cations lents, p.ex. le cycle
de charge d’une batterie, l’évolution de la température… ou dépister des fautes intermittentes dans un circuit.
Les données sont automatiquement mises en mémoire. Le Pc-Lab200 vous permet d’enregistrer des données
pendant 1 an !
3
Comment ?
2
Connectez l’entrée au circuit à tester (ou au générateur interne à une basse fréquence).•
Sélectionnez le canal et les volts/div (ou plage de tension) appropriés (• 1).
Sélectionnez le temps/division approprié (• 3).
Enfoncez "Run" (• 2) pour enregistrer.
Renfoncez "Run" pour interrompre l’enregistrement ou enfoncez "Single" pour effectuer une
mesure d’écran simple.
Sélectionnez "AutoSave Data" dans le menu "File" pour enregistrer en mode continu avec mise en mémoire
automatique sur disque dur.
Remarque :
Pendant l’enregistrement, les écrans peuvent différer de la mesure actuelle.•
L’interaction entre les deux échantillons ne sera pas mesurée si la valeur temps/div choisie est trop •
18
basse.
1
Page 19

LE DIAGRAMME DE BODE
Quoi ? La combinaison unique d'un oscilloscope et générateur de signaux permet un Bode plotter automatisé.
Par conséquent, un instrument puissant pour la mesure d'amplifi cateurs ou de fi ltres.
1
54
Comment ?
Ouvrez la fenêtre "Circuit Analyser" (• 1).
Connectez l’entrée du canal CH1 de l’oscilloscope à la sortie du circuit ou de l’unité à tester.•
Connectez la sortie du générateur à l’entrée du circuit ou de l’unité.•
Réglez la sortie du générateur (• 2) à un niveau approprié.
Paramétrez le traceur de Bode au niveau de "V Range" (• 3), "Vertical Scale", "Frequency Range" et "Frequency
Start" (4)…
Enfoncez "Start" (• 5) et observez les valeurs dans la fenêtre de mesure (6).
Ajustez la valeur sous "V Range" ou le niveau de sortie du générateur si le signal est hors de la portée de •
l’écran.
263
19
Page 20

EINFÜHRUNG: ENTDECKEN SIE DIE WELT VOM
PC-LAB200
Ein komplettes USB-Laboratorium!
Leistungsstarke PcLab200-Software für 2-Kanal-Oszilloskop, Spektrum-analysator, Transientenrecorder,
Funktionsgenerator und Bode Plotter. Kreieren Sie über Datei oder externen PC-Eingang Ihre eigenen Wellenformen mit dem mitgelieferten Signal-Wellenform-Editor und dem automatisierten Sequenzer.
Sie brauchen keine Hardware, um die Software im Demomodus zu verwenden.
20
Allgemein
Markierungen für Amplitude/Spannung und •
Frequenz/Zeit
Eingangskopplung: DC, AC und GND•
Aufl ösung von 8 bits•
Speicherung von Schirmabbildung und Daten•
Stromversorgung über USB-Port (500mA)•
Abmessungen: 100x100x35mm•
Spektrumanalysator
Frequenzbereich: 0 .. 120 Hz ~ 12 MHz•
linearer oder logarithmischer Zeitmaßstab •
Funktionsweise: FFT (Fast Fourier Transform)•
FFT-Aufl ösung: 2048 Zeilen•
FFT-Eingangskanal: CH1 oder CH2•
Zoom-Funktion•
Transientenrecorder
Zeitmaßstab: 20 ms/div ~ 2000 s/div•
max. Aufnahmezeit: 9.4 Stunden pro •
Schirminhalt m
automatische Datenspeicherung•
automatische Aufnahme bis zu mehr als 1Jahr•
max. Abtastgeschwindigkeit: 100/s•
min. Abtastgeschwindigkeit: 1 Sample/20s•
*Bemerkung: Verwenden Sie keinen USB-Hub, um das Blockieren der Software zu vermeiden.
TECHNISCHE DATEN UNTER VORBEHALT - DLL für eigene Projekte verfügbar - www.velleman.eu
Funktionsgenerator
Frequenzbereich: Sinuswelle von 0,005 Hz ~ 1 MHz•
Rechteck-, Dreieckwelle von 0,005 Hz ~ 500 kHz•
umfangreiche Wellenformbibliothek•
Amplitude: 100 mVpp ~ 10 Vpp @ 1 kHz/600 Ω/Aus-•
gangsimpedanz: 50 Ω
Oszilloskop
Bandbreite: 2-Kanal DC bis 12 MHz ±3dB•
Eingangsimpedanz: 1 MΩ/30 pF•
max. Eingangsspannung: 30 V (AC + DC)•
Zeitbasis: 0,1 μs ~ 500 ms pro Division•
Eingangsbereich: 10 mV ~ 3 V/Division•
Anzeigen: TRMS, dBV, dBm, P2P, Arbeitszyklus, •
Frequenz…
Aufnahmelänge: 4.000 Samples / Kanal•
Abtastfrequenz für sich wiederholende Signale: •
250 Hz ~ 25 MHz
Überblick und digitale Bilderfassung•
Bode Plotter
automatische Synchronisation zwischen Oszilloskop •
und Generator
Frequenzbereich: 1 kHz, 10 kHz, 100 kHz, 1 MHz•
Frequenzstart: 1Hz, 10 Hz, 100 Hz, 1 kHz, 10 kHz•
Page 21

SICHERHEITSHINWEISE
Comp
d a
Die Erdungen der Instrumente sind untereinander verbunden und an die Erdung des Computers angeschlossen. Die max. Spannung
zwischen Prüfspitze und Erdung: jederzeit 30V AC +DC ! Bevor Sie eine Messung ausführen, achten Sie darauf, dass die Schaltung
galvanisch von der AC-Versorgung (vom Netz) getrennt ist ! Falls nötig, verwenden Sie einen Isoliertransformator.
r verbunden un
n die
Erdung des
INSTALLATION DES PC-LAB200
Min. Systemvoraussetzungen:
Windows™XP/Vista/7 (*) 32 / 64bit•
VGA-Karte (1024x768 empfohlen)•
10 MB freier Speicherplatz•
Maus oder ähnlich•
freier USB-Port (1.1 oder 2.0) •
Die Software fi nden Sie auf unserer Website, Laden Sie die neueste Version herunter: www.velleman.eu.
Geben Sie PCSU200 im Suchfeld ein und betrachten
Sie den Downloadbereich
Laden Sie die PcLAB200_setup.zip-Datei herunter•
Entzippen Sie die Dateien in einem Ordner auf Ihrem •
Laufwerk
Klicken Sie zwei Mal die “setup.exe”-Datei an. •
Ein Einstellungsassistent wird Ihnen helfen. Es ist möglich Verknüpfungen
zu der Pc-Lab200-Software zu erstellen.
(*) Bemerkung: Loggen Sie als Administrator ein, um die Software zu installieren. Kontaktieren Sie den
Systemverwalter für mehr Information. Siehe auch die ReadME-Datei des installierten Verzeichnisses.
* Microsoft Windows™ XP/VISTA/7 (*) sind eingetragene Schutzmarken.
www.velleman.eu
21
Page 22

DIE HARDWARE EINSTELLEN
Den USB-Treiber installieren
Verbinden Sie das PCSU200-Gerät mit einem freien USB-Anschluss•
Befolgen Sie das Installationsverfahren im Bildschirm.•
Wenn Windows eine Windows-Aktualisierung fragt, wählen Sie dann "Not at this time".•
Installieren Sie den Treiber von einem spezifi schen Ort. Durchsuchen Sie danach den PC und wählen Sie •
die Datei “PCSU200Driver” aus. (Drücken Sie “next”)
Bei Meldung "Has not passed Windows logo testing…" klicken Sie "Continue Anyway".•
Nach der Installation des Treibers, kontrollieren Sie, ob den Treiber korrekt im Device Manager installiert •
wurde.
Starten Sie den PC wieder wenn nötig.•
Die Software starten
Lokalisieren Sie die Verknüpfungen der Pc-Lab200-Software (programs.. Pc-Lab200 …)
Klicken Sie auf um das Hauptprogramm zu starten. “loading, please wait” erscheint im Bildschirm und
normalerweise schaltet die LED-Anzeige EIN. (*)
Das Hauptprogramm lädt sofort das Oszilloskop- und Generatordisplay (siehe nachfolgende Seiten).
Bei einer Fehlermeldung (z.B. keine Hardware erkannt), trennen Sie, verbinden Sie das USB-Kabel wieder
und versuchen Sie wieder. Laden Sie den Demomodus (keine Hardware erforderlich) indem Sie "Options" >
"Hardware Setup" > "Demo mode" klicken
BEMERKUNG:
Das Oszilloskop wird bei der ersten Inbetriebnahme automatisch kalibriert•
Die dargestellten Schirmbeispiele können von der Wirklichkeit abweichen.•
22
Page 23

DER FUNKTIONSGENERATOR
Was?
Die meisten Wellenformen sind
über einen einzigen Tastendruck
verfügbar. Mit den vielen verfügbaren speziellen Funktionen und
den Wave-Editor können Sie fast
jeden Wellenformtyp kreieren.
6
Wie?
Klicken Sie auf die gewünschte Wellenform (• 1).
Wählen Sie den Frequenzbereich (• 2).
Stellen Sie die genaue Frequenz mit dem Schiebebalken (3) ein oder klicken Sie im Frequenzfach (• 4) und
geben Sie die Frequenz ein.
Regeln Sie die Amplitude (• 5).
(• 6) zeigt eine Vorschau der Wellenform an.
Die Taste "More Functions"
Mit der ‘More Functions’-Taste können Sie auf Spezialwellenformen zugreifen
(z.B. Arbiträrwellenform, Frequenzhub). Sie können auch auf die Wellenformbibliothek zugreifen.
Bemerkung: Mit der Taste "Probe Test" (7) kreiert der Generator ein Signal,
das sich zum Kalibrieren von der Oszilloskopsonde an Einstellung X10 eignet.
(geben Sie die Werte im Offset- und Amplitudefeld ein)
7
4
3
2
1
5
23
Page 24

DAS OSZILLOSKOP
Was? Dies ist ein komplettes und einfach zu verwenden digitales Speicheroszilloskop.
1
Wie?
Verbinden Sie den Kreis, den Sie testen möchten, mit dem Eingang (überschreiten Sie die max. Eingang-•
swerte des Oszilloskopes nicht!) oder dem Generatorausgang.
Starten Sie die Messung mit "Trigger off" (• 6).
Drücken Sie "Run" (• 7).
Wählen Sie den gewünschten Kanal und volts/div oder drücken Sie "Autoset" (• 2)
Wählen Sie die geeignete Time/div-Einstellung (• 8).
Auslösung:
Wählen Sie den Triggerkanal (• 5).
Wählen Sie den Triggerfl anke (• 4).
Stellen Sie den Trigger auf "ON" (• 6).
Stellen Sie das Triggerniveau mit der Schiebetaste (• 3) ein. Der Pegel wird links im Diagramm dargestellt (1).
2 3 4 56 7
24
8
Eine LED leuchtet wenn
der Kanal ein- oder ausgeschaltet ist und wenn
der Funktionsgenerator
eingeschaltet ist.
Page 25

DER SPEKTRUMANALYSATOR
Was? Der Spektrumanalysator zeigt Ihnen ein deutliches Bild des Frequenzspektrums eines Signals über
eine FFT-Analyse (Fast Fourier Transform).
12
Wie?
Verbinden Sie den Oszilloskopeingang mit dem Kreis, den Sie testen möchten (überschreiten Sie die max. •
Eingangswerte des Oszilloskopes nicht!) oder verwenden Sie den internen Generatorausgang.
Analysieren Sie das Signal im Display (siehe vorige Seite).•
Beachten Sie, dass das Signal die Höchstwerte nicht überschreitet und nicht außerhalb des Displays fällt.•
Starten Sie den Spektrumanalysator.•
Drücken Sie "Run" (• 1).
Wählen Sie den geeigneten Frequenzbereich damit alle Änderungen im Display sichtbar werden (• 3).
Stellen Sie den Kanal und die Volts/div-Einstellung (• 2) ein wenn gewünscht.
3
25
Page 26

DER TRANSIENTENRECORDER
Was? Legen Sie ein einmaliges auftretendes Signal fest, nimmt automatisch langsame Änderungen
(z.B. Ladezyklus einer Batterie, Temperaturänderungen, usw.) auf oder sucht zyklische Fehler in einem elektronischen Kreis. Der Speicher erlaubt Aufnahmen von einem Jahr!
3
Wie?
2
Verbinden Sie den Oszilloskopeingang mit dem Kreis, den Sie testen möchten, oder verwenden Sie den •
internen Generatorausgang mit niedriger Frequenz.
Wählen Sie den geeigneten Kanal und die Volts/div-Einstellung (Spannungsbereich) (• 1).
Wählen Sie die geeignete Zeit/div-Eintsellung (• 3).
Drücken Sie "Run" (• 2) um die Aufnahme zu starten.
Drücken Sie "Run" wieder, um die Aufnahme zu stoppen oder klicken Sie "Single" um eine einzige
Bildschirmaufnahme zu machen.
Für eine kontinuierliche Aufnahme mit automatischer Speicherung auf Festplatte, wählen Sie "AutoSave Data"
unter "File".
Bemerkung:
Die dargestellten Bildschirmbeispiele können während der Aufnahme von der Wirklichkeit abweichen.•
Es ist möglich, dass der Transientenrecorder das Signal bei einer zu niedrigen Zeit/div-Einstellung •
26
nicht festlegt.
1
Page 27

BODE PLOTTER-MODUL
Was? Dank der einzigartigen Kombination (Oszilloskop und Funktionsgenerator) ist eine automatische Bode-
Plot-Funktion möglich. Hierdurch bekommen Sie ein leistungsstarkes Messinstrument für Verstärker oder
Filter.
1
54
Wie?
Klicken Sie "Circuit Analyser" (• 1).
Verbinden Sie den Eingang CH1 vom Oszilloskop mit dem Ausgang vom Kreis, den Sie testen möchten.•
Verbinden Sie den Ausgang des Generators mit dem Eingang vom Kreis.•
Regeln Sie den Pegel des Generatorausgangs (• 2).
Regeln Sie den Spannungsbereich (• 3), den Maßstab, die Frequenzwerte (4), usw.
Drücken Sie "Start" (• 5). Das Diagramm wird dargestellt (6).
Regeln Sie den Spannungsbereich oder den Generatorausgang wenn die Kurve außerhalb des Bereiches •
fällt.
263
27
Page 28

INTRODUCCIÓN: EL MUNDO DEL PC-LAB200
¡Un pequeño laboratorio USB completo! Software PcLab200 potente para osciloscopio de dos canales,
analizador de espectro, grabador de señales transitorias, generador de funciones y Bode plotter. Editor de
ondas (signal wave editor) incorporado y secuenciador automatizado por fi chero o entrada PC.
Para utilizar el software en el modo de demostración no necesita el hardware.
Informaciones generales
puntos de referencia (marcadores) para •
amplitud/tensión y frecuencia/tiempo
conexión en la entrada: CC, CA y GND•
resolución 8 bits•
es posible guardar la fi gura en la pantalla y •
los datos
alimentación por puerto USB (500mA)•
dimensiones : 100x100x35mm•
Analizador de espectro
rango de frecuencia: 0 .. 120 Hz ~ 12 MHz•
escala de tiempo lineal o logarítmica•
principio de funcionamiento: FFT (Fast Fourier •
Transform)
resolución FFT: 2048 líneas•
canal de entrada FFT: CH1 o CH2•
función zoom•
Grabador de señales transitorias
escala de tiempo: 20 ms/div ~ 2000 s/div•
tiempo de grabación máx. : 9,4 h/pantalla•
almacenamiento automático de datos•
almacenamiento automático durante más de •
un año
número máx. de muestreos: 100/s•
número mín. de muestreos: 1 muestreo/20s•
ESPECIFICACIONES BAJO RESERVA DE MODIFICACIONES - DLL disponible para desarrollos propios - www.velleman.eu
28
Generador de funciones
rango de frecuencia : senoidal de 0,005Hz ~ 1MHz•
señal triangular y cuadrada de 0,005Hz ~ 500kHz•
extensa biblioteca con formas de ondas •
amplitud: 100mVpp ~ 10Vpp @ 1kHz//600Ω/impedancia •
de salida: 50Ω
Osciloscopio
ancho de banda: 2 canales CC a 12MHz ± 3dB•
impedancia de entrada: 1MΩ/30 pF•
tensión de entrada máx.: 30V (CA + CC)•
base de tiempo: 0,1μs ~ 500ms por división•
rango de entrada: 10mV ~ 3V por división•
lectura: TRMS, dBV, dBm, P2P, ciclo de trabajo, •
frecuencia…
duración de la grabación: 4.000 muestreos/canal•
frecuencia de muestreo para señales repetitivas: •
250Hz ~ 25MHz
resumen y función de captura de imagen digital•
Bode plotter
sincronización automática entre el osciloscopio y el •
generador
rango de frecuencia: 1kHz, 10kHz, 100kHz, 1MHz•
frecuencia de arranque: 1Hz, 10Hz, 100Hz, 1kHz,10kHz•
* Nota: para evitar cualquier bloqueo del software, no utilice un hub USB.
Page 29

SEGURIDAD Y AVISOS
e
d
Las tomas de tierra de los instrumentos están interconectadas y conectadas a la toma de tierra del ordenador. Corriente máx. entre la
sonda y la toma de tierra: ¡30V CA + CC en cualquier momento! ¡Asegúrese de que el circuito esté galvánicamente aislado de la aliment-
ación (red eléctrica) CA antes de empezar con las mediciones! Utilice un transformador de aislamiento si fuera necesario.
erconectadas y conecta
as a la toma de ti
INSTALAR EL SOFTWARE PC-LAB200
Exigencias mínimas del sistema
Windows™ XP/Vista/ 7 (*) 32/64 bit•
tarjeta de vídeo VGA (1024x768 recomendado)•
espacio libre disco duro 10 MB •
ratón o similar•
puerto USB (1.1 ó 2.0)•
Para descargarse el software, consulte nuestra página web. Descargue la última versión en www.velleman.eu
Introduzca PCSU200 en el cuadro de búsqueda y
mire la sección de descargas
Descargue el fi chero PcLAB200_setup.zip •
Descomprima los fi cheros en una carpeta •
Haga clic dos veces en el fi chero “setup.exe”. •
Un asistente de confi guración le ayudará a completar el procedimiento
de instalación. Es posible crear accesos directos al software Pc-Lab200
(*) Nota: Entre en el sistema como administrador para completar el procedimiento de instalación
o contacte con su administrador de sistemas para más informaciones. Véase también el fi chero
"ReadME" en la carpeta instalada.
* Microsoft Windows™ XP/VISTA/7 (*) son marcas registradas.
www.velleman.eu
29
Page 30

AJUSTAR EL HARDWARE
Instalar el driver USB
Conecte el PCSU200 a un puerto USB libre.•
Siga el procedimiento de instalación visualizado en la pantalla.•
Si Windows® le propone actualizar su versión de Windows®, seleccione "Not at this time".•
Instale el driver de un lugar específi co. Luego, navegue por el PC y seleccione el fi chero “PCSU200Driver”. •
(Pulse “next”).
Si Windows® indica "Has not passed Windows logo testing…. " haga click en "Continue Anyway".•
Después de haber instalado el driver, controle si el driver ha sido instalado de manera correcta en el Device •
Manager.
Vuelva a iniciar el ordenador si fuera necesario.•
Ejecutar el software
Localizar el atajo "Pc-Lab200".
Haga click en el icono para ejecutar el software. El mensaje "loading, please wait" se visualiza. Después
de que el software está cargado, el LED se ilumina.
El software visualia automáticamente el osciloscopio y el generador de funciones (página siguiente). En caso
de error (unidad no detectada), desconecte y vuelva a conectar el cable USB, y vuelva a intentar. Para entrar
en el modo de demonstración (uso sin hardware), haga click en "Options", "Hardware Setup" y luego en
"Demo Mode".
Nota:
Es posible que las capturas de pantalla difi erran de la réalidad. •
el osciloscopio se calíbrará automáticamente durante la primera puesta en marcha•
30
Page 31

EL GENERADOR DE FUNCIONES
¿Qué ?
Las ondas más comunes están
disponibles por un solo botón.
Es posible crear cualquier tipo
de onda con las funciones especiales y el editor de ondas.
4
3
2
1
6
¿Cómo?
Haga click en la forme de onda deseada (• 1).
Seleccione el rango de frecuencia (• 2).
Determine la frecuencia con el conmutador deslizante (• 3) o haga click en el campo de la frecuecia (4) e
introduzca la frecuencia.
Ajuste la amplitud (• 5). (introduzca los valores al hacer click en el campo "Offset" y "Amplitude")
El diagrama (• 6) visualiza una simulación de la onda.
Más funciones "More Funct."
Es posible acceder a formas de ondas especiales (p.ej. formas de ondas
arbitrarias, barrido de frecuencia) con la tecla ‘More Functions’. It also gives
access to the waveform library.
Nota: El botón "Probe Test" (7) permite al generado producir una señal de
salida para calibrar la sonda del oscilloscopio en X10.
7
5
31
Page 32

EL OSCILOSCOPIO :
¿Qué? Es un osciloscopio digital de almacenamiento completo y fácil de utilizar.
1
2 3 4 56 7
¿Cómo?
Conecte el circuito que quiere probar a la entrada del osciloscopio (¡No sobrepase el valor de entrada máx. •
del osciloscopio!) o la salida del generador.
Mida con "Trigger Off" (• 6).
Press ‘RUN’ (• 7)
Haga click en el canal y volts/div, o haga click en "Autoset" (• 2).
Seleccione temps/div (• 8).
Disparo:
Seleccione el canal de disparo (• 5).
Seleccione el fl anco de disparo (• 4).
Haga click en "Trigger On" (• 6).
Ajuste el nivel con el conmutador deslizante (• 3). El nivel se visualiza en la parte izquierda del diagrama (1)
32
8
El LED del aparato se
ilumina si el canal está
activado o desactivado y si
el generador de funciones
está activado
Page 33

EL ANALIZADOR DE ESPECTRO
¿Qué? Permite visualizar el espectro de frecuencia de una señal con un análisis FFT (Fast Fourier Transform).
3
12
¿Cómo?
Conecte la entrada del osciloscopio al circuito que quiere probar (no sobrepase los valores máx. de entrada •
del osciloscopio) o utilice la salida del generador interno.
Analice la señal en la pantalla del osciloscopio (véase la página anterior).•
Asegúrese de que la señal no sobrepase el valor máx. de la panatlla.•
Inicie el analizador de espectro.•
Pulse "Run" (• 1).
Seleccione el rango de frecuencia adecuado para que se visualicen todos los cambios en la pantalla (• 3).
Seleccione el canal y volts/div si fuera necesario (• 2).
33
Page 34

EL GRABADOR DE SEÑALES TRANSISTORIAS
¿Qué? Grabe automáticamente eventos ocasionales y modifi caciones lentas, p.ej. el ciclo de carga de una
batería, la evolución de la temperatura, etc. o busque los errores cíclicos en un circuito electrónico. Los datos
se guardan automáticamente en la memoria. ¡El Pc-Lab200 le permite grabar los datos durante 1 año!
3
1
Durante la grabación, es posible que las pantallas defi eran de la medición actual•
La interacción entre los dos muestreos no se medirá si el valor temps/div seleccionado es demasiado •
bajo.
2
¿Cómo?
Conecte la entrada al circuito que quiere probar (o utilice un generador interno a baja frecuencia).•
Seleccione el canal y volts/div (o el rango de tensión) adecuados (• 1).
Seleccione tiempo/división (• 3).
Pulse "Run" (• 2) para grabar.
Vuelva a pulsar "Run" para interrumpir la grabación o pulse "Single" para efectuar una medición de
pantalla sencilla.
Seleccione "AutoSave Data" en el menú "File" para grabar en el modo continuo con almacenamiento automático
en disco duro.
Nota:
34
Page 35

EL BODE PLOTTER
¿Qué? La combinaison unique d'un oscilloscope et générateur de signaux permet un Bode plotter automatisé.
Par conséquent, un instrument puissant pour la mesure d'amplifi cateurs ou de fi ltres.
1
54
¿Cómo?
Abra la pantalla "Circuit Analyser" (• 1).
Conecte la entrada del canal CH1 del osciloscopio a la salida del circuito que quiere probar.•
Conecte la salida del generador a la entrada del circuito.•
Ajuste la saldia del generador (• 2) a un nivel adecuado.
Ajuste el Bode Plotter en un nivel de "V Range" (• 3), "Vertical Scale", "Frequency Range" y "Frequency Start" (4).
Pulse "Start" (• 5) y no sobrepase los valores de la pantalla de medición (6).
Ajuste el valor bajo "V Range" o el nivel de salida del generador si la señal está fuera del rango de la •
pantalla.
263
35
Page 36

OR
PCSU200
EAN
PC OSCILLOSCOPE
EAN
& SIGNAL GENERATOR
IGNAL GENERAT
Legen Heirweg 33, 9890 Gavere (Belgium)
 Loading...