

Page 1

Page 2
FR
FR
Consultez notre site www.velleman.eu pour plus d’information sur votre
FRFR
appareil.
NL
NL
Raadpleeg onze web site www.velleman.eu voor vertalingen en meer
NLNL
informatie van dit product.
UK Please check our web site www.velleman.eu for more info on this product.
SSSS
Bruksanvisning och annan information kan finnas på www.velleman.eu.
SF
SF
Käyttöohje sekä muuta informaatiota löytyy osoitteesta www.velleman.eu.
SFSF
IIII
La traduzione di questo manuale e tutte le informazioni con cernenti l'unità
possono essere trovate sul www.velleman.eu .
DK
DK
Oversættelsen af denne manual, samt alle øvrige informationer vedrørende
DKDK
enhederne, kan findes på www.velleman.eu .
DDDD
Anderen Informationen über diese Geräte finden Sie auf www.velleman.eu.
SP
SP
Otra información sobre los dispositivos se encuentran en www.velleman.eu
SPSP
PPPP
A tradução deste Manual e toda a informação referente às uni dades pode
ser encontrada em www.velleman.eu .
www.velleman.eu
http://forum.velleman.eu/
2
Page 3
Content / sommaire / Inhaltsverzeichnis
English
English :
:
EnglishEnglish
: :
Welcome ....................................................................................................................... 4
Install the software.......................................................................................................... 5
Hardware connection...................................................................................................... 6
Starting the software ....................................................................................................... 6
The Function generator module ....................................................................................... 7
The Oscilloscope module ................................................................................................ 8
The Spectrum analyser module........................................................................................ 9
The Transient recorder module ...................................................................................... 10
Bode plot module......................................................................................................... 11
Extra information ......................................................................................................... 12
Français
Français ::::
FrançaisFrançais
Introduction ................................................................................................................. 13
Installation du logiciel................................................................................................... 14
Connexion de périphérique........................................................................................... 15
Lancement du logiciel................................................................................................... 15
Le générateur de fonction ............................................................................................. 16
L’oscilloscope............................................................................................................... 17
L’analyseur de spectre .................................................................................................. 18
L’enregistreur de signaux transitoires ............................................................................. 19
Le diagramme de Bode ................................................................................................ 20
Informations supplémentaires........................................................................................ 21
Deutsch:
Deutsch:
Deutsch:Deutsch:
Einführung................................................................................................................... 22
Installation der Software................................................................................................ 23
Anschluss der Hardware ............................................................................................... 24
Starten der Software ..................................................................................................... 24
Der Funktionsgenerator ................................................................................................ 25
Das Oszilloskop ........................................................................................................... 26
De Spektrumanalysator................................................................................................. 27
De Transientenrecorder ................................................................................................ 28
De Bode plotter............................................................................................................ 29
Zusätzliche Information................................................................................................. 30
Español:
Español:
Español:Español:
Introducción................................................................................................................. 31
Instalar el software ....................................................................................................... 32
Instalar el hardware ..................................................................................................... 33
Ejecutar el software ...................................................................................................... 33
El generador de funciones ............................................................................................ 34
El osciloscopio ............................................................................................................. 35
El analizador de espectro.............................................................................................. 36
El grabador de señales transitorias ................................................................................ 37
El Bode plotter ............................................................................................................. 38
Informaciones adicionales............................................................................................. 39
3
Page 4

Welcome
Welcome
WelcomeWelcome
Welcome to the world of Pc
Welcome to the world of Pc----Lab2000
Welcome to the world of PcWelcome to the world of Pc
Lab2000
Lab2000Lab2000
LT
LT
LTLT
For the PCSGU250 unit, a complete USB-powered lab-in-a-box!
Feature-packed PCLab2000LT software for two channel oscilloscope, spectrum
analyzer, recorder, function generator and Bode plotter. Integrated signal wave
editor and automated sequence generator, using file or external input.
TTTThe hardware is not necessary to evaluate the software in Demo mode
Function generator
General information
General information
General informationGeneral information
•
markers for amplitude/voltage and frequency/time
•
input coupling: DC, AC and GND
•
8 bit resolution
•
storage of display and data
•
supply from USB port (500mA)****
•
dimensions: 205 x 55 X 175 / 8,2 x 2,2 x 7"
Spectrum analyser:
Spectrum analyser:
Spectrum analyser: Spectrum analyser:
•
frequency range: 0 .. 120Hz to 12MHz
•
linear or logarithmic timescale
•
operating principle: FFT (Fast Fourier Transform)
•
FFT resolution: 2048 lines
•
FFT input channel: CH1 or CH2
•
zoom function
Transient recorder:
Transient recorder:
Transient recorder: Transient recorder:
•
timescale: 20ms/Div to 2000s/Div
•
max record time: 9.4hour/screen
•
automatic storage of data
•
automatic recording for more than 1 year
•
max. number of samples: 100/s
•
min. number of samples: 1 sample/20s
Function generator
Function generatorFunction generator
•
frequency range: sine from 0.005Hz to 1MHz
•
square and triangle from 0.005Hz to 500kHz
•
extended waveform library
•
amplitude range: 100mVpp to 10Vpp @ 1KHz//
600ohm load / output impedance: 50ohm
Oscilloscope
Oscilloscope
OscilloscopeOscilloscope
•
bandwidth: two channels DC to 12 MHz ±3dB
•
input impedance: 1 Mohm / 30pF
•
maximum input voltage: 30V (AC + DC)
•
time base: 0.1µs to 500ms per division
•
input range: 10mV to 3V/division
•
readouts: True RMS, dBV, dBm, p to p, Duty
cycle, Frequency…
•
record length: 4K samples / channel
•
sampling frequency: 250Hz to 25MHz
•
sample history and digital grab function
Bode plotter
Bode plotter
Bode plotterBode plotter
•
Automated sync between oscilloscope and generator
•
Frequency range: 1kHz , 10kHz, 100kHz, 1MHz
•
Frequency start: 10Hz, 100Hz, 1kHz, 10kHz
.
* NOTE: it is NOT recommended to use an USB
* NOTE: it is NOT recommended to use an USB ---- HUB device, this can cause the software to stop working.
* NOTE: it is NOT recommended to use an USB * NOTE: it is NOT recommended to use an USB
4
SPECIFICATIONS ARE SUBJECT TO MODIFICATIONS - DLL available for own development - www.velleman.eu
HUB device, this can cause the software to stop working.
HUB device, this can cause the software to stop working. HUB device, this can cause the software to stop working.
Page 5
Install
Install the software
the software
InstallInstall
the software the software
How
How to install Pc
to install Pc----Lab2000
HowHow
to install Pc to install Pc
Minimum system requirements :
•
Windows™2000/XP/Vista (*).
•
VGA display card (1024x768 recommended)
•
10MB free hard disk space.
•
Mouse or pointing device.
•
CD or CD/DVD Rom player.
•
Free USB port (1.1 or 2.0)
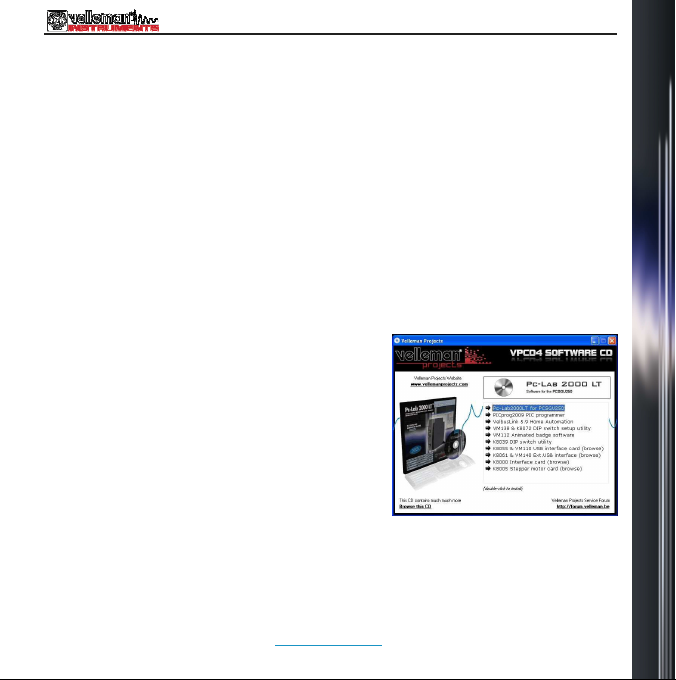
Insert the CD into your drive.
If the “setup” does not start automatically,
browse the CD and run the SETUP
program.
Lab2000
Lab2000Lab2000
SETUP.EXE
SETUPSETUP
LT
LT
LTLT
.EXE
.EXE .EXE
Select “Install
An install wizard will guide you trough the
complete installation procedure. Shortcuts to
the
Pc
Pc----Lab2000
PcPc
are automatically generated.
(*)
(*) Note
Note:::: You will need local Administrator privileges to successfully complete the
(*) (*)
NoteNote
installation, contact your system administrator for assistance.
See also the “ReadME” file in the installed folder.
* Microsoft Windows™ 2000/XP/VISTA (*) are registered trademarks
Download the latest version from
Download the latest version from www.velleman.eu
Download the latest version from Download the latest version from
Pc
Pc----Lab2000
PcPc
Lab2000LT
Lab2000Lab2000
LT
LTLT
Lab2000LT
Lab2000Lab2000
LT
”
LTLT
software and the help files
www.velleman.eu
www.velleman.euwww.velleman.eu
5
Page 6
Hardware connection
Hardware connection
Hardware connectionHardware connection
Hardware Set
Hardware Set----up
Hardware SetHardware Set
USB driver install:
USB driver install:
USB driver install:USB driver install:
•
Connect your PCSGU250 unit to a free USB port
•
Follow the on screen driver installation procedure.
•
If Windows asks for Windows Update, select “not at this time”
•
Install the driver from a specific location, then browse on the CD and select the
folder D:\PCSGU250Driver
D:\PCSGU250Driver. (press “next”)
D:\PCSGU250DriverD:\PCSGU250Driver
•
If Windows indicate “has not passed Windows logo testing…” select “Continue
Anyway”.
•
After finishing, you can check the driver installation in the Device Manager list.
•
It is possible that the PC asks to “restart” for proper installation
Note:
Note: In case of malfunction, remove the USB driver in the control panel and
Note: Note:
install the D:\PCSGU250Driver\PCSGU250Driver_WinUSB after reconnecting the
device.
up
(Close all programs before continuing)
(Close all programs before continuing)
up up
(Close all programs before continuing)(Close all programs before continuing)
Starting
Starting the software :
the software :
StartingStarting
the software : the software :
Locate the
Click the icon to start the main program. “loading, please wait
pear. Then the power LED goes ON on the unit. (*)
The main program automatically launches the Oscilloscope and generator
screen, which is shown on the next pages. Should you receive an error (ex. If no
unit is detected), disconnect and reconnect the USB cable and try again or, if you
want to access the demo mode (no unit is needed) :
- Click the Options menu, and select ‘Hardware Setup’ > demo mode
Pc
Pc----Lab2000LT
Lab2000LT
PcPc
Lab2000LTLab2000LT
software shortcuts (programs..
loading, please wait” should ap-
loading, please waitloading, please wait
Pc-Lab2000LT
…)
Note
Note:::: ---- At first time power
NoteNote
---- The
6
At first time power----up, the oscilloscope will calibrate itself automatically.
At first time powerAt first time power
The actual screen
The The
up, the oscilloscope will calibrate itself automatically.
actual screenssss can differ from the one shown in this manual
actual screen actual screen
up, the oscilloscope will calibrate itself automatically.up, the oscilloscope will calibrate itself automatically.
can differ from the one shown in this manual.
can differ from the one shown in this manual can differ from the one shown in this manual
.
. .
Page 7
The
The Function generator
Function generator
TheThe
Function generator Function generator
3333
The
The Function Generator Module :
Function Generator Module :
TheThe
Function Generator Module : Function Generator Module :
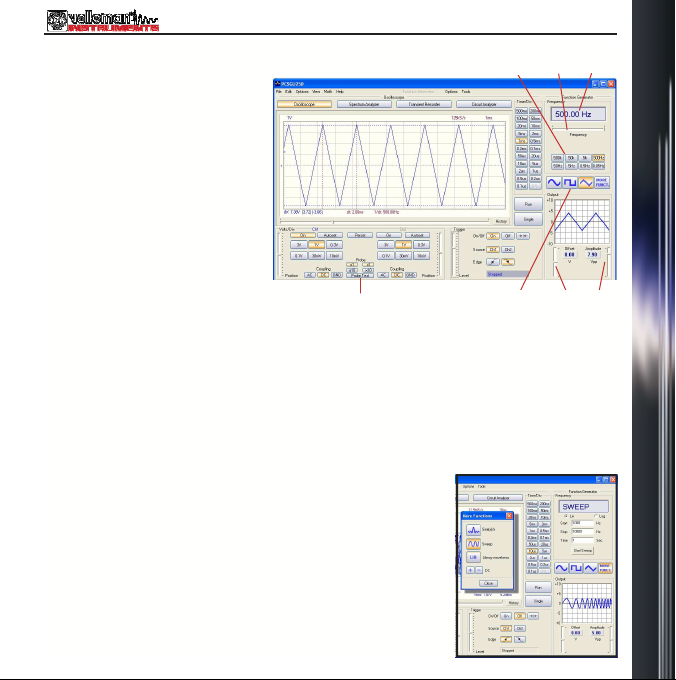
What
What ? :
? :
WhatWhat
forms are accessible at the
touch of a button. A library
with special functions is
provided, as well as a Wave
Editor, to create virtually any
kind of waveform.
How
How ? :
HowHow
•
•
•
•
•
•
The
The ‘
TheThe
The ‘More Functions’-button gives access to special
purpose waveforms such as arbitrary waveforms,
frequency sweeps and DC. It also gives access to the
waveform library.
Note: The Probe test button (8888) makes the generator output a signal,
suitable for your scope probe calibration at X10 setting.
Most common wave-
? : ? :
? :
? : ? :
Click on the desired waveform (1111).
Select the desired frequency range (2222).
Set the exact frequency by sliding (3333) or click the frequency readout (4444) and
enter a value.
Adjust the offset (5555)
Adjust the amplitude (6666)
(values can be entered by clicking the offset and amplitude readout)
(7777) shows a simulated preview of the output waveform
‘More
More Functions’
Functions’---- button
‘ ‘
MoreMore
Functions’ Functions’
button :
buttonbutton
:
: :
8888
2222
5555
1111
4444
7777
6666
7
Page 8
The
The Oscilloscope
Oscilloscope
TheThe
Oscilloscope Oscilloscope
The Oscilloscope
The Oscilloscope module
The OscilloscopeThe Oscilloscope
module :
modulemodule
:
: :
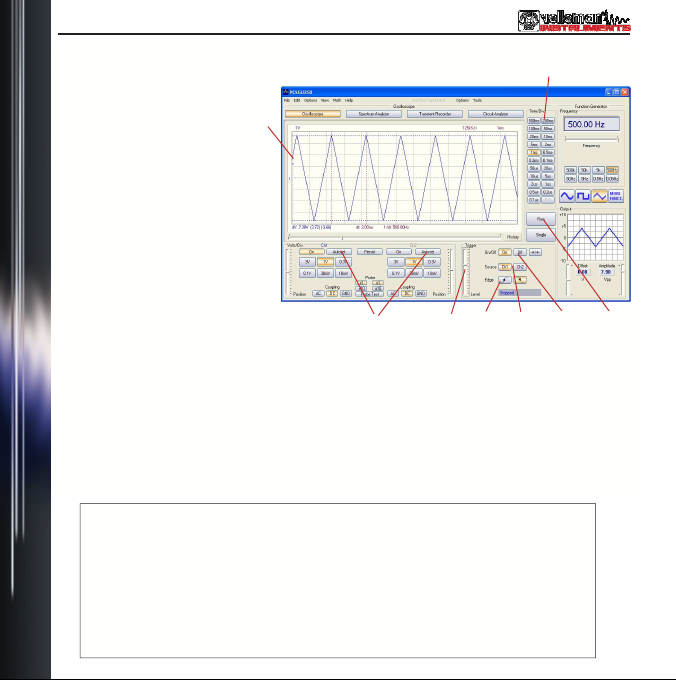
What
What ? :
? :
WhatWhat
Oscilloscope module
offers a feature-packed, easy
to use digital storage
oscilloscope.
How ? :
HowHow
•
•
•
•
•
8
The
? : ? :
How
? :
? : ? :
Connect the circuit under test to the scope input (observe the max. input rating
of the scope!) or connect to the generator output.
Start measuring with “trigger off” (6666)
Press ‘RUN’ (7777)
Choose the desired channel and volts/div setting or press “Auto-set” (2222)
Choose the appropriate time/div setting (8888)
To
To enable triggering :
enable triggering :
ToTo
enable triggering : enable triggering :
•
Select trigger channel (5555)
•
Select trigger edge (4444)
•
Set trigger to ‘ON’ (6666)
•
Set trigger level by sliding (3333). The trigger mark is displayed on the
left hand side of the signal display (1111)
1111
2222
3333
8888
5555 4444
7777 6666
Page 9
The
The Spectrum analyser
Spectrum analyser
TheThe
Spectrum analyser Spectrum analyser
The
The Spectrum Analyser Module :
Spectrum Analyser Module :
TheThe
Spectrum Analyser Module : Spectrum Analyser Module :
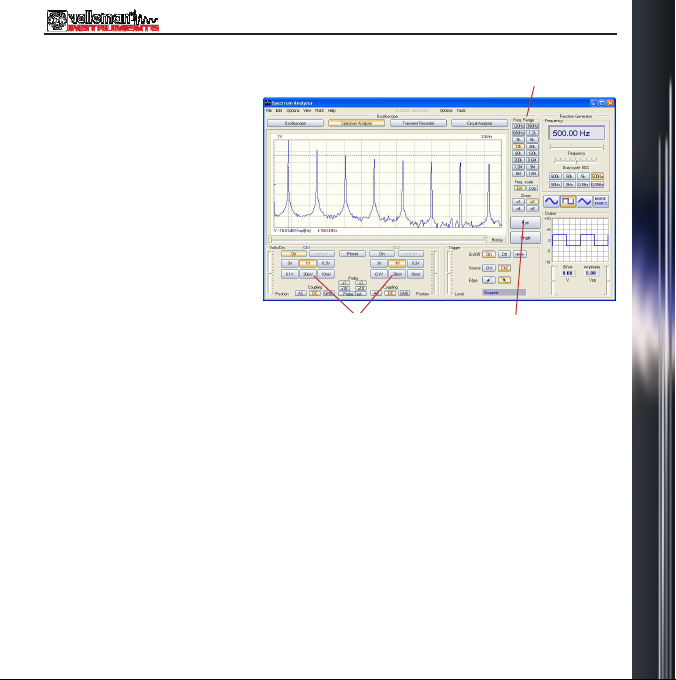
What
What ? :
? :
WhatWhat
which allows visualization of
the frequency spectrum of a
signal, using FFT (Fast
Fourier Transform) analysis.
How
How ? :
HowHow
•
Connect the scope input to the circuit under test. (observe the max. input
rating of the scope!) Or use the internal generator output.
•
First observe the signal on the scope screen (see previous page).
•
Check that the signal is not over the maximum of the screen.
•
Start the spectrum analyzer.
•
Press ‘RUN’ (1111)
•
Select the appropriate frequency range. Make sure your setting will capture
any signal change of interest (3333).
•
If wanted set the appropriate channel and volts/div setting (2222)
Powerful feature
? : ? :
? :
? : ? :
2
3
1
9
Page 10
The
The Transient recorder
Transient recorder
TheThe
Transient recorder Transient recorder
The
The Transient Recorder Module :
Transient Recorder Module :
TheThe
Transient Recorder Module : Transient Recorder Module :
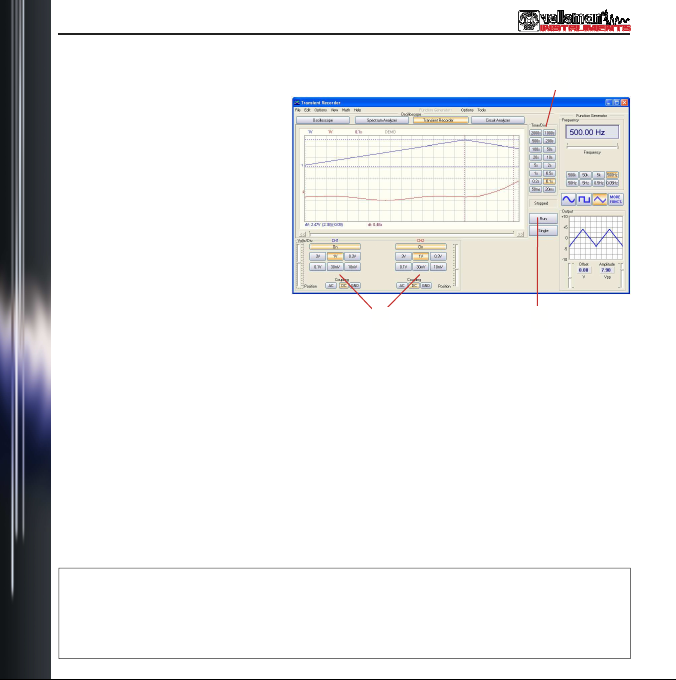
What
What ? :
? :
WhatWhat
events and log slow changing
processes automatically, e.g.
battery charge cycles,
temperature changes,... or track
intermittent faults in electronic
circuits. Automatic data storage
allows over one year of
continuous recording !
How
How ? :
HowHow
•
•
•
•
Press RUN again , to stop the measurement, or use the “Single” button to
For continuous recording with auto-save to your HD, select ‘AutoSave Data’
from the ‘File’-menu.
Notes
Notes::::
NotesNotes
During recording the screen can differ from the actual measurement.
Events happening between two sample acquisitions will be missed if a too
10
Record occasional
? : ? :
? :
? : ? :
Connect the scope input to the circuit under test. (or the internal generator at
a low frequency)
Select the appropriate channel and volts/div (or volt range) setting (1111).
Select the appropriate time/division setting (3333).
Press RUN (2222) to start recording.
make a single screen measurement.
slow time/div is set
1111
2222
3333
Page 11
The
The Bode plotter
Bode plotter
TheThe
Bode plotterBode plotter
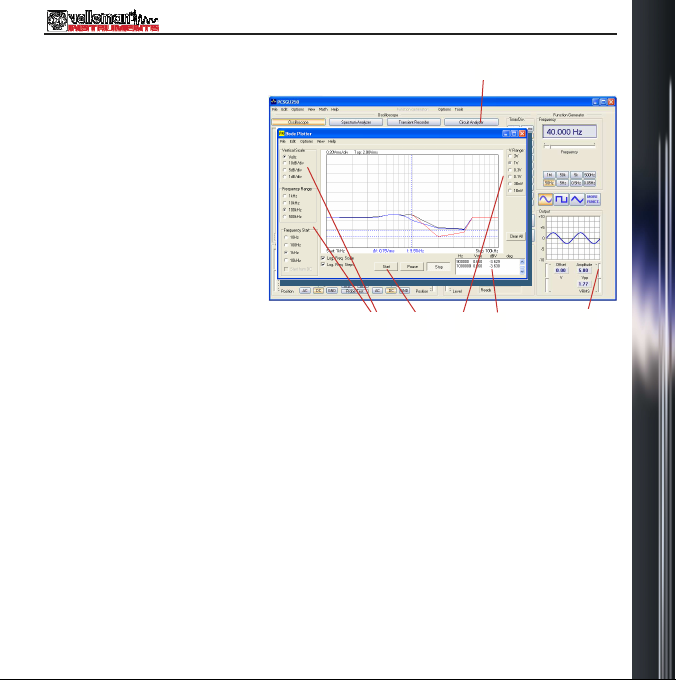
The
The Bode plotter
Bode plotter module
TheThe
Bode plotterBode plotter
What
What ? :
? :
WhatWhat
scope and generator combination, an automated Bode
plot function is possible. This
results in a powerful tool for
amplifier or filter measurements.
How
How ? :
HowHow
•
•
•
•
•
•
•
Due to the unique
? : ? :
? :
? : ? :
Enable the Circuit Analyser window (1111)
Connect the scope CH1 input to the output of the circuit or unit under test.
Connect the generator output to the input of the circuit or unit.
Adjust the generator output (2222) to a suitable level.
Adjust the setting of the Bode plot module like Volt range (3333) Volt scale, fre-
quency start and stop range (4444)...
Press ‘Start’ (5555) and observe the screen and measurement window (6666)
If the signal is out of the screen range, adjust the Voltage range or generator
output level.
module :
modulemodule
:
: :
1
4
6
3 5
2
11
Page 12
Extra’s
Extra’s
Extra’sExtra’s
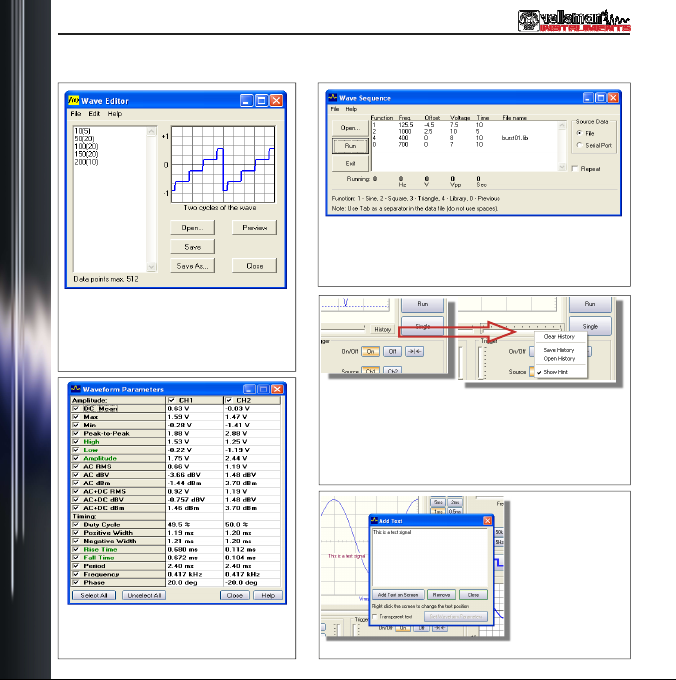
Some useful extra’s
Some useful extra’s ::::
Some useful extra’s Some useful extra’s
In “Tools” Open the Wave editor to generate your own waveform. In this example:
level 10: 5 times, level 50: 20 times ...
Open the waveform parameters window to
see extended waveform parameters
12
(see also the help file)
(see also the help file)
(see also the help file)(see also the help file)
In “Tools” Open the Wave Sequence panel to create
automated wave forms coming from file or serial port
data scripts.
First “Stop” the scope. Click the history button to open
the history scroll panel. This function will record up to
1000 signals. Save and open the history file, then use
your mouse scroll function to easy scroll through the
signal history. Now start (RUN) the scope.
It is possible to add
some text and wave
form parameters on
the signal screen.
Right click on the
signal screen to
open a window and
add your text.
Page 13

Bienvenue
Bienvenue
BienvenueBienvenue
Introduction
Introduction : Le monde du Pc
IntroductionIntroduction
: Le monde du Pc----Lab2000LT
: Le monde du Pc: Le monde du Pc
Lab2000LT
Lab2000LTLab2000LT
Destiné au PCSGU250, un petit labo USB complet !
Logiciel PcLab2000-LT puissant pour oscilloscope deux canaux, analyseur de
spectre, enregistreur, générateur de fonction et diagramme de Bode. Éditeur
d’ondes intégré et séquenceur automatisé via fichier ou entrée PC.
LLLL’utilisation du logiciel en mode de démonstration ne nécessite pas de périphérique.
Générateur de fonction
Informations générales
Informations générales
Informations généralesInformations générales
•
marqueurs pour amplitude/tension et fréquence/temps
•
raccordement à l'entrée : CC, CA et GND
•
résolution 8 bits
•
possibilité de mise en mémoire de l’affichage
et des données
•
alimentation par port USB (500mA)****
•
dimensions : 205 x 55 x 175 mm
Analyseur de spectre
Analyseur de spectre
Analyseur de spectreAnalyseur de spectre
•
plage de fréquence : 0 .. 120 Hz ~ 12 MHz
•
échelle de temps linéaire ou logarithmique
•
principe de fonctionnement : FFT (Fast Fourier
Transform ou transformée de Fourier rapide)
•
résolution FFT : 2048 lignes
•
canal d’entrée FFT : CH1 ou CH2
•
zoom
Enregistreur de signaux transitoires
Enregistreur de signaux transitoires
Enregistreur de signaux transitoiresEnregistreur de signaux transitoires
•
échelle de temps : 20 ms/div ~ 2000 s/div
•
temps d'enregistrement max. : 9,4 h/écran
•
mise en mémoire automatique des données
•
enregistrement automatique pendant plus
d’un an
•
nombre max. d'échantillons : 100/s
•
nombre min. d'échantillons : 1 échantillon/20s
Remarque
Remarque :
: Afin d’éviter tout blocage de logiciel, l’utilisation d’un hub USB est déconseillé
RemarqueRemarque
SPÉCIFICATIONS SOUS RÉSERVE DE MODIFICATIONS - DLL disponible pour des développements personnalisés
: :
Générateur de fonction
Générateur de fonctionGénérateur de fonction
•
plage de fréquence: sinusoïde de 0,005Hz ~ 1MHz
•
carré et triangulaire de 0,005Hz ~ 500kHz
•
formes d’onde étendues
•
amplitude: 100mVpp ~ 10Vpp @ 1kHz//600Ω/
impédance de sortie: 50Ω
Oscilloscope
Oscilloscope
OscilloscopeOscilloscope
•
largeur de bande : 2 canaux CC à 12MHz ± 3dB
•
impédance d’entrée : 1ΩM/30 pF
•
tension d’entrée max. : 30V (CA + CC)
•
base de temps : 0,1µs ~ 500ms par division
•
plage d’entrée : 10mV ~ 3V par division
•
affichages : TRMS, dBV, dBm, P2P, rapport de cycle,
fréquence…
•
longueur d’enregistrement : 4.000 échantillons/
canal
•
fréquence d’échantillonnage : 250Hz ~ 25MHz
•
historique d’échantillonnage et fonction de capture
d’image numérique
Diagramme de Bode
Diagramme de Bode
Diagramme de BodeDiagramme de Bode
•
synchronisation automatique entre l’oscilloscope et
le générateur
•
plage de fréquence : 1kHz, 10kHz, 100kHz, 1MHz
•
départ de fréquence : 10Hz, 100Hz, 1kHz, 10kHz
13
Page 14

Installation du matériel
Installation du matériel
Installation du matérielInstallation du matériel
Comment installer le Pc
Comment installer le Pc----Lab2000LT
Comment installer le PcComment installer le Pc
Lab2000LT
Lab2000LTLab2000LT
Système requis
•
Windows™ 2000/XP/Vista (*)
•
carte vidéo VGA (1024x768 recommandé)
•
espace disque dur 10 Mo
•
souris ou pointeur
•
lecteur CD ou CD/DVD
•
port USB (1.1 ou 2.0)
Insérer le CD dans le lecteur.
Si le CD ne démarre pas automatiquement,
ouvrir le répertoire du CD et lancer le fichier
"SETUP.EXE"
"SETUP.EXE".
"SETUP.EXE""SETUP.EXE"
Sélectionner "
L’assistant d’installation vous guidera dans le
processus d’installation. Les raccourcis vers le
logiciel
sont automatiquement générés.
(*) Remarque
(*) Remarque :::: Enregistrez-vous comme administrateur afin de compléter le
(*) Remarque(*) Remarque
processus d’installation ou contactez votre administrateur systèmes pour plus de
renseignements. Voir également le fichier "ReadME" dans le dossier installé.
* Microsoft Windows™ 2000/XP/VISTA (*) est une marque déposée.
Téléchargez la version à jour sur
Téléchargez la version à jour sur www.velleman.eu.
Téléchargez la version à jour sur Téléchargez la version à jour sur
Pc
Pc----Lab2000LT
Lab2000LT
PcPc
Lab2000LTLab2000LT
Pc
Pc----Lab2000LT
Lab2000LT
PcPc
Lab2000LTLab2000LT
".
et des fichiers de secours
www.velleman.eu.
www.velleman.eu.www.velleman.eu.
14
Page 15

Lancement du logiciel
Lancement du logiciel
Lancement du logicielLancement du logiciel
Connexion de périphérique
Connexion de périphérique
Connexion de périphérique Connexion de périphérique
continuer)
continuer)
continuer)continuer)
Installation du pilote USB
Installation du pilote USB
Installation du pilote USBInstallation du pilote USB
•
•
•
•
•
•
•
Remarque
Remarque :::: En cas de fonctionnement entravé, désinstaller le pilote USB de la
RemarqueRemarque
barre des tâches et installer "D:\PCSGU250Driver\PCSGU250Driver_WinUSB"
après reconnexion du périphérique.
Lancement du logiciel:
Lancement du logiciel:
Lancement du logiciel:Lancement du logiciel:
Localiser le raccourci "
Cliquez sur l’icône pour lancer le logiciel. Le message "loading, please wait"
s’affiche. Une fois le logiciel chargé, la DEL s’allume. (*)
Le logiciel affiche automatiquement l’oscilloscope et le générateur de fonction (à la
page suivante). En cas d’erreur (unité non détectée), déconnectez et reconnectez le
câble USB, et réessayez. Pour accéder au mode de démonstration (utilisation sans
périphérique), cliquez "Options", "Hardware Setup" et ensuite "Demo Mode".
REMARQUES
REMARQUES :
REMARQUESREMARQUES
---- Les captures d’écran peuvent différer de la réalité.
Raccordez votre PCSGU250 à un port USB libre.
Suivez le processus d’installation affiché à l’écran.
Si Windows® vous propose de mettre à jour votre version de Windows®, choisissez
"Non, pas cette fois-ci".
Installez le pilote et sélectionner "D:\PCSGU250Driver
CD. Cliquez "Suivant".
Si Windows® indique "Ce périphérique n’est pas reconnu. Il ne sera pas installé.
Veuillez trouver un autre pilote", sélectionnez "Voulez-vous continuer ?".
Une fois le pilote installé, contrôlez le pilote dans la liste du gestionnaire des
périphériques.
Redémarrez votre ordinateur si nécessaire.
Pc
Pc----Lab2000LT
Lab2000LT
PcPc
Lab2000LTLab2000LT
: ---- L’oscilloscope sera automatiquement étalonné lors de la première mise en marche
L’oscilloscope sera automatiquement étalonné lors de la première mise en marche
: :
L’oscilloscope sera automatiquement étalonné lors de la première mise en marcheL’oscilloscope sera automatiquement étalonné lors de la première mise en marche
Les captures d’écran peuvent différer de la réalité.
Les captures d’écran peuvent différer de la réalité. Les captures d’écran peuvent différer de la réalité.
(fermez tous les programmes avant de
(fermez tous les programmes avant de
(fermez tous les programmes avant de (fermez tous les programmes avant de
D:\PCSGU250Driver" dans le répertoire du
D:\PCSGU250DriverD:\PCSGU250Driver
".
"loading, please wait"
"loading, please wait" "loading, please wait"
15
Page 16

Le générateur de fonction
Le générateur de fonction
Le générateur de fonctionLe générateur de fonction
Le générateur de fonction
Le générateur de fonction
Le générateur de fonctionLe générateur de fonction
Quoi
Quoi ????
QuoiQuoi
Les ondes les plus communes
sont accessibles depuis un seul
bouton. Vous disposez d’un
répertoire contenant des fonctions spéciales, tout comme un
éditeur d’ondes afin de créer
toute sorte d’ondes.
Comment
Comment ????
CommentComment
•
Cliquez sur la forme d’onde souhaitée (1111).
•
Sélectionnez la plage de fréquence (2222).
•
Déterminez la fréquence à l’aide de la glissière (3333) ou en saisissant une
fréquence dans le champ (4444).
•
Réglez l’offset (5555).
•
Réglez l’amplitude (6666).
(saisissez les valeurs en cliquant dans le champ "Offset" et "Amplitude")
•
Le diagramme (7777) affiche une simulation de l’onde.
Plus de fonctions "More Funct."
Plus de fonctions "More Funct."
Plus de fonctions "More Funct."Plus de fonctions "More Funct."
Le bouton "More Funct." vous donne accès à des ondes
spéciales telles que des ondes arbitraires, balayages de
fréquence, CC, ainsi qu’au répertoire des formes d’onde.
Remarque : Le bouton "Probe Test" (8888) permet au générateur de produire
un signal de sortie pour l’étalonnage de la sonde oscilloscope X10.
8888
16
4444
3333
2222
7777
5555
6666
1111
Page 17

L’oscilloscope
L’oscilloscope
L’oscilloscopeL’oscilloscope
L’oscilloscope
L’oscilloscope
L’oscilloscopeL’oscilloscope
8888
Quoi
Quoi ????
QuoiQuoi
Cet outil est un oscilloscope numérique de stockage
complet et facile à utiliser.
Comment
Comment ????
CommentComment
•
Connectez le circuit à tester à l’entrée de l’oscilloscope (observez la valeur
d’entrée max. de l’oscilloscope !) ou à la sortie du générateur.
•
Mesurez avec "Trigger Off" (6666).
•
Cliquez sur "Run" (7777).
•
Choisissez le canal et les volts/div, ou cliquez "Autoset" (2222).
•
Choisissez le temps/div (8888).
Démarrage
Démarrage ::::
DémarrageDémarrage
•
Sélectionnez le canal de démarrage (5555).
•
Sélectionnez le flan de démarrage (4444).
•
Cliquez sur "Trigger On" (6666).
•
Paramétrez le niveau avec la glissière (3333). Le niveau est affiché sur la
gauche du diagramme (1111).
1111
2222
3333
5555
4444
7777 6666
17
Page 18

L’analyseur de spectre
L’analyseur de spectre
L’analyseur de spectreL’analyseur de spectre
L’analyseur de spectre
L’analyseur de spectre
L’analyseur de spectreL’analyseur de spectre
Quoi
Quoi ????
QuoiQuoi
Outil puissant permettant de
visualiser le spectre de fréquence d’un signal à l’aide
d’une analyse FFT (Fast
Fourier Transform).
Comment
Comment ????
CommentComment
•
Connectez l’entrée de l’oscilloscope au circuit à tester (observez les valeurs maximales d’entrée de l’oscilloscope) ou utilisez la sortie du générateur interne.
•
Observez le signal sur l’écran de l’oscilloscope (référez à la page précédente).
•
Assurez-vous que le signal n’excède pas la valeur maximale de l’écran.
•
Démarrez l’analyseur de spectre.
•
Enfoncez "Run" (1111).
•
Sélectionnez la plage de fréquence appropriée. Assurez-vous que la valeur
choisie soit assez large afin qu’elle puisse capturer le changement de signal
souhaité (3333)
•
Choisissez le canal et les volts/div si nécessaire (2222).
2
3
1
18
Page 19

L’enregistreur de signaux transitoires
L’enregistreur de signaux transitoires
L’enregistreur de signaux transitoiresL’enregistreur de signaux transitoires
L’enregistreur de signaux transitoires
L’enregistreur de signaux transitoires
L’enregistreur de signaux transitoiresL’enregistreur de signaux transitoires
Quoi
Quoi ? :
? :
Quoi Quoi
? : ? :
Enregistrez automatiquement des
événements occasionnels et des
modifications lents, p.ex. le cycle
de charge d’une batterie, l’évolution de la température… ou dépister des fautes intermittentes dans
un circuit. Les données sont automatiquement mises en mémoire.
Le Pc-Lab2000LT vous permet
d’enregistrer des données pendant 1 an !
Comment
Comment ????
CommentComment
•
Connectez l’entrée au circuit à tester (ou au générateur interne à une basse
fréquence).
•
Sélectionnez le canal et les volts/div (ou plage de tension) appropriés (1111).
•
Sélectionnez le temps/division approprié (3333).
•
Enfoncez "Run" (2222) pour enregistrer.
Renfoncez "Run" pour interrompre l’enregistrement ou enfoncez "Single" pour
Sélectionnez "AutoSave Data" dans le menu "File" pour enregistrer en mode
continu avec mise en mémoire automatique sur disque dur.
Remarque
Remarque ::::
RemarqueRemarque
Pendant l’enregistrement, les écrans peuvent différer de la mesure actuelle.
L’interaction entre les deux échantillons ne sera pas mesurée si la valeur
effectuer une mesure d’écran simple.
temps/div choisie est trop basse.
1111
3333
2222
19
Page 20

Le diagramme de Bode
Le diagramme de Bode
Le diagramme de BodeLe diagramme de Bode
Le diagramme de Bode
Le diagramme de Bode
Le diagramme de BodeLe diagramme de Bode
Quoi
Quoi ????
QuoiQuoi
Il est possible de mesurer le
niveau d’amplification ou de
filtrage grâce au traceur de
Bode intégré.
Comment
Comment ????
CommentComment
•
Ouvrez la fenêtre "Circuit Analyser" (1111).
•
Connectez l’entrée du canal CH1 de l’oscilloscope à la sortie du circuit ou de
l’unité à tester.
•
Connectez la sortie du générateur à l’entrée du circuit ou de l’unité.
•
Réglez la sortie du générateur (2222) à un niveau approprié.
•
Paramétrez le traceur de Bode au niveau de "V Range" (3333), "Vertical Scale",
"Frequency Range" et "Frequency Start" (4444)…
•
Enfoncez "Start" (5555) et observez les valeurs dans la fenêtre de mesure (6666).
•
Ajustez la valeur sous "V Range" ou le niveau de sortie du générateur si le
signal est hors de la portée de l’écran.
4
1
6
3 5
2
20
Page 21

Informations supplémentaires
Informations supplémentaires
Informations supplémentaires Informations supplémentaires
Ouvrez la fenêtre "Wave Sequence" sous "Tools" pour
créer des formes d’onde automatiques provenant d’un
fichier ou d’un port sériel.
Ouvrez l’éditeur "Wave Editor" sous "Tools"
pour générer votre propre forme d’onde.
Dans cet exemple : niveau 10 : 5 temps,
niveau 50 : 20 temps...
Arrêtez l’oscilloscope. Cliquez sur "History" pour dérouler
un menu. Mémorisez et ouvrez le fichier de l’historique,
et défilez avec le la roulette sur la souris. Démarrez
l’oscilloscope en cliquant sur "Run".
Ouvrez la fenêtre " Waveform Parameters"
pour afficher les paramètres de la forme
d’onde.
Informations supplémentaires
Informations supplémentaires
Informations supplémentaires Informations supplémentaires
(consultez les fichiers de secours)
(consultez les fichiers de secours)
(consultez les fichiers de secours)(consultez les fichiers de secours)
Vous pouvez ajouter
un texte et des
paramètres dans le
diagramme.
Cliquez sur le diagramme avec le
bouton droit de la
souris pour ouvrir
une fenêtre textuelle.
21
Page 22

Einführung
Einführung
EinführungEinführung
Einführung: entdecken Sie die Welt vom Pc
Einführung: entdecken Sie die Welt vom Pc----Lab2000LT
Einführung: entdecken Sie die Welt vom PcEinführung: entdecken Sie die Welt vom Pc
Lab2000LT
Lab2000LTLab2000LT
Ein komplettes USB-Laboratorium!
Leistungsstarke PcLab2000-LT-Software für 2-Kanal-Oszilloskop, Spektrumanalysator, Transientenrecorder, Funktionsgenerator und Bode Plotter. Kreieren
Sie über Datei oder externen PC-Eingang Ihre eigenen Wellenformen mit dem
mitgelieferten Signal-Wellenform-Editor und dem automatisierten Sequenzer.
Sie brauchen keine Hardware, um die Software im Demomodus zu verwenden.
Funktionsgenerator
Allgemein
Allgemein
AllgemeinAllgemein
•
Markierungen für Amplitude/Spannung und
Frequenz/Zeit
•
Eingangskopplung: DC, AC und GND
•
Auflösung von 8 bits
•
Speicherung von Schirmabbildung und Daten
•
Stromversorgung über USB-Port (500mA)
•
Abmessungen: 205 x 55 X 175 mm
Spektrumanalysator
Spektrumanalysator
SpektrumanalysatorSpektrumanalysator
•
Frequenzbereich: 0 .. 120 Hz ~ 12 MHz
•
linearer oder logarithmischer Zeitmaßstab
•
Funktionsweise: FFT (Fast Fourier Transform)
•
FFT-Auflösung: 2048 Zeilen
•
FFT-Eingangskanal: CH1 oder CH2
•
Zoom-Funktion
Transientenrecorder
Transientenrecorder
TransientenrecorderTransientenrecorder
•
Zeitmaßstab: 20 ms/div ~ 2000 s/div
•
max. Aufnahmezeit: 9.4 Stunden pro
Schirminhalt m
•
automatische Datenspeicherung
•
automatische Aufnahme bis zu mehr als 1Jahr
•
max. Abtastgeschwindigkeit: 100/s
•
min. Abtastgeschwindigkeit: 1 Sample/20s
Funktionsgenerator
FunktionsgeneratorFunktionsgenerator
•
Frequenzbereich: Sinuswelle von 0,005 Hz ~ 1 MHz
•
Rechteck-, Dreieckwelle von 0,005 Hz ~ 500 kHz
•
umfangreiche Wellenformbibliothek
•
Amplitude: 100 mVpp ~ 10 Vpp @ 1 kHz/600 Ω/
Ausgangsimpedanz: 50 Ω
Oszilloskop
Oszilloskop
OszilloskopOszilloskop
•
Bandbreite: 2-Kanal DC bis 12 MHz ±3dB
•
Eingangsimpedanz: 1 MΩ/30 pF
•
max. Eingangsspannung: 30 V (AC + DC)
•
Zeitbasis: 0,1 µs ~ 500 ms pro Division
•
Eingangsbereich: 10 mV ~ 3 V/Division
•
Anzeigen: TRMS, dBV, dBm, P2P, Arbeitszyklus,
Frequenz…
•
Aufnahmelänge: 4.000 Samples / Kanal
•
Abtastfrequenz für sich wiederholende Signale:
250 Hz ~ 25 MHz
•
Überblick und digitale Bilderfassung
Bode Plotter
Bode Plotter
Bode PlotterBode Plotter
•
automatische Synchronisation zwischen Oszilloskop
und Generator
•
Frequenzbereich: 1 kHz, 10 kHz, 100 kHz, 1 MHz
•
Frequenzstart: 10 Hz, 100 Hz, 1 kHz, 10 kHz
22
*Bemerkung: Verwenden Sie keinen USB
*Bemerkung: Verwenden Sie keinen USB----Hub, um das Blockieren der Software zu vermeiden.
*Bemerkung: Verwenden Sie keinen USB*Bemerkung: Verwenden Sie keinen USB
TECHNISCHE DATEN UNTER VORBEHALT - DLL für eigene Projekte verfügbar - www.velleman.eu
Hub, um das Blockieren der Software zu vermeiden.
Hub, um das Blockieren der Software zu vermeiden.Hub, um das Blockieren der Software zu vermeiden.
Page 23

Installation der Software
Installation der Software
Installation der SoftwareInstallation der Software
Installation des Pc
Installation des Pc----Lab2000LT
Installation des PcInstallation des Pc
Lab2000LT
Lab2000LTLab2000LT
Min. Systemvoraussetzungen:
•
Windows™2000/XP/Vista (*)
•
VGA-Karte (1024x768 empfohlen)
•
10 MB freier Speicherplatz
•
Maus oder ähnlich
•
CD- oder CD-/DVD-ROMS-Spieler
•
freier USB-Port (1.1 oder 2.0)
Legen Sie das CD-ROM in das CD-ROM-Laufwerk ein.
Durchsuchen Sie das CD-ROM und starten Sie
das Programm SETUP.EXE
nicht automatisch startet.
SETUP.EXE wenn die Installation
SETUP.EXESETUP.EXE
Wählen Sie "Install
Ein Wizard lotst Sie durch das vollständige
Installationsverfahren. Schnelltasten zur
Lab2000LT
Lab2000LT
Lab2000LTLab2000LT
werden automatisch generiert.
(*) Bemerkung:
(*) Bemerkung: Loggen Sie als Administrator ein, um die Software zu
(*) Bemerkung:(*) Bemerkung:
installieren. Kontaktieren Sie den Systemverwalter für mehr Information.
Siehe auch die ReadME-Datei des installierten Verzeichnisses.
* Microsoft Windows™ 2000/XP/VISTA (*) sind eingetragene Schutzmarken.
Laden Sie die neueste Version auf
Laden Sie die neueste Version auf www.velleman.be
Laden Sie die neueste Version auf Laden Sie die neueste Version auf
Pc
Pc----Lab2000LT
Lab2000LT
PcPc
Lab2000LTLab2000LT
----Software und die Hilfsdateien
".
Pc
Pc----
PcPc
www.velleman.be herunter und befolgen Sie den Link.
www.velleman.bewww.velleman.be
herunter und befolgen Sie den Link.
herunter und befolgen Sie den Link. herunter und befolgen Sie den Link.
23
Page 24

Anschluss der Hardware
Anschluss der Hardware
Anschluss der HardwareAnschluss der Hardware
Anschluss der Hardware (schließen Sie zuerst alle Programme)
Anschluss der Hardware (schließen Sie zuerst alle Programme)
Anschluss der Hardware (schließen Sie zuerst alle Programme)Anschluss der Hardware (schließen Sie zuerst alle Programme)
Den USB
Den USB----Treiber installieren
Den USBDen USB
•
•
•
Treiber installieren
Treiber installierenTreiber installieren
Verbinden Sie das PCSGU250 mit einem freien USB-Port.
Befolgen Sie das Installationsverfahren im Bildschirm.
Wenn Windows eine Windows-Aktualisierung fragt, wählen Sie dann "Not at this
time".
•
Installieren Sie den Treiber und wählen Sie "D:\PCSGU250Treiber
D:\PCSGU250Treiber" im CD-ROM.
D:\PCSGU250TreiberD:\PCSGU250Treiber
Klicken Sie "Next".
•
Bei Meldung "Has not passed Windows logo testing…" klicken Sie "Continue Anyway".
•
Nach der Installation des Treibers, kontrollieren Sie, ob den Treiber korrekt im
Device Manager installiert wurde.
•
Starten Sie den PC wieder wenn nötig.
Bemerkung:
Bemerkung: Im Problemfall, entfernen Sie den USB-Treiber vom Menübalken und
Bemerkung:Bemerkung:
installieren Sie "D:\PCSGU250Treiber\PCSGU250Treiber_WinUSB" nachdem Sie die
Hardware wieder verbunden haben.
Die Software starten
Die Software starten
Die Software startenDie Software starten
Lokalisieren Sie die
Pc
Pc----Lab2000LT
Lab2000LT
PcPc
Lab2000LTLab2000LT
----Schnelltaste.
Klicken Sie um das Hauptprogramm zu starten. Die Nachricht "Loading,
please wait"
please wait" erscheint und die LED leuchtet.
please wait"please wait"
oading,
oading, oading,
Das Hauptprogramm lädt sofort das Oszilloskop- und Generatordisplay (siehe
nachfolgende Seiten). Bei einer Fehlermeldung (z.B. keine Hardware erkannt),
trennen Sie, verbinden Sie das USB-Kabel wieder und versuchen Sie wieder.
Laden Sie den Demomodus (keine Hardware erforderlich) indem Sie "Options" >
"Hardware Setup" > "Demo mode" klicken.
BEMERKUNG:
BEMERKUNG: ---- Das Oszilloskop
BEMERKUNG:BEMERKUNG:
---- Die dargestellten Schirmbeispiele können von der Wirklichkeit abweichen.
24
Das Oszilloskop wird bei der ersten Inbetriebnahme automatisch kalibriert
Das OszilloskopDas Oszilloskop
Die dargestellten Schirmbeispiele können von der Wirklichkeit abweichen.
Die dargestellten Schirmbeispiele können von der Wirklichkeit abweichen. Die dargestellten Schirmbeispiele können von der Wirklichkeit abweichen.
wird bei der ersten Inbetriebnahme automatisch kalibriert
wird bei der ersten Inbetriebnahme automatisch kalibriertwird bei der ersten Inbetriebnahme automatisch kalibriert
Page 25

Der Funktionsgenerator
Der Funktionsgenerator
Der FunktionsgeneratorDer Funktionsgenerator
3333
Der Funktionsgenerator
Der Funktionsgenerator
Der FunktionsgeneratorDer Funktionsgenerator
Was?
Was?
Was?Was?
Die meisten Wellenformen sind
über einen einzigen
Tastendruck verfügbar. Mit den
vielen verfügbaren speziellen
Funktionen und den WaveEditor können Sie fast jeden
Wellenformtyp kreieren.
Wie?
Wie?
Wie?Wie?
•
Klicken Sie auf die gewünschte Wellenform (1111).
•
Wählen Sie den Frequenzbereich (2222).
•
Stellen Sie die genaue Frequenz mit dem Schiebebalken (3333) ein oder klicken
Sie im Frequenzfach (4444) und geben Sie die Frequenz ein.
•
Regeln Sie Offset (5555).
•
Regeln Sie die Amplitude (6666).
(geben Sie die Werte im Offset- und Amplitudefeld ein)
•
(7777) zeigt eine Vorschau der Wellenform an.
Die Taste "More Functions"
Die Taste "More Functions"
Die Taste "More Functions"Die Taste "More Functions"
Diese Taste verschafft Zugang zu speziellen
Wellenformen: beliebigen Wellenformen, Frequency
Sweeps, DC und auch der Wellenformbibliothek.
Bemerkung: Mit der Taste "Probe Test" (8888) kreiert der Generator ein
Signal, das sich zum Kalibrieren von der Oszilloskopsonde an
Einstellung X10 eignet.
8888
2222
1111
5555
4444
7777
6666
25
Page 26

Das Oszilloskop
Das Oszilloskop
Das OszilloskopDas Oszilloskop
Das Oszilloskop
Das Oszilloskop
Das OszilloskopDas Oszilloskop
Was?
Was?
Was?Was?
Dies ist ein komplettes
und einfach zu verwenden
digitales Speicheroszilloskop.
Wie?
Wie?
Wie?Wie?
•
Verbinden Sie den Kreis, den Sie testen möchten, mit dem Eingang
(überschreiten Sie die max. Eingangswerte des Oszilloskopes nicht!) oder dem
Generatorausgang.
•
Starten Sie die Messung mit "Trigger off" (6666).
•
Drücken Sie "Run" (7777).
•
Wählen Sie den gewünschten Kanal und volts/div oder drücken Sie "Autoset" (2222)
•
Wählen Sie die geeignete Time/div-Einstellung (8888).
Auslösung:
Auslösung:
Auslösung:Auslösung:
•
Wählen Sie den Triggerkanal (5555).
•
Wählen Sie den Triggerflanke (4444).
•
Stellen Sie den Trigger auf "ON" (6666).
•
Stellen Sie das Triggerniveau mit der Schiebetaste (3333) ein. Der Pegel
26
wird links im Diagramm dargestellt (1111).
1111
2222
4444
3333
5555
8888
7777 6666
Page 27

Der Spektrumanalysator
Der Spektrumanalysator
Der SpektrumanalysatorDer Spektrumanalysator
Der Spektrumanalysator
Der Spektrumanalysator
Der SpektrumanalysatorDer Spektrumanalysator
Was?
Was?
Was?Was?
Der Spektrumanalysator
zeigt Ihnen ein deutliches
Bild des Frequenzspektrums
eines Signals über eine FFTAnalyse (Fast Fourier
Transform).
Wie?
Wie?
Wie?Wie?
•
Verbinden Sie den Oszilloskopeingang mit dem Kreis, den Sie testen möchten
(überschreiten Sie die max. Eingangswerte des Oszilloskopes nicht!) oder
verwenden Sie den internen Generatorausgang.
•
Analysieren Sie das Signal im Display (siehe vorige Seite).
•
Beachten Sie, dass das Signal die Höchstwerte nicht überschreitet und nicht
außerhalb des Displays fällt.
•
Starten Sie den Spektrumanalysator.
•
Drücken Sie "Run" (1111).
•
Wählen Sie den geeigneten Frequenzbereich damit alle Änderungen im
Display sichtbar werden (3333).
•
Stellen Sie den Kanal und die Volts/div-Einstellung (2222) ein wenn gewünscht.
2
3
1
27
Page 28

Der Transientenrecorder
Der Transientenrecorder
Der TransientenrecorderDer Transientenrecorder
Der Transientenrecorder
Der Transientenrecorder
Der TransientenrecorderDer Transientenrecorder
Was?
Was?
Was?Was?
Legen Sie ein einmaliges
auftretendes Signal fest, nimmt
automatisch langsame
Änderungen (z.B. Ladezyklus einer
Batterie, Temperaturänderungen,
usw.) auf oder sucht zyklische
Fehler in einem elektronischen
Kreis. Der Speicher erlaubt
Aufnahmen von einem Jahr!
Wie?
Wie?
Wie?Wie?
•
Verbinden Sie den Oszilloskopeingang mit dem Kreis, den Sie testen möchten,
oder verwenden Sie den internen Generatorausgang mit niedriger Frequenz.
•
Wählen Sie den geeigneten Kanal und die Volts/div-Einstellung
(Spannungsbereich) (1111).
•
Wählen Sie die geeignete Zeit/div-Eintsellung (3333).
•
Drücken Sie "Run" (2222) um die Aufnahme zu starten.
Drücken Sie "Run" wieder, um die Aufnahme zu stoppen oder klicken Sie
"Single" um eine einzige Bildschirmaufnahme zu machen.
Für eine kontinuierliche Aufnahme mit automatischer Speicherung auf Festplatte,
wählen Sie "AutoSave Data" unter "File".
Bemerkung:
Bemerkung:
Bemerkung:Bemerkung:
Die dargestellten Bildschirmbeispiele können während der Aufnahme von
der Wirklichkeit abweichen.
Es ist möglich, dass der Transientenrecorder das Signal bei einer zu
28
niedrigen Zeit/div-Einstellung nicht festlegt.
1111
2222
3333
Page 29

Der Bode plotter
Der Bode plotter
Der Bode plotterDer Bode plotter
Der Bode Plotter
Der Bode Plotter
Der Bode PlotterDer Bode Plotter
Was?
Was?
Was?Was?
Mit diesem Diagramm
können Sie einfach
Filtermessungen durchführen.
Wie?
Wie?
Wie?Wie?
•
Klicken Sie "Circuit Analyser" (1111).
•
Verbinden Sie den Eingang CH1 vom Oszilloskop mit dem Ausgang vom
Kreis, den Sie testen möchten.
•
Verbinden Sie den Ausgang des Generators mit dem Eingang vom Kreis.
•
Regeln Sie den Pegel des Generatorausgangs (2222).
•
Regeln Sie den Spannungsbereich (3333), den Maßstab, die Frequenzwerte (4444), usw.
•
Drücken Sie "Start" (5555). Das Diagramm wird dargestellt (6666).
•
Regeln Sie den Spannungsbereich oder den Generatorausgang wenn die
Kurve außerhalb des Bereiches fällt.
4
1
6
3 5
2
29
Page 30

Zusätzliche Information
Zusätzliche Information
Zusätzliche InformationZusätzliche Information
Zusätzliche Information
Zusätzliche Information
Zusätzliche Information Zusätzliche Information
Öffnen Sie "Wave Editor" unter "Tools", um
Ihre eigene Wellenform zu kreieren. In
diesem Beispiel: Pegel 10: 5 Mal, Pegel
50: 20 Mal...
Öffnen Sie "Waveform Parameters“, um
ausführliche Parameter anzuzeigen.
30
(siehe auch Hilfedatei)
(siehe auch Hilfedatei)
(siehe auch Hilfedatei)(siehe auch Hilfedatei)
Öffnen Sie "Wave Sequence" unter "Tools", um
automatisierte Wellenformen zu kreieren.
Stoppen Sie das Oszilloskop. Klicken Sie "History", um
das Überblickmenü zu öffnen. Mit dieser Funktion
können Sie bis zu 1.000 Signale festlegen. Öffnen Sie
den Überblick und speichern Sie ihn, scrollen Sie mit
dem Mausrad durch den Überblick. Starten Sie (drücken
Sie "Run") das Oszilloskop aufs Neue.
Si e kö nnen da s
Diagramm mit Text und
P a r a m e t e r n
vervollständigen.
Kl icken S i e da s
Diagramm mit der
rechten Maustaste, um
das Textfenster zu öffnen
und geben Sie den
gewünschten Text ein.
Page 31

Introducción
Introducción
IntroducciónIntroducción
Introducción: El mundo del Pc
Introducción: El mundo del Pc----Lab2000LT
Introducción: El mundo del PcIntroducción: El mundo del Pc
Lab2000LT
Lab2000LTLab2000LT
¡Un pequeño laboratorio USB completo! Software PcLab2000-LT potente para
osciloscopio de dos canales, analizador de espectro, grabador de señales transitorias, generador de funciones y Bode plotter. Editor de ondas (signal wave
editor) incorporado y secuenciador automatizado por fichero o entrada PC.
Para utilizar el software en el modo de demostración no necesita el hardware.
Generador de funciones
Informaciones generales
Informaciones generales
Informaciones generalesInformaciones generales
•
puntos de referencia (marcadores) para
amplitud/tensión y frecuencia/tiempo
•
conexión en la entrada: CC, CA y GND
•
resolución 8 bits
•
es posible guardar la figura en la pantalla y
los datos
•
alimentación por puerto USB (500mA)
•
dimensiones : 205 x 55 x 175 mm
Analizador de espectro
Analizador de espectro
Analizador de espectroAnalizador de espectro
•
rango de frecuencia: 0 .. 120 Hz ~ 12 MHz
•
escala de tiempo lineal o logarítmica
•
principio de funcionamiento: FFT (Fast Fourier Transform)
•
resolución FFT: 2048 líneas
•
canal de entrada FFT: CH1 o CH2
•
función zoom
Grabador de señales transitorias
Grabador de señales transitorias
Grabador de señales transitoriasGrabador de señales transitorias
•
escala de tiempo: 20 ms/div ~ 2000 s/div
•
tiempo de grabación máx. : 9,4 h/pantalla
•
almacenamiento automático de datos
•
almacenamiento automático durante más de
un año
•
número máx. de muestreos: 100/s
•
número mín. de muestreos: 1 muestreo/20s
* Nota: para evitar cualquier bloqueo del software, no utilice un hub USB.
* Nota: para evitar cualquier bloqueo del software, no utilice un hub USB.
ESPECIFICACIONES BAJO RESERVA DE MODIFICACIONES - DLL disponible para desarrollos propios - www.velleman.eu
* Nota: para evitar cualquier bloqueo del software, no utilice un hub USB.* Nota: para evitar cualquier bloqueo del software, no utilice un hub USB.
Generador de funciones
Generador de funcionesGenerador de funciones
•
rango de frecuencia : senoidal de 0,005Hz ~
1MHz
•
señal triangular y cuadrada de 0,005Hz ~ 500kHz
•
extensa biblioteca con formas de ondas
•
amplitud: 100mVpp ~ 10Vpp @ 1kHz//600Ω/
impedancia de salida: 50Ω
Osciloscopio
Osciloscopio
OsciloscopioOsciloscopio
•
ancho de banda: 2 canales CC a 12MHz ± 3dB
•
impedancia de entrada: 1ΩM/30 pF
•
tensión de entrada máx.: 30V (CA + CC)
•
base de tiempo: 0,1µs ~ 500ms por división
•
rango de entrada: 10mV ~ 3V por división
•
lectura: TRMS, dBV, dBm, P2P, ciclo de trabajo,
frecuencia…
•
duración de la grabación: 4.000 muestreos/canal
•
frecuencia de muestreo para señales repetitivas:
250Hz ~ 25MHz
•
resumen y función de captura de imagen digital
Bode plotter
Bode plotter
Bode plotterBode plotter
•
sincronización automática entre el osciloscopio y el
generador
•
rango de frecuencia: 1kHz, 10kHz, 100kHz, 1MHz
•
frecuencia de arranque: 10Hz, 100Hz, 1kHz,10kHz
31
Page 32

Instalar el software
Instalar el software
Instalar el softwareInstalar el software
Instalar el Pc
Instalar el Pc----Lab2000LT
Instalar el PcInstalar el Pc
Exigencias mínimas del sistema
•
Windows™ 2000/XP/Vista (*)
•
tarjeta de vídeo VGA (1024x768 recomendado)
•
espacio libre disco duro 10 MB
•
ratón o similar
•
lector de CD o CD/DVD
•
puerto USB (1.1 ó 2.0)
Introduzca el CD en el reproductor.
Lab2000LT
Lab2000LTLab2000LT
Si el CD no inicia automáticamente, abra el directorio del CD y ejecute el fichero "SETUP.EXE
Seleccione "
El asistente de instalación le guiará en el procedimiento de instalación. Los atajos al software
Pc
Pc----Lab2000LT
Lab2000LT
PcPc
Lab2000LTLab2000LT
generan automáticamente.
(*) Nota:
(*) Nota: Entre en el sistema como administrador para completar el procedi-
(*) Nota:(*) Nota:
miento de instalación o contacte con su administrador de sistemas para más
informaciones. Véase también el fichero "ReadME" en la carpeta instalada.
* Microsoft Windows™ 2000/XP/VISTA (*) son marcas registradas.
Descargue la última versión en
Descargue la última versión en www.velleman.be
Descargue la última versión en Descargue la última versión en
Pc
Pc----Lab2000LT
Lab2000LT
PcPc
Lab2000LTLab2000LT
y los ficheros de ayuda se
SETUP.EXE"
SETUP.EXESETUP.EXE
".
www.velleman.be y siga el enlace "Descargas".
www.velleman.bewww.velleman.be
y siga el enlace "Descargas".
y siga el enlace "Descargas". y siga el enlace "Descargas".
32
Page 33

Instalar el hardware
Instalar el hardware
Instalar el hardwareInstalar el hardware
Instalar el hardware
Instalar el hardware
Instalar el hardware Instalar el hardware
Instalar el driver USB
Instalar el driver USB
Instalar el driver USBInstalar el driver USB
•
Conecte el PCSGU250 a un puerto USB libre.
•
Siga el procedimiento de instalación visualizado en la pantalla.
•
Si Windows® le propone actualizar su versión de Windows®, seleccione "Not at this
time".
•
Instale el driver y seleccione "D:\PCSGU250Driver
click en "Next".
•
Si Windows® indica "Has not passed Windows logo testing…. " haga click en
"Continue Anyway".
•
Después de haber instalado el driver, controle si el driver ha sido instalado de
manera correcta en el Device Manager.
•
Vuelva a iniciar el ordenador si fuera necesario.
Nota:
Nota: Een caso de problemas, quite el driver USB de la barra de tarreas e instale
Nota:Nota:
"D:\PCSGU250Driver\PCSGU250Driver_WinUSB" después de haber conectado
el hardware de nuevo.
Ejecutar el software
Ejecutar el software
Ejecutar el softwareEjecutar el software
Localizar el atajo "
Haga click en el icono para ejecutar el software. El mensaje "loading, please
wait" se visualiza. Después de que el software está cargado, el LED se ilumina.
El software visualia automáticamente el osciloscopio y el generador de funciones
(página siguiente). En caso de error (unidad no detectada), desconecte y vuelva a
conectar el cable USB, y vuelva a intentar. Para entrar en el modo de demonstración (uso sin hardware), haga click en "Options", "Hardware Setup" y luego en
"Demo Mode".
Nota:
Nota: ---- Es posible que las capturas de pantalla difierran de la réalidad.
Nota: Nota:
Es posible que las capturas de pantalla difierran de la réalidad.
Es posible que las capturas de pantalla difierran de la réalidad. Es posible que las capturas de pantalla difierran de la réalidad.
---- el osciloscopio se calíbrará automáticamente durante la primera puesta en marcha
Pc
Pc----Lab2000LT
PcPc
el osciloscopio se calíbrará automáticamente durante la primera puesta en marcha
el osciloscopio se calíbrará automáticamente durante la primera puesta en marchael osciloscopio se calíbrará automáticamente durante la primera puesta en marcha
(cierre todos los programas antes de continuar)
(cierre todos los programas antes de continuar)
(cierre todos los programas antes de continuar)(cierre todos los programas antes de continuar)
D:\PCSGU250Driver" en el directorio del CD. Haga
D:\PCSGU250DriverD:\PCSGU250Driver
Lab2000LT
Lab2000LTLab2000LT
".
33
Page 34

El generador de funciones
El generador de funciones
El generador de funcionesEl generador de funciones
El generador de funciones
El generador de funciones
El generador de funcionesEl generador de funciones
¿¿¿¿
Qué
Qué ????
QuéQué
Las ondas más comunes están
disponibles por un solo botón.
Es posible crear cualquier tipo
de onda con las funciones
especiales y el editor de ondas.
•
¿Cómo?
¿Cómo?
¿Cómo?¿Cómo?
•
Haga click en la forme de onda deseada (1111).
•
Seleccione el rango de frecuencia (2222).
•
Determine la frecuencia con el conmutador deslizante (3333) o haga click en el
campo de la frecuecia (4444) e introduzca la frecuencia.
•
Ajuste el offset (5555).
•
Ajuste la amplitud (6666).
(introduzca los valores al hacer click en el campo "Offset" y "Amplitude")
•
El diagrama (7777) visualiza una simulación de la onda.
Más funciones "More Funct."
Más funciones "More Funct."
Más funciones "More Funct."Más funciones "More Funct."
El botón "More Funct." no sólo le da acceso a las ondas
especiales (ondas arbitrarias, exploraciones de frecuencia, CC) sino también al directorio de formas de onda.
Nota: El botón "Probe Test" (8888) permite al generado producir una
señal de salida para calibrar la sonda del oscilloscopio en X10.
8888
34
4444
3333
2222
7777
6666
5555
1111
Page 35

El osciloscopio
El osciloscopio
El osciloscopioEl osciloscopio
El osciloscopio :
El osciloscopio :
El osciloscopio :El osciloscopio :
8888
¿Qué?
¿Qué?
¿Qué?¿Qué?
Es un osciloscopio digital
de almacenamiento completo
y fácil de utilizar.
¿Cómo?
¿Cómo?
¿Cómo?¿Cómo?
•
Conecte el circuito que quiere probar a la entrada del osciloscopio (¡No sobrepase el valor de entrada máx. del osciloscopio!) o la salida del generador.
•
Mida con "Trigger Off" (6666).
•
Haga click en el canal y volts/div, o haga click en "Autoset" (2222).
•
Seleccione temps/div (8888).
Disparo:
Disparo:
Disparo:Disparo:
•
Seleccione el canal de disparo (5555).
•
Seleccione el flanco de disparo (4444).
•
Haga click en "Trigger On" (6666).
•
Ajuste el nivel con el conmutador deslizante (3333). El nivel se visualiza
en la parte izquierda del diagrama (1111).
1111
2222
3333
6666
5555 4444
7777
35
Page 36

El analizador de espectro
El analizador de espectro
El analizador de espectroEl analizador de espectro
El analizador de espectro
El analizador de espectro
El analizador de espectroEl analizador de espectro
¿Qué?
¿Qué?
¿Qué?¿Qué?
Permite visualizar el espectro
de frecuencia de una señal
con un análisis FFT (Fast
Fourier Transform).
How
How ? :
? :
HowHow
? : ? :
¿Cómo?
¿Cómo?
¿Cómo?¿Cómo?
•
Conecte la entrada del osciloscopio al circuito que quiere probar (no sobrepase los valores máx. de entrada del osciloscopio) o utilice la salida del generador interno.
•
Analice la señal en la pantalla del osciloscopio (véase la página anterior).
•
Asegúrese de que la señal no sobrepase el valor máx. de la panatlla.
•
Inicie el analizador de espectro.
•
Pulse "Run" (1111).
•
Seleccione el rango de frecuencia adecuado para que se visualicen todos los
cambios en la pantalla (3333).
•
Seleccione el canal y volts/div si fuera necesario (2222).
2
3
1
36
Page 37

El grabador de señales transitorias
El grabador de señales transitorias
El grabador de señales transitoriasEl grabador de señales transitorias
El grabador de señales transistorias
El grabador de señales transistorias
El grabador de señales transistoriasEl grabador de señales transistorias
¿Qué?
¿Qué?
¿Qué?¿Qué?
Grabe automáticamente eventos
ocasionales y modificaciones
lentas, p.ej. el ciclo de carga de
una batería, la evolución de la
temperatura, etc. o busque los
errores cíclicos en un circuito electrónico. Los datos se guardan
automáticamente en la memoria.
¡El Pc-Lab2000LT le permite grabar los datos durante 1 año!
¿Cómo?
¿Cómo?
¿Cómo?¿Cómo?
•
Conecte la entrada al circuito que quiere probar (o utilice un generador interno a baja frecuencia).
•
Seleccione el canal y volts/div (o el rango de tensión) adecuados (1111).
•
Seleccione tiempo/división (3333).
•
Pulse "Run" (2222) para grabar.
Vuelva a pulsar "Run" para interrumpir la grabación o pulse "Single" para
efectuar una medición de pantalla sencilla.
Seleccione "AutoSave Data" en el menú "File" para grabar en el modo continuo
con almacenamiento automático en disco duro.
Nota:
Nota:
Nota:Nota:
Durante la grabación, es posible que las pantallas defieran de la medición
actual
La interacción entre los dos muestreos no se medirá si el valor temps/div selec-
cionado es demasiado bajo.
1111
3333
2222
37
Page 38

El Bode plotter
El Bode plotter
El Bode plotterEl Bode plotter
El Bode Plotter
El Bode Plotter
El Bode PlotterEl Bode Plotter
¿Qué?
¿Qué?
¿Qué?¿Qué?
Es posible medir el nivel de
amplificación o de filtrado
gracias al Bode Plotter incorporado.
¿Cómo?
¿Cómo?
¿Cómo?¿Cómo?
•
•
•
•
•
•
•
Abra la pantalla "Circuit Analyser" (1111).
Conecte la entrada del canal CH1 del osciloscopio a la salida del circuito
que quiere probar.
Conecte la salida del generador a la entrada del circuito.
Ajuste la saldia del generador (2222) a un nivel adecuado.
Ajuste el Bode Plotter en un nivel de "V Range" (3333), "Vertical Scale", "Frequency
Range" y "Frequency Start" (4444)…
Pulse "Start" (5555) y no sobrepase los valores de la pantalla de medición (6666).
Ajuste el valor bajo "V Range" o el nivel de salida del generador si la señal
está fuera del rango de la pantalla.
4
1
6
3 5
2
38
Page 39

Informaciones adicionales
Informaciones adicionales
Informaciones adicionales Informaciones adicionales
Abra la pantalla "Wave Sequence" bajo "Tools" para
crear formas de onda automizadas.
Abra el editor "Wave Editor" bajo "Tools"
para generar su propia forma de onda. En
este ejemplo: nivel 10: 5 veces, nivel 50:
20 veces...
Pare el osciloscopio. Haga clic en "History" para abrir un
menú. Guarde y abra el fichero con el resumen, y
muévase con la rueda del ratón. Active el osciloscopio al
hacer click en "Run".
Abra la pantalla "Waveform Parameters"
para visualizar los parámetros de la forma
de onda.
Informaciones adicionales
Informaciones adicionales
Informaciones adicionalesInformaciones adicionales
(véase los ficheros deayudas)
(véase los ficheros deayudas)
(véase los ficheros deayudas)(véase los ficheros deayudas)
Es posible añadir un
texto y parámetros
en el diagrama.
Haga click en el
diagrama con el
botón derecho del
ratón para abrir
una pantalla con
texto.
39
Page 40

 Loading...