

Page 1
Nacelle-mounted lidar:
New advances in Power Performance Testing,
optimization, and financial outcomes in wind energy
Page 2

As wind energy continues to evolve, so do the financial stakes in
maximizing power output and profit.
Today, even a minor difference between estimated
and actual energy output creates substantial
financial impacts. While developers and operators
expect to get the energy output promised by
manufacturers, they can’t know if they are
succeeding without accurate Power Performance
Testing (PPT) data. They are also unable to identify
and take corrective actions that can extend the life
of the turbine and reduce annualized cost of energy.
Enter nacelle-mounted lidar. With its exceptional
accuracy and range, economical design and small
footprint, nacelle-mounted lidar is one of the most
reliable and affordable ways to assess a turbine and
enable IEC-compliant PPT. Recent advances in the
lidar itself and the software that interprets its data
are revolutionizing wind farm operations.
This eBook explains how nacelle-mounted lidar
works, how it is changing PPT, and why it is such
a powerful solution for today’s ever-growing wind
turbines and farms.
$500,000
Revenue loss from a 1% decrease in annual production (100 two-megawatt turbines)1.
© Vaisala 2021
Page 3

Contents
How does nacelle-mounted lidar work? 4
Power Performance Testing in detail 6
Leosphere, a Vaisala company's, Windcube suite 10
Case study: Offshore PPT 12
Further applications for nacelle-mounted lidar 13
© Vaisala 2021
Page 4
How does nacelle-mounted lidar work?
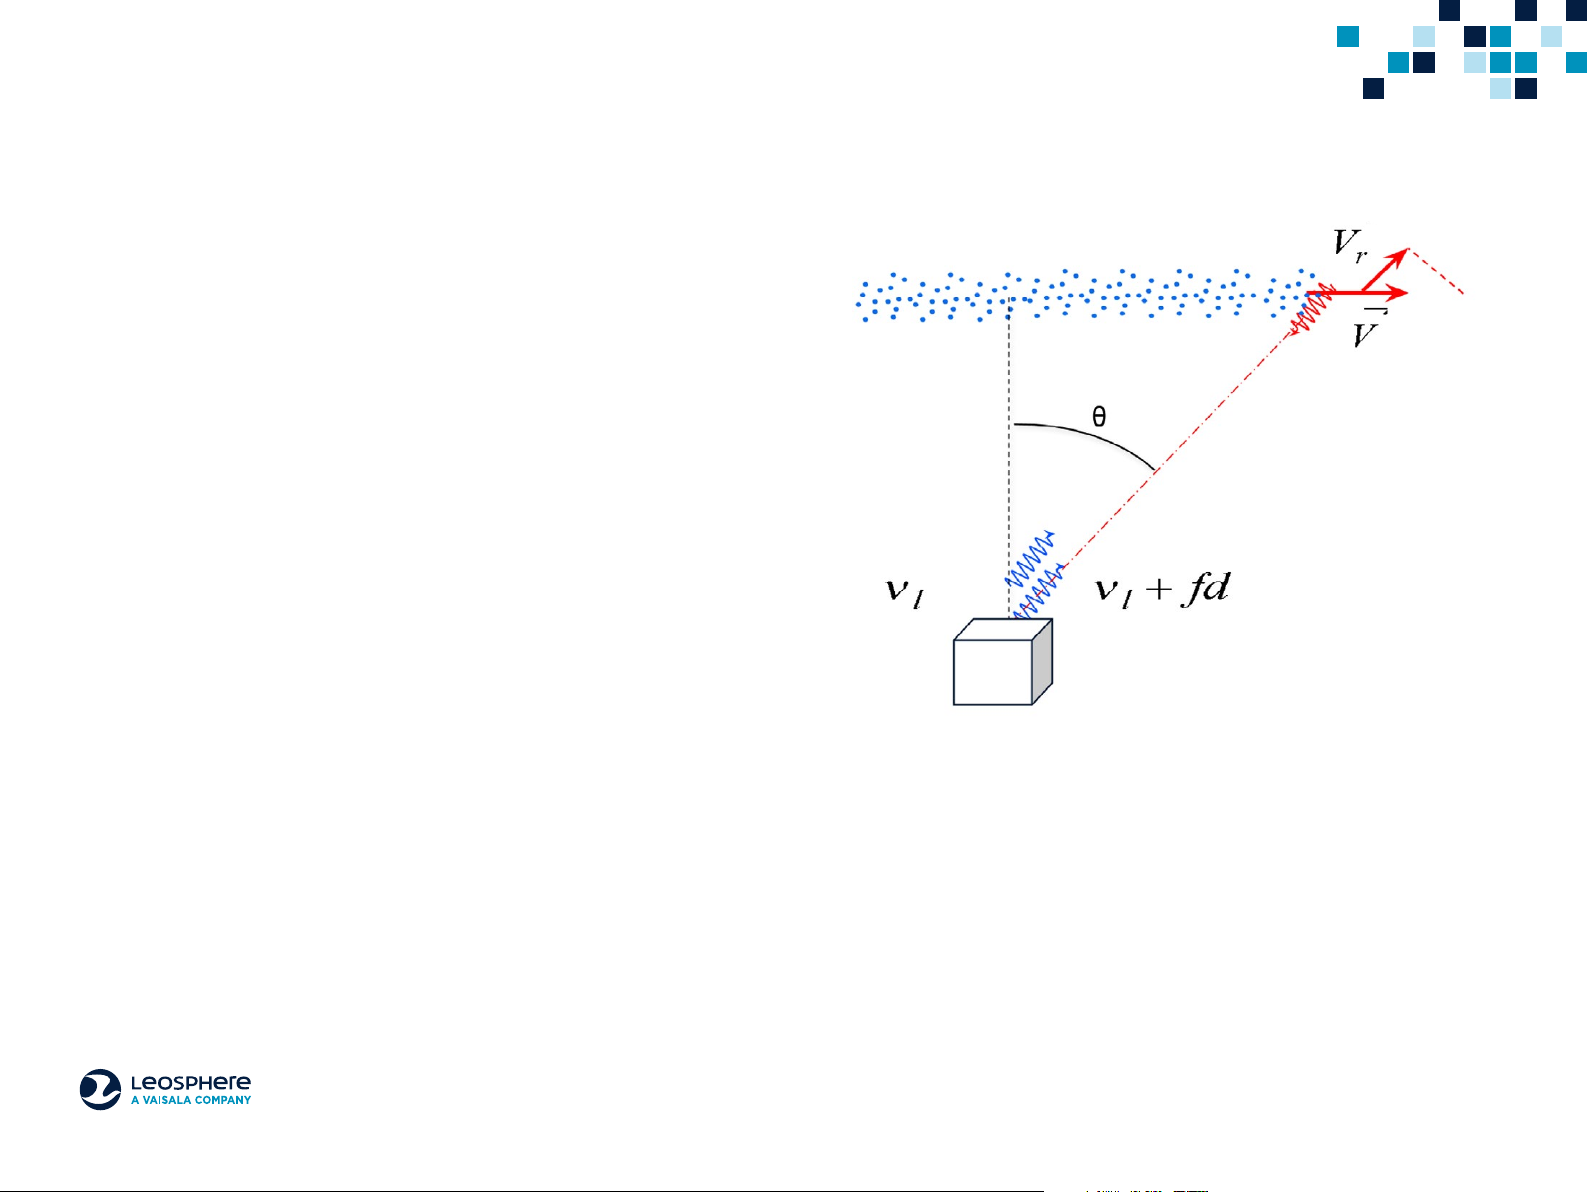
Wind speed measurement and the Doppler effect
Lidar emits light pulses at a very high frequency, and these light pulses are
reflected back by aerosols in the atmosphere. The Doppler effect allows the
lidar to accurately compute the speed of those particles — and, thus, the speed
of the wind carrying them through the atmosphere. Today, wind lidar is used for
a wide range of applications in wind energy, aviation, and meteorology.
Notably, WindCube© Nacelle operates on a pulsed lidar principle, which provides
several important advantages over other lidar types. Pulsed lidar maintains
constant accuracy over the entire measurement range, and it offers the highest
accuracy, data availability, and sample rates regardless of weather conditions.
Nacelle-mounted lidar has evolved substantially in recent years. For example, earlier generations of WindCube Nacelle (formerly called Wind Iris) measured up to 450
meters at 10 measurement distances. This was extremely useful, but today’s version covers a measurement range from 50 to 700 meters at 20 separate distances,
dramatically increasing PPT quality and making it suitable for even the largest turbines likely to be deployed now or in the future.
WindCube Nacelle measures from 50 to 700 meters at 20 separate distances, dramatically increasing PPT
quality and making it suitable for even the largest turbines likely to be deployed now or in the future.
© Vaisala 2021
Page 5

The best technology for the job
Once a wind turbine is deployed, its operators
depend on its performance to match manufacturer
expectations. Underperformance can be extremely
costly — and without good wind data, it can go
unobserved for months or years.
Back when turbines were smaller, this was less of
a problem. But now that the scale of wind turbines
has increased so much, so has the scale of the
financial losses when they aren’t operating at
maximum capacity. Even slight underperformances
are no longer acceptable.
Traditionally, the way to assess power performance
was to use a met mast. But because of their costs
and logistical challenges, many wind operators
simply skipped using them. One reason why is
that you need to have both the met mast and the
turbine aligned with the wind direction — meaning
that frequent changes in wind direction can
invalidate the measurements. Another is that the
costs and logistical constraints are often too high for
such a short measurement period. Nacelle-mounted
anemometers are cheaper to use, but they are not
accurate enough for reliable PPT.
Nacelle-mounted lidar, on the other hand, is
much quicker and easier to deploy, and it collects
data much faster. It is always aligned with the
wind turbine because it moves with it, and it is
typically half the cost (or less) of using a met mast,
particularly for taller and offshore wind turbines.
Lidar also uses multiple laser beams to cover the
whole rotor area, creating more representative
wind data that accounts for shear values and
other influences acting in three dimensions. (This
data, while not mandatory, can now be included
in PPT for improved accuracy and higher certainty
following IEC rules.)
Expert groups from IEC and independent consultants
are also preparing guidelines for using nacellemounted lidar in complex terrain for the next
revision of IEC standards.
The bottom line is that nacelle-mounted lidar
is here to stay. It is the best solution for PPT —
both onshore and offshore — and its continual
improvements are making wind farms more
profitable, reliable, and efficient.
© Vaisala 2021
Page 6

Power Performance Testing in detail
PPT is the most critical application for nacelle lidar,
since it provides operators and other stakeholders
the power curve data they need to verify the
performance of a wind farm project. Enormous
financial resources are at stake in any PPT project.
Critical factors in PPT include:
•
Ability to accurately verify turbine
power performance
•
Comparison of actual power curves with
warranted power curves
•
Reduced logistics for setting-up and operating
the measurement system
•
Optimized OPEX
•
Rapid data completion
•
Presentation and analysis of power curve data in
an IEC-compliant format
•
Ensuring measurement traceability
© Vaisala 2021
Page 7

Power Performance Testing planning and key steps
Four steps to success
A correctly managed PPT campaign is broken down into four stages.
2. Verification
Check the quality of the
in the campaign
3. Operation
Install, operate, and
monitor throughout the
campaign duration
1. Design
Plan the campaign as much as
possible in advance
system for every device used
4. Analysis
Extract data and act on it
Step 1: Design
The first decision in campaign planning is choosing which turbine(s) to measure. Operators can typically help minimize the length of the PPT campaign by selecting the
one with the biggest opening sector.
Process
•
Decide on the needed applications: contractual or operational PPT, checking
production increases after turbine upgrades, yaw alignment and nacelle-transfer
function verification, research and turbine prototyping. (One data set can be
used for multiple applications.)
•
Select the wind turbine to test: Maximize open sector following various rules
•
Anticipate installation steps including OEM authorizations and network access
•
Key documents:
◦
IEC - 61400-12-1
◦
IEC - 61400-50-3 – CDV (available as draft, and expected to be released
from mid 2021)
◦
Lidar manufacturer installation and safety guidelines
◦
Various precursor project report – EUDP procedure (established by DTU,
Orsted, Siemens-Gamesa and Leosphere)
© Vaisala 2021
Page 8
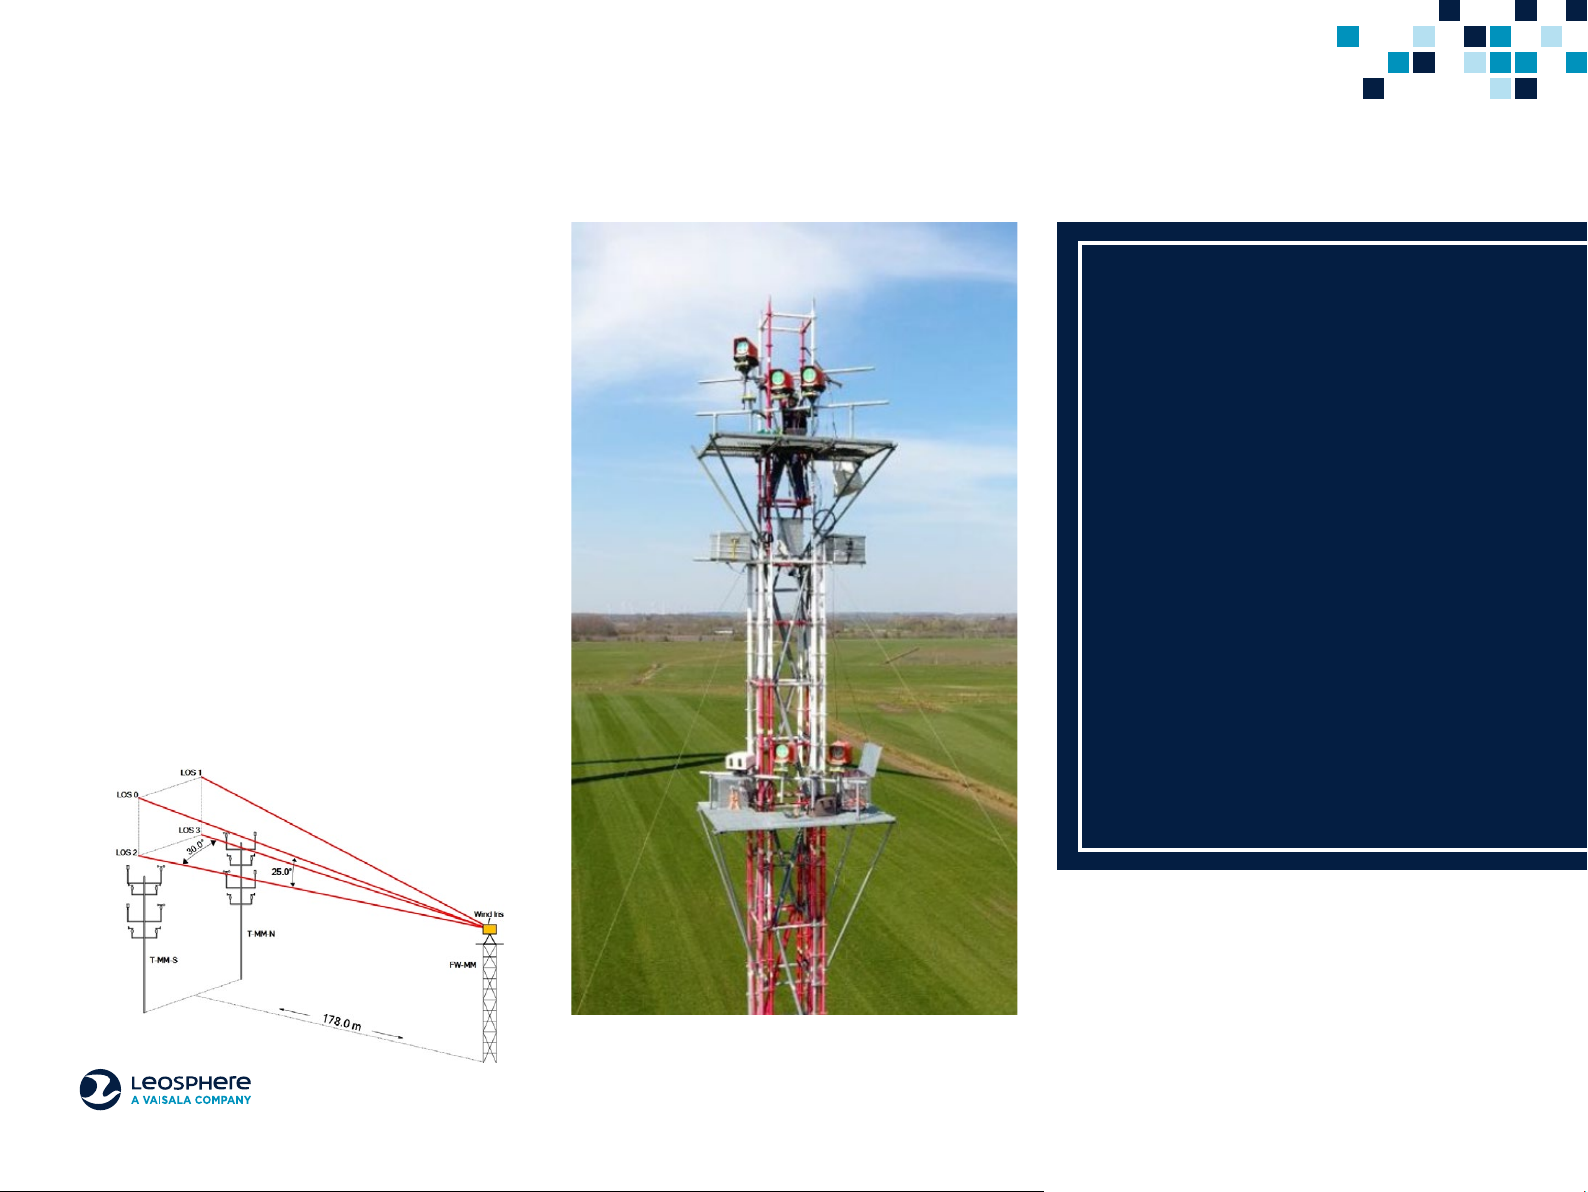
Step 2: Verification and calibration
Verification ensures performance of the lidar.
Much of the verification process can be done in
parallel with design, and usually takes about two
months at a certification site.
Process
Leosphere
certification and
verification standards
•
Verification at Leosphere: Leosphere calibrates
lidar units throughout the manufacturing process,
then verifies it against a calibrated lidar of the
same type.
•
Third-party calibration: This is a contractual
step for PPT, conducted at an independent test
site. The analyst uses this data to calculate the
uncertainty on the power curve. Key documents
for the verification process:
◦
EUDP and UniTTe reports
◦
IEC: IEC 61400-50-3 – CDV (expected
to be published in 2021)
Leosphere products meet the latest
and most rigorous international
verification standards, including
ISO9001. All WindCube products
are compliant to the latest IEC
standards (when applicable), and
they are recognized and verified by
the world’s leading independent
certifying bodies, including DNV
GL, DTU Wind Energy, UL, and
Deutsche WindGuard.
DNV GL calibration site in Germany
© Vaisala 2021
Page 9

Step 3: Operation
Operation is a busy and important phase.
It requires training, foresight, and effective
project management.
Process
•
Installation: Training is provided. Documentation
includes checklist and health/safety precautions.
Complete alignment on nacelle roof.
•
Time synchronization: Use either NTP or GPS.
All sensors should be synchronized, or the offset
should be reported.
•
Monitoring: Conduct daily or weekly checks on
all related equipment and sensors along with any
automatic alerts.
•
Data collection: Choose automatic, FTP, or
manual. Regularly check if data set is completed
(see step 4).
Measured wind speeds
Step 4: Analysis
After a few weeks of operation, there will be
enough information in the dataset to extract and
analyze. This can overlap the monitoring phase.
•
Synchronization: This is a crucial, sometimes
difficult, step in preparing for data extraction.
(WindCube Insights—Analytics includes a
simple-to-use synchronization function).
•
Filtering: Isolate a time period when everything
was working nominally and proper data was
being returned.
•
Data completion: The IEC provides guidance that
will help you determine whether your dataset is
complete. Key indicators include:
◦
180h of valid measurement
◦
At least three measurements per bin
(0.5m/s)
◦
Range of wind speed according to turbine
nominal power
•
Complete analyses according to IEC procedures.
◦
PC, Cp, AEP
◦
And associated uncertainty
◦
Terrain assessment
◦
Obstacles & topo
Power curve
© Vaisala 2021
Page 10
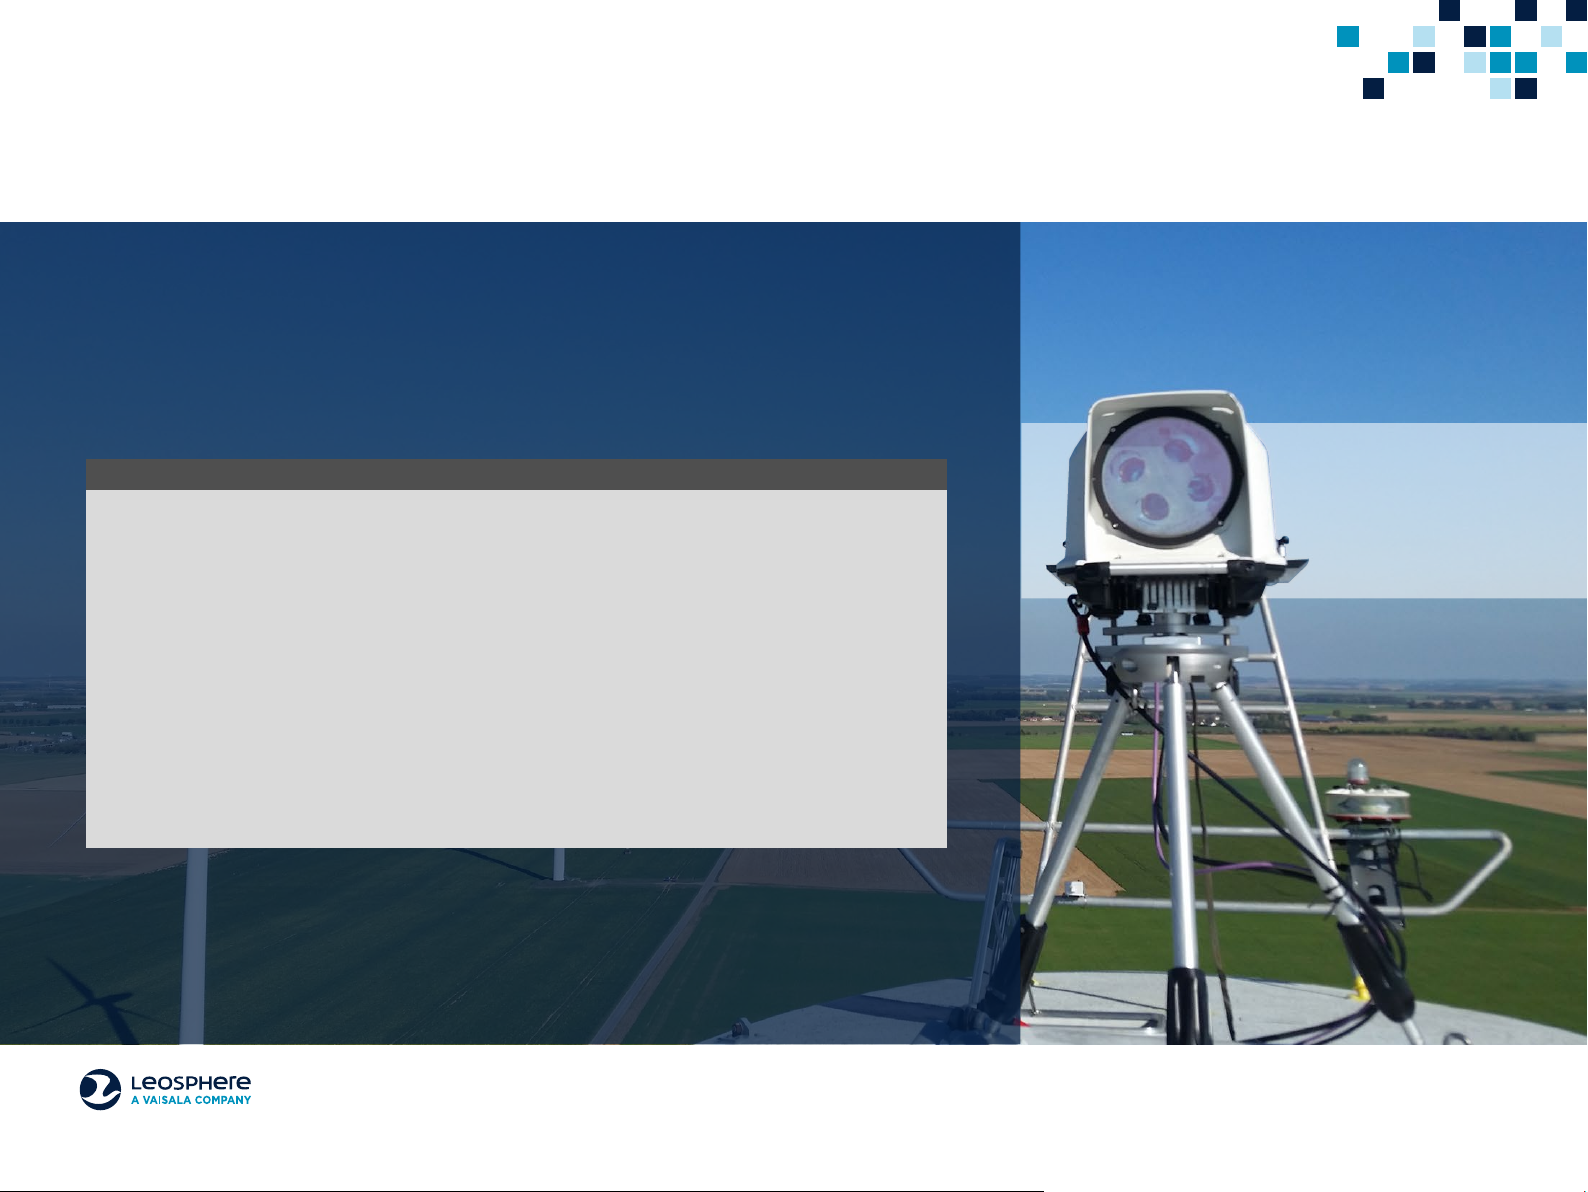
WindCube Nacelle:
The industry's most trusted and deployed nacelle-mounted lidar
WindCube Nacelle is one of the most accepted and widely deployed nacelle-mounted lidar systems in
the world.
It is the only long range nacelle-mounted lidar that enables PPT on any wind turbine — onshore or
offshore. Its accuracy and versatility have made Leosphere a contributing expert to industry guidelines
and standards for PPT.
Key benefits
Enables quick, accurate, compliant PPT
Rapid data completion with continuous wind direction alignment
Reliable contractual and operational PPT
Based on industry best practices and upcoming IEC standards
Accurate data from 50 to 700 meters
Captures wind data simultaneously at 20 measurement distances
Extremely high correlation with IEC met mast measurements
Gives wind industry stakeholders the reliable data needed to make better decisions
WindCube Nacelle
also provides a wide
range of supporting
data, including shear,
veer, turbulence, and is
ready for REWS (Rotor
Equivalent Wind Speed)
Universal compatibility and ease of use
Compatible with all current and future turbine types
Simple installation and system integration and configuration
Outstanding reliability under even the most demanding conditions
Permits a 3-year warranty period and limited maintenance
© Vaisala 2021
Page 11
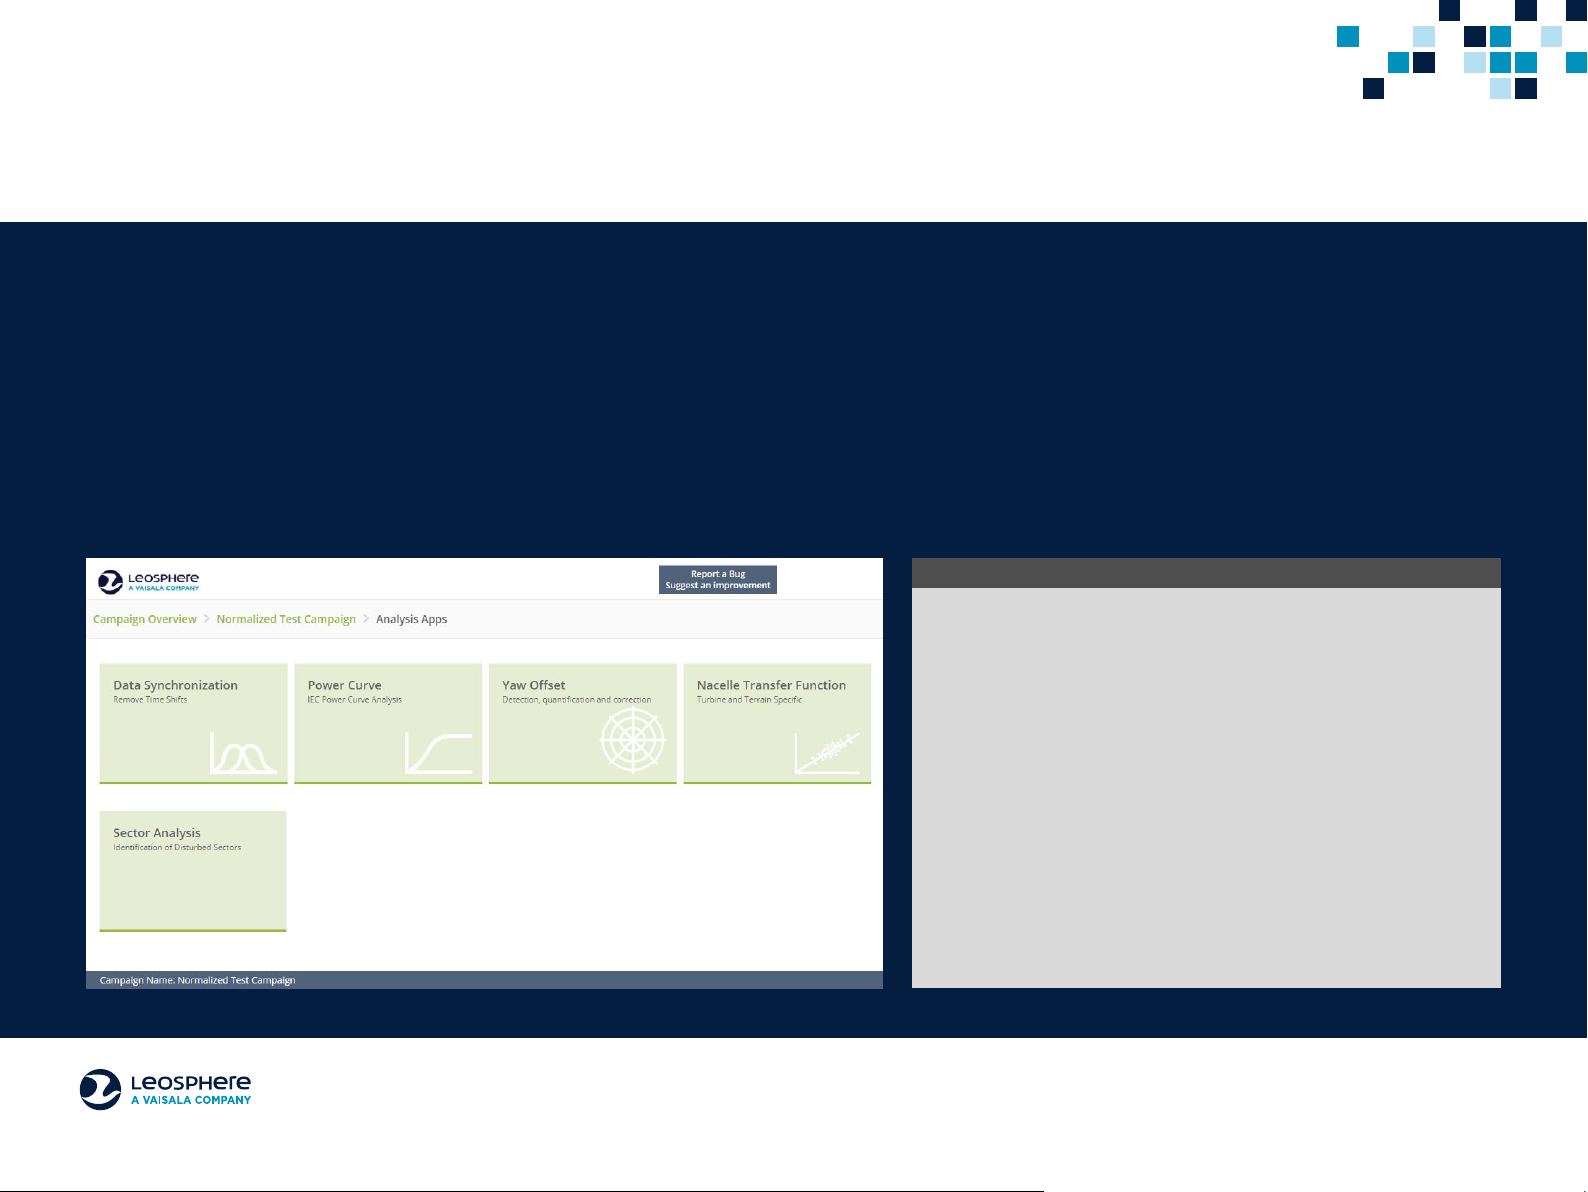
WindCube Insights — Analytics:
Revolutionary software enabling IEC-compliant PPT
No other lidar provider offers a solution like it.
WindCube Insights — Analytics software completes the PPT process by analyzing, interpreting, and displaying the data obtained from WindCube Nacelle.
Operators can perform quick, simple, and transparent PPT with IEC-compliant filtering, AEP calculation, and uncertainties reporting. Simplifying data handling activities
frees users to focus on the most essential performance analysis and optimization work.
Since PPT is a very strict process, this tool provides transparent validations and even lists which IEC standards are relevant while in use. It allows for the upload
of WindCube Nacelle and SCADA data with a simplified data synchronization process, and provides a variety of standardized lidar and turbine data filters that are
available and fully configurable to prepare the data set.
Key benefits
Easy-to-use, fully compliant, affordable PPT analytics
Eliminates time-consuming and expensive processes developed
in-house
Provides powerful performance calculations and data integrations
Adheres to accepted industry best practices
Backed by rigorous, transparent validations
Proactively displays which IEC paragraph/standard it is referring to
while in use
Improved data visibility and value for the whole wind farm
Gives users outstanding awareness of their systems
Simple interface, efficient analyses, and easy report table exporting
Enables data-driven decision-making and better-functioning
wind farms
© Vaisala 2021
Page 12
Case study: Offshore PPT
Siemens Gamesa Renewable Energy
Siemens Gamesa Renewable Energy, one of
the world's largest wind turbine manufacturers,
provides offshore and onshore wind services and is
well-known as a renewable energy industry leader.
The company has been using nacelle-mounted lidar
in place of met masts for several years because
many of the limitations of using met masts are
compounded offshore. Met masts offshore are
prohibitively expensive and, between permitting
and the building process itself, can take years
to implement.
Siemens Gamesa has adopted nacelle-mounted lidar
in offshore applications for several primary reasons:
•
Reduced cost
•
Wider measurement sector in most cases
•
Faster power curve calculations due to the wider
measurement sector
•
Ability to collect both short-range (inside
the induction zone) and long-range
data simultaneously
•
WindCube Nacelle measures up to 700m to cover
their largest offshore wind turbines
As an early adopter of nacelle-mounted lidar
for offshore applications, Siemens Gamesa is
leading its field and routinely proving the value of
WindCube Nacelle.
© Vaisala 2021
Page 13
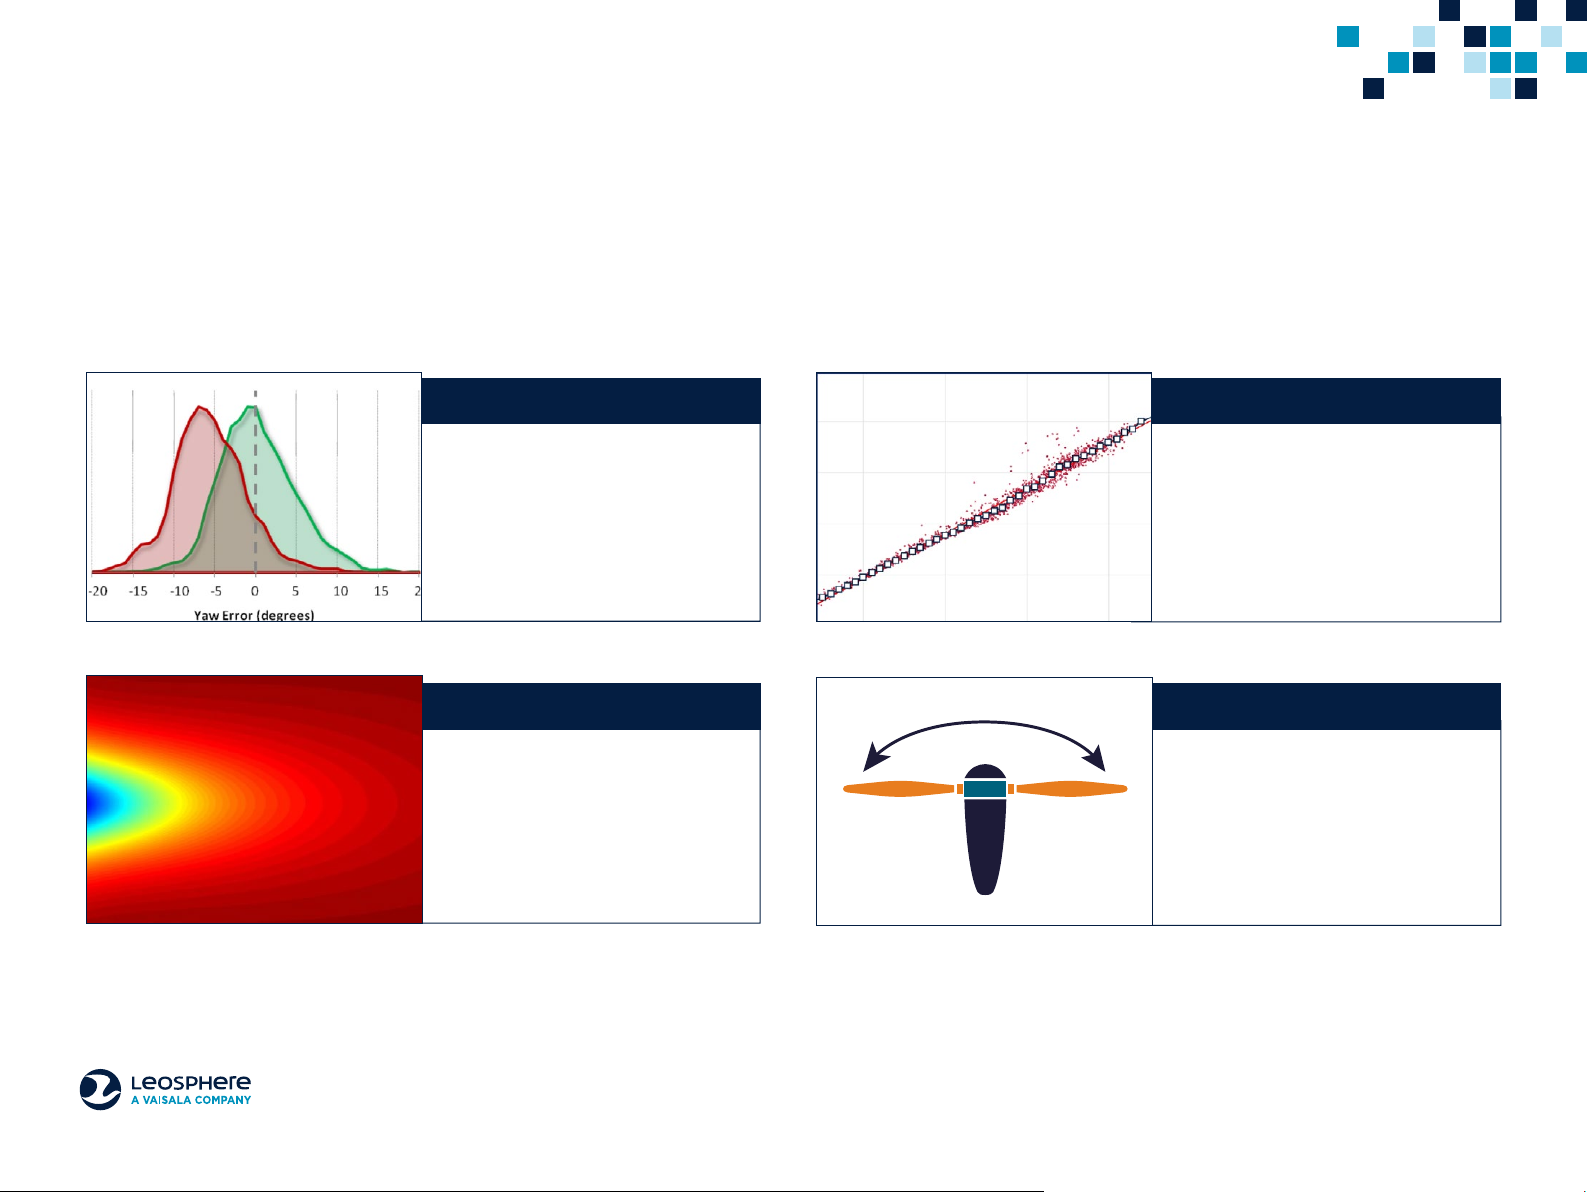
Further applications for nacelle-mounted lidar
Although nacelle-mounted lidar’s primary purpose is PPT, it is a multi-use tool that creates impressive efficiencies and cost savings throughout a wind farm’s lifespan.
Any of these secondary applications can be compelling enough on their own to deploy nacelle-mounted lidar. They include:
Turbine yaw misalignment
Nacelle-mounted lidar allows
operators to identify and correct any
misalignment between the turbine
and wind direction — maximizing
performance and reducing structural
loads. Nacelle-mounted lidar is the
only proven technology for this cost-
saving assessment.
Research Project
Many agencies and companies rely
on highly detailed wind field data for
studies and product development.
Nacelle-mounted lidar can provide
previously unavailable detail and
precision, leading to accelerated
innovation and new insights.
Nacelle transfer function
Nacelle transfer function, which
describes how the turbine and nacelle
structures influence wind speed, is
an important assessment to improve
turbine performance monitoring.
Nacelle-mounted lidar assesses this
accurately even after a wind campaign
is complete.
Lidar assisted control
Lidar-assisted control (LAC) allows for anticipatory
adjustments to blade and turbine alignment to
better handle incoming weather or storms. LAC can
substantially reduce turbine cost, reduce loads on
the turbine and nacelle, improve longevity, and
reduce risk. It can also increase energy capture and
lower the levelized cost of energy (LCOE). WindCube
Nacelle for Turbine Control is the ideal, custom-
made solution for this purpose. Learn more about it
at windcubelidar.com.
© Vaisala 2021
Page 14

Why Leosphere, a Vaisala company?
We are modern innovators, scientists, and discoverers who enable our customers to harness the power of wind energy in new ways. We are driven by passion,
relentless curiosity, and the desire to create a better world, as evidenced in our commitment to four guiding principles:
Trustworthy, superior metrology
Our solutions are backed by the best science and metrology, and
validated by the most demanding testing and certifications in the
industry. Our contributions make wind energy smarter.
Unrivaled thought leadership
Our years of experience, impressive global client roster, and
plethora of industry breakthroughs demonstrate that we are the
iconic gold standard in wind energy.
As a result, Leosphere, a Vaisala company, is the iconic and trusted gold standard in wind lidar. Our turnkey WindCube product suite offers innovative, reliable, and
highly accurate solutions for thousands of customers across the globe. All of this has enabled us to be catalysts for change and ambassadors for wind energy, always
advancing the field and those we serve.
Our innovation story, like the wind energy story, continues.
Innovative lidars from a one-stop shop
Customers know we have the right suite of solutions for their
needs in wind energy — taking them ever higher by adding value
at each step of the project lifecycle.
Easy, reliable global solution
We make our clients’ lives easier. Our easy to use, turnkey
WindCube product suite enables customers to harness the power
of wind energy efficiently and affordably.
windcubelidar.com
Ref. B211919EN-C ©Vaisala 2021
This material is subject to copyright protection, with all copyrights retained by Vaisala and its individual
partners. All rights reserved. Any logos and/or product names are trademarks of Vaisala or its individual
partners. The reproduction, transfer, distribution or storage of information contained in this ebook in any
form without the prior written consent of Vaisala is strictly prohibited. All specifications — technical included
— are subject to change without notice.
 Loading...