

Page 1
www.vaisala.com
Graphical Web Interface for Radar Data
Vaisala IRIS Webview
Features/Benefits
View radar and surface data
▪
within a web browser
Allows time selection and
▪
animation of all radar and
surface data
Interrogate radar data products
▪
using cursor tools
Display regional radar
▪
composites or multiple
single station radar sites
simultaneously
Adjustable data layers opacity
▪
Ability to display every radar
▪
product generated by
IRIS, example PPI, CAPPI,
TOPS, WARN, TRACK, VVP,
RAINN, etc.
Automatically updates when
▪
new data arrives or search data
archives
Geographical data layers
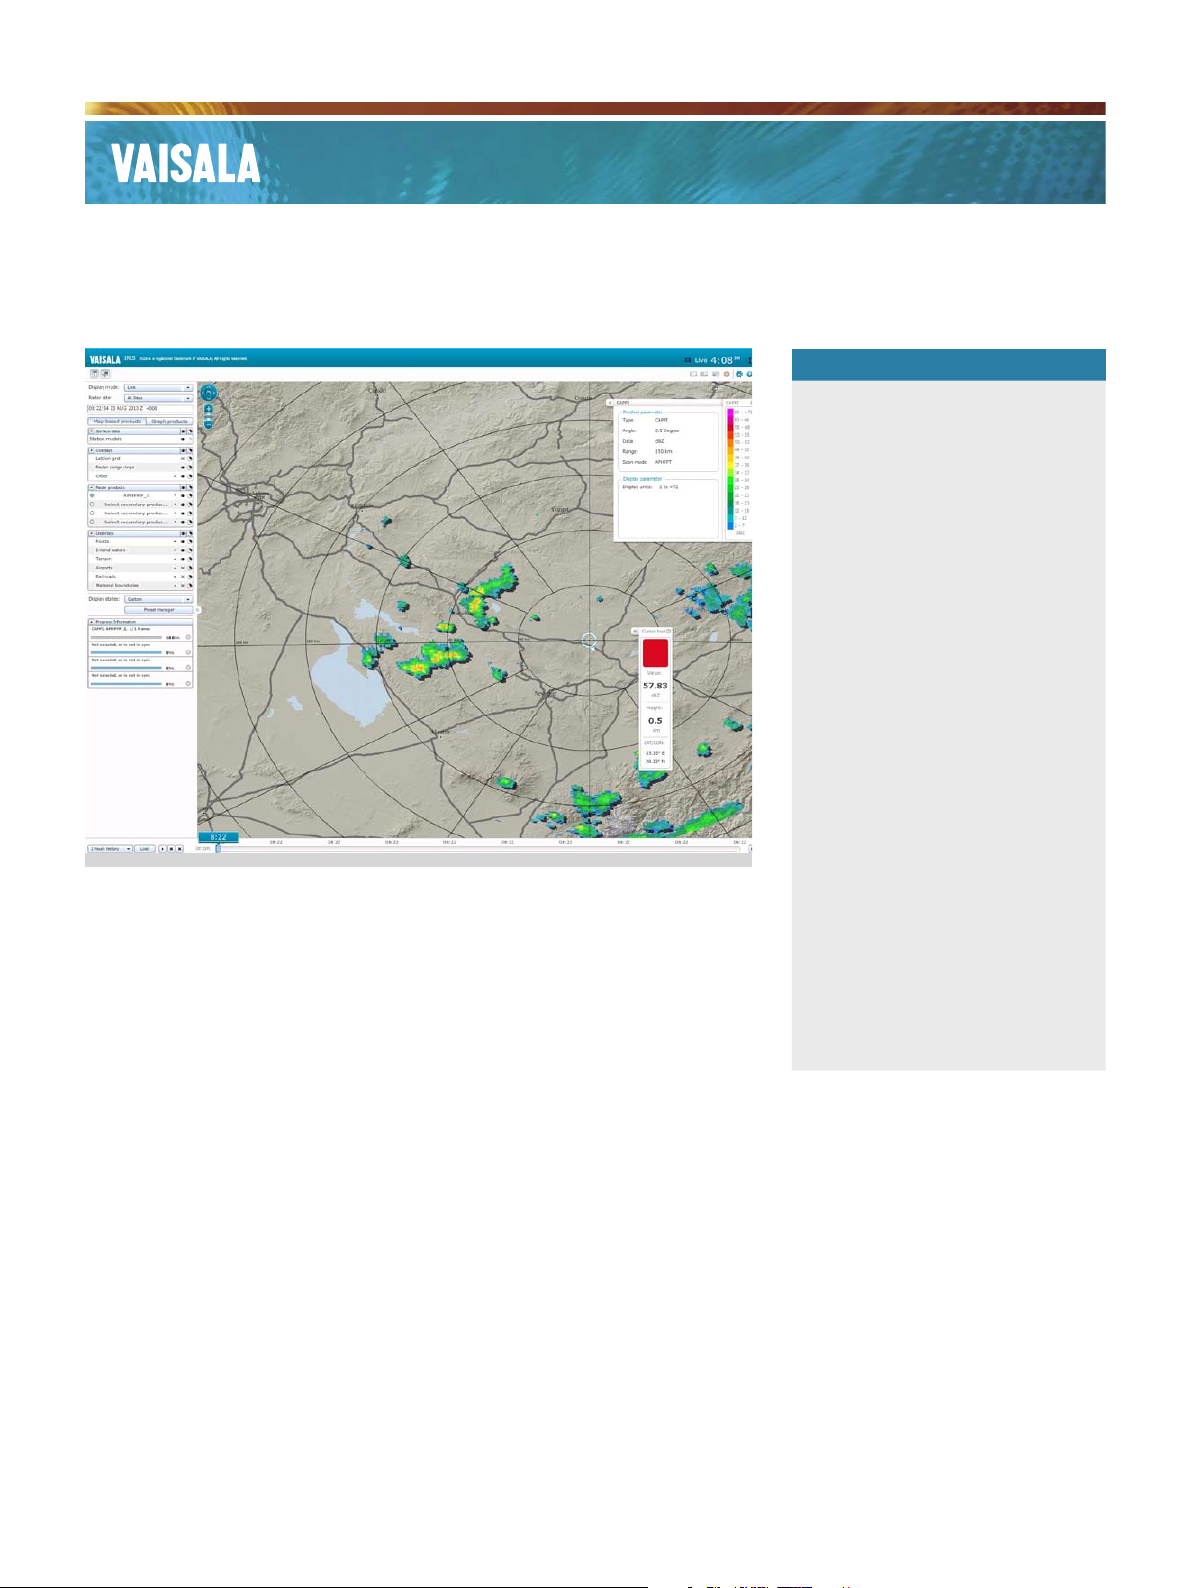
Vaisala’s IRIS Webview software is a web browser application for
viewing and interacting with weather radar and surface station data.
These data are overlaid with informative geographical references
giving user’s situational awareness of the atmospheric conditions.
The application retrieves data from meteorological and geographical
database servers which are configurable by system administrators.
This product is ideal in conveying information from a weather radar
network over an intranet, or even public internet.
▪
Ability to configure types of
▪
data available to the clients
and optionally require user
authentication
Webserver supports up to
▪
500 simultaneous clients
Own Your Data
A weather radar network is a large
investment for any organization. The
data from such an investment should
be easily disseminated at the owner’s
discretion within the organization,
to outside customers, or even the
general public at large. Vaisala’s IRIS
Webview satises the need to easily
make the radar data available to
points beyond the traditional scope
of meteorological agency or airport
authority.
IRIS Webview is an optionally
installed module to the IRIS radar
application. It allows the sharing of
radar and surface data to any person
with a web browser and network
connection. Up to 500 simultaneous
client connections are supported to
a single server. The data gathered by
expensive instruments is truly your
data – own it.
Comprehensive and
User-Friendly
The IRIS Webview browser interface
was designed for both novice and
expert users. Throughout the
design process usability consultants
were employed to evaluate the
interface. Test subjects with varied
backgrounds provided invaluable
insight into their thought process
while using draft versions. This
feedback has lead to a comprehensive
yet user-friendly experience with the
application.
IRIS Webview allows users to select
data from individual radars or
regional composites. The most recent
data may be displayed or the web
server archives may be browsed for
historical information. Animations of
the data may be viewed for up to a 24
Page 2
hour time period. Tools built into the client allow a user to
interact and interrogate the radar data. For instance if the
rain rate at a particular location is needed, the cursor tool
may be used to show the value at the point of interest. It
will also show the latitude, longitude, and distance to other
locations.
Surface weather data may be integrated into the
application. Surface data in METAR or SYNOP formats
are ingested into the web server. Then this data can
be requested by the browser clients. The clients will
show this data using a traditional station model for
meteorological displays. When animating, the surface
weather data will also change in synchronization with the
radar data.
Technical data
Display Requirements
Network connection
Supported browsers -
Microsoft Internet Explorer version 8.0 or later),
Mozilla Firefox (version 3.5.11 or later),
Chrome (version 5.0 or later),
Opera (version 10.61 or later),
Safari
Windows XP/Vista/7, Linux, Mac
Adobe Flash Player plug-in (version 9.0 or later)
Display resolution 1024 x 768 or greater
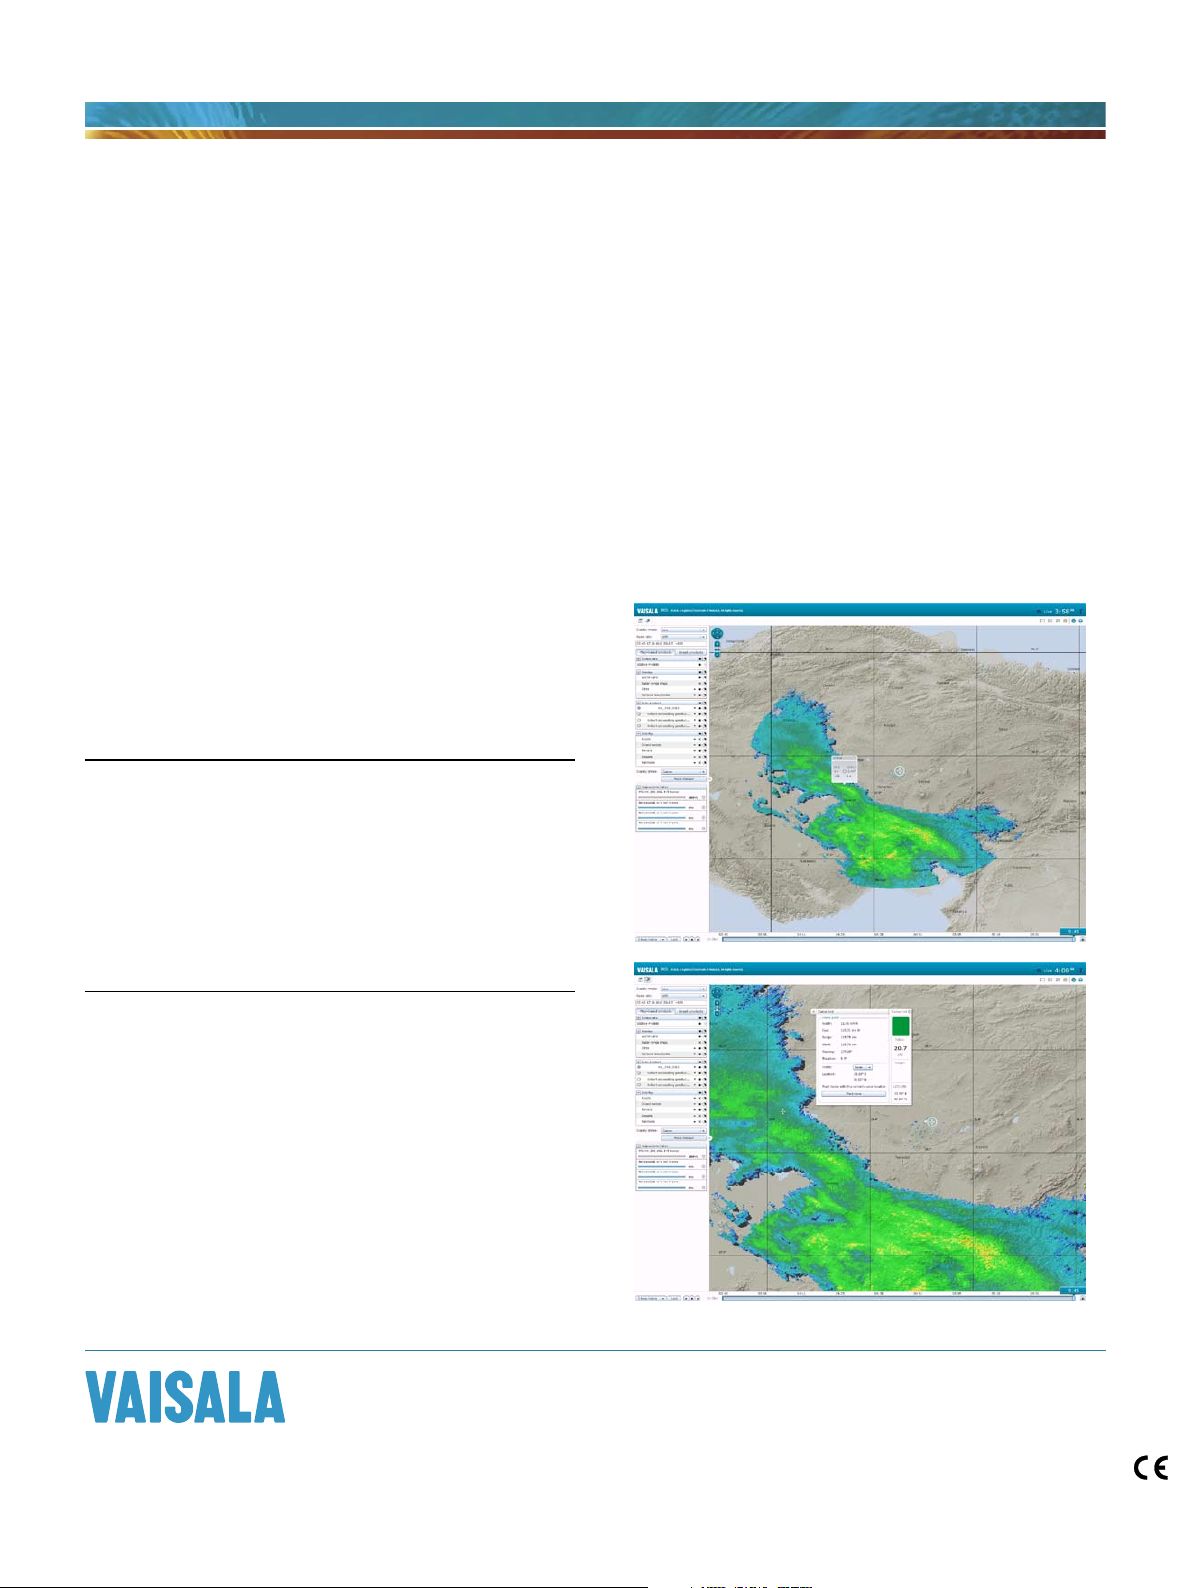
Geographic layers presented will include roads, terrain,
airports, rail, cities, political boundary, latitude/longitude
grid, and range rings. These are given to the web browser
by a GeoServer. It will be possible to add additional
geographical data layers to the GeoServer for expansion.
The web client allows user to pan to new locations and
zoom in or out. All of these functions allow users to keep
situational awareness with the changing environment at
their specic location.
As the web client display is extremely exible in its layout
style, an individual user may save one or more display
states. Then they would be able to quickly jump between
saved states to view particular presentations needed in
their applications.
For more information, visit
www.vaisala.com or contact
us at sales@vaisala.com
Ref. B211058EN-A ©Vaisala 2010
This material is subject to copyright protection, with all
copyrights retained by Vaisala and its individual partners. All
rights reserved. Any logos and/or product names are trademarks
of Vaisala or its individual partners. The reproduction, transfer,
distribution or storage of information contained in this brochure
in any form without the prior written consent of Vaisala is strictly
prohibited. All specifications — technical included — are subject
to change without notice.
 Loading...