

Page 1

Teledyne LeCroy SimPass PE™
PCI Express Analysis Software
User Manual
For SimPass PE Software Version 1.1x
June 2013
Page 2

SimPASS PE Software User Manual
This electronic product is subject to
disposal and recycling regulations that
vary by country and region. Many
countries prohibit the disposal of
waste electronic equipment in
standard waste receptacles.
For more information about proper
disposal and recycling of your LeCroy
product, please visit
www.lecroy.com/recycle.
Document Disclaimer
The information in this document has been carefully checked and is believed to be
reliable. However, no responsibility can be assumed for inaccuracies that may not have
been detected.
Teledyne LeCroy reserves the right to revise the information in this document without
notice or penalty.
Trademarks and Servicemarks
Teledyne LeCroy, SimPASS PE, CATC Trace, PCI Express, PETracer Edge, PETracer
EML, PETracer ML, PETracer, PETrainer EML, PETrainer ML, PETracer Summit,
Summit T2-16, Summit T3-16, Summit Z2-16, Universal Protocol Analyzer System,
UPAS, and BusEngine are trademarks of Teledyne LeCroy.
All other trademarks are property of their respective companies.
Copyright
© 2012, Teledyne LeCroy. All Rights Reserved.
This document may be printed and reproduced without additional permission, but all
copies should contain this copyright notice.
WEEE Program
LeCroy Corporation
Page 3

SimPASS PE Software User Manual
TABLE OF CONTENTS
Chapter 1 Overview . . . . . . . . . . . . . . . . . . . . . . . . . . . . . 1
1.1 Other Documents . . . . . . . . . . . . . . . . . . . . . . . . . . . . . . . . . . . . . . . . . . . . 1
Chapter 2 Installation . . . . . . . . . . . . . . . . . . . . . . . . . . . . 2
Chapter 3 Licensing . . . . . . . . . . . . . . . . . . . . . . . . . . . . . 3
3.1 Installing a License File . . . . . . . . . . . . . . . . . . . . . . . . . . . . . . . . . . . . . . . . 3
3.2 Checking License Information . . . . . . . . . . . . . . . . . . . . . . . . . . . . . . . . . . . 3
Chapter 4 Software Overview . . . . . . . . . . . . . . . . . . . . . 4
4.1 The SimPASS PE Software . . . . . . . . . . . . . . . . . . . . . . . . . . . . . . . . . . . . . 4
4.2 Application Layout . . . . . . . . . . . . . . . . . . . . . . . . . . . . . . . . . . . . . . . . . . . . 5
4.3 Using the Toolbar . . . . . . . . . . . . . . . . . . . . . . . . . . . . . . . . . . . . . . . . . . . . 5
Multi-Segment Toolbar . . . . . . . . . . . . . . . . . . . . . . . . . . . . . . . . . . . . . . 7
Toolbar Hide Buttons. . . . . . . . . . . . . . . . . . . . . . . . . . . . . . . . . . . . . . . . 8
4.4 Using the Menus . . . . . . . . . . . . . . . . . . . . . . . . . . . . . . . . . . . . . . . . . . . . 10
4.5 Tool Tips . . . . . . . . . . . . . . . . . . . . . . . . . . . . . . . . . . . . . . . . . . . . . . . . . . 15
4.6 Keyboard Shortcuts . . . . . . . . . . . . . . . . . . . . . . . . . . . . . . . . . . . . . . . . . . 15
4.7 Search Direction Indicator . . . . . . . . . . . . . . . . . . . . . . . . . . . . . . . . . . . . . 15
4.8 Importing a SimPASS PE File . . . . . . . . . . . . . . . . . . . . . . . . . . . . . . . . . . 16
4.9 Opening CATC Trace Files . . . . . . . . . . . . . . . . . . . . . . . . . . . . . . . . . . . . 16
4.10 Saving CATC Trace Files . . . . . . . . . . . . . . . . . . . . . . . . . . . . . . . . . . . . 17
Using the Save As Function . . . . . . . . . . . . . . . . . . . . . . . . . . . . . . . . . 17
Saving a Portion of a CATC Trace . . . . . . . . . . . . . . . . . . . . . . . . . . . . 17
4.11 Exporting a CATC Trace File . . . . . . . . . . . . . . . . . . . . . . . . . . . . . . . . . . 18
4.12 Printing Data Files . . . . . . . . . . . . . . . . . . . . . . . . . . . . . . . . . . . . . . . . . . 19
Chapter 5 Reading CATC Traces. . . . . . . . . . . . . . . . . . 20
5.1 Viewing PCI Express CATC Traces. . . . . . . . . . . . . . . . . . . . . . . . . . . . . . 20
5.2 Expand and Collapse Data Fields . . . . . . . . . . . . . . . . . . . . . . . . . . . . . . . 20
5.3 Resizing Cells . . . . . . . . . . . . . . . . . . . . . . . . . . . . . . . . . . . . . . . . . . . . . . 20
5.4 Pop-up Menus . . . . . . . . . . . . . . . . . . . . . . . . . . . . . . . . . . . . . . . . . . . . . . 21
5.5 View Data Block . . . . . . . . . . . . . . . . . . . . . . . . . . . . . . . . . . . . . . . . . . . . 21
5.6 Show Raw 10b Codes . . . . . . . . . . . . . . . . . . . . . . . . . . . . . . . . . . . . . . . . 22
5.7 Show Header Fields . . . . . . . . . . . . . . . . . . . . . . . . . . . . . . . . . . . . . . . . . 23
5.8 Packet Cell Popup Menus . . . . . . . . . . . . . . . . . . . . . . . . . . . . . . . . . . . . . 24
Packet Header R-> Cell Popup Menu. . . . . . . . . . . . . . . . . . . . . . . . . . 24
Packet Header G1 Cell Popup Menu . . . . . . . . . . . . . . . . . . . . . . . . . . 25
5.9 Set Marker . . . . . . . . . . . . . . . . . . . . . . . . . . . . . . . . . . . . . . . . . . . . . . . . . 26
5.10 Edit or Clear Marker . . . . . . . . . . . . . . . . . . . . . . . . . . . . . . . . . . . . . . . . 27
5.11 Decoding Traffic. . . . . . . . . . . . . . . . . . . . . . . . . . . . . . . . . . . . . . . . . . . . 28
Packet . . . . . . . . . . . . . . . . . . . . . . . . . . . . . . . . . . . . . . . . . . . . . . . . . . 28
Link . . . . . . . . . . . . . . . . . . . . . . . . . . . . . . . . . . . . . . . . . . . . . . . . . . . . 28
Split . . . . . . . . . . . . . . . . . . . . . . . . . . . . . . . . . . . . . . . . . . . . . . . . . . . . 28
LeCroy Corporation iii
Page 4

SimPASS PE Software User Manual
Chapter 6 Searching CATC Traces . . . . . . . . . . . . . . . . 29
6.1 CATC Trace Search Overview. . . . . . . . . . . . . . . . . . . . . . . . . . . . . . . . . . 29
6.2 Go to Trigger . . . . . . . . . . . . . . . . . . . . . . . . . . . . . . . . . . . . . . . . . . . . . . . 29
6.3 Go to Packet . . . . . . . . . . . . . . . . . . . . . . . . . . . . . . . . . . . . . . . . . . . . . . . 29
6.4 Go to Time. . . . . . . . . . . . . . . . . . . . . . . . . . . . . . . . . . . . . . . . . . . . . . . . . 30
6.5 Go To Marker. . . . . . . . . . . . . . . . . . . . . . . . . . . . . . . . . . . . . . . . . . . . . . . 30
6.6 Go To Menu . . . . . . . . . . . . . . . . . . . . . . . . . . . . . . . . . . . . . . . . . . . . . . . . 31
6.7 Search Direction . . . . . . . . . . . . . . . . . . . . . . . . . . . . . . . . . . . . . . . . . . . . 31
6.8 Find . . . . . . . . . . . . . . . . . . . . . . . . . . . . . . . . . . . . . . . . . . . . . . . . . . . . . . 32
Event Groups . . . . . . . . . . . . . . . . . . . . . . . . . . . . . . . . . . . . . . . . . . . . 34
6.9 Search for the Next Packet Type. . . . . . . . . . . . . . . . . . . . . . . . . . . . . . . . 34
Chapter 7 Display Options . . . . . . . . . . . . . . . . . . . . . . . 35
7.1 Setting Display Options . . . . . . . . . . . . . . . . . . . . . . . . . . . . . . . . . . . . . . . 35
7.2 Specifying General Display Options . . . . . . . . . . . . . . . . . . . . . . . . . . . . . 36
Analysis Tools Checkboxes. . . . . . . . . . . . . . . . . . . . . . . . . . . . . . . . . . 36
Fonts . . . . . . . . . . . . . . . . . . . . . . . . . . . . . . . . . . . . . . . . . . . . . . . . . . . 36
Configuration Name . . . . . . . . . . . . . . . . . . . . . . . . . . . . . . . . . . . . . . . 37
7.3 Color, Format, and Hiding Options . . . . . . . . . . . . . . . . . . . . . . . . . . . . . . 37
Setting Field Colors. . . . . . . . . . . . . . . . . . . . . . . . . . . . . . . . . . . . . . . . 37
Changing Field Formats . . . . . . . . . . . . . . . . . . . . . . . . . . . . . . . . . . . . 40
7.4 Load a Previously Saved Display Options File . . . . . . . . . . . . . . . . . . . . . 44
7.5 Saving Display Options . . . . . . . . . . . . . . . . . . . . . . . . . . . . . . . . . . . . . . . 44
Chapter 8 BitTracer Trace Files . . . . . . . . . . . . . . . . . . . 45
8.1 Overview . . . . . . . . . . . . . . . . . . . . . . . . . . . . . . . . . . . . . . . . . . . . . . . . . . 45
8.2 Views Available for Captured Data . . . . . . . . . . . . . . . . . . . . . . . . . . . . . . 45
8.3 De-Skewing Data. . . . . . . . . . . . . . . . . . . . . . . . . . . . . . . . . . . . . . . . . . . . 46
8.4 Data Display Formats . . . . . . . . . . . . . . . . . . . . . . . . . . . . . . . . . . . . . . . . 46
8.5 Color-Coding of BitTracer Contents . . . . . . . . . . . . . . . . . . . . . . . . . . . . . 47
8.6 Report and Analysis Windows. . . . . . . . . . . . . . . . . . . . . . . . . . . . . . . . . . 47
8.7 Timing Measurements Bar . . . . . . . . . . . . . . . . . . . . . . . . . . . . . . . . . . . . 48
Markers Bar. . . . . . . . . . . . . . . . . . . . . . . . . . . . . . . . . . . . . . . . . . . . . . 48
8.8 Errors Bar . . . . . . . . . . . . . . . . . . . . . . . . . . . . . . . . . . . . . . . . . . . . . . . . . 50
8.9 Symbols Bar . . . . . . . . . . . . . . . . . . . . . . . . . . . . . . . . . . . . . . . . . . . . . . . 51
8.10 Events Bar . . . . . . . . . . . . . . . . . . . . . . . . . . . . . . . . . . . . . . . . . . . . . . . . 51
8.11 Packets Bar . . . . . . . . . . . . . . . . . . . . . . . . . . . . . . . . . . . . . . . . . . . . . . . 52
8.12 Decoding Bar. . . . . . . . . . . . . . . . . . . . . . . . . . . . . . . . . . . . . . . . . . . . . . 53
8.13 Search . . . . . . . . . . . . . . . . . . . . . . . . . . . . . . . . . . . . . . . . . . . . . . . . . . . 54
8.14 Link Configuration . . . . . . . . . . . . . . . . . . . . . . . . . . . . . . . . . . . . . . . . . . 55
8.15 Export of BitTracer Capture to CATC Trace Format . . . . . . . . . . . . . . . . 57
Exports Involving Multiple Logical Links on One Physical Link. . . . . . . 57
8.16 Compressing and Expanding the Data View . . . . . . . . . . . . . . . . . . . . . . 57
8.17 Opening and Saving BitTracer Captures . . . . . . . . . . . . . . . . . . . . . . . . . 57
Chapter 9 Reports and Tools . . . . . . . . . . . . . . . . . . . . . 59
9.1 File Information . . . . . . . . . . . . . . . . . . . . . . . . . . . . . . . . . . . . . . . . . . . . . 60
9.2 Error Summary . . . . . . . . . . . . . . . . . . . . . . . . . . . . . . . . . . . . . . . . . . . . . 61
9.3 Traffic Summary . . . . . . . . . . . . . . . . . . . . . . . . . . . . . . . . . . . . . . . . . . . . 62
Using the Traffic Summary Window to Search the CATC Trace . . . . . . 62
Traffic Summary Buttons. . . . . . . . . . . . . . . . . . . . . . . . . . . . . . . . . . . . 63
iv LeCroy Corporation
Page 5

SimPASS PE Software User Manual
9.4 Bus Utilization . . . . . . . . . . . . . . . . . . . . . . . . . . . . . . . . . . . . . . . . . . . . . . 64
Bus Utilization Pop-up Menu. . . . . . . . . . . . . . . . . . . . . . . . . . . . . . . . . 65
Bus Utilization Buttons . . . . . . . . . . . . . . . . . . . . . . . . . . . . . . . . . . . . . 67
9.5 Link Tracker. . . . . . . . . . . . . . . . . . . . . . . . . . . . . . . . . . . . . . . . . . . . . . . . 69
Using the Link Tracker Window . . . . . . . . . . . . . . . . . . . . . . . . . . . . . . 70
Link Tracker Buttons . . . . . . . . . . . . . . . . . . . . . . . . . . . . . . . . . . . . . . . 73
9.6 Data Flow Window. . . . . . . . . . . . . . . . . . . . . . . . . . . . . . . . . . . . . . . . . . . 75
9.7 Flow Control Tracking . . . . . . . . . . . . . . . . . . . . . . . . . . . . . . . . . . . . . . . . 76
9.8 Using the CATC Trace Navigator . . . . . . . . . . . . . . . . . . . . . . . . . . . . . . . 77
Displaying the Navigator . . . . . . . . . . . . . . . . . . . . . . . . . . . . . . . . . . . . 77
Navigator Toolbar . . . . . . . . . . . . . . . . . . . . . . . . . . . . . . . . . . . . . . . . . 78
Navigator Ranges . . . . . . . . . . . . . . . . . . . . . . . . . . . . . . . . . . . . . . . . . 78
Navigator Panes . . . . . . . . . . . . . . . . . . . . . . . . . . . . . . . . . . . . . . . . . . 80
9.9 LTSSM Flow Graph . . . . . . . . . . . . . . . . . . . . . . . . . . . . . . . . . . . . . . . . . . 83
9.10 Packet Header Bar . . . . . . . . . . . . . . . . . . . . . . . . . . . . . . . . . . . . . . . . . 84
9.11 Packet Data Window . . . . . . . . . . . . . . . . . . . . . . . . . . . . . . . . . . . . . . . . 85
9.12 Configuration Space View . . . . . . . . . . . . . . . . . . . . . . . . . . . . . . . . . . . . 86
9.13 Using Unit Metrics . . . . . . . . . . . . . . . . . . . . . . . . . . . . . . . . . . . . . . . . . . 88
Show Metrics in the CATC Trace Display . . . . . . . . . . . . . . . . . . . . . . . 89
Show Metrics in the Traffic Summary Window . . . . . . . . . . . . . . . . . . . 91
Show Metrics in the Bus Utilization Window . . . . . . . . . . . . . . . . . . . . . 93
9.14 TC to VC Mapping . . . . . . . . . . . . . . . . . . . . . . . . . . . . . . . . . . . . . . . . . . 96
9.15 Timing and Bus Usage Calculations . . . . . . . . . . . . . . . . . . . . . . . . . . . . 97
9.16 Running Verification Scripts. . . . . . . . . . . . . . . . . . . . . . . . . . . . . . . . . . . 99
Appendix A Configuration Space Decoding . . . . . . . . . 103
A.1 Mandatory Definitions . . . . . . . . . . . . . . . . . . . . . . . . . . . . . . . . . . . . . . . 103
A.2 Mandatory Module Functions . . . . . . . . . . . . . . . . . . . . . . . . . . . . . . . . . 103
A.3 Configuration Register Types . . . . . . . . . . . . . . . . . . . . . . . . . . . . . . . . . 104
A.4 Primitives . . . . . . . . . . . . . . . . . . . . . . . . . . . . . . . . . . . . . . . . . . . . . . . . 104
A.5 Helper File. . . . . . . . . . . . . . . . . . . . . . . . . . . . . . . . . . . . . . . . . . . . . . . . 105
Appendix B China Restriction of Hazardous Substances
Table . . . . . . . . . . . . . . . . . . . . . . . . . . . . . . 106
How to Contact LeCroy . . . . . . . . . . . . . . . . . . . . . . . . . 107
Index . . . . . . . . . . . . . . . . . . . . . . . . . . . . . . . . . . . . . . . . . 109
LeCroy Corporation v
Page 6

SimPASS PE Software User Manual
[page intentionally blank to preserve odd-even pagination]
vi LeCroy Corporation
Page 7

SimPASS PE Software User Manual Chapter 1: Overview
Chapter 1: Overview
The Teledyne LeCroy SimPASS PE™ PCI Express Protocol Analyzer Software is a
powerful and intuitive expert software system embedding detailed knowledge of the
protocol hierarchy and intricacies, as defined in the protocol specification. It allows you
to import your simulation results and analyze them in a graphical display that has been
optimized for fast and easy navigation through a simulated traffic session. Users are
alerted as violations are detected at all levels of the protocol layering and can easily drill
down on areas of interest or collapse and hide fields that are not relevant. It is based on
Teledyne LeCroy PETracer™ PCI Express Analysis Software running in the Windows
operating system.
Features and Benefits
The Teledyne LeCroy PCI Express Protocol Analyzer Software has the following features
and benefits:
Features Benefits
Powerful and Intuitive
CATC Trace™ Analysis Software
Extensive Decoding Complete, accurate and reliable decoding of TLPs (Transaction
Intelligent Reporting
Sophisticated Viewing View Packet, Link, and Split transaction levels of the PCI Express
Dword to Transaction Level
Viewer
Faster interpretation and debug of PCI Express traffic with
color-coded, clearly labeled protocol elements in a graphical
display. Reduces coding and deciphering.
Layer Packets), DLLPs (Data Link Layer Packets),and all PCI
Express Primitives.
Quickly identify and track error rates and abnormal link or timing
conditions. Display configuration space and protocol specification
details.
protocol. Collapsible/expandable headers with Tool tip explanations
make it easy to navigate and interpret packet contents, headers,
and commands. View packets, transactions of TLPs and DLLPs in
classic CATC Trace™ format or in raw bit stream for deeper
analysis.
View Dwords, Packet, Link and Split Transaction levels of the PCI
Express protocol.
1.1 Other Documents
For more information, refer to the following documents:
• Teledyne LeCroy Analyzers File-based Decoding Manual
• PETracer VSE Manual
LeCroy Corporation 1
Page 8
Chapter 2: Installation SimPASS PE Software User Manual
Chapter 2: Installation
The SimPASS PE™ software is installed on a Linux®-based PC running in a Windows®
emulation environment that is installed together with SimPASS PE software.
Please consult the readme file on the installation CD for the latest PC requirements.
To install the SimPASS PE software on the Host PC:
Step 1 Insert the CD into the CD ROM drive of the PC.
Alternatively, you can download the SimPASS PE installation from the
Teledyne LeCroy web site.
Step 2 The SimPASS PE software installs automatically on the PC hard disk.
Follow the onscreen instructions.
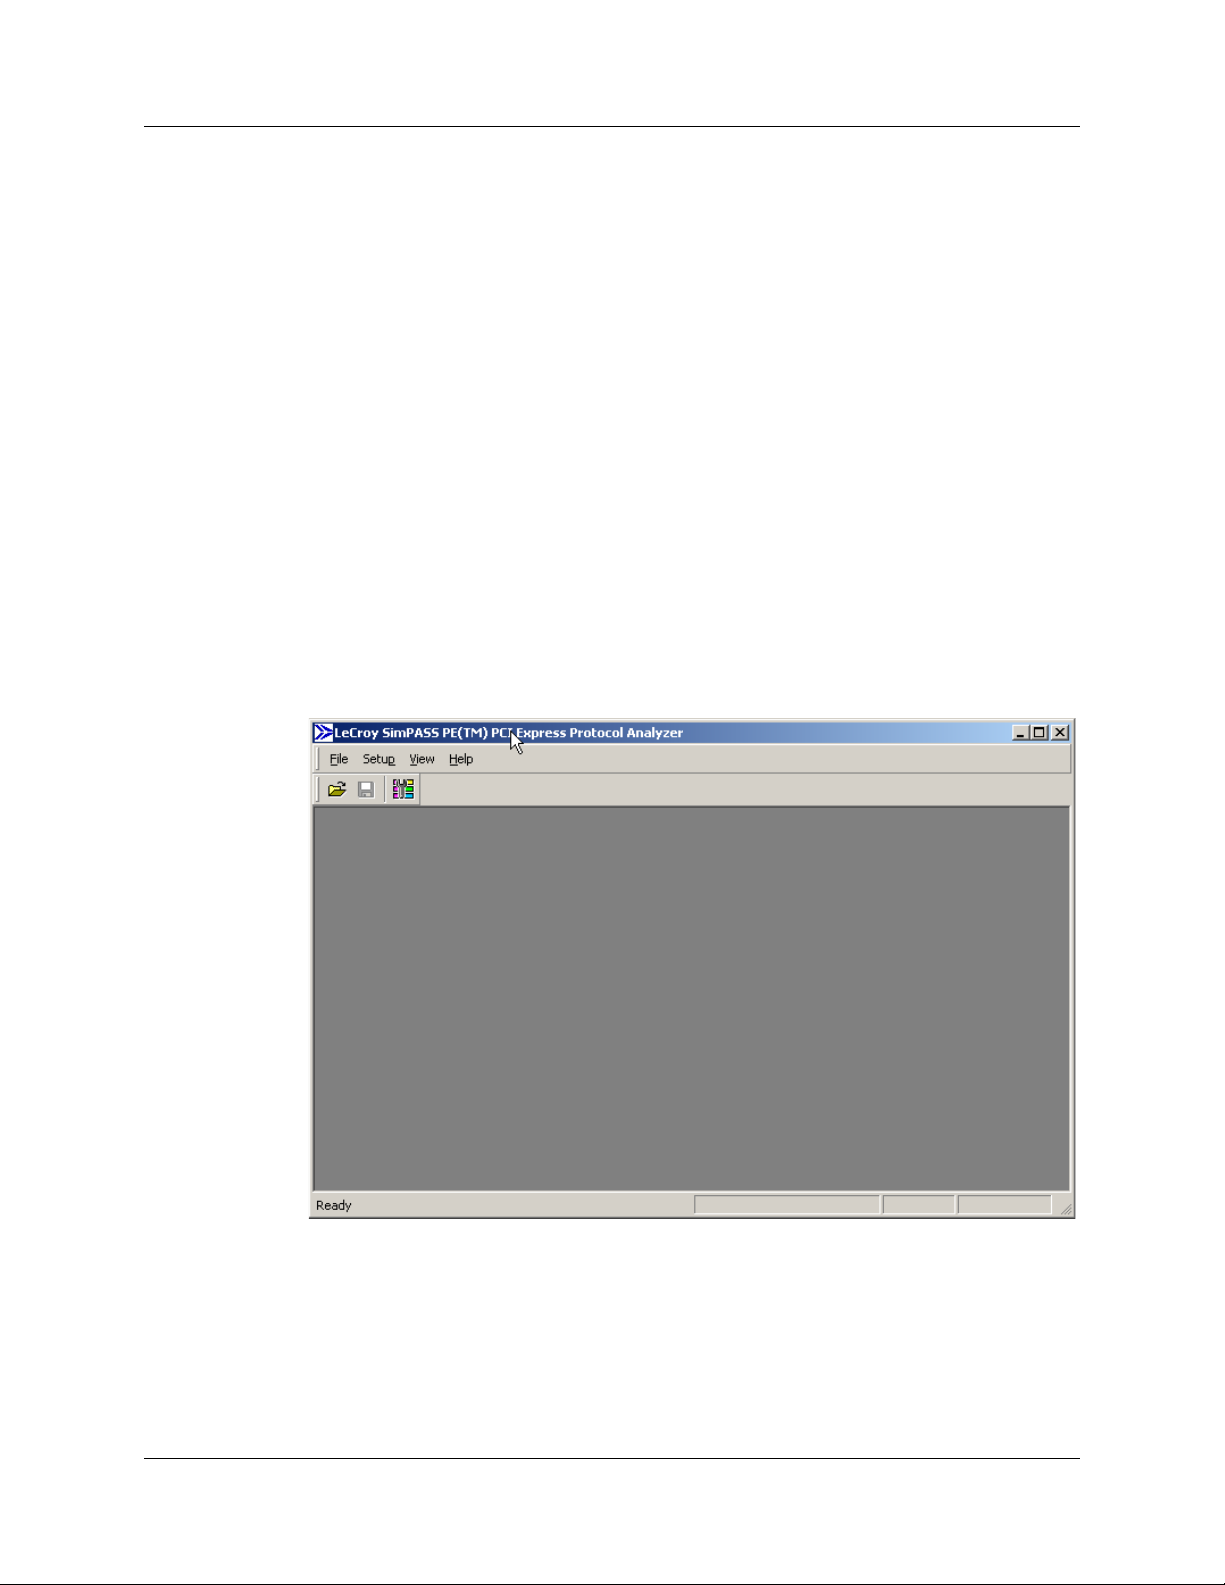
Starting the Application
Launch the SimPASS PE program to open the SimPASS PE main window.:
2 LeCroy Corporation
Page 9
SimPASS PE Software User Manual Chapter 3: Licensing
Chapter 3: Licensing
3.1 Installing a License File
To i mp or t .simpass files requires an appropriate license.
After obtaining a SimPASS PE License file, install it using the following procedure.
Step 1 Run the SimPASS PE application.
Step 2 Select Help > Install Software License File.
Step 3 Use the Open dialog box file browser to locate and select the license file.
If the license is valid, it will install itself. Otherwise, contact PSG support.
See “How to Contact LeCroy” on page 107 to purchase a valid license.
Note: You do not need a license to view recorded or imported trace files in SimPASS PE.
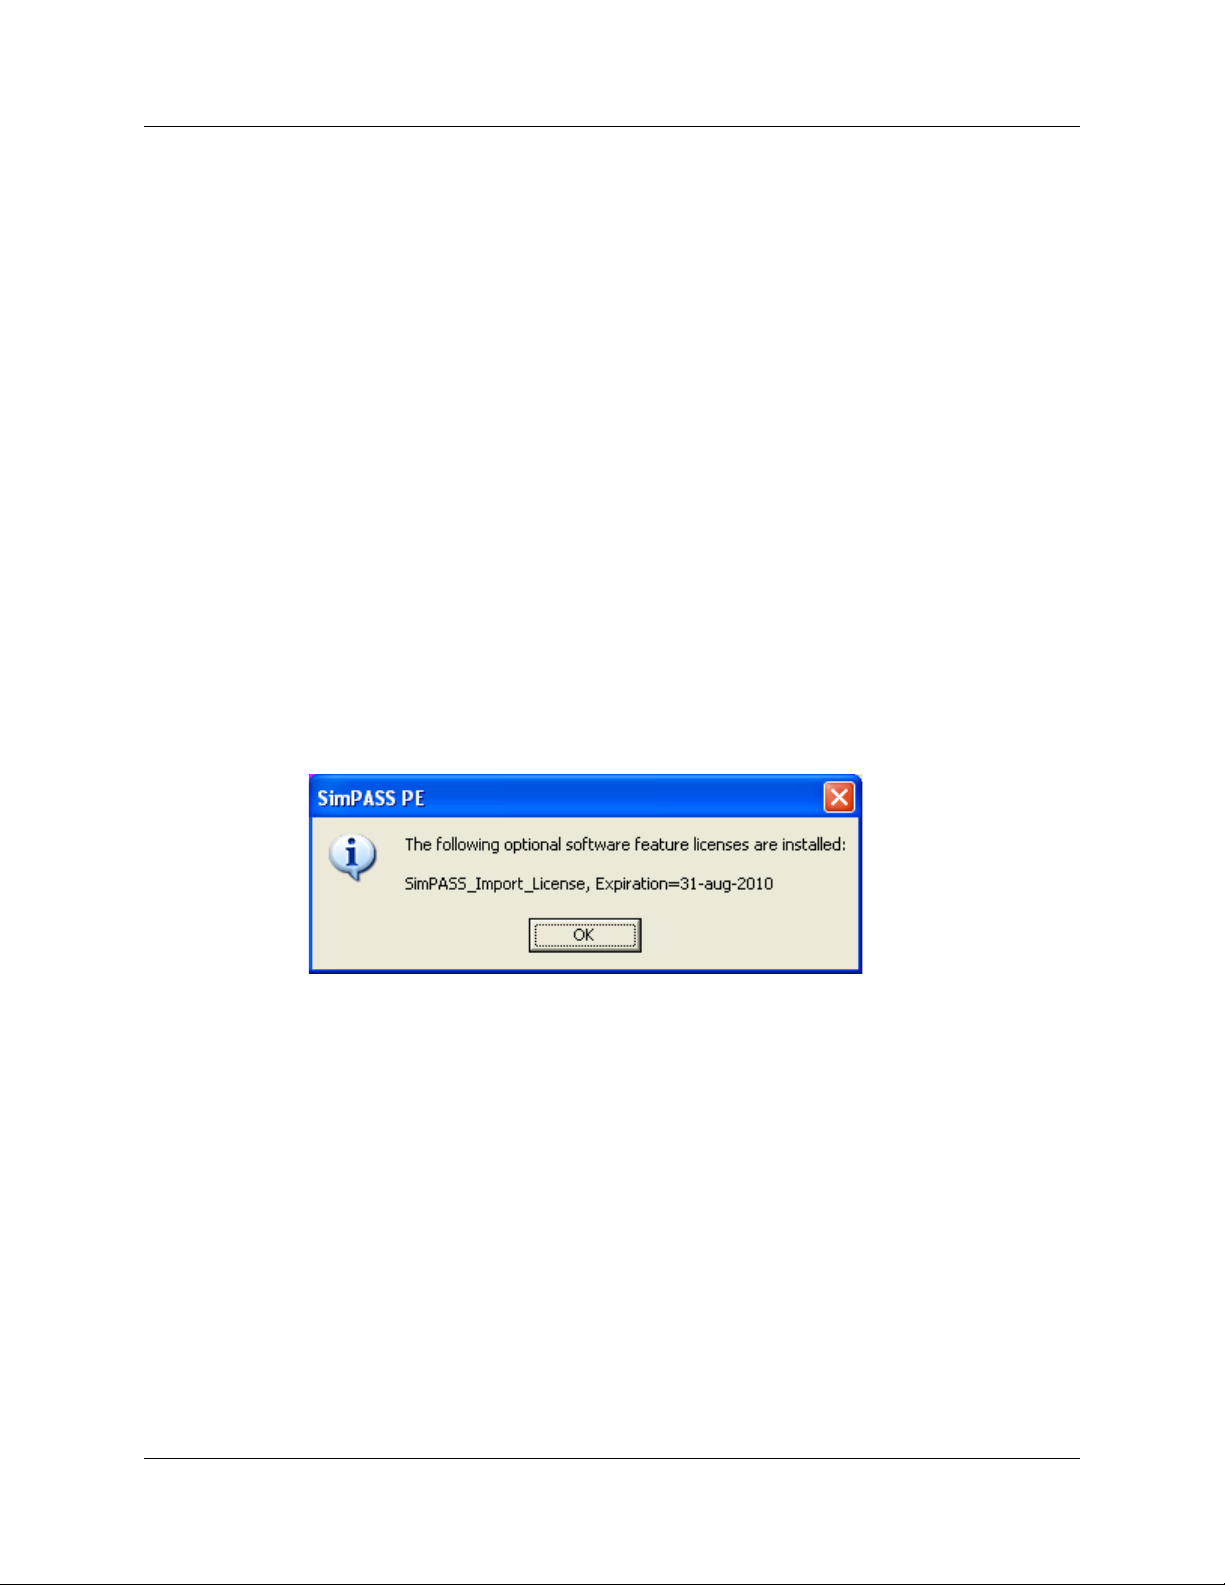
3.2 Checking License Information
To view the SimPASS PE license registered with an instance of the SimPASS PE
application, open the application and select Help > Display License Information to
display a message.
The message shows the installed licenses and their respective expiration dates.
LeCroy Corporation 3
Page 10
Chapter 4: Software Overview SimPASS PE Software User Manual
Chapter 4: Software Overview
4.1 The SimPASS PE Software
The SimPASS PE™ software administers Analyzer platforms and handles all
CATC Trace analysis and display.
The software runs in a Windows
you to import simulation results for analysis.
®
-emulation environment on a Linux-based PC. It allows
4 LeCroy Corporation
Page 11
SimPASS PE Software User Manual Chapter 4: Software Overview
4.2 Application Layout
The SimPASS PE application contains the following components:
Title bar: The title bar is at the top of the application window and displays the CATC Trace
file name or generation script name.
Menu bar: The menu bar is located below the title bar, by default. The menu bar can be
moved by clicking a blank area of the bar and then dragging the menu to a new position.
It can be docked in another part of the application window or moved outside of the window
to become a floating menu.
Toolbar: The toolbar is composed of buttons that represent the commonly used
commands. The toolbar divides into smaller toolbars that can be moved and docked in a
new position or made to float outside of the window.
Display area: The display area is the main part of the application window in which traces
are displayed.
Status bar: The status bar is located at the bottom of the application window. The left end
of the status bar displays descriptions of buttons and menu items when the mouse is
positioned over them. The right end of the bar shows the search direction.
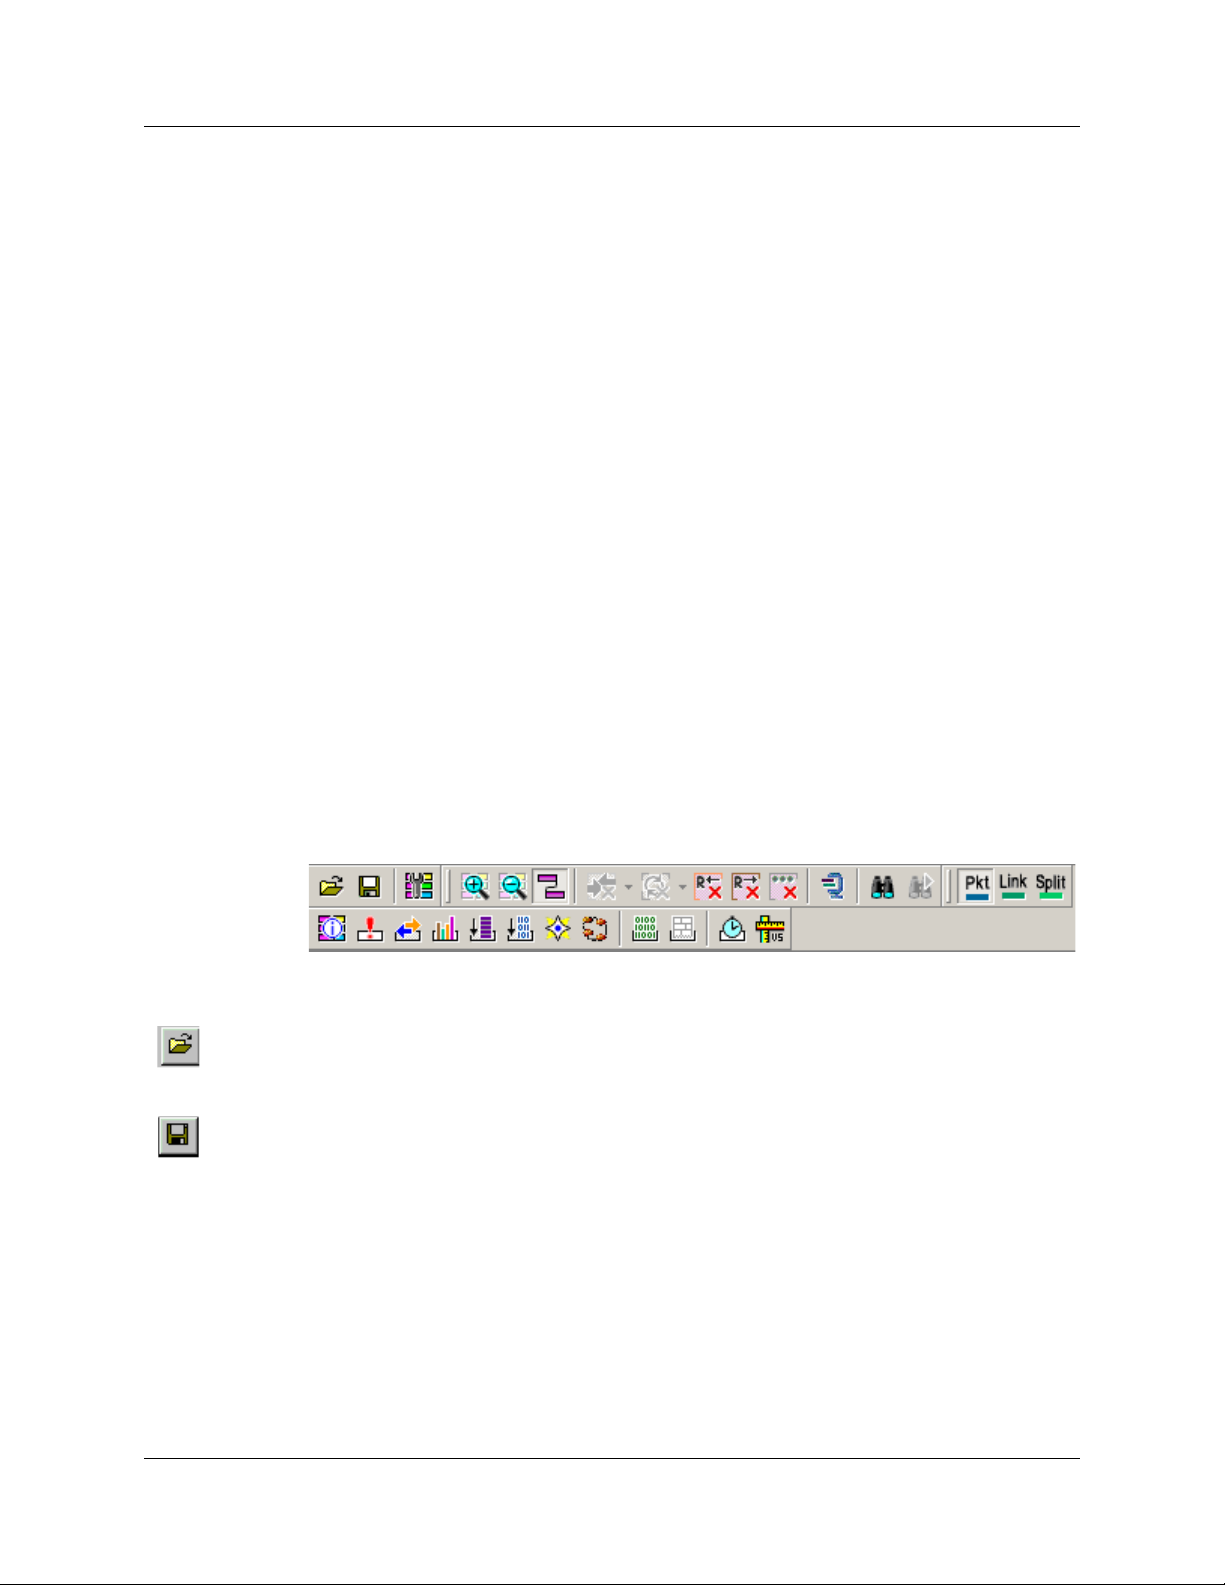
4.3 Using the Toolbar
You can use the SimPASS PE application Toolbar as a shortcut to most of the operations
supplied by the menus.
Opens a previously recorded, or
imported,
Save As
Allows the open file to be saved
with a new name.
CATC Trace file.
LeCroy Corporation 5
Page 12

Chapter 4: Software Overview SimPASS PE Software User Manual
Setup Display Options
Opens the Display Options dialog
box.
Zoom in display. Wraps display information.
Zoom out display.
Hide Training Sequence. Hide Downstream traffic/recording.
Hide SKIP and Update FC
packets.
Hide Upstream recording/traffic. Compact View
Find
Opens a dialog box that allows you
to select one or more items to find
in the recording, then searches to
that point.
View Packet Level data.
View Link Transaction Level data. View Split Transaction Level data
Advanced Hiding Options
Opens a dialog box that allows you to select
items to hide from view.
Toggles compacting of training sequences to
analyze
compacting to display more data.
Find Next. Repeats last Find or Search action.
CATC Trace data faster, or no
6 LeCroy Corporation
Page 13

SimPASS PE Software User Manual Chapter 4: Software Overview
File Information
Lists the conditions under which
the recording was made.
Error Report
Opens a window that lists all errors
identified in the recording.
Traffic Summary
Opens a window that lists all
events that occurred during the
recording
Navigator. Shows/hides the
Navigator bar - a utility that lets you
easily navigate the CATC Trace.
Displays the Data/Payload
window for the current packet.
Bus Utilization
Opens a window that graphically represents
various information about the recording.
Link Tracker
Opens a window that displays symbol information
per lane.
Opens the Data Flow window.
Shows recorded data in a compressed tabular
format.
LTSSM Flow Graph
Shows a state diagram of the Link Training
and Status State machine.
Displays the Packet Header bar.
Opens a window that displays the header
information in the current packet, as it would be
viewed in the specification.
Opens the Timing and Bus Usage
Calculations window.
Multi-Segment Toolbar
First Segment. Open first segment
in the multisegment CATC Trace.
Previous segment. Open previous
segment in the multisegment
CATC Trace.
Running Verification Scripts
Opens a dialog that allows you to select and run
verification scripts.
Index file. This button becomes active if a
multisegment CATC Trace file is open and
displays the index file for the recording.
Next Segment. Open next segment in
multisegment CATC Trace.
Last segment. Open last segment in
multisegment CATC Trace.
LeCroy Corporation 7
Page 14
Chapter 4: Software Overview SimPASS PE Software User Manual
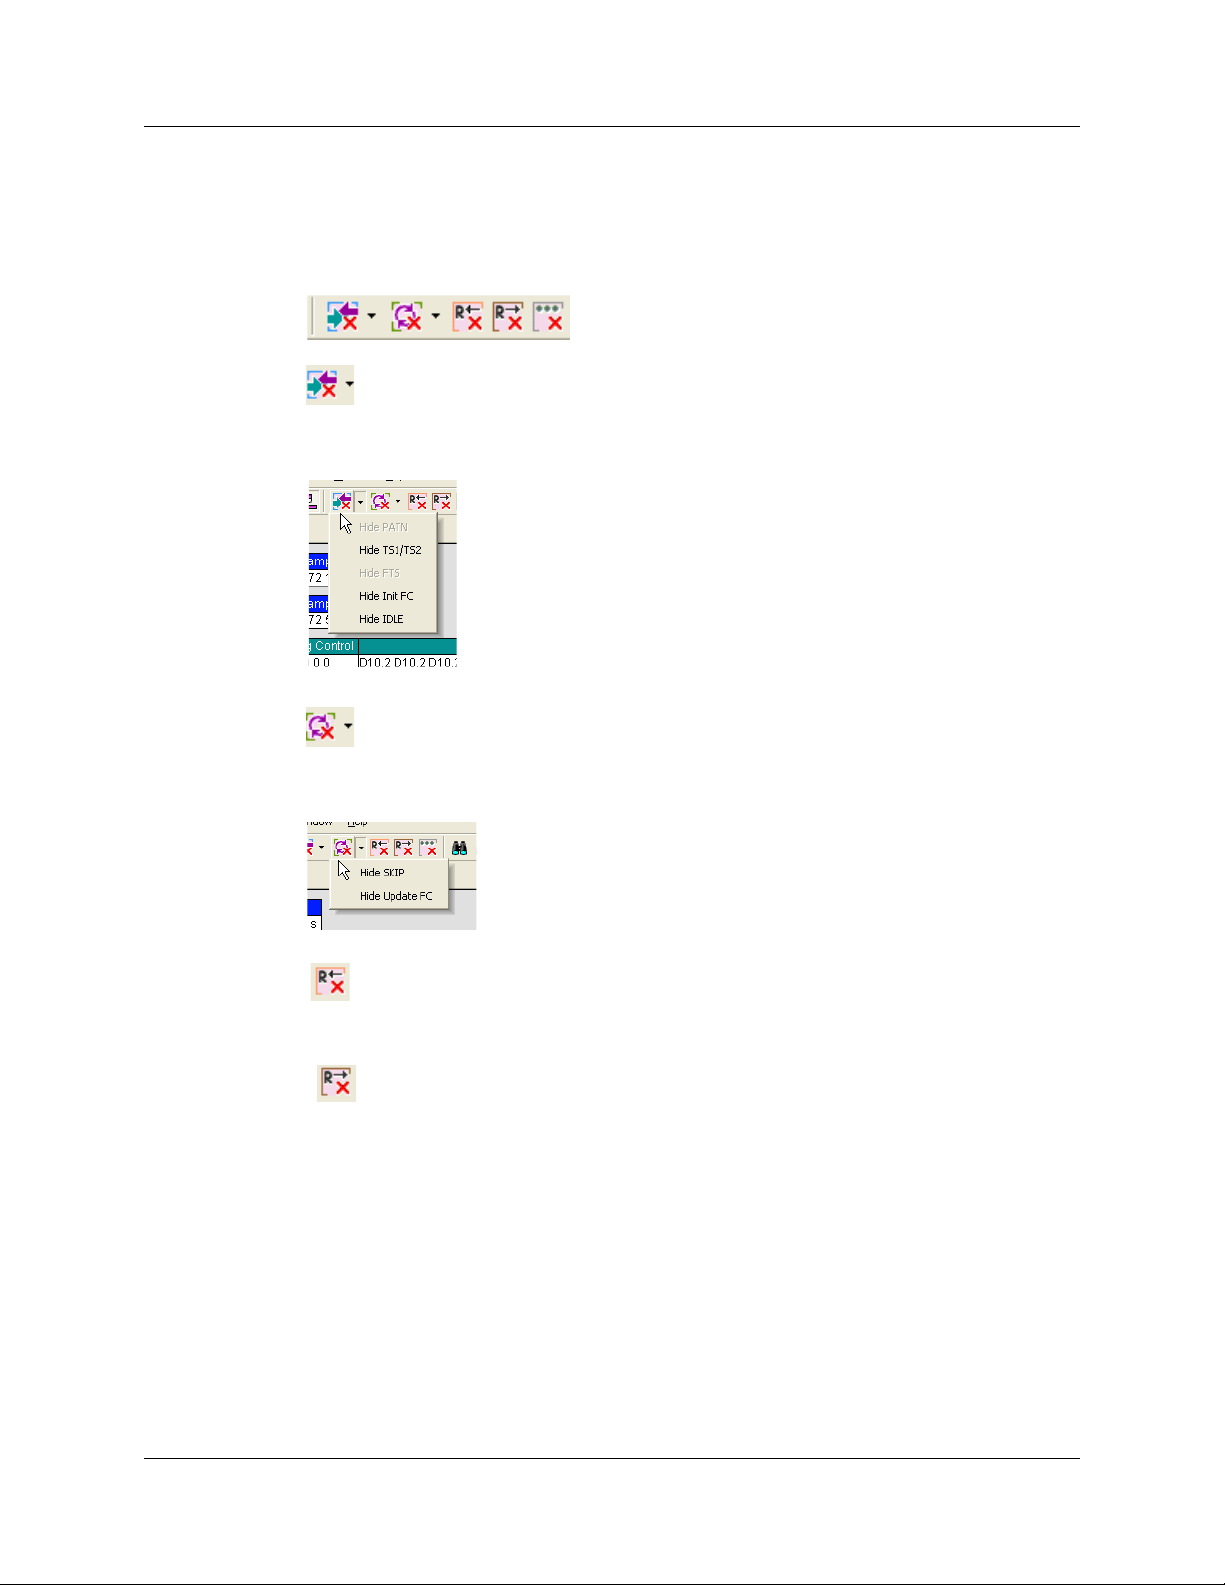
Toolbar Hide Buttons
The SimPASS PE application toolbar has five buttons related to show/hide of
CATC Trace file contents. The buttons allow you to quickly adjust the display to your
needs.
Hide Training: Brings up a drop-down menu that lets you to hide all or a portion of the
packets in the training portion of the CATC Trace.
Hide SKIP and Update FC: Brings up a drop-down menu that lets you hide SKIP or
Update FC packets in a CATC Trace.
Hide Upstream: Hide all traffic from endpoint devices to the root complex.
{
Hide Downstream: Hide all traffic from the root complex to endpoint devices.
8 LeCroy Corporation
Page 15
SimPASS PE Software User Manual Chapter 4: Software Overview
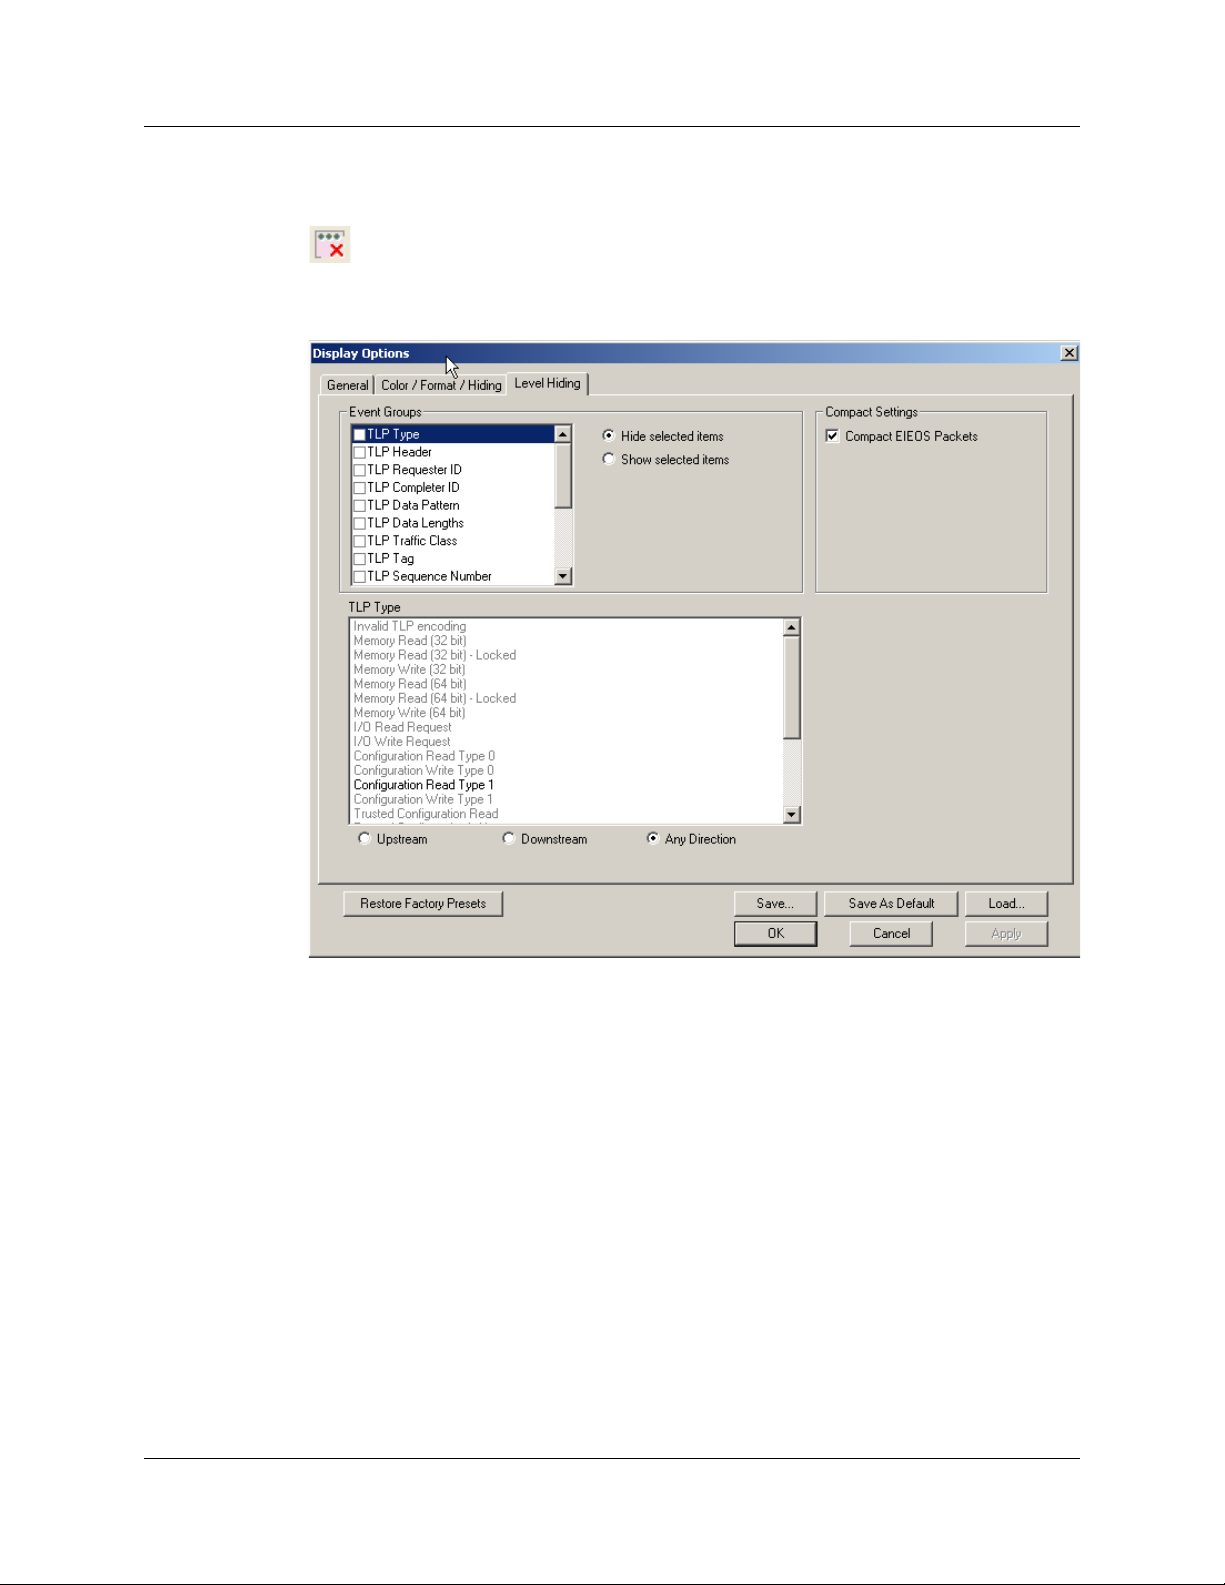
Advanced Hiding Options: Brings up the Level Hiding pane of the Display Options
window. Use this pane to tune the show/hide options within the CATC Trace display.
LeCroy Corporation 9
Page 16

Chapter 4: Software Overview SimPASS PE Software User Manual
4.4 Using the Menus
The SimPASS PE application main display includes the following set of pull-down menus:
File Menu
New Generator Script Creates a new Traffic Generation file.
Open Opens a file.
Close Closes the current file.
Save as Saves all or a specified range of packets to a uniquely named file.
Convert Old Files Convert CATC Trace files.
Print Prints part or all of the current traffic data file.
Print Preview Produces an on-screen preview before printing.
Print Setup Setup your current or new printer.
Import SimPASS File to
Protocol Trace
Import SimPASS File to
Bit Trace
Edit Comment Create or edit the comment field in a CATC Trace file.
Export
>> to Text
>> Packets to CSV Text
>> to Generator
File Format
Exit Exit the SimPASS PE application.
Imports a .simpass file as a CATC Trace file.
CATC Trace files are optimized for protocol analysis.
Imports a .simpass file as a BitTracer file.
BitTracer files are optimized for link and phy layer analysis.
Saves all or part of a CATC Trace to a text file or traffic generation file. This text file
summarizes the traffic in the CATC Trace.
Saves the CATC Trace to a text file in Comma Separated Value (CSV) format.
Saves the CATC Trace to a generation file.
10 LeCroy Corporation
Page 17

SimPASS PE Software User Manual Chapter 4: Software Overview
Setup Menu
Display Options Allows you to customize display options such as field colors, field formats and level
hiding.
Report Menu
Report Menu operations are only available when you are working with a CATC Trace file.
File Information Displays information about the file contents and describes the conditions of the file’s
recording (Recording Options, hardware information, and so on).
Error Summary Displays an error summary of the current CATC Trace file and allows you to go to a
specific packet, and save the error file to a uniquely named file.
Traffic Summary Details the number and types of packets that were transferred during the recording.
You can hide, save, send, text, print, and view.
Bus Utilization Opens a window with graphs of bus usage for the open CATC Trace.
Link Tracker Opens a window for displaying a detailed chronological view of traffic. The window
provides view and navigation options.
Data Flow Opens the Data Flow Window, providing a tabular view of transactions and their
payload.
Trace Navigator Shows the Navigator bar for navigating a CATC Trace. Shows a snapshot of the
recording and allows you to adjust the memory area for the view.
LTSSM Flow Graph
Shows a state diagram of bus activity. Also allows you to navigate through
the LTSSM, based on the current recording.
Packet Header Opens the Packet Header bar, showing the Packet Header information as it would be
viewed in the specification.
Packet Data/View Data Opens the Data Window for the current packet, with the options: Hide, Save,
Hexadecimal, ASCII, Decimal, Binary, MSB Format, LSB Format, Big Endian, and
Little Endian. Format Line allows you to enter the number of bytes, words, or dwords
per line.
Configuration Space Presents a list of Configuration Spaces. Clicking an item displays the selected
Configuration Space in a Configuration Table format.
LeCroy Corporation 11
Page 18

Chapter 4: Software Overview SimPASS PE Software User Manual
Search Menu
Search Menu operations are only available when you are working with a CATC Trace file.
Go to Trigger Repositions the display to show the first packet following the trigger event.
Go to Segment/ Packet Repositions the display to a specific packet, Link or Split transaction number.
Go to Time Repositions the display to specific timestamp.
Go to Marker Repositions the display to a previously marked packet, Link Transaction, or
Split Transaction.
Go to Packet Allows searching for specific link events: TLP Type, DLLP Type, Ordered Set,
Link Event, Traffic Class, DLLP Virtual Channel, TLP Virtual Channel, Direction,
Speed, Link Width, Requester ID, Completer ID, Data Lengths, Errors.
Find Displays the Find dialog to allow searching for various events within a CATC Trace.
You can search by Display Level: Packets, Link Transactions, Split Transactions.
You can search packets by Event Group: TLP Type, TLP Header, TLP Requester ID,
TLP Completer ID, TLP Data Pattern, TLP Data Lengths, TLP Tag, TLP Sequence
Number, DLLP Type, DLLP Header, DLLP Virtual Channel, ACK/NAK Seq Number,
Ordered Sets, Link Event, Direction, Errors.
You can search link transactions by Event Group: TLP Type, Traffic Class, Virtual
Channel, Direction, Requester ID, Completer ID, Status, Tag.
You can search split transactions by Event Group: TLP Type, Traffic Class, Virtual
Channel, Direction, Requester ID, Completer ID, Status, Tag.
Find allows you to create complex searches based on numerous criteria.
You can search by Display Level: Packets, Link Transactions, Split Transactions.
You can search packets by Event Group: TLP Type, TLP Header, TLP Requester ID,
TLP Completer ID, TLP Data Pattern, TLP Data Lengths, TLP Tag,
TLP Sequence Number, DLLP Type, DLLP Header, DLLP Virtual Channel,
ACK/NAK Seq Number, Ordered Sets, Link Event, Direction, Errors.
You can search link transactions by Event Group: TLP Type, Traffic Class,
Virtual Channel, Direction, Requester ID, Completer ID, Status, Tag.
You can search split transactions by Event Group: TLP Type, Traffic Class,
Virtual Channel, Direction, Requester ID, Completer ID, Status, Tag.
Find allows you to create complex searches based on numerous criteria.
Find Next Repeats the previous Find or Search operation.
Search Direction Allows you to specify a forward or backward search of a CATC Trace file.
12 LeCroy Corporation
Page 19

SimPASS PE Software User Manual Chapter 4: Software Overview
View Menu
Toolbars>> Displays available toolbars: Standard, Frequently Used, Analysis, and Transaction
Level. Use Customize to display the Windows Customize window.
Script Editor Displays the Script Editor (only appears if a .peg file is open).
Status Bar Switches display of the Status Bar on or off.
Zoom In Zoom in increases the size of the displayed elements.
Zoom Out Zoom out decreases the size of the displayed elements.
Wrap Allows the display to wrap.
FC Credits Toggles a display for tracking Flow Control Credit update and consumption on a PCI
Express link.
FC Credits Setup Allows you to customize the display for tracking Flow Control Credits.
Compact View
Toggles compacting of the Link Training sequence to analyze CATC Trace
data faster or no compacting to display more data.
Packet Level View the current recording at the Packet Level.
Link Transaction Level View the current recording at the Link Transaction Level.
Split Transaction Level View the current recording at the Split Transaction Level.
LeCroy Corporation 13
Page 20

Chapter 4: Software Overview SimPASS PE Software User Manual
Tools Menu
TC to VC Mapping Allows Traffic Classes to be mapped to Virtual Channels for purposes of simplifying
navigation (for example, Search > Go to > TLP Virtual Channel) and changing the way
the CATC Trace is displayed (for example, in Split Transactions).
Timing Calculations Starts the mode-less calculator dialog for calculating various timing and bandwidth
parameters in the recording file.
Run Verification Scripts Presents a list of verification scripts, from which you can run a verification script.
Window Menu
New Window Opens a copy of the current CATC Trace window.
Cascade Displays all open CATC Trace windows in an overlapping arrangement.
Tile Displays all open CATC Trace windows as a series of strips across the display.
Arrange Icons Arranges minimized CATC Trace windows at the bottom of the display.
Synchronize Traces Synchronizes the CATC Trace View windows so that a move in one window
repositions the other window of the same recording.
Help Menu
User Manuals Accesses the SimPASS PE application user manuals.
Display License Information
Install Software License FIle Installs a valid license file.
Register Product Online Register at the Teledyne LeCroy website registration page.
About Displays version information about the currently running SimPASS PE software.
Displays the installed licenses and their respective expiration dates.
14 LeCroy Corporation
Page 21

SimPASS PE Software User Manual Chapter 4: Software Overview
4.5 Tool Tips
Tool tips provide details about fields within the CATC Trace. To see a tool tip, position your
mouse pointer over a field within the CATC Trace.
You can turn off this capability in the Display Options menu.
4.6 Keyboard Shortcuts
Keystrokes Operation
Ctrl + O Open file
Ctrl + P Print
Ctrl + S Save file
Ctrl + Home Jump to first packet
Ctrl + End Jump to last packet
Ctrl + G Go to packet ...
Ctrl + F Search forward
F3 Find next
F6 Next pane
Shift + F6 Previous pane
Ctrl + B Search backward
4.7 Search Direction Indicator
A segment in the status bar indicates search direction. The direction can be changed by
selecting Search Direction from the Search menu.
LeCroy Corporation 15
Page 22

Chapter 4: Software Overview SimPASS PE Software User Manual
4.8 Importing a SimPASS PE File
The SimPASS PE software creates and uses two related file types:
• Teledyne LeCroy CATC PCI Express Protocol Analysis File (CATC Trace file):
Trace files optimized for protocol analysis
• Teledyne LeCroy PCI Express BitTracer Analyzer File (BitTracer file): Trace
files optimized for link and phy layer analysis
SimPASS PE import files have the extension ".simpass". Simulation environments of
participating vendors create these files to allow importing the logical PCI Express
simulation traffic into a CATC Trace file and into a BitTracer file.
To i mp or t a .simpass file to a CATC Trace file:
Step 1 Select File > Import SimPASS File to Protocol Trace...
Step 2 Select a .simpass file.
To i mp or t a .simpass file to a BitTracer file:
Step 1 Select File > Import SimPASS File to BitTrace...
Step 2 Select a .simpass file.
4.9 Opening CATC Trace Files
To open an existing CATC Trace file, click File > Open or .
16 LeCroy Corporation
Page 23
SimPASS PE Software User Manual Chapter 4: Software Overview
4.10 Saving CATC Trace Files
Using the Save As Function
When you record a CATC Trace file, the Analyzer software provides a pre-defined name
to the CATC Trace file (data.pex or any other that you specified in the Recording
Options). If you do consecutive recordings, each time the previous recording is
overwritten. If you see a recording you want to analyze later, you need to give a unique
name to the CATC Trace file, so it is not overwritten with the next recording.
Also, when you analyze a recorded CATC Trace file, you might be interested in
preserving just a part of the PCI Express traffic that was recorded. If you save a portion
of a CATC Trace file, it can get significantly smaller, allowing you to attach it to an e-mail.
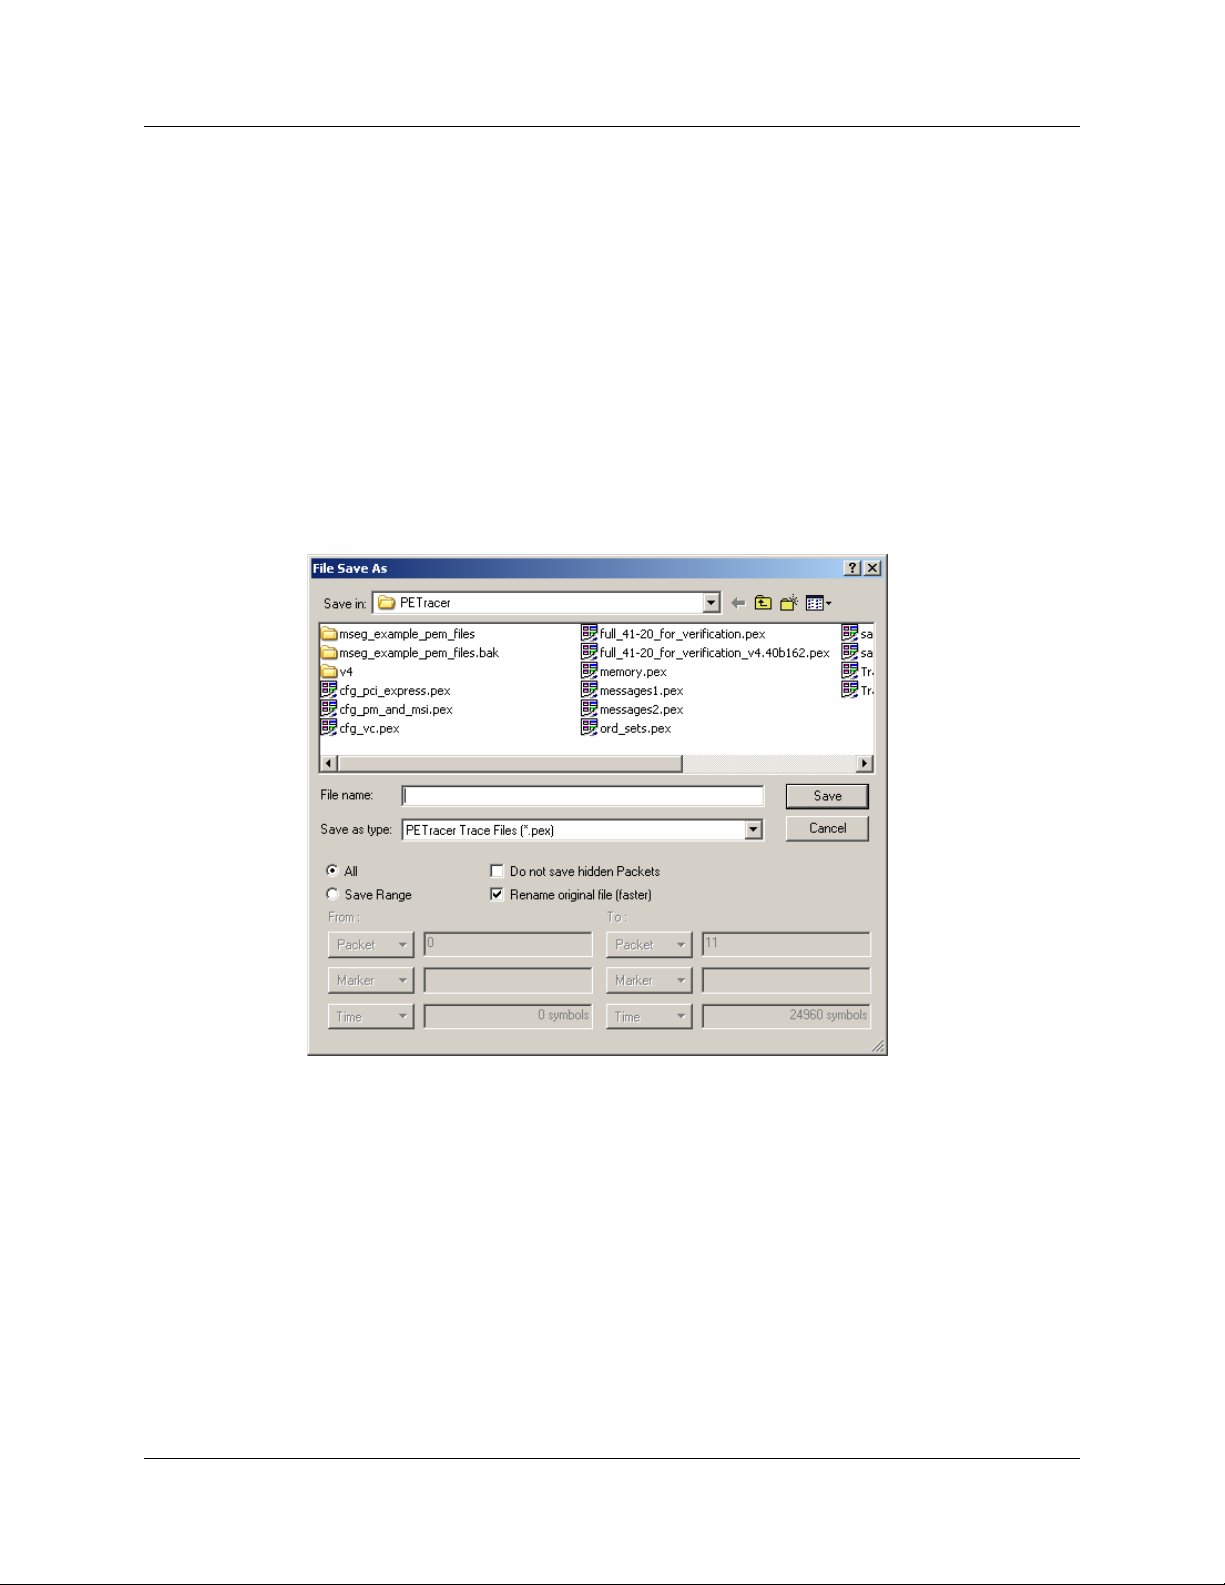
To save a portion of a CATC Trace file or the whole file to a unique name, select Save As
from the File menu.
If you want to give a unique name to the CATC Trace file, select the All option and keep
Rename original file checked. This is the default setting for the dialog.
Saving a Portion of a CATC Trace
If you want to save a portion of a CATC Trace file, select Save packet range. Enter
starting and ending packet numbers in the From Packet and To Packet fields. By default,
it has the numbers of the first and the last packets in the file. The software is going to save
all the packets in specified range to the new file, unless you have Do not save hidden
packets checked. In this case it is going to save all packets in the range, EXCLUDING
the currently hidden packets.
LeCroy Corporation 17
Page 24
Chapter 4: Software Overview SimPASS PE Software User Manual
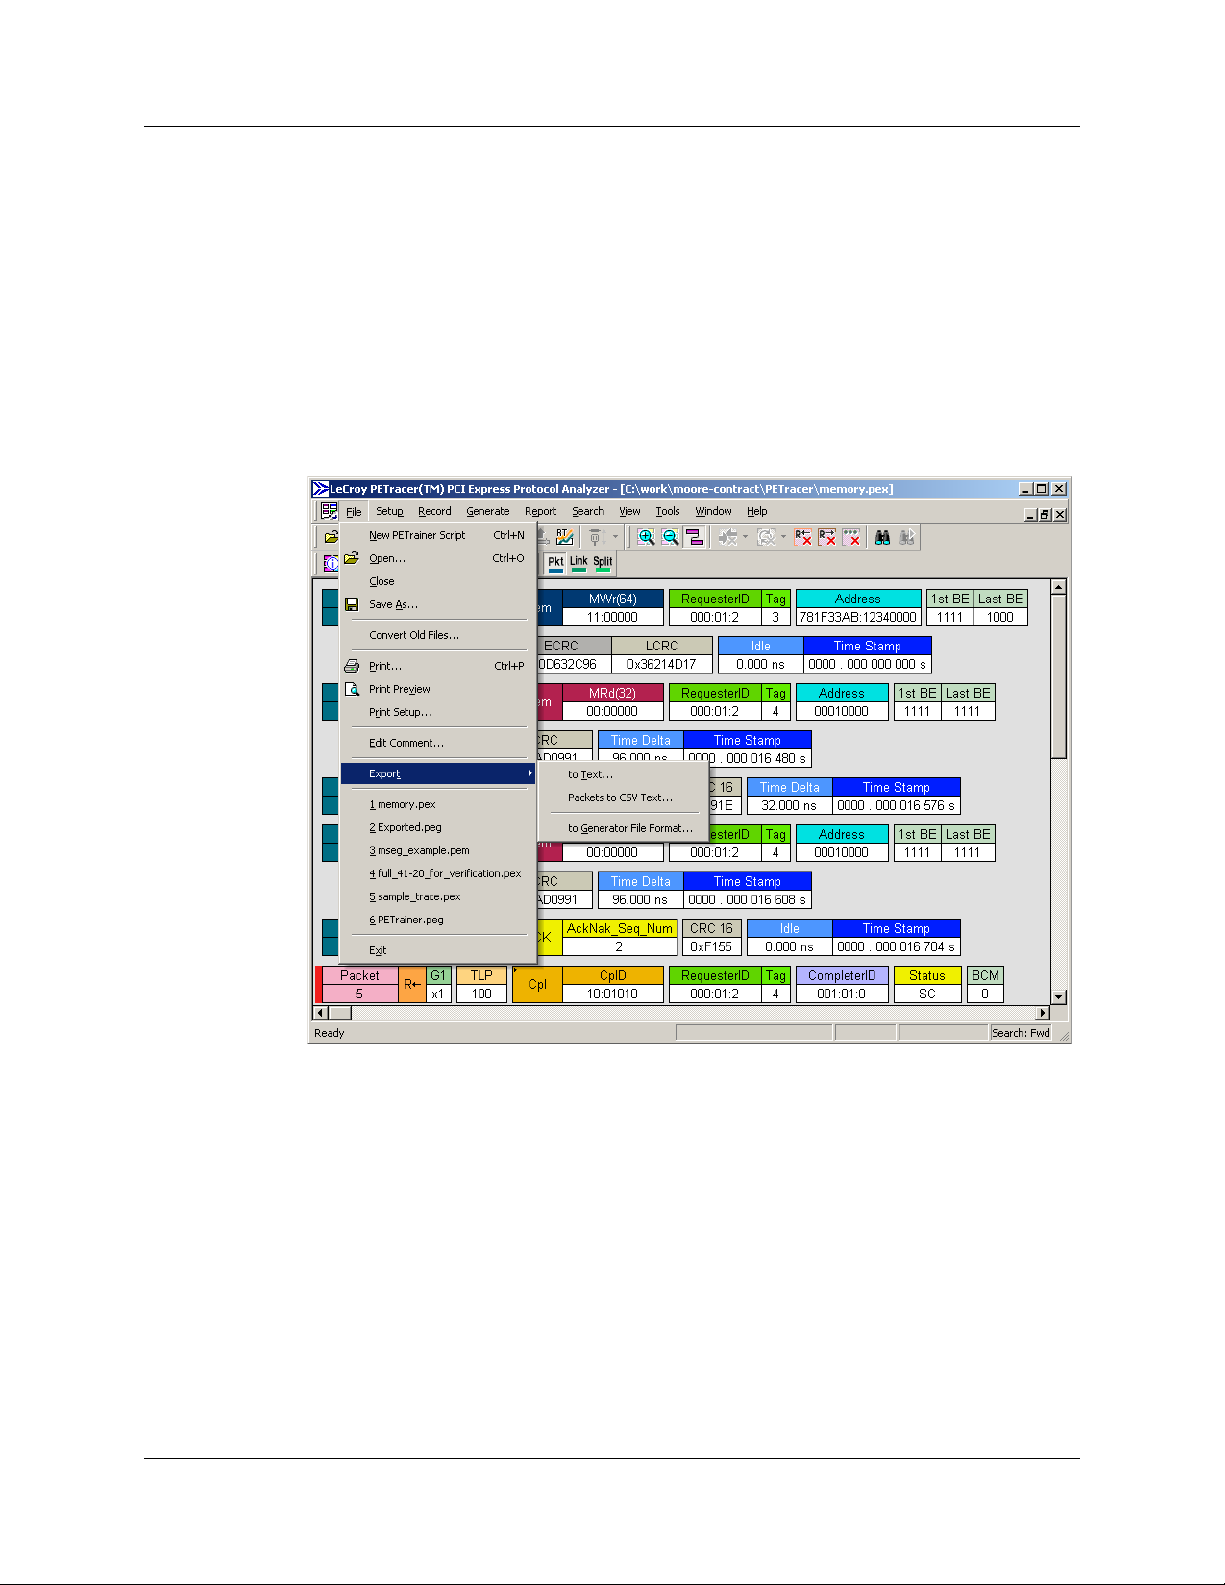
4.11 Exporting a CATC Trace File
By default, SimPASS PE saves CATC Trace files in the .pex format. However, you can
export a CATC Trace to a file in any of the following other formats:
•Text
• Comma Separated Value (CSV)
• Generator file format
Exporting to Generator file format is a simple way to create a script file from your
CATC Trace.
To export a CATC Trace file, select File > Export:
18 LeCroy Corporation
Page 25
SimPASS PE Software User Manual Chapter 4: Software Overview
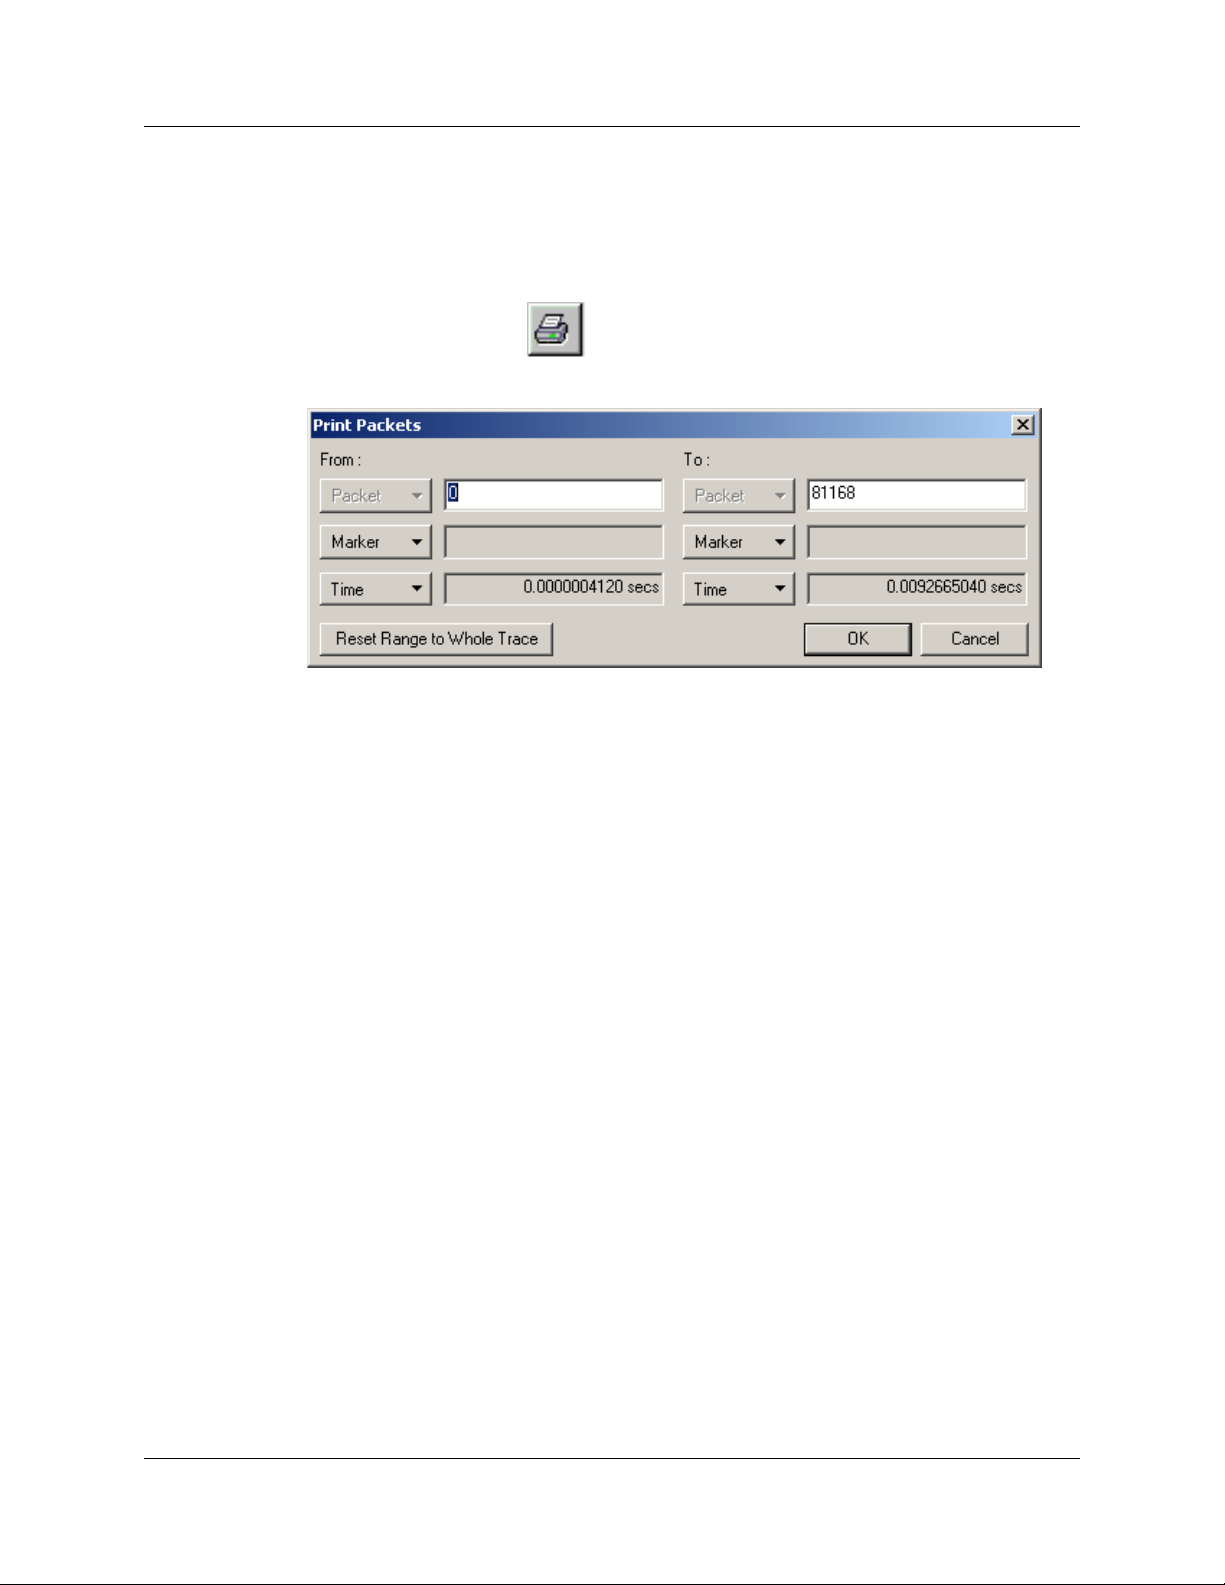
4.12 Printing Data Files
To print all or part of the open CATC Trace:
Step 1 Select File > Print from the menu or
click the Printer button on the toolbar.
The Print Packets dialog opens:
Step 2 To select a range of packets, enter values in the From packet # and To
packet # fields and click Print.
Step 3 To print an entire file, leave the From and To fields empty and click Print.
The specified traffic information is printed as currently displayed, in color or gray scale as
supported by your printer. Any CATC Trace File comments you entered are printed
following the current document name at the top of each page.
Note: CATC Trace File comments can be created by using Edit Comment on the File
menu.
LeCroy Corporation 19
Page 26
Chapter 5: Reading CATC Traces SimPASS PE Software User Manual
Chapter 5: Reading CATC Traces
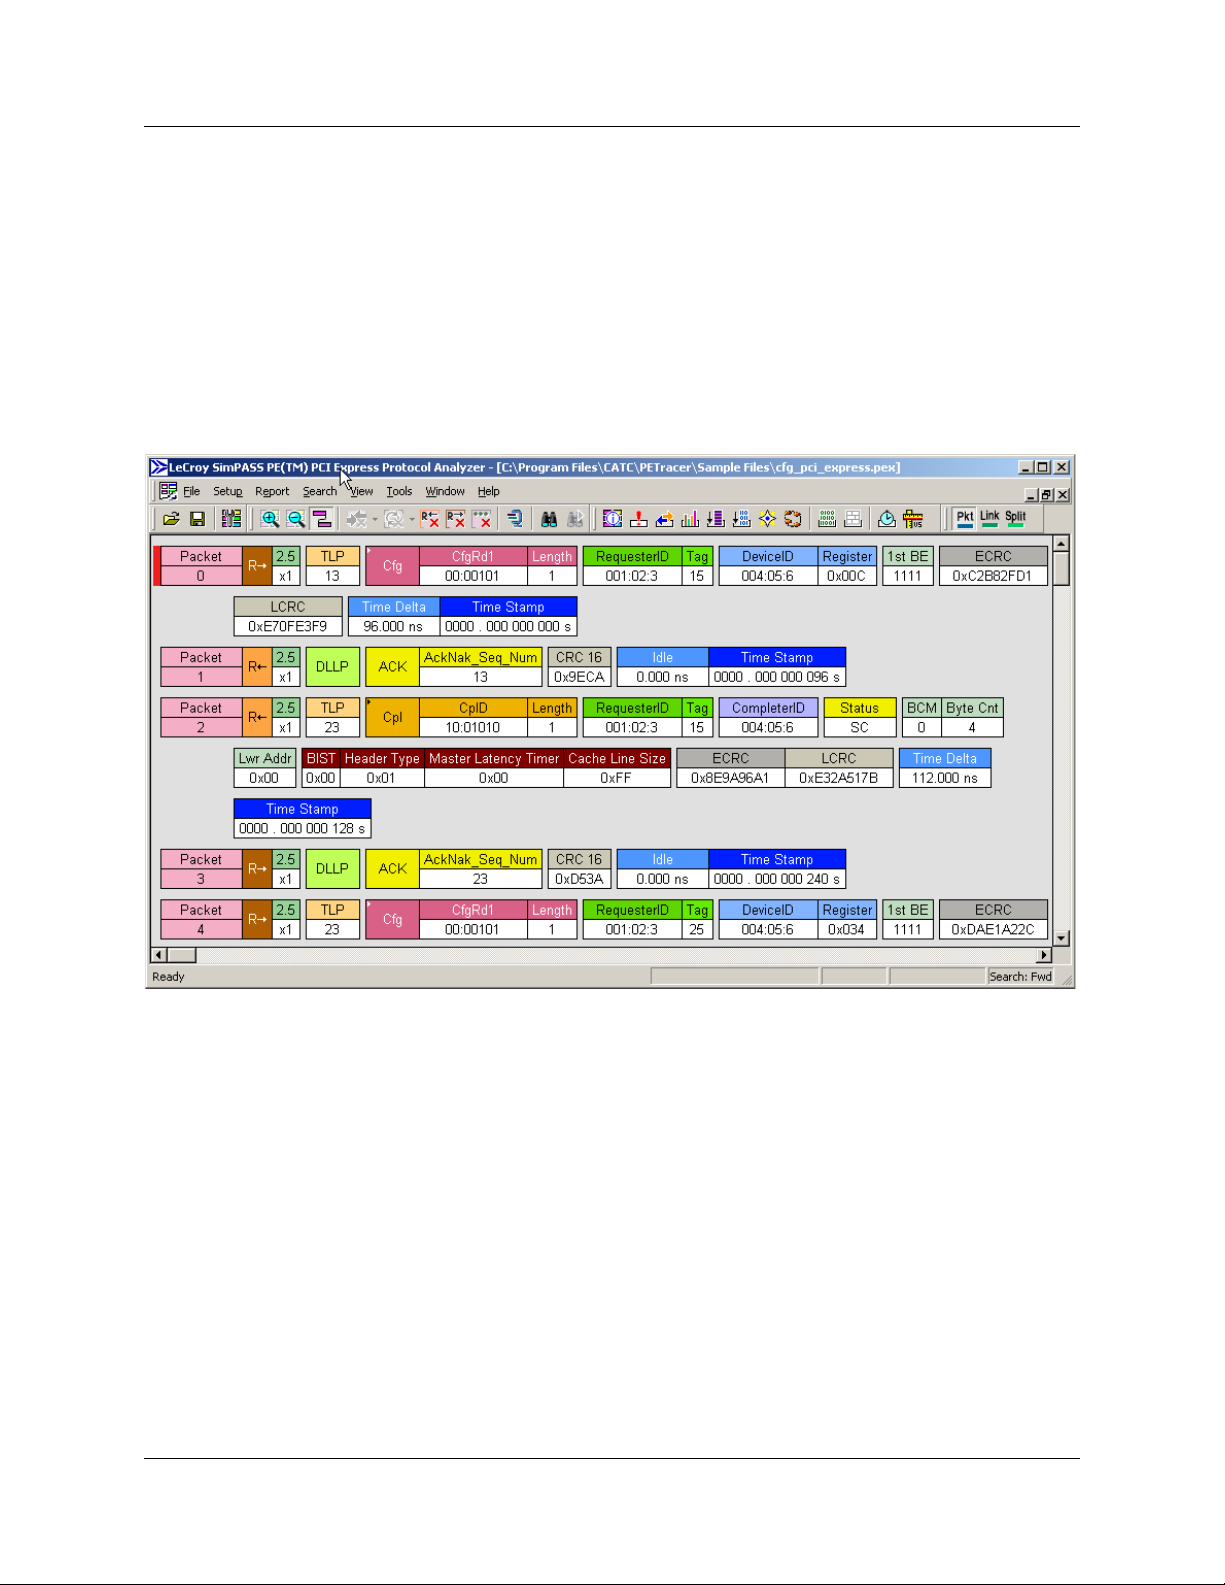
5.1 Viewing PCI Express CATC Traces
SimPASS PE™ displays traffic as labeled, color-coded, and time-stamped rows.
Tool tips provide details about fields within the CATC Trace. Hold the mouse cursor over
a field to see a tool tip.
Additional information is available from pop-up menus. For example, if you click the left
mouse button on the first cell in a packet a menu appears with an option to view
Raw 10b Codes.
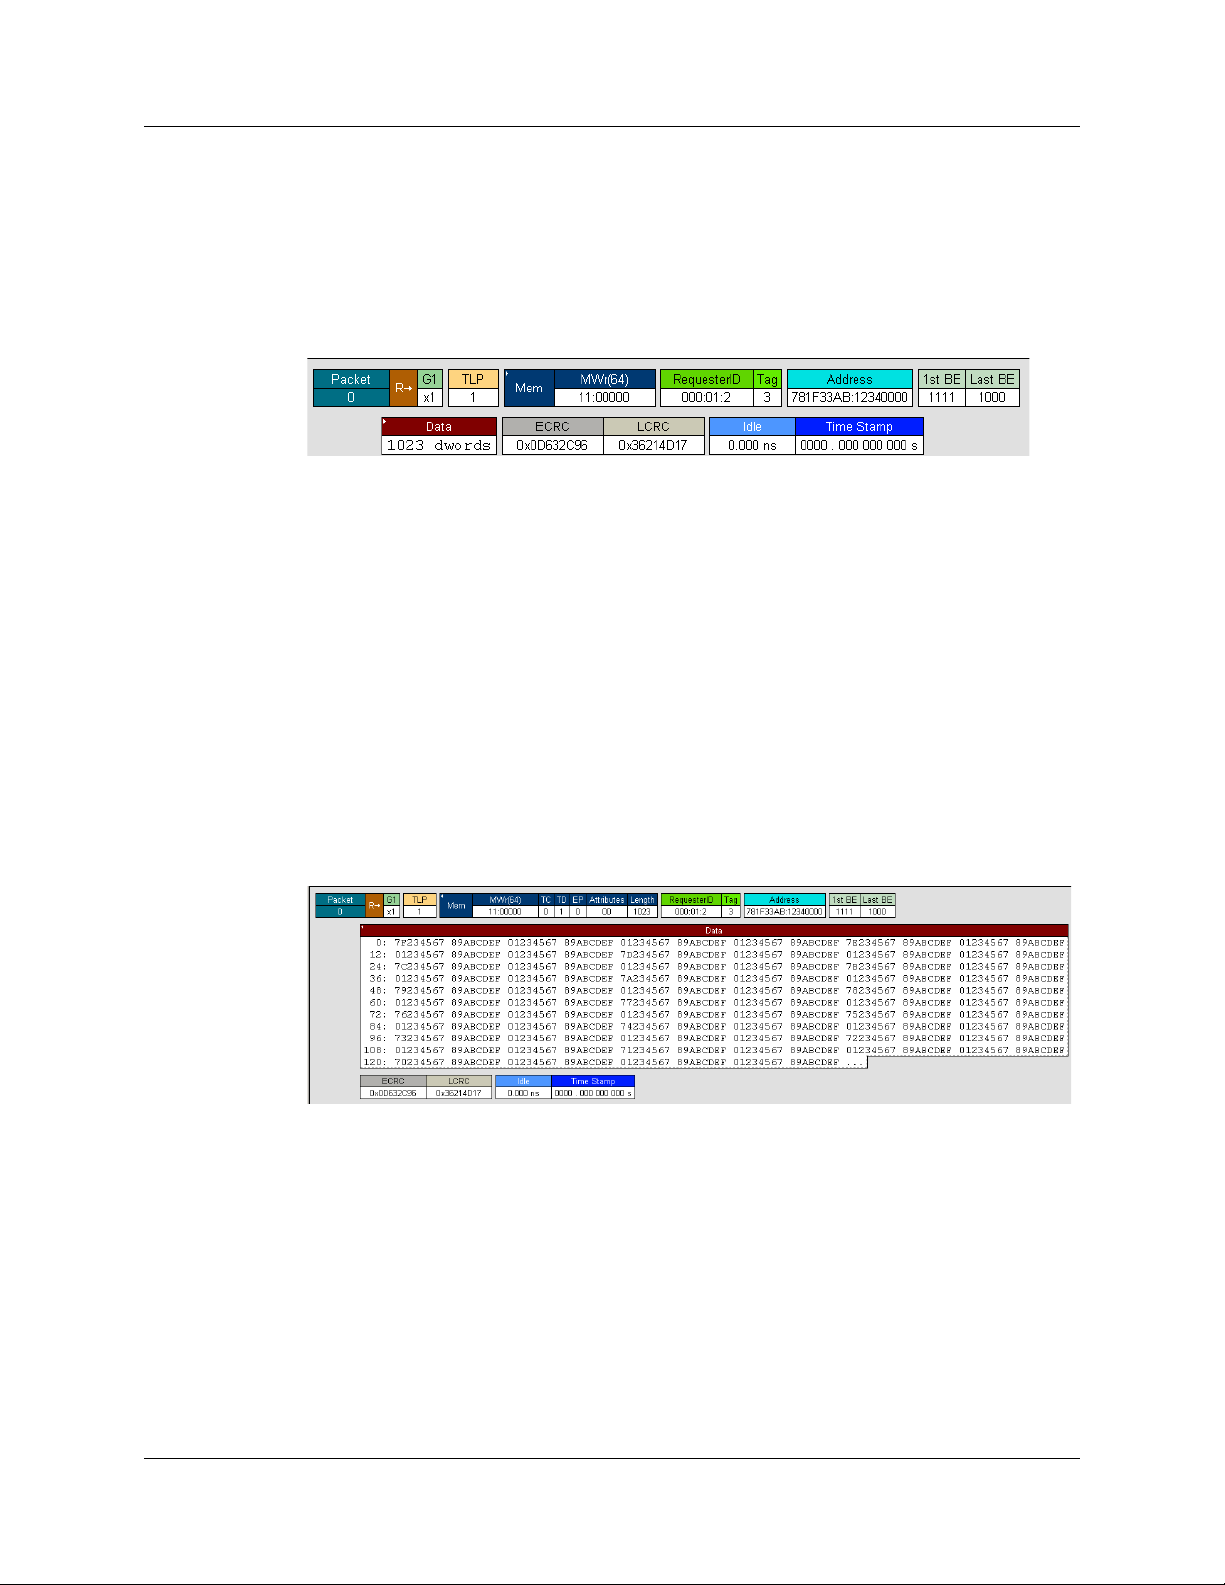
5.2 Expand and Collapse Data Fields
Packet data fields are displayed in a short format by default.
You can view a data field’s long format by performing one of the following three actions:
• Click the small triangle in the left corner.
• Double-click anywhere in the data field.
• Click once in the Data Field with the left mouse button, then choose
Expand Data from the pop-up menu.
A repeat of any above methods causes the display to return to a Short Data format.
5.3 Resizing Cells
Data cells can be resized by pointing the mouse pointer on the edge of a data cell,
depressing and holding the left mouse button, and then repositioning the mouse pointer
while keeping the mouse button depressed.
20 LeCroy Corporation
Page 27
SimPASS PE Software User Manual Chapter 5: Reading CATC Traces
5.4 Pop-up Menus
The Analyzer software makes extensive use of pop-up menus. In some instances,
pop-up menus provide the only means of accessing dialog boxes that contain detailed
information about cells within the CATC Trace, for example, the Show Configuration
Space dialog box.
To see a pop-up menu, left-click or right-click a cell within the CATC Trace. Right-click or
left-click behavior depends on the Display Options setting. For default left-click, the
right-click menu is not cell-dependent. For other left-click behavior, the type of menu that
opens varies depending on the type of cell that is selected. Take some time to explore
CATC Traces and the various pop-up menus.
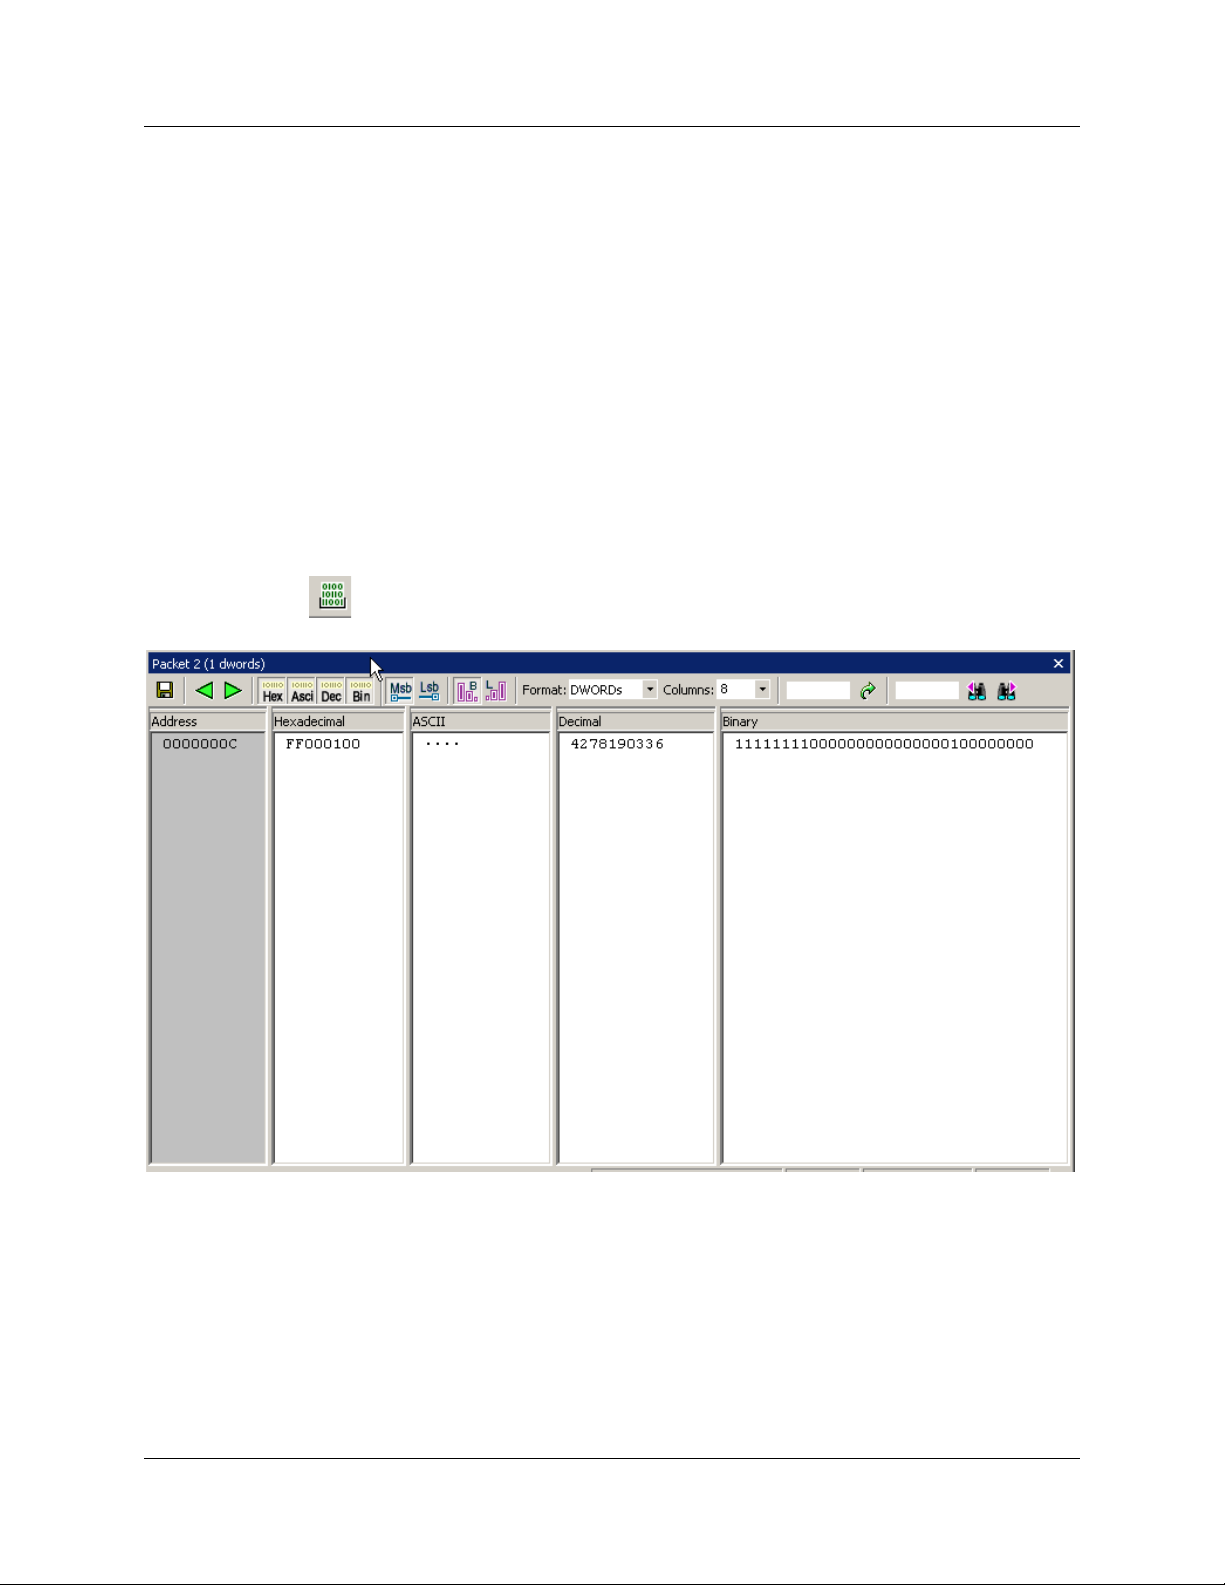
5.5 View Data Block
To view the raw bits that make up the data in a data field, left-click a data field, then click
or select View Data Block from the pop-up menu to display the Data Block window.
You can display data in Hexadecimal, ASCII, Decimal, or Binary formats.
Bit Order is Most Significant Bit or Least Significant Bit.
You can display data in Big Endian or Little Endian.
Format lets you display data as BYTEs, WORDs, or DWORDs.
Columns lets you select the number of columns.
You can enter hexadecimal offset values.
You can go to or search Previous or Next.
LeCroy Corporation 21
Page 28
Chapter 5: Reading CATC Traces SimPASS PE Software User Manual
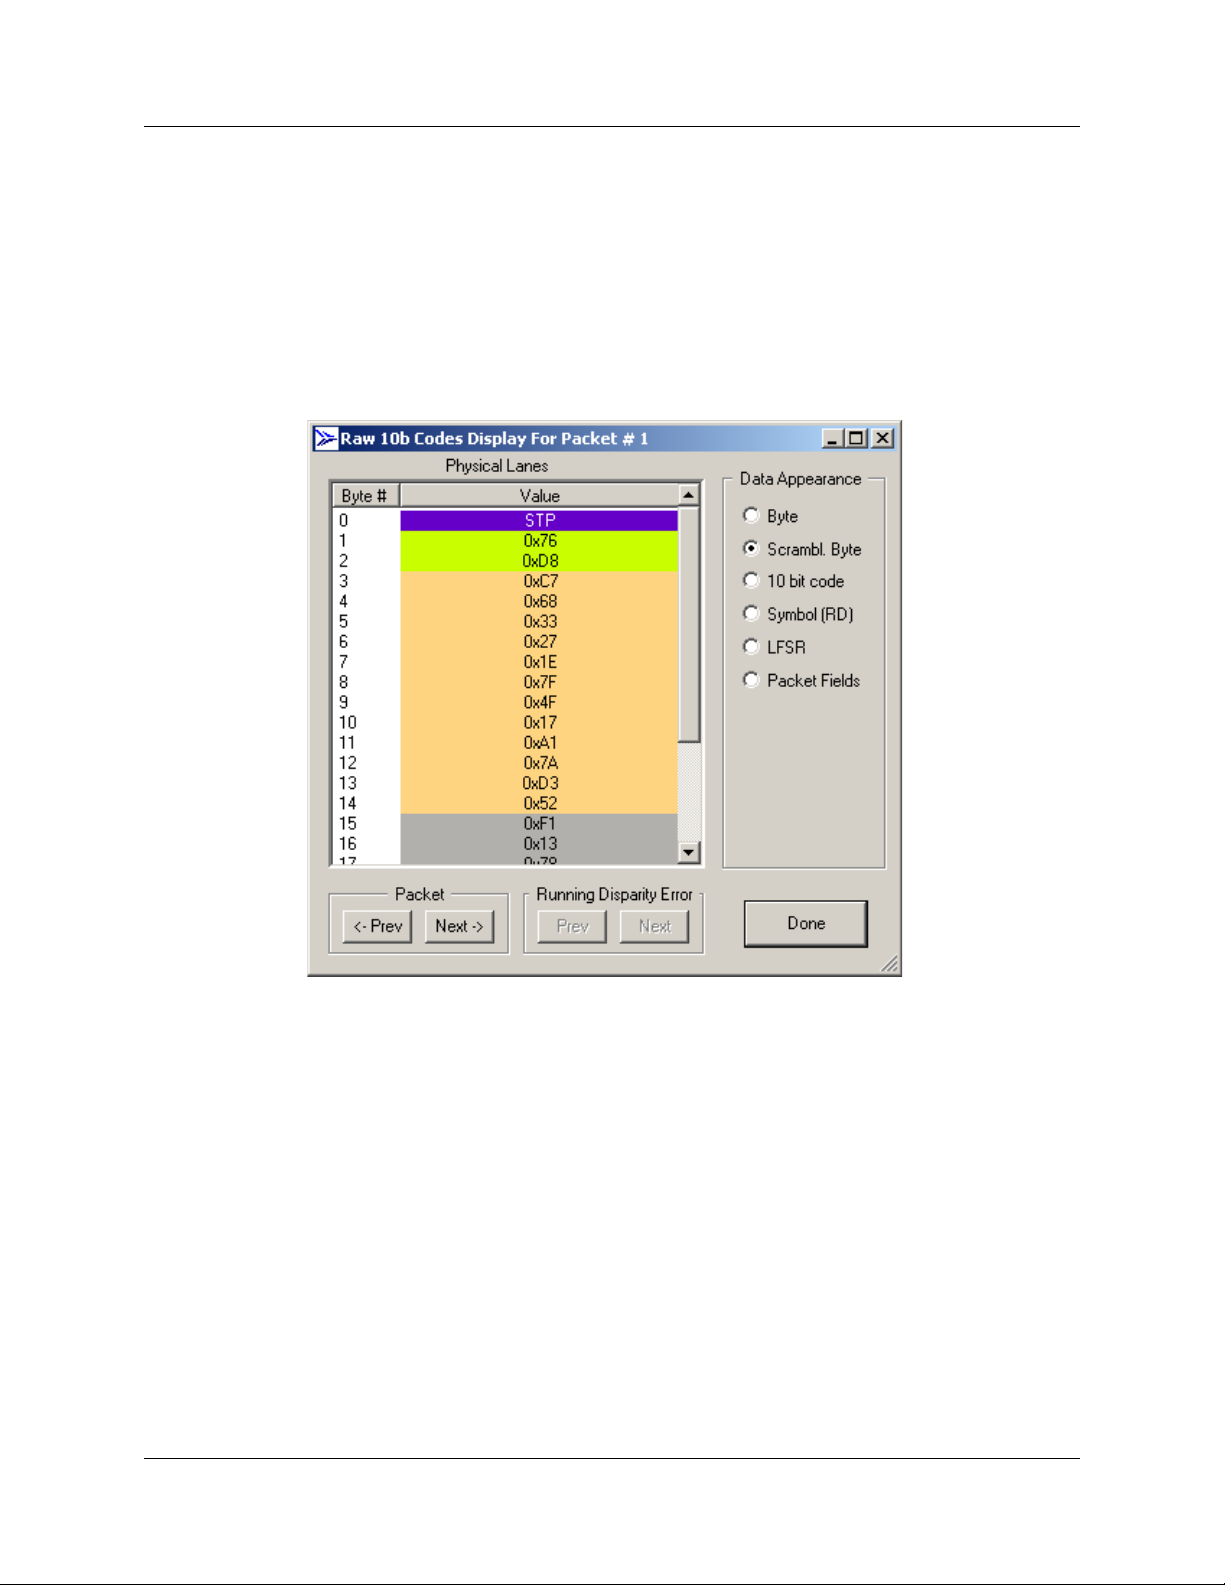
5.6 Show Raw 10b Codes
You can view the raw bits that make up the data field by left-clicking the field and selecting
View Data Block from the pop-up menu.
To view Raw 10b Codes:
Step 1 Left-click the first cell in a packet.
Step 2 Select Show Raw 10b Codes from the pop-up menu to display the
Raw 10b Codes window.
Step 3 To change the format of the data, use the options along the right side of
the dialog.
Step 4 To navigate the CATC Trace, use the Prev and Next buttons.
22 LeCroy Corporation
Page 29
SimPASS PE Software User Manual Chapter 5: Reading CATC Traces
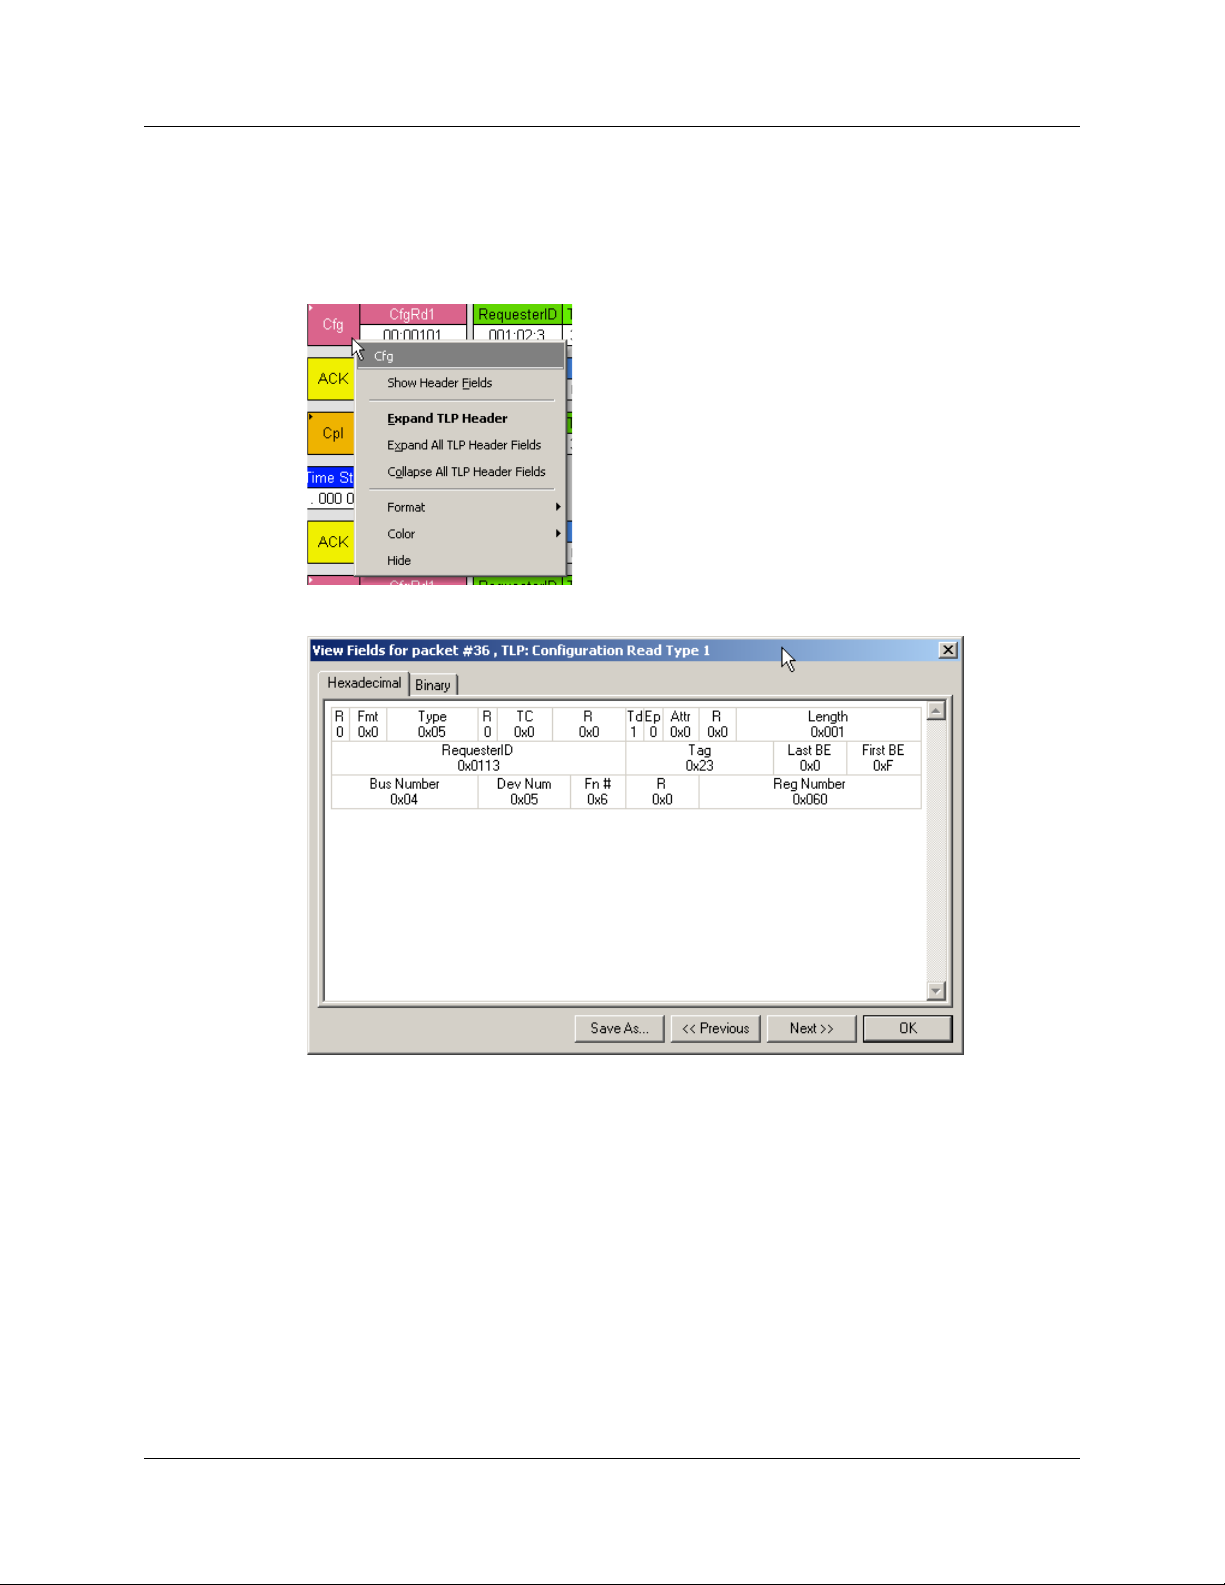
5.7 Show Header Fields
You can view details about header fields by opening the Show Header Fields dialog box.
Step 1 Click a header. A pop-up menu appears.
Step 2 Select Show Header Fields. The following dialog box opens.
Step 3 Use the Prev and Next buttons to navigate to other headers.
LeCroy Corporation 23
Page 30
Chapter 5: Reading CATC Traces SimPASS PE Software User Manual
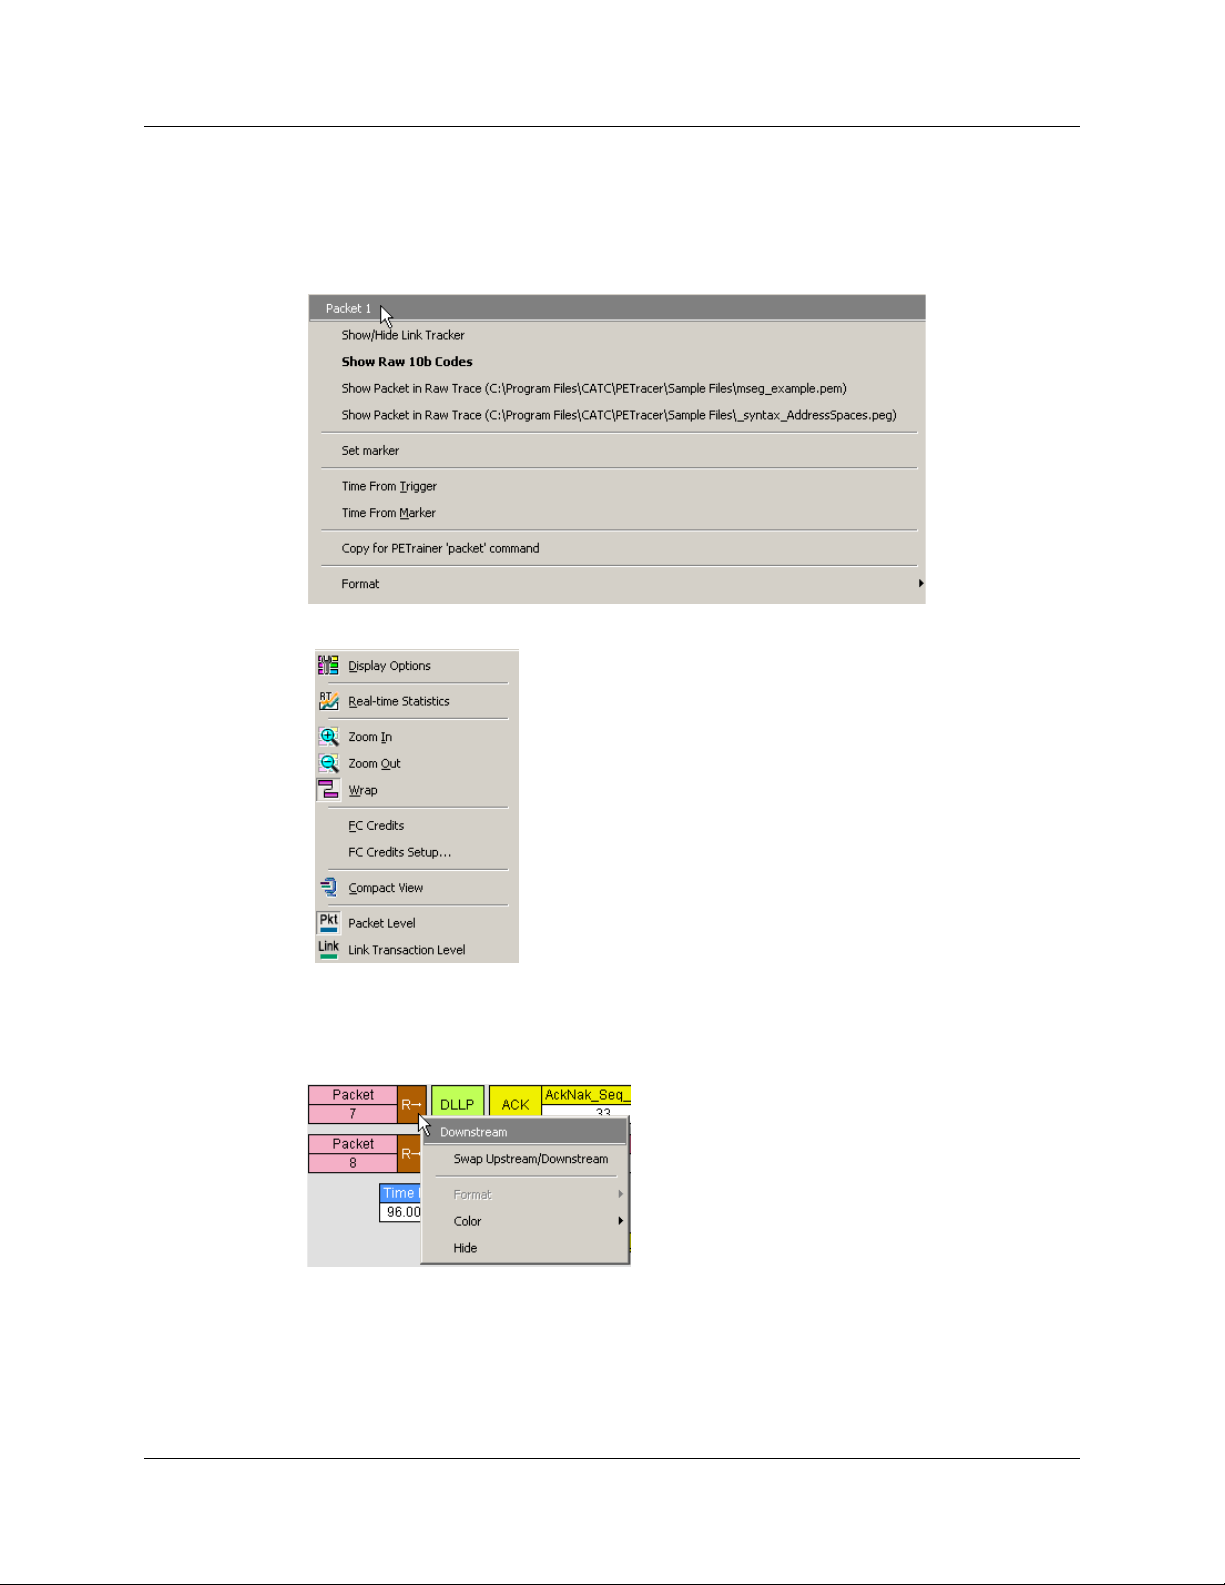
5.8 Packet Cell Popup Menus
The Packet cell has a left-click pop-up menu that includes the Show Raw 10b Codes
command:
The right-click pop-up menu from Packet cell is:
Packet Header R-> Cell Popup Menu
The Packet Header R-> cell has a pop-up menu with the Swap Upstream/Downstream
command, which changes the directionality of the packets in the CATC Trace.
24 LeCroy Corporation
Page 31

SimPASS PE Software User Manual Chapter 5: Reading CATC Traces
Packet Header G1 Cell Popup Menu
The Packet Header G1 cell has a pop-up menu with the Show Header Fields command
(see “Show Header Fields” on page 23), which exposes a detailed view of the selected
Header field.
LeCroy Corporation 25
Page 32

Chapter 5: Reading CATC Traces SimPASS PE Software User Manual
5.9 Set Marker
A marker is a unique label for a packet that allows you to go to that packet and also serves
as a comment string for a specific packet. When you select a marker, the identified
packet appears at the top of the screen. Packets that have been marked have a red bar
on the left edge.
To set a marker, perform the following steps:
Step 1 Left-click the Packet field of the packet you want to mark.
Step 2 Click Set Marker.
Step 3 When the Edit Marker for Packet # pop-up appears, enter a unique
identifier for the packet in the Comment field.
Later, you can go directly to this packet using the Go To Marker operation in the Search
Menu.
26 LeCroy Corporation
Page 33

SimPASS PE Software User Manual Chapter 5: Reading CATC Traces
5.10 Edit or Clear Marker
To change a markers identifier, or clear (delete) the marker:
Step 1 Left-click the Packet field of the desired packet to display a pop-up
menu:
Step 2 Choose Edit Marker and enter a new identifier into the
Edit Marker for Packer # pop-up, or
Choose Clear Marker. When you choose Clear Marker, the marker is
removed and the red line disappears.
LeCroy Corporation 27
Page 34

Chapter 5: Reading CATC Traces SimPASS PE Software User Manual
5.11 Decoding Traffic
The SimPASS PE software has three decode levels:
Packet
Packet level decode includes all TLP packets, DLLP packets, and all ordered sets.
Link
Link level decode is composed of TLP packets matched with a corresponding ACK
or NAK coming from the opposite direction.
Split
Split level decode is composed of two Link transactions, the Request TLP and the
Completion TLP from the other direction.
28 LeCroy Corporation
Page 35

SimPASS PE Software User Manual Chapter 6: Searching CATC Traces
Chapter 6: Searching CATC Traces
This chapter describes how to search for CATC Trace events.
6.1 CATC Trace Search Overview
Several search commands let you navigate a CATC Trace view to search for key events,
such as errors and triggers.
To view the search options, click Search in the Menu bar.
6.2 Go to Trigger
To position a trigger packet at the top of the screen:
•Select Search > Go to Trigger.
6.3 Go to Packet
To position a packet at the top of the screen:
Step 1 Select Go to Packet from the Search menu. A pop-up menu prompts
you for the packet number, marker, or time.
Step 2 Enter the packet number, marker, or time.
Step 3 Click OK.
LeCroy Corporation 29
Page 36

Chapter 6: Searching CATC Traces SimPASS PE Software User Manual
6.4 Go to Time
To position a specific time at the top of the screen:
Step 1 Select Go to Time from the Search menu. A pop-up menu prompts you
for the time in Seconds or Clocks.
Step 2 Enter the time and format (seconds or clocks).
Step 3 Click Go.
6.5 Go To Marker
Use this operation to go directly to a specific packet that has been marked with a unique
marker by the Set Marker operation.
To go to a marker:
Step 1 Select Go To Marker from the Search Menu.
Step 2 Select the marker you want from the fly-out menu.
Alternatively, select All Markers to display the All Markers window, then
select a marker and click Goto.
The packet you want appears at the top of the screen. Marked packets have a red bar on
the left edge.
30 LeCroy Corporation
Page 37

SimPASS PE Software User Manual Chapter 6: Searching CATC Traces
6.6 Go To Menu
The Go To menu in the Search menu provides a quick way to search for a packet based
on a simple condition. You can search for the following types of events:
• TLP Type
•DLLP Type
• Ordered Set
• Link Event
• Traffic Class
• DLLP Virtual Channel
• TLP Virtual Channel
• Direction
• Speed
• Link Width
• Requester ID
• Completer ID
• Data Lengths
•Errors
6.7 Search Direction
Search direction can be toggled back and forth by using the command under the Search
menu. Search Direction controls the direction of the search. Each time Search Direction
is selected, the search order is reversed. For example, if the previous search was
forward, choosing Search Direction toggles the current search to backward.
To verify the direction of a search look at the lower right corner of the screen.
Search: Bwd or Search: Fwd should appear. If a direction is not indicated, it means that
the status bar is turned off.
To turn on the Status bar, select from the menu View > Status Bar.
Keyboard shortcuts can also be used to control search direction:
• Control-f means Search Forward.
• Control-b means Search Backward.
LeCroy Corporation 31
Page 38

Chapter 6: Searching CATC Traces SimPASS PE Software User Manual
6.8 Find
Find allows you to conduct complex searches in a CATC Trace. You can search by
protocol level (Packets, Link Transactions, Split Transactions).
You can search packets by Event Group: TLP Type, TLP Header,
TLP Prefix (Summit T2-16 only), TLP Requester ID, TLP Completer ID,
TLP Data Pattern, TLP Data Lengths, TLP Tag, TLP Sequence Number, DLLP Type,
DLLP Header, DLLP Virtual Channel, ACK/NAK Seq Number, Ordered Sets, Link Event,
Direction, Errors.
You can search link transactions by Event Group: TLP Type, Traffic Class,
Virtual Channel, Direction, Requester ID, Completer ID, Status, Tag.
You can search split transactions by Event Group: TLP Type, Traffic Class,
Virtual Channel, Direction, Requester ID, Completer ID, Status, Tag.
The options Union, Intersection, and Exclusion allow you to create complex searches
such as “Find x OR y” or “Exclude all x or y.”
To find a item:
Step 1 Open a CATC Trace.
Step 2 Open Find by selecting Search > Find from the menu or clicking .
Step 3 From the Search For menu, select a display level such as Packets.
To search multiple levels, finish steps 3 to 9, and then repeat 3 to 9 for
each additional display level.
32 LeCroy Corporation
Page 39

SimPASS PE Software User Manual Chapter 6: Searching CATC Traces
Step 4 From the Event Groups menu, select an Event Group. The menu in the
far right of the dialog box is context sensitive and changes to reflect the
options for that group.
Step 5 In the menu in the far right, select one or more items.
Step 6 Repeat Step 5 for each Event Group of interest for the selected display
level.
Step 7 Under Direction, select Forward or Backward to select a search
direction.
Step 8 Under Origin, select a starting point for the search.
Step 9 Under Combining Specified Event Groups, select
The options Union, Intersection, and Exclusion let you set conditions on your
searches:
• Union: To search for any of the selected criteria.
Example: “Find packets with ANY of the following characteristics …”
• Intersection: To search for all of the selected criteria.
Example: “Find packets with ALL of the following characteristics …”
• Exclude: To exclude items from a search. This option works in conjunction
with Union and Intersection. You select Union and Exclude to exclude any of
the specified traffic. You select Intersection and Exclude to exclude all of the
specified traffic.
Example: “Exclude packets with ANY of the following …” or
“Exclude packets with ALL of the following …”
Step 10 Repeat Steps 3 through 9 for additional display levels.
Step 11 Find All displays all matching packets or transactions in a separate
view.
Step 12 Search in Hidden includes hidden packets or transactions in the
search.
Step 13 Click OK.
LeCroy Corporation 33
Page 40

Chapter 6: Searching CATC Traces SimPASS PE Software User Manual
Event Groups
The Event Groups for Packets are:
• TLP Type
• TLP Header
• TLP Prefix (Summit T2-16 only)
• TLP Requester ID
• TLP Completer ID
• TLP Data Pattern
• TLP Data Lengths
• TLP Traffic Class
•TLP Tag
• TLP Sequence Number
•DLLP Type
• DLLP Header
• DLLP Virtual Channel
• ACK/NAK Seq Number
• Ordered Sets
• Link Event
• Direction
•Errors
The Event Groups for Link Transactions and Split Transactions are:
• TLP Type
• Traffic Class
• Virtual Channel
• Direction
• RequesterID
• CompleterID
•Status
•Tag
6.9 Search for the Next Packet Type
Use Find Next or click to search for the next packet meeting the search criteria.
34 LeCroy Corporation
Page 41

SimPASS PE Software User Manual Chapter 7: Display Options
Chapter 7: Display Options
7.1 Setting Display Options
Display Options allow you to customize the colors and formats of displayed traffic.
To open the Display Options dialog at the General tab, Select Setup > Display Options
from the menu or
click the Display Options button on the toolbar.
LeCroy Corporation 35
Page 42

Chapter 7: Display Options SimPASS PE Software User Manual
7.2 Specifying General Display Options
The Display Options General tab allows you to specify:
Zoom Level: Defines the size of packet fields in the packet view. Zoom level is adjustable
as 10, 20, 40, 60, 80, 100, 120, 140, 160, 180 and 200 percent.
Enable Tool tips: Allows information to be displayed on a packet by resting your mouse
pointer over it.
Wrap: Allows packets, Link Transactions, and Split Transactions to wrap within the
display.
Right click cell context menu: Swaps mouse functions.
Hierarchy Lines: Adds lines to the trace view indicating relations between packets,
Link Transactions, and Split Transactions.
Timestamp position: Moves timestamp location from end of packet to beginning of
packet, or merges it with the packet number.
Trace Viewing Level: Allows the CATC Trace to be displayed in different hierarchical
levels: Packets, Link Transactions, and Split Transactions.
Time Stamp: Gives you options for setting the timestamp to zero for either the first
CATC Trace packet or the trigger packet or for leaving the stamp unchanged as it was
originally recorded.
Analysis Tools Checkboxes
Error Report: Opens Traffic Summary window and displays list of errors that occurred in
the CATC Trace.
Timing Calculator: Opens Timing Calculator dialog for calculating timing between
events.
Traffic Summary: Displays a table of events that occurred in the CATC Trace.
Bus Utilization: Opens a graph of bus usage in the open CATC Trace.
Link Tracker: Opens window that displays traffic on a per lane basis in a strictly
chronological view.
Navigator: Displays/Hides Navigation bar. The Navigation bar lets you see in a glance
the position of errors and triggers in a CATC Trace and narrow the range of traffic
displayed in the CATC Trace window.
Data: Displays packet payload information in various formats.
Real-Time Statistics: Opens a dialog that displays a graph of bus activity on the DUT in
real-time, as well as other statistical information.
Fonts
Fonts: Allows the appearance of field text and/or data text to be defined.
36 LeCroy Corporation
Page 43

SimPASS PE Software User Manual Chapter 7: Display Options
Configuration Name
Display Configuration Name: This field is used to enter a text string to be associated
with the current set of Display Options. This name is saved with the Display Options file,
and appears as part of the title of the packet view window that uses this set of Display
Options.
7.3 Color, Format, and Hiding Options
The Color/Format/Hiding tab allows you to customize the colors and formats associated
with each field in the CATC Trace and to selectively hide fields or packets. You access
these display options by selecting Setup > Display Options > Color/Format/Hiding
tab.
The Color/Format/Hiding property page lets you set how fields display in a CATC Trace.
This property page lets you set field color and data format (binary, hex, decimal, ASCII),
and lets you hide selected fields from the display.
Setting Field Colors
The Field Colors tab allows you to customize the colors associated with each field used
in the packet view.
You may experiment with this option to achieve a color combination that suits you.
LeCroy Corporation 37
Page 44

Chapter 7: Display Options SimPASS PE Software User Manual
Select or change the trigger color using the color buttons labeled - Packet # and
+ Packet # (before and after trigger) found under the Packet# section of the Field Colors
window.
You select or change a color by clicking the appropriate color button. This action causes
a color palette to pop up. Select the desired color and press OK.
Step 1 Click View > Set Display Options to open the Display Options dialog
box.
Step 2 Select the Color/Format/Hiding property page.
Step 3 Under the Group and Colors column, click the plus symbol (+) next to
the group you want to reformat. The group expands to show the
individual fields within the group. Each field has a color, as shown below:
Step 4 Click the colored cell that you want to change. A color palette appears.
Step 5 Click a color in the palette, then click Apply or OK.
Note: The colors of the following Frame types cannot be changed:
• Invalid Data (frame error) field (red)
• Softbit Errors (yellow)
38 LeCroy Corporation
Page 45

SimPASS PE Software User Manual Chapter 7: Display Options
You can also change color by left-clicking a field in the CATC Trace and selecting Color
from the pop-up menu.
LeCroy Corporation 39
Page 46

Chapter 7: Display Options SimPASS PE Software User Manual
Changing Field Formats
The Field Formats tab allows you to define the way various numeric fields are shown in
the packet display. You can select Hexadecimal, Decimal, Binary, or ASCII for certain
fields or groups of fields.
To change a field's format, click the plus sign (+) next to a field in the list. This causes the
selected item to expand so you can see its constituent sub-fields. Select a sub-field, and
then choose the format from the formatting choices that appear at the bottom of the
window.
To change the format of alphanumeric characters in a field:
Step 1 Under the Group and Colors column, click the plus symbol (+) next to
the group you want to reformat. The group expands to show the
individual fields within the group (as shown above).
Step 2 Click the row representing the field that you want to reformat. If the field
can be reformatted, the format options at the top of the dialog box
become active, as shown below:
Step 3 Select a format.
40 LeCroy Corporation
Page 47

SimPASS PE Software User Manual Chapter 7: Display Options
Step 4 Specify the bit order in the displayed fields by checking/unchecking the
MSB > LSB checkboxes.
Step 5 Click Apply or OK.
Hiding Fields
To hide a field:
Step 1 Under the Group and Colors column, click the plus symbol (+) next to
the group that has the field(s) you want to hide. The group expands to
show the individual fields within the group (as shown above).
Step 2 Click the checkbox in the row representing the field that you want to
hide.
Step 3 Click Apply or OK.
LeCroy Corporation 41
Page 48

Chapter 7: Display Options SimPASS PE Software User Manual
Hiding Levels
The Level Hiding page lets you hide traffic by Event Group. If you select one or more
event types from the Event Group list, the selected types are hidden from the
CATC Trace.
To hide a level:
Step 1 Select an Event Group.
Step 2 Select whether to Hide or Show selected items.
Step 3 Select Upstream, Downstream, or Any Direction.
Step 4 (optional) Select Compact EIEOS packets.
Step 5 Click OK.
42 LeCroy Corporation
Page 49

SimPASS PE Software User Manual Chapter 7: Display Options
The Event Groups for Packets are:
• TLP Type
• TLP Header
• TLP Requester ID
• TLP Completer ID
• TLP Data Pattern
• TLP Data Lengths
• TLP Traffic Class
•TLP Tag
• TLP Sequence Number
•DLLP Type
• DLLP Header
• DLLP Virtual Channel
• ACK/NAK Seq Number
• Ordered Sets
• Link Event
• Direction
•Errors
The Event Groups for Link Transactions and Split Transactions are:
• TLP Type
• Traffic Class
• Virtual Channel
• Direction
• RequesterID
• CompleterID
•Status
•Tag
LeCroy Corporation 43
Page 50

Chapter 7: Display Options SimPASS PE Software User Manual
7.4 Load a Previously Saved Display Options File
If you have previously saved Display Options, you can load them by opening the Display
Options dialog and clicking the Load button. A dialog box opens to let you load a
previously saved display options file.
Step 1 Click Load to use a previously defined display options file.
Step 2 When you see the Open File pop-up window, enter the name of the file
you want to load and click Open.
Step 3 When the SimPASS PE™ software returns you to the Recording Options
menu, click OK to activate the display options you selected.
7.5 Saving Display Options
If you have customized the Display Options and wish to save them, you can do so by
clicking the Save button, then entering a unique file name. The .opt extension is added
by default.
Setting the Defaults: Save the currently specified Display Options to the file name:
default.opt by clicking Save As Default. When the Analyzer software begins execution,
it automatically loads the default.opt file, if one exists.
44 LeCroy Corporation
Page 51

SimPASS PE Software User Manual Chapter 8: BitTracer Trace Files
Chapter 8: BitTracer Trace Files
8.1 Overview
Note: BitTracer is an optional feature.
BitTracer displays bi-directional link traffic in raw format. The BitTracer mode captures
and displays traffic before lane-to-lane de-skew operations and before descrambling of
10b bytes. The BitTracer mode includes support for multiple logical links (bifurcations) on
a single physical link.
The BitTracer mode has its own user interface, which provides characterizations of link
traffic that are not available in the standard protocol analyzer mode.
You can export BitTracer recordings for viewing in CATC Trace format.
8.2 Views Available for Captured Data
BitTracer mode displays captured data lane-by-lane and byte-by-byte in each direction
(upstream and downstream), with the time scale progressing left to right.
Other views are provided for timing measurements, marker placement, physical layer
errors, captured symbol types, packets, events, and decoding of ordered sets and
packets. You can view any or all displays simultaneously, using the Windows selection
in the View menu.
LeCroy Corporation 45
Page 52

Chapter 8: BitTracer Trace Files SimPASS PE Software User Manual
8.3 De-Skewing Data
By default, BitTracer recordings display captured data in a raw, time-skewed format,
across all lanes in both directions. Individual bytes are as they were captured on the
recorded link, before the receiver device on the link (or the receiver logic on the
SimPASS PE analyzer) has performed lane-to-lane de-skew operations.
You can manually skew the captured data, left or right, in increments of one symbol time,
using the associated toolbar buttons.
You can automatically de-skew an entire lane direction. First, left-click on the direction in
the data window. Then right-click to display a popup menu. Then select Auto De-Skew.
You can de-skew only one direction for each right-click operation. To automatically
de-skew the opposite direction, first left-click on that direction in the data window.
8.4 Data Display Formats
To display traffic in K/D symbol (with Running Disparity indicated), scrambled,
descrambled, 10-bit, and Binary code formats:
• Use the toolbar.
• Right-click to display a menu.
• Place the cursor over any given byte to display all byte formats (including an LFSR
value) in pop-up list.
Note: Descrambled values can only be displayed after the first recorded skip ordered set.
Data prior to the skip is displayed in scrambled values, due to the unknown LFSR.
Note: For Binary Data Display Format, bits are shown in order of transmission on the bus.
46 LeCroy Corporation
Page 53

SimPASS PE Software User Manual Chapter 8: BitTracer Trace Files
8.5 Color-Coding of BitTracer Contents
To increase visual understanding of BitTracer displays, different symbol types have
color-coding:
• Presence or non-presence of a lane’s byte-lock
• Idle data characters (D0.0)
•K codes
• Invalid 10b symbols
• Signal presence
• Background of the Markers Bar (see “Markers Bar” on page 48)
(color coded according to traffic speed).
• All symbols of a TS1/TS2 ordered set
By default, these color selections match the standard color selections used in the
CATC Trace format. You can modify them in the Display Options menu, accessible from
the Main toolbar or the Setup menu.
8.6 Report and Analysis Windows
In the report windows, BitTracer mode provides several functions to analyze traffic:
• Statistical information
• Timing measurements
• Packet decoding
To activate/deactivate a report window, use Views > Windows.
You can rearrange the report windows.
All report windows are dockable.
LeCroy Corporation 47
Page 54

Chapter 8: BitTracer Trace Files SimPASS PE Software User Manual
8.7 Timing Measurements Bar
BitTracer mode provides timing measurements on captured data:
• Measurements from the Trigger position relative to user-selected X and Y markers
• X-Y measurements
• Measurements between user-defined markers
Markers Bar
The Trigger marker is at the point where BitTracer recognized the user-defined
trigger condition.
To set an X marker , left-click anywhere in the data display, except for the light gray
bar located above the data and below the directional label.
To set a Y marker .right-click anywhere in the data display, except for the light gray
bar located above the data and below the directional label.
To define a marker, select the Set Marker command in the Markers menu or use the
Toggle Marker icons in the toolbar. You can also use the Jump to Next or Previous
marker icons in the toolbar.
User-defined markers are numbered in order they were placed:
• U1 , U2, and so on in the upstream direction
• D1, D2 , and so on in downstream direction.
You can set a marker with text using the Set Marker with Text… command in the
Markers menu. After setting the marker, when the mouse pointer is on the marker symbol,
the marker text displays as a tooltip.
48 LeCroy Corporation
Page 55

SimPASS PE Software User Manual Chapter 8: BitTracer Trace Files
You can also display the Markers window, which lists all markers and their locations,
including a hyperlink for each.
Timing measurements between all combinations of X, Y, U, and Trigger cursors are in the
Timing window.
LeCroy Corporation 49
Page 56

Chapter 8: BitTracer Trace Files SimPASS PE Software User Manual
8.8 Errors Bar
BitTracer mode provides a summary of 10b errors (invalid symbols) and disparity errors
in the Errors window. The window shows the total error count and errors per-lane for each
error type. Hyperlinks allow jumps to selected errors.
BitTracer mode also highlights errors:
• Invalid symbols have a black background.
• Bytes with incorrect running disparity have red borders.
50 LeCroy Corporation
Page 57

SimPASS PE Software User Manual Chapter 8: BitTracer Trace Files
8.9 Symbols Bar
The Symbol window provides a summary of the different symbol types captured, by
quantity and direction, and includes hyperlinks for jumps to selected symbols.
Expanding the + sign at the left of each symbol provides a summary of symbols by lane.
8.10 Events Bar
The Events report window summarizes Link Up, Link Down, and Speed Switch events for
Upstream and Downstream.
Note: The table entries are hyperlinks.
LeCroy Corporation 51
Page 58

Chapter 8: BitTracer Trace Files SimPASS PE Software User Manual
8.11 Packets Bar
The Packets report window summarizes packet types detected in the file.
To obtain packet types, you must perform a post-capture “Analyze” step. After capture,
when you open the Packets Bar for the first time, items can display the command
“Analyze”. To start the analysis, click the word Analyze. After analysis finishes, the
results are saved with the file. Therefore, you do not need to click Analyze the next time.
Note: The table entries are hyperlinks.
Note: If you edit anything, the results are no longer valid, and the system requires you to
click Analyze again.
After analysis, the Packets Bar looks like the following:
52 LeCroy Corporation
Page 59

SimPASS PE Software User Manual Chapter 8: BitTracer Trace Files
8.12 Decoding Bar
If you select them in the data view, or search or jump locates a feature, BitTracer mode
displays ordered sets and packets in the Decoding window:
• Logical view is identical to CATC Trace format.
• Specification view provides a more elementary display. The Specification view
includes an option to display data in hex or binary format.
Note: Packets and ordered sets translate directly to this view from data capture and use
any post-capture skew manipulations you add, or use natural lane-to-lane skew present
on the link if you have not added post-capture skew manipulations. Typically, you would
perform an Auto De-Skew before viewing ordered sets and packets in this view.
Use the left and right arrows to search for the next or previous symbol type.
LeCroy Corporation 53
Page 60

Chapter 8: BitTracer Trace Files SimPASS PE Software User Manual
8.13 Search
To search, use the Search toolbar.
Clicking the Search icon displays the Search window.
You can copy data shown in the BitTracer display across a lane (horizontally) or across
multiple lanes (vertically), and then paste it into the Search Pattern window.
The Search Pattern window stores previous search values, which you can recall by
selecting the Search Pattern drop-down button.
In the Pattern Format section, select to search in 10-bit Codes, Scrambled Bytes, or
Descrambled Bytes format.
In the Search Order section, select to search Across Lanes (multiple lanes, vertically) or
Along Lanes (individual lanes, horizontally).
To define the direction (upstream or downstream) and the lanes on which to search, use
the Search On section.
54 LeCroy Corporation
Page 61

SimPASS PE Software User Manual Chapter 8: BitTracer Trace Files
8.14 Link Configuration
Use the toolbar icon or right-click in the data views to display the Link Configuration
dialog. This dialog allows you to associate logical lanes with physical lanes, thereby
providing support for lane bifurcation (multiple logical links on the same physical link).
After logical lanes map to physical lanes, BitTracer mode reconfigures the display to
show the selected logical link (and the logical link width, as the link width selected in the
dialog).
Use the arrows to force symbol time skew on any lane.
Use the polarity checkbox to invert lane polarity on the selected lane or use the +/- toolbar
icon.
Use the scrambling option to select a scrambling algorithm, as per specification 1.0a or
legacy specification 1.0.
LeCroy Corporation 55
Page 62

Chapter 8: BitTracer Trace Files SimPASS PE Software User Manual
Note: This dialog applies to one direction at a time (upstream or downstream). Left-click
in the direction in the data display to edit the configuration for that direction.
As you perform operations that affect display configurations, the application records
them. To undo or redo operations, use the Undo and Re-do icons on the toolbar.
56 LeCroy Corporation
Page 63

SimPASS PE Software User Manual Chapter 8: BitTracer Trace Files
8.15 Export of BitTracer Capture to CATC Trace Format
You can export BitTracer captures to standard CATC Trace file formats, selecting the
Export option from the File menu. Note: You should use the Auto De-skew feature before
using the export feature.
The exported CATC Trace keeps association information with the original BitTracer file.
Such traces scroll synchronously when you select the Synchronize Traces option in the
Windows menu.
You can navigate between BitTrace and CATC Trace using the
Show in Trace View/Show Packet in Raw Trace context menu.
Exports Involving Multiple Logical Links on One
Physical
If a single BitTrace capture contains more than one logical link, you can export each
logical link to CATC Trace format. You may then cascade or tile the various BitTracer
exports, which then scroll together in linked fashion, along with the original BitTracer file.
The Export dialog provides options to export a limited range within the BitTrace capture
and to automatically open the exported capture in CATC Trace format.
Link
8.16 Compressing and Expanding the Data View
You can compress (zoom out) the horizontal timing of the displayed data to view
higher-order link behaviors. You can expand (zoom in) to examine higher-resolution
views.
To zoom in or zoom out, right-click the data view, then select a command or select a zoom
icon on the toolbar.
Alternatively, to zoom in, left-click and drag across a desired range of data.
8.17 Opening and Saving BitTracer Captures
You can save BitTracer captures in various file types.
You can collate and archive these files for transport, using the
Export to Compressed Archive feature in the File menu.
The main BitTracer files have a *.peraw extension.
You can open these files in the SimPASS PE application using the File > Open
command.
LeCroy Corporation 57
Page 64

Chapter 8: BitTracer Trace Files SimPASS PE Software User Manual
[page intentionally blank to preserve odd-even pagination]
58 LeCroy Corporation
Page 65

SimPASS PE Software User Manual Chapter 9: Reports and Tools
Chapter 9: Reports and Tools
Reports assist you in analyzing traffic recorded by the Analyzer. The available reports
are:
• File Information: To view general information about the CATC Trace file.
• Error Summary: To view a count of errors in a CATC Trace file.
• Traffic Summary: To view a summary of protocol-related information in the
CATC Trace file summary information about a selected group of items in the
CATC Trace file (such as a count of particular frame or packet types).
• Bus Utilization: To display information on bandwidth usage for the transmit and
receive channels.
• Link Tracker: Displays a detailed chronological view of events.
• Data Flow: Shows marker, packet, direction, type, length, address, payload, handshake, and timestamp information.
• Trace Navigator: Navigates within the CATC Trace to view the location of errors
and triggers, narrow the range of traffic on display, and jump to any point in the
CATC Trace.
• LTSSM Flow Graph: Shows a state diagram of bus activity.
• Packet Header: Shows packet header information
• Packet Data: Shows packet information.
• Configuration Space:
• Metrics: Measures key operating parameters.
• TC to VC Mapping:
simplify navigation) and how the CATC Trace display was changed (for example, in Split
Transactions).
• Timing Calculations: To view timing measured between two events set within the
CATC Trace file.
• Run Verification Scripts: Allows you to check errors, link transactions, split trans-
actions, metrics, ordered sets, replays, DLLPs, and TLPs.
Reports are available from the Report menu and buttons on the Tool bar. Tools are
available from the Tools menu.
Displays a Configuration Space.
To display how Traffic Classes are mapped to Virtual Channels (to
LeCroy Corporation 59
Page 66

Chapter 9: Reports and Tools SimPASS PE Software User Manual
9.1 File Information
The File Information window provides a summary on the currently displayed file.
Select Reports > File Information to obtain the File Information window.
60 LeCroy Corporation
Page 67

SimPASS PE Software User Manual Chapter 9: Reports and Tools
9.2 Error Summary
The Error Summary dialog box displays the number of errors for each event and the
packet containing the errors.
Select Reports > Error Summary to obtain the Error Summary dialog box.
LeCroy Corporation 61
Page 68

Chapter 9: Reports and Tools SimPASS PE Software User Manual
9.3 Traffic Summary
The Traffic Summary window summarizes the traffic in the current CATC Trace. The left
side of the window displays a tree of protocol levels. The right side displays a summary
of traffic for the displayed levels.
Select Reports > Traffic Summary or click to display the Traffic Summary window.
Buttons at the top of the Traffic Summary window change the display format and enable
data to be exported to email, file, or the printer.
Using the Traffic Summary Window to Search the
CATC
You can use the Traffic Summary window to move the CATC Trace to packets of interest:
Step 1 Click one of the numbers in the right side of the Traffic Summary window.
Trace
The CATC Trace jumps to the first instance of the selected protocol.
62 LeCroy Corporation
Page 69

SimPASS PE Software User Manual Chapter 9: Reports and Tools
Step 2 Click the up or down arrows . The CATC Trace jumps forward or
backward through the display to the next instance of selected protocol
level.
Traffic Summary Buttons
Buttons at the top of the Traffic Summary dialog box provide options for exporting the
data or formatting its appearance:
Save. Saves Traffic Summary results into an HTML format.
Email. Attaches an HTML file of the results to a new email.
Print. Prints results.
Text. Displays results in HTML format.
Options. Opens a drop-down menu with the following options:
• Grid Lines: Displays/Hides grid lines
• Row Selection: Allows entire rows to be selected
• Tight Columns: Reformats column widths to match data
• Event Navigation:
Skip Hidden Items
Show Hidden Items
Prompt each time
LeCroy Corporation 63
Page 70

Chapter 9: Reports and Tools SimPASS PE Software User Manual
9.4 Bus Utilization
Select Report > Bus Utilization from the menu or press to open the Bus Utilization
window.
The Bus Utilization window displays information on bandwidth use for the transmit and
receive channels.
64 LeCroy Corporation
Page 71

SimPASS PE Software User Manual Chapter 9: Reports and Tools
Bus Utilization Pop-up Menu
You can reformat the display by right-clicking a graph and making a selection from the
Bus Utilization pop-up menu.
Go to Packet #: Relocates the CATC Trace to the selected packet number.
Undo Zoom: If you have zoomed in, this command undoes the zoom.
Zoom to Trace View: Zooms in on graph to show traffic currently displayed in the
CATC Trace screen.
Fit to Graph Area: Redisplays graph so that the entire CATC Trace fits inside graph area.
Y Scale Type:
• Linear: Converts display to linear format
• Logarithmic: Converts display to logarithmic format
Hide: Hides the selected graph
Remove: Allows you to remove any graph that you created via the New command
LeCroy Corporation 65
Page 72

Chapter 9: Reports and Tools SimPASS PE Software User Manual
Properties: Opens a dialog box with options for changing the Title, Type, Appearance,
and Color of the graphs.
66 LeCroy Corporation
Page 73

SimPASS PE Software User Manual Chapter 9: Reports and Tools
Bus Utilization Buttons
The Bus Utilization window buttons allow you to reformat the display and export data.
Button Function
Save. Saves Bus Utilization data to a bitmap file (*.bmp).
Email. Opens an email and attaches a bitmap file of the Bus Utilization data.
Print. Prints the Bus Utilization data.
Full Screen. Maximizes the Bus Utilization window.
View Settings. Opens a sub-menu with the following choices:
• Orient Horizontally
• Tile Vertically
• Show Markers
• Show Plumbline
• Status >>
Bar
Too l t i ps
None
• Grid Lines >>
Both Axes
X Axis
Y Axis
No Grid
•Grid on Top
• Fonts & Colors
Horizontal zoom in
Horizontal zoom out
LeCroy Corporation 67
Page 74

Chapter 9: Reports and Tools SimPASS PE Software User Manual
Vertical zoom in
Vertical zoom out
Click and Drag zoom. Click and drag to zoom in on a part of the graph.
Select Range. Displays a dialog box for selecting a packet range.
Synchronize Graph Areas. If two or more graphs are displayed, this button
synchronizes the graphs to one another. Once synchronized, the positioning slider of
one graph moves the other graphs.
Graph Areas. Provides options for creating and displaying additional graphs of data
lengths, packet lengths, and percentage of bus used.
68 LeCroy Corporation
Page 75

SimPASS PE Software User Manual Chapter 9: Reports and Tools
9.5 Link Tracker
The Link Tracker window displays a detailed chronological view of events. Events are
shown on a channel-by-channel basis in columns within the window.
Each time slot in the vertical axis represents the minimum time that a DWORD requires
to traverse the bus.
Toolbar: Presents buttons for changing the format of the Link Tracker window.
Main Display Area: Displays traffic chronologically as it occurred in the recording. The
window divides into columns: the first column shows time and traffic is shown on a
channel-by-channel basis in the columns on the right.
LeCroy Corporation 69
Page 76

Chapter 9: Reports and Tools SimPASS PE Software User Manual
Using the Link Tracker Window
The Link Tracker window can be reformatted in several ways.
Zooming In and Out
Zooming out can give you a quick, high-level view of a CATC Trace. A fully zoomed out
CATC Trace only shows columns and colored lines. Using the colors, you can see what
types of traffic run through the CATC Trace.
Further information can be obtained on any point of interest in the CATC Trace by
positioning your mouse pointer over it. Tool tips provide detailed description of events.
Note: When fully zoomed out, the smallest graphical unit is the DWORD, represented by
a single line. Zooming out makes the CATC Trace appear smaller and increases the time
scale in the first column.
70 LeCroy Corporation
Page 77

SimPASS PE Software User Manual Chapter 9: Reports and Tools
Collapsing Idle Time, Enabling Tool tips, and Resetting Column
Widths
Click the View Options button to open a menu with options for formatting the
display. Three options are presented:
Collapsible Idle Time: Opens a dialog box for setting the Idle time value. Setting a value
tells the Analyzer when to collapse Idle times and display them as grayed out strips within
the Bus View window.
Tooltip Display: Opens a menu with options for adding content to Tooltips. Tooltips
display when you position the mouse pointer over an item in the Bus View window. The
options are:
• Tooltips Display Values
• Tooltips Display Scrambled Values
• Tooltips Display 10-bit Codes
• Tooltips Display Symbols
Time Format: Seconds or Clock
Reset Column Widths: This option resets column widths to their defaults and enables
columns to resize themselves automatically any time the application window is resized.
Normally, columns automatically resize themselves if the application window is made
larger or smaller. However, if you manually resize any columns in the Bus View window,
column widths become static. Thereafter, if you resize the application window, the
Bus View columns do not adjust automatically. Reset Column Widths re-enables the
automatic resizing capability.
Reset Columns Order: Return to default column sequence.
Docking and Undocking the Window
You can undock the Link Tracker window by double-clicking the blue title bar along the
left side of the window. Once undocked, the window can be dragged anywhere in the
application. To redock, double-click again on the title bar.
LeCroy Corporation 71
Page 78

Chapter 9: Reports and Tools SimPASS PE Software User Manual
Setting Markers
Markers can be set on any event within the Link Tracker window.
To set a marker, right-click an event, then select Set Marker from the pop-up menu.
Once marked, you can navigate to events with the Go to Marker command in the Search
menu.
Markers set in the Link Tracker window display the packet number and DWORD number.
In contrast, markers set in the CATC Trace window just show the packet number.
Calculating Time between DWORDs
You can calculate time between DWORDs by clicking an event and then positioning your
mouse pointer over a second event and reading the ensuing Tool tip.
Click the time value for the first event. Scroll down through the CATC Trace to the second
event and position the mouse pointer above its time value. A Tool tip appears showing
the time interval between the first and second events.
Hiding Traffic
You can hide Idles and other data from the Link Tracker window by clicking the Hide
buttons on the toolbar.
72 LeCroy Corporation
Page 79

SimPASS PE Software User Manual Chapter 9: Reports and Tools
Link Tracker Buttons
The Link Tracker window has a row of buttons for changing the format of the displayed
data and for exporting data: The buttons have the following functions:
Full Screen. Expands the Link Tracker window to fill the entire screen.
View Options. Opens a menu with three options:
• Collapsible Idle Time (Collapse Idle Bigger Than n nanoseconds.
Note: Does not affect Collapse Idle Plus.)
• Tooltip Display (Values, Scrambled Values, 10-bit Codes, Symbols)
• Time Format (Seconds, Clock)
• Reset Columns Widths (return to default widths)
• Reset Columns Order (return to default column sequence)
See “Using the Link Tracker Window” on page 70 for further details.
Synchronize Trace View. Synchronizes the Trace View and Link Tracker windows
so that a move in one window repositions the other.
Because of the differences in scale and logic between the Link Tracker and Trace
view window, scrolling produces different effects depending on which window is
being scrolled.
Scrolling in the CATC Trace window causes the Link Tracker window to rapidly
jump from event to event. Long periods of idle time are thus skipped.
Scrolling in the Link Tracker window, in contrast, produces modest movements
within the CATC Trace window.
Scrolling in the Link Tracker window causes the CATC Trace window to pause until
the beginning of a packet is displayed. At that point, the CATC Trace window
repositions itself. While scrolling long Idle periods or through the contents of a
packet, the CATC Trace window does not move.
Zoom In
Zoom Out
Continuous Time Scale. No collapsing.
Collapse Idle. Do not show some periods of Link being idle.
Collapse Idle Plus. Do not show periods of Link being idle.
LeCroy Corporation 73
Page 80

Chapter 9: Reports and Tools SimPASS PE Software User Manual
Show Values
Show Scrambled Values
Show 10b Codes
Show Symbols
Show Text
74 LeCroy Corporation
Page 81

SimPASS PE Software User Manual Chapter 9: Reports and Tools
9.6 Data Flow Window
The Data Flow window shows marker, packet, direction, type, length, address, payload,
handshake, and timestamp information.
To obtain the Data Flow window, select Report > Data Flow
or click the Data Flow toolbar icon.
The toolbar allows you to:
• Expand the window to full screen or Collapse to a smaller window.
• Synchronize.
• Save.
• Select Data Flow columns to display and their widths:
• Marker
• Packet
• Direction
• Type
• Length
•Address
•Payload
• Handshake
• Time Stamp
LeCroy Corporation 75
Page 82

Chapter 9: Reports and Tools SimPASS PE Software User Manual
9.7 Flow Control Tracking
The Flow Control View mode highlights portions of the packets that affect flow control
and displays flow control values. Flow control values shown at the beginning of Link
Transaction display the credit values that were available prior to TLP transmission. Flow
control values shown at the end of the Link Transaction display the credit values that
were available after TLP was transmitted. Hover the mouse over the field to display
tool-tips. Refer to the following screen capture.
If the trace includes Flow Control initialization, PETracer detects the amount of available
credits based on the values advertised in InitFC packets. If the InitFC packets are not in
the trace, the amount of available credits can be set using the FC Credit Setup dialog
(see the following screen capture).
For each virtual channel that is present in the trace you need to specify the amount of
available credits before the beginning of the trace. You can also specify the values of
credit fields for UpdateFC packets before the beginning of the trace. If the values of the
UpdateFC credit fields are different than the values in the first UpdateFC packet, Flow
Control tracking view will show that the first UpdateFC packet is releasing appropriate
amount of credits. By default, PETracer sets these values to match the first UpdateFC
packets in the trace. The following screen capture shows the Flow Control Setup dialog.
76 LeCroy Corporation
Page 83

SimPASS PE Software User Manual Chapter 9: Reports and Tools
9.8 Using the CATC Trace Navigator
The CATC Trace Navigator is a tool for navigating within the CATC Trace. It allows you
to view the location of errors and triggers in a CATC Trace and to narrow the range of
traffic on display. It also allows you to quickly jump to any point in the CATC Trace.
Displaying the Navigator
Click in the toolbar to display the Navigator. The Navigator appears on the right side
of the Main window. It has a two-button toolbar and a vertical slider bar. It also has colored
panes for navigating the CATC Trace in different ways. You set which panes are
displayed through Navigator pop-up menus.
LeCroy Corporation 77
Page 84

Chapter 9: Reports and Tools SimPASS PE Software User Manual
Navigator Toolbar
The Navigator toolbar lets you quickly set Navigator features. The toolbar has two
buttons.
Navigator Ranges: This button brings up a pop-up menu that lets you reset the
Navigator range. The range determines what packets are viewable in the CATC Trace
display.
Navigator Panes: This button has two purposes: To select which Navigator panes
appear and to bring up the Navigator legend. The legend determines how information is
shown in the panes.
Navigator Ranges
You set the viewing range by dragging the yellow range delimiters along the slider.
To set the lowest packet viewable, drag the top delimiter up. As you do so, a tool tip
appears to indicate the current range. Stop dragging when you reach the desired lowest
packet.
To set the highest packet viewable, drag the bottom delimiter down. Stop when the tool
tip indicates you are at the desired highest packet.
To Determine Current Position
In addition to the two range delimiters, the slider has a blue current-position indicator
(see above). The current-position indicator shows where you are in the CATC Trace
display with respect to the possible viewing range.
78 LeCroy Corporation
Page 85

SimPASS PE Software User Manual Chapter 9: Reports and Tools
For example, suppose you set viewing range to packet 0 through packet 500 (the top
range delimiter is at packet 0, and the bottom range delimiter is at packet 500). If you then
move the current-position indicator on the slider to midway between the top and bottom
delimiters, then packet 250 appears in the middle of the CATC Trace display.
To Reset Navigator Range
You can reset the Navigator range using the toolbar Navigator Range button. Press the
button to bring up the Navigator Range drop-down menu.
The menu has the following options:
• Set Range to Whole Trace: Allows you to reset the range to include the entire
CATC Trace file contents. The top range delimiter is placed at the lowest packet
number in the CATC Trace. The bottom range delimiter is placed at the highest
packet number in the CATC Trace.
• Set Range Near Packet xxx: Allows you to collapse the range so that only the
packets immediately above and below the xxx packet are displayed. The xxx packet
is whatever packet is currently at the top in the CATC Trace display.
• Recently Used Ranges: Allows you to reset the range to any of a number of
recently used (previously set) ranges.
LeCroy Corporation 79
Page 86

Chapter 9: Reports and Tools SimPASS PE Software User Manual
Navigator Panes
You can display any combination of CATC Trace Navigator panes.
From left to right, the panes are: Pre/Post Trigger, Errors, Traffic Type, Traffic Speed, and
Link Width. Each pane represents the entire CATC Trace with respect to different types
of information. The top of each pane represents the start of the CATC Trace file, and the
bottom represents the end of the CATC Trace file.
• Pre/Post Trigger: To view the trigger event in the CATC Trace and the relative size
of pre-trigger and post-trigger portions of the CATC Trace. The two portions are set
apart as different colors. The trigger event occurs at the point the two colors meet.
• Errors: To view any errors in the CATC Trace. A thin red line represents each error
in the pane.
• Traffic Type: To view the types of packets that occur in the CATC Trace. A different
color represents each packet type in the pane. The relative size of colored portions
in the pane corresponds to the amounts of the various packet types in the
CATC Trace. As described below, you can use the Navigator legend to change the
types of packets that take precedence in the display.
• Traffic Speed: To view the speed that occurs in the CATC Trace.
• Link Width: To view the link width that occurs in the CATC Trace.
To Show/Hide Navigator Panes
You can show/hide any of the panes using pop-up menus accessible through left-click the
Navigator Panes button or by right-click anywhere in any CATC Trace Navigator pane.
80 LeCroy Corporation
Page 87

SimPASS PE Software User Manual Chapter 9: Reports and Tools
Navigator Slider
The Navigator slider appears at the left of Navigator panes. The slider has yellow upper
and lower range delimiters and a blue current-position indicator.
The Navigator slider lets you to set the range of packets viewable in the CATC Trace
display. In other words, it sets scrolling range of the display. You can scroll the display up
to the lowest packet number in the viewing range. You can scroll the display down to the
highest packet number in the viewing range.
CATC Trace Navigator Legend
The Navigator legend lets you control the display of content in Navigator panes.
You bring up the legend through the Navigator Panes drop-down menu. Press the toolbar
Navigator Panes button to access the menu. Select the Legend option to bring up the
Navigator Legend dialog box.
The Navigator Legend dialog box has areas corresponding to each of the panes. Each
area has check boxes that allow you to hide/display information in the pane. You can set
the priority of information displayed in the panes using the up and down triangles on the
right.
Using the Legend to Show/Hide Navigator Panes
To use the legend to show/hide an entire pane, use the checkbox next to the name of
each pane in the legend.
In the case of the Pre/Post Trigger and Errors areas, the action of show/hide in the legend
is identical to that provided by CATC Trace Navigator pop-up menus.
In the case of the Traffic Types pane, there is no equivalent show/hide available through
the pop-up menus.
LeCroy Corporation 81
Page 88

Chapter 9: Reports and Tools SimPASS PE Software User Manual
Using the Legend to Set the Priority of Information Display
You can use the legend to set the priority of information displayed in the Pre/Post Trigger
Traffic Type panes. This is a two-step process.
Step 1 For a particular item in a pane, click the column next to the checkbox
for the item. That labels the item as currently active.
Step 2 Next, use the up-down at the lower-right of the area to move the item
higher or lower in priority.
In the case of the Traffic Type pane, priority determines display priority of each packet
type. For portions of the CATC Trace that are dominated by a particular packet type, this
setting no effect: only the color corresponding to that packet type is displayed in that
portion of the pane. Suppose, however, that part of the CATC Trace includes equal or
near equal numbers of several types of packets. In that case, you can use the legend to
select which among those types is represented in that portion of the Traffic Types pane.
This allows you to view only packets of interest in crowded portions of the CATC Trace
display.
82 LeCroy Corporation
Page 89

SimPASS PE Software User Manual Chapter 9: Reports and Tools
9.9 LTSSM Flow Graph
The LTSSM Flow Graph shows link state transitions that the link goes through, as
recorded in the CATC Trace file.
To obtain the LTSSM Flow Graph, select View > LTSSM Flow Graph.
You can display the following directions:
• Upstream
• Downstream
•Both
You can Show Number of Transitions.
LeCroy Corporation 83
Page 90

Chapter 9: Reports and Tools SimPASS PE Software User Manual
9.10 Packet Header Bar
The Packet Header bar shows packet header information.
To obtain the Packet Header bar, select Report > Packet Header
or click the Packet Header toolbar icon.
The toolbar allows you to
the Packet Data window.
Save, go to Previous or Next, display Hexadecimal or Binary, and show
84 LeCroy Corporation
Page 91

SimPASS PE Software User Manual Chapter 9: Reports and Tools
9.11 Packet Data Window
The Packet Data window shows packet information.
To obtain the Packet Data window, select Report > Packet Data
or click the toolbar icon.
The toolbar allows you to
or Binary; use MSB Format or LSB Format; and use Big Endian or Little Endian.
Format and Columns allows you to enter the number of bytes, words, or dwords per line.
You can enter an Offset and scroll to it.
You can enter text and Search Previous or Search Next.
Save; go to Previous or Next; display Hexadecimal, ASCII, Decimal,
LeCroy Corporation 85
Page 92

Chapter 9: Reports and Tools SimPASS PE Software User Manual
9.12 Configuration Space View
The Configuration Space View displays information about the Configuration Space state
as of the current packet of the currently selected device. The view shows the
Configuration Space Header and the PCI-compatible or PCI Express
Capability Structures.
To display the Configuration Space View for a device at a packet:
Step 1 Open a CATC Trace, such as the sample file cfg_pci_express.pex.
Step 2 Scroll to a packet with a Configuration header.
Step 3 Select Report > Configuration Space > <device> to display the
Configuration Space View.
or
86 LeCroy Corporation
Page 93

SimPASS PE Software User Manual Chapter 9: Reports and Tools
Click a CompeterID or DeviceID field. A pop-up menu opens.
Select Show Configuration Space for xxxx from the menu, where xxxx is the
device number. The Configuration Space View opens.
On the left, the view displays the Configuration Space for the selected CompleterID or
DeviceID at the current packet. You can select Configuration Space Header or a
Capability Structure.
The right displays the decoded data of the selected Configuration Space Header or a
Capability Structure, up to the current packet. (The decoding builds while navigating
through the next packets.)
The Configuration Space View toolbar allows you to
go to Next, go to Last, go to Previous Access to Selected Configuration Space Register,
go to Next Access to Selected Configuration Space Register, and display Hexadecimal or Binary
Save, go to First, go to Previous,
Note: See Appendix A “Configuration Space Decoding” on page 103.
LeCroy Corporation 87
.
Page 94

Chapter 9: Reports and Tools SimPASS PE Software User Manual
9.13 Using Unit Metrics
For every protocol unit at the Link or Split transaction level, SimPASS PE™ calculates
and displays a set of metrics. Metrics are measurements of key operating parameters.
You can use metrics to evaluate performance of traffic in the CATC Trace stream.
You can view metrics information in the CATC Trace display, the Traffic Summary
window, and the Bus Utilization window.
SimPASS PE defines different metrics for Link and Split transactions.
Metrics Defined for Link Transactions
Number of Packets: The total number of packets that compose this Link transaction.
Payload: The number of data payload bytes this Link transaction transferred.
Response Time: The time it took to transmit this Link transaction on the PE link, from the
beginning of the first packet in the transaction to the end of the last packet in the
transaction.
Data Throughput: The payload divided by response time, expressed in megabytes per
second.
Note: Usually, the Number of Packets metric for a link transaction is two (in case of
explicit acknowledge) or one (in case of implicit acknowledge). However if
Naks/link level retries are involved, this metric might be higher. As a result,
the Number of Packets metric is useful in highlighting unusual link
transactions.
Metrics Defined for Split Transactions
The following types of metrics currently are defined for Split transactions:
Number of Link Transactions: The total number of Link transactions that compose this
Split transaction.
Payload: The number of payload bytes this Split transaction transferred.
Response Time: The time it took to transmit this Split transaction on the PE link, from
the beginning of the first packet in the Split transaction to the end of the last packet in the
Split transaction;
Data Throughput: The transaction payload divided by response time, expressed in
megabytes per second.
Latency Time: The time measured from the end of the request transaction to the first
completion transmitted in response to the request within this Split transaction.
Note: The Number Of Link Transactions metric for a Split Transaction usually is two
for a Configuration or IO request. It can be bigger then two for a Memory
Read request.
88 LeCroy Corporation
Page 95

SimPASS PE Software User Manual Chapter 9: Reports and Tools
Show Metrics in the CATC Trace Display
In the CATC Trace view display of Link Transaction or Split Transaction levels, all metrics
information applicable to a specific protocol unit is displayed in a Metrics header. The
header is located close to the end of the unit, in front of the Time cell. You can expand
and collapse the header to show or hide the metrics information.
Collapsed Metrics Header Display
Following is a collapsed metrics display for a unit of Link Transaction. The collapsed
header display shows only the metrics cell representing the Number of Packets.
Following is a collapsed metrics display for a unit of Split Transaction. The collapsed
header display shows only the metrics cell representing Number of Link Transactions.
Metrics Tool Tip Display
In both CATC Trace level views, you can view the summary of all the unit metrics in the
Metrics header tool tip. To view the tool tip, simply place the mouse cursor over the
Metrics header. Following is the tool tip for a unit in the Link Transaction view.
Note: The tool tip also presents information for time passed from the start of the
recording till the beginning of this Link or Split Transaction.
LeCroy Corporation 89
Page 96

Chapter 9: Reports and Tools SimPASS PE Software User Manual
Expanded Metrics Header Display
When you expand the Metrics header, the display creates a separate cell for each
applicable metric:
Following is the expanded Metric header for a unit in the Split Transaction view.
Following is the expanded Metric header for a unit in the Link Transaction view.
Note: Each of the metric cells pops up a tool tip window with the explanation of what the
metric means.
90 LeCroy Corporation
Page 97

SimPASS PE Software User Manual Chapter 9: Reports and Tools
Show Metrics in the Traffic Summary Window
Some of the Traffic Summary reports at the Link and Split Transaction levels are based
on metrics collected for the corresponding protocol units in the CATC Trace.
Reports at Split Transaction Level
Split Transaction Performance: This report table groups the Split Transactions by
Requester-Completer pair and displays Minimum/Average/Maximum data for Number Of
Link Transactions and Response Time metrics.
Read Requests Performance: This report table includes only the Split Transactions that
present Read Requests (Configuration, IO and Memory). It groups them by the
combination of Requester-Completer pair, request type, and Traffic Class and displays
Minimum/Average/Maximum data for Throughput, Response Time, and Latency metrics.
Write Requests Performance: This report table includes only the Split Transactions that
present Write Requests (Configuration and IO). It groups them by the combination of
Requester-Completer pair, request type, and Traffic Class and displays
Minimum/Average/Maximum data for Throughput, Response Time, and Latency metrics.
LeCroy Corporation 91
Page 98

Chapter 9: Reports and Tools SimPASS PE Software User Manual
Reports at the Link Transaction Level
The following metric-based reports are displayed at the Link Transaction level:
Link Transaction Performance: This report table groups the Link Transactions by TLP
Type and displays Minimum/Average/Maximum data for Number Of Packets, Response
Time and Payload Bytes metrics.
Memory Writes: This report table includes only the Link Transactions that present
Memory Write Requests. Memory Writes are the only (posted) requests that don't get
promoted to the Split transaction level, therefore their performance should be viewed at
the Link transaction level. The table groups Memory Writes by the combination of
Requester ID and Traffic Class and displays Minimum/Average/Maximum data for
Response Time, Payload and Throughput metrics.
Following features apply to all of the report tables described above for the Split
Transaction and Link Transaction levels:
• Each report row for the defined tables contains the total number of units in this
group for the CATC Trace (total number of units for Split Transaction performance,
Read Requests performance, Memory Writes, and so on).
• In many cases, the Maximum and Minimum values in the report tables are
navigable. By clicking table cells, you reposition the corresponding CATC Trace
view to the Split or Link Transaction that has yielded this maximum or minimum
value. This can help you to find specific units in the CATC Trace, such as
transactions that produced spikes in Response Time or Throughput.
92 LeCroy Corporation
Page 99

SimPASS PE Software User Manual Chapter 9: Reports and Tools
Show Metrics in the Bus Utilization Window
The Bus Utilization window provides graphs for packet-level information in the
CATC Trace. The window also provides graphs for information on Split and Link
Transaction levels, plotted over time. The graphs for Split and Link Transaction levels are
based on metrics collected for the transactions throughout the CATC Trace.
The seven graphs related to Split and Transaction levels are:
1. Pending Requests at Split Transaction level.
2. Response Time at Split Transaction level.
3. Latency Time at Split Transaction level.
4. Throughput Per Transaction at Split Transaction level.
5. Response Time and Latency Time at Split Transaction level (combined graph).
6. Response Time at Link Transaction level, for Memory Writes only.
7. Throughput at Link Transaction level, for Memory Writes only.
The following is an example of Bus Utilization window display of graph numbers 1, 4, 5,
6 and 7:
LeCroy Corporation 93
Page 100

Chapter 9: Reports and Tools SimPASS PE Software User Manual
Unit-Based Averaging
The Analyzer builds metric graphs using unit-based averaging (as opposed to
time-based averaging). For the total duration of a certain request (or Memory Write
transaction), the graph value is assumed equal to the corresponding metric for this
request (transaction). If there are overlapping operations for a certain time period, then
the value is calculated as an average of metric values for all the overlapped requests
(transactions).
It is important to remember that the Analyzer uses unit-based averaging rather than
time-based averaging. Time-based averaging can be misleading in some situations. For
example, consider the Throughput Per Transaction graph. Sometimes, while many
outstanding requests are in progress, latency (and response time) grows for each of the
transactions, resulting in a lower throughput per transaction over time (which is reflected
in the graph). This happens even though aggregated throughput across all the
transactions is constant.
Bus Utilization Window Features
For the seven Split- and Transaction-level graphs listed, all Bus Utilization window
features are available, such as zooming in/out, changing scale type, scrolling,
context-sensitive status, and graph synchronization. See Bus Utilization and Bus
Utilization Buttons for more on these features.
Note: Clicking a certain place within a graph area repositions the CATC Trace display at
the Link or Split transaction level to the transaction that was in progress at that time.
Split Transaction Level Graphs
Transactions at the Split level combine all the non-posted requests with corresponding
completions. This includes Configuration and IO Read and Write requests, as well as
Memory Read requests.
The following shows the graphs for the Split level:
94 LeCroy Corporation
 Loading...