


Service Manual
WCA230A & WCA280A
Portable Wireless Communication Analyzers
071-1257-01
This document applies to firmware version 2.4
and above.
Warning
The servicing instructions are for use by qualified
personnel only. To avoid personal injury, do not
perform any servicing unless you are qualified to
do so. Refer to all safety summaries prior to
performing service.
www.tektronix.com

Copyright © Tektronix, Inc. All rights reserved. Licensed software products are owned by Tektronix or its suppliers and
are protected by United States copyright laws and international treaty provisions.
Use, duplication, or disclosure by the Government is subject to restrictions as set forth in subparagraph (c)(1)(ii) of the
Rights in Technical Data and Computer Software clause at DFARS 252.227-7013, or subparagraphs (c)(1) and (2) of the
Commercial Computer Software – Restricted Rights clause at FAR 52.227-19, as applicable.
Tektronix products are covered by U.S. and foreign patents, issued and pending. Information in this publication supercedes
that in all previously published material. Specifications and price change privileges reserved.
TEKTRONIX and TEK are registered trademarks of Tektronix, Inc.
Contacting Tektronix
Tektronix, Inc.
14200 SW Karl Braun Drive or P.O. Box 500
Beaverton, OR 97077 USA
For product information, sales, service, and technical support:
H In North America, call 1-800-833-9200.
H Worldwide, visit www.tektronix.com to find contacts in your area.

Warranty 2
Tektronix warrants that this product will be free from defects in materials and workmanship for a period of one (1) year
from the date of shipment. If any such product proves defective during this warranty period, Tektronix, at its option, either
will repair the defective product without charge for parts and labor, or will provide a replacement in exchange for the
defective product. Parts, modules and replacement products used by Tektronix for warranty work may be new or
reconditioned to like new performance. All replaced parts, modules and products become the property of Tektronix.
In order to obtain service under this warranty, Customer must notify Tektronix of the defect before the expiration of the
warranty period and make suitable arrangements for the performance of service. Customer shall be responsible for
packaging and shipping the defective product to the service center designated by Tektronix, with shipping charges prepaid.
Tektronix shall pay for the return of the product to Customer if the shipment is to a location within the country in which the
Tektronix service center is located. Customer shall be responsible for paying all shipping charges, duties, taxes, and any
other charges for products returned to any other locations.
This warranty shall not apply to any defect, failure or damage caused by improper use or improper or inadequate
maintenance and care. Tektronix shall not be obligated to furnish service under this warranty a) to repair damage resulting
from attempts by personnel other than Tektronix representatives to install, repair or service the product; b) to repair
damage resulting from improper use or connection to incompatible equipment; c) to repair any damage or malfunction
caused by the use of non-Tektronix supplies; or d) to service a product that has been modified or integrated with other
products when the effect of such modification or integration increases the time or difficulty of servicing the product.
THIS WARRANTY IS GIVEN BY TEKTRONIX WITH RESPECT TO THE PRODUCT IN LIEU OF ANY OTHER
WARRANTIES, EXPRESS OR IMPLIED. TEKTRONIX AND ITS VENDORS DISCLAIM ANY IMPLIED
WARRANTIES OF MERCHANTABILITY OR FITNESS FOR A PARTICULAR PURPOSE. TEKTRONIX’
RESPONSIBILITY TO REPAIR OR REPLACE DEFECTIVE PRODUCTS IS THE SOLE AND EXCLUSIVE REMEDY
PROVIDED TO THE CUSTOMER FOR BREACH OF THIS WARRANTY. TEKTRONIX AND ITS VENDORS WILL
NOT BE LIABLE FOR ANY INDIRECT, SPECIAL, INCIDENTAL, OR CONSEQUENTIAL DAMAGES
IRRESPECTIVE OF WHETHER TEKTRONIX OR THE VENDOR HAS ADVANCE NOTICE OF THE POSSIBILITY
OF SUCH DAMAGES.


Table of Contents
Specifications
General Safety Summary xi. . . . . . . . . . . . . . . . . . . . . . . . . . . . . . . . . . . .
Service Safety Summary xiii. . . . . . . . . . . . . . . . . . . . . . . . . . . . . . . . . . . . .
Preface xv. . . . . . . . . . . . . . . . . . . . . . . . . . . . . . . . . . . . . . . . . . . . . . . . . . .
Manual Structure xv. . . . . . . . . . . . . . . . . . . . . . . . . . . . . . . . . . . . . . . . . . . . . . . . .
Manual Conventions xvi. . . . . . . . . . . . . . . . . . . . . . . . . . . . . . . . . . . . . . . . . . . . . .
Finding Other Information xvi. . . . . . . . . . . . . . . . . . . . . . . . . . . . . . . . . . . . . . . . . .
Introduction xvii. . . . . . . . . . . . . . . . . . . . . . . . . . . . . . . . . . . . . . . . . . . . . . .
Performance Check Interval xvii. . . . . . . . . . . . . . . . . . . . . . . . . . . . . . . . . . . . . . . . .
Strategy for Servicing xvii. . . . . . . . . . . . . . . . . . . . . . . . . . . . . . . . . . . . . . . . . . . . .
Product Overview 1–1. . . . . . . . . . . . . . . . . . . . . . . . . . . . . . . . . . . . . . . . . .
Features 1–1. . . . . . . . . . . . . . . . . . . . . . . . . . . . . . . . . . . . . . . . . . . . . . . . . . . . . . . .
Application 1–2. . . . . . . . . . . . . . . . . . . . . . . . . . . . . . . . . . . . . . . . . . . . . . . . . . . . . .
Difference between WCA230A and WCA280A 1–2. . . . . . . . . . . . . . . . . . . . . . . . .
Real-Time Analysis 1–3. . . . . . . . . . . . . . . . . . . . . . . . . . . . . . . . . . . . . . . . . . . . . . .
Architecture 1–6. . . . . . . . . . . . . . . . . . . . . . . . . . . . . . . . . . . . . . . . . . . . . . . . . . . . .
Specifications 1–9. . . . . . . . . . . . . . . . . . . . . . . . . . . . . . . . . . . . . . . . . . . . . .
Performance Conditions 1–9. . . . . . . . . . . . . . . . . . . . . . . . . . . . . . . . . . . . . . . . . . . .
Electrical Characteristics 1–10. . . . . . . . . . . . . . . . . . . . . . . . . . . . . . . . . . . . . . . . . . .
Physical Characteristics 1–23. . . . . . . . . . . . . . . . . . . . . . . . . . . . . . . . . . . . . . . . . . . .
Environmental Characteristics 1–23. . . . . . . . . . . . . . . . . . . . . . . . . . . . . . . . . . . . . . .
Operating Information
Installation 2–1. . . . . . . . . . . . . . . . . . . . . . . . . . . . . . . . . . . . . . . . . . . . . . . .
Supplying Operating Power 2–1. . . . . . . . . . . . . . . . . . . . . . . . . . . . . . . . . . . . . . . . .
Operating Environment 2–3. . . . . . . . . . . . . . . . . . . . . . . . . . . . . . . . . . . . . . . . . . . .
Applying Power 2–4. . . . . . . . . . . . . . . . . . . . . . . . . . . . . . . . . . . . . . . . . . . . . . . . . .
Powering Off the Analyzer 2–7. . . . . . . . . . . . . . . . . . . . . . . . . . . . . . . . . . . . . . . . .
Restart 2–8. . . . . . . . . . . . . . . . . . . . . . . . . . . . . . . . . . . . . . . . . . . . . . . . . . . . . . . . .
Setting Up the Stand 2–9. . . . . . . . . . . . . . . . . . . . . . . . . . . . . . . . . . . . . . . . . . . . . . .
Repackaging Instructions 2–10. . . . . . . . . . . . . . . . . . . . . . . . . . . . . . . . . . . . . . . . . . .
Installed Options 2–10. . . . . . . . . . . . . . . . . . . . . . . . . . . . . . . . . . . . . . . . . . . . . . . . .
Operating Instructions 2–11. . . . . . . . . . . . . . . . . . . . . . . . . . . . . . . . . . . . . .
Preparations 2–12. . . . . . . . . . . . . . . . . . . . . . . . . . . . . . . . . . . . . . . . . . . . . . . . . . . . .
Displaying Spectrum 2–16. . . . . . . . . . . . . . . . . . . . . . . . . . . . . . . . . . . . . . . . . . . . . .
Using Markers and Peak Search 2–25. . . . . . . . . . . . . . . . . . . . . . . . . . . . . . . . . . . . .
Using Averaging and Comparison Displays 2–31. . . . . . . . . . . . . . . . . . . . . . . . . . . .
Displaying a Spectrogram 2–34. . . . . . . . . . . . . . . . . . . . . . . . . . . . . . . . . . . . . . . . . .
Spectrum Analysis 2–37. . . . . . . . . . . . . . . . . . . . . . . . . . . . . . . . . . . . . . . . . . . . . . . .
Modulation Analysis 2–41. . . . . . . . . . . . . . . . . . . . . . . . . . . . . . . . . . . . . . . . . . . . . .
Using Windows XP 2–48. . . . . . . . . . . . . . . . . . . . . . . . . . . . . . . . . . . . . . . . . . . . . . .
Turning Off the Power 2–50. . . . . . . . . . . . . . . . . . . . . . . . . . . . . . . . . . . . . . . . . . . . .
WCA230A & WCA280A Service Manual
i

Table of Contents
Theory of Operation
RF Input Circuit 3–1. . . . . . . . . . . . . . . . . . . . . . . . . . . . . . . . . . . . . . . . . . . . . . . . . .
RF3 Module 3–2. . . . . . . . . . . . . . . . . . . . . . . . . . . . . . . . . . . . . . . . . . . . . . . . . . . . .
RF2 Module 3–2. . . . . . . . . . . . . . . . . . . . . . . . . . . . . . . . . . . . . . . . . . . . . . . . . . . . .
RF5 Module 3–3. . . . . . . . . . . . . . . . . . . . . . . . . . . . . . . . . . . . . . . . . . . . . . . . . . . . .
RF4 Module 3–3. . . . . . . . . . . . . . . . . . . . . . . . . . . . . . . . . . . . . . . . . . . . . . . . . . . . .
A10 A/D Board 3–4. . . . . . . . . . . . . . . . . . . . . . . . . . . . . . . . . . . . . . . . . . . . . . . . . .
A20 DDC Board 3–4. . . . . . . . . . . . . . . . . . . . . . . . . . . . . . . . . . . . . . . . . . . . . . . . . .
A30 Trigger Board (Optional) 3–4. . . . . . . . . . . . . . . . . . . . . . . . . . . . . . . . . . . . . . .
A40 Memory Board 3–5. . . . . . . . . . . . . . . . . . . . . . . . . . . . . . . . . . . . . . . . . . . . . . .
Power Supply Circuit 3–5. . . . . . . . . . . . . . . . . . . . . . . . . . . . . . . . . . . . . . . . . . . . . .
Standby Power and On/Standby Switch 3–6. . . . . . . . . . . . . . . . . . . . . . . . . . . . . . .
A50 Mother Board 3–6. . . . . . . . . . . . . . . . . . . . . . . . . . . . . . . . . . . . . . . . . . . . . . . .
A60 Front Key Board 3–6. . . . . . . . . . . . . . . . . . . . . . . . . . . . . . . . . . . . . . . . . . . . . .
A62 Front Connection Board 3–6. . . . . . . . . . . . . . . . . . . . . . . . . . . . . . . . . . . . . . . .
Performance Verification
Conventions 4–2. . . . . . . . . . . . . . . . . . . . . . . . . . . . . . . . . . . . . . . . . . . . . . . . . . . . .
Brief Procedures 4–3. . . . . . . . . . . . . . . . . . . . . . . . . . . . . . . . . . . . . . . . . . .
Functional Check 4–4. . . . . . . . . . . . . . . . . . . . . . . . . . . . . . . . . . . . . . . . . . . . . . . . .
Diagnostics 4–8. . . . . . . . . . . . . . . . . . . . . . . . . . . . . . . . . . . . . . . . . . . . . . . . . . . . . .
Performance Tests 4–9. . . . . . . . . . . . . . . . . . . . . . . . . . . . . . . . . . . . . . . . . .
Prerequisites 4–10. . . . . . . . . . . . . . . . . . . . . . . . . . . . . . . . . . . . . . . . . . . . . . . . . . . . .
Equipment Required 4–10. . . . . . . . . . . . . . . . . . . . . . . . . . . . . . . . . . . . . . . . . . . . . . .
Auto Tests 4–12. . . . . . . . . . . . . . . . . . . . . . . . . . . . . . . . . . . . . . . . . . . . . . . . . . . . . . .
Manual Tests 4–20. . . . . . . . . . . . . . . . . . . . . . . . . . . . . . . . . . . . . . . . . . . . . . . . . . . .
Test Record 4–48. . . . . . . . . . . . . . . . . . . . . . . . . . . . . . . . . . . . . . . . . . . . . . . . . . . . . .
Adjustment Procedures
ii
Requirements for Performance 5–1. . . . . . . . . . . . . . . . . . . . . . . . . . . . . . . . . . . . . .
Equipment Required 5–2. . . . . . . . . . . . . . . . . . . . . . . . . . . . . . . . . . . . . . . . . . . . . . .
Preparation 5–3. . . . . . . . . . . . . . . . . . . . . . . . . . . . . . . . . . . . . . . . . . . . . . . . . . . . . .
Self Calibration 5–10. . . . . . . . . . . . . . . . . . . . . . . . . . . . . . . . . . . . . . . . . . . . . . . . . .
Auto Calibration 5–14. . . . . . . . . . . . . . . . . . . . . . . . . . . . . . . . . . . . . . . . . . . . . . . . . .
Reference Oscillator Frequency Adjustment 5–18. . . . . . . . . . . . . . . . . . . . . . . . . . . .
Reconfiguration of RF Modules 5–20. . . . . . . . . . . . . . . . . . . . . . . . . . . . . . . . . . . . . .
WCA230A & WCA280A Service Manual

Maintenance
Table of Contents
Related Maintenance Procedures 6–1. . . . . . . . . . . . . . . . . . . . . . . . . . . . . . . . . . . . .
Preparation 6–2. . . . . . . . . . . . . . . . . . . . . . . . . . . . . . . . . . . . . . . . . . . . . . . . . . . . . .
Inspection and Cleaning 6–4. . . . . . . . . . . . . . . . . . . . . . . . . . . . . . . . . . . . . . . . . . . .
Removal and Installation Procedures 6–7. . . . . . . . . . . . . . . . . . . . . . . . . .
Preparation 6–7. . . . . . . . . . . . . . . . . . . . . . . . . . . . . . . . . . . . . . . . . . . . . . . . . . . . . .
Access Procedure 6–21. . . . . . . . . . . . . . . . . . . . . . . . . . . . . . . . . . . . . . . . . . . . . . . . .
Procedures for External Modules 6–22. . . . . . . . . . . . . . . . . . . . . . . . . . . . . . . . . . . . .
Procedures for RF Modules 6–27. . . . . . . . . . . . . . . . . . . . . . . . . . . . . . . . . . . . . . . . .
Procedures for CPU Board and Disk Modules 6–31. . . . . . . . . . . . . . . . . . . . . . . . . .
Procedures for Mother Board and its Daughter Boards 6–36. . . . . . . . . . . . . . . . . . . .
Procedures for Power Supply Modules on the Instrument Bottom 6–43. . . . . . . . . . .
Procedures for RF1 Modules on the Instrument Bottom 6–48. . . . . . . . . . . . . . . . . . .
Procedures for Front Panel Modules 6–55. . . . . . . . . . . . . . . . . . . . . . . . . . . . . . . . . .
Procedures for Chassis Modules 6–61. . . . . . . . . . . . . . . . . . . . . . . . . . . . . . . . . . . . .
Troubleshooting 6–67. . . . . . . . . . . . . . . . . . . . . . . . . . . . . . . . . . . . . . . . . . . .
Troubleshooting Procedure 6–67. . . . . . . . . . . . . . . . . . . . . . . . . . . . . . . . . . . . . . . . .
Symptoms and Faulty Modules 6–80. . . . . . . . . . . . . . . . . . . . . . . . . . . . . . . . . . . . . .
Notes for Changing Modules or Parts 6–82. . . . . . . . . . . . . . . . . . . . . . . . . . . . . . . . .
Options
Electrical Parts List
Diagrams
Mechanical Parts List
Options and Accessories 7–1. . . . . . . . . . . . . . . . . . . . . . . . . . . . . . . . . . . . .
Options 7–1. . . . . . . . . . . . . . . . . . . . . . . . . . . . . . . . . . . . . . . . . . . . . . . . . . . . . . . . .
Standard Accessories 7–3. . . . . . . . . . . . . . . . . . . . . . . . . . . . . . . . . . . . . . . . . . . . . .
Optional Accessories 7–4. . . . . . . . . . . . . . . . . . . . . . . . . . . . . . . . . . . . . . . . . . . . . .
Replaceable Parts 10–1. . . . . . . . . . . . . . . . . . . . . . . . . . . . . . . . . . . . . . . . . .
Parts Ordering Information 10–1. . . . . . . . . . . . . . . . . . . . . . . . . . . . . . . . . . . . . . . . .
Using the Replaceable Parts List 10–3. . . . . . . . . . . . . . . . . . . . . . . . . . . . . . . . . . . . .
WCA230A & WCA280A Service Manual
iii

Table of Contents
List of Figures
Figure 1–1: Concept of the swept spectrum analyzer 1–3. . . . . . . . . . . . .
Figure 1–2: Sweep of resolution filter 1–3. . . . . . . . . . . . . . . . . . . . . . . . . .
Figure 1–3: Concept of the real-time spectrum analyzer 1–4. . . . . . . . . .
Figure 1–4: Concurrent acquisition 1–4. . . . . . . . . . . . . . . . . . . . . . . . . . . .
Figure 1–5: Frame acquisition 1–5. . . . . . . . . . . . . . . . . . . . . . . . . . . . . . . .
Figure 1–6: Block diagram 1–6. . . . . . . . . . . . . . . . . . . . . . . . . . . . . . . . . . .
Figure 2–1: AC Input (rear panel) 2–4. . . . . . . . . . . . . . . . . . . . . . . . . . . . .
Figure 2–2: Principal power switch (rear panel) 2–5. . . . . . . . . . . . . . . . .
Figure 2–3: Front panel power switch (ON/STANDBY switch) 2–5. . . . .
Figure 2–4: Initial screen 2–6. . . . . . . . . . . . . . . . . . . . . . . . . . . . . . . . . . . .
Figure 2–5: RF INPUT connector 2–6. . . . . . . . . . . . . . . . . . . . . . . . . . . . .
Figure 2–6: Setting up the stand 2–9. . . . . . . . . . . . . . . . . . . . . . . . . . . . . .
Figure 2–7: Cable connection 2–12. . . . . . . . . . . . . . . . . . . . . . . . . . . . . . . . .
Figure 2–8: Principal power switch (rear panel) 2–13. . . . . . . . . . . . . . . . .
Figure 2–9: Power switch (ON/STANDBY) 2–13. . . . . . . . . . . . . . . . . . . . .
Figure 2–10: Initial screen 2–14. . . . . . . . . . . . . . . . . . . . . . . . . . . . . . . . . . .
Figure 2–11: Frequency, span, and amplitude settings 2–16. . . . . . . . . . . .
Figure 2–12: Menu items for numeric value input 2–17. . . . . . . . . . . . . . . .
Figure 2–13: Numeric value entry keypad 2–18. . . . . . . . . . . . . . . . . . . . . .
Figure 2–14: Center frequency of 800 MHz, span of 15 MHz 2–18. . . . . .
Figure 2–15: Center frequency of 800 MHz, span of 100 kHz 2–20. . . . . .
Figure 2–16: Setting amplitude 2–21. . . . . . . . . . . . . . . . . . . . . . . . . . . . . . .
Figure 2–17: Menu items for numeric value input 2–22. . . . . . . . . . . . . . . .
Figure 2–18: Reference level of 10 dBm 2–22. . . . . . . . . . . . . . . . . . . . . . . .
Figure 2–19: Status indicator 2–23. . . . . . . . . . . . . . . . . . . . . . . . . . . . . . . . .
Figure 2–20: Measurement with a single marker 2–26. . . . . . . . . . . . . . . . .
Figure 2–21: Measurement with the delta marker 2–28. . . . . . . . . . . . . . . .
Figure 2–22: Searching for the peak 2–30. . . . . . . . . . . . . . . . . . . . . . . . . . .
Figure 2–23: Comparing a new waveform with an averaged
waveform 2–32. . . . . . . . . . . . . . . . . . . . . . . . . . . . . . . . . . . . . . . . . . . . . .
Figure 2–24: Comparison display with averaged waveform 2–33. . . . . . . .
Figure 2–25: Concurrent display of spectrum and spectrogram 2–34. . . .
Figure 2–26: Tall display of spectrum and spectrogram 2–35. . . . . . . . . . .
Figure 2–27: Spectrogram view 2–36. . . . . . . . . . . . . . . . . . . . . . . . . . . . . . .
iv
WCA230A & WCA280A Service Manual

Table of Contents
Figure 2–28: Channel power measurement 2–38. . . . . . . . . . . . . . . . . . . . .
Figure 2–29: Channel power measurement (Channel Bandwidth
= 40 kHz) 2–39. . . . . . . . . . . . . . . . . . . . . . . . . . . . . . . . . . . . . . . . . . . . . .
Figure 2–30: Carrier frequency measurement 2–40. . . . . . . . . . . . . . . . . . .
Figure 2–31: MODE keys 2–41. . . . . . . . . . . . . . . . . . . . . . . . . . . . . . . . . . . .
Figure 2–32: IQ level measurement 2–42. . . . . . . . . . . . . . . . . . . . . . . . . . . .
Figure 2–33: Analysis range settings 2–44. . . . . . . . . . . . . . . . . . . . . . . . . . .
Figure 2–34: Frame and block 2–44. . . . . . . . . . . . . . . . . . . . . . . . . . . . . . . .
Figure 2–35: Changing the acquisition length 2–45. . . . . . . . . . . . . . . . . . .
Figure 2–36: Single view display 2–46. . . . . . . . . . . . . . . . . . . . . . . . . . . . . .
Figure 2–37: Scale settings 2–47. . . . . . . . . . . . . . . . . . . . . . . . . . . . . . . . . . .
Figure 2–38: USB ports (side panel) 2–48. . . . . . . . . . . . . . . . . . . . . . . . . . .
Figure 4–1: Spectrum of the calibration signal (50 MHz, –20 dBm) 4–5.
Figure 4–2: Setup display 4–6. . . . . . . . . . . . . . . . . . . . . . . . . . . . . . . . . . . .
Figure 4–3: Reference level setting and A/D overflow indicator 4–7. . . .
Figure 4–4: Spectrogram display 4–7. . . . . . . . . . . . . . . . . . . . . . . . . . . . . .
Figure 4–5: Diagnostic screen 4–8. . . . . . . . . . . . . . . . . . . . . . . . . . . . . . . . .
Figure 4–6: Initial test hookup 4–12. . . . . . . . . . . . . . . . . . . . . . . . . . . . . . . .
Figure 4–7: Initial test hookup 4–21. . . . . . . . . . . . . . . . . . . . . . . . . . . . . . . .
Figure 4–8: Initial hookup for setting up the power meter and
sensor 4–22. . . . . . . . . . . . . . . . . . . . . . . . . . . . . . . . . . . . . . . . . . . . . . . . .
Figure 4–9: Hookup for calibrating the power sensor 4–23. . . . . . . . . . . . .
Figure 4–10: Hookup for setting the signal generator output 4–23. . . . . . .
Figure 4–11: Hookup for checking the absolute amplitude
accuracy 4–24. . . . . . . . . . . . . . . . . . . . . . . . . . . . . . . . . . . . . . . . . . . . . . .
Figure 4–12: Initial test hookup 4–26. . . . . . . . . . . . . . . . . . . . . . . . . . . . . . .
Figure 4–13: Initial test hookup 4–29. . . . . . . . . . . . . . . . . . . . . . . . . . . . . . .
Figure 4–14: Initial test hookup 4–35. . . . . . . . . . . . . . . . . . . . . . . . . . . . . . .
Figure 4–15: Initial test hookup 4–38. . . . . . . . . . . . . . . . . . . . . . . . . . . . . . .
Figure 4–16: Initial test hookup 4–41. . . . . . . . . . . . . . . . . . . . . . . . . . . . . . .
Figure 4–17: Initial test hookup 4–44. . . . . . . . . . . . . . . . . . . . . . . . . . . . . . .
Figure 5–1: Hookup for storing the cal factors in the power meter 5–5. .
Figure 5–2: Initial test hookup 5–7. . . . . . . . . . . . . . . . . . . . . . . . . . . . . . . .
Figure 5–3: Hookup for calibrating the power sensor 5–8. . . . . . . . . . . . .
Figure 5–4: UNCAL display 5–10. . . . . . . . . . . . . . . . . . . . . . . . . . . . . . . . . .
Figure 5–5: Calibration menu 5–11. . . . . . . . . . . . . . . . . . . . . . . . . . . . . . . .
Figure 5–6: Center offset 5–12. . . . . . . . . . . . . . . . . . . . . . . . . . . . . . . . . . . .
Figure 5–7: DC offset 5–13. . . . . . . . . . . . . . . . . . . . . . . . . . . . . . . . . . . . . . .
WCA230A & WCA280A Service Manual
v

Table of Contents
Figure 5–8: Initial test hookup 5–14. . . . . . . . . . . . . . . . . . . . . . . . . . . . . . . .
Figure 5–9: Initial test hookup 5–18. . . . . . . . . . . . . . . . . . . . . . . . . . . . . . . .
Figure 5–10: R232 location (top view of the card cage) 5–19. . . . . . . . . . . .
Figure 5–11: Test hookup 5–21. . . . . . . . . . . . . . . . . . . . . . . . . . . . . . . . . . . .
Figure 5–12: Test hookup 5–22. . . . . . . . . . . . . . . . . . . . . . . . . . . . . . . . . . . .
Figure 6–1: Analyzer orientation 6–11. . . . . . . . . . . . . . . . . . . . . . . . . . . . . .
Figure 6–2: External modules 6–12. . . . . . . . . . . . . . . . . . . . . . . . . . . . . . . .
Figure 6–3: RF modules 6–13. . . . . . . . . . . . . . . . . . . . . . . . . . . . . . . . . . . . .
Figure 6–4: CPU board and disk modules 6–14. . . . . . . . . . . . . . . . . . . . . .
Figure 6–5: Mother board and its daughter boards 6–15. . . . . . . . . . . . . .
Figure 6–6: Bottom modules – Power supply 6–16. . . . . . . . . . . . . . . . . . . .
Figure 6–7: Bottom modules – RF1 (WCA230A) 6–17. . . . . . . . . . . . . . . . .
Figure 6–8: Bottom modules – RF1 (WCA280A) 6–18. . . . . . . . . . . . . . . . .
Figure 6–9: Front panel modules 6–19. . . . . . . . . . . . . . . . . . . . . . . . . . . . . .
Figure 6–10: Chassis modules 6–20. . . . . . . . . . . . . . . . . . . . . . . . . . . . . . . .
Figure 6–11: Guide to removal procedures 6–21. . . . . . . . . . . . . . . . . . . . . .
Figure 6–12: Line cord and cabinet removal 6–23. . . . . . . . . . . . . . . . . . . .
Figure 6–13: Front cushion removal 6–24. . . . . . . . . . . . . . . . . . . . . . . . . . .
Figure 6–14: Cabinet modules removal 6–26. . . . . . . . . . . . . . . . . . . . . . . . .
Figure 6–15: RF modules removal 6–28. . . . . . . . . . . . . . . . . . . . . . . . . . . . .
Figure 6–16: CPU board removal 6–32. . . . . . . . . . . . . . . . . . . . . . . . . . . . .
Figure 6–17: Disk module removal 6–34. . . . . . . . . . . . . . . . . . . . . . . . . . . .
Figure 6–18: A10 A/D board removal 6–37. . . . . . . . . . . . . . . . . . . . . . . . . .
Figure 6–19: Daughter boards removal 6–40. . . . . . . . . . . . . . . . . . . . . . . .
Figure 6–20: Mother board removal 6–42. . . . . . . . . . . . . . . . . . . . . . . . . . .
Figure 6–21: Power supply 1 and 2 removal 6–44. . . . . . . . . . . . . . . . . . . . .
Figure 6–22: Power supply modules removal 6–46. . . . . . . . . . . . . . . . . . . .
Figure 6–23: RF1 modules removal – 1 6–49. . . . . . . . . . . . . . . . . . . . . . . . .
Figure 6–24: RF1 modules removal – 2 (WCA230A) 6–51. . . . . . . . . . . . . .
Figure 6–25: RF1 modules removal – 2 (WCA280A) 6–53. . . . . . . . . . . . . .
Figure 6–26: Front panel assembly removal 6–56. . . . . . . . . . . . . . . . . . . . .
Figure 6–27: Front panel modules removal 6–57. . . . . . . . . . . . . . . . . . . . .
Figure 6–28: LCD display removal 6–60. . . . . . . . . . . . . . . . . . . . . . . . . . . .
Figure 6–29: Fan and side panel removal 6–62. . . . . . . . . . . . . . . . . . . . . . .
Figure 6–30: Board guide bracket removal 6–63. . . . . . . . . . . . . . . . . . . . .
Figure 6–31: Rear panel modules 6–65. . . . . . . . . . . . . . . . . . . . . . . . . . . . .
Figure 6–32: Troubleshooting procedure 1 — Power supply system 6–68.
vi
WCA230A & WCA280A Service Manual

Table of Contents
Figure 6–33: Troubleshooting procedure 2 — Display and CPU
system 6–69. . . . . . . . . . . . . . . . . . . . . . . . . . . . . . . . . . . . . . . . . . . . . . . . .
Figure 6–34: Troubleshooting procedure 3 — Signal path 6–70. . . . . . . . .
Figure 6–35: Top view for cable interconnection 6–75. . . . . . . . . . . . . . . . .
Figure 6–36: Bottom view for cable interconnection (WCA230A) 6–76. . .
Figure 6–37: Bottom view for cable interconnection (WCA280A) 6–77. . .
Figure 6–38: A70 DC power supply board 6–79. . . . . . . . . . . . . . . . . . . . . .
Figure 9–1: Block diagram 9–3. . . . . . . . . . . . . . . . . . . . . . . . . . . . . . . . . . .
Figure 9–2: Interconnect diagram (WCA230A) 9–5. . . . . . . . . . . . . . . . . .
Figure 9–3: Interconnect diagram (WCA280A) 9–7. . . . . . . . . . . . . . . . . .
Figure 10–1: External modules 10–5. . . . . . . . . . . . . . . . . . . . . . . . . . . . . . .
Figure 10–2: Front-panel assembly – 1 10–7. . . . . . . . . . . . . . . . . . . . . . . . .
Figure 10–3: Front-panel assembly – 2 10–9. . . . . . . . . . . . . . . . . . . . . . . . .
Figure 10–4: RF modules 10–11. . . . . . . . . . . . . . . . . . . . . . . . . . . . . . . . . . . .
Figure 10–5: Mother board and its daughter boards – 1 10–13. . . . . . . . . .
Figure 10–6: Mother board and its daughter boards – 2 10–15. . . . . . . . . .
Figure 10–7: Disk modules 10–17. . . . . . . . . . . . . . . . . . . . . . . . . . . . . . . . . . .
Figure 10–8: Bottom modules – Power supply 10–19. . . . . . . . . . . . . . . . . . .
Figure 10–9: Bottom modules – RF1 (WCA230A) 10–21. . . . . . . . . . . . . . . .
Figure 10–10: Bottom modules – RF1 (WCA280A) 10–23. . . . . . . . . . . . . . .
Figure 10–11: Bottom modules – Interconnection 10–25. . . . . . . . . . . . . . . .
Figure 10–12: Chassis modules – 1 10–27. . . . . . . . . . . . . . . . . . . . . . . . . . . .
Figure 10–13: Chassis modules – 2 10–29. . . . . . . . . . . . . . . . . . . . . . . . . . . .
Figure 10–14: Rackmount – 1 10–31. . . . . . . . . . . . . . . . . . . . . . . . . . . . . . . .
Figure 10–15: Rackmount – 2 10–33. . . . . . . . . . . . . . . . . . . . . . . . . . . . . . . .
WCA230A & WCA280A Service Manual
vii

Table of Contents
List of Tables
Table 1–1: Frequency 1–10. . . . . . . . . . . . . . . . . . . . . . . . . . . . . . . . . . . . . . .
Table 1–2: Spectrum purity 1–10. . . . . . . . . . . . . . . . . . . . . . . . . . . . . . . . . .
Table 1–3: Noise sideband 1–11. . . . . . . . . . . . . . . . . . . . . . . . . . . . . . . . . . .
Table 1–4: Input 1–12. . . . . . . . . . . . . . . . . . . . . . . . . . . . . . . . . . . . . . . . . . .
Table 1–5: Amplitude 1–12. . . . . . . . . . . . . . . . . . . . . . . . . . . . . . . . . . . . . . .
Table 1–6: Dynamic range 1–13. . . . . . . . . . . . . . . . . . . . . . . . . . . . . . . . . . .
Table 1–7: Spurious response 1–14. . . . . . . . . . . . . . . . . . . . . . . . . . . . . . . .
Table 1–8: Acquisition 1–15. . . . . . . . . . . . . . . . . . . . . . . . . . . . . . . . . . . . . .
Table 1–9: Sampling rate 1–15. . . . . . . . . . . . . . . . . . . . . . . . . . . . . . . . . . . .
Table 1–10: Frame time 1–16. . . . . . . . . . . . . . . . . . . . . . . . . . . . . . . . . . . . .
Table 1–11: Digital demodulation 1–16. . . . . . . . . . . . . . . . . . . . . . . . . . . . .
Table 1–12: Analog demodulation 1–18. . . . . . . . . . . . . . . . . . . . . . . . . . . . .
Table 1–13: RBW (Resolution Bandwidth) 1–19. . . . . . . . . . . . . . . . . . . . .
Table 1–14: Trigger 1–20. . . . . . . . . . . . . . . . . . . . . . . . . . . . . . . . . . . . . . . . .
Table 1–15: Measurement function 1–20. . . . . . . . . . . . . . . . . . . . . . . . . . . .
Table 1–16: Display 1–21. . . . . . . . . . . . . . . . . . . . . . . . . . . . . . . . . . . . . . . .
Table 1–17: Marker, trace, and display line 1–21. . . . . . . . . . . . . . . . . . . . .
Table 1–18: Controller and interface 1–21. . . . . . . . . . . . . . . . . . . . . . . . . .
Table 1–19: Power requirements 1–22. . . . . . . . . . . . . . . . . . . . . . . . . . . . . .
Table 1–20: Power connector 1–22. . . . . . . . . . . . . . . . . . . . . . . . . . . . . . . . .
Table 1–21: Physical characteristics 1–23. . . . . . . . . . . . . . . . . . . . . . . . . . .
Table 1–22: Environmental characteristics 1–23. . . . . . . . . . . . . . . . . . . . .
Table 1–23: Certifications and compliances 1–24. . . . . . . . . . . . . . . . . . . . .
viii
Table 2–1: Power-cord conductor identification 2–1. . . . . . . . . . . . . . . . .
Table 2–2: Power cord identification 2–2. . . . . . . . . . . . . . . . . . . . . . . . . .
Table 4–1: Span and RBW 4–6. . . . . . . . . . . . . . . . . . . . . . . . . . . . . . . . . . .
Table 4–2: Internal diagnostic program 4–8. . . . . . . . . . . . . . . . . . . . . . . .
Table 4–3: Test equipment 4–10. . . . . . . . . . . . . . . . . . . . . . . . . . . . . . . . . . .
Table 4–4: Spurious measurement 4–40. . . . . . . . . . . . . . . . . . . . . . . . . . . .
Table 5–1: Test equipment 5–2. . . . . . . . . . . . . . . . . . . . . . . . . . . . . . . . . . .
Table 6–1: Relative susceptibility to static-discharge damage 6–3. . . . . .
Table 6–2: External inspection check list 6–5. . . . . . . . . . . . . . . . . . . . . . .
WCA230A & WCA280A Service Manual

Table of Contents
Table 6–3: Internal inspection check list 6–6. . . . . . . . . . . . . . . . . . . . . . .
Table 6–4: Summary of procedures 6–9. . . . . . . . . . . . . . . . . . . . . . . . . . .
Table 6–5: Tools required for module removal 6–10. . . . . . . . . . . . . . . . . .
Table 6–6: Normal supply voltages 6–78. . . . . . . . . . . . . . . . . . . . . . . . . . . .
Table 6–7: Test point voltages on A70 6–79. . . . . . . . . . . . . . . . . . . . . . . . . .
Table 6–8: Symptoms and faulty modules 6–80. . . . . . . . . . . . . . . . . . . . . .
Table 7–1: Power cord identification 7–2. . . . . . . . . . . . . . . . . . . . . . . . . .
Table 7–2: Standard accessories 7–3. . . . . . . . . . . . . . . . . . . . . . . . . . . . . .
Table 7–3: Accessories for optional software 7–3. . . . . . . . . . . . . . . . . . . .
Table 7–4: Optional accessories 7–4. . . . . . . . . . . . . . . . . . . . . . . . . . . . . . .
WCA230A & WCA280A Service Manual
ix

Table of Contents
x
WCA230A & WCA280A Service Manual

General Safety Summary
Review the following safety precautions to avoid injury and prevent damage to
this product or any products connected to it. To avoid potential hazards, use this
product only as specified.
Only qualified personnel should perform service procedures.
To Avoid Fire or
Personal Injury
Use Proper Power Cord. Use only the power cord specified for this product and
certified for the country of use.
Ground the Product. This product is grounded through the grounding conductor
of the power cord. To avoid electric shock, the grounding conductor must be
connected to earth ground. Before making connections to the input or output
terminals of the product, ensure that the product is properly grounded.
Observe All Terminal Ratings. To avoid fire or shock hazard, observe all ratings
and markings on the product. Consult the product manual for further ratings
information before making connections to the product.
Do Not Operate Without Covers. Do not operate this product with covers or panels
removed.
Avoid Exposed Circuitry. Do not touch exposed connections and components
when power is present.
Do Not Operate With Suspected Failures. If you suspect there is damage to this
product, have it inspected by qualified service personnel.
Do Not Operate in Wet/Damp Conditions.
Do Not Operate in an Explosive Atmosphere.
Provide Proper Ventilation. Refer to the manual’s installation instructions for
details on installing the product so it has proper ventilation.
Symbols and Terms
WCA230A & WCA280A Service Manual
Terms in this Manual. These terms may appear in this manual:
WARNING. Warning statements identify conditions or practices that could result
in injury or loss of life.
CAUTION. Caution statements identify conditions or practices that could result in
damage to this product or other property.
xi

General Safety Summary
Terms on the Product. These terms may appear on the product:
DANGER indicates an injury hazard immediately accessible as you read the
marking.
WARNING indicates an injury hazard not immediately accessible as you read the
marking.
CAUTION indicates a hazard to property including the product.
Symbols on the Product. The following symbols may appear on the product:
WARNING
High Voltage
Protective Ground
(Earth) Terminal
CAUTION
Refer to Manual
xii
WCA230A & WCA280A Service Manual

Service Safety Summary
Only qualified personnel should perform service procedures. Read this Service
Safety Summary and the General Safety Summary before performing any service
procedures.
Do Not Service Alone. Do not perform internal service or adjustments of this
product unless another person capable of rendering first aid and resuscitation is
present.
Disconnect Power. To avoid electric shock, switch off the instrument power, and
then disconnect the power cord from the mains power.
Use Care When Servicing With Power On. Dangerous voltages or currents may
exist in this product. Disconnect power, remove battery (if applicable), and
disconnect test leads before removing protective panels, soldering, or replacing
components.
To avoid electric shock, do not touch exposed connections.
WCA230A & WCA280A Service Manual
xiii

Service Safety Summary
xiv
WCA230A & WCA280A Service Manual

Preface
Manual Structure
This is the service manual for the WCA230A and WCA280A Portable Wireless
Communication Analyzers. The manual contains information needed to service
the analyzer to the module level.
This manual is divided into sections, such as Specifications and Theory of
Operation. Further, some sections are divided into subsections, such as
Product Description and Removal and Installation Procedures.
Sections containing procedures also contain introductions to those procedures.
Be sure to read these introductions because they provide information needed to
do the service correctly and efficiently. The manual section name and a brief
description of each is given below.
H Specifications contains a description of the analyzer and the applicable
characteristics.
H Operating Information includes general information and operating instruc-
tions.
H Theory of Operation contains circuit descriptions that support service to the
module level.
H Performance Verification contains procedures for confirming that the
analyzer functions properly and meets warranted limits.
H Adjustment Procedures contains procedures for adjusting the analyzer to
meet warranted limits.
H Maintenance contains information and procedures for performing preventive
and corrective maintenance of the analyzer. These instructions include
cleaning, module removal and installation, and fault isolation to the module.
H Options contains information on servicing factory-installed options.
H Electrical Parts List contains a statement referring you to Mechanical Parts
List, where both electrical and mechanical modules are listed.
H Diagrams contains a block diagram and an interconnection diagram.
H Mechanical Parts List includes a table of all replaceable modules, their
descriptions, and their Tektronix part numbers.
WCA230A & WCA280A Service Manual
xv

Preface
Manual Conventions
This manual uses certain conventions that you should become familiar with.
Some sections of the manual contain procedures for you to perform. To keep
those instructions clear and consistent, this manual uses the following conventions:
H Names of front panel controls and menus appear in the same case (initial
capitals, all uppercase, etc.) in the manual as is used on the analyzer front
panel and menus. Front panel names are all upper-case letters; for example,
SPAN, TRIG, and SELECT.
H Instruction steps are numbered unless there is only one step.
Modules
Safety
Throughout this manual, any replaceable component, assembly, or part of the
analyzer is referred to generically as a module. In general, a module is an
assembly (like a circuit board), rather than a component (like a resistor or an
integrated circuit). Sometimes a single component is a module; for example, the
chassis of the analyzer is a module.
Symbols and terms related to safety appear in the Safety Summary near the
beginning of this manual.
Finding Other Information
Other documentation for the WCA230A and WCA280A analyzers includes:
H The WCA230A and WCA280A User Manual contains a tutorial to quickly
H The WCA230A and WCA280A Programmer Manual explains how to use the
describe how to operate the analyzer. It also includes an in-depth discussion
on how to more completely use the analyzer features.
GPIB interface to remotely control the analyzer.
xvi
WCA230A & WCA280A Service Manual

Introduction
This manual contains information needed to properly service the WCA230A and
WCA280A Portable Wireless Communication Analyzers as well as general
information critical to safe and effective servicing.
To prevent personal injury or damage to the analyzer, consider the following
before attempting service:
H The procedures in this manual should be performed only by a qualified
service person.
H Read the General Safety Summary and the Service Safety Summary,
beginning on page xi.
H Read Preparation for Use in section 2, Operating Information.
When using this manual for servicing, be sure to follow all warnings, cautions,
and notes.
Performance Check Interval
Strategy for Servicing
Generally, the performance check described in section 4, Performance Verification, should be done every 12 months. In addition, performance check is
recommended after module replacement.
If the analyzer does not meet performance criteria, repair is necessary.
Throughout this manual, the term “module” refers to any field-replaceable
component, assembly, or part of the analyzer.
This manual contains all the information needed for periodic maintenance of the
analyzer. (Examples of such information are procedures for checking performance.)
Further, it contains all information for corrective maintenance down to the
module level. To isolate a failure to a module, use the fault isolation procedures
found in Troubleshooting, part of section 6, Maintenance. To remove and replace
any failed module, follow the instructions in Removal and Installation Proce-
dures, also part of section 6. After isolating a faulty module, replace it with a
fully-tested module obtained from the factory. Section 10, Mechanical Parts
List, contains part number and ordering information for all replaceable modules.
WCA230A & WCA280A Service Manual
xvii

Introduction
xviii
WCA230A & WCA280A Service Manual

Specifications


Product Overview
The WCA230A and the WCA280A are portable wireless communication
analyzers capable of real-time spectrum analysis and modulated-signal analysis.
The analyzers enable transmitter characteristic evaluation required for mobile
communication systems. Large capacity memory that collects W-CDMA data
up to 2.5 seconds is standard, ensuring even accurate collection and analysis of
super frame signals defined in the 3GPP standard.
Features
H DC to 3 GHz (WCA230A) / 8 GHz (WCA280A) measurement
H 100 Hz to 3 GHz measurement span and 15 MHz vector span
H Real-time analysis for seamless capture of time-varying RF signals
H Spectrum analysis of power, ACPR, C/N, OBW, EBW, and spurious
H Analog modulation analysis of AM, PM, FM, ASK and FSK signals
frequency range
H Digital modulation analysis ranging from BPSK to 256QAM
H Time characteristic analysis including pulse measurements
H CCDF analysis
H AM/AM and AM/PM distortion analyses
H Time-correlated simultaneous views
H Spectrum display
H Spectrogram display (frequency versus time versus power)
H Time domain display (IS-95 standard)
H Analog demodulation display:
time versus modulation factor, phase, or frequency
H Digital demodulation display:
constellation, eye diagram, symbol table, or EVM
H 8.4 inch TFT color display and sturdy cabinet
WCA230A & WCA280A Service Manual
1-1

Product Overview
Application
The WCA230A and the WCA280A can perform real-time analysis for the
following purposes:
H Signal quality analysis of analog and digital modulation
H Understanding frequency and spectral occupancy behavior over time
H Capture and characterization of undesired, unknown, or interfering signals
H Device/system design or operational diagnostic measurement
H Getting answers to elusive EMI problems
H VCO/synthesizer design
H RFID device characterization
H General purpose digital modulation vector signal analysis
H Spectrum monitoring
H Radar measurements
H Characterization, troubleshooting, and verification of wireless designs
(Option):
H GSM/EDGE
H W-CDMA
H HSDPA
H cdma2000 1x
H cdma2000 1xEV–DO
H TD-SCDMA
Difference between WCA230A and WCA280A
The WCA230A and the WCA280A have the same functions except for their
measurement frequency ranges:
WCA230A DC to 3 GHz. . . . . . . . .
WCA280A DC to 8 GHz. . . . . . . . .
1-2
Descriptions in this manual apply to both the WCA230A and the WCA280A
unless otherwise noted.
WCA230A & WCA280A Service Manual

RealĆTime Analysis
Product Overview
This section explains real-time analysis with the comparison of conventional
swept spectrum analyzer and real-time spectrum analyzer.
Conventional Swept
Spectrum Analyzer
Figure 1–1 is a block diagram of the conventional swept spectrum analyzer.
There are two RF input signals in this example. The RF signal is converted to IF
(intermediate frequency) by the swept local oscillator. IF output goes through a
bandpass filter, where resolution of the spectrum analyzer is defined.
RF input
F
Mixer
Resolution
Local
oscillator
filter
Detector
Display
F
Figure 1-1: Concept of the swept spectrum analyzer
The filter is swept from F
start
to F
. See Figure 1–2. Only signals within the
stop
filter bandwidth are observed at one point in time. Signal A is detected first and
then signal B is detected and displayed.
NOTE. An intermittent signal, such as a burst phenomenon, will not be detected
unless it is present at the exact moment that the filter is being swept past it.
F
start
Figure 1-2: Sweep of resolution filter
WCA230A & WCA280A Service Manual
Sweep
AB
F
stop
1-3
Product Overview
RealĆTime Spectrum
Analyzer
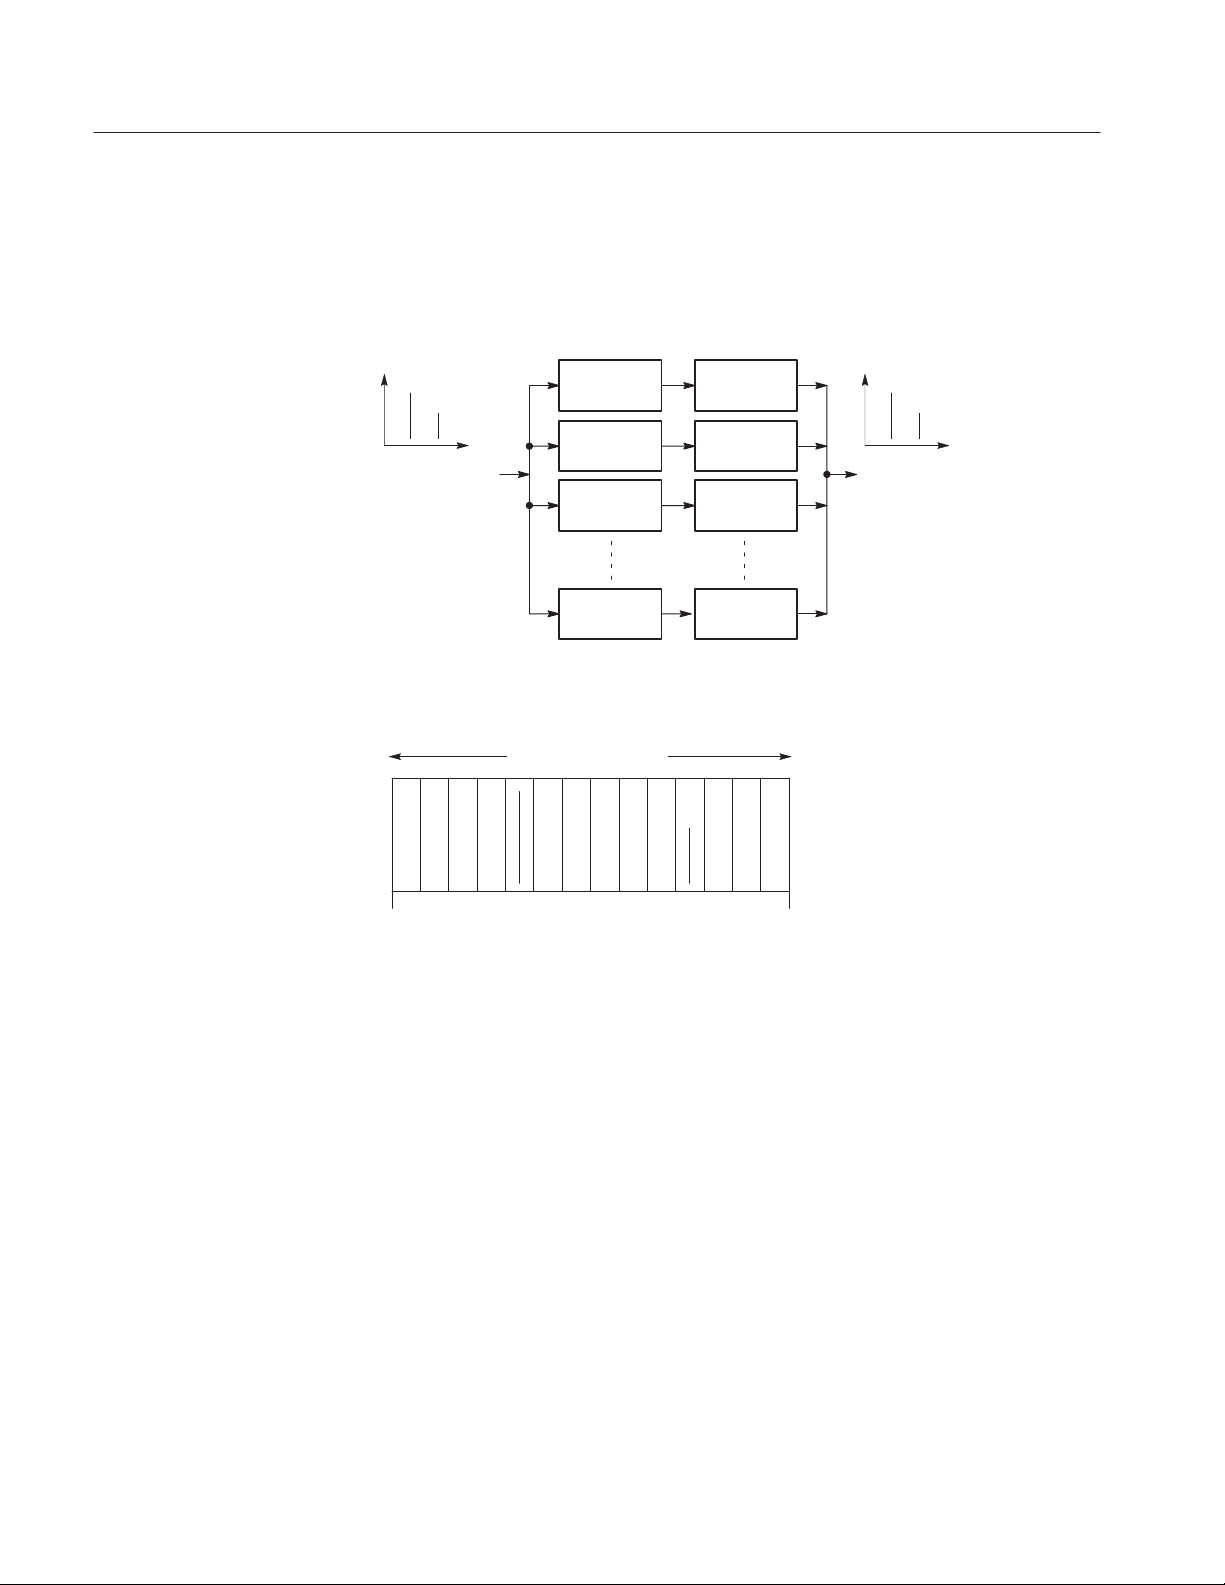
The real-time spectrum analyzer is conceptually equipped with a series of
bandpass filters as shown in Figure 1–3. Signals passing through those filters are
concurrently observed and recorded continuously. Signals A and B are concurrently acquired and displayed as shown in Figure 1–4.
Resolution
filter 1
FF
RF input
Resolution
filter 2
Resolution
filter 3
Resolution
filter N
Detector 1
Detector 2
Display
Detector 3
Detector N
Figure 1-3: Concept of the realĆtime spectrum analyzer
Concurrent acquisition
AB
F
start
Figure 1-4: Concurrent acquisition
F
stop
1-4
WCA230A & WCA280A Service Manual
Product Overview
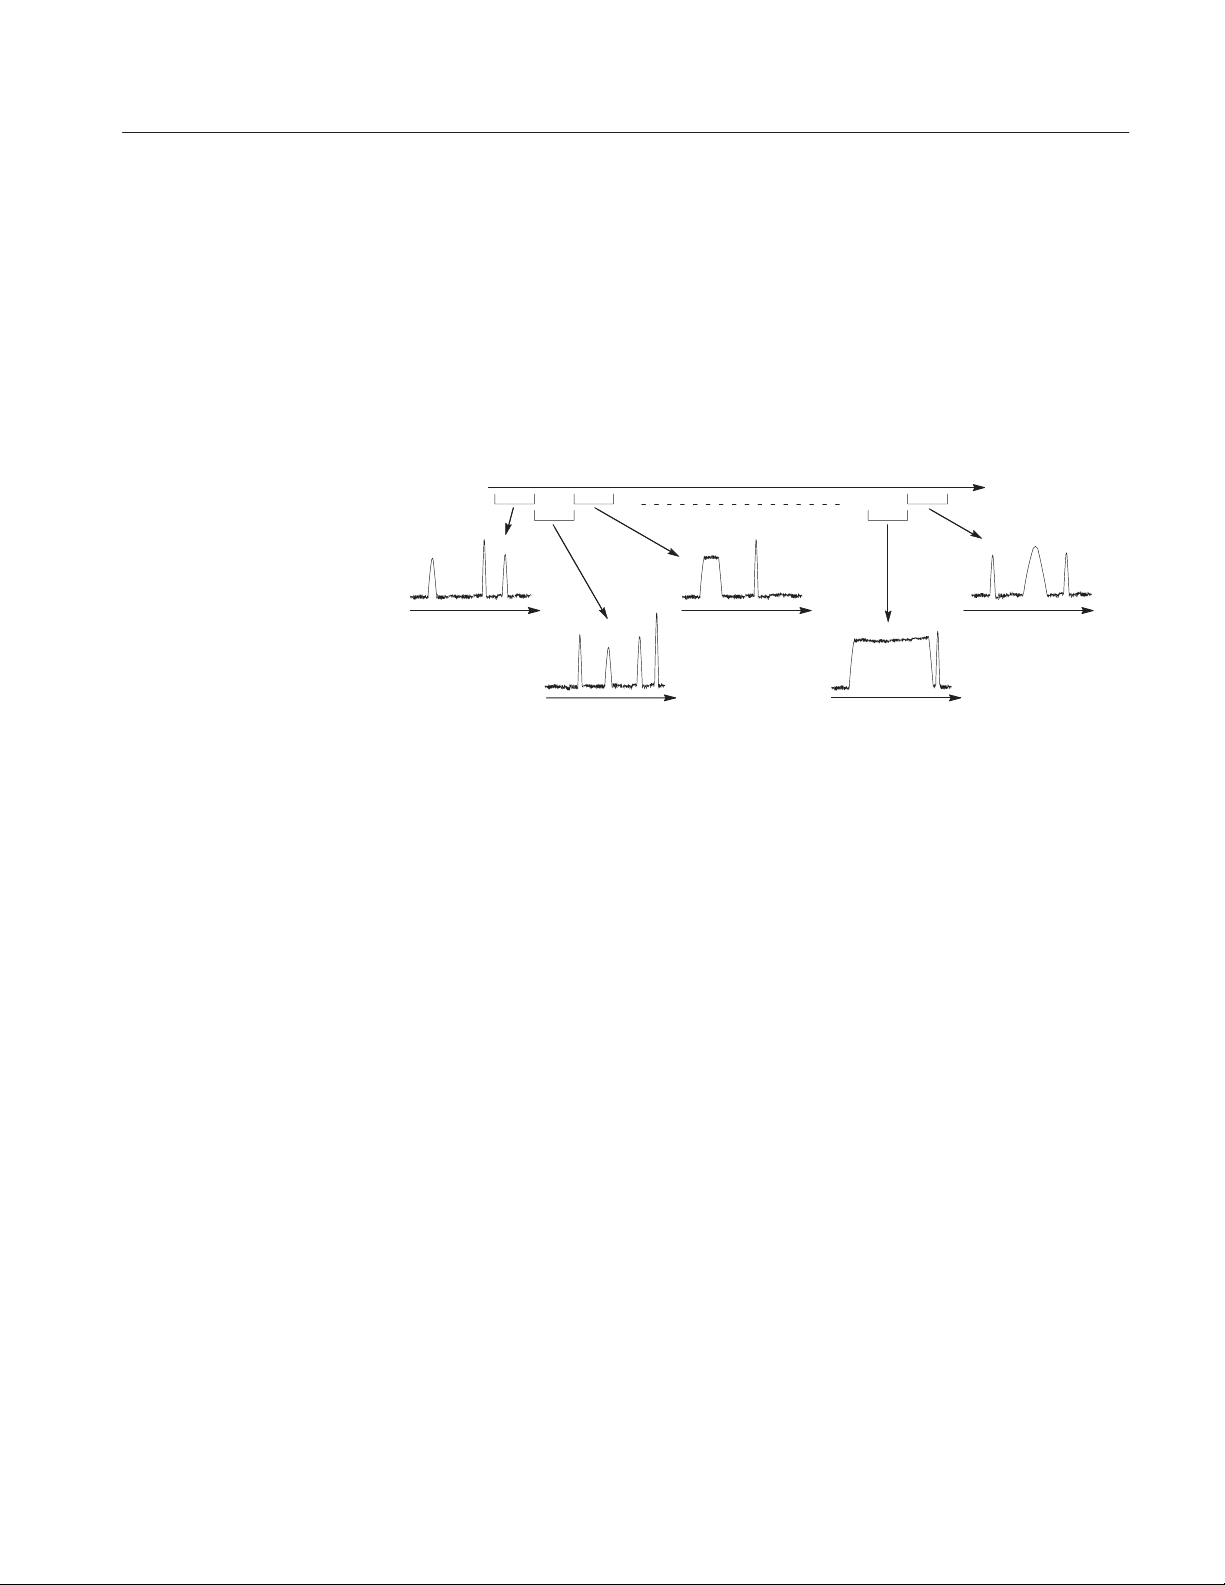
The method used to concurrently acquire signals in a certain frequency range is
not bandpass filters, but FFT (Fast Fourier Transformation). The WCA230A or
WCA280A first acquires a series of frames of data in the time domain, as shown
in Figure 1–5, and then performs the FFT process for each frame. This method
enables continuous analysis of spectra and ensures the capture of real-time
phenomenon such as burst signals in digital mobile communication. The
WCA230A and the WCA280A are equipped with a 51.2 MHz A/D converter to
analyze the spectrum by single scanning for spans up to 15 MHz.
Time
Frame
F F F
F F
Figure 1-5: Frame acquisition
WCA230A & WCA280A Service Manual
1-5

Product Overview
Architecture
Figure 1–6 shows the block diagram of the signal processing system.
RF input
Option
3 GHz / 8 GHz
down converter
External trigger input Trigger detection
Q input
I Input
IF sampling
A/D converter
(optional)
IF sampling
A/D converter
Memory controller
Digital
down converter
FFT
Extended trigger
(optional)
Data memory
64 MB (standard)
256 MB (optional)
Local bus
1-6
Display
Mass Storage
Devices
Figure 1-6: Block diagram
HDD
FDD
PCI bridge
Windows
board PC
USB
LAN
GPIB
VGA
Front panel key
External interface
WCA230A & WCA280A Service Manual

Product Overview
3 GHz / 8 GHz
Down Converter
IF Sampling A/D Converter
Digital Down Converter
Converts the RF signal, input through the front-panel INPUT connector, into a
20 MHz IF signal. This converter processes signals up to 3 GHz for WCA230A
and 8 GHz for WCA280A by IF conversions in three stages. A 10 MHz
oscillator provides a high-accuracy reference for all stages of IF conversion. The
converter also adjusts signals for A/D conversion using a low-noise amplifier,
fine-tuning attenuator, and anti-alias filter. The output signal from the down
converter is sent to the IF sampling A/D converter described below.
The IF analog output from the down converter enters the A/D converter through
the fine-tuning attenuator, low-noise amplifier, and anti-alias filter, to be
converted into a digital signal. The sampling rate of the A/D converter is
51.2 MHz with a resolution of 14 bits.
The digital down converter splits the real signal from the A/D converter into
complex (I and Q) components and limits the frequency span of the resulting
signal.
With Option 03, you can enter I and Q signals at this point in the block diagram.
The down converter performs span and center frequency fine-tuning. This
converter consists of two primary stages. In the baseband, the first stage converts
a 0 to 15 MHz real signal into a complex signal of ±7.5 MHz. The second stage
converts frequency to set any center frequency.
FFT/Extended Trigger
(Optional)
A decimating filter between stages changes the span by effectively reducing the
sampling rate. A 503 tap FIR filter and four stage comb filter allows extremely
accurate filtering with minimal spurious emissions.
The data streams from the digital down converter are then divided into frames
and saved in data memory.
Option 02 provides a real-time digital trigger function that monitors the
frequency spectrum for the occurrence of specific events. A trigger mask is used
to set conditions for trigger.
The FFT processor performs high-speed calculations to create extended trigger
signals. The FFT processor performs 1024-point complex FFT at high speed to
create extended trigger signals. The FFT processor consists of an input buffer,
FFT calculation DSP, output buffer, and timing control circuit. Performing a
1024-point complex FFT at 12,500 times per second allows the trigger to operate
in real time in spans up to 15 MHz.
Because the trigger comparator is continuously operating at the maximum rate,
no events will be missed. The pre-trigger and post-trigger positions can be set as
needed; events before and after the trigger event can be measured.
WCA230A & WCA280A Service Manual
1-7

Product Overview
Data Memory
Windows Board PC
A high-speed 64 MB standard SDRAM stores spectrum data. It is expanded to
256 MB with Option 02. For each data point, I and Q data use 2 bytes. This
memory can store 16,000 frames for 1 waveform = 1024 points of analysis, and
64,000 frames for Option 02. For example, W-CDMA communication data can
be captured for up to 2.5 seconds on standard and 10 seconds on Option 02. The
memory is accessed from the system controller via the ISA/PCI bridge.
The system controller board has an Intel Pentium III CPU. It runs on Windows XP, and controls menu operation from the front panel keys. It is equipped
with a 20 GB hard disk and 3.5 inch disk drive to store data and settings.
Waveforms, menus, and measurement results are shown on the color display,
which uses an 8.4 inch XGA TFT-LCD module.
The standard analyzer has the following external interfaces:
H USB (for mouse, keyboard, and/or printer)
H LAN (Ethernet 10/100BASE-T)
H GPIB
H VGA (for an external monitor)
1-8
WCA230A & WCA280A Service Manual

Specifications
This section contains the WCA230A and WCA280A Portable Wireless
Communication Analyzers specifications. All specifications are guaranteed
unless labeled Typical. Typical specifications are provided for your convenience.
NOTE. In these tables, those warranted characteristics that are checked in the
Performance Verification appear with the n symbol in the Characteristics
column.
Performance Conditions
The performance limits in this specification are valid with these conditions:
H The analyzer must have been calibrated and adjusted at an ambient tempera-
H The analyzer must be in an environment with temperature, altitude,
ture between +20
humidity, and vibration within the operating limits described in these
specifications.
_C and +30 _C.
H The analyzer must have had a warm-up period of at least 20 minutes.
WCA230A & WCA280A Service Manual
1-9

Specifications
Electrical Characteristics
Table 1-1: Frequency
Characteristics Description
Measurement frequency
Frequency range Baseband: DC to 20 MHz
RF: 15 MHz to 3 GHz (WCA230A)
RF1: 15 MHz to 3.5 GHz (WCA280A)
RF2: 3.5 GHz to 6.5 GHz (WCA280A)
RF3: 5 GHz to 8 GHz (WCA280A)
Center frequency setting resolution 0.1 Hz
Frequency marker readout accuracy Baseband: ±(RE × MF + 0.001 × Span + 0.2) Hz
RF, RF1 to 3: ±(RE × MF + 0.001 × Span+2)Hz
RE: Reference frequency error; MF: Marker frequency [Hz]
n At specified frequency Baseband, Frequency = 10 MHz, Span=1MHz
Marker: ±1 kHz; Carrier frequency measurement: ±1.2 Hz
RF/RF1, Frequency = 2 GHz, Span=1MHz
Marker: ±1.2 kHz; Carrier frequency measurement: ±210 Hz
RF2, Frequency = 5 GHz, Span = 1 MHz (WCA280A only)
Marker: ±1.5 kHz; Carrier frequency measurement: ±510 Hz
RF3, Frequency = 7 GHz, Span = 1 MHz (WCA280A only)
Marker: ±1.7 kHz; Carrier frequency measurement: ±710 Hz
Residual FM (Typical) 2Hzp-p
Span accuracy ±1 bin
RBW filter bandwidth accuracy 0.1%
Reference frequency
Aging per day 1 × 10⁻⁹(after 30 days of operation)
Aging per year 1 × 10⁻⁷(after 30 days of operation)
Temperature drift 1 × 10⁻⁷(10 to 40 _C)
n Total frequency error 2 × 10⁻⁷(within one year after calibration)
Reference output level >0 dBm
External reference input 10 MHz, -10 to +6 dBm, Spurious level <-80 dBc within 100 kHz offset
Table 1-2: Spectrum purity
Characteristics Description
n Spectrum purity (Frequency = 1500 MHz)
Carrier offset = 10 kHz, Span = 100 kHz -100 dBc/Hz
Carrier offset = 100 kHz, Span=1MHz -105 dBc/Hz
Carrier offset = 1 MHz, Span=5MHz -125 dBc/Hz
1-10
WCA230A & WCA280A Service Manual

Table 1-3: Noise sideband
Characteristics Description
Noise sideband Offset
Frequency = 1000 MHz -100 dBc/Hz
-105 dBc/Hz
-105 dBc/Hz
-105 dBc/Hz
-112 dBc/Hz
-132 dBc/Hz
-135 dBc/Hz
-135 dBc/Hz
Frequency = 2000 MHz -96 dBc/Hz
-104 dBc/Hz
-105 dBc/Hz
-105 dBc/Hz
-112 dBc/Hz
-132 dBc/Hz
-135 dBc/Hz
-135 dBc/Hz
Frequency = 6000 MHz
(WCA280A only)
Typical Noise sideband Offset
Frequency = 1000 MHz -103 dBc/Hz
Frequency = 2000 MHz -99 dBc/Hz
-87 dBc/Hz
-104 dBc/Hz
-105 dBc/Hz
-105 dBc/Hz
-112 dBc/Hz
-128 dBc/Hz
-130 dBc/Hz
-130 dBc/Hz
-108 dBc/Hz
-108 dBc/Hz
-108 dBc/Hz
-115 dBc/Hz
-135 dBc/Hz
-138 dBc/Hz
-138 dBc/Hz
-107 dBc/Hz
-108 dBc/Hz
-108 dBc/Hz
-115 dBc/Hz
-135 dBc/Hz
-138 dBc/Hz
-138 dBc/Hz
1 kHz
10 kHz
20 kHz
30 kHz
100 kHz
1 MHz
5 MHz
7 MHz
1 kHz
10 kHz
20 kHz
30 kHz
100 kHz
1 MHz
5 MHz
7 MHz
1 kHz
10 kHz
20 kHz
30 kHz
100 kHz
1 MHz
5 MHz
7 MHz
1 kHz
10 kHz
20 kHz
30 kHz
100 kHz
1 MHz
5 MHz
7 MHz
1 kHz
10 kHz
20 kHz
30 kHz
100 kHz
1 MHz
5 MHz
7 MHz
Specifications
WCA230A & WCA280A Service Manual
1-11

Specifications
Table 1-3: Noise sideband (Cont.)
Characteristics Description
Frequency = 6000 MHz
(WCA280A only)
-90 dBc/Hz
-107 dBc/Hz
-108 dBc/Hz
-108 dBc/Hz
-115 dBc/Hz
-131 dBc/Hz
-133 dBc/Hz
-133 dBc/Hz
1 kHz
10 kHz
20 kHz
30 kHz
100 kHz
1 MHz
5 MHz
7 MHz
Table 1-4: Input
Characteristics Description
Signal input
Input connector N type (RF and baseband input); BNC type (Option 03 IQ input)
Input impedance 50 W
VSWR <1.4 (2.5 GHz, RF attenuation≥10 dB)
<1.8 (7.5 GHz, RF attenuation≥10 dB, WCA280A only)
Typical <1.4 (300 kHz to 10 MHz, RF attenuation≥10 dB)
<1.3 (10 MHz to 3 GHz, RF attenuation≥10 dB)
<1.4 (3 GHz to 8 GHz, RF attenuation≥10 dB, WCA280A only)
Maximum input level
Maximum DC voltage ±0.2 V (RF, RF1 to 3)
±5 V (Baseband)
±5 V (Option 03 IQ input)
Maximum input power +30 dBm (RF, RF1 to 3, RF attenuation≥10 dB)
Input attenuator
RF/Baseband attenuator 0 to 50 dB (2 dB step in RF/RF1/Baseband; 10 dB step in RF2/RF3)
I/Q attenuator 0 to 30 dB (10 dB step)
Table 1-5: Amplitude
Characteristics Description
Reference level
Reference level setting range -30 to +20 dBm (2 dB step, Baseband)
-51 to +30 dBm (1 dB step, RF/RF1)
-50 to +30 dBm (1 dB step, RF2/RF3, WCA280A only)
-10 to +20 dBm (10 dB step, Option 03 IQ input)
Accuracy (-10 to -50 dBm)
±0.2 dB (at 50 MHz, 10 dB attenuation, 20 to 30 _C)
1-12
WCA230A & WCA280A Service Manual

Table 1-5: Amplitude (Cont.)
Characteristics Description
Frequency response (RF attenuation≥10 dB)
n at 20 to 30 _C ±0.5 dB (Baseband)
±1.2 dB (RF/RF1)
±1.7 dB (RF2, WCA280A only)
±1.7 dB (RF3, WCA280A only)
Typical ±0.3 dB (100 kHz to 20 MHz)
±0.5 dB (10 MHz to 3 GHz)
±0.5 dB (10 MHz to 3.5 GHz, WCA280A only)
±1.0 dB (3.5 GHz to 6.5 GHz, WCA280A only)
±1.0 dB (5 GHz to 8 GHz, WCA280A only)
at 10 to 40 _C ±0.7 dB (Baseband)
±1.5 dB (RF/RF1)
±2.0 dB (RF2, WCA280A only)
±2.0 dB (RF3, WCA280A only)
n Absolute amplitude accuracy at calibration
point (0 dB attenuation, 20 to 30 _C)
n Input attenuator setting uncertainty ±0.5 dB (at 50 MHz)
Level linearity in display range ±0.2 dB (0 to -40 dBfs)
Channel power measurement accuracy for
WĆCDMA signal at 20 to 30 _C (Typical)
±0.3 dB (Baseband at 10 MHz, -10 dBm signal)
±0.5 dB (at 50 MHz, -20 dBm signal)
±0.2 dB (0 to -50 dBfs, Typical)
±0.12 dB (0 to -50 dBfs, Typical)
±0.6 dB (Signal frequency: 1900 to 2200 MHz; Signal power: +10 to -30 dBm;
RF attenuation: 0 to 20 dB; After Auto Level operation at 10 MHz span)
Specifications
Table 1-6: Dynamic range
Characteristics Description
1 dB compression input +2 dBm (RF attenuation = 0 dB, 2 GHz)
Second harmonic distortion
(-30 dBm tone at input mixer)
3rd order intermodulation distortion (Reference level = +5 dBm, RF attenuation = Adjusted, Total signal power = -7 dBm)
n Center frequency=2GHz -74 dBc
100 MHz to 3 GHz -74 dBc
3 GHz to 8 GHz (WCA280A only) -72 dBc
n Displayed average noise level -144 dBm/Hz (100 Hz to 10 kHz)
-56 dBc (10 MHz to 1500 MHz)
-56 dBc (10 MHz to 1750 MHz, WCA280A only)
-151 dBm/Hz (10 kHz to 10 MHz)
-151 dBm/Hz (10 MHz to 100 MHz)
-151 dBm/Hz (100 MHz to 1 GHz)
-150 dBm/Hz (1 GHz to 2 GHz)
-150 dBm/Hz (2 GHz to 3 GHz)
-142 dBm/Hz (3 GHz to 5 GHz, WCA280A only)
-142 dBm/Hz (5 GHz to 8 GHz, WCA280A only)
WCA230A & WCA280A Service Manual
1-13

Specifications
Table 1-6: Dynamic range (Cont.)
Characteristics Description
ACLR (3GPP down link, test model 1, 16 ch) 60 dB (5 MHz offset)
63 dB (10 MHz offset)
Typical 66 dB (5 MHz offset)
70 dB (10 MHz offset)
Local feedĆthrough to input connecter
(Typical)
-40 dBm (local frequency 4.2 to 5 GHz)
-55 dBm (local frequency 5 to 6 GHz)
-60 dBm (local frequency 6 to 7 GHz)
-60 dBm (local frequency 7 to 7.7 GHz, WCA280A only)
Table 1-7: Spurious response
Characteristics Description
Image Suppression (Typical)
1stIF 75 dB (RF/RF1)
70 dB (RF2/RF3, WCA280A only)
2ndand 3rdIF 80 dB (RF/RF1 )
75 dB (RF2/RF3, WCA280A only)
Alias suppression (Typical) 65 dB (Baseband)
n Residual response (Reference level = -30 dBm, RBW = 100 kHz)
Baseband, 1 to 20 MHz -93 dBm (Span = 20 MHz)
RF, 0.5 to 3 GHz (WCA280A) -90 dBm (Span = 2.5 GHz)
RF1, 0.5 to 3.5 GHz (WCA280A) -90 dBm (Span = 3 GHz)
RF2, 3.5 to 6.5 GHz (WCA280A) -85 dBm (Span = 3 GHz)
RF3, 5 to 8 GHz (WCA280A) -85 dBm (Span = 3 GHz)
n Spurious response (Span = 10 MHz, Reference level = 0 dBm, RBW = 50 kHz)
Baseband, 10 MHz -73 dBc (Signal frequency = 10 MHz, Signal level = -5 dBm)
RF/RF1, 2 GHz -73 dBc (Signal frequency = 2 GHz, Signal level = -5 dBm)
RF2, 5 GHz (WCA280A) -70 dBc (Signal frequency = 5 GHz, Signal level = -5 dBm)
RF3, 7 GHz (WCA280A) -70 dBc (Signal frequency = 7 GHz, Signal level = -5 dBm)
1-14
WCA230A & WCA280A Service Manual

Table 1-8: Acquisition
Characteristics Description
Acquisition mode Single and Continuous
Acquisition memory size 64 Mbytes (Standard), 256 Mbytes (Option 02)
Block size 1 to 16,000 frames (Standard), 1 to 64,000 frames (Option 02)
Number of data samples in one frame 1024 (Vector mode)
A/D converter 14 bits, 51.2 Msps
Vector span 20 MHz (Baseband), 15 MHz (RF, RF1 to 3), 20 MHz (Option 03 IQ input)
RealĆtime capture bandwidth 20 MHz (Baseband), 15 MHz (RF, RF1 to 3), 10 MHz (Option 03 IQ input)
Table 1-9: Sampling rate
Characteristics Description
Sampling rate (Real Time S/A, Demod, and Time modes)
20 MHz span (Baseband) 25.6 Msps
15 MHz span (RF, RF1 to 3) 25.6 Msps
10 MHz span 12.8 Msps
5 MHz span 6.4 Msps
2 MHz span 3.2 Msps
1 MHz span 1.6 Msps
500 kHz span 800 ksps
200 kHz span 320 ksps
100 kHz span 160 ksps
50 kHz span 80 ksps
20 kHz span 32 ksps
10 kHz span 16 ksps
5 kHz span 8 ksps
2 kHz span 3.2 ksps
1 kHz span 1.6 ksps
500 Hz span 800 sps
200 Hz span 320 sps
100 Hz span 160 sps
Specifications
WCA230A & WCA280A Service Manual
1-15

Specifications
Table 1-10: Frame time
Characteristics Description
Frame time (Real Time S/A, Demod, and Time modes)
20 MHz span (Baseband) 40 ms
15 MHz span (RF, RF1 to 3) 40 ms
10 MHz span 80 ms
5 MHz span 160 ms
2 MHz span 320 ms
1 MHz span 640 ms
500 kHz span 1.28 ms
200 kHz span 3.2 ms
100 kHz span 6.4 ms
50 kHz span 12.8 ms
20 kHz span 32 ms
10 kHz span 64 ms
5 kHz span 128 ms
2 kHz span 320 ms
1 kHz span 640 ms
500 Hz span 1.28 s
200 Hz span 3.2 s
100 Hz span 6.4 s
Table 1-11: Digital demodulation
Characteristics Description
Demodulator
Carrier type Continuous and Burst
Modulation format BPSK, QPSK, p/4 shift DQPSK, 8PSK, 16QAM, 64QAM, 128QAM, 256QAM,
GMSK, GFSK, ASK and FSK
Measurement filter Root cosine
Reference filter Cosine, Gauss
Filter parameter a/BT: 0.0001 to 1, 0.0001 step
Maximum symbol rate 12.8 Msps
Standard setup PDC, PHS, NADC, TETRA, GSM, CDPD, and Bluetooth
1-16
WCA230A & WCA280A Service Manual

Specifications
Table 1-11: Digital demodulation (Cont.)
Characteristics Description
Display format
Vector diagram Symbol/Locus display, Frequency error measurement, and Origin offset measurement
Constellation diagram Symbol display, Frequency error measurement, and Origin offset measurement
Eye diagram I, Q, and Trellis displays(1to16symbols )
Error vector diagram EVM, Magnitude error, Phase error, Waveform quality (r) measurement,
Frequency error measurement, and Origin offset measurement
Symbol table Binary, Octal, Hexadecimal
AM/AM Measured amplitude vs. Reference amplitude, 1 dB compression measurement
AM/PM Phase error vs. Reference amplitude
CCDF Probability of excess vs. Power level, Crest factor measurement
PDF Probability of occurrence vs. Power level
Accuracy
PDC (100 kHz span) EVM ≤1.2%, Magnitude error ≤1.0%, Phase error ≤0.8°
PHS (1 MHz span) EVM ≤1.4%, Magnitude error ≤1.2%, Phase error ≤0.8°
GSM (1 MHz span) EVM ≤1.8%, Magnitude error ≤1.2%, Phase error ≤1.0°
64QAM, 5.3 Msps, 1 GHz carrier
(15 MHz span, Typical)
QPSK, 3.84 Msps, 2 GHz carrier
(15 MHz span, Typical)
QPSK EVM (Typical) Symbol rate
Center frequency=1GHz 0.5%
Center frequency=2GHz 0.5%
Center frequency=3GHz 0.7%
Center frequency=5GHz
(WCA280A only)
EVM ≤2.5%
EVM ≤2.5%
0.5%
1.2%
2.7%
0.5%
1.2%
2.7%
0.7%
1.5%
2.9%
0.7%
0.7%
1.5%
3.0%
100 kHz
1 MHz
4 MHz
10 MHz
100 kHz
1 MHz
4 MHz
10 MHz
100 kHz
1 MHz
4 MHz
10 MHz
100 kHz
1 MHz
4 MHz
10 MHz
WCA230A & WCA280A Service Manual
1-17

Specifications
Table 1-11: Digital demodulation (Cont.)
Characteristics Description
p/4 DQPSK EVM (Typical) Symbol rate
Center frequency=1GHz 0.6%
0.6%
1.2%
2.7%
Center frequency=2GHz 0.6%
0.6%
1.2%
2.7%
Center frequency=3GHz 0.7%
0.7%
1.5%
2.9%
Center frequency=5GHz
(WCA280A only)
16QAM EVM (Typical) Symbol rate
Center frequency=1GHz 0.9%
Center frequency=2GHz 0.9%
Center frequency=3GHz 0.9%
Center frequency=5GHz
(WCA280A only)
0.7%
0.7%
1.5%
3.0%
0.5%
1.2%
2.2%
0.5%
1.2%
2.2%
0.5%
1.2%
2.5%
0.9%
0.5%
1.2%
2.5%
100 kHz
1 MHz
4 MHz
10 MHz
100 kHz
1 MHz
4 MHz
10 MHz
100 kHz
1 MHz
4 MHz
10 MHz
100 kHz
1 MHz
4 MHz
10 MHz
100 kHz
1 MHz
4 MHz
10 MHz
100 kHz
1 MHz
4 MHz
10 MHz
100 kHz
1 MHz
4 MHz
10 MHz
100 kHz
1 MHz
4 MHz
10 MHz
Table 1-12: Analog demodulation
Characteristics Description
Accuracy (Typical)
AM demodulation ±2% (-10 dBfs input at center, 10 to 60% modulation depth)
PM demodulation ±3° (-10 dBfs input at center)
FM demodulation ±1% of span (-10 dBfs input at center)
1-18
WCA230A & WCA280A Service Manual

Table 1-13: RBW (Resolution Bandwidth)
Characteristics Description
Filter shape Gaussian, Rectangle, Root Nyquist
Setting range 1Hzto10MHz
Minimum Resolution Bandwidth (S/A mode)
>2 GHz span 100 kHz
1 to 1.99 GHz span 50 kHz
500 to 990 MHz span 20 kHz
200 to 490 MHz span 10 kHz
100 to 190 MHz span 10 kHz
50 to 90 MHz span 10 kHz
20 to 40 MHz span 10 kHz
10 MHz span 1 kHz
5 MHz span 1 kHz
2 MHz span 1 kHz
1 MHz span 1 kHz
500 kHz span 500 Hz
200 kHz span 200 Hz
100 kHz span 100 Hz
50 kHz span 50 Hz
20 kHz span 20 Hz
10 kHz span 10 Hz
5 kHz span 5Hz
2 kHz span 2Hz
1 kHz span 1Hz
500 Hz span 1Hz
200 Hz span 1Hz
100 Hz span 1Hz
Specifications
WCA230A & WCA280A Service Manual
1-19

Specifications
Table 1-14: Trigger
Characteristics Description
Trigger mode Free run and Triggered
Trigger event source IF (Level comparator)
External (TTL)
IQ (Option 02, power comparator)
Internal trigger comparator data source A/D output (IF level trigger)
Frequency amplitude (Option 02)
Time amplitude (Option 02)
Pre/Post trigger setting Trigger position is settable from 0 to 100% of total data length.
IF level trigger setting range 1 to 100% (100% is fullĆscale of A/D output)
Event trigger (Option 02)
Frequency domain
Mask resolution 1 bin
Trigger level 0 to -60 dBfs
RealĆtime event detection bandwidth 5 MHz (1024Ćpoint FFT, 50% overlapping)
Time domain
Trigger level 0 to -40 dBfs
External trigger input
Input voltage High: +1.6 to +5 V; Low: 0 to +0.5 V
Input impedance >2 kW
Trigger output High: >2.0 V, Low: <0.4 V (output current <1 mA)
Trigger marker position timing uncertainty ±2 sample points
Table 1-15: Measurement function
Characteristics Description
S/A mode Noise power, Channel power, Adjacent channel power ratio, Occupied bandwidth,
Emission bandwidth, Carrier to Noise ratio, Carrier frequency, Spurious
Demod mode Analog demodulation (AM, FM, PM), Digital demodulation (refer to Table 1-11),
I/Q vs. Time, Power vs. Time, Frequency vs. Time
Time mode I/Q vs. Time, Power vs. Time, Frequency vs. Time, CCDF, Pulse measurement
Pulse measurement Pulse width, Pulse peak power, On/Off ratio, Pulse ripple, Pulse repetition interval,
Duty cycle, PulseĆPulse phase, Channel power, OBW, EBW, Frequency deviation
Pulse length Minimum 20 samples; Maximum 260,000 samples
1-20
WCA230A & WCA280A Service Manual

Table 1-16: Display
Characteristics Description
View
Number of views 1, 2, 3, or 4
Number of display traces 2
LCD
Size 213 mm (8.4 in)
Resolution 800 × 600 pixels
Color Maximum 256 colors
Display detector Positive peak, Negative peak, and PositiveĆNegative peak
Table 1-17: Marker, trace, and display line
Characteristics Description
Specifications
Marker type Normal, Reference, and Band power
Search function Peak right, Peak left, Maximum, Larger peak, and Smaller peak
Trace content Active, Average, Max Hold, Min Hold, View, and Off
Display line Horizontal line 1 and 2, Vertical line 1 and 2
Table 1-18: Controller and interface
Characteristics Description
Controller
CPU Intel Pentium III 850 MHz
DRAM 256 Mbyte DIMM
OS Windows XP
System bus PCI, ISA
Storage medium
Hard disk ≥20 Gbyte 2.5 inch IDE
Floppy disk 1.44 Mbyte 3.5 inch
WCA230A & WCA280A Service Manual
1-21

Specifications
Table 1-18: Controller and interface (Cont.)
Characteristics Description
Interface
Printer port USB
GPIB IEEE 488.1
LAN 10/100 BASEĆT (IEEE 802.3)
Mouse USB
Keyboard USB
Monitor out VGA (DĆSUB 15 pins)
Table 1-19: Power requirements
Characteristics Description
Rating voltage 100 to 240 VAC
Voltage range 90 to 250 VAC
Line frequency 47 to 63 Hz
Mains Fuse Data Densei-Lambda supplies: 5 A, Time-delayed, 250 V (not operator replaceable)
Cosel supply: 2 A, Time-delayed, 250 V (not operator replaceable)
Heat dissipation
Maximum power 350 VA
Maximum line current 5 A rms at 50 Hz (90 V line with 5% clipping)
Surge current Maximum 52 A peak (25 _C) for ≤5 line cycles after the product has been turned off
for at least 30 s.
Table 1-20: Power connector
Characteristics Description
Preamp power connector
Connector type LEMO 6 poles
Pin assignment Pin 1: NC, Pin 2: ID1, Pin 3: ID2, Pin 4: -12 V, Pin 5: GND, Pin 6: +12 V
1-22
WCA230A & WCA280A Service Manual

Physical Characteristics
Table 1-21: Physical characteristics
Characteristics Description
Dimensions
Width 425 mm (16.7 in) without belts
Height 215 mm (8.5 in) without feet
Depth 425 mm (16.7 in) without cover and feet
Net weight 19 kg
Environmental Characteristics
Table 1-22: Environmental characteristics
Specifications
Characteristics Description
Temperature
Operating +10 to +40 _C
Nonoperating -20 to +60 _C
Relative humidity
Operating and nonoperating 20 to 80% (no condensation), maximum wetĆbulb temperature 29 _C
Altitude
Operating Up to 3000 m (10000 ft)
Nonoperating Up to 12000 m (40000 ft)
Vibration
Operating 2.65 m/s2rms (0.27 G rms), 5 to 500 Hz
Nonoperating 22.3 m/s2rms (2.28 G rms), 5 to 500 Hz
Shock
Nonoperating 196 m/s2(20 G), halfĆsine, 11 ms duration
Three shocks in each direction along each major axis, total of 18 shocks
Cooling clearance
Bottom 20 mm (0.79 in)
Both sides 50 mm (1.97 in)
Rear 50 mm (1.97 in)
WCA230A & WCA280A Service Manual
1-23

Specifications
Table 1-23: Certifications and compliances
Characteristic Description
EC Declaration of Conformity - EMC Meets intent of Directive 89/336/EEC for Electromagnetic Compatibility. Compliance
was demonstrated to the following specifications as listed in the Official Journal of the
European Communities:
EN 61326 EMC requirements for Class A electrical equipment for
measurement, control and laboratory use.
IEC 61000Ć4Ć2 Electrostatic discharge immunity
(Performance criterion B)
IEC 61000Ć4Ć3 RF electromagnetic field immunity
(Performance criterion A)
IEC 61000Ć4Ć4 Electrical fast transient / burst immunity
(Performance criterion B)
IEC 61000Ć4Ć5 Power line surge immunity
(Performance criterion B)
IEC 61000Ć4Ć6 Conducted RF immunity
(Performance criterion A)
IEC 61000Ć4Ć11 Voltage dips and interruptions immunity
(Performance criterion B)
EN 61000Ć3Ć2 AC power line harmonic emissions
EN 61000Ć3Ć3 Power line voltage fluctuation/flicker
Australia/New Zealand Declaration of
Conformity - EMC
EC Declaration of Conformity - Low Voltage Compliance was demonstrated to the following specification as listed in the Official
Complies with EMC provision of Radiocommunications Act per the following
standard(s):
AS/NZS 2064.1/2 Industrial, Scientific, and Medical Equipment: 1992
Journal of the European Union:
Low Voltage Directive 73/23/EEC, amended by 93/68/EEC
1
EN 61010Ć1:2001 Safety requirements for electrical equipment for
measurement control and laboratory use.
U.S. Nationally Recognized Testing Laboratory
Listing
Canadian Certification CAN/CSA C22.2 No. 1010.1 CSA safety requirements for electrical and electronic
Additional Compliance ANSI/ISA S82.02.01:1999 Safety standard for electrical and electronic test,
1
Emissions which exceed the levels required by this standard may occur when this equipment is connected to
a test object.
1-24
UL61010BĆ1 Standard for electrical measuring and test equipment.
measuring and test equipment.
measuring, controlling, and related equipment.
IEC61010Ć1 Safety requirements for electrical equipment for
measurement, control, and laboratory use.
WCA230A & WCA280A Service Manual

Specifications
Table 1-23: Certifications and compliances (Cont.)
Characteristic Description
Installation (Overvoltage) Category Terminals on this product may have different installation (overvoltage) category
designations. The installation categories are:
CAT III DistributionĆlevel mains (usually permanently connected). Equipment at this
level is typically in a fixed industrial location.
CAT II LocalĆlevel mains (wall sockets). Equipment at this level includes
appliances, portable tools, and similar products. Equipment is usually
cordĆconnected.
CAT I Secondary (signal level) or battery operated circuits of electronic equipment.
Pollution Degree A measure of the contaminates that could occur in the environment around and within
a product. Typically the internal environment inside a product is considered to be the
same as the external. Products should be used only in the environment for which they
are rated.
Pollution Degree 1 No pollution or only dry, nonconductive pollution occurs.
Products in this category are generally encapsulated,
hermetically sealed, or located in clean rooms.
Pollution Degree 2 Normally only dry, nonconductive pollution occurs.
Occasionally a temporary conductivity that is caused by
condensation must be expected. This location is a
typical office/home environment. Temporary
condensation occurs only when the product is out of
service.
Pollution Degree 3 Conductive pollution, or dry, nonconductive pollution that
becomes conductive due to condensation. These are
sheltered locations where neither temperature nor
humidity is controlled. The area is protected from direct
sunshine, rain, or direct wind.
Pollution Degree 4 Pollution that generates persistent conductivity through
conductive dust, rain, or snow. Typical outdoor locations.
Safety Certification Compliance
Equipment Type Test and measuring
Safety Class Class 1 (as defined in IEC61010Ć1, Annex H) - grounded product
Operating Temperature Range +5 to +40 _C
Overvoltage Category Overvoltage Category II (as defined in IEC61010Ć1, Annex J)
Pollution Degree Pollution Degree 2 (as defined in IEC61010Ć1). Note: Rated for indoor use only.
WCA230A & WCA280A Service Manual
1-25

Specifications
1-26
WCA230A & WCA280A Service Manual

Operating Information


Installation
Supplying Operating Power
WARNING. AC POWER SOURCE AND CONNECTION. The analyzer operates
from a single-phase power source. It has a three-wire power cord and two-pole,
three-terminal grounding type plug. The voltage to ground (earth) from either
pole of the power source must not exceed the maximum rated operating voltage,
250 volts.
Before making connection to the power source, be sure the analyzer has a
suitable two-pole, three-terminal grounding-type plug.
GROUNDING. This instrument is safety Class 1 equipment (IEC designation).
All accessible conductive parts are directly connected through the grounding
conductor of the power cord to the grounded (earthing) contact of the power
plug.
WARNING. The power input plug must be inserted only in a mating receptacle
with a grounding contact where earth ground has been verified by a qualified
service person. Do not defeat the grounding connection. Any interruption of the
grounding connection can create an electric shock hazard.
Power Cord Information
For electric shock protection, the grounding connection must be made before
making connection to the instrument’s input or output terminals.
A power cord with the appropriate plug configuration is supplied with each
analyzer. Table 2–1 gives the color-coding of the conductors in the power cord. If
you require a power cord other than the one supplied, refer to Table 2–2, Power
Cord Identification.
Table 2-1: PowerĆcord conductor identification
Conductor Color Alternate color
Ungrounded (Line) Brown Black
Grounded (Neutral) Light Blue White
Grounded (Earthing) Green/Yellow Green
WCA230A & WCA280A Service Manual
2-1

Installation
Table 2-2: Power cord identification
Plug configuration Normal usage Option number
North America
120 V
Universal Euro
230 V
United Kingdom
230 V
Australia
240 V
North America
240 V
Switzerland
220 V
A0
A1
A2
A3
A4
A5
2-2
Operating Voltage
Japan
100 V
China
240 V
No power cord supplied. A99
This analyzer operates with any line voltage from 90–250 VAC
A6
A10
with any line
RMS
frequency from 47–63 Hz. Before plugging the cord in the outlet, be sure that the
power supply voltage is proper.
WCA230A & WCA280A Service Manual

Operating Environment
Installation
The following environmental requirements are provided to ensure proper
operation and long instrument life.
Operating Temperature
Ventilation Requirements
Operate the analyzer where the ambient air temperature is from +10 _C to
+40 _C with no diskette in the floppy drive. Store the analyzer in ambient
temperatures from –20 _C to +60 _C with no diskette in the floppy drive. After
storage at temperatures outside the operating limits, allow the chassis to stabilize
at a safe operating temperature before applying power.
The analyzer is cooled by air drawn by external fans on the side panel. To ensure
proper cooling of the analyzer, allow at least 5 cm clearance on both sides of and
behind the analyzer. The feet on the bottom of the analyzer provide the required
clearance when set on flat surfaces. The top of the analyzer does not require
ventilation clearance.
WCA230A & WCA280A Service Manual
2-3

Installation
Applying Power
Power on the analyzer using the following procedure:
AC Power Requirements
Connecting the Power
Cord
The analyzer operates from an AC line frequency of 47–63 Hz, over the range of
90–250 Volts, without the need for configuration, except the power cord. Refer
to page 2–2 for the power cord options.
The maximum power consumption is 350 W. Refer to Appendix A, Specifica-
tions, for additional information on power and environmental requirements.
CAUTION. Use only power cords that are approved for the country of use. Using
non-approved power cords could result in fire or shock hazard.
1. Plug the power cord into the AC input on the rear panel.
2-4
AC input
Figure 2-1: AC Input (rear panel)
2. Connect the plug of the power cord to a properly grounded outlet.
WCA230A & WCA280A Service Manual

Installation
Turning on the Analyzer
1. Turn on the principal power switch on the rear panel.
Principal power switch
Figure 2-2: Principal power switch (rear panel)
When you turn on the principal power switch, a voltage is applied to the
analyzer standby circuit. Make sure the LED next to the power switch on the
front panel lights up in orange.
2. Turn on the power switch (ON/STANDBY) on the lower left of the front
panel. The LED next to the power switch changes to green.
Power switch
LED
Figure 2-3: Front panel power switch (ON/STANDBY switch)
When you turn on the analyzer, Windows XP boots up.
After several minutes, the analyzer application starts up.
The initial screen appears as shown in Figure 2–4.
The displayed spectrum represents the noise floor of the analyzer.
WCA230A & WCA280A Service Manual
2-5

Installation
Figure 2-4: Initial screen
If “UNCAL” is displayed on top of the screen, run the gain calibration routine
(refer to Gain Calibration on page 5–10).
CAUTION. Never apply signals with a combined amplitude greater than +30 dBm
to the RF INPUT connector. If you exceed this input rating, you can permanently
damage the analyzer. (The RF INPUT connector is shown in Figure 2–5.)
RF INPUT connector
Max +30 dBm AC + DC
2-6
Figure 2-5: RF INPUT connector
WCA230A & WCA280A Service Manual

Powering Off the Analyzer
Turn off the power switch on the front panel.
CAUTION. When you power on or off the analyzer, you must use the front-panel
power switch. Failure to do so may cause the operating system to shut down
improperly.
When you power on the analyzer again, wait at least 10 seconds after the last
power off.
When you press the front-panel ON/STANDBY switch, the analyzer starts a
shutdown process (including a Windows shutdown) to preserve settings and then
power off. The LED next to the power switch changes to orange. Avoid using the
rear-panel power switch or disconnecting the power cord to power off the
analyzer.
To completely remove power to the analyzer, perform the shutdown just
described, and then set the power switch on the rear panel to off.
Installation
NOTE. Turning off the front-panel power switch does not shut down the principal
power supply completely. To turn off the principal power supply, press the
principal power switch on the rear panel. Turning off the principal power switch
turns off the front-panel LED. When you do not use the analyzer for a long time
or in case of emergency, you should unplug the power cord.
WCA230A & WCA280A Service Manual
2-7

Installation
Restart
When the analyzer operates abnormally, use the following procedure to turn the
analyzer off and on again.
NOTE. When the analyzer operates abnormally, it will not be shut down by
turning off the front-panel power switch alone.
1. Make sure that the front-panel power switch is in the turned-off position.
2. Turn off the principal power switch on the rear panel.
3. Wait at least 10 seconds and then turn on the principal power switch again.
4. Turn on the front-panel power switch.
When Scan Disk Appears
When the Display
Brightness Is Not Even
If the analyzer was not shut down properly, Windows Scan Disk may run when
you turn on the analyzer. When the Scan Disk screen appears, wait until the Scan
Disk is completed. If an error is detected, refer to the Windows manual for
treatment. For more information on accessing Windows on the analyzer, refer to
Using Windows XP on page 2–48.
It is a characteristic of the LCD (Liquid Crystal Display) panel to sometimes
have uneven brightness, dead pixels (dots that never turn on) or stuck pixels
(dots that always stay on). This is neither a malfunction nor a defect, and not a
cause for repair or exchange.
2-8
WCA230A & WCA280A Service Manual

Setting Up the Stand
Installation
To set up the stand, place the analyzer on a table. Lift the front of the analyzer
and pull out the stand until it is perpendicular to the analyzer.
Figure 2-6: Setting up the stand
WCA230A & WCA280A Service Manual
Stand
2-9

Installation
Repackaging Instructions
If you ship the analyzer, pack it in the original shipping carton and packing
material. If the original packing material is not available, package the instrument
as follows:
1. Obtain a corrugated cardboard shipping carton with inside dimensions at
2. If you are shipping the instrument to a Tektronix field office for repair, attach
3. Wrap the instrument with polyethylene sheeting or equivalent material to
4. Cushion the instrument in the shipping carton by tightly packing dunnage or
least 15 cm (6 in.) taller, wider, and deeper than the instrument. The shipping
carton must be constructed of cardboard with 170 kg (375 lb.) test strength.
a tag to the instrument showing the instrument owner and address, the name
of the person to contact about the instrument, the instrument type, and the
serial number.
protect the finish.
urethane foam on all sides between the carton and the analyzer. Allow
7.5 cm (3 in.) on all sides, top, and bottom.
Installed Options
5. Seal the shipping carton with shipping tape or an industrial stapler.
NOTE. Do not ship the instrument with a diskette inside the floppy disk drive.
When the diskette is inside the drive, the disk release button sticks out. This
makes the button more prone to damage than it would otherwise be.
Your instrument may be equipped with one or more instrument options. Except
for the line-cord options described by Table 2–2 on page 2–2, all options and
optional accessories are listed and described in Section 7, Options. For further
information and prices of instrument options, see your Tektronix Products
catalog or contact your Tektronix Field Office.
2-10
WCA230A & WCA280A Service Manual

Operating Instructions
Before performing any service, read the following operating instructions. These
instructions are at the level appropriate for servicing the analyzer. The user
manual contains more complete operating instructions. This section describes
basic procedures, such as applying power, displaying measurement results, and
powering off the analyzer, using default settings as far as possible for simplicity.
The following procedures are contained in this section:
H Preparations: Connecting devices and applying the power
H Displaying spectrum
H Using markers and peak search
H Using averaging and comparison displays
H Displaying spectrogram
H Spectrum analysis
H Digital modulation analysis
H Using Windows XP
H Shutting off the power
You must complete the installation procedures (starting on page 2–1) before
performing any of the following steps.
WCA230A & WCA280A Service Manual
2-11
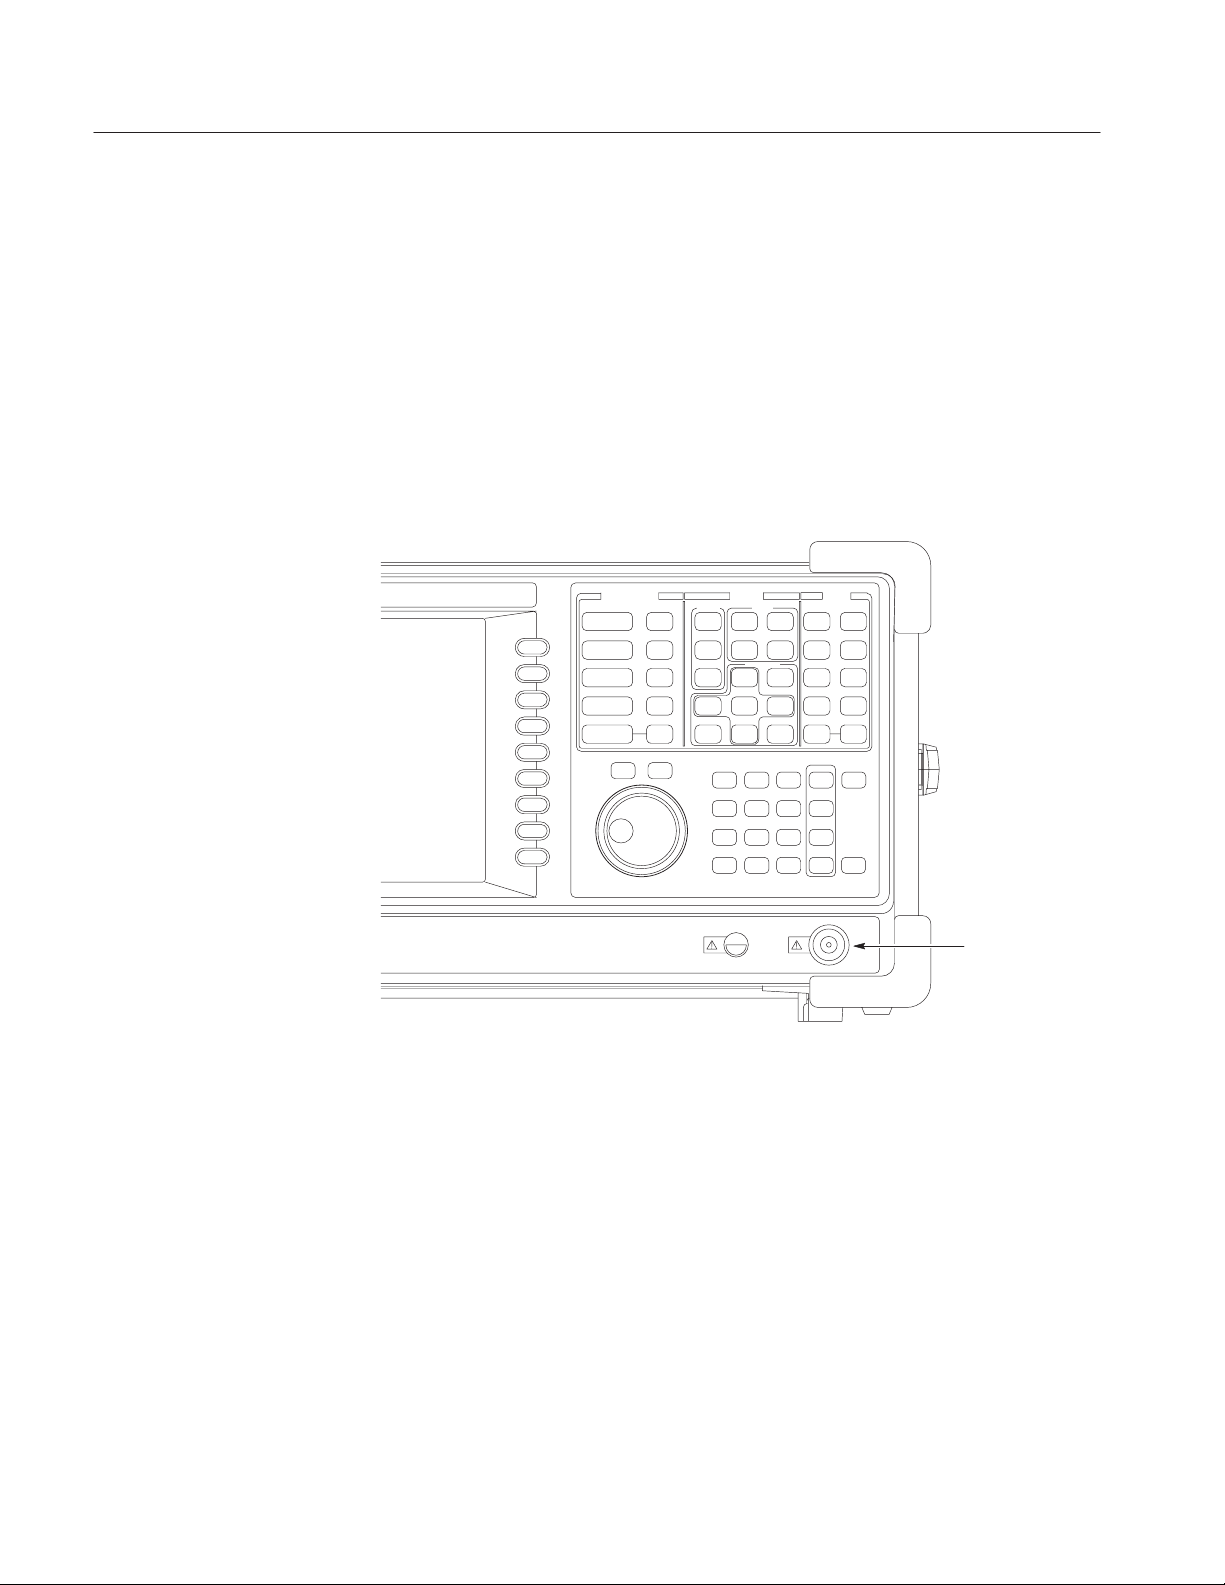
Operating Instructions
Preparations
This tutorial uses a digitally-modulated signal. The following equipment is used
as a signal source.
H Digitally-modulated signal generator (recommended: Anritsu MG3671A)
H One 50 W coaxial cable
Connecting the Signal
Generator
1. Connect the output of the signal generator to the RF INPUT connector on the
analyzer front panel using a coaxial cable (see Figure 2–7).
RF INPUT
(N type connector)
2-12
Figure 2-7: Cable connection
2. Set the signal generator as follows:
Modulation system PDC. . . . . . . . .
Modulation data Pseudo-random pattern. . . . . . . . . . .
Center frequency 800 MHz. . . . . . . . . . .
Output level –10 dBm. . . . . . . . . . . . . . .
WCA230A & WCA280A Service Manual

Operating Instructions
Applying the Power
1. Apply power to the signal generator.
2. Turn on the principal power switch (PRINCIPAL POWER SWITCH) on
the rear panel, as shown in Figure 2–8. The orange LED on the front panel
lights.
Principal power switch
Power switch
LED
Figure 2-8: Principal power switch (rear panel)
3. Turn on the power switch (ON/STANDBY) on the front panel, as shown in
Figure 2–9.
Figure 2-9: Power switch (ON/STANDBY)
WCA230A & WCA280A Service Manual
2-13
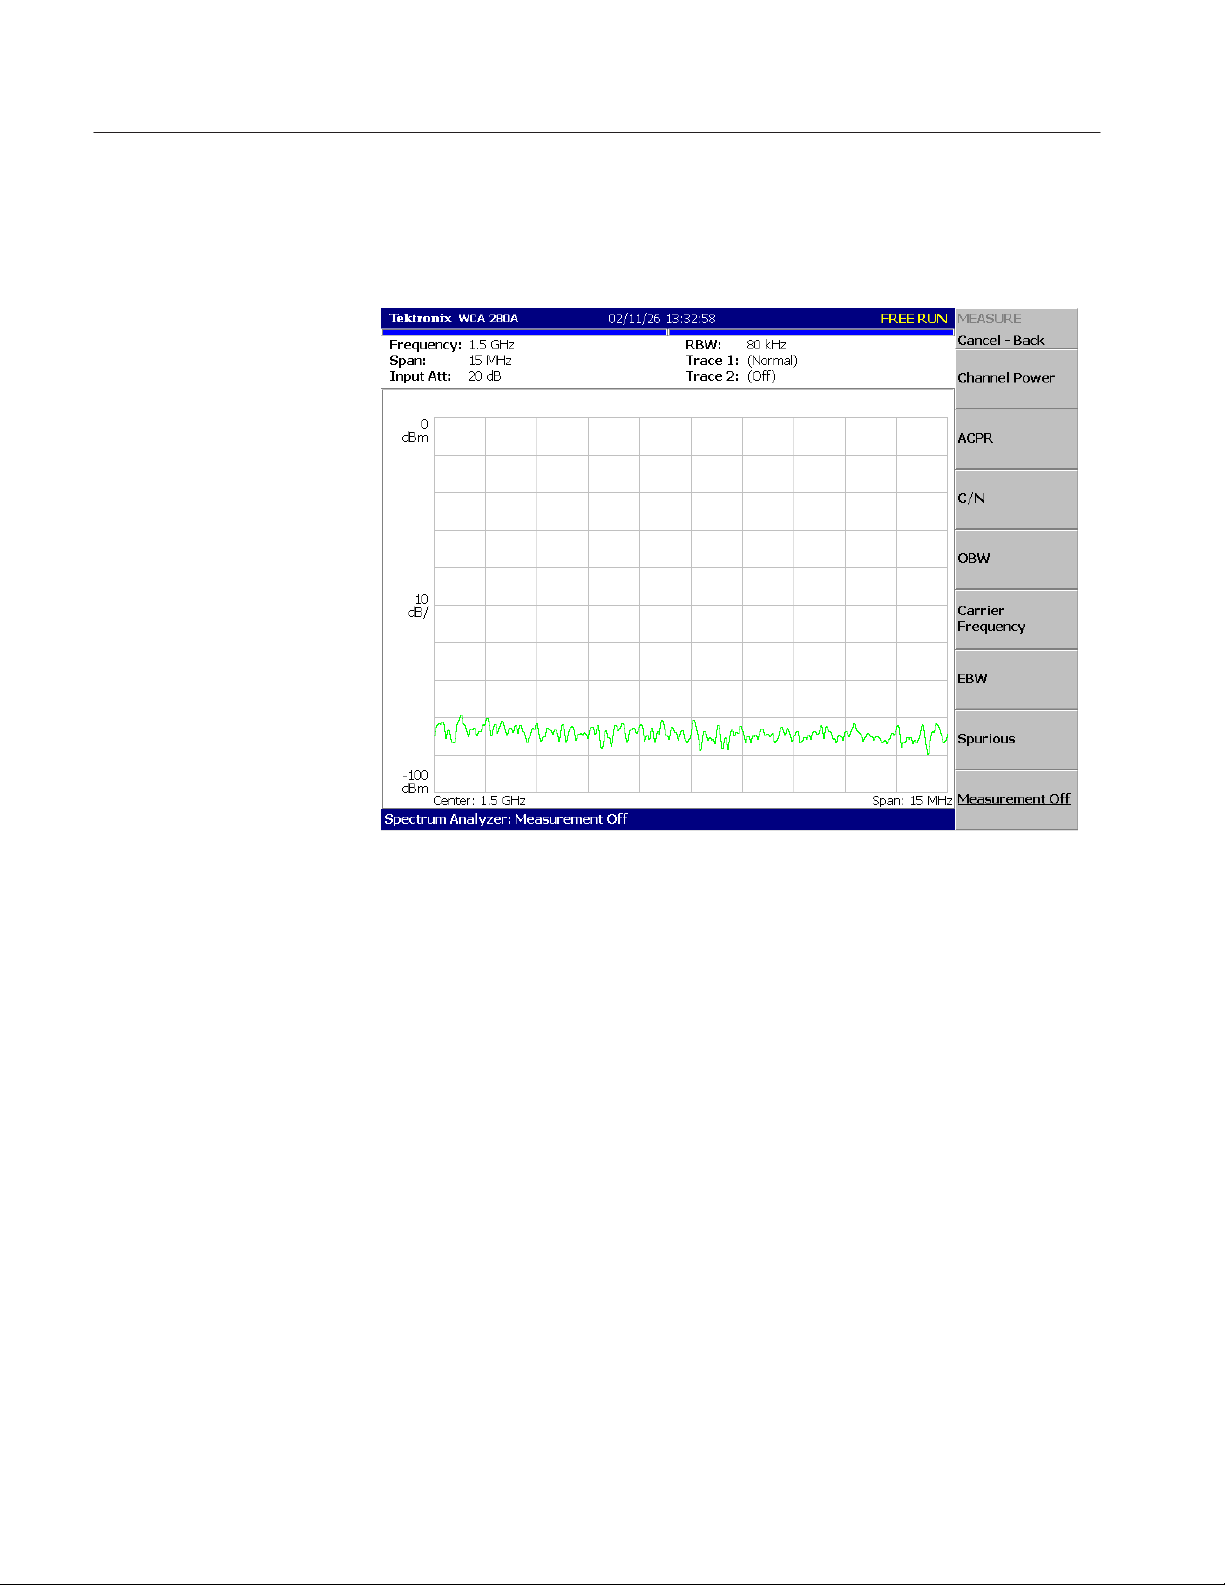
Operating Instructions
The initial screen shown in Figure 2–10 appears after Windows XP starts up (the
background color is in white on this manual to make figures more viewable).
Figure 2-10: Initial screen
2-14
WCA230A & WCA280A Service Manual

Operating Instructions
Restoring Default Settings
SYSTEM key
The analyzer saves the settings when it is turned off. When you turn on the
analyzer, it starts with the settings as they were when the analyzer was shut
down.
This tutorial starts with the factory default settings. Perform the following steps
to restore the factory default settings:
1. Press the SYSTEM key.
2. Press the Reset All to Factory Defaults side key.
The instrument is now ready to take measurements.
WCA230A & WCA280A Service Manual
2-15

Operating Instructions
Displaying Spectrum
Amplitude
This section describes how to set the frequency, span, and amplitude first, and
then appropriately display the spectrum. Figure 2–11 shows the settings.
Frequency
(Center frequency)
Span
Figure 2-11: Frequency, span, and amplitude settings
2-16
WCA230A & WCA280A Service Manual

Operating Instructions
Setting Center Frequency
and Span
FREQUENCY/CHANNEL key
The center frequency is set to 1.5 GHz, and span is set to 15 MHz when you
power on the analyzer. Change the settings of center frequency and span to
display the waveform around 800 MHz.
1. Press the FREQUENCY/CHANNEL key on the front panel.
The FREQUENCY/CHANNEL menu, shown in Figure 2–12, is displayed on
the right side of the screen. Notice that the Frequency menu item is available for
entering the numeric value for center frequency.
Center Freq
(Hz)
XXX
Indicates that the general purpose knob
is available
Numeric value input field
Figure 2-12: Menu items for numeric value input
You can change the value using the general purpose knob or enter the value using
the numeric value entry keypad, shown in Figure 2–13.
2. Enter the new center frequency at 800 MHz. As the interval between
1.5 GHz (current setting) and 800 MHz is wide, it is more convenient to use
the keypad here.
Press 8 0 0 MHz, in order, on the keypad.
The GHz, MHz, kHz, and Hz keys also function as the enter key. When you
press any of these keys, the numeric value you enter will be set immediately.
If you enter incorrect values, clear them using the BKSP (back space) key and
then enter the correct digit.
WCA230A & WCA280A Service Manual
2-17
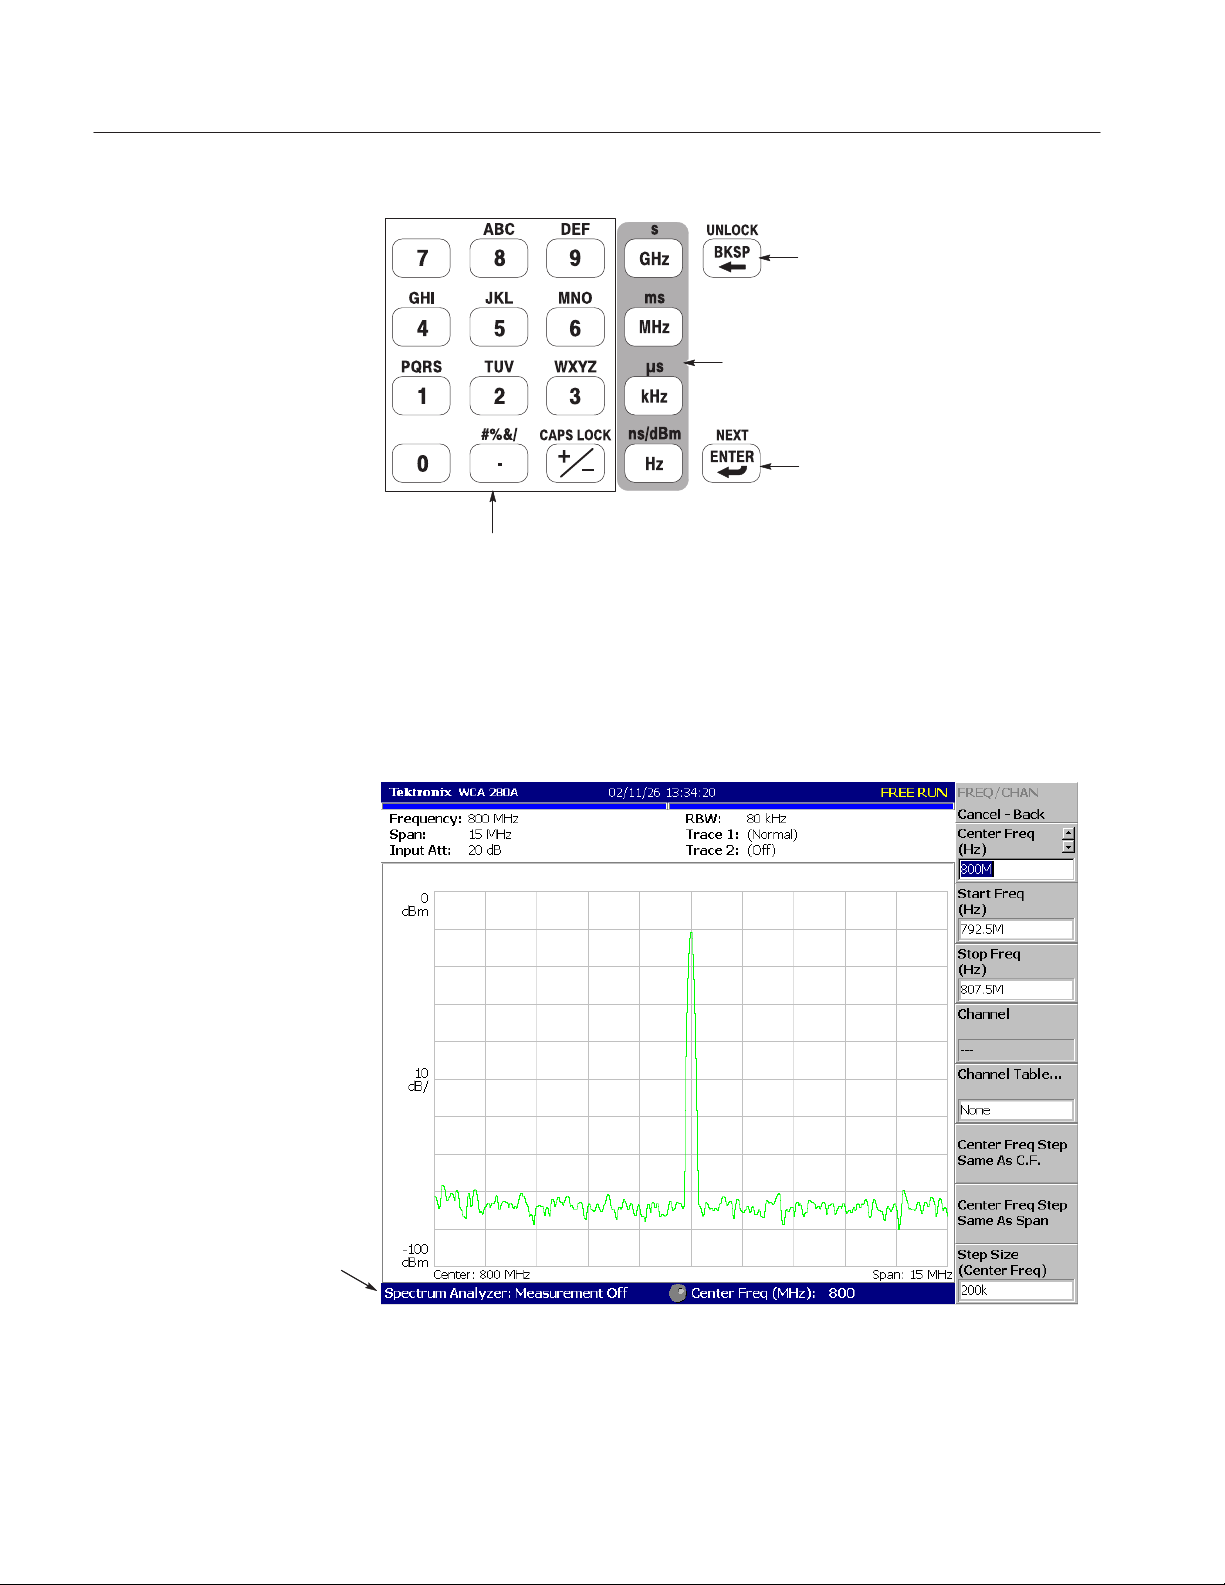
Operating Instructions
Clears the character preceding the cursor.
The unit keys also function as enter keys.
When you press any of these keys, the numeric value
you enter will be set immediately with the unit.
Accepts the inputs.
Numeric keys
Figure 2-13: Numeric value entry keypad
The spectrum waveform is displayed on the screen as shown in Figure 2–14. The
current setting is displayed on the bottom of the screen (“Center Freq (MHz):
800” in this example).
2-18
The current setting is
displayed in this field.
Figure 2-14: Center frequency of 800 MHz, span of 15 MHz
WCA230A & WCA280A Service Manual

SPAN key
Operating Instructions
The next step is to set the span, which is currently set to 15 MHz as the default
value.
3. Press the SPAN key on the front panel.
The Span menu item is selected.
Span
Indicates that the general purpose knob is available
(Hz)
XXX
4. Turn the general purpose knob to the left to select 100k. The hardware is set
with the selected value immediately.
The spectrum waveform is displayed on the screen as shown in Figure 2–15.
Numeric value input field
WCA230A & WCA280A Service Manual
2-19

Operating Instructions
Figure 2-15: Center frequency of 800 MHz, span of 100 kHz
2-20
WCA230A & WCA280A Service Manual

Operating Instructions
Setting Up Amplitude
-100 dBm
In Figure 2–16, the vertical scale shows the spectrum view, set up for 10 dB per
division. Ref level is the maximum value of the vertical axis, and it is set to
0 dBm when the analyzer is powered on. Observe the change in the waveform as
you change this setting in the following procedure:
0 dBm
Ref Level
setting
10 dB
Figure 2-16: Setting amplitude
AMPLITUDE key
1. Press the Amplitude key on the front panel.
WCA230A & WCA280A Service Manual
2-21
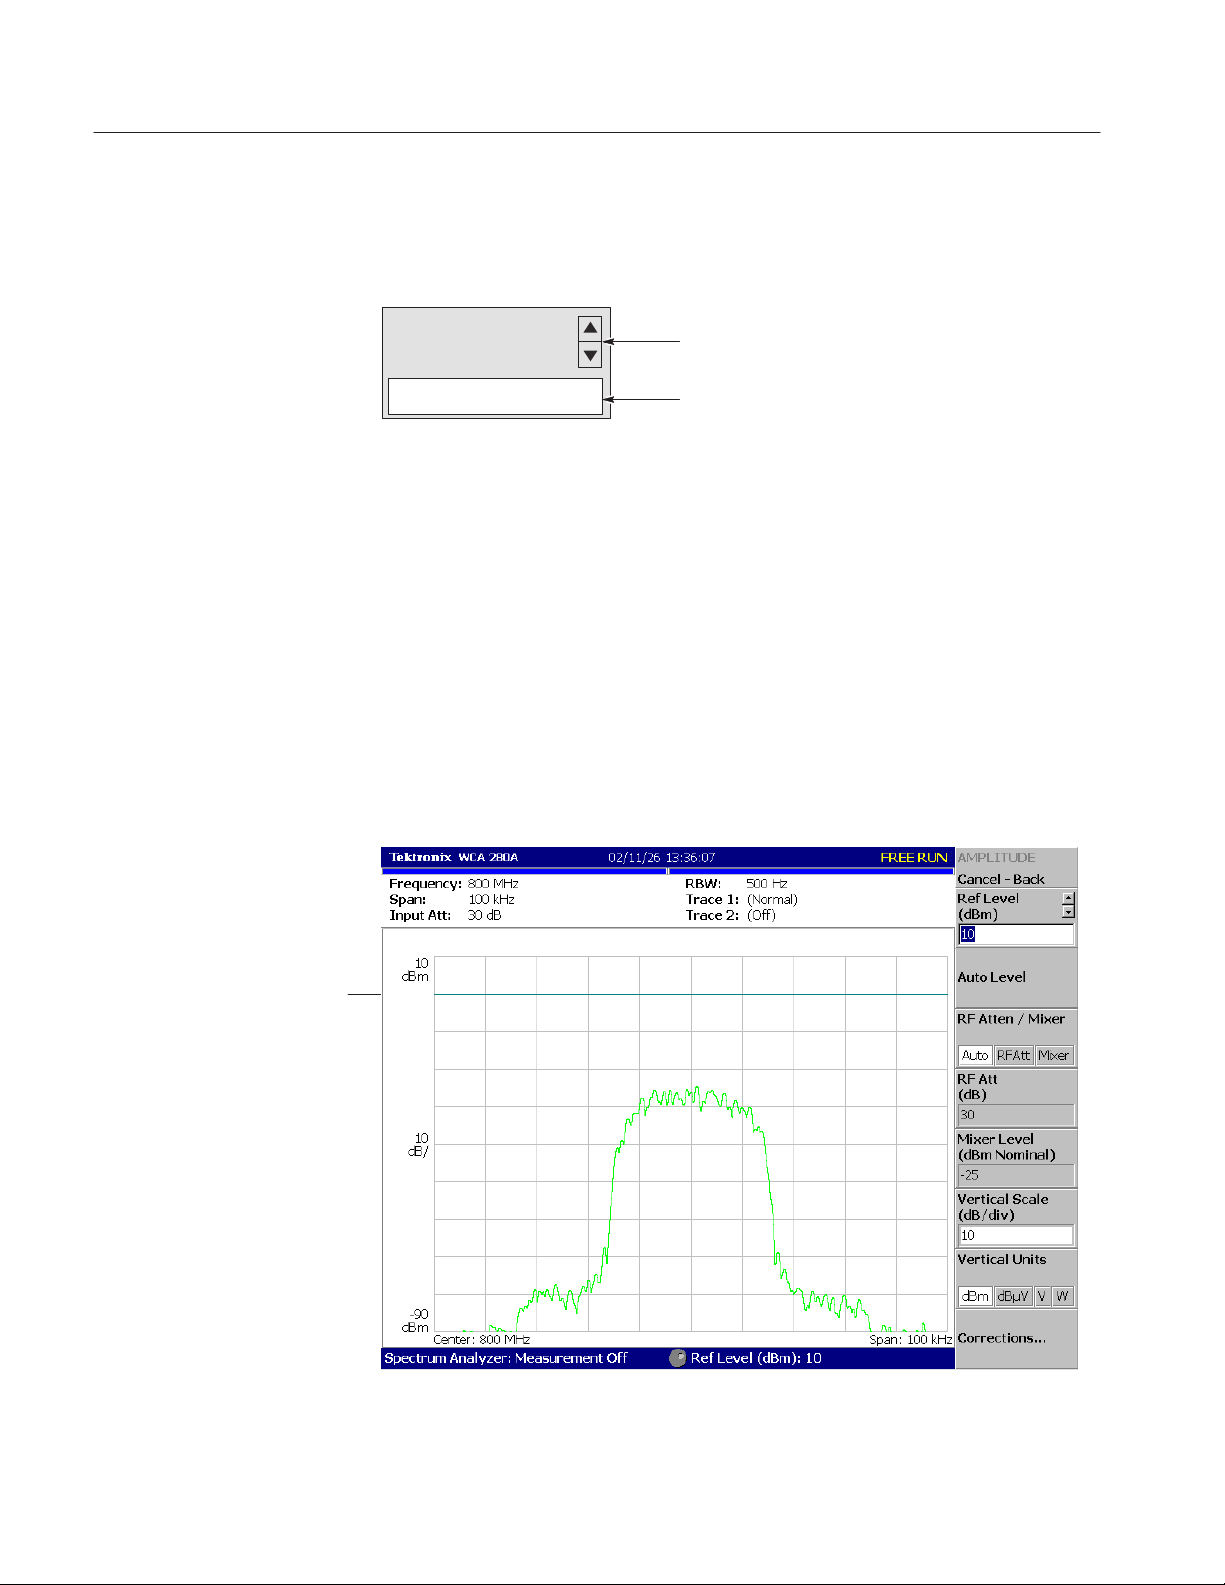
Operating Instructions
The Amplitude menu is displayed on the right side of the screen. Notice that
the Ref Level item is available for entering amplitude (see Figure 2–17).
Ref Level
Indicates that the general purpose knob is available
(dBm)
XXX
Figure 2-17: Menu items for numeric value input
2. Observe the changes in the waveform as you turn the general purpose knob.
H As you turn the knob to the right, the amplitude increases and waveform
shifts to a relatively lower position.
H As you turn the knob to the left, the amplitude decreases and waveform
shifts to a relatively higher position.
In Figure 2–18, the amplitude is set to 10 dBm. When the amplitude is set to
0 dBm or higher, a blue standard line is displayed indicating 0 dBm.
3. Set the Ref Level back to 0 dBm after confirming the amplitude operation.
Numeric value input field
2-22
0 dBm reference line
Figure 2-18: Reference level of 10 dBm
WCA230A & WCA280A Service Manual
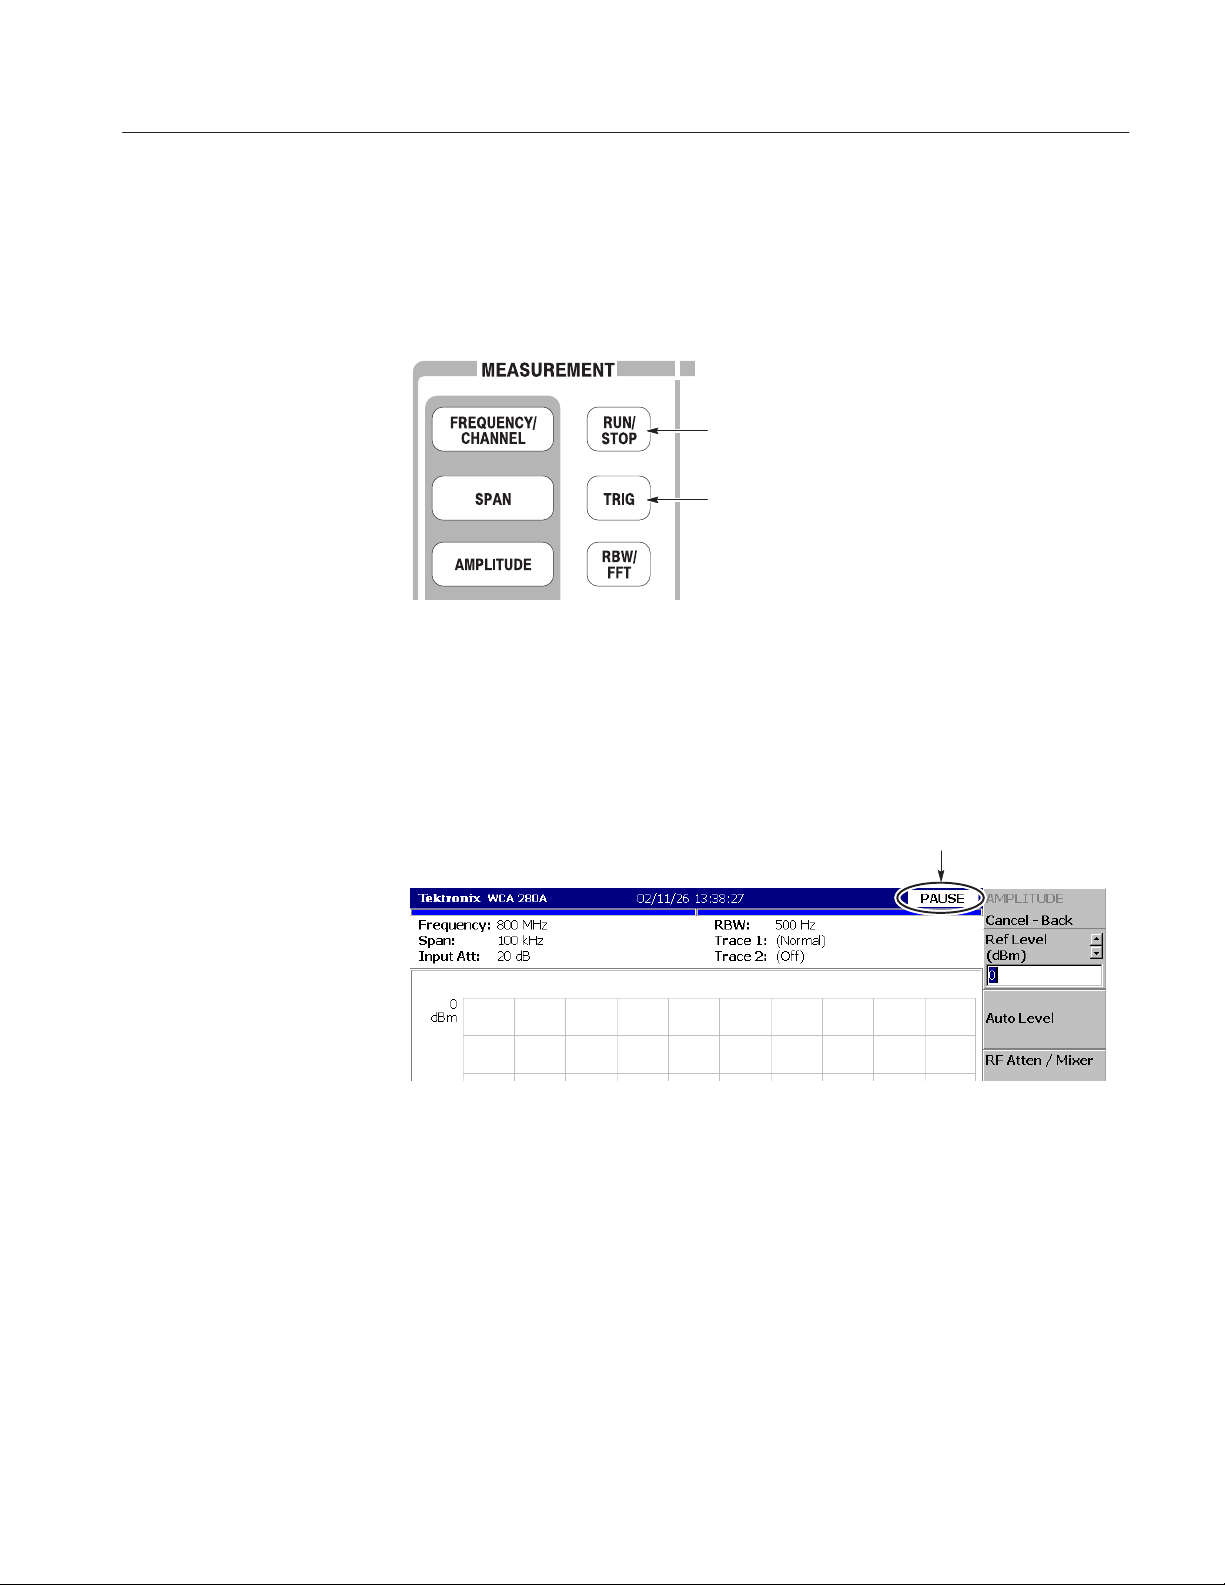
Operating Instructions
Starting and Stopping
Data Acquisition
Use the RUN/STOP key to start or stop data acquisition. There are two
acquisition modes: the continuous mode, in which data is acquired repeatedly
and the single mode, in which one waveform is acquired. You can select the
mode using the Trig menu.
RUN/STOP key
TRIG key
By default, the analyzer is now acquiring data in the continuous mode.
1. Press the RUN/STOP key to stop data acquisition.
When acquisition stops, “PAUSE” is shown in the status indicator on screen
(see Figure 2–19).
Figure 2-19: Status indicator
Status indicator
WCA230A & WCA280A Service Manual
2-23

Operating Instructions
2. Acquire data in the single mode using the following steps:
a. Press the TRIG key on the front panel.
b. Press the Repeat... side key and select Single.
c. Press the RUN/STOP key to acquire data. One waveform is acquired
and displayed every time you press the key.
3. Press the Repeat... side key again and select Continuous to return to the
continuous mode.
When acquisition starts, “READY” is displayed in the status indicator,
indicating that the analyzer is ready for trigger.
2-24
WCA230A & WCA280A Service Manual

Using Markers and Peak Search
The markers are used to measure amplitude or frequency (and also to find the
peak signal).
One or two markers can be displayed as Marker 1 and 2. To measure an absolute
value, only Marker 1 is used, and that is called “single marker mode.” To
measure a relative value, Markers 1 and 2 are used, and that is called “delta
marker mode.” To position the markers, use the general purpose knob or the
numeric input keypad.
Operating Instructions
Measuring with a
Single Marker
1. Press the MARKER SETUP key on the front panel.
MARKER SETUP key
Selects the behavior of
the markers.
2. Press the Markers side key to select Single.
The marker (V) appears at the left end of the waveform.
3. The Marker X Position menu item is selected by default. Turn the general
purpose knob to move the marker to a measurement point (see Figure 2–20).
WCA230A & WCA280A Service Manual
2-25

Operating Instructions
Marker 1
Marker readout
Figure 2-20: Measurement with a single marker
Marker X Position
Sets the horizontal position of the
marker using the general purpose
knob or numeric input keypad.
2-26
WCA230A & WCA280A Service Manual

Operating Instructions
Measuring Difference with
Delta Marker
Turn on Marker 1 and 2 to measure the difference in amplitude and frequency.
On the screen, the symbol “V” represents the active marker and “Z” represents
the fixed marker. You can operate only the active marker.
1. Press the MARKERS SETUP key on the front panel.
2. Press the Markers side key to select Delta. The fixed marker (Z) appears at
the left end on the waveform.
3. Make sure that 1 (Marker 1) is selected in the Select Marker menu item.
This means that Marker 1 is the active marker.
4. The Marker X Position menu item is selected. Using the general purpose
knob or the numeric input keypad, move the marker to a reference point
(see Figure 2–21).
5. Press the Select Marker side key to select 2, making Marker 2 the active
marker.
You can also select the marker using the MARKERS SELECT key on the
front panel. The MARKERS: SELECT key and the Select Marker side key
have the same function.
WCA230A & WCA280A Service Manual
2-27

Operating Instructions
Delta marker measurement value
= Marker 1 - Marker 2
6. The Marker X Position menu item is selected. Using the general purpose
knob or the numeric input keypad, move the marker to a measurement point
(see Figure 2–21).
The difference between the two marker positions is indicated in the upper
left part of the screen.
Readout of the selected marker
Select Marker
Selects the active marker.
Marker 1
Markers
Here selects Delta to show
Marker 1 and 2.
Marker 2
Figure 2-21: Measurement with the delta marker
7. Press the Markers side key to select Single. The analyzer returns to the
single marker mode.
2-28
WCA230A & WCA280A Service Manual
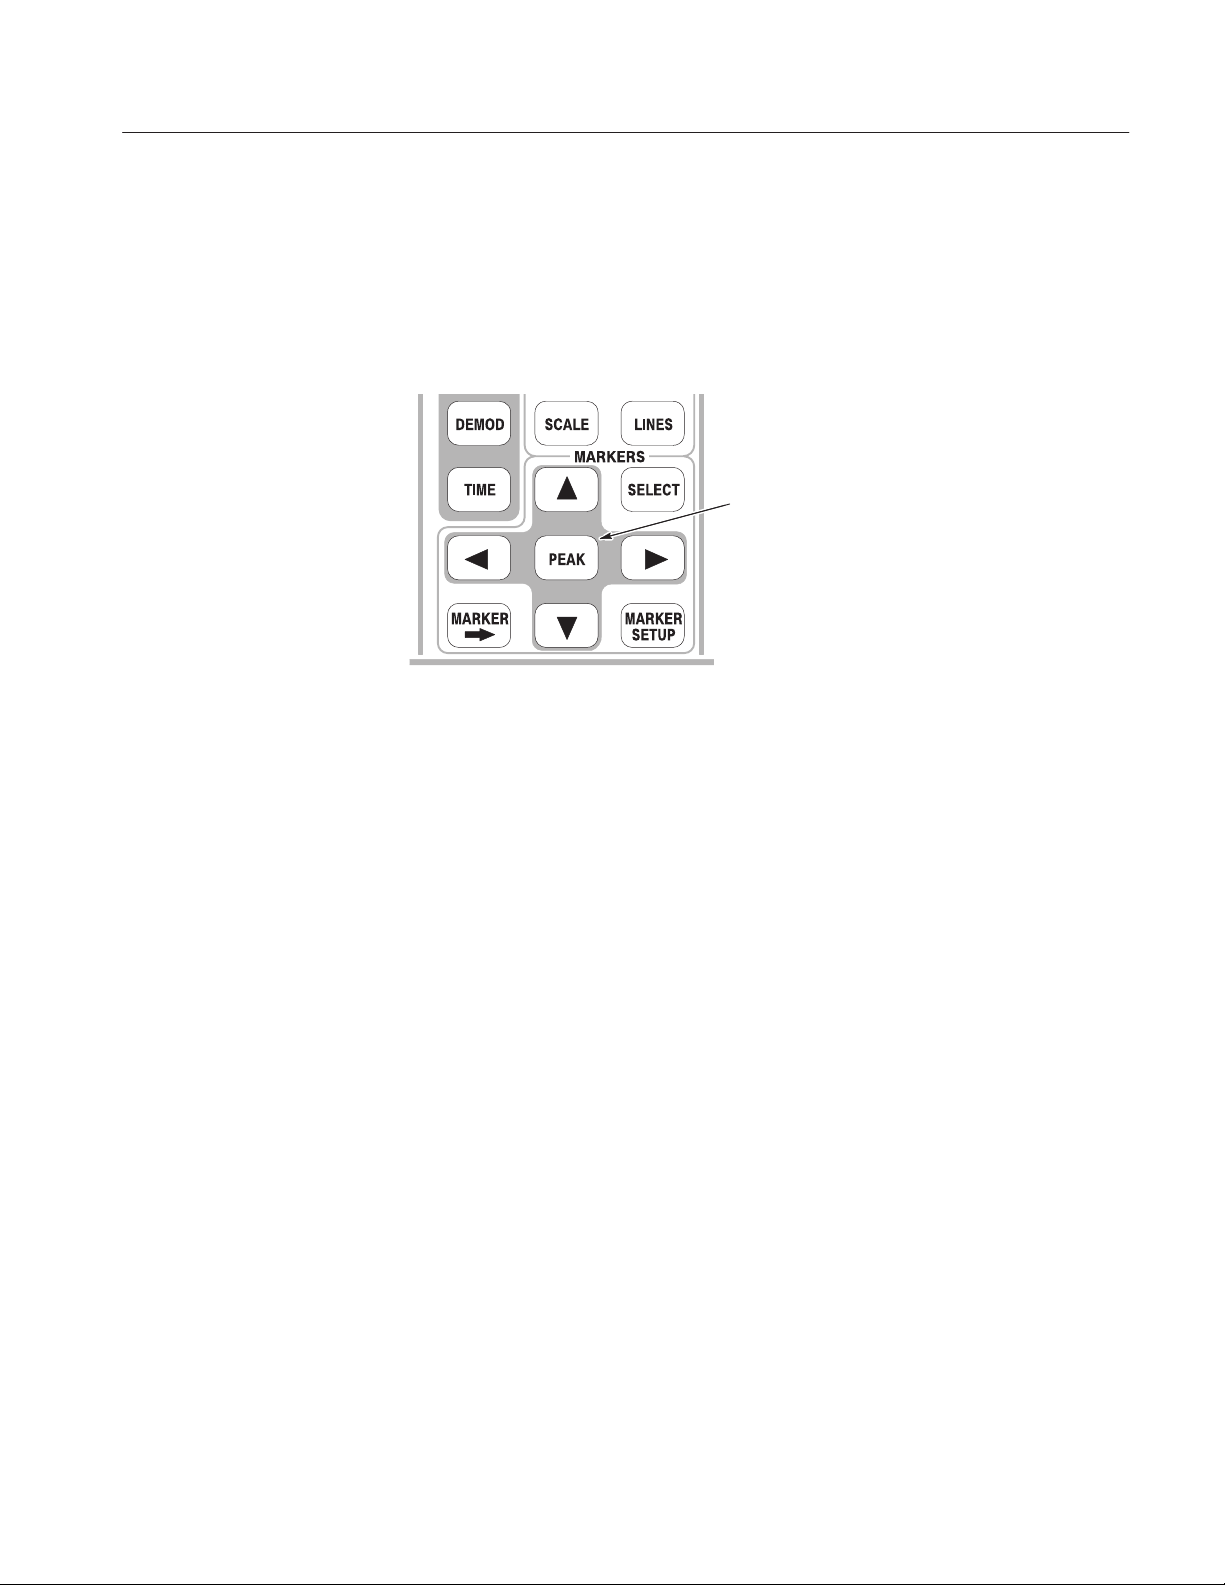
Operating Instructions
Searching for the Peak
Measure the frequency interval between the maximum intensity spectrum and the
peak to its left by using the delta marker and peak search functions together.
1. Press the PEAK key on the front panel.
Marker 1 moves to the maximum intensity spectrum.
PEAK key
Positions the marker at
the maximum peak.
2. Press the Markers side key to select Delta.
The fixed marker (Z) appears at the point that was last set.
3. Press the Select Marker side key to select 2, making Marker 2 active.
4. Press the marker right key (") to move the marker to the next signal peak to
the right. Try it several times.
5. Press the marker left key (A) to move the marker to the next signal peak to
the left. Try it several times.
6. Using the marker left or right key, position the marker to the measurement
peak.
WCA230A & WCA280A Service Manual
2-29

Operating Instructions
The difference between the two marker positions is shown in the upper left
part of the screen (see Figure 2–22).
Peak value at the selected marker
Peak difference
Marker 1
Marker 2
Figure 2-22: Searching for the peak
7. Press the Markers side key to select Off. Both markers disappear.
2-30
WCA230A & WCA280A Service Manual

Using Averaging and Comparison Displays
This section describes how to use the averaging function, which displays the
waveform with reduced noise. The averaged waveform can be displayed with the
original waveform.
Operating Instructions
Averaging
There are several averaging methods; select RMS (Root-Mean-Square) in this
example.
1. Press the TRACE/AVG key.
TRACE/AVG key
2. Press the Trace Type side key to select Average.
3. Press the Number of Averages side key to specify how many traces are
accumulated to create the averaged waveform.
In this example, enter 64 with the numeric keypad.
Press 6 4 ENTER in order.
4. Press the RUN/STOP key on the front panel to acquire waveform.
WCA230A & WCA280A Service Manual
2-31

Operating Instructions
The averaged waveform is displayed on the screen. The average count is shown
in the upper right part of the screen (see Figure 2–23). When the waveform is
acquired in the free run mode, the averaging is done with exponential RMS
(root-mean-square). This method continues the average with an exponential
weighting applied to old values, using the number of averages (64 in this
example) as the weighting factor.
Average count
Trace 1 Type
Selects the type of processing
for the selected trace.
Figure 2-23: Comparing a new waveform with an averaged waveform
5. Press the Reset Average side key to restart averaging.
2-32
WCA230A & WCA280A Service Manual

Operating Instructions
Comparison Display
You can display two different types of traces concurrently on the screen. In this
procedure, you will display the currently acquired waveform and an averaged
waveform for comparison.
1. Press the TRACE/AVG key on the front panel.
2. Make sure that 1 (Trace 1) is selected in the Select Trace menu item.
3. Press the Trace Type... side key and select Normal to define Trace 1 as the
currently acquired waveform.
4. Press the Select Trace side key to select 2 (Trace 2).
5. Press the Trace 1 Type... side key and select Average to define Trace 2 as
the averaged waveform.
6. Press the RUN/STOP key on the front panel to acquire waveform.
The currently acquired waveform (Trace 1 in yellow) is displayed with the
averaged waveform (Trace 2 in green). See the display in Figure 2–24.
Select Trace
Selects the trace to be operated.
Trace 1 (Yellow): currently acquired waveform.
Trace 2 (Green): averaged waveform.
Figure 2-24: Comparison display with averaged waveform
7. Press the Trace 2 Type... side key again and select Off to remove Trace 2.
WCA230A & WCA280A Service Manual
2-33
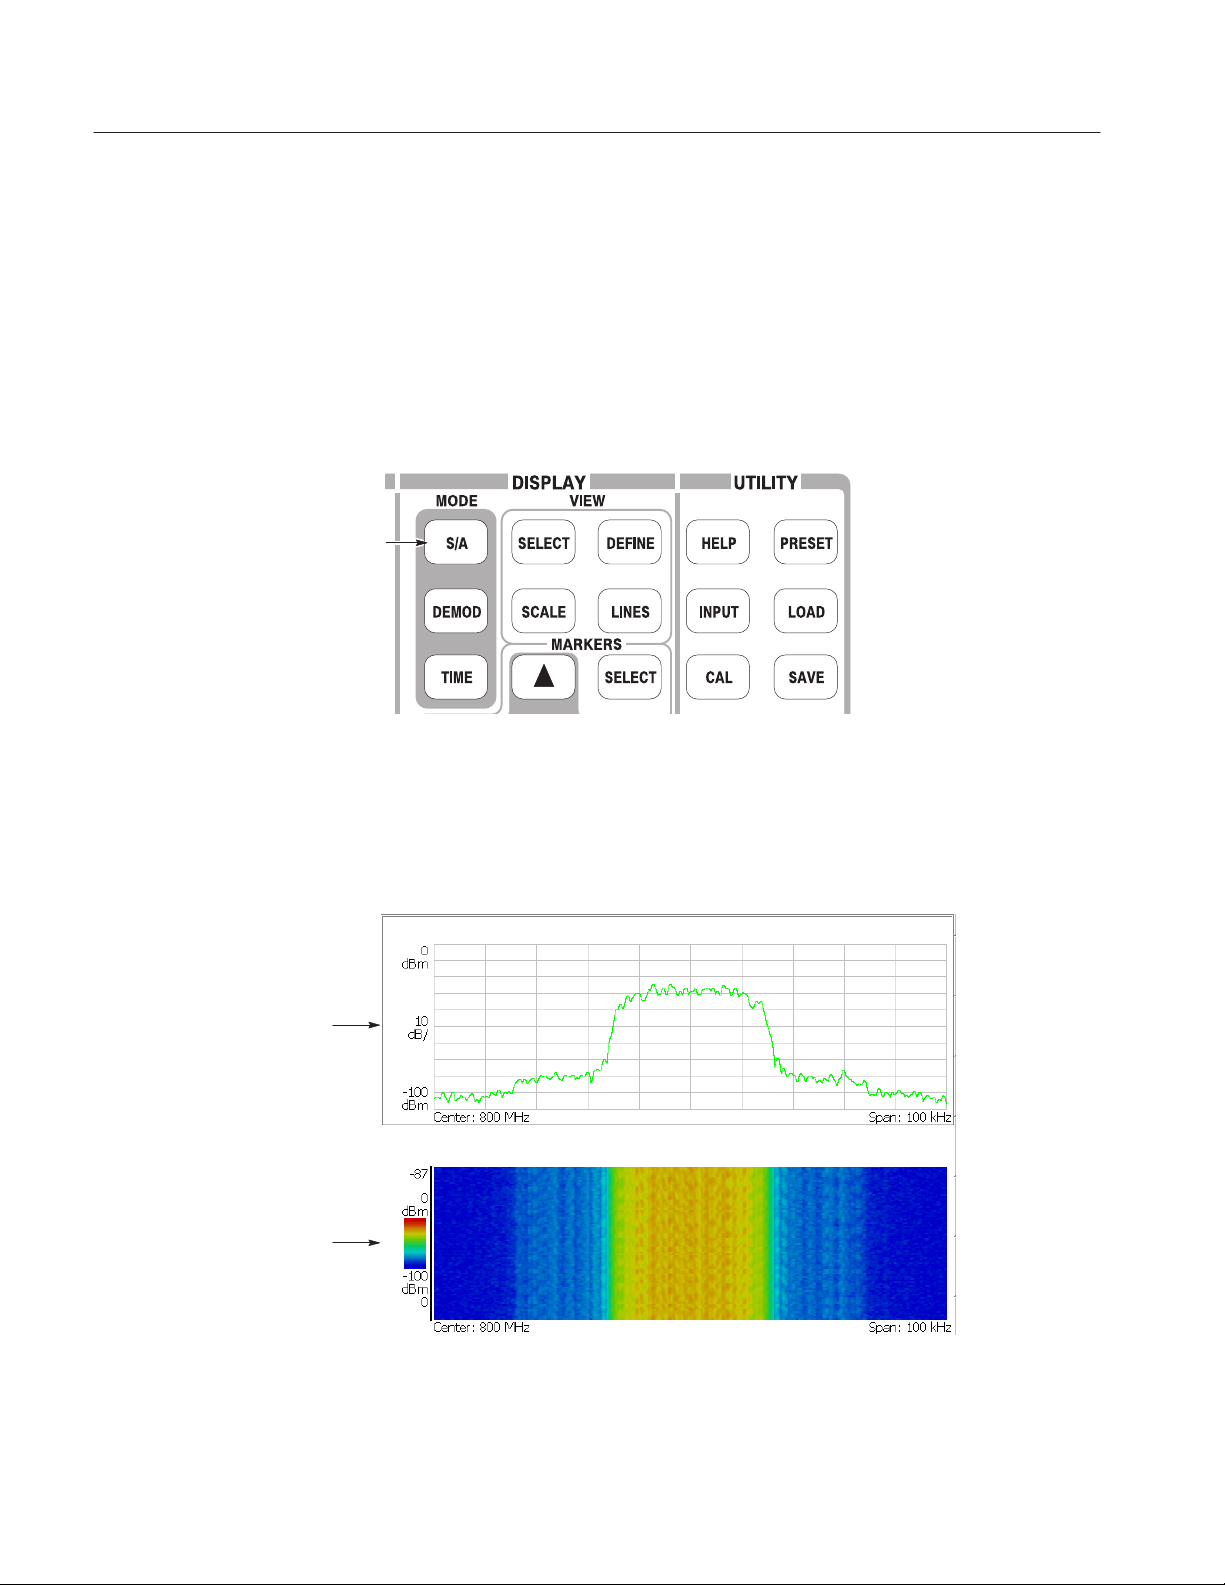
Operating Instructions
Displaying a Spectrogram
The spectrogram view is a useful tool to observe spectrum changes in time series
in a three-dimensional view. The horizontal and vertical axes indicate frequency
and frame number, respectively, and the color axis represents amplitude.
Display the spectrogram using the following steps:
1. Press the MODE: S/A key.
S/A key
Spectrum
Spectrogram
2. Press the Spectrum Analyzer with Spectrogram side key.
3. If no waveform is displayed, press the RUN/STOP key to acquire data.
The spectrum and spectrogram are displayed concurrently (see Figure 2–25).
2-34
Figure 2-25: Concurrent display of spectrum and spectrogram
WCA230A & WCA280A Service Manual

4. Display the spectrum and spectrogram side-by-side:
a. Press the VIEW: DEFINE key.
VIEW: DEFINE key
Modifies display format.
b. Press the View Orientation side key to select Tall.
Operating Instructions
Figure 2-26: Tall display of spectrum and spectrogram
c. Press the View Orientation side key to select Wide.
WCA230A & WCA280A Service Manual
2-35

Operating Instructions
5. Display spectrogram only:
a. Press the VIEW: SELECT key and then select the spectrogram on the
display.
The selected view is framed in white on screen.
VIEW: SELECT key
Selects a view to operate.
(The selected view is surrounded by a white frame)
b. Press the VIEW: DEFINE key and then press the Show Views side key
to select Single.
The new frame is displayed in
order from the bottom.
Amplitude is represented in color.
Default scale is from
Red (0dBm) to Blue (-100dBm).
Only the spectrogram is displayed (see Figure 2–27).
Frequency
Figure 2-27: Spectrogram view
2-36
c. Press the Show Views side key again to return to Multi.
WCA230A & WCA280A Service Manual
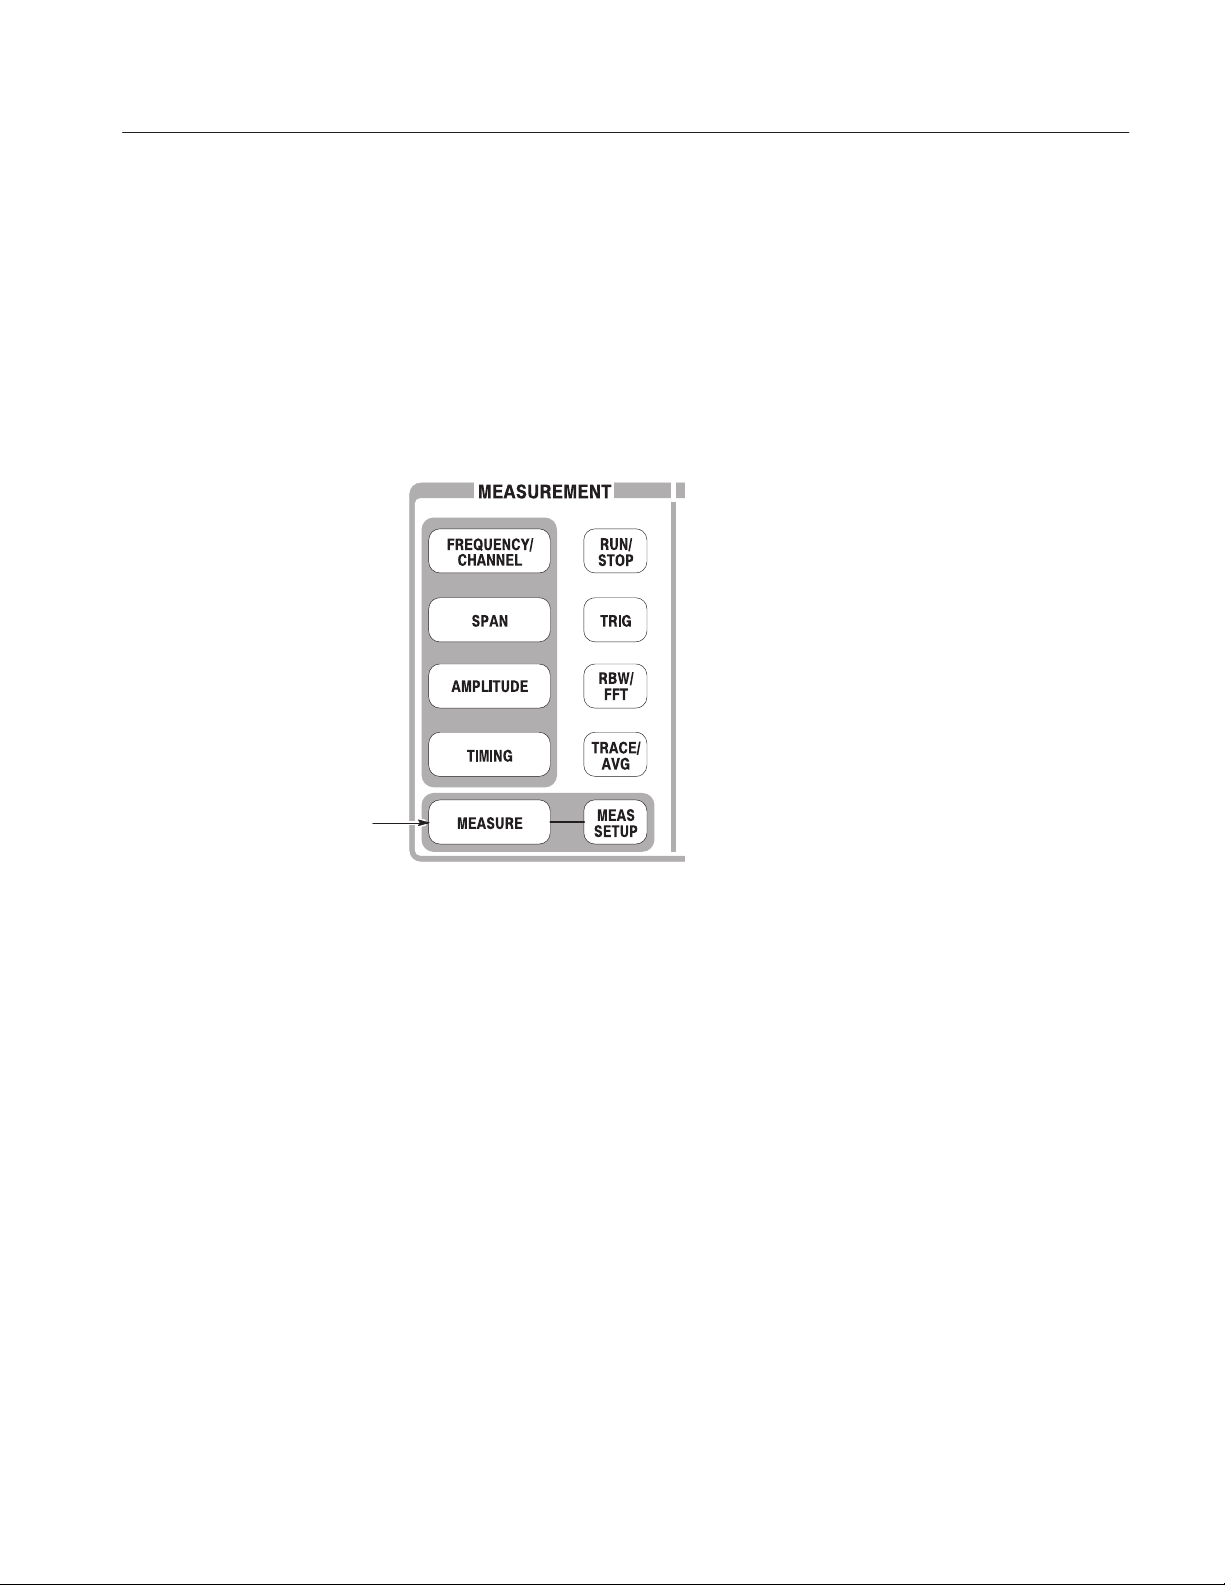
Spectrum Analysis
Operating Instructions
There are several items in the spectrum analysis, such as ACPR (Adjacent
Channel Leak Power Ratio), C/N (Carrier vs. Noise Power Ratio), and OBW
(Occupied Band Width). These items enable you to perform measurements using
simple key operations. Channel power and carrier frequency are measured as
examples.
Measuring Channel Power
MEASURE key
Selects a measurement item
1. Press the MEASURE key on the front panel.
Measurement items are displayed in the menu on the right side of the screen.
WCA230A & WCA280A Service Manual
2-37
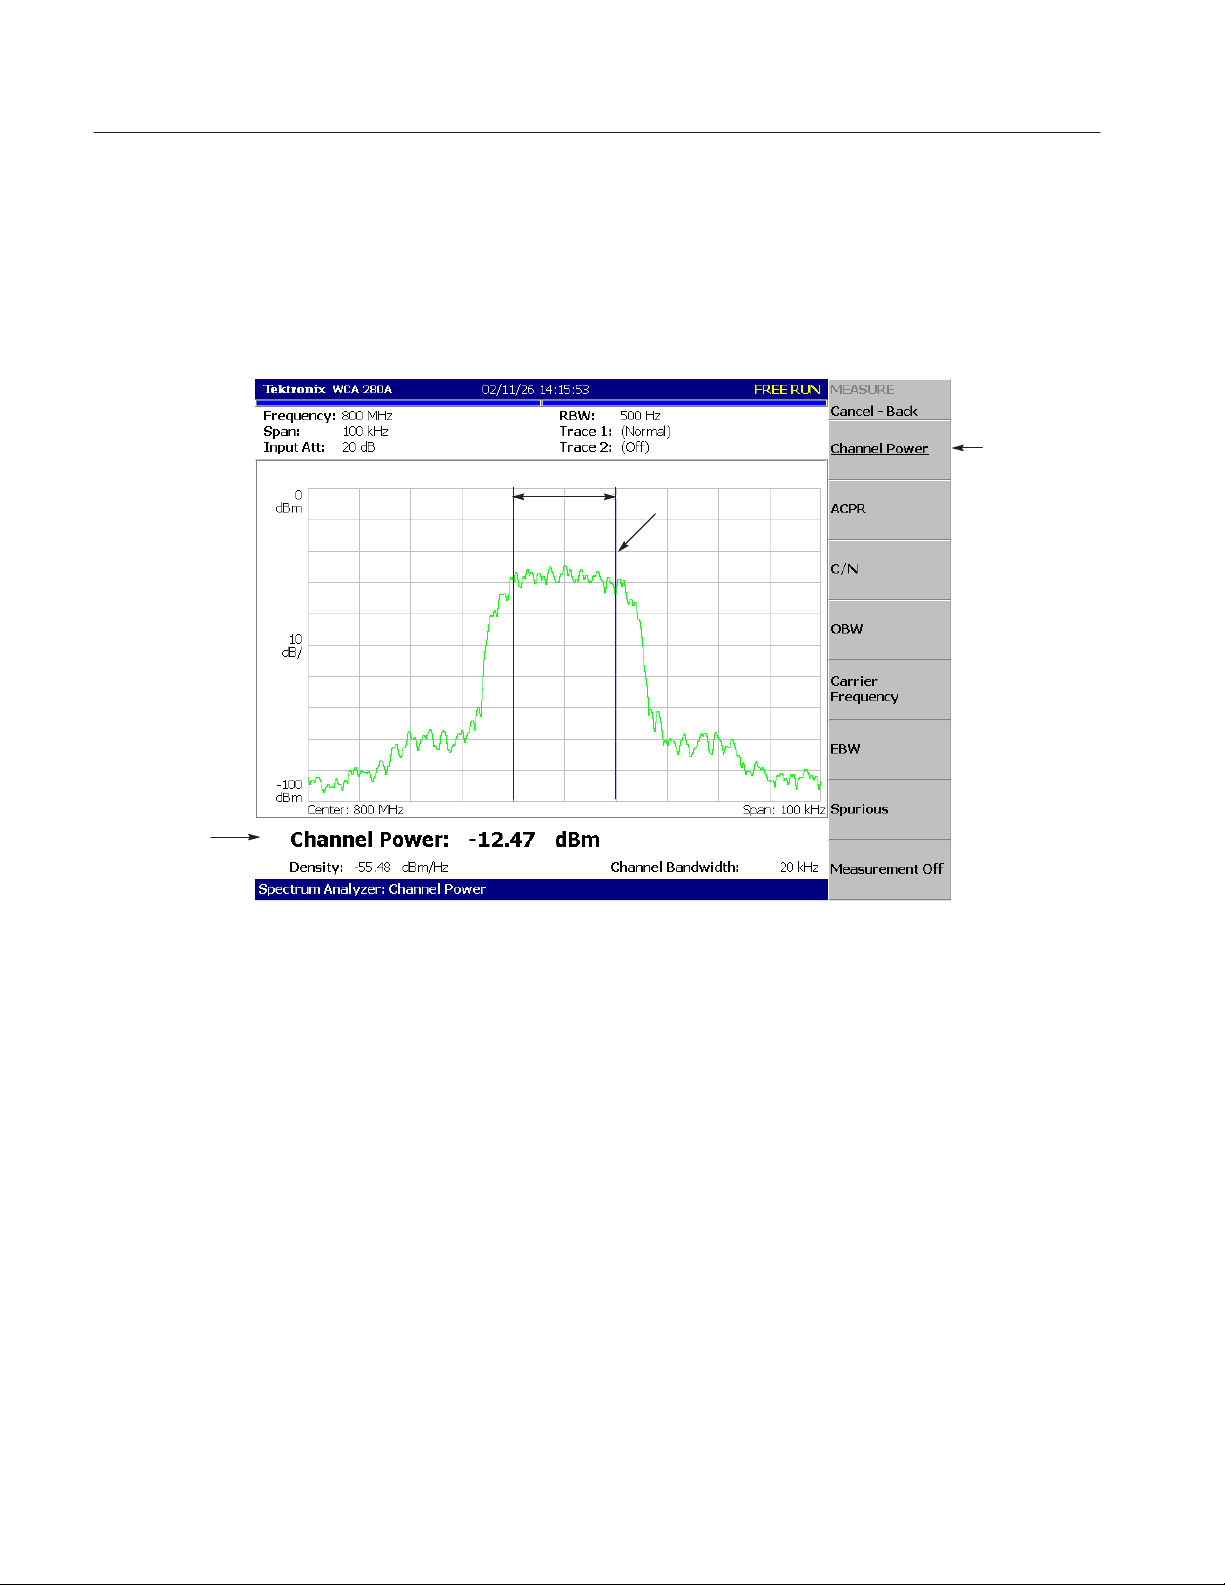
Operating Instructions
2. Press the Channel Power side key.
A band power marker, indicating measurement range, is displayed on the
spectrum waveform. The measurement result is displayed below the
waveform (see Figure 2–28).
Select Channel
Power here
Band power marker
Measurement
results
Figure 2-28: Channel power measurement
2-38
WCA230A & WCA280A Service Manual
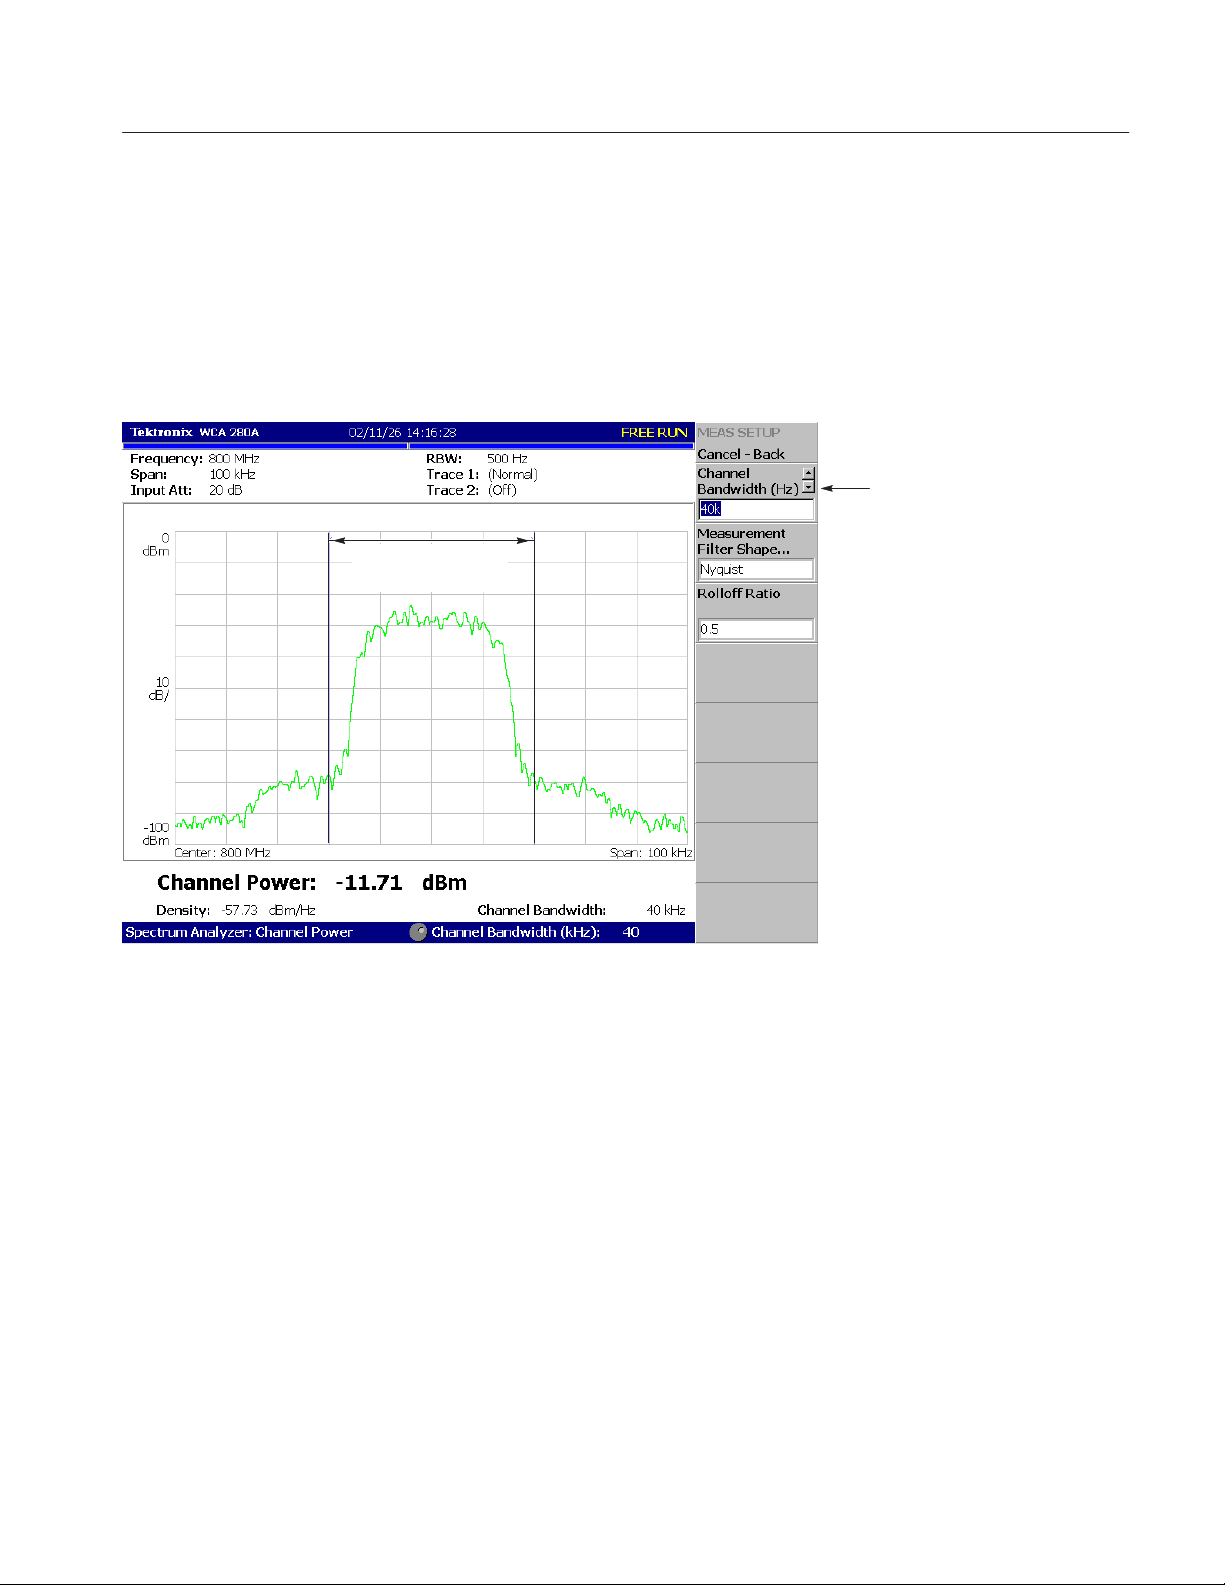
Operating Instructions
Changing a Measurement
Parameter
Change a measurement parameter:
1. Press the MEAS SETUP key on the front panel.
2. The Channel Bandwidth menu item is selected. Using the general purpose
knob, set the measurement range to 40 kHz for example. See the display in
Figure 2–29.
Channel Bandwidth
Sets the measurement bandwidth.
Channel Bandwidth
=40kHz
Figure 2-29: Channel power measurement (Channel Bandwidth = 40 kHz)
WCA230A & WCA280A Service Manual
2-39

Operating Instructions
Measuring Carrier
Frequency
Carrier frequency can be measured accurately, using the counter function:
1. Press the MEASURE key on the front panel.
2. Press the Carrier Frequency side key.
The measurement result is displayed at the bottom of the screen
(see Figure 2–30).
Carrier frequency measurement
result: measured accurately with
counter function.
Figure 2-30: Carrier frequency measurement
2-40
WCA230A & WCA280A Service Manual

Modulation Analysis
Operating Instructions
This section describes how to analyze a digitally-modulated signal. Settings are
the same as those in the previous section; center frequency at 800 MHz, span of
100 kHz, and amplitude of 0 dBm.
Selecting Analysis Mode
The analyzer functions are classified into three functional groups, selected using
the Mode keys (see Figure 2–31):
H Spectrum analysis MODE: S/A
Performs general spectrum analysis. All operations in the tutorial up to this
point have been performed in this mode.
H Modulation analysis MODE: DEMOD
Performs analog and digital modulation analysis.
H Time analysis MODE: TIME
Performs time characteristic analysis, including CCDF measurement.
MODE keys
Selects the analysis mode
Figure 2-31: MODE keys
The measurement procedures for modulation analysis and the time analysis are
similar. Select the digital modulation analysis:
1. Press the DEMOD key on the front panel.
2. Press the Measurement Set side key to select Digital.
WCA230A & WCA280A Service Manual
2-41
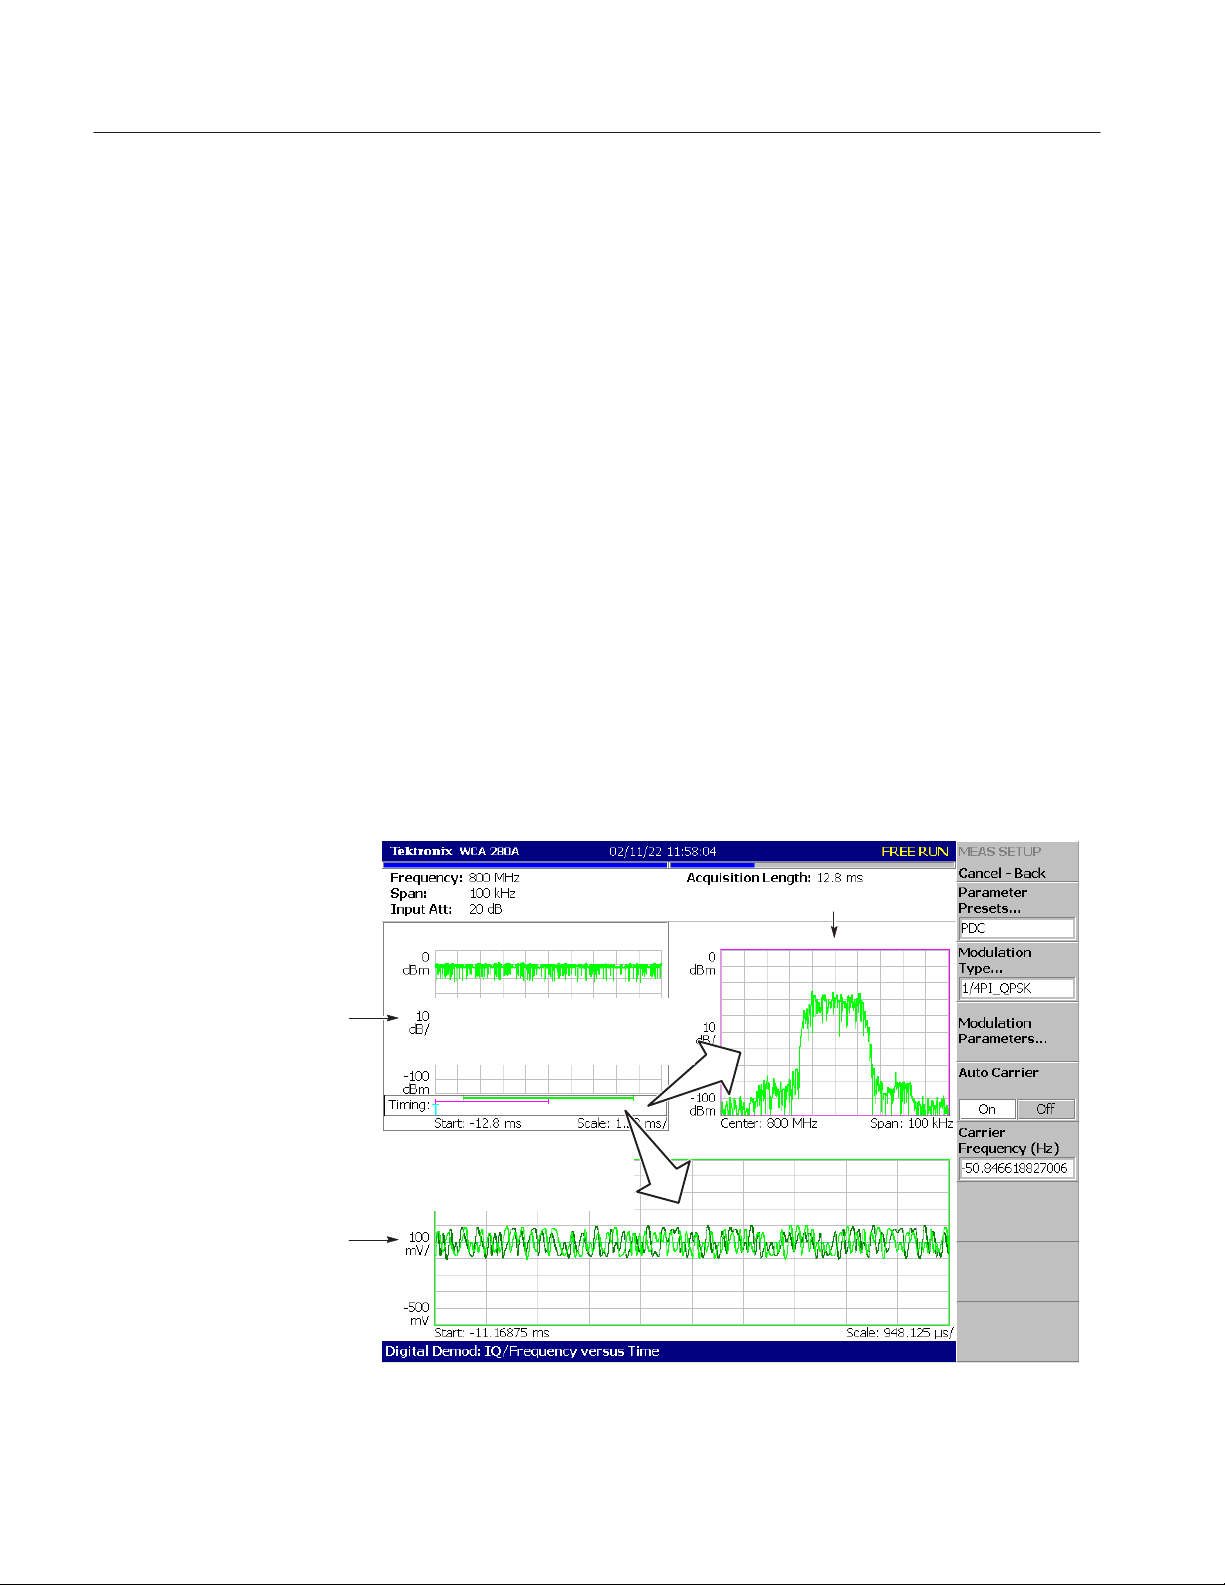
Operating Instructions
Selecting a Measurement
Item
Observe IQ level change in time series as an example.
1. Press the IQ/Frequency vs. Time side key.
2. Press the MEAS SETUP key on the front panel to set the measurement
parameter.
3. Because this tutorial uses the PDC modulation signal, press the Parameter Presets... side key and select PDC.
4. Press the RUN/STOP key to acquire the signal (see Figure 2–32).
Three views are displayed on the screen in the Demod mode:
H Overview: All data of the specified block are displayed in the time
domain. The measurement range indicated by the green underline is
specified in this view.
H Main view: Displays the measurement result and waveform of the range
specified in the overview (they may be displayed in separate views). In
this case, level changes of I and Q signals are displayed as the yellow
and green traces, respectively, in the main view.
H Subview: Spectrum is displayed as an auxiliary view by default. You can
specify the range in the overview to create the spectrum for the subview.
Overview
Main view
Subview
The data in the range indicated by
the pink underline is FFTĆprocessed
and displayed in the subview.
The data in the range indicated by
the green underline is analyzed and
displayed in the main view.
Figure 2-32: IQ level measurement
2-42
WCA230A & WCA280A Service Manual

Operating Instructions
Setting Analysis Range
TIMING key
Sets analysis range.
Set an analysis range, which will be displayed with a green underline in the
overview.
1. Press the TIMING key on the front panel.
Two vertical green lines appear, indicating the analysis range, shown in
Figure 2–33.
2. Press the Acquisition History side key to specify the number of the block to
be analyzed. Leave it at “0” (the latest block), its default value.
3. Press the Analysis Length side key and specify the time length of the
analysis range. For example, enter 8 ms using the numeric keypad.
4. Press the Analysis Offset side key and specify the starting point of the
range. For example, enter 3 ms using the numeric keypad.
WCA230A & WCA280A Service Manual
2-43

Operating Instructions
Two green vertical lines represent
an analysis range.
The main view shows the waveform and
measurement result for the analysis range.
TIMING menu
Acquisition History
Specifies the number of the block to
be analyzed.
Analysis Length
Specifies the time length of the
analysis range.
Analysis Offset
Specifies the start point of the
analysis range.
Figure 2-33: Analysis range settings
Setting the Acquisition
Length
One frame consists of 1024 data points and one block consists of several frames.
Data are acquired in block units in the Demod mode. The number of frames in
one block is referred to as block size. Frame and block size are shown in
Figure 2–34.
Figure 2-34: Frame and block
1024 data points
...
Frame 0
Frame 1
Frame 2
Frame 3
Frame N-1
1 block (=N frames)
2-44
WCA230A & WCA280A Service Manual

Operating Instructions
Suppose that one block contains N frames. The acquisition length for a block is
calculated using this equation:
(One block acquisition length) = N (One frame acquisition length)
One block acquisition length is set using Acquisition Length in the Timing
menu. One frame acquisition length is set internally, depending on span, and
displayed in Spectrum Length in the Timing menu.
To set the acquisition length, perform the following steps:
1. Press the TIMING key on the front panel.
By default, Acquisition Length is set to 12.8 ms and Spectrum Length
6.4 ms. The number of frames in a block is 12.8B6.4=2.
2. Press the Acquisition Length side key to change the value.
For example, set 64 ms by turning the knob (see Figure 2–35).
10 frames
(10240 points)
Figure 2-35: Changing the acquisition length
In this case, Acquisition Length is 64 ms and Spectrum Length 6.4 ms, so the
data is displayed in the overview for 64B6.4=10 frames (10240 points). The
green underline indicating the analysis range gets narrower than the previous
setting: one block = 2 frames.
Acquisition Length
Sets the time length to
acquire one block.
WCA230A & WCA280A Service Manual
2-45

Operating Instructions
Displaying Single View
and Changing Scale
Although three views are normally displayed in the Demod mode, you can select
one view to display full screen. This section describes how to display one view
and change the vertical and horizontal scales using the VIEW keys.
1. Press the RUN/STOP key to stop acquisition and observe the waveform.
2. Press the VIEW: SELECT key to select the main view.
The selected view is surrounded with a white frame.
VIEW keys
3. Press the DEFINE key, and then the Show Views side key, shown in
Figure 2–36, to select Single.
Only the main view is displayed, with the size enlarged on the screen.
Figure 2-36: Single view display
Show Views
Select Single to show only the
selected view with the size enlarged.
2-46
WCA230A & WCA280A Service Manual

Operating Instructions
4. Change the scale:
a. Press the SCALE key in the VIEW area.
b. Press the Horizontal Scale side key and change the scale of the
horizontal axis (see Figure 2–37). Try several settings by turning the
general purpose knob; observe the changes in the display.
c. Press the Vertical Scale side key and change the vertical axis scale. Try
several settings by turning the knob; observe the changes in the display.
Vertical Scale
Completing the
Measurement
Horizontal Scale
Figure 2-37: Scale settings
Complete the measurement with the following procedure:
1. Press the MEASURE key on the front panel.
2. Press the Measurement Off side key.
The display returns to the spectrum view. However, the analysis mode is still
in the Demod mode.
WCA230A & WCA280A Service Manual
2-47
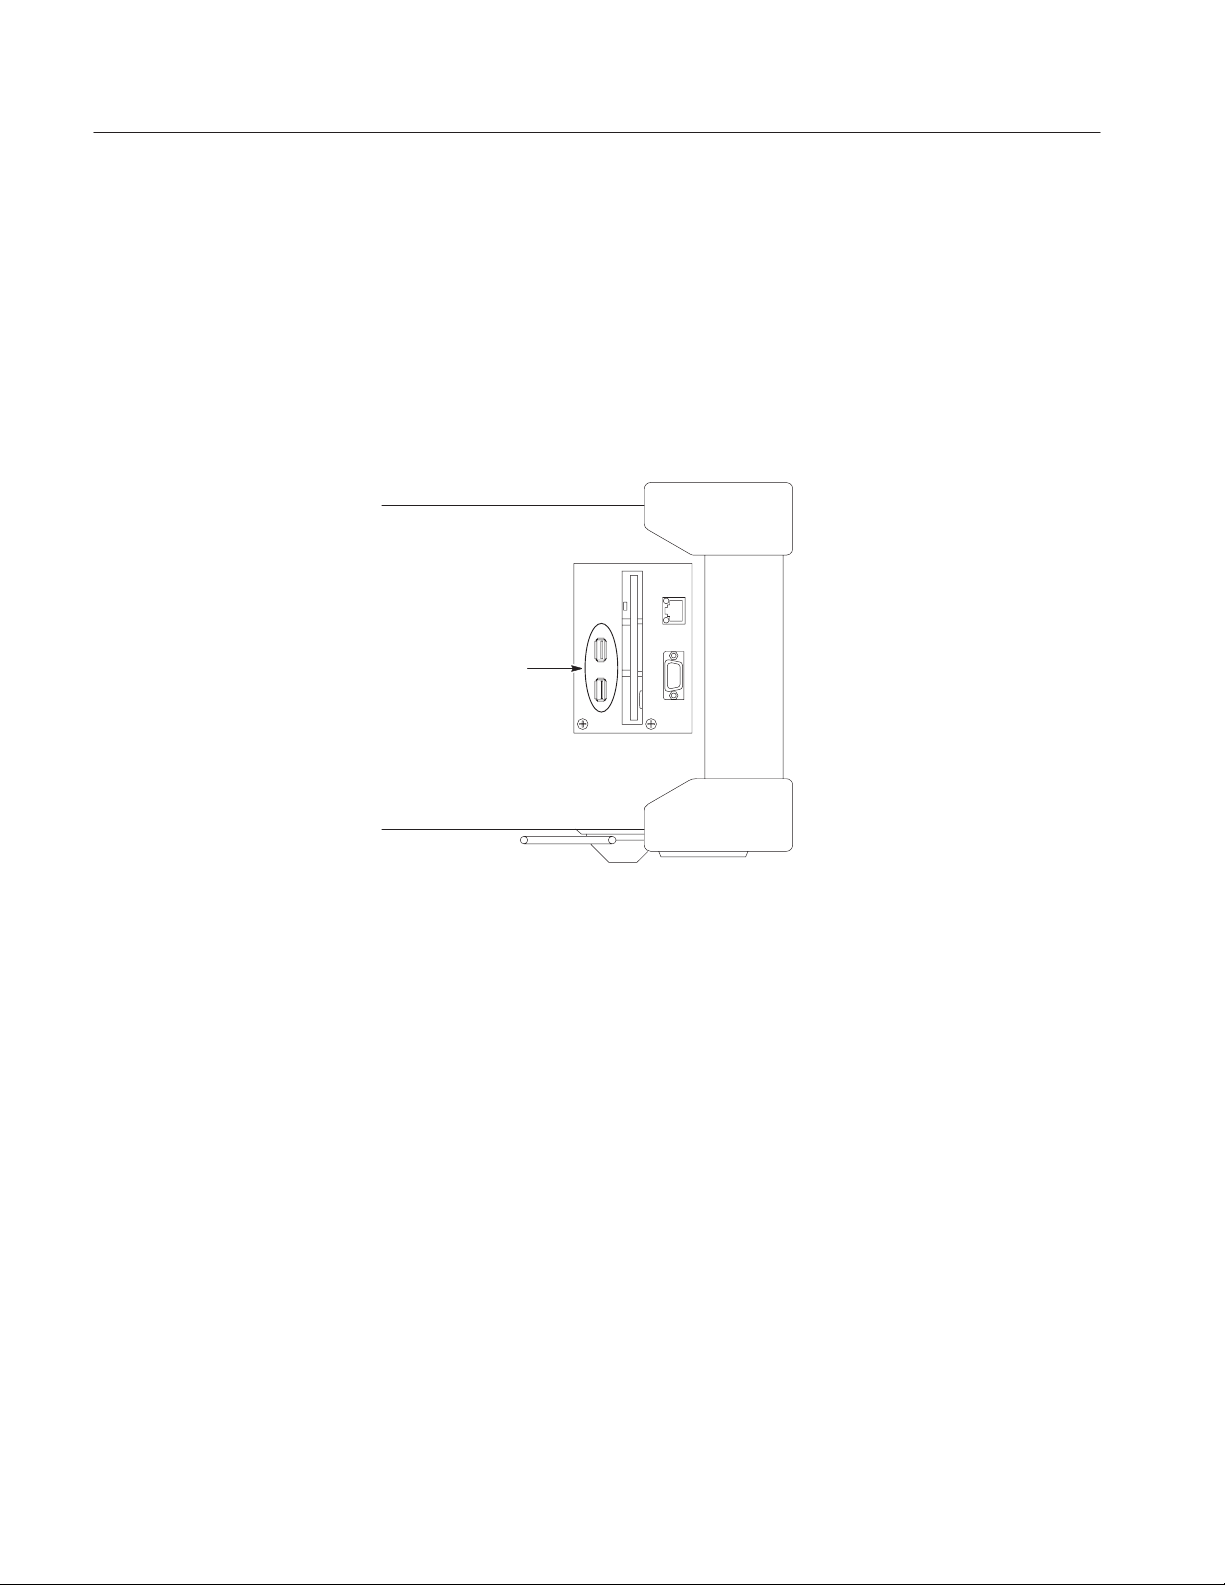
Operating Instructions
Using Windows XP
This analyzer operates under Windows XP. You can switch to a Windows XP
desktop screen or execute a Windows XP application program.
Connecting a Mouse and a
Keyboard
Connect a USB mouse and a USB keyboard to the USB ports on the side panel.
You can connect them to either or both ports. You can also connect the mouse to
the USB port on the keyboard.
USB ports
Figure 2-38: USB ports (side panel)
Front
2-48
WCA230A & WCA280A Service Manual
 Loading...