

Page 1

User Manual
WCA230A & WCA280A Option 27
3GPP Release 5 Downlink (HSDPA) Analysis
Software
071-1509-02
This document supports firmware version 3.30 and above.
www.tektronix.com
Page 2

Copyright © Tektronix. All rights reserved. Licensed software products are owned by Tektronix or its subsidiaries or
suppliers, and are protected by national copyright laws and international treaty provisions.
Tektronix products are covered by U.S. and foreign patents, issued and pending. Information in this publication
supercedes that in all previously published material. Specifications and price change privileges reserved.
TEKTRONIX and TEK are registered trademarks of Tektronix, Inc.
Contacting Tektronix
Tektronix, Inc.
14200 SW Karl Braun Drive
P.O . B ox 5 0 0
Beaverton, OR 97077
USA
For product information, sales, service, and technical support:
In North America, call 1-800-833-9200.
Worldwide, visit www.tektronix.com to find contacts in your area.
Page 3

Warranty 2
Tektronix warrants that this product will be free from defects in materials and workmanship for a period of one (1) year
from the date of shipment. If any such product proves defective during this warranty period, Tektronix, at its option,
either will repair the defective product without charge for parts and labor, or will provide a replacement in exchange
for the defective product. Parts, modules and replacement products used by Tektronix for warranty work may be new
or reconditioned to like new performance. All replaced parts, modules and products become the property of Tektronix.
In order to obtain service under this warranty, Customer must notify Tektronix of the defect before the expiration of
the warranty period and make suitable arrangements for the performance of service. Customer shall be responsible for
packaging and shipping the defective product to the service center designated by Tektronix, with shipping charges
prepaid. Tektronix shall pay for the return of the product to Customer if the shipment is to a location within the country
in which the Tektronix service center is located. Customer shall be responsible for paying all shipping charges, duties,
taxes, and any other charges for products returned to any other locations.
This warranty shall not apply to any defect, failure or damage caused by improper use or improper or inadequate
maintenance and care. Tektronix shall not be obligated to furnish service under this warranty a) to repair damage
resulting from attempts by personnel other than Tektronix representatives to install, repair or service the product; b) to
repair damage resulting from improper use or connection to incompatible equipment; c) to repair any damage or
malfunction caused by the use of non-Tektronix supplies; or d) to service a product that has been modified or integrated
with other products when the effect of such modification or integration increases the time or difficulty of servicing the
product.
THIS WARRANTY IS GIVEN BY TEKTRONIX WITH RESPECT TO THE PRODUCT IN LIEU OF ANY OTHER
WARRANTIES, EXPRESS OR IMPLIED. TEKTRONIX AND ITS VENDORS DISCLAIM ANY IMPLIED
WARRANTIES OF MERCHANTABILITY OR FITNESS FOR A PARTICULAR PURPOSE. TEKTRONIX’
RESPONSIBILITY TO REPAIR OR REPLACE DEFECTIVE PRODUCTS IS THE SOLE AND EXCLUSIVE
REMEDY PROVIDED TO THE CUSTOMER FOR BREACH OF THIS WARRANTY. TEKTRONIX AND ITS
VENDORS WILL NOT BE LIABLE FOR ANY INDIRECT, SPECIAL, INCIDENTAL, OR CONSEQUENTIAL
DAMAGES IRRESPECTIVE OF WHETHER TEKTRONIX OR THE VENDOR HAS ADVANCE NOTICE OF
THE POSSIBILITY OF SUCH DAMAGES.
Page 4

Page 5

Table of Contents
Preface . . . . . . . . . . . . . . . . . . . . . . . . . . . . . . . . . . . . . . . . . . . . . . . . . . . . . . 1ix
About This Manual . . . . . . . . . . . . . . . . . . . . . . . . . . . . . . . . . . . . . . . . . . . . . . . . . . . 1ix
Related Manuals. . . . . . . . . . . . . . . . . . . . . . . . . . . . . . . . . . . . . . . . . . . . . . . . . . . . . . 1ix
Getting Started
Analysis Definition . . . . . . . . . . . . . . . . . . . . . . . . . . . . . . . . . . . . . . . . . . . . . . . . . . . 1-2
Measurement Menu . . . . . . . . . . . . . . . . . . . . . . . . . . . . . . . . . . . . . . . . . . . . . . . . . . . 1-5
Operating Basics
Uplink/Downlink Analysis in the S/A Mode . . . . . . . . . . . . . . . . . . . . . . . 2-1
Measurement Procedure. . . . . . . . . . . . . . . . . . . . . . . . . . . . . . . . . . . . . . . . . . . . . . . . 2-2
Channel Power Measurement . . . . . . . . . . . . . . . . . . . . . . . . . . . . . . . . . . . . . . . . . . . 2-3
ACLR Measurement . . . . . . . . . . . . . . . . . . . . . . . . . . . . . . . . . . . . . . . . . . . . . . . . . . 2-5
Multi-Carrier ACLR Measurement
Downlink Analysis Only. . . . . . . . . . . . . . . . . . . . . . . . . . . . . . . . . . . . . . . . . . . . . . . . 2-7
Spectrum Emission Mask Measurement . . . . . . . . . . . . . . . . . . . . . . . . . . . . . . . . . . . 2-9
OBW Measurement . . . . . . . . . . . . . . . . . . . . . . . . . . . . . . . . . . . . . . . . . . . . . . . . . . 2-11
EBW Measurement . . . . . . . . . . . . . . . . . . . . . . . . . . . . . . . . . . . . . . . . . . . . . . . . . . 2-12
Carrier Frequency Measurement . . . . . . . . . . . . . . . . . . . . . . . . . . . . . . . . . . . . . . . . 2-13
Editing the Measurement Limits . . . . . . . . . . . . . . . . . . . . . . . . . . . . . . . . . . . . . . . . 2-14
Downlink Analysis in the Demod Mode . . . . . . . . . . . . . . . . . . . . . . . . . . 2-21
Measurement Procedure. . . . . . . . . . . . . . . . . . . . . . . . . . . . . . . . . . . . . . . . . . . . . . . 2-22
Measurement Setup Menu . . . . . . . . . . . . . . . . . . . . . . . . . . . . . . . . . . . . . . . . . . . . . 2-25
Scale and Format of View . . . . . . . . . . . . . . . . . . . . . . . . . . . . . . . . . . . . . . . . . . . . . 2-28
Code Domain Power . . . . . . . . . . . . . . . . . . . . . . . . . . . . . . . . . . . . . . . . . . . . . . . . . 2-31
Power Codogram . . . . . . . . . . . . . . . . . . . . . . . . . . . . . . . . . . . . . . . . . . . . . . . . . . . . 2-33
Code Power versus Time Slot . . . . . . . . . . . . . . . . . . . . . . . . . . . . . . . . . . . . . . . . . . 2-35
Code Power versus Symbol . . . . . . . . . . . . . . . . . . . . . . . . . . . . . . . . . . . . . . . . . . . . 2-37
Symbol Constellation. . . . . . . . . . . . . . . . . . . . . . . . . . . . . . . . . . . . . . . . . . . . . . . . . 2-39
Symbol EVM . . . . . . . . . . . . . . . . . . . . . . . . . . . . . . . . . . . . . . . . . . . . . . . . . . . . . . . 2-40
Symbol Eye Diagram. . . . . . . . . . . . . . . . . . . . . . . . . . . . . . . . . . . . . . . . . . . . . . . . . 2-42
Symbol Table . . . . . . . . . . . . . . . . . . . . . . . . . . . . . . . . . . . . . . . . . . . . . . . . . . . . . . . 2-43
Modulation Accuracy. . . . . . . . . . . . . . . . . . . . . . . . . . . . . . . . . . . . . . . . . . . . . . . . . 2-44
Uplink Analysis in the Demod Mode . . . . . . . . . . . . . . . . . . . . . . . . . . . . 2-45
Measurement Procedure. . . . . . . . . . . . . . . . . . . . . . . . . . . . . . . . . . . . . . . . . . . . . . . 2-46
Measurement Setup Menu . . . . . . . . . . . . . . . . . . . . . . . . . . . . . . . . . . . . . . . . . . . . . 2-48
Display Method for HS-DPCCH . . . . . . . . . . . . . . . . . . . . . . . . . . . . . . . . . . . . . . . . 2-51
Scale and Format of View . . . . . . . . . . . . . . . . . . . . . . . . . . . . . . . . . . . . . . . . . . . . . 2-54
Code Domain Power . . . . . . . . . . . . . . . . . . . . . . . . . . . . . . . . . . . . . . . . . . . . . . . . . 2-57
Power Codogram . . . . . . . . . . . . . . . . . . . . . . . . . . . . . . . . . . . . . . . . . . . . . . . . . . . . 2-59
Code Power versus Time Slot . . . . . . . . . . . . . . . . . . . . . . . . . . . . . . . . . . . . . . . . . . 2-61
Code Power versus Symbol . . . . . . . . . . . . . . . . . . . . . . . . . . . . . . . . . . . . . . . . . . . . 2-63
Symbol Constellation. . . . . . . . . . . . . . . . . . . . . . . . . . . . . . . . . . . . . . . . . . . . . . . . . 2-65
Symbol EVM . . . . . . . . . . . . . . . . . . . . . . . . . . . . . . . . . . . . . . . . . . . . . . . . . . . . . . . 2-66
WCA230A & WCA280A Option 27 User Manual
i
Page 6

Table of Contents
Syntax and Commands
Symbol Eye Diagram . . . . . . . . . . . . . . . . . . . . . . . . . . . . . . . . . . . . . . . . . . . . . . . . . 2-68
Symbol Table. . . . . . . . . . . . . . . . . . . . . . . . . . . . . . . . . . . . . . . . . . . . . . . . . . . . . . . . 2-69
Modulation Accuracy . . . . . . . . . . . . . . . . . . . . . . . . . . . . . . . . . . . . . . . . . . . . . . . . . 2-70
ACK/NACK Analysis . . . . . . . . . . . . . . . . . . . . . . . . . . . . . . . . . . . . . . . . . . . . . . . . . 2-71
Command Groups . . . . . . . . . . . . . . . . . . . . . . . . . . . . . . . . . . . . . . . . . . . . . 3-1
Functional Groups. . . . . . . . . . . . . . . . . . . . . . . . . . . . . . . . . . . . . . . . . . . . . . . . . . . . . 3-2
:CONFigure Commands . . . . . . . . . . . . . . . . . . . . . . . . . . . . . . . . . . . . . . . . . . . . . . . . 3-2
:DISPlay Commands. . . . . . . . . . . . . . . . . . . . . . . . . . . . . . . . . . . . . . . . . . . . . . . . . . . 3-3
:FETCh Commands. . . . . . . . . . . . . . . . . . . . . . . . . . . . . . . . . . . . . . . . . . . . . . . . . . . . 3-4
:MMEMory Commands . . . . . . . . . . . . . . . . . . . . . . . . . . . . . . . . . . . . . . . . . . . . . . . . 3-5
:READ Commands . . . . . . . . . . . . . . . . . . . . . . . . . . . . . . . . . . . . . . . . . . . . . . . . . . . . 3-5
:SENSe Commands. . . . . . . . . . . . . . . . . . . . . . . . . . . . . . . . . . . . . . . . . . . . . . . . . . . . 3-6
:CONFigure Commands . . . . . . . . . . . . . . . . . . . . . . . . . . . . . . . . . . . . . . . . 3-9
:DISPlay Commands . . . . . . . . . . . . . . . . . . . . . . . . . . . . . . . . . . . . . . . . . . 3-15
:FETCh Commands . . . . . . . . . . . . . . . . . . . . . . . . . . . . . . . . . . . . . . . . . . 3-53
:MMEMory Commands . . . . . . . . . . . . . . . . . . . . . . . . . . . . . . . . . . . . . . . 3-77
:READ Commands . . . . . . . . . . . . . . . . . . . . . . . . . . . . . . . . . . . . . . . . . . . 3-81
:SENSe Commands . . . . . . . . . . . . . . . . . . . . . . . . . . . . . . . . . . . . . . . . . . . 3-95
Appendices
Index
Factory Default Settings . . . . . . . . . . . . . . . . . . . . . . . . . . . . . . . . . . . . . . . . . . . . . A-1
GPIB Command Defaults . . . . . . . . . . . . . . . . . . . . . . . . . . . . . . . . . . . . . . . . . . . . . . A-1
Measurement Limit Defaults. . . . . . . . . . . . . . . . . . . . . . . . . . . . . . . . . . . . . . . . . . . . A-3
Scale Setting Range . . . . . . . . . . . . . . . . . . . . . . . . . . . . . . . . . . . . . . . . . . . . . . . . . B-1
ii
WCA230A & WCA280A Option 27 User Manual
Page 7

List of Figures
List of Figures
Figure 1-1: Measurement menus for the 3GPP-R5 analysis . . . . . . . . . . . . . . . . . 1-5
Figure 2-1: Measurement menu in the S/A mode . . . . . . . . . . . . . . . . . . . . . . . . . 2-1
Figure 2-2: Channel power measurement . . . . . . . . . . . . . . . . . . . . . . . . . . . . . . . 2-4
Figure 2-3: 3GPP-R5 ACLR measurement . . . . . . . . . . . . . . . . . . . . . . . . . . . . . . 2-6
Figure 2-4: 3GPP-R5 ACLR measurement . . . . . . . . . . . . . . . . . . . . . . . . . . . . . . 2-8
Figure 2-5: Spectrum emission mask measurement . . . . . . . . . . . . . . . . . . . . . . 2-10
Figure 2-6: OBW measurement . . . . . . . . . . . . . . . . . . . . . . . . . . . . . . . . . . . . . . . 2-11
Figure 2-7: EBW measurement . . . . . . . . . . . . . . . . . . . . . . . . . . . . . . . . . . . . . . . 2-12
Figure 2-8: Carrier frequency measurement . . . . . . . . . . . . . . . . . . . . . . . . . . . . 2-13
Figure 2-9: Measurement limits editor . . . . . . . . . . . . . . . . . . . . . . . . . . . . . . . . . 2-14
Figure 2-10: Spectrum emission mask measurement limits editor . . . . . . . . . . 2-16
Figure 2-11: Downlink analysis measurement menu in the Demod mode . . . . . 2-21
Figure 2-12: Example of the code domain power measurement . . . . . . . . . . . . 2-24
Figure 2-13: Time slot table . . . . . . . . . . . . . . . . . . . . . . . . . . . . . . . . . . . . . . . . . . 2-28
Figure 2-14: Code domain power . . . . . . . . . . . . . . . . . . . . . . . . . . . . . . . . . . . . . 2-31
Figure 2-15: Power codogram . . . . . . . . . . . . . . . . . . . . . . . . . . . . . . . . . . . . . . . . 2-33
Figure 2-16: Code domain power versus Time slot . . . . . . . . . . . . . . . . . . . . . . . 2-35
Figure 2-17: Code domain power versus Symbol . . . . . . . . . . . . . . . . . . . . . . . . 2-37
Figure 2-18: Symbol constellation . . . . . . . . . . . . . . . . . . . . . . . . . . . . . . . . . . . . . 2-39
Figure 2-19: Symbol EVM . . . . . . . . . . . . . . . . . . . . . . . . . . . . . . . . . . . . . . . . . . . 2-40
Figure 2-20: Symbol eye diagram . . . . . . . . . . . . . . . . . . . . . . . . . . . . . . . . . . . . . 2-42
Figure 2-21: Symbol table . . . . . . . . . . . . . . . . . . . . . . . . . . . . . . . . . . . . . . . . . . . 2-43
Figure 2-22: Modulation accuracy . . . . . . . . . . . . . . . . . . . . . . . . . . . . . . . . . . . . 2-44
Figure 2-23: Uplink analysis measurement menu in the Demod mode . . . . . . . 2-45
Figure 2-24: Example of the code domain power measurement . . . . . . . . . . . . 2-47
Figure 2-25: Subframe offset . . . . . . . . . . . . . . . . . . . . . . . . . . . . . . . . . . . . . . . . . 2-50
Figure 2-26: HS-DPCCH display method (Code domain power) . . . . . . . . . . . . 2-51
Figure 2-27: HS-DPCCH display method (Code power versus Symbol) . . . . . . 2-52
Figure 2-28: HS-DPCCH display method (ACK/NACK analysis) . . . . . . . . . . . 2-53
Figure 2-29: Time slot table . . . . . . . . . . . . . . . . . . . . . . . . . . . . . . . . . . . . . . . . . . 2-54
Figure 2-30: Code domain power . . . . . . . . . . . . . . . . . . . . . . . . . . . . . . . . . . . . . 2-57
Figure 2-31: Power codogram . . . . . . . . . . . . . . . . . . . . . . . . . . . . . . . . . . . . . . . . 2-59
Figure 2-32: Code domain power versus Time slot . . . . . . . . . . . . . . . . . . . . . . . 2-61
Figure 2-33: Code domain power versus Symbol . . . . . . . . . . . . . . . . . . . . . . . . 2-63
Figure 2-34: Symbol constellation . . . . . . . . . . . . . . . . . . . . . . . . . . . . . . . . . . . . . 2-65
Figure 2-35: Symbol EVM . . . . . . . . . . . . . . . . . . . . . . . . . . . . . . . . . . . . . . . . . . . 2-66
Figure 2-36: Symbol eye diagram . . . . . . . . . . . . . . . . . . . . . . . . . . . . . . . . . . . . . 2-68
Figure 2-37: Symbol table . . . . . . . . . . . . . . . . . . . . . . . . . . . . . . . . . . . . . . . . . . . 2-69
Figure 2-38: Modulation accuracy . . . . . . . . . . . . . . . . . . . . . . . . . . . . . . . . . . . . 2-70
Figure 2-39: ACK/NACK . . . . . . . . . . . . . . . . . . . . . . . . . . . . . . . . . . . . . . . . . . . . 2-71
WCA230A & WCA280A Option 27 User Manual
iii
Page 8

List of Tables
List of Tables
Table 1-1: Additional functions in Option 27 . . . . . . . . . . . . . . . . . . . . . . . . . . . . . 1-1
Table 1-2: 3GPP-R5 downlink transmission parameters . . . . . . . . . . . . . . . . . . . . 1-2
Table 1-3: 3GPP-R5 uplink transmission parameters . . . . . . . . . . . . . . . . . . . . . . 1-3
Table 2-1: Measurement limits settings . . . . . . . . . . . . . . . . . . . . . . . . . . . . . . . . . 2-15
Table 2-2: Limit settings for the spectrum emission mask measurement . . . . . . 2-17
Table 2-3: Vertical scale setting range . . . . . . . . . . . . . . . . . . . . . . . . . . . . . . . . . . 2-41
Table 2-4: Vertical scale setting range . . . . . . . . . . . . . . . . . . . . . . . . . . . . . . . . . . 2-67
Table 3-1: Measurement modes added in Option 27 . . . . . . . . . . . . . . . . . . . . . . . 3-1
Table 3-2: List of command groups . . . . . . . . . . . . . . . . . . . . . . . . . . . . . . . . . . . . . 3-2
Table 3-3: :CONFigure commands . . . . . . . . . . . . . . . . . . . . . . . . . . . . . . . . . . . . . 3-2
Table 3-4: :DISPlay commands . . . . . . . . . . . . . . . . . . . . . . . . . . . . . . . . . . . . . . . . 3-3
Table 3-5: :FETCh commands . . . . . . . . . . . . . . . . . . . . . . . . . . . . . . . . . . . . . . . . . 3-4
Table 3-6: :MMEMory commands . . . . . . . . . . . . . . . . . . . . . . . . . . . . . . . . . . . . . . 3-5
Table 3-7: :READ commands . . . . . . . . . . . . . . . . . . . . . . . . . . . . . . . . . . . . . . . . . . 3-5
Table 3-8: :SENSe commands . . . . . . . . . . . . . . . . . . . . . . . . . . . . . . . . . . . . . . . . . . 3-6
Table 3-9: :DISPlay command subgroups . . . . . . . . . . . . . . . . . . . . . . . . . . . . . . . 3-15
Table 3-10: Symbol rate settings . . . . . . . . . . . . . . . . . . . . . . . . . . . . . . . . . . . . . . . 3-21
Table 3-11: Main view display formats . . . . . . . . . . . . . . . . . . . . . . . . . . . . . . . . . 3-25
Table 3-12: Symbol rate settings . . . . . . . . . . . . . . . . . . . . . . . . . . . . . . . . . . . . . . . 3-40
Table 3-13: Main view display formats . . . . . . . . . . . . . . . . . . . . . . . . . . . . . . . . . 3-44
Table 3-14: Queried information on the 3GPP-R5 downlink analysis results . . 3-55
Table 3-15: Queried information on the 3GPP-R5 uplink analysis results . . . . 3-72
Table 3-16: :SENSe command subgroups . . . . . . . . . . . . . . . . . . . . . . . . . . . . . . . 3-95
iv
Table A-1: Factory initialization settings, :DISPlay commands . . . . . . . . . . . . . A-1
Table A-2: Factory initialization settings, :SENSe commands . . . . . . . . . . . . . . A-2
Table A-3: Common limits (Band I, II, and III) . . . . . . . . . . . . . . . . . . . . . . . . . . A-3
Table A-4: SEM limits in Band I and III . . . . . . . . . . . . . . . . . . . . . . . . . . . . . . . . A-4
Table A-5: SEM limits in Band II . . . . . . . . . . . . . . . . . . . . . . . . . . . . . . . . . . . . . . A-4
Table B-1: Display format and scale . . . . . . . . . . . . . . . . . . . . . . . . . . . . . . . . . . . B-1
WCA230A & WCA280A Option 27 User Manual
Page 9

Preface
About This Manual
Related Manuals
This manual provides operating instructions for the WCA230A and WCA280A
Portable Wireless Communication Analyzers Option 27 3GPP Release 5 Downlink
(HSDPA) analysis software.
This manual is composed of the following sections:
Getting Started describes the overview of the 3GPP Release 5 analysis.
Operating Basics explains the menu functions and measurement procedures.
Syntax and Commands describes GPIB commands for Option 27.
Appendix provides additional information including factory default settings
and scale setting range.
The following related documents are also available:
The WCA230A & WCA280A Portable Wireless Communication Analyzers
User Manual (Tektronix part number 071-1253-xx) contains a tutorial to
quickly describe how to operate the analyzer. It also includes an in-depth
discussion on how to more completely use the analyzer features.
The WCA230A & WCA280A Portable Wireless Communication Analyzer
Programmer Manual (Tektronix part number 071-1255-xx) contains an
alphabetical listing of the programming commands and other information
related to controlling the analyzer over the GPIB interface.
WCA230A & WCA280A Option 27 User Manual
v
Page 10

Preface
vi
WCA230A & WCA280A Option 27 User Manual
Page 11

Getting Started
Page 12

Page 13

Getting Started
The WCA230A and WCA280A Option 27 3GPP Release 5 Downlink (HSDPA)
analysis software enables modulation analysis of HSDPA (High Speed Downlink
Packet Access) signals defined in 3GPP (3
rd
Generation Partnership Project)
Release 5 (“3GPP-R5”). Measurements may be performed on downlink QPSK and
16QAM or uplink BPSK signals.
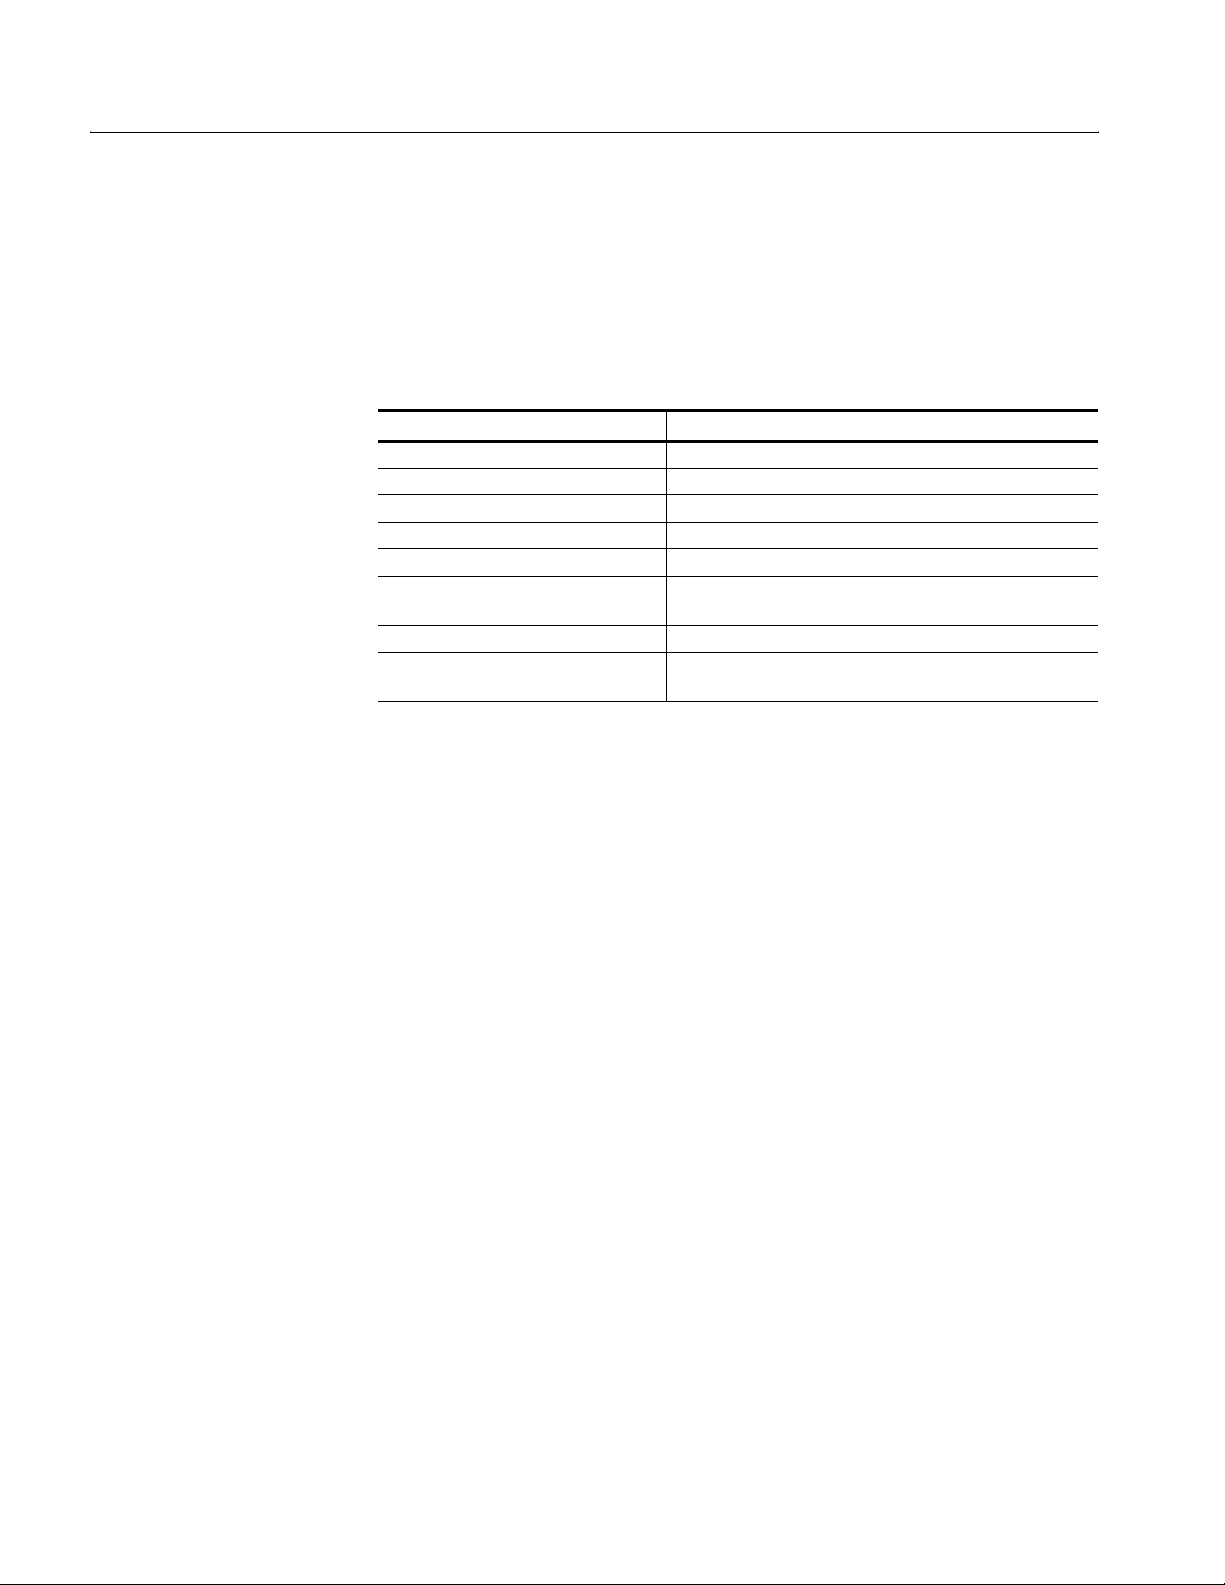
Table 1-1 summarizes the functions added in Option 27 by the measurement modes
of the analyzer.
Table 1-1: Additional functions in Option 27
Measurement mode Additional functions
S/A (spectrum analysis) 3GPP-R5 downlink/uplink analysis
Channel power
ACLR (Adjacent Channel Leakage Power Ratio)
MC-ACLR (Multi-Carrier ACLR, downlink analysis only)
Spectrum emission Mask
OBW (Occupied Bandwidth)
EBW (Emission Bandwidth)
Carrier frequency
Demod (modulation analysis) 3GPP-R5 downlink/uplink analysis
Code domain power
Power codogram
Code power versus Time slot
Code power versus Symbol
Symbol constellation
Symbol EVM (Error Vector Magnitude)
Symbol eye diagram
Symbol table
Modulation accuracy
ACK/NACK analysis (uplink analysis only)
Time (time analysis) None
NOTE.
The ACK/NACK analysis requires Option 23 W-CDMA Uplink Analysis
Software.
WCA230A & WCA280A Option 27 User Manual
1-1
Page 14
Getting Started
Analysis Definition
The analyzer performs measurements according to 3GPP-R5 specifications.
Downlink Analysis
Table 1-2 shows the 3GPP-R5 downlink transmission parameters for the analyzer.
Table 1-2: 3GPP-R5 downlink transmission parameters
Item Description
Chip rate 3.84 Mcps
Symbol rate 7.5, 15, 30, 60, 120, 240, 480, and 960 ksps
Maximum number of channels 512
Frame structure Time slot: 666.7
Scrambling code Gold code using M series by generator polynomial 18 bits
Channelization code Hierarchical orthogonal code series based on the
combination of chip rate and symbol rate
Modulation method for each channel QPSK or 16QAM
Baseband filter Root-cosine with
Can be set in the range of 0.0001
Measurement Functions.
Code domain power: Measures the power relative to the total power for each
The analyzer has the following measurement functions:
µ
s
α
= 0.22 (default)
≤α ≤
1
channel. Multi-rate is supported and up to 512 channels can be measured.
Code domain power versus Time: Measures the relative power at symbol points
for each channel in time series.
1-2
Power codogram: Measures the code domain power continuously for up to
150 slots (0.1 sec) and displays a spectrogram for each slot.
Vector/Constellation: Measures the vector loci and chip points for all signals
as well as constellation at symbol points for each channel.
Modulation accuracy: Measures EVM (Error Vector Magnitude), amplitude
and phase errors, waveform quality, and origin offset for each channel.
Measures PCDE (Peak Code Domain Error), amplitude, frequency, and phase
errors; waveform quality; and origin offset for each time slot.
WCA230A & WCA280A Option 27 User Manual
Page 15
Getting Started
Uplink Analysis
Measurement Process.
The following steps show the internal process for the
3GPP-R5 downlink analysis:
1. Perform flatness correction and filtering.
2. Establish the synchronization with P-SCH.
3. Determine the range of scrambling code numbers with S-SCH.
4. Fix the scrambling code number and the phase.
5. Correct the frequency and the phase.
6. Perform high-speed Hadamard transformation.
7. Calculate the power for each symbol on all channels.
The analyzer supports the following types of 3GPP-R5 uplink signals:
DPDCH (Dedicated Physical Data Channel)
DPCCH (Dedicated Physical Control Channel)
HS-DPCCH (Dedicated Physical Control Channel for High-Speed
Downlink Shared Channel (HS-DSCH))
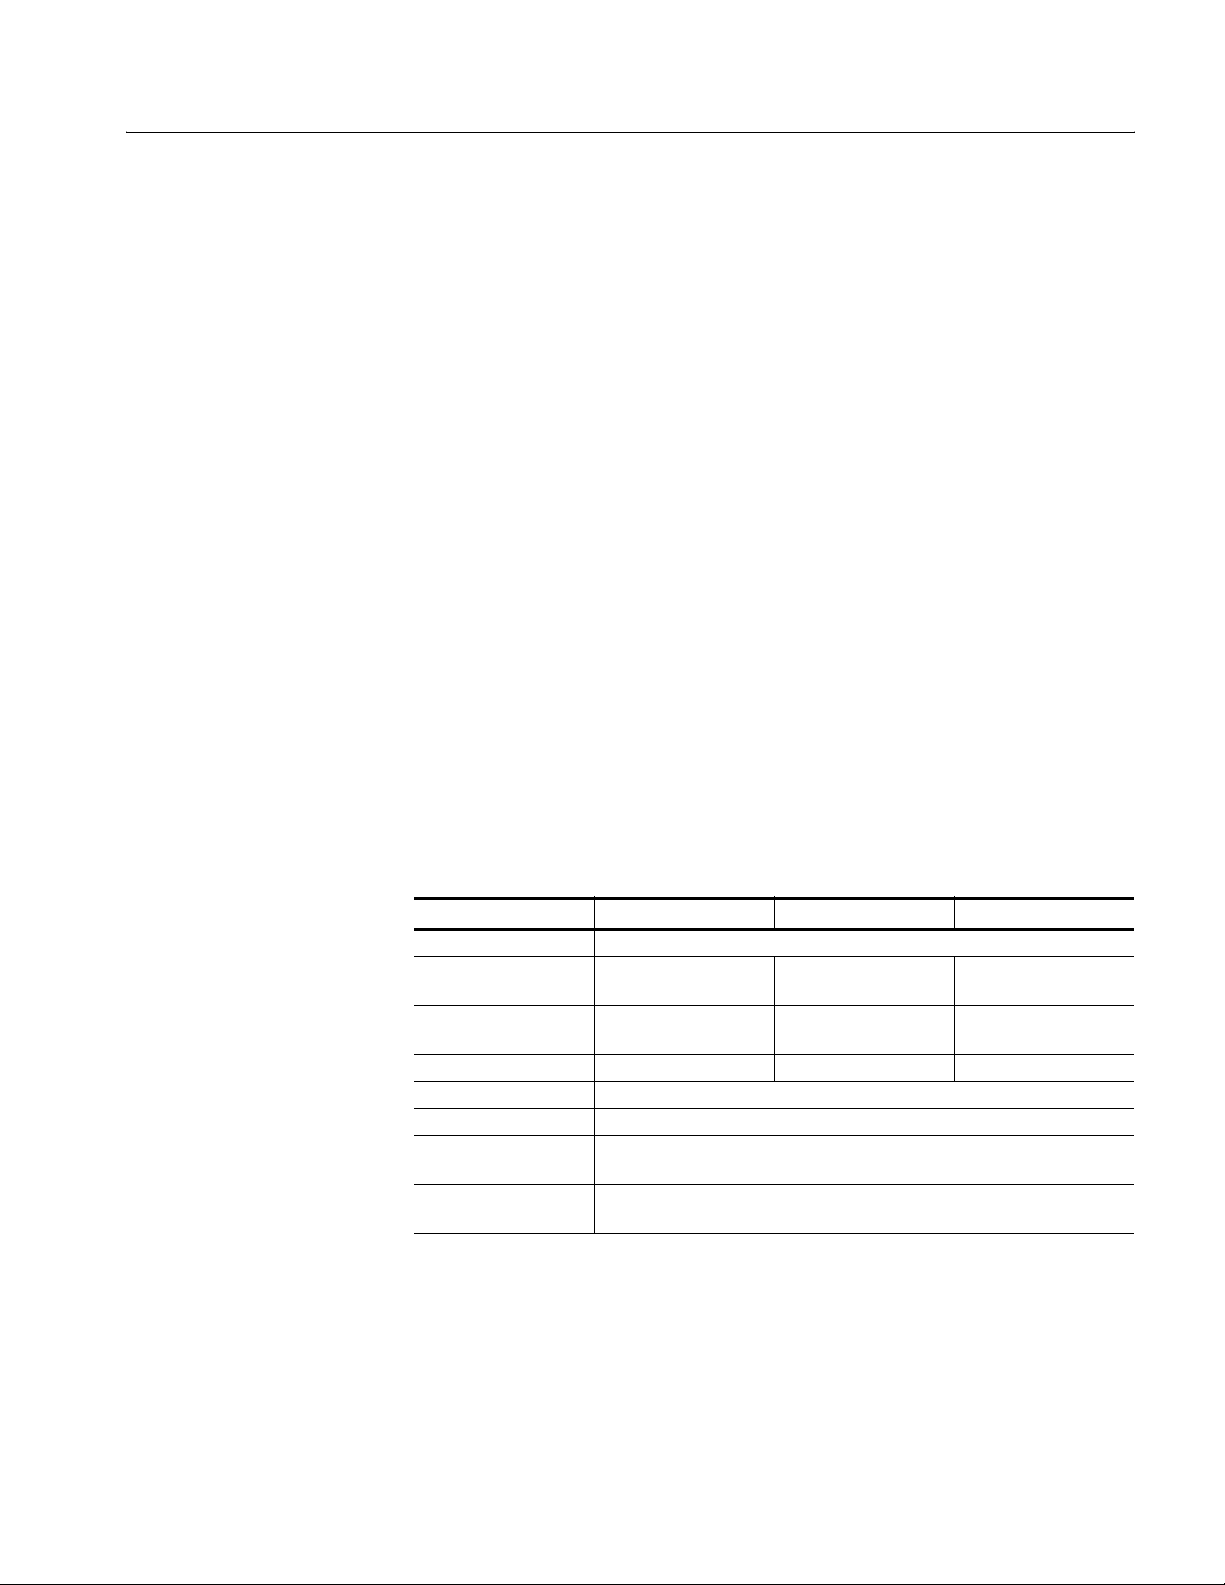
The analyzer covers the 3GPP-R5 uplink transmission parameters listed in
Tab le 1-3 .
Table 1-3: 3GPP-R5 uplink transmission parameters
Item DPDCH DPCCH HS-DPCCH
Chip rate 3.84 Mcps
Symbol rate 15, 30, 60, 120, 240,
480, and 960 ksps
Maximum number of
channels
Frame structure 15 time-slots, 10 ms 15 time-slots, 10 ms 5 sub-frames, 10 ms
Time slot 2560 chips, 667
Scrambling code Long or short. Number: 0 to 16,777,215
Modulation method for
each channel
Baseband filter Root-cosine with
611
Can be set in the range of 0.0001
15 ksps 15 ksps
µ
s
BPSK
α
= 0.22 (default).
≤α ≤
1
WCA230A & WCA280A Option 27 User Manual
1-3
Page 16

Getting Started
Measurement Functions.
ACK/NACK analysis: Measures the HS-DPCCH to detect and display the
The analyzer has the following measurement functions:
ACK/NACK indicator, DTX (Discontinuous Transmission), and CQI (Channel
Quality Indicator).
Code domain power: Measures the power relative to the total power for each
channel. Multi-rate is supported and up to 512 channels can be measured.
Power codogram: Measures the code domain power continuously for up to
150 slots (0.1 sec) and displays spectrogram for each slot.
NOTE.
The code domain power and the power codogram can be displayed in the
subview only.
Measurement Process.
The following steps show the internal process for the
3GPP-R5 uplink analysis:
1. Perform flatness correction and filtering.
2. Search for a synchronous point by de-spreading DPCCH.
3. Correct the frequency and phase.
4. Obtain symbols for each channel of DPDCH and DPCCH, and calculate power
for each symbol.
NOTE.
using the frequency and phase to establish synchronization. If the level of DPCCH
or the control part is much lower than (about 1/10
The analyzer de-spreads DPCCH and the control part of an input signal,
th
) the level of the other channels
(DPDCH or the data part), the analysis may not be performed accurately.
1-4
WCA230A & WCA280A Option 27 User Manual
Page 17
Measurement Menu
Getting Started
Figure 1-1 shows the measurement menus related to the 3GPP-R5 analysis.
MODE
S/A
DEMOD
TIME
Measure menu items
Standard... 3GPP-R5-DL * Channel Power
3GPP-R5-UL *
Standard... 3GPP-R5-DL * Code Domain Power
3GPP-R5-UL * Code Domain Power
ACLR
Spectrum Emission Mask
OBW
EBW
Carrier Frequency
MC-ACLR
Channel Power
ACLR
Spectrum Emission Mask
OBW
EBW
Carrier Frequency
Power Codogram
Code Power versus Time Slot
Code Power versus Symbol
Symbol Constellation
Symbol EVM
Symbol Eye Diagram
Symbol Table
Modulation Accuracy
Power Codogram
Code Power versus Time Slot
Code Power versus Symbol
Symbol Constellation
Symbol EVM
Symbol Eye Diagram
Symbol Table
Modulation Accuracy
ACK/NACK Analysis
Figure 1-1: Measurement menus for the 3GPP-R5 analysis
For the CCDF (Complementary Cumulative Distribution Function) analysis in
Time mode, refer to the WCA230A and WCA280A User Manual (Tektronix part
number 071-1253-XX).
NOTE.
If you are not familiar with the operation of the analyzer, refer to the
WCA230A and WCA280A User Manual (Tektronix part number 071-1253-XX).
WCA230A & WCA280A Option 27 User Manual
CCDF
(Standard)
* DL and UL represent downlink and uplink, respectively.
1-5
Page 18

Getting Started
1-6
WCA230A & WCA280A Option 27 User Manual
Page 19

Operating Basics
Page 20

Page 21

Uplink/Downlink Analysis in the S/A Mode
This section describes the basic operation of 3GPP-R5 uplink/downlink analysis in
the S/A (Spectrum Analysis) mode. You can access the measurement items by
pressing S/A →Standard... →3GPP-R5-DL (downlink) or 3GPP-R5-UL
(uplink) as shown in Figure 2-1.
MODE
S/A
DEMOD
TIME
Standard... 3GPP-R5-DL * Channel Power
3GPP-R5-UL *
* DL and UL represent downlink and uplink, respectively.
Measure menu items
ACLR
Spectrum Emission Mask
OBW
EBW
Carrier Frequency
MC-ACLR
Channel Power
ACLR
Spectrum Emission Mask
OBW
EBW
Carrier Frequency
Figure 2-1: Measurement menu in the S/A mode
WCA230A & WCA280A Option 27 User Manual
2-1
Page 22

Uplink/Downlink Analysis in the S/A Mode
Measurement Procedure
Use the following procedure to take a spectrum measurement in S/A mode.
NOTE.
For details on setting frequency, span, and amplitude, refer to the
WCA230A and WCA280A User Manual (Tektronix part number 071-1253-XX).
1. Press the S/A key on the front panel.
2. Press the side key: Standard... →3GPP-R5-DL (for downlink) or
3GPP-R5-UL (for uplink).
3. Press the FREQUENCY/CHANNEL key on the front panel to set frequency.
If you use the channel table, do these steps:
Press the Channel Table... side key and select W-CDMA-DL (for
downlink) or W-CDMA-UL (for uplink).
Press the Channel side key and select a channel by turning the general
purpose knob.
The center frequency is set to the value corresponding to the channel.
4. Press the SPAN key on the front panel and set span.
5. Press the AMPLITUDE key on the front panel and set amplitude
appropriately.
NOTE.
If the input level is too high, A/D OVERFLOW displays in the red box at the
center top of the screen. If this occurs, raise the reference level.
2-2
6. Press the MEASURE key on the front panel and select a measurement item:
Channel Power
ACLR (Adjacent Channel Leakage Power Ratio)
Spectrum Emission Mask
OBW (Occupied Bandwidth)
EBW (Emission Bandwidth)
Carrier Frequency
MC-ACLR (Multi-Carrier ACLR, downlink analysis only)
NOTE.
Refer to the WCA230A and WCA280A User Manual for information on
scaling the views.
The following sections explain each measurement.
WCA230A & WCA280A Option 27 User Manual
Page 23

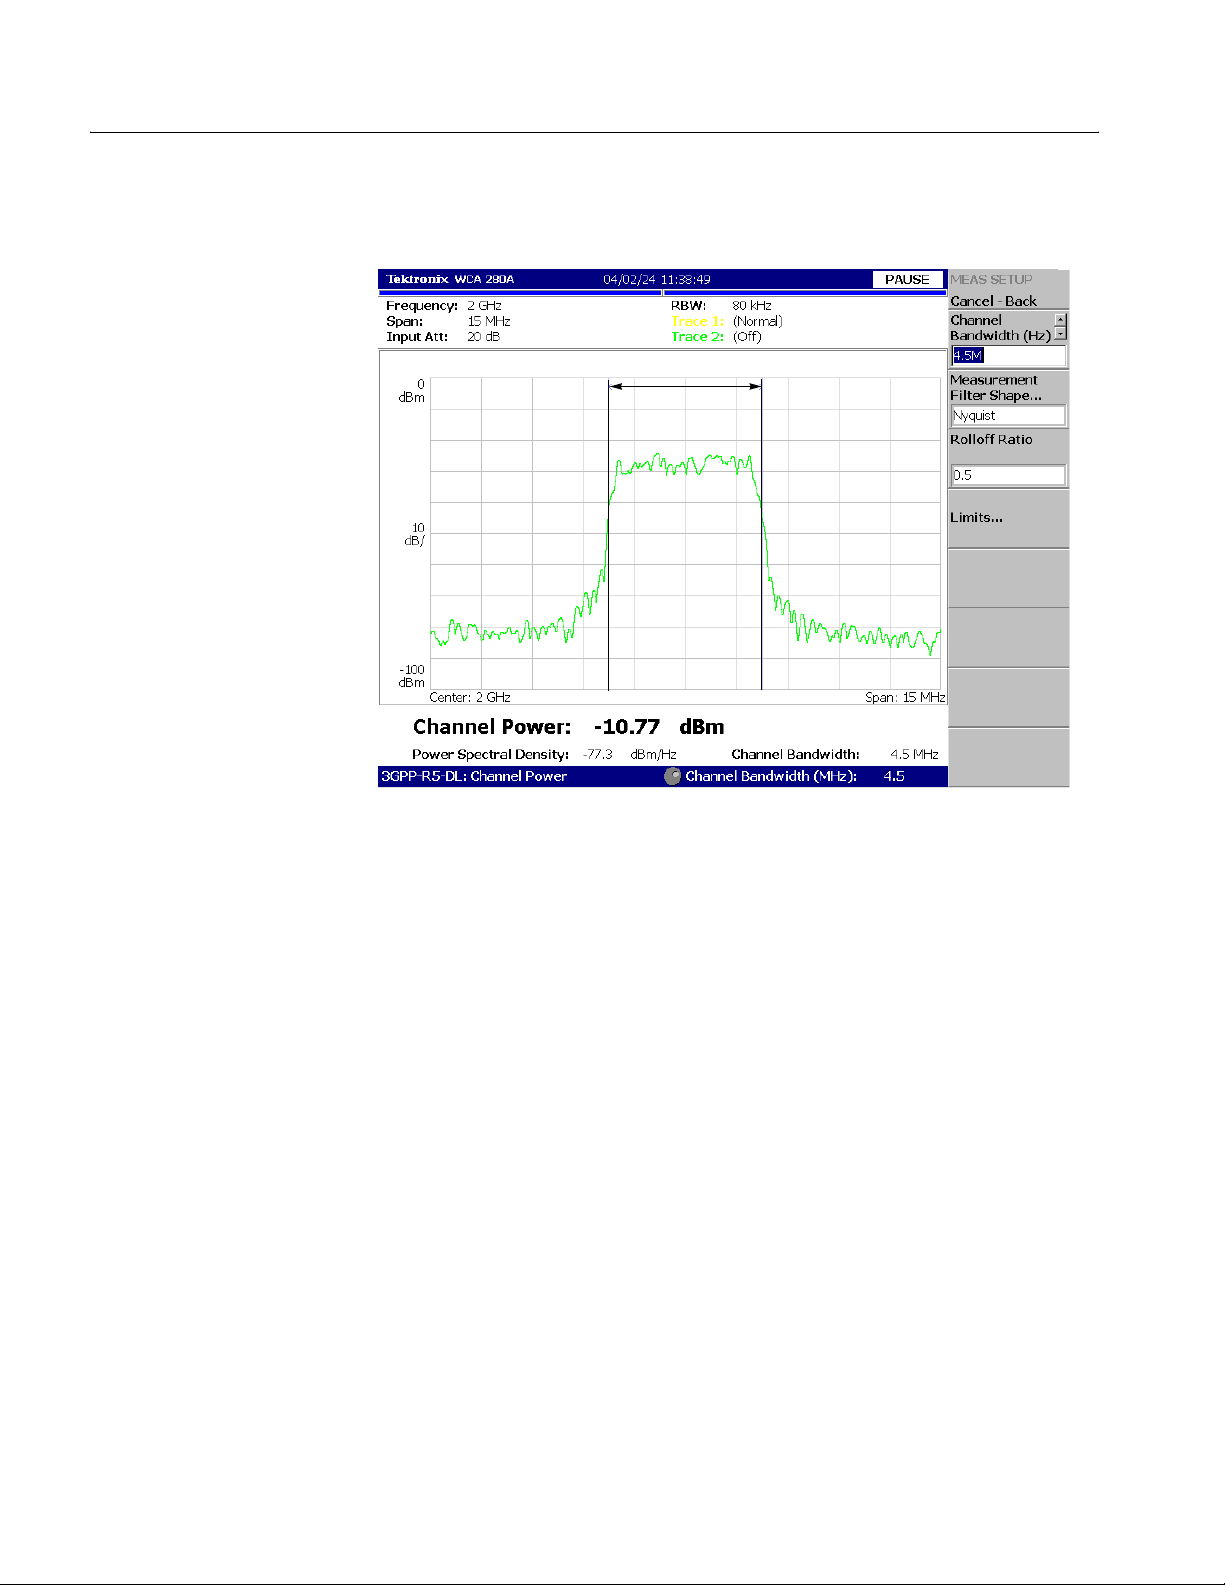
Channel Power Measurement
The channel power measurement measures the channel power within a specified
bandwidth and the power spectral density in dBm/Hz.
After selecting Channel Power in the procedure described on page 2-2, set the
parameters in the Meas Setup menu as follows.
Uplink/Downlink Analysis in the S/A Mode
Measurement Setup Menu
The Meas Setup menu for the channel power measurement contains the following
controls:
Channel Bandwidth.
Sets the frequency range for the measurement using the band
power marker (see Figure 2-2). Range: 50 kHz to 20 MHz (default: 3.84 MHz).
Measurement Filter Shape...
Rect (Rectangular, default)
Gaussian
Nyquist
Root Nyquist
Rolloff Ratio.
Sets the roll-off ratio when the Measurement Filter Shape is
Selects the filter to be used for the measurement:
Nyquist or Root Nyquist. Range: 0.0001 to 1 (default: 0.5).
Limits...
Sets the pass/fail limit for the channel power measurement.
When pressing this side key, the measurement limits editor appears. Refer to
Editing the Measurement Limits on page 2-14 for more information.
WCA230A & WCA280A Option 27 User Manual
2-3
Page 24
Uplink/Downlink Analysis in the S/A Mode
Figure 2-2 shows an example of the channel power measurement.
Channel Bandwidth
Figure 2-2: Channel power measurement
2-4
WCA230A & WCA280A Option 27 User Manual
Page 25

ACLR Measurement
Uplink/Downlink Analysis in the S/A Mode
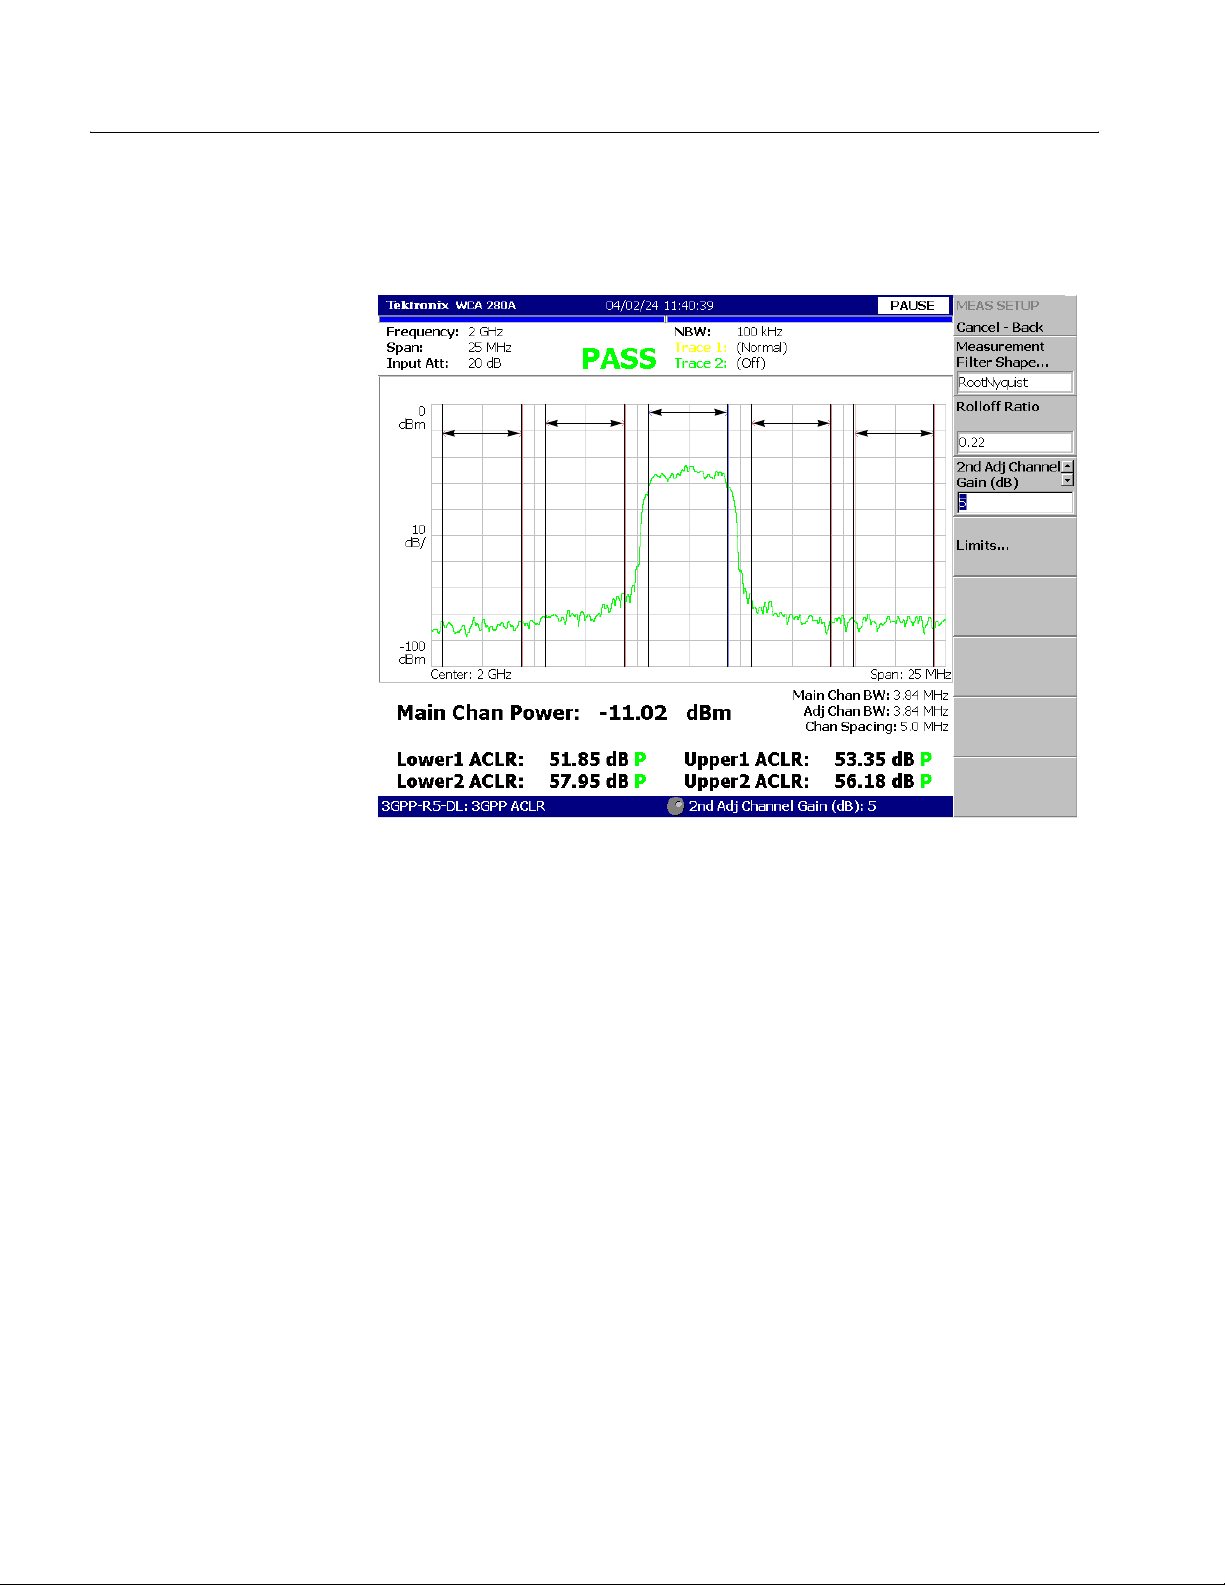
The ACLR (Adjacent Channel Leakage Power Ratio) measurement according to
the 3GPP-R5 standard is based on the ACPR measurement function in the normal
spectrum analysis. For the basics, refer to ACPR Measurement in the WCA230A
and WCA280A User Manual.
The following settings are fixed according to the 3GPP-R5 standard:
Span: 25 MHz
Main channel measurement bandwidth (Main Chan BW): 3.84 MHz
Adjacent channel measurement bandwidth (Adj Chan BW): 3.84 MHz
Channel spacing (Chan Spacing): 5 MHz
After selecting ACLR in the procedure described on page 2-2, set the parameters
in the Meas Setup menu as follows.
Measurement Setup Menu
The Meas Setup menu for the ACLR measurement contains the following controls:
Measurement Filter Shape...
Rect (rectangle)
RootNyquist (Root Nyquist, default)
Rolloff Ratio.
Range: 0.0001 to 1 (default: 0.22)
2nd Adj Channel Gain.
normally much smaller than the main channel, measurement with the same gain
causes a larger error. To enhance accuracy, raise the gain of the second adjacent
channel inside the analyzer. Set the gain value here.
Range: 3 to 15 dB (default: 5 dB)
NOTE.
amplitude settings and/or calibration results. This gain setting does not affect the
waveform display.
Limits...
side key, the measurement limits editor appears. Refer to Editing the Measurement
Limits on page 2-14 for more information.
Sets the roll-off value when the filter is Root Nyquist.
The upper limit of the range may be smaller than 15 dB, depending on
Sets the pass/fail limit for the ACLR measurement. When you press this
Selects a filter shape:
Because the power of the second adjacent channel is
NOTE.
same limits setting.
WCA230A & WCA280A Option 27 User Manual
The ACLR measurement and the multi-carrier ACLR measurement use the
2-5
Page 26
Uplink/Downlink Analysis in the S/A Mode
Figure 2-3 shows an example of the ACLR measurement. Measured values are
displayed in the lower part of the screen.
Main Upper1 Upper2Lower1Lower2
Figure 2-3: 3GPP-R5 ACLR measurement
2-6
WCA230A & WCA280A Option 27 User Manual
Page 27

Multi-Carrier ACLR Measurement
Downlink Analysis Only
The multi-carrier ACLR (Adjacent Channel Leakage Power Ratio) measurement is
performed according to the 3GPP-R5 standard. You can measure the power levels
of up to four carriers and the ratio of each adjacent channel (a total of four channels)
to the power of the main channel. The measurement is based on the ACPR
measurement function in the normal spectrum analysis. For the basics, refer to
ACPR Measurement in the WCA230A and WCA280A User Manual.
The following settings are fixed according to the 3GPP-R5 standard:
Span: 55 MHz
Main channel measurement bandwidth (Main Chan BW): 3.84 MHz
Adjacent channel measurement bandwidth (Adj Chan BW): 3.84 MHz
Channel spacing (Chan Spacing): 5 MHz
After selecting MC-ACLR in the procedure described on page 2-2, set the
parameters in the Meas Setup menu as follows.
Uplink/Downlink Analysis in the S/A Mode
Measurement Setup Menu
The Meas Setup menu for the multi-carrier ACLR measurement contains the
following controls:
Carrier Threshold.
is indicated by a horizontal line in blue as shown in Figure 2-4.
Range: −30 to −1 dBc relative to the power of the main channel (default: −10 dBc).
Measurement Filter Shape...
Rect (Rectangular)
Root Nyquist (default)
Rolloff Ratio.
Range: 0.0001 to 1 (default: 0.22)
Limits...
When you press this side key, the measurement limits editor appears. Refer to
Editing the Measurement Limits on page 2-14 for more information.
NOTE.
same limits setting.
Sets the pass/fail limit for the multi-carrier ACLR measurement.
The ACLR measurement and the multi-carrier ACLR measurement use the
Sets the threshold level to detect the carrier. The threshold level
Selects a filter shape.
Sets the roll-off value when the filter is Root Nyquist.
WCA230A & WCA280A Option 27 User Manual
2-7
Page 28

Uplink/Downlink Analysis in the S/A Mode
Figure 2-4 shows an example of the multi-carrier ACLR measurement. There are
four carriers. On the bottom of the screen, the measurement results of the channel
power and ACLR are displayed. The channel at the center frequency (Ch 2 in this
case) is the main channel, which is indicated as “Main” in green in the
measurement results. The all channels are located at 5 MHz intervals according to
the standard.
Ch1 Ch2 Ch3 Ch4
Carrier Threshold
Measurement results
adjacent
channels
P (Pass) / F (Fail)
CarriersLower
Figure 2-4: 3GPP-R5 ACLR measurement
NOTE.
If there is no carrier in the main channel, the error message “No carrier”
will appear.
Upper
adjacent
channels
Main channel
2-8
If there are more than four carriers in the span, the error message “Too many
carriers” will appear.
WCA230A & WCA280A Option 27 User Manual
Page 29

Spectrum Emission Mask Measurement
The spectrum emission mask measurement verifies that the base station is not
transmitting excessive power outside of its designated channel.
Uplink/Downlink Analysis in the S/A Mode
Measurement Setup Menu
NOTE.
When performing this measurement, be sure to apply a continuous active
slot signal or a continuous idle slot signal.
After selecting Spectrum Emission Mask in the procedure described on page 2-2,
set the parameters in the Meas Setup menu as follows.
The Meas Setup menu for the spectrum emission mask measurement contains the
following controls:
Ref. Channel Select.
Auto. The level is determined automatically by evaluating the spectrum trace.
Man. The level is set by the Ref. Channel Level just below.
Ref. Channel Level.
Selects how to determine the reference channel level.
Sets the reference channel level to be used by the measurement
when Ref. Channel Select is set to Man. Range: −150 to 30 dBm (default: 0 dBm).
Channel Bandwidth.
Defines the frequency window occupied by the
reference channel. Range: 1 to 10 MHz (default: 3.84 MHz).
Measurement Filter Shape...
Selects the filter shape to be used when measuring the
reference channel when Ref. Channel Select is set to Auto.
Rect (Rectangular, default)
Gaussian
Nyquist
Root Nyquist
Rolloff Ratio.
Sets the rolloff ratio when Measurement Filter Shape is set to
Nyquist or Root Nyquist. Range: 0.0001 to 1 (default: 0.5).
Limits...
Sets the pass/fail limit for the spectrum emission mask measurement.
When pressing this side key, the measurement limits editor appears. Refer to
Editing the Measurement Limits on page 2-14 for more information.
Scroll Table.
Step Size.
Scrolls the results table on screen using the general purpose knob.
Sets the step size for the Channel Bandwidth setting.
WCA230A & WCA280A Option 27 User Manual
2-9
Page 30
Uplink/Downlink Analysis in the S/A Mode
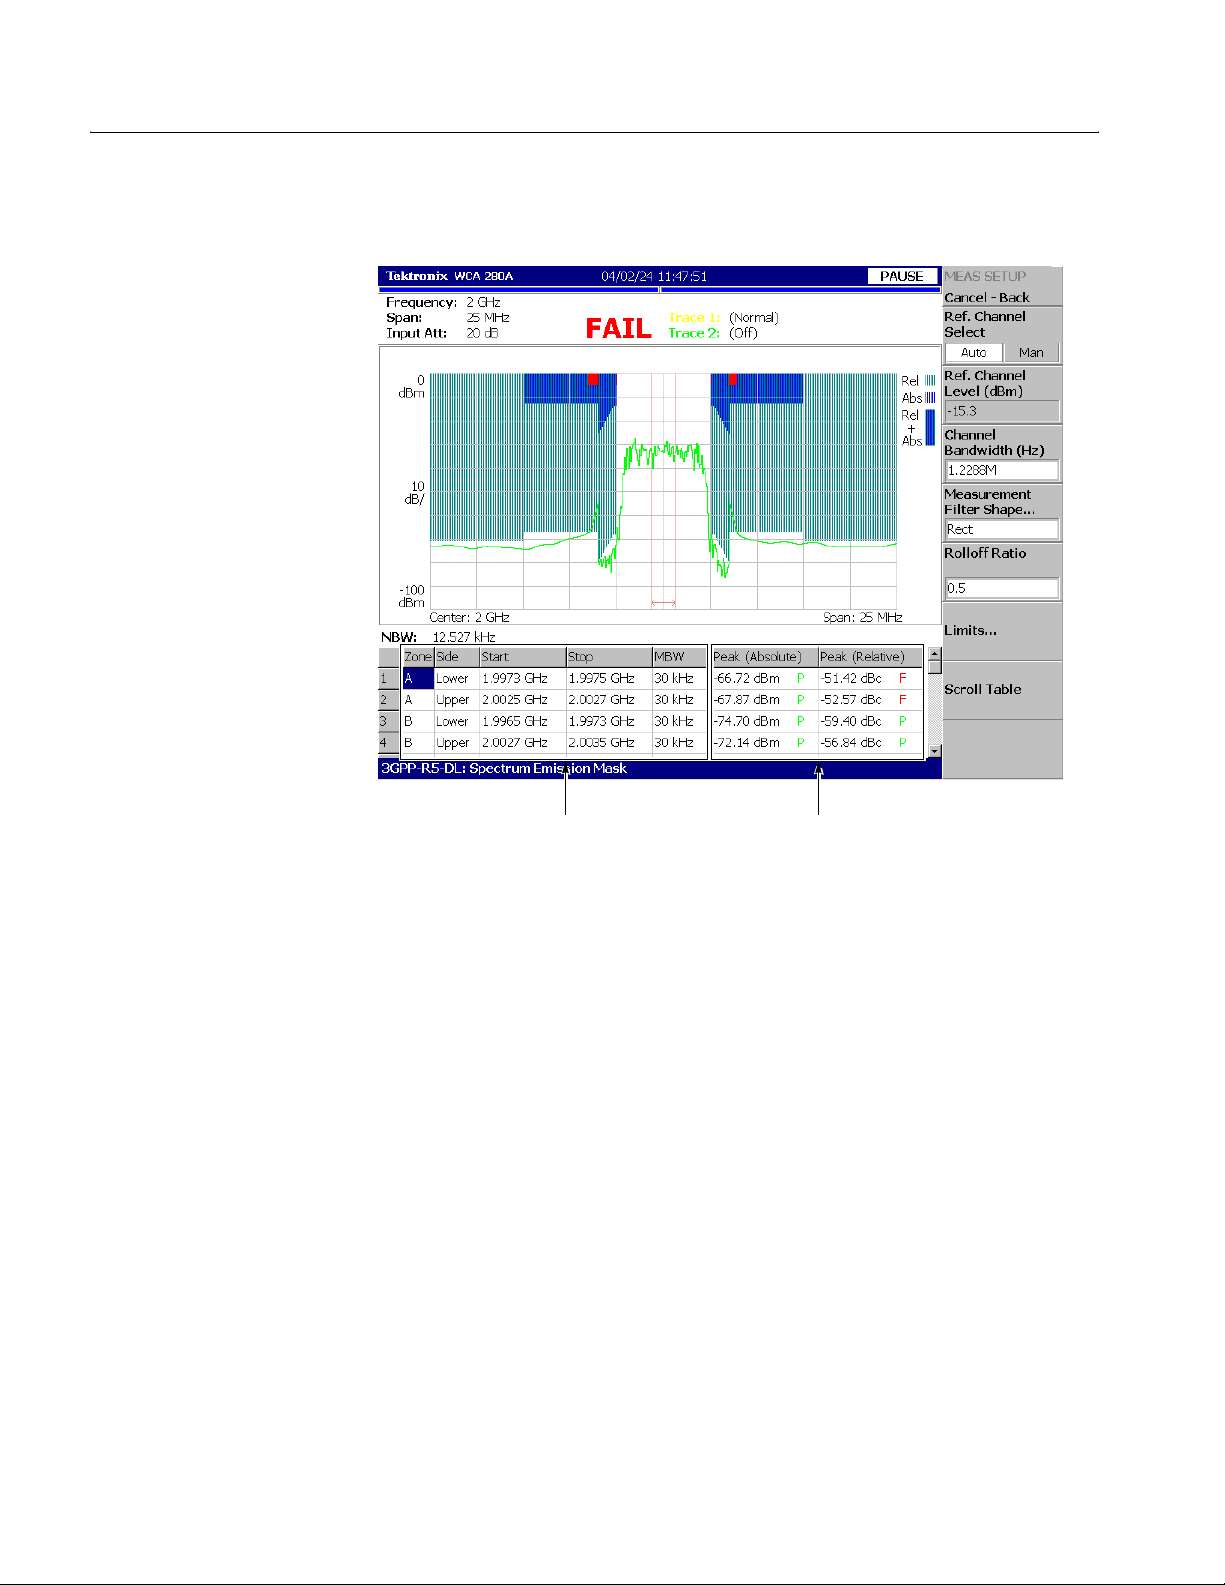
Figure 2-5 shows an example of the spectrum emission mask measurement.
Defined by the measurement limits editor
(from the left)
■
Zone (A to E)
■
Side (upper or lower)
■
Start frequency of the zone
■
Stop frequency of the zone
■
MBW (Measurement Bandwidth (RBW))
Measurement results (P: Pass; F: Fail)
(from the left)
■
Absolute peak value and Pass/Fail
■
Relative peak value and Pass/Fail
Figure 2-5: Spectrum emission mask measurement
2-10
WCA230A & WCA280A Option 27 User Manual
Page 31

OBW Measurement
Uplink/Downlink Analysis in the S/A Mode
The OBW (Occupied Bandwidth) measurement measures the frequency bandwidth
using the ratio you specify for carrier signal power over power within the set span.
After selecting OBW in the procedure described on page 2-2, set the parameters in
the Meas Setup menu as follows.
Measurement Setup Menu
The Meas Setup menu for the OBW measurement contains the following controls:
Power Ratio.
calculating OBW. Range: 80 to 99.99% (default: 99%).
Limits...
When pressing this side key, the measurement limits editor appears. Refer to
Editing the Measurement Limits on page 2-14 for more information.
Figure 2-6 shows an example of the OBW measurement.
Specifies the power ratio of the carrier and span regions for
Sets the pass/fail limits for the OBW measurement.
Occupied Bandwidth
Figure 2-6: OBW measurement
WCA230A & WCA280A Option 27 User Manual
2-11
Page 32

Uplink/Downlink Analysis in the S/A Mode
EBW Measurement
The frequency bandwidth between the maximum peak of spectrum and the
specified dB value is measured in EBW (Emission Bandwidth).
After selecting EBW in the procedure described on page 2-2, set the parameters in
the Meas Setup menu as follows.
Measurement Setup Menu
The Meas Setup menu for the EBW measurement contains the following controls:
Measurement Level.
measured (see Figure 2-7). Range: −100 to −1 dB (default: −30 dB).
Figure 2-7 shows an example of the EBW measurement.
Specifies how far down from the peak level the bandwidth is
Emission Bandwidth
Measurement Level
2-12
Figure 2-7: EBW measurement
WCA230A & WCA280A Option 27 User Manual
Page 33

Carrier Frequency Measurement
Carrier frequency is accurately measured using the counter function.
Uplink/Downlink Analysis in the S/A Mode
Measurement Setup Menu
NOTE.
roughly the frequency of a 3GPP signal. Use the modulation analysis function
(Demod mode) to measure accurately the 3GPP signal.
After selecting Carrier Frequency in the procedure described on page 2-2, set the
parameters in the Meas Setup menu as follows.
The Meas Setup menu for the carrier frequency measurement contains the
following controls:
Counter Resolution.
displayed on the bottom of the view with this resolution.
Range: 1 mHz to 1 MHz in a tenfold sequence (default: 1 Hz).
Figure 2-8 shows an example of the carrier frequency measurement.
The carrier frequency measurement function should be used to estimate
Sets the counter resolution. The measurement result is
Figure 2-8: Carrier frequency measurement
WCA230A & WCA280A Option 27 User Manual
2-13
Page 34

Uplink/Downlink Analysis in the S/A Mode
Editing the Measurement Limits
This section describes how to set measurement limits that can be used to perform
pass/fail testing for the following measurements in the S/A mode:
Channel power
ACLR
Spectrum emission mask
OBW
Refer to Appendix A: Measurement Limit Defaults for information about the
default settings of each measurement limit.
Using the Measurement
Limits Editor
All of the measurement limits are set in the measurement limits editor. You can
access it from the Limits... side key on the Meas Setup menu. Figure 2-9 shows the
measurement limits editor for the 3GPP-R5 downlink analysis in the S/A mode.
2-14
Figure 2-9: Measurement limits editor
WCA230A & WCA280A Option 27 User Manual
Page 35

Uplink/Downlink Analysis in the S/A Mode
Table 2-1 describes all of the measurement limit items available in the
measurement limits editor.
Table 2-1: Measurement limits settings
Limit item Description Lower limit range Upper limit range
Channel Power Sets the lower and upper limits for the Channel Power
measurement.
SEM Offset From Channel Select this item to access another measurement limits
editor to edit SEM offset from channel limits.
OBW Sets the upper and lower limits for the OBW
measurement.
ACLR 1st Lower Channel Sets the upper limit for the first lower channel in the
ACLR measurement.
ACLR 1st Upper Channel Sets the upper limit for the first upper channel in the
ACLR measurement.
ACLR 2nd Lower Channel Sets the upper limit for the second lower channel in the
ACLR measurement.
ACLR 2nd Upper Channel Sets the upper limit for the second upper channel in
the ACLR measurement.
−
200 to +200 dBm
Refer to page 2-16 for the details.
0 to 30 MHz 0 to 30 MHz
- 0 to 70 dB
- 0 to 70 dB
- 0 to 70 dB
- 0 to 70 dB
−
200 to +200 dBm
Setting Measurement
Limits
Perform the following procedure to set measurement limits:
1. Press the MEAS SETUP menu key to open the Meas Setup menu.
2. Press the Limits... side key to open the measurement limits editor with the
LIMITS menu.
3. Press the Select row to edit side key.
4. Turn the general purpose knob (or press the arrow keys just above the knob) to
select the row that you want to edit.
5. Press the Enable Limit side key to enable or disable the Pass/Fail testing for
the specified limit(s).
6. Press the Lower Limit side key and set the lower limit for the selected
measurement item, if applicable.
7. Press the Upper Limit side key and set the upper limit for the selected
measurement item.
8. If you want to use a given measurement limit set for the frequency band of
Band I, II, or III defined in 3GPP-R5, press the Default all limits to... side key
and then select the band. Refer to Appendix A: Measurement Limit Defaults for
information about the default settings of each measurement limit.
WCA230A & WCA280A Option 27 User Manual
2-15
Page 36

Uplink/Downlink Analysis in the S/A Mode
When you set limits for the spectrum emission mask measurement, perform the
following steps to open another limits editor:
1. Press the Select row to edit side key.
2. Turn the general purpose knob (or press the arrow keys just above the knob) to
select the SEM Offset From Channel row in the table.
3. Press the Edit SEM Offset Limits... side key.
This opens the measurement limits editor to specify the detail of the limits for the
spectrum emission mask measurement. For more information, refer to the
following section, Setting the Spectrum Emission Mask Limits.
Setting the Spectrum
Emission Mask Limits
When you select the SEM Offset From Channel row in the measurement limits
editor and then press the Edit SEM Offset Limits... side key, another limits editor
for the spectrum emission mask measurement is displayed as shown in Figure 2-10.
Zone A
BC
Zone A
BC
2-16
Figure 2-10: Spectrum emission mask measurement limits editor
WCA230A & WCA280A Option 27 User Manual
Page 37

Uplink/Downlink Analysis in the S/A Mode
Table 2-2 lists the measurement limit items that can be set in the measurement
limits editor.
Table 2-2: Limit settings for the spectrum emission mask measurement
Item Description Limit ranges
Enable Enables or disables use of the mask in the specified zone (A, B, C, D, or E). Beginning Frequency Sets the beginning frequency relative to the center frequency for the zone.
Ending Frequency Sets the ending frequency relative to the center frequency for the zone.
Measurement Bandwidth Sets the measurement RBW (Resolution Bandwidth) for the zone.
Offset from Carrier Specifies which offset side is to be measured.
You can select Upper (positive), Lower (negative), or Both.
Fail if signal exceeds Selects the fail mode to detect failure conditions between the measurement
results and the test limits. The choices are:
■
Absolute:
Failure is detected when one of the absolute measurement results is larger
than the Beginning Absolute Limit and/or Ending Absolute Limit.
■
Relative:
Failure is detected when one of the relative measurement results is larger
than the Beginning Relative Limit and/or Ending Relative Limit.
−
8 to 8 GHz
−
8 to 8 GHz
−
8 to 8 GHz
-
-
■
Rel OR Abs:
Failure is detected when one of the absolute measurement results is larger
than the Beginning Absolute Limit and Ending Absolute Limit
OR one of the relative measurement results is larger than the Beginning
Relative Limit and Ending Relative Limit.
■
Rel AND Abs:
Failure is detected when one of the absolute measurement results is larger
than the Beginning Absolute Limit and Ending Absolute Limit
AND one of the relative measurement results is larger than the Beginning
Relative Limit and Ending Relative Limit.
Beginning Absolute Limit Sets an absolute level limit at Beginning Frequency.
Ending Absolute Limit Sets an absolute level limit at Ending Frequency.
Beginning Relative Limit Sets a relative level limit at Beginning Frequency.
Ending Relative Limit Sets a relative level limit at Ending Frequency.
−
200 to 200 dBm
−
200 to 200 dBm
−
200 to 200 dBc
−
200 to 200 dBc
WCA230A & WCA280A Option 27 User Manual
2-17
Page 38

Uplink/Downlink Analysis in the S/A Mode
Perform the following steps to set measurement limits in the limits editor:
1. Press the Select column to edit side key.
2. Turn the general purpose knob (or press the arrow keys just above the knob) to
select the column that you want to edit.
3. Press the Enable side key to enable or disable use of the limits for the zone.
4. Press the side key corresponding to the limit item, and then use the general
purpose knob or the arrow keys to set the value.
5. If you want to use a given measurement limit set for the frequency band of
Band I, II, or III defined in 3GPP-R5, press the Default limits to... side key and
then select the band. Refer to Appendix A: Measurement Limit Defaults for
information about the default settings of each measurement limit.
6. When you press the Rescale Graph side key, the graph is rescaled to match the
set limits.
2-18
WCA230A & WCA280A Option 27 User Manual
Page 39

Uplink/Downlink Analysis in the S/A Mode
Saving and Loading
Measurement Limits
Measurement limits that set in the limits editor can be saved to a file and loaded
from a file. This section describes how to save and load measurement limits.
Refer to the WCA230A and WCA280A User Manual for further information about
file operation including how to enter a file name and how to delete a file.
Saving the Limits.
1. When you open the spectrum emission mask measurement limits editor, press
the Cancel-Back (MENU) side key to return the measurement limit editor (see
Figure 2-9 on page 2-14).
2. Press the Save Limits side key to open the Save to File menu.
You can save the limits by using the preset file name or by entering a new file
name.
3. To use the preset file name, press one of the following side keys:
Save to LimitsA, Save to LimitsB, or Save to LimitsC.
4. To enter a new file name, type a file name in the text box at the top of the menu,
and then press the Save File Now side key.
The file extension *.lmt is automatically added to the limits file.
Perform the following steps to save the current limits to a file:
Loading the Limits.
1. When you open the spectrum emission mask measurement limits editor, press
the Cancel-Back (MENU) side key to return the measurement limit editor (see
Figure 2-9 on page 2-14).
2. Press the Load Limits side key to open the Load From File menu.
3. To load limits from the preset file, press one of the following side keys:
Load from LimitsA, Load from LimitsB, or Load from LimitsC.
4. To load limits from an existing file, select the file from the file list, and then
press the Load File Now side key.
Perform the following steps to load the limits from a file:
WCA230A & WCA280A Option 27 User Manual
2-19
Page 40

Uplink/Downlink Analysis in the S/A Mode
2-20
WCA230A & WCA280A Option 27 User Manual
Page 41

Downlink Analysis in the Demod Mode
This section describes the basic operation of the 3GPP-R5 downlink analysis in the
Demod (Modulation Analysis) mode. You can access the measurement items by
pressing DEMOD →Standard... → 3GPP-R5-DL as shown in Figure 2-11.
MODE
S/A
DEMOD
TIME
Figure 2-11: Downlink analysis measurement menu in the Demod mode
Standard... 3GPP-R5-DL
Measure menu items
Code Domain Power
Power Codogram
Code Power versus Time Slot
Code Power versus Symbol
Symbol Constellation
Symbol EVM
Symbol Eye Diagram
Symbol Table
Modulation Accuracy
The measurement in the Demod mode is based on the digital modulation analysis
function. For the digital modulation analysis, refer to the WCA230A and WCA280A
User Manual.
WCA230A & WCA280A Option 27 User Manual
2-21
Page 42

Downlink Analysis in the Demod Mode
Measurement Procedure
The following procedure shows you how to acquire data of multiple slots in
advance, measure continuous data, and obtain continuous code domain power:
NOTE.
WCA230A and WCA280A User Manual.
1. Press the DEMOD key on the front panel.
2. Press the side key Standard... →3GPP-R5-DL.
3. Press the FREQUENCY/CHANNEL key on the front panel to set frequency.
4. Press the SPAN key on the front panel to set the span.
5. Press the AMPLITUDE key on the front panel to set the amplitude
NOTE.
center top of the screen. If this occurs, raise the reference level.
6. Press the TIMING key on the front panel and then the Acquisition Length
For details on setting frequency, span, and amplitude, refer to the
If you use the channel table, do these steps:
a. Press the Channel Table... side key and select W-CDMA-DL.
b. Press the Channel side key and select a channel by rotating the general
purpose knob.
The center frequency is set to the value corresponding to the channel.
appropriately.
If the input level is too high, A/D OVERFLOW displays in the red box at the
side key to set the time length to acquire one block.
2-22
Suppose that one block contains M frames; the acquisition length is calculated
with this equation:
(One block acquisition length) = M × (One frame acquisition length)
One frame acquisition length is determined by span and indicated on the
Spectrum Length side key.
The number of frames M required for measuring N slots must meet the
following condition:
M > K × (N + 1.2) + 1
where
K =16.7 (for the span of 20 MHz and 15 MHz)
8.34 (for the span of 10 MHz)
4.17 (for the span of 5 MHz)
WCA230A & WCA280A Option 27 User Manual
Page 43

Downlink Analysis in the Demod Mode
7. After acquiring measurement data, stop the data acquisition. If you are
acquiring data in the continuous mode, press the RUN/STOP key.
8. Press the MEASURE key on the front panel and select measurement items.
For example, press the Power Codogram side key to observe the code domain
power spectrogram.
9. Press the MEAS SETUP key on the front panel and set the measurement
parameters. Refer to page 2-25 for details of the Meas Setup menu.
10. Set the analysis range in the overview. Refer to the WCA230A and WCA280A
User Manual for the details.
11. Press the Analyze side key to perform measurement for the frames in the
analysis range. The measurement result and waveform are displayed in the
main view.
Change the scale and format of the view as needed. Refer to page 2-28 for
setting views specific to the 3GPP-R5 downlink analysis.
12. If the level of input signals is low, the waveform may not be displayed
correctly. In this case, perform the following procedure:
NOTE.
The 3GPP-R5 downlink signal analysis may not be performed correctly if
the P-SCH, S-SCH, and PCPICH channels are too low to be detected. An error
occurs when one of these channel levels is lower than several tenths the sum of
other channel levels. In this case, set Scrambling Code Search to Off and specify
the scrambling code with the Scrambling Code side key.
a. Press the MEAS SETUP key on the front panel.
b. Press the Modulation Parameters... side key.
c. Press the Scrambling Code Search side key to select Off.
d. Press the Scrambling Code side key and enter the scrambling code.
The analyzer performs the measurement with the value set here in place of
detecting the scrambling code.
e. Press the MEAS SETUP key on the front panel.
f. Press the Analyze side key to perform measurement for the frames in the
analysis range.
WCA230A & WCA280A Option 27 User Manual
2-23
Page 44

Downlink Analysis in the Demod Mode
Figure 2-12 shows an example of the code domain power measurement.
Figure 2-12: Example of the code domain power measurement
Change the scale and format of the view as needed. Refer to page 2-28 for setting
views specific to the 3GPP-R5 uplink analysis.
2-24
WCA230A & WCA280A Option 27 User Manual
Page 45

Measurement Setup Menu
The Meas Setup menu for the 3GPP-R5 downlink modulation analysis contains the
following controls:
Downlink Analysis in the Demod Mode
Analyze
Modulation Parameters...
Performs measurements for time slots in the analysis range.
NOTE.
described below, press the Analyze side key to perform the measurement for the
modified settings.
Sets a measurement parameter to a non-standard value. The following controls are
provided:
Scrambling Code Search.
scrambling code from input signals.
On. Detects a scrambling code automatically from the input signal to perform
Off. Default. Performs measurement using the scrambling code that has been
NOTE.
appropriate scrambling code for reliable detection when either multiple code
channels are active or the sync channels have low power.
Also refer to Note on page 2-23.
When you change settings of the parameters in the Meas Setup menu
Selects whether to perform analysis by detecting a
the measurement.
set manually with Scrambling Code described below.
The manual mode (Scrambling Code Search Off) should be used with the
Scrambling Code.
Scrambling Code Search. The analyzer performs measurement using the set
scrambling code. Range: 0 to 24575 (default: 0).
The 3GPP standard defines the scrambling code with the following formulas.
Input the n value to set the code.
Primary scrambling code: n = 16 * i where i = 0 to 511
Secondary scrambling code: n = 16 * i + k where k = 1 to 15
WCA230A & WCA280A Option 27 User Manual
Sets the scrambling code number when you select Off in
2-25
Page 46

Downlink Analysis in the Demod Mode
Use Alternative Scramb. Code...
Selects the de-spread method to display the
measurement results:
Not Used. Default. Uses the primary scrambling code only (without the left
and the right alternative scrambling codes) to de-spread the input signal.
Primary. Uses the primary scrambling with the left and the right alternative
scrambling codes to de-spread the input signal.
Left Alternative. Uses the left alternative scrambling code to de-spread the
input signal.
Right Alternative. Uses the right alternative scrambling code to de-spread the
input signal.
Primary, Left Alternative and Right Alternative use the proprietary algorithm
to enhance the sensitivity by approximately 20 to 30 dB compared to Not Used.
Not Used does not use the alternative scrambling codes, providing faster
measurements.
Use SCH Part.
Selects whether to include or exclude the SCH portion when
calculating the code domain power.
On. Calculates the code domain power by including the SCH portion.
Off. Default. Calculates the code domain power by excluding the SCH portion.
Composite.
Determines whether to perform the composite analysis (automatic
detection of symbol rate).
On. Default. Specifies that the composite analysis is performed.
Off. Specifies that the composite analysis is not performed.
NOTE.
You should usually specify that composite analysis is performed. If a normal
analysis does not result, select Off in this command and select a specific symbol
rate with Symbol Rate in the View: Define menu.
16QAM Detection.
Selects whether to detect the QPSK or 16QAM code channel
automatically.
On. Default. Automatically detects whether the code channel is QPSK or
16QAM.
Off. Assumes that all code channels are QPSK.
2-26
WCA230A & WCA280A Option 27 User Manual
Page 47

Downlink Analysis in the Demod Mode
Auto Carrier
Measurement Filter...
None (no filter)
RootRaisedCosine (default)
Reference Filter...
None (no filter)
RaisedCosine (default)
Gaussian
Selects a filter for demodulating digitally-modulated signals:
Selects a filter for creating reference data:
For the filters, refer to Process Flow of Digitally-Modulated Signal in the
WCA230A and WCA280A User Manual.
Filter Parameter.
Sets the a/BT value for Measurement Filter and Reference Filter
described above. Range: 0.0001 to 1 (default: 0.22).
Selects whether to detect the carrier automatically.
On. Default. Automatically detects the carrier for every frame.
The error from the center frequency is shown on the Freq Error side key.
Frequency Offset
EVM IQ Origin Offset
Off. Sets the carrier frequency using Frequency Offset described below.
Sets the carrier frequency when Auto Carrier is selected to Off.
Input the carrier offset from the center frequency.
Determines whether to include or exclude the I/Q origin offset in the EVM, Rho,
and PCDE calculation.
Include. Default. Includes the I/Q origin offset in the EVM, Rho, and PCDE
calculation.
Exclude. Excludes the I/Q origin offset from the calculation.
WCA230A & WCA280A Option 27 User Manual
2-27
Page 48

Downlink Analysis in the Demod Mode
Scale and Format of View
The following main views are specific for the measurement items of the 3GPP-R5
downlink analysis in Demod mode:
Code domain power
Power codogram
Code power versus Time slot
Code power versus Symbol
Symbol constellation
Symbol EVM
Symbol eye diagram
Symbol table
Modulation accuracy
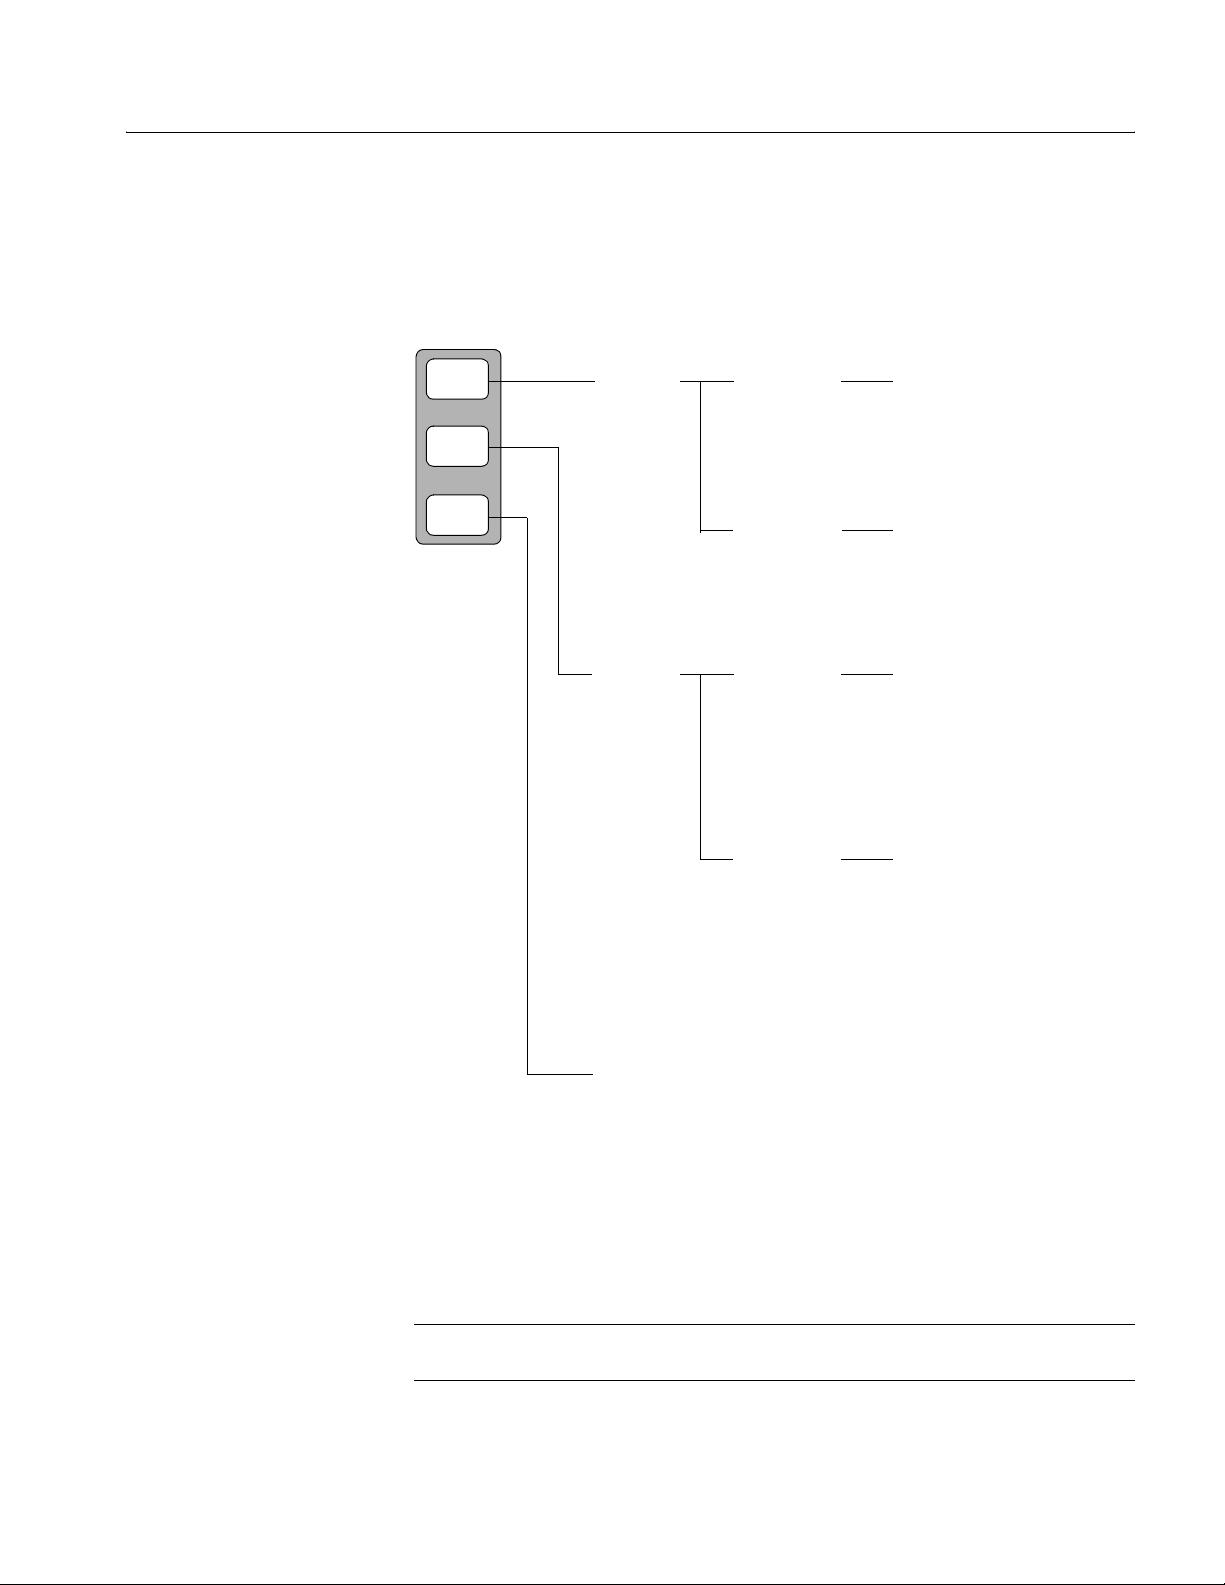
Each view (and its specific menu) is described on the following pages. In the main
view, the time slot table shown in Figure 2-13 is displayed in addition to waveform
and measurement results.
Time slot number in the analysis range
(0 is the last)
Figure 2-13: Time slot table
Time slot number in the radio frame
SSCH (Secondary Synchronization Channel)
SCG (Scrambling Code Group)
Scrambling code number
2-28
WCA230A & WCA280A Option 27 User Manual
Page 49

Downlink Analysis in the Demod Mode
View: Define Menu
The View: Define menu is common to all main views of the 3GPP-R5 downlink
measurement items. It contains the following controls:
Show Views.
Single. Displays only the view selected by the VIEW: SELECT key.
Multi. Default. Displays the overview, subview, and main view.
Overview Content...
Waveform (power versus time)
Spectrogram
Subview Content...
Spectrum
Code Domain Power
Power Codogram
CDP vs Time Slot (code domain power versus time slot)
CDP vs Symbol (code domain power versus symbol)
Selects the view style:
Selects a view to display in the overview:
Selects a view to display in the subview:
Symbol Constellation
Symbol EVM
Symbol Eye Diagram
Symbol Table
Modulation Accuracy
Time Slot.
Sets a time slot number to position the marker.
Range: 0 to the number of slots −1
Channelization Code.
Sets a channelization code number to position the marker.
Range: 0 to 511 channels
Multi Slot.
Selects whether to display single slot or multiple slots in the main view.
This selection affects only the code domain power versus symbol view and the
symbol EVM view. In the other views, it has no effect.
Off. Displays one time-slot selected by the Time Slot side key.
On. Displays up to 15 time-slots in the main view.
WCA230A & WCA280A Option 27 User Manual
2-29
Page 50

Downlink Analysis in the Demod Mode
Menu Off.
Removes the side menu from the screen to expand the waveform and
measurement result area. Press the MENU side key when you return to the
original display.
Show SCH Part.
Off. Hides the SCH part.
On. Displays the SCH part.
Symbol Rate...
960 k
480 k
240 k
120 k
60 k
30 k
15 k
7.5 k
Determines whether to display SCH at the beginning of data.
Sets the symbol rate for displaying symbol constellation:
Composite
The default is Composite for multi-rate.
2-30
WCA230A & WCA280A Option 27 User Manual
Page 51

Code Domain Power
Downlink Analysis in the Demod Mode
When you select Code Domain Power in the Measure menu, the code domain
power is displayed for each channelization code, as shown in Figure 2-14.
Channelization code number (Channel number at the symbol rate, modulation type)
Marker readout
Vertical Scale
Ver t i cal S t a r t
Code domain power
Time slot number in the radio frame
Horizontal Scale
Horizontal Start
Figure 2-14: Code domain power
WCA230A & WCA280A Option 27 User Manual
2-31
Page 52

Downlink Analysis in the Demod Mode
View: Scale Menu
Use the following controls to scale the view:
Auto Scale.
Sets the start value and the scale of the vertical axis automatically
to fit the waveform to the screen.
Horizontal Scale.
Sets the scale of the horizontal axis.
Range: 16 to 512 channels.
Horizontal Start.
Sets the start channel number of the horizontal axis.
Range: 0 to [512 −(Horizontal Scale)].
Vertical Scale.
Sets the scale of the vertical axis.
Range: 50 µ to 50 dB.
Vertical Stop.
Sets the maximum value (top edge) of the vertical axis.
Range: −50 to Vertical Scale [dB].
Full Scale.
Y Axis.
Sets the scale of the vertical axis to the default full scale value.
Selects whether to represent the vertical axis (amplitude) with relative or
absolute values.
Relative. The vertical axis represents power relative to the total power of
all channels.
Absolute. The vertical axis represents absolute power of each channel
2-32
WCA230A & WCA280A Option 27 User Manual
Page 53

Power Codogram
Downlink Analysis in the Demod Mode
When you select Power Codogram in the Measure menu, the code domain power
is displayed in spectrogram, as shown in Figure 2-15.
Channelization code number (Channel number at the symbol rate, modulation type)
Ver tical S i ze
Vertical Start
Marker readout
Color Stop
Code domain power
Slot number in the radio frame
Slot number based on the end of analysis range (0)
Relative time from completion of data acquisition
Color Scale
Horizontal Scale
Horizontal Start
Figure 2-15: Power codogram
WCA230A & WCA280A Option 27 User Manual
2-33
Page 54

Downlink Analysis in the Demod Mode
View: Scale Menu
Use the following controls to scale the view:
Auto Scale.
Sets the start value and the scale of the vertical axis automatically
to fit the waveform to the screen.
Horizontal Scale.
Sets the scale of the horizontal axis.
Range: 16 to 512 channels.
Horizontal Start.
Sets the start channel number of the horizontal axis.
Range: 0 to [512 − (Horizontal Scale)].
Vertical Size.
Sets the full scale of the vertical axis in frames.
Range: 58 to 59392.
Vertical Start.
Color Scale.
Sets the start frame number of the vertical axis.
Sets the scale of the color axis (the value obtained by subtracting the
minimum value from the maximum power).
5 dB
10 dB
20 dB
50 dB
The spectrogram is displayed in 100 steps (100 colors) from the minimum value
(blue) to the maximum value (red) in the default state.
Color Stop.
Sets the maximum value (top edge) of the color axis.
Range: −50 to Color Scale [dB].
Full Scale.
Y Axis.
Sets Color Stop to 0 (zero) and Color Scale to 50 dB.
Selects whether to represent the Y (color) axis with relative or
absolute values.
Relative. The Y axis represents power relative to the total power of
all channels.
Absolute. The Y axis represents absolute power of each channel.
2-34
WCA230A & WCA280A Option 27 User Manual
Page 55

Code Power versus Time Slot
When you select Code Power versus Time Slot in the Measure menu, the
code domain power is displayed for each slot, as shown in Figure 2-16.
S
lot number in the analysis range (Slot number in the radio frame)
Downlink Analysis in the Demod Mode
Marker readout
Vertical Scale
Ver t i cal S t a r t
Slot power
Horizontal Scale
Horizontal Start
Figure 2-16: Code domain power versus Time slot
WCA230A & WCA280A Option 27 User Manual
2-35
Page 56

Downlink Analysis in the Demod Mode
View: Scale Menu
Use the following controls to scale the view:
Auto Scale.
Sets the start value and the scale of the vertical axis automatically to
display the entire waveform.
Horizontal Scale.
Sets the scale of the horizontal axis (number of slots).
Range: N/8 to N slots (N: the number of slots in the analysis range.)
Horizontal Start.
Sets the start slot number of the horizontal axis.
Range: −(N − 1) to [1 − (Horizontal Scale)].
Vertical Scale.
Sets the scale of the vertical axis.
Range: 50 µ to 50 dB.
Vertical Stop.
Sets the maximum value (top edge) of the vertical axis.
Range: − 25 to [(Vertical Scale) + 25] dB.
Full Scale.
Y Axis.
Sets the scale of the vertical axis to the default full scale value.
Selects whether to represent the vertical (amplitude) axis with relative or
absolute values.
Relative. The vertical axis represents time slot power relative to the power of
the first time slot in the analysis range.
Absolute. The vertical axis represents absolute power of time slots.
Select Power.
Code. Shows the power of all channels or the specified channel depending on
Selects the channel to show the power for each time slot.
the setting of Total Power described below.
PSCH. Shows the power of the PSCH (Primary Synchronization Channel).
SSCH. Shows the power of the SSCH (Secondary Synchronization Channel).
Tot al Powe r.
Determines whether to display the total power for each time slot when
you select Code with Select Power described above.
On. Default. Displays the total power of all channels for each time slot.
Off. Displays power of the channel specified with Channelization Code in the
View: Define menu (refer to page 2-29).
2-36
WCA230A & WCA280A Option 27 User Manual
Page 57

Code Power versus Symbol
When you select Code Power versus Symbol in the Measure menu, the
code domain power is displayed for each symbol, as shown in Figure 2-17.
Downlink Analysis in the Demod Mode
Marker readout
Vertical Scale
Vertical Start
Symbol number
Horizontal Start
Channelization code number
Symbol power (Channel number at the symbol rate, modulation type)
Channel number (Symbol rate)
Time slot number in the radio frame
Horizontal Scale
Figure 2-17: Code domain power versus Symbol
WCA230A & WCA280A Option 27 User Manual
2-37
Page 58

Downlink Analysis in the Demod Mode
View: Scale Menu
Use the following controls to scale the view:
Auto Scale.
Sets the start value and the scale of the vertical axis automatically
to fit the waveform to the screen.
Horizontal Scale.
Sets the scale of the horizontal axis (number of symbols).
Range: 0 to 320 symbols.
Horizontal Start.
Sets the start symbol number of the horizontal axis.
Range: 0 to [(initial value of Horizontal Scale) − (set value of Horizontal Scale)].
Vertical Scale.
Sets the scale of the vertical axis.
Range: 50 µ to 50 dB.
Vertical Stop.
Sets the maximum value (top edge) of the vertical axis.
Range: −50 to Vertical Scale [dB].
Full Scale.
Y Axis.
Sets the scale of the vertical axis to the default full-scale value.
Selects whether to represent the vertical (amplitude) axis with relative or
absolute values.
Relative. The vertical axis represents power relative to the total power of
all channels.
Absolute. The vertical axis represents absolute power of each channel.
2-38
WCA230A & WCA280A Option 27 User Manual
Page 59

Symbol Constellation
Downlink Analysis in the Demod Mode
The symbol constellation is displayed when you select Symbol Constellation in the
Measure menu, as shown in Figure 2-18.
Origin offset measurement value
Scale of amplitude
View: Scale Menu
Symbol number
Marker readout
Real channel number (Symbol rate)
Time slot number in the radio frame
Figure 2-18: Symbol constellation
Use the following controls to set the scale:
Measurement Content...
Selects vector or constellation display.
Channelization code number
Vec tor. Selects vector display. A signal represented by phase and amplitude is
displayed in polar coordinate or IQ diagram. The red point indicates the
symbol position of the measured signal, and the yellow trace indicates the
locus of the signal between symbols.
Constellation. Selects constellation display. It is the same as the vector
display, except that only symbols of the measured signal are indicated in red,
and the locus between symbols is not shown. The cross marks indicate the
symbol positions of an ideal signal.
You can select degree or radian for the angular unit by pressing SYSTEM →
Instrument Setup... → Angular Units...
WCA230A & WCA280A Option 27 User Manual
2-39
Page 60

Downlink Analysis in the Demod Mode
Symbol EVM
When you select Symbol EVM in the Measure menu, EVM (Error Vector
Magnitude) is displayed for each symbol, as shown in Figure 2-19.
EVM
Magnitude error
Phase error
Waveform quality (ρ)
Analysis length
(number of symbols)
Marker readout
Channelization code numberSymbol number
Measurement Content = EVM
Channel number (Symbol rate)
Time slot number in the radio frame
Horizontal Scale
Horizontal Start
Vertical Scale
Vertical Start
Vertical Offset
Figure 2-19: Symbol EVM
Measurement Content = Mag Error or Phase Error
Vertical Scale
Horizontal Scale
Horizontal Start
2-40
WCA230A & WCA280A Option 27 User Manual
Page 61

Downlink Analysis in the Demod Mode
View: Scale Menu
Use the following controls to scale the view:
Auto Scale.
Sets the start value and the scale of the vertical axis automatically
to fit the waveform to the screen.
Horizontal Scale.
Sets the scale of the horizontal axis (number of symbols).
Range: 0 to 320 symbols.
Horizontal Start.
Sets the start symbol number of the horizontal axis.
Range: 0 to [(initial value of Horizontal Scale) − (set value of Horizontal Scale)].
Vertical Scale.
Sets the scale of the vertical axis.
Refer to Table 2-3 for the setting range.
Vertical Start.
Sets the minimum value (bottom edge) of the vertical axis when the
measurement content is EVM. Refer to Table 2-3 for the setting range.
Vertical Offset.
Sets the center value ((maximum + minimum) / 2) of the
vertical axis when the measurement content is Mag Error or Phase Error.
Refer to Table 2-3 for the setting range.
Full Scale.
Sets the scale of vertical axis to the default full-scale value.
Measurement Content...
EVM. Represents the vertical axis with EVM.
Mag Error. Represents the vertical axis with magnitude error.
Phase Error. Represents the vertical axis with phase error.
Selects how to display the vertical axis:
Table 2-3: Vertical scale setting range
Measurement
Content... Vertical Scale Vertical Start Vertical Offset
EVM 100
Mag Error 200
Phase Error 450
µ
to 100%
µ
to 200% -
µ
to 450
°
−
100 to 100% -
-
−
200 to 200%
−
450 to 450
°
You can select degree or radian for the angular unit by pressing SYSTEM →
Instrument Setup... → Angular Units...
WCA230A & WCA280A Option 27 User Manual
2-41
Page 62

Downlink Analysis in the Demod Mode
Symbol Eye Diagram
The symbol eye diagram is displayed when you select Symbol Eye Diagram in the
Measure menu, as shown in Figure 2-20.
Channelization code numberSymbol number
Marker readout
View: Scale Menu
Amplitude (Channel number at the symbol rate, Modulation type)
Channel number (Symbol rate)
Time slot number in the radio frame
Figure 2-20: Symbol eye diagram
Use the following controls to scale the view.
Measurement Content...
I. Default. Displays I data on the vertical axis.
Q. Displays Q data on the vertical axis.
Tre llis . Displays phase on the vertical axis.
Selects the vertical axis of eye diagram.
2-42
Eye Length.
Enters the number of display symbols on the horizontal axis.
Range: 1 to 16 (default: 2)
WCA230A & WCA280A Option 27 User Manual
Page 63

Symbol Table
Downlink Analysis in the Demod Mode
The symbol table is displayed when you select Symbol Table in the Measure menu,
as shown in Figure 2-21.
Marker readout
View: Scale Menu
Symbol number
Channelization code number
Symbol value (Channel number at the symbol rate, modulation type)
Figure 2-21: Symbol table
Use the following controls to scale the view:
Radix.
Selects the radix for displaying the table:
Hex. Hexadecimal digit
Oct. Octal digit
Bin. Default. Binary digit
Hex and Oct indicate values of binary data string in units of modulation symbol.
Rotate.
Sets the start position. Range: 0 to 3.
WCA230A & WCA280A Option 27 User Manual
2-43
Page 64

Downlink Analysis in the Demod Mode
Modulation Accuracy
The constellation of all channels before the de-spread is displayed when you select
Modulation Accuracy in the Measure menu.
When you press the VIEW: SELECT key on the front panel to select the
constellation view, the measurement results for the time slot are displayed instead
of the overview, as shown in Figure 2-22.
Measurement results
■
EVM (RMS and peak)
■
Magnitude error (RMS and peak)
■
Phase error (RMS and peak)
These values are displayed when you
select the constellation view.
Time at the marker position
(relative to the end of data acquisition)
Marker readout
Measurement results
■
PCDE (Peak Code Domain Error)
@ channel
■
EVM (RMS)
■
Phase error (RMS)
■
Waveform quality (ρ)
■
Frequency error
■
Origin offset (IQ feedthrough)
Constellation view
Time slot number in the radio frame
Figure 2-22: Modulation accuracy
The view settings are the same as for Symbol Constellation.
Refer to Symbol Constellation on page 2-39.
2-44
WCA230A & WCA280A Option 27 User Manual
Page 65

Uplink Analysis in the Demod Mode
This section describes the basic operation for the 3GPP-R5 uplink analysis in the
Demod (modulation analysis) mode. You can access the measurement item by
pressing DEMOD →Standard... → 3GPP-R5-UL as shown in Figure 2-23.
MODE
S/A
DEMOD
TIME
Figure 2-23: Uplink analysis measurement menu in the Demod mode
Standard... 3GPP-R5-UL
Measure menu items
Code Domain Power
Power Codogram
Code Power versus Time Slot
Code Power versus Symbol
Symbol Constellation
Symbol EVM
Symbol Eye Diagram
Symbol Table
Modulation Accuracy
ACK/NACK Analysis
The 3GPP-R5 uplink modulation analysis is based on the standard digital
modulation analysis function. For the digital modulation analysis, refer to the
WCA230A and WCA280A User Manual.
WCA230A & WCA280A Option 27 User Manual
2-45
Page 66

Uplink Analysis in the Demod Mode
Measurement Procedure
The following procedure shows you how to acquire data of multiple slots in
advance, measure continuous data, and obtain continuous code domain power:
NOTE.
For details on setting frequency, span, and amplitude, refer to the
WCA230A and WCA280A User Manual.
1. Press the DEMOD key on the front panel.
2. Press the side key Standard... →3GPP-R5-UL.
3. Press the FREQUENCY/CHANNEL key on the front panel to set frequency.
If you use the channel table, do these steps:
Press the Channel Table... side key and select W-CDMA-UL.
Press the Channel side key and select a channel by rotating the general
purpose knob.
The center frequency is set to the value corresponding to the channel.
4. Press the SPAN key on the front panel to set the span.
5. Press the AMPLITUDE key on the front panel to set the amplitude
appropriately.
NOTE.
If the input level is too high, A/D OVERFLOW displays in the red box at the
center top of the screen. If this occurs, raise the reference level.
6. Press the TIMING key on the front panel and then the Acquisition Length
side key to set the time length to acquire one block.
2-46
Suppose that one block contains M frames; the acquisition length is calculated
with this equation:
(One block acquisition length) = M × (One frame acquisition length)
One frame acquisition length is determined by span and indicated on the
Spectrum Length side key.
The number of frames M required for measuring N slots must meet the
following condition:
M > K × (N + 1.2) + 1
where
K =16.7 (for span 20 MHz and 15 MHz)
8.34 (for span 10 MHz)
4.17 (for span 5 MHz)
WCA230A & WCA280A Option 27 User Manual
Page 67

Uplink Analysis in the Demod Mode
7. After acquiring measurement data, stop the acquisition.
If you are acquiring data in the continuous mode, press the RUN/STOP key.
8. Press the MEASURE key on the front panel and select measurement items.
For example, press the Power Codogram side key to observe the code domain
power spectrogram.
9. Press the MEAS SETUP key on the front panel and set the measurement
parameters. Refer to page 2-48 for details of the Meas Setup menu.
10. Set the analysis range in the overview using the Timing menu.
Refer to the WCA230A and WCA280A User Manual for the details.
11. Press the Analyze side key to perform measurement for the frames in the
analysis range. The measurement result and waveform are displayed in the
main view.
Figure 2-24 shows an example of the code domain power measurement.
Figure 2-24: Example of the code domain power measurement
Change the scale and format of the view as needed. Refer to page 2-54 for setting
views specific to the 3GPP-R5 uplink analysis.
WCA230A & WCA280A Option 27 User Manual
2-47
Page 68

Uplink Analysis in the Demod Mode
Measurement Setup Menu
The Meas Setup menu for the uplink analysis contains the following controls:
Analyze
Modulation Parameters...
Performs measurements for time slots in the analysis range.
NOTE.
When you change settings in the Meas Setup menu, press the Analyze
side key to perform the measurement for the modified settings.
Sets a measurement parameter to a non-standard value.
The following setting items are provided:
Measurement Mode...
Selects the type of uplink signal.
(Not available for the ACK/NACK analysis.)
DPDCH/DPCCH (default)
PRACH
PCPCH
Scrambling Code Type.
Available for the DPDCH/DPCCH measurement mode.
Selects the scrambling code type:
Long (default)
Short
2-48
Scrambling Code.
Sets the scrambling code number.
Range: 0 to 16777215 (default: 0).
Threshold.
Available for the PRACH measurement mode.
Sets the threshold level to detect a burst.
Range: −100 to 10 dB relative to the reference level (default: −30 dB).
Measurement Filter...
None (no filter)
RootRaisedCosine (default)
Reference Filter...
None (no filter)
RaisedCosine (default
Gaussian
Selects a filter for demodulating digitally-modulated signals:
Selects a filter for creating reference data:
WCA230A & WCA280A Option 27 User Manual
Page 69

Uplink Analysis in the Demod Mode
For the filters, refer to Process Flow of Digitally-Modulated Signal in the
WCA230A and WCA280A User Manual.
Auto Carrier
Frequency Offset
EVM IQ Origin Offset
Filter Parameter.
Sets an α/BT value for Measurement Filter and Reference Filter
described above. Range: 0.0001 to 1 (default: 0.22)
Selects whether to detect the carrier automatically.
On. Default. Automatically detects the carrier for every frame.
The error from the center frequency is shown on the Freq Error side key.
Off. Sets the carrier frequency using Frequency Offset.
Sets the carrier frequency when Off is selected in Auto Carrier.
Input the carrier offset from the center frequency.
Determines whether or not to take into account the I/Q origin offset for the EVM,
Rho and PCDE measurement results.
Include. Default. Takes into account the I/Q origin offset for the results.
Exclude. Ignores the I/Q origin offset for the results.
WCA230A & WCA280A Option 27 User Manual
2-49
Page 70

Uplink Analysis in the Demod Mode
Subframe Offset Select
Subframe to TS Offset
Downlink Time Offset
ACK/NACK Analysis Measurement Menu.
The following controls are only for
ACK/NACK analysis.
Selects how to specify the subframe offset.
Auto. Default. The symbol table is displayed for any offset.
STO. Sets the Subframe to Time-Slot Offset (STO) using the
Subframe to TS Offset side key.
DTO. Sets the Downlink Time Offset (DTO) using the Downlink Time Offset
side key.
Specifies the subframe to time-slot offset when you select STO with the
Subframe Offset Select side key. Range: 0 to 9 symbols (default: 0).
The subframe to time-slot offset is the time offset between the start of the DPDCH
time slot and the start of the HS-DPCCH subframe (see Figure 2-25).
Specifies the downlink time offset when you select DTO with the
Subframe Offset Select side key. Range: 0 to 149 symbols (default: 1).
The downlink time offset is the time offset between the start of HS-SCCH and the
start of DPCH (see Figure 2-25).
Downlink Unit: Symbols
HS-SCCH
HS-PDSCH
DPCH
30 30
20
Downlink time offset
30
(DTO)
Uplink
HS-DPCCH
DPDCH
4
30 30
10 10 10 10 10 10 10 10 10 10
Subframe to time-slot offset
(STO)
75
10 10 10 10 10 10 10 10 10 10
Displayed on the symbol table
30
• • •
30
Figure 2-25: Subframe offset
Update ACK/NACK Results
Re-detects ACK and NACK indications on the existing time slot data to update the
measurement result display after you change the subframe offset manually or abort
the Analyze (top side key) operation.
2-50
WCA230A & WCA280A Option 27 User Manual
Page 71

Display Method for HS-DPCCH
The measurement results for each channel are normally displayed in the view for
each time slot. But HS-DPCCH has the different display methods for the settings
of Subframe Offset Select in the Meas Setup menu. This section describes how to
display HS-DPCCH in each view.
Code Domain Power
When Subframe Offset Select is set to AUTO
Each time slot is displayed without offset as the other channels (see the
upper part of Figure 2-26).
When Subframe Offset Select is set to STO (Subframe to Time slot Offset)
Each time slot is displayed with offset specified by Subframe to TS Offset in
the Meas Setup menu. Also in the total power calculation for the relative value
display, only HS-DPCCH is offset in the same way. But the last time slot is
displayed without offset (see the lower part of Figure 2-26).
When Subframe Offset Select is set to DTO (Downlink Time Offset)
Each time slot is displayed in the same manner as when Subframe Offset Select
is set to STO. But the number of offset symbols is determined by this formula:
[151 − (Downlink Time Offset)] mod 10 (see the lower part of Figure 2-26).
Uplink Analysis in the Demod Mode
Subframe Offset Select = AUTO
DPDCH 10
HS-DPCCH
Display sequence
Subframe Offset Select = STO or DTO
DPDCH 10
HS-DPCCH
Display sequence
1 234
10 10 10
10 10 10
10 10 10
10 10 10
1 23
NOTE. “10” in the box represents the number of symbols in a time slot.
<10
<10
4
Figure 2-26: HS-DPCCH display method (Code domain power)
WCA230A & WCA280A Option 27 User Manual
2-51
Page 72

Uplink Analysis in the Demod Mode
Code Power versus Symbol
When Subframe Offset Select is set to AUTO
When Subframe Offset Select is set to STO (Subframe to Time slot Offset)
When Subframe Offset Select is set to DTO (Downlink Time Offset)
10 symbols are displayed for each time slot without offset as the other channels
(see the upper part of Figure 2-26 on page 2-51).
30 symbols are displayed for each time slot with offset specified by Subframe
to TS Offset in the Meas Setup menu. Also in the total power calculation for
the relative value display in the Code power versus Symbol view, only
HS-DPCCH is offset in the same way (see the upper part of Figure 2-27). But
when there are not enough symbols in the last part of the analysis range, 30,
20, and 10 symbols are displayed without offset as shown in the upper part of
Figure 2-27, the display sequence 8, 9, and 10, respectively.
If the specified time slot is the first one in the subframe, symbols are displayed
in the same manner as when Subframe Offset Select is set to STO. Otherwise
symbols are displayed in the same manner as when Subframe Offset Select is
set to AUTO (see the lower part of Figure 2-26).
Subframe Offset Select = STO
DPDCH 10
HS-DPCCH
Display sequence
Subframe Offset Select = DTO
DPDCH 10
HS-DPCCH
Display sequence
10 10 10
10
10
10 10 10 10 10 10 10 10 <10
1
2
10 10 10
10 10 10 10 10 10 10 10 <10
1
2 3 5 6 8 910
10 10 10 10 10 10
4 7
5
3
10 10 10 10 10 10
4 7
NOTE. “10” in the box represents the number of symbols in a time slot.
6
8
9
10
Figure 2-27: HS-DPCCH display method (Code power versus Symbol)
2-52
WCA230A & WCA280A Option 27 User Manual
Page 73

Uplink Analysis in the Demod Mode
ACK/NACK Analysis
Symbols of four time slots (40 symbols) are displayed without offset (see the
upper part of Figure 2-28). But for the last three time slots, 30, 20, and 10 symbols
are displayed without offset as shown in the Figure 2-28, the display sequence 4, 5,
and 6, respectively.
DPDCH 10
HS-DPCCH
Display sequence
10 10 10
10
10 10 10 10 <10
1
2
NOTE. “10” in the box represents the number of symbols in a time slot.
10 10
5
6
3
4
Figure 2-28: HS-DPCCH display method (ACK/NACK analysis)
Power Codogram, Code Power versus Time Slot, Symbol Constellation,
Symbol EVM, Symbol Eye Diagram, and Symbol Table
Each time slot is displayed regardless HS-DPCCH.
WCA230A & WCA280A Option 27 User Manual
2-53
Page 74

Uplink Analysis in the Demod Mode
Scale and Format of View
The following main views are specific for the measurement items of the 3GPP-R5
downlink analysis in Demod mode:
Code domain power
Power codogram
Code power versus Time slot
Code power versus Symbol
Symbol constellation
Symbol EVM
Symbol eye diagram
Symbol table
Modulation accuracy
ACK/NACK analysis
Each view (and its specific menu) is described on the following pages. In the
main view, the time slot table shown in Figure 2-29 is displayed in addition to
waveform and measurement results. Only the ACK/NACK analysis has its own
time slot table, which is shown in Figure 2-39 on page 2-71.
Time slot number in the analysis range
(0 is the last)
Figure 2-29: Time slot table
Time slot number in the radio frame
Signature number in preamble
Preamble
2-54
WCA230A & WCA280A Option 27 User Manual
Page 75

Uplink Analysis in the Demod Mode
View: Define Menu
The View: Define menu is common to all main views of the 3GPP-R5 downlink
measurement items. It contains the following controls:
Show Views.
Single. Displays only the view selected by the VIEW: SELECT key.
Multi. Default. Displays the overview, subview, and main view.
Overview Content...
Waveform (power versus time)
Spectrogram
Subview Content...
Spectrum
Code Domain Power
Power Codogram
CDP vs Time Slot (code domain power versus time slot)
CDP vs Symbol (code domain power versus symbol)
Selects the view style:
Selects a view to display in the overview:
Selects a view to display in the subview:
Symbol Constellation
Symbol EVM
Symbol Eye Diagram
Symbol Table
Modulation Accuracy
Time Slot.
Sets a time slot number to position the marker.
Range: 0 to the number of slots −1
Symbol Rate...
960 k
480 k
240 k
120 k
60 k
30 k
15 k
Sets the symbol rate for displaying symbol constellation:
WCA230A & WCA280A Option 27 User Manual
2-55
Page 76

Uplink Analysis in the Demod Mode
Channel Number.
Range: Channel 0 to 7.
Menu Off.
measurement result area. Press the MENU side key when you return to the
original display.
Change scale and format of the view as needed. For the details, refer to the
WCA230A and WCA280A User Manual and the WCA230A and WCA280A
Option 23 User Manual.
Removes the side menu from the screen to expand the waveform and
Sets a channel number to position the marker.
2-56
WCA230A & WCA280A Option 27 User Manual
Page 77

Code Domain Power
Uplink Analysis in the Demod Mode
When you select Code Domain Power in the Measure menu, the code domain
power is displayed for each channel, as shown in Figure 2-30.
Channel number (Time slot number in the radio frame)
Marker readout
Vertical Scale
Ver t i cal S t a r t
Code domain power
Horizontal Scale
Horizontal Start
Figure 2-30: Code domain power
WCA230A & WCA280A Option 27 User Manual
2-57
Page 78

Uplink Analysis in the Demod Mode
View: Scale Menu
Use the following controls to scale the view:
Auto Scale.
Sets the start value and the scale of the vertical axis automatically to fit
the waveform to the screen.
Horizontal Scale.
Sets the scale of the horizontal axis.
Range: 1 to 8 channels.
Horizontal Start.
Sets the start channel number of the horizontal axis.
Range: 0 to [8 − (Horizontal Scale)].
Vertical Scale.
Sets the scale of the vertical axis.
Range: 50 µ to 50 dB.
Vertical Stop.
Sets the maximum value (top edge) of the vertical axis.
Range: −50 to Vertical Scale [dB].
Full Scale.
Y Axis.
Sets the scale of the vertical axis to the default full-scale value.
Selects whether to represent the vertical axis (amplitude) with relative or
absolute values.
Relative. The vertical axis represents power relative to the total power of
all channels.
Absolute. The vertical axis represents absolute power of each channel
2-58
WCA230A & WCA280A Option 27 User Manual
Page 79

Power Codogram
Uplink Analysis in the Demod Mode
When you select Power Codogram in the Measure menu, the code domain power
is displayed in spectrogram, as shown in Figure 2-31.
Channel number
Ver tical S i ze
Vertical Start
Marker readout
Color Stop
Code domain power
TS: Slot number in the radio frame
SIG: Signature number in preamble
Slot number based on the end of analysis range (0)
Relative time from completion of data acquisition
Color Scale
Horizontal Scale
Horizontal Start
Figure 2-31: Power codogram
WCA230A & WCA280A Option 27 User Manual
2-59
Page 80

Uplink Analysis in the Demod Mode
View: Scale Menu
Use the following controls to scale the view:
Auto Scale.
Sets the start value and the scale of the vertical axis automatically to fit
the waveform to the screen.
Horizontal Scale.
Sets the scale of the horizontal axis.
Range: 1 to 8 channels.
Horizontal Start.
Sets the start channel number of the horizontal axis.
Range: 0 to [8 − (Horizontal Scale)].
Vertical Size.
Sets the full scale of the vertical axis in frames.
Range: 58 to 59392 frames.
Vertical Start.
Color Scale.
Sets the start frame number of the vertical axis.
Sets the scale (the value subtracting the minimum power value from
the maximum) of the color axis:
5 dB
10 dB
20 dB
50 dB
The spectrogram is displayed in 100 steps (100 colors) from the minimum value
(blue) to the maximum value (red) in the default state.
Color Stop.
Sets the maximum value (top edge) of the color axis.
Range: −50 to Color Scale [dB].
Full Scale.
Y Axis.
Sets Color Stop to 0 (zero) and Color Scale to 50 dB.
Selects whether to represent the Y (color) axis with relative or
absolute values.
Relative. The Y axis represents power relative to the total power of
all channels.
Absolute. The Y axis represents absolute power of each channel.
2-60
WCA230A & WCA280A Option 27 User Manual
Page 81

Code Power versus Time Slot
When you select Code Power versus Time Slot in the Measure menu, the
code domain power is displayed for each slot, as shown in Figure 2-32.
Slot number in the analysis range (Slot number in the radio frame)
Marker readout
Vertical Scale
Uplink Analysis in the Demod Mode
Slot power
Ver t i cal S t a r t
Horizontal Scale
Horizontal Start
Figure 2-32: Code domain power versus Time slot
WCA230A & WCA280A Option 27 User Manual
2-61
Page 82

Uplink Analysis in the Demod Mode
View: Scale Menu
Use the following controls to scale the view:
Auto Scale.
Sets the start value and the scale of the vertical axis automatically to
display the entire waveform.
Horizontal Scale.
Sets the scale of the horizontal axis (number of slots).
Range: N/8 to N slots (N: the number of slots in the analysis range.)
Horizontal Start.
Sets the start slot number of the horizontal axis.
Range: −(N − 1) to [1 − (Horizontal Scale)].
Vertical Scale.
Sets the scale of the vertical axis.
Range: 50 µ to 50 dB.
Vertical Stop.
Sets the maximum value (top edge) of the vertical axis.
Range: − 25 to [(Vertical Scale) + 25] dB.
Full Scale.
Y Axis.
Sets the scale of the vertical axis to the default full scale value.
Selects whether to represent the vertical (amplitude) axis with relative or
absolute values.
Relative. The vertical axis represents time slot power relative to the power of
the first time slot in the analysis range.
Absolute. The vertical axis represents absolute power of time slots.
Select Power.
Code. Shows the power of all channels or the specified channel, depending on
Selects the channel to show the power for each time slot.
the setting of Total Power described below.
PSCH. Shows the power of the P-SCH (Primary Synchronization Channel).
SSCH. Shows the power of the S-SCH (Secondary Synchronization Channel).
Tot al Powe r.
Determines whether to display the total power for each time slot when
you select Code with Select Power described above.
On. Default. Displays the total power of all channels for each time slot.
Off. Displays power of the channel specified with Channel Number in the
View: Define menu (refer to page 2-56).
2-62
WCA230A & WCA280A Option 27 User Manual
Page 83

Code Power versus Symbol
When you select Code Power versus Symbol in the Measure menu, the
code domain power is displayed for each symbol, as shown in Figure 2-33.
Uplink Analysis in the Demod Mode
Marker readout
Vertical Scale
Vertical Start
Symbol number
Horizontal Start
Channel number (Slot number in the radio frame)
Symbol power
Channel number
Slot number in the radio frame
Horizontal Scale
Figure 2-33: Code domain power versus Symbol
WCA230A & WCA280A Option 27 User Manual
2-63
Page 84

Uplink Analysis in the Demod Mode
View: Scale Menu
Use the following controls to scale the view:
Auto Scale.
Sets the start value and the scale of the vertical axis automatically to fit
the waveform to the screen.
Horizontal Scale.
Sets the scale of the horizontal axis (number of symbols).
Range: 0 to 640 symbols.
Horizontal Start.
Sets the start symbol number of the horizontal axis.
Range: 0 to [(initial value of Horizontal Scale) − (set value of Horizontal Scale)].
Vertical Scale.
Sets the scale of the vertical axis.
Range: 50 µ to 50 dB.
Vertical Stop.
Sets the maximum value (top edge) of the vertical axis.
Range: −50 to Vertical Scale [dB].
Full Scale.
Y Axis.
Sets the scale of the vertical axis to the default full-scale value.
Selects whether to represent the vertical (amplitude) axis with relative or
absolute values.
Relative. The vertical axis represents power relative to the total power of
all channels.
Absolute. The vertical axis represents absolute power of each channel.
2-64
WCA230A & WCA280A Option 27 User Manual
Page 85

Symbol Constellation
Uplink Analysis in the Demod Mode
The symbol constellation is displayed when you select Symbol Constellation in the
Measure menu, as shown in Figure 2-34.
Origin offset measurement value
Scale of amplitude
View: Scale Menu
Symbol number
Marker readout
Channel number
Slot number
in the radio frame
Figure 2-34: Symbol constellation
Use the following controls to set the scale:
Measurement Content...
Vec tor. Selects vector display. A signal represented with phase and amplitude
Selects vector or constellation display.
is displayed in polar coordinate or IQ diagram. The red point indicates the
symbol position of the measured signal, and the yellow trace indicates the
locus of the signal between symbols.
Constellation. Selects constellation display. It is the same as the vector
display, except that only symbols of the measured signal are indicated in red,
and the locus between symbols is not shown. The cross marks indicate the
symbol positions of an ideal signal.
You can select degree or radian for the angular unit by pressing SYSTEM
→ Instrument Setup... → Angular Units...
WCA230A & WCA280A Option 27 User Manual
2-65
Page 86

Uplink Analysis in the Demod Mode
Symbol EVM
When you select Symbol EVM in the Measure menu, EVM (Error Vector
Magnitude) is displayed for each symbol, as shown in Figure 2-35.
Channel numberSymbol number
Measurement results
■
EVM RMS
■
Magnitude error RMS
■
Phase error RMS
■
Waveform quality (ρ)
■
Analysis length (number of symbols)
Peak @ symbol
Peak @ symbol
Peak @ symbol
Marker readout
Vertical Offset
in the radio frame
Horizontal Start
Measurement Content = Mag Error or Phase Error
Measurement Content = EVM
Channel number
Slot number
Vertical Scale
Vertical Start
Horizontal Scale
Vertical Scale
2-66
Horizontal Scale
Horizontal Start
Figure 2-35: Symbol EVM
NOTE.
The uplink signals are BPSK modulated and all channels are mapped on
either I or Q axis, so the Symbol EVM view does not show the phase error
measurement result. Also, when you set the Measurement Content (refer to
page 2-67) to Phase Error, the measurement waveform is not displayed.
WCA230A & WCA280A Option 27 User Manual
Page 87

Uplink Analysis in the Demod Mode
View: Scale Menu
Use the following controls to scale the view:
Auto Scale.
Sets the start value and the scale of the vertical axis automatically to
display the entire waveform.
Horizontal Scale.
Sets the scale of the horizontal axis (number of symbols).
Range: 0 to 640 symbols.
Horizontal Start.
Sets the start symbol number of the horizontal axis.
Range: 0 to [(initial value of Horizontal Scale) − (set value of Horizontal Scale)].
Vertical Scale.
Vertical Start.
Sets the scale of the vertical axis.
Sets the minimum value (bottom edge) of the vertical axis when the
measurement content is EVM. Refer to Table 2-4 for the setting range.
Vertical Offset.
Sets the center value ((maximum + minimum) / 2) of the vertical
axis when the measurement content is Mag Error or Phase Error. Refer to Table 2-4
for the setting range.
Full Scale.
Measurement Content...
Sets the scale of vertical axis to the default full-scale value.
Selects how to display the vertical axis:
EVM. Represents the vertical axis with EVM (Error Vector Magnitude).
Mag Error. Represents the vertical axis with magnitude error.
Phase Error. Represents the vertical axis with phase error.
Table 2-4: Vertical scale setting range
Measurement
Content... Vertical Scale Vertical Start Vertical Offset
EVM 100
Mag Error 200
Phase Error 450
µ
to 100%
µ
to 200% -
µ
to 450
°
−
100 to 100% -
-
−
200 to 200%
−
450 to 450
°
You can select degree or radian for the angular unit by pressing SYSTEM →
Instrument Setup... → Angular Units...
WCA230A & WCA280A Option 27 User Manual
2-67
Page 88

Uplink Analysis in the Demod Mode
Symbol Eye Diagram
The symbol eye diagram is displayed when you select Symbol Eye Diagram in the
Measure menu, as shown in Figure 2-36.
Marker readout
Figure 2-36: Symbol eye diagram
Channel numberSymbol number
Slot number in the radio frame
View: Scale Menu
Use the following controls to scale the view:
Measurement Content...
I. Default. Displays I data on the vertical axis.
Q. Displays Q data on the vertical axis.
Tre llis . Displays phase on the vertical axis.
Eye Length.
Enters the number of display symbols on the horizontal axis.
Selects the vertical axis of eye diagram.
Range: 1 to 16 (default: 2)
2-68
WCA230A & WCA280A Option 27 User Manual
Page 89

Symbol Table
Marker readout
Uplink Analysis in the Demod Mode
The symbol table is displayed when you select Symbol Table in the Measure menu,
as shown in Figure 2-37.
Symbol number
Figure 2-37: Symbol table
View: Scale Menu
Use the following controls to scale the view:
Radix.
Selects the radix for displaying the table:
Hex. Hexadecimal digit
Oct. Octal digit
Bin. Default. Binary digit
Hex and Oct indicate values of binary data string in units of modulation symbol.
NOTE.
The BPSK modulation signal contains one-bit data in a symbol, so the
symbol table has the same values for all the radices.
Rotate.
Sets the start position. Range: 0 to 3.
WCA230A & WCA280A Option 27 User Manual
2-69
Page 90

Uplink Analysis in the Demod Mode
Modulation Accuracy
The constellation of all channels before the de-spread is displayed when you select
Modulation Accuracy in the Measure menu.
When you press the VIEW: SELECT key on the front panel to select the
constellation view, the measurement results for the time slot are displayed instead
of the overview, as shown in Figure 2-38.
Measurement results
■
PCDE (Peak Code Domain Error)
@ channel
■
EVM (RMS and peak)
■
Magnitude error (RMS and peak)
■
Phase error (RMS and peak)
■
Waveform quality (ρ)
■
Frequency error
■
Origin offset (IQ feedthrough)
Marker readout
Time at the marker position
(relative to the end of data acquisition)
Slot number
in the radio frame
Constellation view
Figure 2-38: Modulation accuracy
The view settings are the same as for Symbol Constellation.
Refer to Symbol Constellation on page 2-65.
2-70
WCA230A & WCA280A Option 27 User Manual
Page 91

ACK/NACK Analysis
Uplink Analysis in the Demod Mode
The ACK/NACK analysis detects and displays the arrival of ACK and NACK
indications, DTX (Discontinuous Transmission), and CQI (Channel Quality
Indicator) from the UE (User Equipment). Also, measures the power versus time
against a mask and display other contents of the indications.
Figure 2-39 shows an example of the ACK/NACK analysis measurement display.
Time slot table
(From the left)
Index: Time slot index
TS: Time slot number
ACK: ACK/NACK/DTX detected in this time slot
CQI: CQI detected in this time slot
(the number defined in 3GPP-R5)
Offset:Subframe to time-slot offset
(refer to
Subframe to TS Offset
on page 2-50)
Symbol table
Yellow text: ACK/NACK
Blue text: CQI
xxx...: DTX
Figure 2-39: ACK/NACK
When the TS index is changed to a time slot that does not contain the beginning of
an HS-DPCCH subframe, the symbol table text is all white. When an ACK or
NACK time slot is selected, the symbol table text color changes to show the
position of the ACK/NACK symbols (yellow) and the CQI symbols (blue).
WCA230A & WCA280A Option 27 User Manual
2-71
Page 92

Uplink Analysis in the Demod Mode
2-72
WCA230A & WCA280A Option 27 User Manual
Page 93

Syntax and Commands
Page 94

Page 95

Command Groups
This section lists the commands added in Option 27 in two ways. It first presents
them by functional groups. It then lists them alphabetically. The functional group
list starts below. The alphabetical list provides more detail on each command and
starts on page 3-9.
For details on the standard analyzer commands, refer to the WCA230A and
WCA280A Programmer Manual (Tektronix part number 071-1255-xx).
NOTE.
Version 1999.0. However, all commands for the WCA230A/WCA280A Option 27
are not defined in the standard.
Items followed by question marks are queries; items without question marks are
commands. Some items in this section have a question mark in parentheses(?) in
the command header section; this indicates that the item can be both a command
and a query.
Each command may be available or unavailable, depending on the current
measurement mode. The Measurement Modes in each command description shows
the measurement mode in which the command is available. To set the measurement
mode, use the :INSTrument[:SELect] command (refer to the WCA230A and
WCA280A Programmer Manual) using one of the mnemonics listed below:
Table 3-1: Measurement modes added in Option 27
The GPIB commands for the WCA200 Series analyzer are based on SCPI
Mnemonic Meaning
SADLR5_3G 3GPP-R5 downlink spectrum analysis
SAULR5_3G 3GPP-R5 uplink spectrum analysis
DEMDLR5_3G 3GPP-R5 downlink modulation analysis
DEMULR5_3G 3GPP-R5 uplink modulation analysis
WCA230A & WCA280A Option 27 User Manual
3-1
Page 96

Command Groups
Functional Groups
The commands added in Option 27 are divided into the groups listed below.
Table 3-2: List of command groups
Command group Function
:CONFigure Configure the analyzer for each measurement session.
:DISPlay Control how to show waveform and measurement result on the screen.
:FETCh Retrieve the measurements from the data last acquired.
:MMEMory Control file saving/loading to/from the hard disk or floppy disk.
:READ Obtain the measurement results with acquiring data.
:SENSe Set up detailed conditions for each measurement.
The following sections list the commands by group.
NOTE.
Throughout the header descriptions in this section, the word Standard in
italics is substituted for either of the following two measurement standards:
SADLR5_3GPP (3GPP-R5 downlink spectrum analysis) or SAULR5_3GPP
(3GPP-R5 uplink spectrum analysis).
:CONFigure Commands
Set up the analyzer in order to perform the specified measurement.
Table 3-3: :CONFigure commands
Header Description
:CONFigure:DLR5_3GPP Sets the analyzer for the modulation analysis in 3GPP-R5 downlink.
:CONFigure:
:CONFigure:
:CONFigure:
:CONFigure:
:CONFigure:SADLR5_3GPP:MCAClr Sets the analyzer to the multi-carrier ACLR measurement default settings.
:CONFigure:
:CONFigure:
:CONFigure:ULR5_3GPP Sets the analyzer for the modulation analysis in 3GPP-R5 uplink.
Standard
Standard
Standard
Standard
Standard
Standard
:ACLR Sets the analyzer to the ACLR measurement default settings.
:CFRequency Sets the analyzer to the carrier frequency measurement default settings.
:CHPower Sets the analyzer to the channel power measurement default settings.
:EBWidth Sets the analyzer to the EBW measurement default settings.
:OBWidth Sets the analyzer to the OBW measurement default settings.
:SEMask Sets the analyzer to the spectrum emission mask test default settings.
3-2
WCA230A & WCA280A Option 27 User Manual
Page 97

Command Groups
:DISPlay Commands
Control how to show measurement data on the screen.
Table 3-4: :DISPlay commands
Header Description
:DISPlay:DLR5_3GPP subgroup
:DISPlay:DLR5_3GPP:AVIew:CCODe(?) Sets the channelization code to position the marker.
:DISPlay:DLR5_3GPP:AVIew:MSLot:HEAD(?) Sets the number of the head of the time slot to be displayed.
:DISPlay:DLR5_3GPP:AVIew:MSLot[:STATe](?) Determines whether to display the multiple or the single slot.
:DISPlay:DLR5_3GPP:AVIew:SHORtcode(?) Selects the short code to display.
:DISPlay:DLR5_3GPP:AVIew:SRATe(?) Selects the symbol rate for downlink analysis.
:DISPlay:DLR5_3GPP:AVIew:SSCHpart(?) Determines whether to show SCH.
:DISPlay:DLR5_3GPP:AVIew:TSLot(?) Selects the time slot to display.
:DISPlay:DLR5_3GPP:MVIew|:SVIew:COLor[:SCALe]:OFFSet(?) Sets the minimum color-axis value (bottom end) in the main view.
:DISPlay:DLR5_3GPP:MVIew|:SVIew:COLor[:SCALe]:RANGe(?) Sets the color-axis full scale in the main view.
:DISPlay:DLR5_3GPP:MVIew|:SVIew:FORMat(?) Selects the main view display format.
:DISPlay:DLR5_3GPP:MVIew|:SVIew:RADix(?) Selects the base of symbols in the main view.
:DISPlay:DLR5_3GPP:MVIew|:SVIew:X[:SCALe]:OFFSet(?) Sets the minimum horizontal value (left end) in the main view.
:DISPlay:DLR5_3GPP:MVIew|:SVIew:X[:SCALe]:RANGe(?) Sets the horizontal full scale in the main view.
:DISPlay:DLR5_3GPP:MVIew|:SVIew:Y[:SCALe]:FIT Runs auto-scale on the main view.
:DISPlay:DLR5_3GPP:MVIew|:SVIew:Y[:SCALe]:FULL Sets the main view’s vertical axis to the default full scale.
:DISPlay:DLR5_3GPP:MVIew|:SVIew:Y[:SCALe]:OFFSet(?) Sets the minimum vertical value (bottom end) in the main view.
:DISPlay:DLR5_3GPP:MVIew|:SVIew:Y[:SCALe]:PUNit(?) Selects the unit for the main view’s vertical axis.
:DISPlay:DLR5_3GPP:MVIew|:SVIew:Y[:SCALe]:RANGe(?) Sets the vertical full scale in the main view.
:DISPlay:
:DISPlay:
:DISPlay:
:DISPlay:
:DISPlay:
:DISPlay:
:DISPlay:
:DISPlay:ULR5_3GPP subgroup Related to modulation analysis for 3GPP-R5 uplink
:DISPlay:ULR5_3GPP:AVIew:CNUMber(?) Sets the channelization code to position the marker.
:DISPlay:ULR5_3GPP:AVIew:SRATe(?) Selects the symbol rate for uplink analysis.
:DISPlay:ULR5_3GPP:AVIew:TSLot(?) Selects the time slot to display.
:DISPlay:ULR5_3GPP:MVIew|:SVIew:COLor[:SCALe]:OFFSet(?) Sets the minimum color-axis value (bottom end) in the subview.
:DISPlay:ULR5_3GPP:MVIew|:SVIew:COLor[:SCALe]:RANGe(?) Sets the color-axis full scale in the subview.
:DISPlay:ULR5_3GPP:MVIew|:SVIew:FORMat(?) Selects the subview display format.
:DISPlay:ULR5_3GPP:MVIew|:SVIew:RADix(?) Selects the base of symbols in the subview.
:DISPlay:ULR5_3GPP:MVIew|:SVIew:X[:SCALe]:OFFSet(?) Sets the minimum horizontal value (left end) in the subview.
:DISPlay:ULR5_3GPP:MVIew|:SVIew:X[:SCALe]:RANGe(?) Sets the horizontal full scale in the subview.
Standard
Standard
Standard
Standard
Standard
Standard
Standard
subgroup Related to spectrum analysis for 3GPP-R5 downlink
:SPECtrum:X[:SCALe]:OFFSet(?) Sets the minimum horizontal value (left end).
:SPECtrum:X[:SCALe]:PDIVision(?) Defines the display area along the horizontal axis.
:SPECtrum:Y[:SCALe]:FIT Runs auto-scale.
:SPECtrum:Y[:SCALe]:FULL Sets the vertical axis to the default full scale.
:SPECtrum:Y[:SCALe]:OFFSet(?) Sets the minimum vertical value (bottom end).
:SPECtrum:Y[:SCALe]:PDIVision(?) Sets the vertical full scale.
Related to modulation analysis for 3GPP-R5 downlink
WCA230A & WCA280A Option 27 User Manual
3-3
Page 98

Command Groups
Table 3-4: :DISPlay commands (cont.)
Header Description
:DISPlay:ULR5_3GPP:MVIew|:SVIew:Y[:SCALe]:FIT Runs auto-scale on the subview.
:DISPlay:ULR5_3GPP:MVIew|:SVIew:Y[:SCALe]:FULL Sets the subview’s vertical axis to the default full scale.
:DISPlay:ULR5_3GPP:MVIew|:SVIew:Y[:SCALe]:OFFSet(?) Sets the minimum vertical value (bottom end) in the subview.
:DISPlay:ULR5_3GPP:MVIew|:SVIew:Y[:SCALe]:PUNit(?) Selects the unit for the subview’s vertical axis.
:DISPlay:ULR5_3GPP:MVIew|:SVIew:Y[:SCALe]:RANGe(?) Sets the vertical full scale in the subview.
:FETCh Commands
The :FETCh commands retrieve the measurements from the data taken by the latest
INITiate command.
If you want to perform a FETCh operation on fresh data, use the :READ
commands, which acquire a new input signal and fetch the measurement results
from that data.
Table 3-5: :FETCh commands
Header Description
:FETCh:DLR5_3GPP subgroup Related to modulation analysis for 3GPP-R5 downlink
:FETCh:DLR5_3GPP? Returns measurement results of the downlink modulation analysis.
:FETCh:
:FETCh:
:FETCh:
:FETCh:
:FETCh:
:FETCh:SADLR5_3GPP:MCAClr? Returns the multi-carrier ACLR measurement results.
:FETCh:
:FETCh:
:FETCh:
:FETCh:
:FETCh:
:FETCh:
:FETCh:SADLR5_3GPP:SPECtrum:MCAClr? Returns spectrum waveform data of the multi-carrier ACLR measurement.
:FETCh:
:FETCh:
:FETCh:ULR5_3GPP subgroup Related to modulation analysis for 3GPP-R5 uplink
:FETCh:ULR5_3GPP? Returns measurement results of the uplink modulation analysis.
Standard
Standard
Standard
Standard
Standard
Standard
Standard
Standard
Standard
Standard
Standard
Standard
Standard
subgroup 3GPP-R5 spectrum analysis related
:ACLR? Returns the ACLR measurement results.
:CFRequency? Returns the carrier frequency measurement results.
:CHPower? Returns the channel power measurement results.
:EBWidth? Returns the EBW measurement results.
:OBWidth? Returns the OBW measurement results.
:SEMask? Returns the spectrum emission mask measurement results.
:SPECtrum:ACLR? Returns spectrum waveform data of the ACLR measurement.
:SPECtrum:CFRequency? Returns spectrum waveform data of the carrier frequency measurement.
:SPECtrum:CHPower? Returns spectrum waveform data of the channel power measurement.
:SPECtrum:EBWidth? Returns spectrum waveform data of the EBW measurement.
:SPECtrum:OBWidth? Returns spectrum waveform data of the OBW measurement.
:SPECtrum:SEMask? Returns spectrum waveform data of the spectrum emission mask measurement.
3-4
WCA230A & WCA280A Option 27 User Manual
Page 99

:MMEMory Commands
Use these commands to manipulate files on the hard disk or floppy disk.
Table 3-6: :MMEMory commands
Header Description
:MMEMory:LOAD:LIMit Loads the limit from the specified file.
:MMEMory:STORe:LIMit Stores the limit in the specified file.
:MMEMory:STORe:STABle Stores the symbol table in the specified file.
:READ Commands
The :READ commands acquire an input signal once in the single mode and obtain
the measurement results from that data.
If you want to fetch the measurement results from the data currently residing in the
memory without acquiring the input signal, use the :FETCh commands.
Command Groups
Table 3-7: :READ commands
Header Description
:READ:
Standard
:READ:
Standard
:READ:
Standard
:READ:
Standard
:READ:SADLR5_3GPP:MCAClr? Returns the multi-carrier ACLR measurement results.
:READ:
Standard
:READ:
Standard
:READ:
Standard
:READ:
Standard
:READ:
Standard
Standard
:READ:
:READ:SADLR5_3GPP:SPECtrum:MCAClr? Returns spectrum waveform data of the multi-carrier ACLR measurement.
:READ:
Standard
:READ:
Standard
:ACLR? Returns the ACLR measurement results.
:CFRequency? Returns the carrier frequency measurement results.
:CHPower? Returns the channel power measurement results.
:EBWidth? Returns the EBW measurement results.
:OBWidth? Returns the OBW measurement results.
:SEMask? Returns the spectrum emission mask measurement results.
:SPECtrum:ACLR? Returns spectrum waveform data of the ACLR measurement.
:SPECtrum:CFRequency? Returns spectrum waveform data of the carrier frequency measurement.
:SPECtrum:CHPower? Returns spectrum waveform data of the channel power measurement.
:SPECtrum:EBWidth? Returns spectrum waveform data of the EBW measurement.
:SPECtrum:OBWidth? Returns spectrum waveform data of the OBW measurement.
:SPECtrum:SEMask? Returns spectrum waveform data of the spectrum emission mask measurement.
WCA230A & WCA280A Option 27 User Manual
3-5
Page 100

Command Groups
:SENSe Commands
Set the detailed measurement conditions.
Table 3-8: :SENSe commands
Header Description
[:SENSe]:DLR5_3GPP subgroup Related to the 3GPP-R5 modulation analysis.
[:SENSe]:DLR5_3GPP:BLOCk(?) Sets the number of the block to measure.
[:SENSe]:DLR5_3GPP:CARRier:OFFSet(?) Sets the carrier frequency offset.
[:SENSe]:DLR5_3GPP:CARRier:SEARch(?) Determines whether to detect the carrier automatically.
[:SENSe]:DLR5_3GPP:COMPosite(?) Determines whether to perform the composite analysis.
[:SENSe]:DLR5_3GPP:DTYPe:SEARch(?) Determines whether to detect the demodulation type of the code channel.
[:SENSe]:DLR5_3GPP:EVM:IQOoffset(?) Determines whether to include the I/Q origin offset in the analysis.
[:SENSe]:DLR5_3GPP:FILTer:ALPHa(?) Sets the filter factor.
[:SENSe]:DLR5_3GPP:FILTer:MEASurement(?) Selects the measurement filter.
[:SENSe]:DLR5_3GPP:FILTer:REFerence(?) Selects the reference filter.
[:SENSe]:DLR5_3GPP[:IMMediate] Runs the 3GPP-R5 downlink analysis calculation on the acquired data.
[:SENSe]:DLR5_3GPP:LENGth(?) Defines the analysis range.
[:SENSe]:DLR5_3GPP:OFFSet(?) Sets the measurement start position.
[:SENSe]:DLR5_3GPP:SCHPart(?) Determines whether to include the SCH part in the analysis.
[:SENSe]:DLR5_3GPP:SCODe:ALTernative(?) Selects the alternative scrambling code.
[:SENSe]:DLR5_3GPP:SCODe:NUMBer(?) Sets the scrambling code.
[:SENSe]:DLR5_3GPP:SCODe:SEARch(?) Determines whether to enable automatic detection of the scrambling code.
[:SENSe]:
[:SENSe]:
[:SENSe]:
[:SENSe]:
[:SENSe]:
[:SENSe]:
[:SENSe]:
[:SENSe]:
[:SENSe]:
:INTegration(?)
[:SENSe]:
[:SENSe]:
[:SENSe]:
[:SENSe]:
[:SENSe]:
Standard
Standard
Standard
Standard
Standard
Standard
Standard
Standard
Standard
Standard
Standard
Standard
Standard
Standard
:ACLR subgroup Related to the ACLR measurement.
:ACLR:FILTer:COEFficient (?) Sets the filter factor (α/BT).
:ACLR:FILTer:TYPE (?) Selects a filter.
:ACLR:SGAin (?) Sets or queries the gain offset for the second adjacent channel.
:ACLR:LIMit:ADJacent<x>[:STATe] (?) Determines whether to enable the adjacent limit testing.
:CFRequency subgroup Related to the carrier frequency measurement.
:CFRequency:CRESolution(?) Sets the counter resolution.
:CHPower subgroup Related to the channel power measurement.
:CHPower:BANDwidth|:BWIDth
:CHPower:FILTer:COEFficient(?) Sets the filter roll-off rate for the channel power measurement.
:CHPower:FILTer:TYPE(?) Selects the filter for the channel power measurement
:CHPower:LIMit[:STATe](?) Determines whether to enable the limit testing.
:EBWidth subgroup Related to the EBW measurement.
:EBWidth:XDB(?) Sets the relative power from the peak for the measurement.
Sets the channel bandwidth for the channel power measurement.
3-6
WCA230A & WCA280A Option 27 User Manual
 Loading...