

Page 1

User Manual
WCA230A & WCA280A Option 25
cdma2000 Analysis Software
071-1367-01
This document supports software version 1.00 and above.
www.tektronix.com
Page 2

Copyright © Tektronix, Inc. All rights reserved. Licensed software products are owned by Tektronix or its subsidiaries or
suppliers, and are protected by national copyright laws and international treaty provisions.
Tektronix products are covered by U.S. and foreign patents, issued and pending. Information in this publication supercedes
that in all previously published material. Specifications and price change privileges reserved.
TEKTRONIX and TEK are registered trademarks of Tektronix, Inc.
Contacting Tektronix
Tektronix, Inc.
14200 SW Karl Braun Drive
P.O. Box 500
Beaverton, OR 97077
USA
For product information, sales, service, and techni cal support:
H In North America, call 1-800-833-9200.
H Worldwide, visit www.tektronix.com to find contacts in your area.
Page 3

Warranty 2
Tektronix warrants that this product will be free from defects in materials and workmanship for a period of one (1)
year from the date of shipment. If any such product proves defective during this warranty period, Tektronix, at its
option, either will repair the defective product without charge for parts and labor, or will provide a replacement i n
exchange for the defective product. Parts, modules and replacement products used by Tektronix for warranty work
may be new or reconditioned to like new performance. All replaced parts, modules and products become the
property of Tektronix.
In order to obtain service under this warranty, Customer must notify Tektronix of the defect before the expiration
of the warranty period and make suitable arrangements for the performance of service. Customer shall be
responsible for packaging and shipping the defective product to t he servic e center designated by Tektronix, with
shipping charges prepaid. Tektronix shall pay for the return of the product to Customer if the shipment is to a
location within the country in which the Tektronix service center is located. Customer shall be responsible for
paying all shipping charges, duties, taxes, and any other charges for products returned to any other locations.
This warranty shall not apply to any defec t, failure or damage caused by improper use or improper or inadequate
maintenance and care. Tektronix shall not be obligated to furnish servic e under this warranty a) to repair damage
resulting from attempts by personnel other than Tektronix representatives to install, repair or service the product;
b) to repair damage resulting from improper use or connection to incompatible equipment; c) to repair any
damage or malfunction caused by the use of non-Tektronix supplies; or d) to service a product that has be en
modified or integrated with other products when the effect of such modification or integration increases the time
or difficulty of servicing the product.
THIS WARRANTY IS GIVEN BY TEKTRONIX WITH RESPECT TO THE PRODUCT IN LIEU OF ANY
OTHER WARRANTIES, EXPRESS OR IMPLIED. TEKTRONIX AND ITS VENDORS DISCLAIM ANY
IMPLIED WARRANTIES OF MERCHANTABILITY OR FITNESS FOR A P ARTICULAR PURPOSE.
TEKTRONIX’ RESPONSIBILITY TO REP AIR OR REPLACE DEFECTIVE PRODUCTS IS THE SOLE AND
EXCLUSIVE REMEDY PROVIDED TO THE CUSTOMER FOR BREACH OF THIS WARRANTY.
TEKTRONIX AND ITS VENDORS WILL NOT BE LIABLE FOR ANY INDIRECT, SPECIAL, INCIDENTAL,
OR CONSEQUENTIAL DAMAGES IRRESPECTIVE OF WHETHER TEKTRONIX OR THE VENDOR HAS
ADVANCE NOTICE OF THE POSSIBILITY OF SUCH DAMAGES.
Page 4

Page 5

Table of Contents
Getting Started
Operating Basics
Preface . . . . . . . . . . . . . . . . . . . . . . . . . . . . . . . . . . . . . . . . . . . . . . . . . . . . . . . vii
About This Manual . . . . . . . . . . . . . . . . . . . . . . . . . . . . . . . . . . . . . . . . . . . . . . . . . . . . vii
Related Manuals. . . . . . . . . . . . . . . . . . . . . . . . . . . . . . . . . . . . . . . . . . . . . . . . . . . . . . . vii
Getting Started . . . . . . . . . . . . . . . . . . . . . . . . . . . . . . . . . . . . . . . . . . . . . . . 1-1
Product Description . . . . . . . . . . . . . . . . . . . . . . . . . . . . . . . . . . . . . . . . . . . . . . . . . . . 1-1
Functional Overview . . . . . . . . . . . . . . . . . . . . . . . . . . . . . . . . . . . . . . . . . . 2-1
cdma2000 Forward Link Measurements . . . . . . . . . . . . . . . . . . . . . . . . . . 2-3
Modulation Accuracy Measurement . . . . . . . . . . . . . . . . . . . . . . . . . . . . . . . . . . . . . . 2-4
Code Domain Power Measurement . . . . . . . . . . . . . . . . . . . . . . . . . . . . . . . . . . . . . . 2-13
Channel Power Measurement . . . . . . . . . . . . . . . . . . . . . . . . . . . . . . . . . . . . . . . . . . 2-23
OBW Measurement . . . . . . . . . . . . . . . . . . . . . . . . . . . . . . . . . . . . . . . . . . . . . . . . . . 2-24
ACPR Measurement . . . . . . . . . . . . . . . . . . . . . . . . . . . . . . . . . . . . . . . . . . . . . . . . . 2-25
Spectrum Emission Mask Measurement . . . . . . . . . . . . . . . . . . . . . . . . . . . . . . . . . . 2-26
Intermodulation Measurement . . . . . . . . . . . . . . . . . . . . . . . . . . . . . . . . . . . . . . . . . . 2-28
CCDF Measurement . . . . . . . . . . . . . . . . . . . . . . . . . . . . . . . . . . . . . . . . . . . . . . . . . 2-30
Pilot to Code Channel Measurement . . . . . . . . . . . . . . . . . . . . . . . . . . . . . . . . . . . . . 2-33
cdma2000 Reverse Link Measurements . . . . . . . . . . . . . . . . . . . . . . . . . . 2-37
Modulation Accuracy Measurement . . . . . . . . . . . . . . . . . . . . . . . . . . . . . . . . . . . . . 2-38
Code Domain Power Measurement . . . . . . . . . . . . . . . . . . . . . . . . . . . . . . . . . . . . . . 2-47
Pilot to Code Channel Measurement . . . . . . . . . . . . . . . . . . . . . . . . . . . . . . . . . . . . . 2-51
Gated Output Power Measurement . . . . . . . . . . . . . . . . . . . . . . . . . . . . . . . . . . . . . . 2-55
Editing the Measurement Limits . . . . . . . . . . . . . . . . . . . . . . . . . . . . . . . . 2-57
Using the Measurement Limits Editor . . . . . . . . . . . . . . . . . . . . . . . . . . . . . . . . . . . . 2-57
Saving and Loading Measurement Limits . . . . . . . . . . . . . . . . . . . . . . . . . . . . . . . . . 2-66
Measurement Limit Defaults . . . . . . . . . . . . . . . . . . . . . . . . . . . . . . . . . . . . . . . . . . . 2-67
Syntax and Commands
Command Groups . . . . . . . . . . . . . . . . . . . . . . . . . . . . . . . . . . . . . . . . . . . . 3-1
:CONFigure Commands . . . . . . . . . . . . . . . . . . . . . . . . . . . . . . . . . . . . . . . . . . . . . . . 3-2
:DISPlay Commands . . . . . . . . . . . . . . . . . . . . . . . . . . . . . . . . . . . . . . . . . . . . . . . . . . 3-2
:FETCh Commands . . . . . . . . . . . . . . . . . . . . . . . . . . . . . . . . . . . . . . . . . . . . . . . . . . . 3-4
:MMEMory Commands. . . . . . . . . . . . . . . . . . . . . . . . . . . . . . . . . . . . . . . . . . . . . . . . 3-5
:READ Commands . . . . . . . . . . . . . . . . . . . . . . . . . . . . . . . . . . . . . . . . . . . . . . . . . . . 3-5
:SENSe Commands . . . . . . . . . . . . . . . . . . . . . . . . . . . . . . . . . . . . . . . . . . . . . . . . . . . 3-6
WCA230A & WCA280A Option 25 cdma2000 Analysis Software User Manual i
Page 6

Table of Contents
Appendices
:CONFigure Commands . . . . . . . . . . . . . . . . . . . . . . . . . . . . . . . . . . . . . . . 3-11
:DISPlay Commands . . . . . . . . . . . . . . . . . . . . . . . . . . . . . . . . . . . . . . . . . . 3-17
:FETCh Commands . . . . . . . . . . . . . . . . . . . . . . . . . . . . . . . . . . . . . . . . . . 3-43
:MMEMory Commands . . . . . . . . . . . . . . . . . . . . . . . . . . . . . . . . . . . . . . . 3-61
:READ Commands . . . . . . . . . . . . . . . . . . . . . . . . . . . . . . . . . . . . . . . . . . . 3-63
:SENSe Commands . . . . . . . . . . . . . . . . . . . . . . . . . . . . . . . . . . . . . . . . . . . 3-75
Specifications . . . . . . . . . . . . . . . . . . . . . . . . . . . . . . . . . . . . . . . . . . . . . . . . . . . . . . A-1
Factory Default Settings . . . . . . . . . . . . . . . . . . . . . . . . . . . . . . . . . . . . . . . . . . . . . B-1
Setting Range . . . . . . . . . . . . . . . . . . . . . . . . . . . . . . . . . . . . . . . . . . . . . . . . . . . . . . C-1
SCPI Conformance Information . . . . . . . . . . . . . . . . . . . . . . . . . . . . . . . . . . . . . . . D-1
Index . . . . . . . . . . . . . . . . . . . . . . . . . . . . . . . . . . . . . . . . . . . . . . . . . . . . Index-1
ii WCA230A & WCA280A Option 25 cdma2000 Analysis Software User Manual
Page 7

List of Figures
List of Figures
Figure 2-1: Menu diagram showing measurement functions available
in Option 25 . . . . . . . . . . . . . . . . . . . . . . . . . . . . . . . . . . . . . . . . . . . . . . . 2-1
Figure 2-2: Modulation accuracy measurement . . . . . . . . . . . . . . . . . . . . 2-4
Figure 2-3: Modulation accuracy display . . . . . . . . . . . . . . . . . . . . . . . . . . 2-8
Figure 2-4: EVM display . . . . . . . . . . . . . . . . . . . . . . . . . . . . . . . . . . . . . . . 2-9
Figure 2-5: MagErr display . . . . . . . . . . . . . . . . . . . . . . . . . . . . . . . . . . . . 2-10
Figure 2-6: PhaseErr display . . . . . . . . . . . . . . . . . . . . . . . . . . . . . . . . . . . 2-11
Figure 2-7: Symbol table display . . . . . . . . . . . . . . . . . . . . . . . . . . . . . . . . 2-12
Figure 2-8: Code domain power measurement . . . . . . . . . . . . . . . . . . . . 2-13
Figure 2-9: Code domain power display . . . . . . . . . . . . . . . . . . . . . . . . . 2-17
Figure 2-10: Power codogram display . . . . . . . . . . . . . . . . . . . . . . . . . . . 2-19
Figure 2-11: IQ power graph display . . . . . . . . . . . . . . . . . . . . . . . . . . . . 2-21
Figure 2-12: Channel power measurement . . . . . . . . . . . . . . . . . . . . . . . 2-23
Figure 2-13: OBW measurement . . . . . . . . . . . . . . . . . . . . . . . . . . . . . . . 2-24
Figure 2-14: ACPR measurement . . . . . . . . . . . . . . . . . . . . . . . . . . . . . . . 2-25
Figure 2-15: Spectrum emission mask measurement . . . . . . . . . . . . . . . 2-26
Figure 2-16: Intermodulation measurement . . . . . . . . . . . . . . . . . . . . . . 2-28
Figure 2-17: CCDF measurement (single view) . . . . . . . . . . . . . . . . . . . . 2-30
Figure 2-18: Scale settings in the CCDF display . . . . . . . . . . . . . . . . . . . 2-32
Figure 2-19: Pilot to code channel measurement . . . . . . . . . . . . . . . . . . . 2-33
Figure 2-20: Modulation accuracy measurement-reverse link . . . . . . . 2-38
Figure 2-21: Modulation accuracy display-reverse link . . . . . . . . . . . . . 2-42
Figure 2-22: EVM display-reverse link . . . . . . . . . . . . . . . . . . . . . . . . . . 2-43
Figure 2-23: MagErr display-reverse link . . . . . . . . . . . . . . . . . . . . . . . . 2-44
Figure 2-24: PhaseErr display-reverse link . . . . . . . . . . . . . . . . . . . . . . . 2-45
Figure 2-25: Symbol table display-reverse link . . . . . . . . . . . . . . . . . . . . 2-46
Figure 2-26: Code domain power measurement-reverse link . . . . . . . . 2-47
Figure 2-27: Pilot to code channel measurement-reverse link . . . . . . . . 2-51
Figure 2-28: Gated output power measurement . . . . . . . . . . . . . . . . . . . 2-55
Figure 2-29: Measurement limits editor . . . . . . . . . . . . . . . . . . . . . . . . . . 2-57
Figure 2-30: ACPR measurement limits editor . . . . . . . . . . . . . . . . . . . . 2-60
Figure 2-31: Spectrum emission mask measurement limits editor . . . . 2-62
Figure 2-32: Gated output power measurement limits editor . . . . . . . . 2-64
WCA230A & WCA280A Option 25 cdma2000 Analysis Software User Manual iii
Page 8

List of Tables
List of Tables
Table 2-1: Measurement limits items . . . . . . . . . . . . . . . . . . . . . . . . . . . . 2-58
Table 2-2: Measurement limit items for the ACPR measurement . . . . . 2-60
Table 2-3: Measurement limit items for the spectrum emission mask
measurement . . . . . . . . . . . . . . . . . . . . . . . . . . . . . . . . . . . . . . . . . . . . . . 2-62
Table 2-4: Measurement limit items for the gated output power
measurement . . . . . . . . . . . . . . . . . . . . . . . . . . . . . . . . . . . . . . . . . . . . . . 2-64
Table 2-5: Forward link common limits . . . . . . . . . . . . . . . . . . . . . . . . . . 2-67
Table 2-6: Reverse link common limits . . . . . . . . . . . . . . . . . . . . . . . . . . . 2-67
Table 2-7: Forward link: all band classes . . . . . . . . . . . . . . . . . . . . . . . . . 2-68
Table 2-8: Reverse link: all band classes . . . . . . . . . . . . . . . . . . . . . . . . . 2-68
Table 2-9: Forward link: BC (band class) 0, 2, 3, 5, and 9 . . . . . . . . . . . 2-69
Table 2-10: Forward link: BC (band class) 1, 4, and 8 . . . . . . . . . . . . . . 2-69
Table 2-11: Forward link: BC (band class) 3b . . . . . . . . . . . . . . . . . . . . . 2-70
Table 2-12: Forward link: BC (band class) 6 . . . . . . . . . . . . . . . . . . . . . . 2-70
Table 2-13: Forward link: BC (band class) 7 . . . . . . . . . . . . . . . . . . . . . . 2-71
Table 2-14: Reverse link: BC (band class) 0, 2, 3, 5, and 9 . . . . . . . . . . . 2-71
Table 2-15: Reverse link: BC (band class) 1, 4, and 8 . . . . . . . . . . . . . . . 2-72
Table 2-16: Reverse link: BC (band class) 6 . . . . . . . . . . . . . . . . . . . . . . . 2-72
Table 2-17: Reverse link: BC (band class) 7 . . . . . . . . . . . . . . . . . . . . . . . 2-73
Table 2-18: Forward and reverse link: BC (band class) 0, 1, 2, 3, 4, 5,
7, 8, and 9 . . . . . . . . . . . . . . . . . . . . . . . . . . . . . . . . . . . . . . . . . . . . . . . . 2-73
Table 2-19: Forward link: BC (band class) 6 . . . . . . . . . . . . . . . . . . . . . . 2-74
Table 2-20: Reverse link: BC (band class) 6 . . . . . . . . . . . . . . . . . . . . . . . 2-74
Table 2-21: Reverse link: all band classes . . . . . . . . . . . . . . . . . . . . . . . . 2-75
Table 3-1: Measurement modes . . . . . . . . . . . . . . . . . . . . . . . . . . . . . . . . . . 3-1
Table 3-2: :CONFigure commands . . . . . . . . . . . . . . . . . . . . . . . . . . . . . . . 3-2
Table 3-3: :DISPlay commands . . . . . . . . . . . . . . . . . . . . . . . . . . . . . . . . . . 3-2
Table 3-4: :FETCh commands . . . . . . . . . . . . . . . . . . . . . . . . . . . . . . . . . . . 3-4
Table 3-5: :MMEMory commands . . . . . . . . . . . . . . . . . . . . . . . . . . . . . . . 3-5
Table 3-6: :READ commands . . . . . . . . . . . . . . . . . . . . . . . . . . . . . . . . . . . 3-5
Table 3-7: :SENSe commands . . . . . . . . . . . . . . . . . . . . . . . . . . . . . . . . . . . 3-6
Table 3-8: :DISPlay command subgroups . . . . . . . . . . . . . . . . . . . . . . . . 3-17
Table 3-17: :SENSe command subgroups . . . . . . . . . . . . . . . . . . . . . . . . 3-75
iv WCA230A & WCA280A Option 25 cdma2000 Analysis Software User Manual
Page 9

List of Tables
Table A-1: cdma2000 forward link . . . . . . . . . . . . . . . . . . . . . . . . . . . . . . . A-1
Table A-2: cdma2000 reverse link . . . . . . . . . . . . . . . . . . . . . . . . . . . . . . . A-2
Table B-1: Factory default settings-:DISPlay commands . . . . . . . . . . . . B-1
Table B-2: Factory default settings-:SENSe commands . . . . . . . . . . . . . . B-2
Table C-1: Display format and scale . . . . . . . . . . . . . . . . . . . . . . . . . . . . . C-1
Table D-1: SCPI conformance information-:CONFigure commands . . . D-1
Table D-2: SCPI conformance information-:DISPlay commands . . . . . . D-1
Table D-3: SCPI conformance information-:FETCh commands . . . . . . D-3
Table D-4: SCPI conformance information-:MMEMory commands . . . D-3
Table D-5: SCPI conformance information-:READ commands . . . . . . . D-4
Table D-6: SCPI conformance information-:SENSe commands . . . . . . . D-4
WCA230A & WCA280A Option 25 cdma2000 Analysis Software User Manual v
Page 10

List of Tables
vi WCA230A & WCA280A Option 25 cdma2000 Analysis Software User Manual
Page 11

Preface
About This Manual
This manual provides operating instructions for the WCA230A & WCA280A
Portable Wireless Communication Analyzers Option 25 cdma2000 analysis
software.
This manual is composed of the following sections:
Getting Started provides a product description.
Operating Basics describes the measurement functions added by the option
and explains how to set up the analyzer for each measurement mode.
Syntax and Commands lists all command subsystems and describes all
programming commands.
Appendices provides additional information including specifications, factory
default settings, and SCPI conformance information.
Related Manuals
The following related documents are also available:
The WCA230A & WCA280A Portable Wireless Communication Analyzers
User Manual (Tektronix part number 071-1253-xx) contains a tutorials that
describes how to operate the analyzer. It also includes an in-depth discussion
on how to more completely use the analyzer features.
The WCA230A & WCA280A Portable Wireless Communication Analyzers
Programmer Manual (Tektronix part number 071-1255-xx) contains an
alphabetical listing of the programming commands and other information
related to controlling the analyzer over the GPIB interface.
WCA230A & WCA280A Option 25 cdma2000 Analysis Software User Manual vii
Page 12

Preface
viii WCA230A & WCA280A Option 25 cdma2000 Analysis Software User Manual
Page 13

Getting Started
Page 14

Page 15

Getting Started
Product Description
This section provides an overview of the product capabilities.
The WCA230A & WCA280A Wireless Communication Analyzers Option 25 is an
analysis software option that adds transmitter measurements capability for
cdma2000 forward link (3GPP2 C.S0010) and reverse link (3GPP2 C.S0011) to
the analyzers.
You can perform the following cdma2000 measurements:
Modulation accuracy
Code domain power
Channel power
OBW (occupied bandwidth)
ACPR (Adjacent channel power ratio)
Spectrum emission mask
Gated output power (reverse link only)
Intermodulation
CCDF
Pilot to code channel
In addition, the option provides pre-defined measurement limits for the ACPR,
spectrum emission mask, and gated output power measurements. Using these
measurement limits, you can easily check that the input signal meets the
specification.
WCA230A/WCA280A Option 25 cdma2000 Analysis Software User Manual 1-1
Page 16

Getting Started
1-2 WCA230A/WCA280A Option 25 cdma2000 Analysis Software User Manual
Page 17

Operating Basics
Page 18

Page 19

Functional Overview
This section provides an overview of the Option 25 measurement functions.
Figure 2-1 shows the measurement functions and how to access each measurement
function from the front-panel menu key.
Other option name
(if installed)
MODE
S/A
DEMOD
TIME
DEMOD
menu
Analog Demod
Digital Demod
Standard...
Standard
menu
cdma2000-Fwd
cdma2000-Rev
Measurement functions
added by Option 25
Modulation Accuracy
Code Domain Power
Channel Power
MEASURE
menu
MEASURE
menu
OBW
ACPR
Spectrum Emission Mask
Intermodulation
CCDF
Pilot to Code Channel
Modulation Accuracy
Code Domain Power
Channel Power
OBW
ACPR
Spectrum Emission Mask
Gated Output Power
Intermodulation
CCDF
Pilot to Code Channel
Figure 2-1: Menu diagram showing measurement functions available in Option 25
WCA230A & WCA280A Option 25 cdma2000 Analysis Software User Manual 2-1
Page 20

Functional Overview
Accessing a Measurement
Function
All of the measurement functions available in Option 25 can be selected from the
DEMOD (demodulation) mode.
Perform the following procedure to access any of the measurement functions:
1. Press the DEMOD menu key to open the DEMOD menu.
2. Press the Standard... side key to open the Standard menu.
3. Press the cdma2000-Fwd or cdma2000-Rev side key to open the MEASURE
menu for the standard.
4. Press one of the side keys to select the measurement that you want to perform.
If the desired measurement is not displayed on the current MEASURE menu,
press the Go to page 2 (of 2) side key to open the next page.
5. If needed, set frequency, span, and amplitude of the input signal.
Refer to the WCA230A & WCA280A Portable Wireless Communication
Analyzers User Manual for information on how to set frequency, span, and
amplitude.
2-2 WCA230A & WCA280A Option 25 cdma2000 Analysis Software User Manual
Page 21

cdma2000 Forward Link Measurements
This section describes the functions and features of the cdma2000 forward link
measurements. Each measurement description contains general information about
the measurement, descriptions of the measurement displays and functions available
through menu selections.
The information is divided into the following subsections:
Modulation accuracy measurement
Code domain power measurement
Channel power measurement
OBW measurement
ACPR measurement
Spectrum emission mask measurement
Intermodulation measurement
CCDF measurement
Pilot to code channel measurement
NOTE. If you are not familiar with the operation of the WCA230A/WCA280A, refer
to the WCA230A & WCA280A Portable Wireless Communication Analyzers User
Manual before reading this section.
WCA230A & WCA280A Option 25 cdma2000 Analysis Software User Manual 2-3
Page 22

cdma2000 Forward Link Measurements
Modulation Accuracy Measurement
The modulation accuracy measurement measures Rho (ratio of the correlated
power to the total power), EVM (Error Vector Magnitude), magnitude error, phase
error, frequency error, and origin offset. Figure 2-2 shows an example of the
modulation accuracy measurement.
Figure 2-2: Modulation accuracy measurement
2-4 WCA230A & WCA280A Option 25 cdma2000 Analysis Software User Manual
Page 23

cdma2000 Forward Link Measurements
Display Elements
Setting the Timing
Parameters
The following information is shown in the modulation accuracy measurement
display:
Overview: This view can contain power versus time or spectrogram.
Subview: This view can contain spectrum, EVM, magnitude error, phase
error, IQ power graph, and constellation.
Main view: This view can contain modulation accuracy, EVM, magnitude
error, phase error, and symbol table.
The display contents in each view can be changed using the VIEW DEFINE menu.
Refer to Changing the View Contents on page 2-7 for more information about the
VIEW DEFINE menu.
You can set the following timing parameters using the TIMING menu. Press the
TIMING key to open the TIMING menu.
Acquisition Length (chips): Sets the acquisition length in chips. The range
depends on the acquisition memory size and the span setting.
Acquisition Length (s): Displays the acquisition length in seconds.
Acquisition History: Specifies the number of the block to display and
analyze. The latest block is number zero. Older blocks have larger negative
numbers.
Analysis Interval: Sets the analysis interval in chips. The range depends on
the acquisition length setting.
Analysis Offset: Sets the start point of the analysis with respect to the left end
of the acquisition length in chips.
Spectrum Length: Displays the time length for FFT processing of the
spectrum displayed in the subview. This value is equivalent to one frame
acquisition length.
Spectrum Offset: Sets the beginning of Spectrum Length with respect to the
left end of the acquisition length.
NOTE. Refer to the WCA230A & WCA280A Portable Wireless Communication
Analyzers User Manual for detailed information about the timing parameters.
WCA230A & WCA280A Option 25 cdma2000 Analysis Software User Manual 2-5
Page 24

cdma2000 Forward Link Measurements
Setting the Measurement
Parameters
You can set the following measurement parameters using the MEAS SETUP
menu. Press the MEAS SETUP key to open the MEAS SETUP menu.
Analyze: Performs analysis for the time slots in the analysis range.
Measurement Level: Selects the measurement level for the measurement.
You can select Chip (chip level) or Symbol (symbol level).
Radio Configuration...: Selects the radio configuration for the measurement.
You can select RC1/RC2 or RC3/RC4/RC5.
PN Offset: Sets the PN offset in units of 64 chips. You can set the value from
0 to 511.
Select PCG: Sets the PCG (power control group) for the measurement.
Select Code: Sets the code in the PCG for the measurement. This setting is
only available when Measurement Level is set to Symbol.
Limits...: Sets the pass/fail limits for the modulation accuracy measurement.
When pressing this side key, the measurement limits editor appears. Refer to
Editing the Measurement Limits on page 2-57 for more information.
Active Channel Threshold: Sets the active channel threshold level (in dB
from the pilot) used for deciding whether a code channel is active or inactive.
You can set the value from -50 dB to 50 dB.
IQ Swap: Sets whether to swap the I and Q data streams before demodulation.
Measurement Filter...: Selects the measurement filter to apply when
calculating EVM and other modulation accuracy results. You can select None,
cdma2000, or cdma2000+EQ (equalizer).
Walsh Code Length...: Selects the Walsh code length. You can select
Composite, 64, 32, 16, 8, 4, or 2. This setting is only available when
Measurement Level is set to Symbol and Radio Configuration is set to
RC3/RC4/RC5. When Radio Configuration is set to RC1/RC2, the Walsh code
length is fixed at 64 and cannot be changed by the user.
QOF: Sets the Walsh code quasi-orthogonal function. The choices are 0, 1, 2,
or 3. This setting is only available when Measurement Level is set to Symbol
and Radio Configuration is set to RC3/RC4/RC5.
2-6 WCA230A & WCA280A Option 25 cdma2000 Analysis Software User Manual
Page 25

cdma2000 Forward Link Measurements
Changing the View
Contents
You can change the view contents in the overview, subview, and main view using
the VIEW DEFINE menu. Press the DEFINE key to display the VIEW DEFINE
menu.
Show Views: Selects the view style on the screen. You can select Single or
Multi.
Overview Content...: Selects a view to display in the overview. You can
select Spectrogram or Waveform (power versus time).
Subview Content...: Selects a view to display in the subview:
Spectrum: Displays spectrum of the measured signal.
EVM: Displays changes of EVM (Error Vector Magnitude) over time.
MagErr: Displays changes of magnitude error over time.
PhaseErr: Displays changes of phase error over time.
IQ Power Graph: Displays the code domain power for each symbol.
Refer to IQ Power Graph Display on page 2-21.
Constellation: Displays the signal as an I-Q constellation.
Mainview Content...: Selects a view to display in the main view. You can
select Modulation Accuracy, EVM, MagErr, PhaseErr, or Symbol Table. Refer
to Scale and Format in the Main View on page 2-8 for more information about
the views.
Menu Off: Hides the side menu. To display the menu again, press the MENU
side key or VIEW:DEFINE key.
WCA230A & WCA280A Option 25 cdma2000 Analysis Software User Manual 2-7
Page 26

cdma2000 Forward Link Measurements
Scale and Format in the
Main View
This subsection describes the scale settings and display format in the main view.
Modulation Accuracy Display. When you select Mainview Content from the VIEW
DEFINE menu and then select Modulation Accuracy from the Mainview Content
submenu, an IQ rectangular graph and the measured value for Rho, peak code
domain error, rms and peak EVM, magnitude error, phase error, frequency error,
IQ origin offset, and Tau are displayed (see Figure 2-3). The peak code domain
error is displayed only when the Measurement Level menu item is set to Symbol,
and Tau is displayed only when an external trigger signal is applied.
IQ rectangular graph
(Vector display)
Figure 2-3: Modulation accuracy display
You can set the scale of the display using the VIEW SCALE menu. Press the
SCALE key to open the menu.
Measurement Content...: Selects vector or constellation display.
Ve ct or: Selects vector display. A signal represented with phase and amplitude
is displayed in rectangular (I and Q) coordinates. The red point indicates the
symbol position on the measured signal and the yellow trace indicates the locus
of the signal between symbols.
Constellation: Selects constellation display. It is the same as the vector
display, except that only symbols of the measured signal are indicated in red,
and the locus between symbols is not shown. The cross marks indicate symbol
positions of an ideal signal.
NOTE. I and Q signals are normalized to prevent the scale from changing when
signal attenuation changes.
2-8 WCA230A & WCA280A Option 25 cdma2000 Analysis Software User Manual
Page 27

cdma2000 Forward Link Measurements
EVM Display. When you select Mainview Content from the VIEW DEFINE menu
and then select EVM from the Mainview Content submenu, changes of EVM
(Error Vector Magnitude) over time are displayed for each chip or symbol (see
Figure 2-4).
Symbol number
Horizontal Start
Code length and channel number
Vertical Sca le
Vertical Start
Horizontal Scale
Figure 2-4: EVM display
You can set the scale of the display using the VIEW SCALE menu. Press the
SCALE key to open the menu.
Auto Scale: Sets the start value and the scale of the vertical axis to display the
entire waveform.
Horizontal Scale: Sets the scale of the horizontal axis (number of chips or
symbols).
Horizontal Start: Sets the chip number or symbol number of the first (left)
value of the horizontal axis.
Vertical Scale: Sets the scale of the vertical axis.
Vertical Start: Sets the minimum (bottom) value of the vertical axis.
Full Scale: Sets the scale of vertical axis to the default full-scale value.
Measurement Content...: Selects the display content in the main view. You
can select EVM, MagErr, or PhaseErr. This selection can also be made from
Mainview Content in the VIEW DEFINE menu.
WCA230A & WCA280A Option 25 cdma2000 Analysis Software User Manual 2-9
Page 28
cdma2000 Forward Link Measurements
MagErr Display. When you select Mainview Content from the VIEW DEFINE
menu and then select MagErr from the Mainview Content submenu, changes of
magnitude error over time are displayed for each chip or symbol (see
Figure 2-5).
Symbol number
Horizontal Start
Code length and channel number
Vertical Scale
Horizontal Scale
Figure 2-5: MagErr display
You can set the scale of the display using the VIEW SCALE menu. Press the
SCALE key to open the menu.
Auto Scale: Sets the start value and the scale of the vertical axis automatically
to display the entire waveform.
Horizontal Scale: Sets the scale of the horizontal axis (number of chips or
symbols).
Horizontal Start: Sets the chip number or symbol number of the first (left)
value of the horizontal axis.
Vertical Scale: Sets the scale of the vertical axis.
Vertical Offset: Sets the offset value of the vertical axis. You can set the value
from -200% to 200%.
Full Scale: Sets the scale of vertical axis to the default full-scale value.
Measurement Content...: Selects the display content in the main view. You
can select EVM, MagErr, or PhaseErr. This selection can also be made from
Mainview Content in the VIEW DEFINE menu.
2-10 WCA230A & WCA280A Option 25 cdma2000 Analysis Software User Manual
Page 29

cdma2000 Forward Link Measurements
PhaseErr Display. When you select Mainview Content from the VIEW DEFINE
menu and then select PhaseErr from the Mainview Content submenu, changes of
phase error over time are displayed for each chip or symbol (see Figure 2-6).
Symbol number
Horizontal Start
Code length and channel number
Vertical Scale
Horizontal Scale
Figure 2-6: PhaseErr display
You can set the scale of the display using the VIEW SCALE menu. Press the
SCALE key to open the menu.
Auto Scale: Sets the start value and the scale of the vertical axis automatically
to display the entire waveform.
Horizontal Scale: Sets the scale of the horizontal axis (number of chips or
symbols).
Horizontal Start: Sets the chip number or symbol number of the first (left)
value of the horizontal axis.
Vertical Scale: Sets the scale of the vertical axis.
Vertical Offset: Sets the offset value of the vertical axis. You can set the value
from -450 to 450 degrees.
Full Scale: Sets the scale of vertical axis to the default full-scale value.
Measurement Content...: Selects the display content in the main view. You
can select EVM, MagErr, or PhaseErr. This selection can also be made from
Mainview Content in the VIEW DEFINE menu.
WCA230A & WCA280A Option 25 cdma2000 Analysis Software User Manual 2-11
Page 30

cdma2000 Forward Link Measurements
Symbol Table Display. When you select Mainview Content from the VIEW
DEFINE menu and then select Symbol Table from the Mainview Content
submenu, the symbol table is displayed (see Figure 2-7). This display is only
available when the Measurement Level menu item is set to Symbol.
Symbol number
Code length and channel number
Figure 2-7: Symbol table display
You can set the radix for the display using the VIEW SCALE menu. Press the
SCALE key to open the menu.
Radix...: Sets the radix for displaying the table. You can select Hex
(hexadecimal), Oct (octal), or Bin (binary).
2-12 WCA230A & WCA280A Option 25 cdma2000 Analysis Software User Manual
Page 31
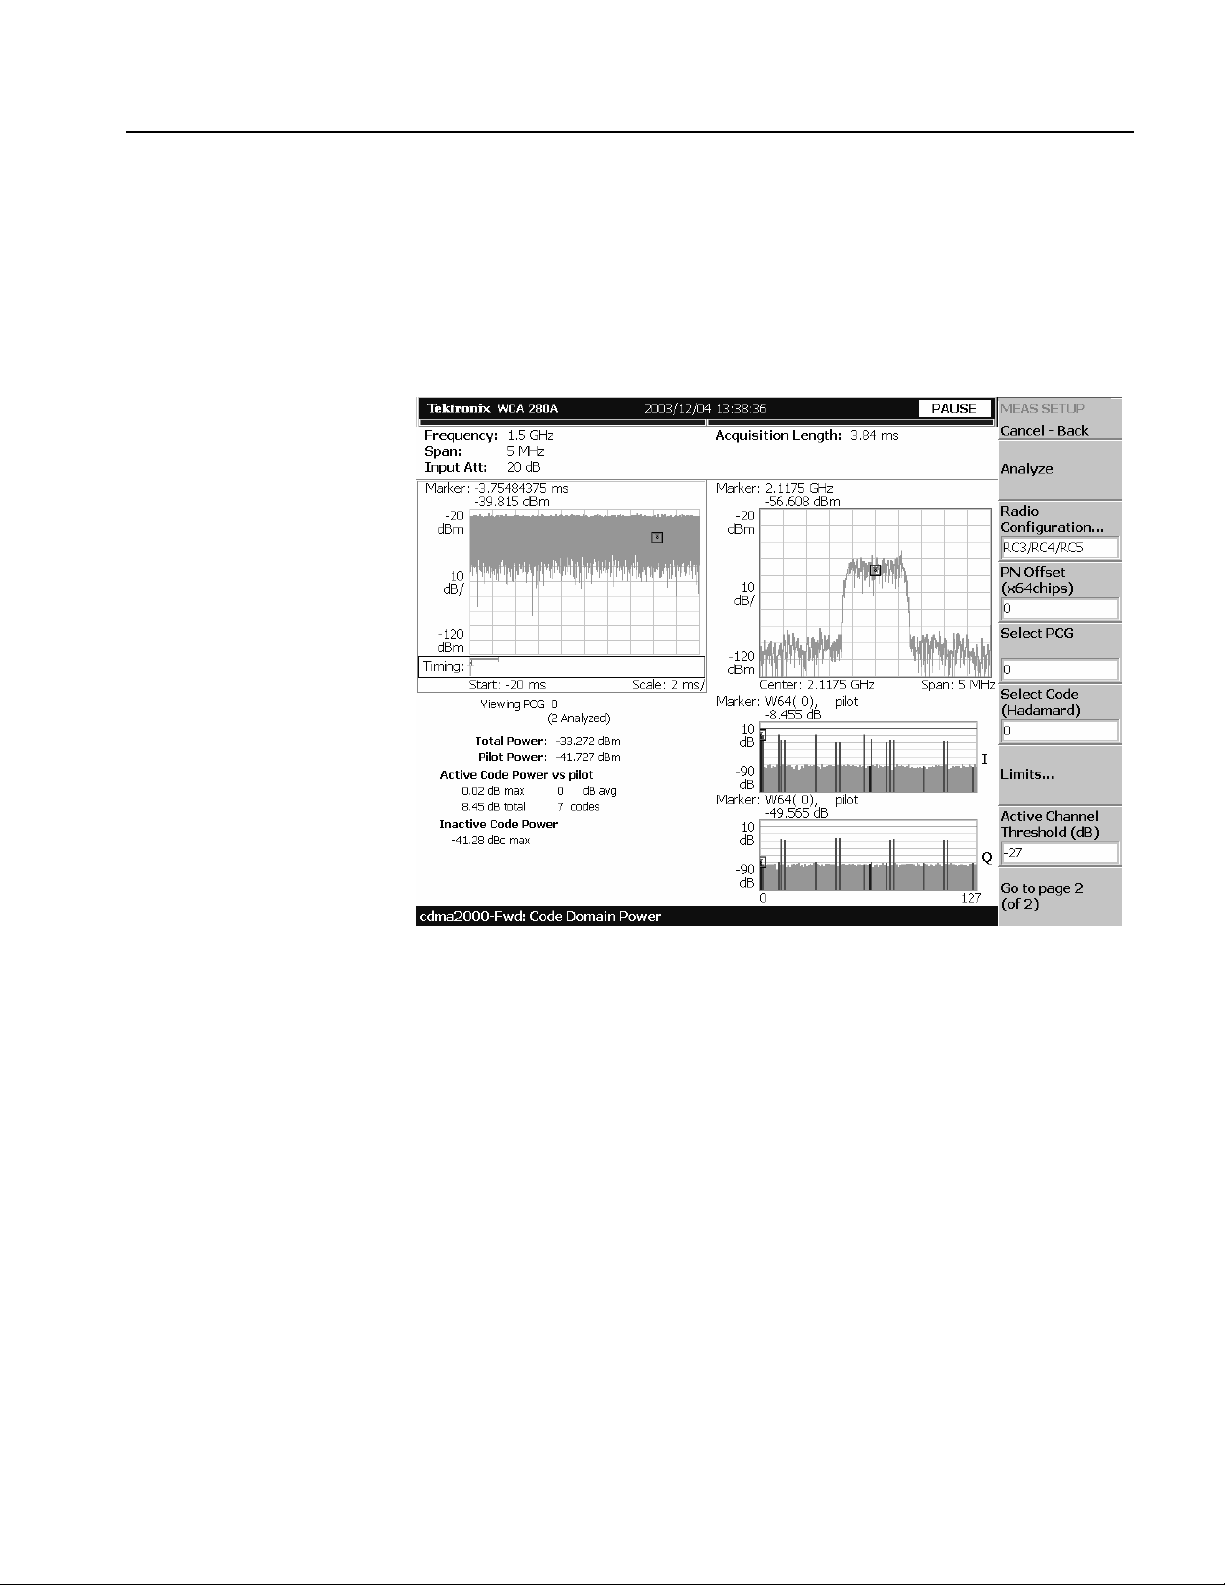
Code Domain Power Measurement
The code domain power measurement measures the distribution of signal power
across the set of code channels, normalized to the total signal power. This
measurement allows you to verify that each code channel is operating at its proper
level. Figure 2-8 shows an example of the code domain power measurement.
cdma2000 Forward Link Measurements
Figure 2-8: Code domain power measurement
WCA230A & WCA280A Option 25 cdma2000 Analysis Software User Manual 2-13
Page 32

cdma2000 Forward Link Measurements
Display Elements
Setting the Timing
Parameters
The following information is shown in the code domain power measurement
display:
Overview: This view can contain power versus time or spectrogram.
Subview: This view can contain spectrum, EVM, magnitude error, phase
error, IQ power graph, and constellation.
Main view: This view can contain code domain power, power codogram, and
IQ power graph. The view also lists the following measurement results:
Total power
Pilot power
Active code power versus pilot
Active/inactive code power
The display contents in each view can be changed using the VIEW DEFINE menu.
Refer to Changing the View Contents on page 2-16 for more information about the
VIEW DEFINE menu.
You can set the following timing parameters using the TIMING menu. Press the
TIMING key to open the TIMING menu.
Acquisition Length (chips): Sets the acquisition length in chips. The range
depends on the acquisition memory size and the span setting.
Acquisition Length (s): Displays the acquisition length in seconds.
Acquisition History: Specifies the number of the block to display and
analyze. The latest block is number zero. Older blocks have larger negative
numbers.
Analysis Interval: Sets the analysis interval in chips. The range depends on
the acquisition length setting.
Analysis Offset: Sets the start point of the analysis with respect to the left end
of the acquisition length in chips.
Spectrum Length: Displays the time length for FFT processing of the
spectrum displayed in the subview. This value is equivalent to one frame
acquisition length.
Spectrum Offset: Sets the beginning of Spectrum Length with respect to the
left end of the acquisition length.
NOTE. Refer to the WCA230A & WCA280A Portable Wireless Communication
Analyzers User Manual for detailed information about the timing parameters.
2-14 WCA230A & WCA280A Option 25 cdma2000 Analysis Software User Manual
Page 33

cdma2000 Forward Link Measurements
Setting the Measurement
Parameters
You can set the following measurement parameters using the MEAS SETUP
menu. Press the MEAS SETUP key to open the MEAS SETUP menu.
Analyze: Performs analysis for the time slots in the analysis range.
Measurement Level: Selects the measurement level for the measurement.
You can select Chip (chip level) or Symbol (symbol level). This setting is only
available when Mainview Content in the VIEW DEFINE menu is set to IQ
Power Graph.
Radio Configuration...: Selects the radio configuration for the measurement.
You can select RC1/RC2 or RC3/RC4/RC5.
PN Offset: Sets the PN offset in units of 64 chips. You can set the value from
0 to 511.
Select PCG: Sets the PCG (power control groups) for the measurement.
Select Code: Sets the code in the PCG for the measurement.
Limits...: Sets the pass/fail limits for the code domain power measurement.
When pressing this side key, the measurement limits editor appears. Refer to
Editing the Measurement Limits on page 2-57 for more information.
Active Channel Threshold: Sets the active channel threshold level (in dB
from the pilot) used for deciding whether a code channel is active or inactive.
You can set the value from -50 dB to 50 dB.
IQ Swap: Sets whether to swap the I and Q data streams before demodulation.
Measurement Filter...: Selects the measurement filter to apply when
calculating code domain power results. You can select None, cdma2000, or
cdma2000+EQ (equalizer).
Walsh Code Length...: Selects the Walsh code length. You can select
Composite, 64, 32, 16, 8, 4, or 2. This setting is only available when Radio
Configuration is set to RC3/RC4/RC5. When Radio Configuration is set to
RC1/RC2, the Walsh code length is fixed at 64 and cannot be changed by the
user.
QOF: Sets the Walsh code quasi-orthogonal function. The choices are 0, 1, 2,
or 3. This setting is only available when Radio Configuration is set to
RC3/RC4/RC5.
WCA230A & WCA280A Option 25 cdma2000 Analysis Software User Manual 2-15
Page 34

cdma2000 Forward Link Measurements
Changing the View
Contents
You can change the contents in the overview, subview, and main view using the
VIEW DEFINE menu. Press the DEFINE key to display the VIEW DEFINE
menu.
Show Views: Selects the view style on the screen. You can select Single or
Multi.
Overview Content...: Selects a view to display in the overview. You can
select Spectrogram or Waveform (power versus time).
Subview Content...: Selects a view to display in the subview:
Spectrum: Displays spectrum of the input signal.
EVM: Displays changes of EVM (Error Vector Magnitude) over time.
MagErr: Displays changes of magnitude error over time.
PhaseErr: Displays changes of phase error over time.
IQ Power Graph: Displays the code domain power for each symbol.
Refer to IQ Power Graph Display on page 2-21.
Constellation: Displays the signal as an I-Q constellation.
Mainview Content...: Selects a view to display in the main view. You can
select Code Domain Power, Power Codogram, or IQ Power Graph. Refer to
Scale and Format in the Main View on page 2-17 for more information about
the views.
Code Order...: Sets the way that code channels are arranged on the display.
You can select Hadamard or BitReverse.
Menu Off: Hides the side menu. To display the menu again, press the MENU
side key or VIEW:DEFINE key.
2-16 WCA230A & WCA280A Option 25 cdma2000 Analysis Software User Manual
Page 35

cdma2000 Forward Link Measurements
Scale and Format in the
Main View
Code length and channel number
Marker readout
Vertical Stop
This subsection describes the scale settings and display format in the main view.
Code Domain Power Display. When you select Mainview Content from the VIEW
DEFINE menu and then select Code Domain Power from the Mainview Content
submenu, the code domain power for code channels is displayed (see Figure 2-9).
active, inactive, or pilot display
Code domain power
Vertical Sca le
Horizontal Scale
Horizontal Start
Figure 2-9: Code domain power display
WCA230A & WCA280A Option 25 cdma2000 Analysis Software User Manual 2-17
Page 36

cdma2000 Forward Link Measurements
In the code domain power display, the I and Q power bars are distinguished by
using different colors as follows:
Blue: pilot channel
Red: active channel
Yellow: inactive channel
You can set the scale of the display using the VIEW SCALE menu. Press the
SCALE key to open the menu.
Auto Scale: Sets the start value and the scale of the vertical axis automatically
to display the entire waveform.
Horizontal Scale: Sets the scale of the horizontal axis. The range is dependent
on the Radio Configuration setting.
Horizontal Start: Sets the channel number of the first (left) value of the
horizontal axis.
Vertical Scale: Sets the scale of the vertical axis. You can set the value from
µdB to 100 dB.
100
Vert i ca l St op : Sets the maximum (top) value of the vertical axis. You can set
the value from -100 dB to 100 dB.
Full Scale: Sets the scale of the vertical axis to the default full-scale value.
Y Axis...: Selects whether to represent the vertical (amplitude) axis with
relative values or absolute values. When you select Relative, the vertical axis
represents the power relative to the total power of all channels. When you
select Absolute, the vertical axis represents the absolute power of each
channel.
Graph Number: Selects the number of graphs to be displayed in the screen.
You can select 1 or 2.
View Data...: Sets which channels to display when 1 is selected in the Graph
Number menu item. You can select I, Q, or IandQ.
2-18 WCA230A & WCA280A Option 25 cdma2000 Analysis Software User Manual
Page 37

cdma2000 Forward Link Measurements
Power Codogram Display. When you select Mainview Content from the VIEW
DEFINE menu and then select Power Codogram from the Mainview Content
submenu, the code domain power is displayed in spectrogram (see Figure 2-10).
Code length and channel number
Marker readout
Color Scale
Vertical Size
Vertical Start
active, inactive, or pilot display
Code domain power
PCG number
Relative time from completion of data acquisition
Horizontal Scale
Horizontal Start
Figure 2-10: Power codogram display
WCA230A & WCA280A Option 25 cdma2000 Analysis Software User Manual 2-19
Page 38

cdma2000 Forward Link Measurements
You can set the scale of the display using the VIEW SCALE menu. Press the
SCALE key to open the menu.
Auto Scale: Sets the start value and the scale of the vertical axis to display the
entire waveform.
Horizontal Scale: Sets the scale of the horizontal axis. The range is dependent
on the Radio Configuration setting.
Horizontal Start: Sets the channel number of the first (left) value of the
horizontal axis.
Vertical Size: Sets the scale of the vertical axis.
Vertical Start: Sets the frame value at the bottom of the vertical axis.
Color Scale: Sets the scale (the value separating the minimum power value
from the maximum power value) of the color axis. The choices are 5, 10, 20,
and 50 dB.
Color Stop: Sets the stop value of the color axis.
Full Scale: Sets the maximum value of the color axis to the reference level.
Y Axis...: Selects whether to represent the Y (color) axis with relative values
or absolute values. When you select Relative, the Y axis represents the power
relative to the total power of all channels. When you select Absolute, the Y axis
represents the absolute power of each channel.
Graph Number: Selects the number of graphs to be displayed in the screen.
You can select 1 or 2.
View Data...: Sets which channels to display when 1 is selected in the Graph
Number menu item. You can select I, Q, or IandQ.
2-20 WCA230A & WCA280A Option 25 cdma2000 Analysis Software User Manual
Page 39

cdma2000 Forward Link Measurements
IQ Power Graph Display. When you select Mainview Content from the VIEW
DEFINE menu and then select IQ Power Graph from the Mainview Content
submenu, I and Q powers over time is displayed for each chip or symbol
(see Figure 2-11).
Marker readout
Vertical Stop
Vertical Scale
Symbol number
Code length and channel number
Horizontal Scale
Horizontal Start
Figure 2-11: IQ power graph display
WCA230A & WCA280A Option 25 cdma2000 Analysis Software User Manual 2-21
Page 40

cdma2000 Forward Link Measurements
You can set the scale of the display using the VIEW SCALE menu. Press the
SCALE key to open the menu.
Auto Scale: Sets the start value and the scale of the vertical axis automatically
to display the entire waveform.
Horizontal Scale: Sets the scale of the horizontal axis (number of chips or
symbols).
Horizontal Start: Sets the chip or symbol number of the first (left) value of
the horizontal axis.
Vertical Scale: Sets the scale of the vertical axis. You can set the value from
100
Vert i ca l St op : Sets the maximum (top) value of the vertical axis. You can set
the value from -100 dB to 100 dB.
Full Scale: Sets the scale of the vertical axis to the default full scale value.
Y Axis...: Selects whether to represent the vertical (amplitude) axis with
relative values or absolute values. When you select Relative, the vertical axis
represents the power relative to the total power of all channels. When you
select Absolute, the vertical axis represents the absolute power of each
channel.
µdB to 100 dB.
Graph Number: Selects the number of graphs to be displayed in the screen.
You can select 1 or 2.
View Data...: Sets which channels to display when 1 is selected in the Graph
Number menu item. You can select I, Q, or IandQ.
2-22 WCA230A & WCA280A Option 25 cdma2000 Analysis Software User Manual
Page 41

Channel Power Measurement
The channel power measurement measures the channel power within a specified
bandwidth and the power spectral density in dBm/Hz. Figure 2-12 shows an
example of the channel power measurement.
cdma2000 Forward Link Measurements
Figure 2-12: Channel power measurement
Setting the Measurement
Parameters
WCA230A & WCA280A Option 25 cdma2000 Analysis Software User Manual 2-23
You can set the following measurement parameters using the MEAS SETUP
menu. Press the MEAS SETUP key to open the MEAS SETUP menu.
Channel Bandwidth: Sets the frequency range for the measurement.
Measurement Filter Shape: Sets the filter to be used for the measurement.
You can select Rect (Rectangular), Gaussian, Nyquist, or Root Nyquist.
Rolloff Ratio: Enters the rolloff ratio when the Nyquist or Root Nyquist filter
is selected. You can set the value from 0.0001 to 1. The default value is 0.5.
Limits...: Sets the pass/fail limit for the channel power measurement. When
pressing this side key, the measurement limits editor appears. Refer to Editing
the Measurement Limits on page 2-57 for more information.
NOTE. Refer to the WCA230A & WCA280A Portable Wireless Communication
Analyzers User Manual for information about the scale settings for the display.
Page 42

cdma2000 Forward Link Measurements
OBW Measurement
The OBW (Occupied Bandwidth) measurement measures the frequency
bandwidth, using the ratio you specify for carrier signal power/power within the
span setting. Figure 2-13 shows an example of the OBW measurement.
Figure 2-13: OBW measurement
Setting the Measurement
Parameters
2-24 WCA230A & WCA280A Option 25 cdma2000 Analysis Software User Manual
You can set the following measurement parameters using the MEAS SETUP
menu. Press the MEAS SETUP key to open the MEAS SETUP menu.
Power Ratio: Specifies the power ratio of the carrier and span regions for
calculating OBW. You can set the value from 80 to 99.99%. The default value
is 99%.
Limits...: Sets the pass/fail limits for the OBW measurement. When pressing
this side key, the measurement limits editor appears. Refer to Editing the
Measurement Limits on page 2-57 for more information.
NOTE. Refer to the WCA230A & WCA280A Portable Wireless Communication
Analyzers User Manual for information about the scale settings for the display.
Page 43
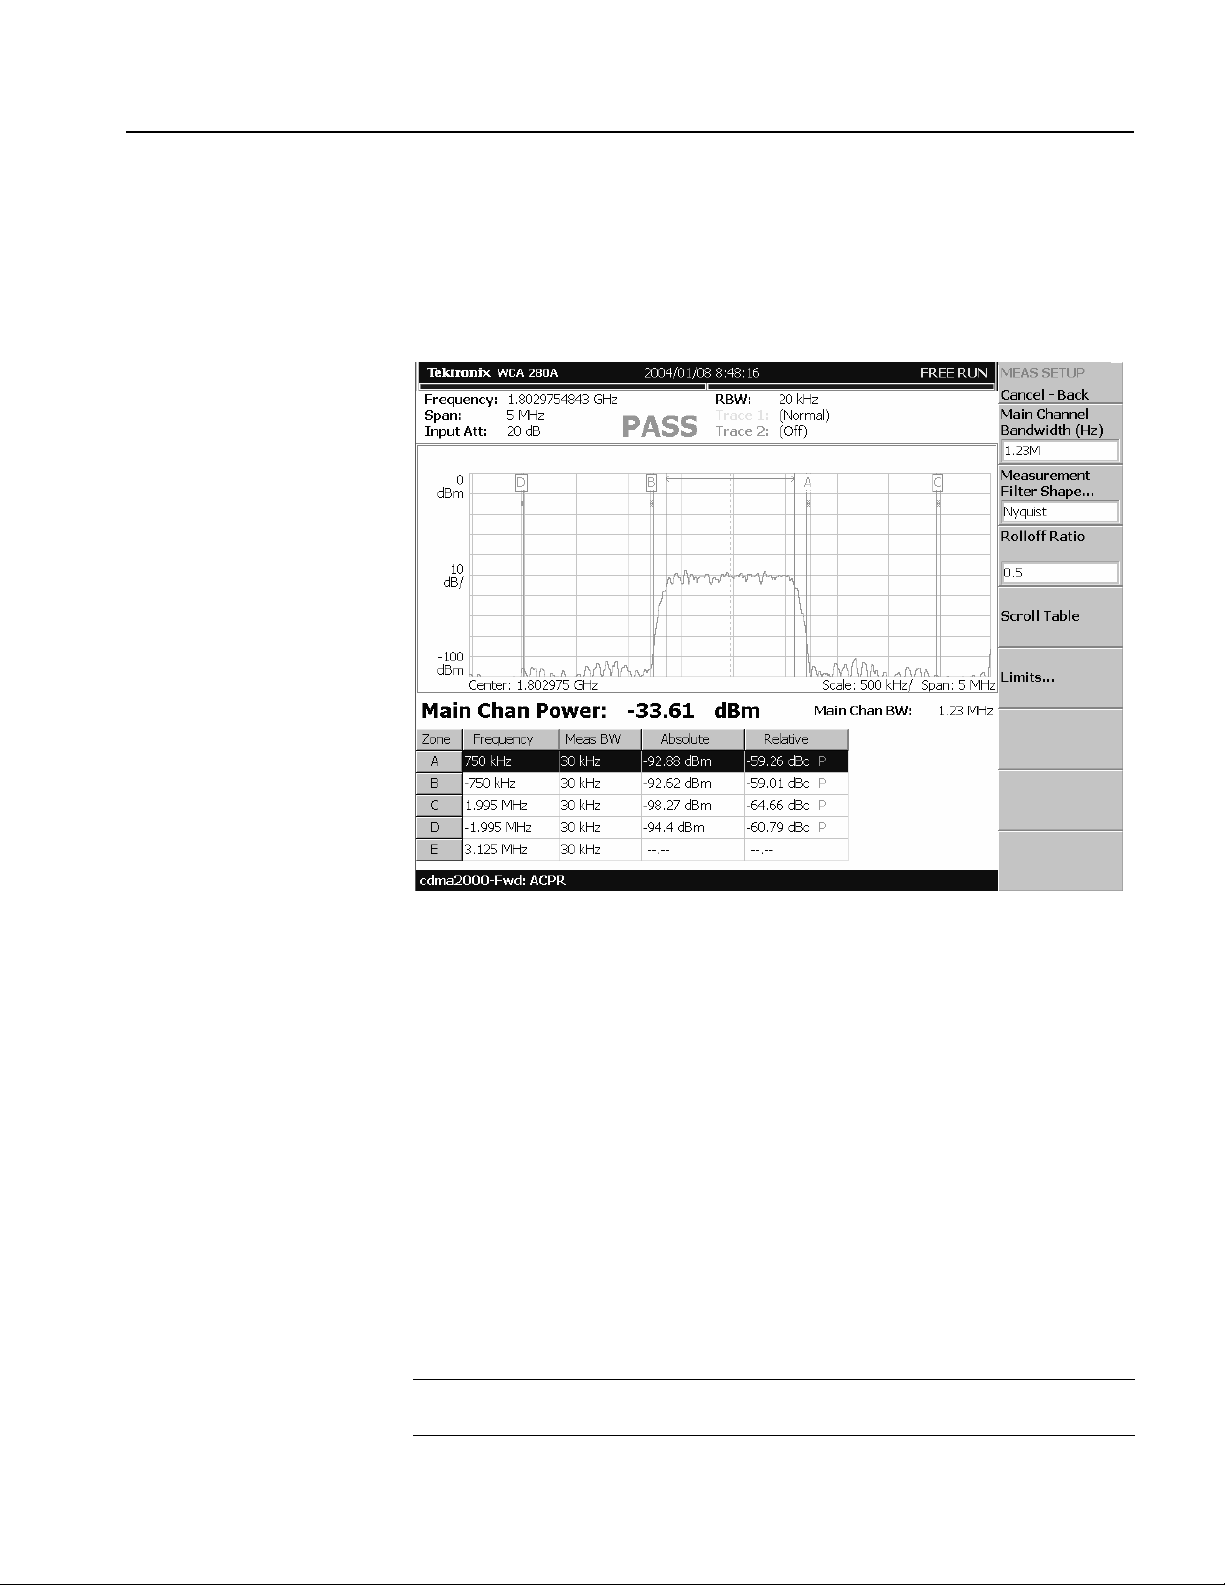
ACPR Measurement
cdma2000 Forward Link Measurements
The ACPR (Adjacent Channel Power Ratio) measurement measures the ratio of
carrier signal power to the signal power in an adjacent channel (leakage signal).
Figure 2-14 shows an example of the ACPR measurement.
Figure 2-14: ACPR measurement
Setting the Measurement
Parameters
WCA230A & WCA280A Option 25 cdma2000 Analysis Software User Manual 2-25
You can set the following measurement parameters using the MEAS SETUP
menu. Press the MEAS SETUP key to open the MEAS SETUP menu.
Main Channel Bandwidth: Sets the bandwidth of the main channel.
Measurement Filter Shape...: Sets the filter to be used for the measurement.
You can select Rect (Rectangular), Gaussian, Nyquist, or Root Nyquist.
Rolloff Ratio: Enters the rolloff ratio when the Nyquist or Root Nyquist filter
is selected. You can set the value from 0.0001 to 1. The default value is 0.5.
Scroll Table: Scrolls the table displayed in the view.
Limits: Sets the pass/fail limit for the ACPR measurement. When pressing this
side key, the measurement limits editor appears. Refer to Editing the
Measurement Limits on page 2-57 for more information.
NOTE. Refer to the WCA230A & WCA280A Portable Wireless Communication
Analyzers User Manual for information about the scale settings for the display.
Page 44

cdma2000 Forward Link Measurements
Spectrum Emission Mask Measurement
The spectrum emission mask measurement verifies that the base station is not
transmitting excessive power outside of its designated channel. Figure 2-15 shows
an example of the spectrum emission mask measurement.
Figure 2-15: Spectrum emission mask measurement
2-26 WCA230A & WCA280A Option 25 cdma2000 Analysis Software User Manual
Page 45

cdma2000 Forward Link Measurements
Setting the Measurement
Parameters
You can set the following measurement parameters using the MEAS SETUP
menu. Press the MEAS SETUP key to open the MEAS SETUP menu.
Measurement...: Sets the limit table used for limit testing. You can select
Offset From Channel or Inband Spurious. For Offset From Channel, frequency
zones are specified by the difference from the center frequency. For Inband
Spurious, frequency zones are specified by the absolute frequency values.
Ref. Channel Select: Selects the reference mode used to measure the spectrum
emission level. You can select Auto or Man (manual). For Auto, the reference
level is measured from the input signal for the specified channel bandwidth.
For Man, you can set the reference level in the Ref. Channel Level menu item.
Ref. Channel Level: Sets the reference level used to measure the spectrum
emission level. You can set the value from -150 dBm to 30 dBm. This setting
is only available when Ref. Channel Select is set to Man (manual).
Channel Bandwidth: Sets the channel bandwidth for the measurement.
Measurement Filter Shape...: Sets the filter to be used for the measurement.
You can select Rect (Rectangular), Gaussian, Nyquist, or Root Nyquist. This
setting is only available when Ref. Channel Select is set to Auto.
Rolloff Ratio: Enters the rolloff ratio when the Nyquist or Root Nyquist filter
is selected. You can set the value from 0.0001 to 1. The default value is 0.5.
This setting is only available when Ref. Channel Select is set to Auto.
Changing the View
Contents
Limits...: Sets the pass/fail limits for the intermodulation measurement. When
pressing this side key, the measurement limits editor appears. Refer to Editing
the Measurement Limits on page 2-57 for more information.
Scroll Table: Scrolls the table displayed in the view.
NOTE. Refer to the WCA230A & WCA280A Portable Wireless Communication
Analyzers User Manual for information about the scale settings for the display.
You can change the contents in the view using the VIEW DEFINE menu. Press the
DEFINE key to display the VIEW DEFINE menu.
Grid Style: Sets the grid style in the view. You can select Off, Fix, or Flex. For
Flex, the grid is changed depending on frequency or span setting.
Menu Off: Hides the side menu. To display the menu again, press the MENU
side key or VIEW: DEFINE key.
WCA230A & WCA280A Option 25 cdma2000 Analysis Software User Manual 2-27
Page 46

cdma2000 Forward Link Measurements
Intermodulation Measurement
The intermodulation measurement measures the third-order and fifth-order
harmonic distortion components of a modulated signal. Figure 2-16 shows an
example of the intermodulation measurement.
Figure 2-16: Intermodulation measurement
2-28 WCA230A & WCA280A Option 25 cdma2000 Analysis Software User Manual
Page 47

cdma2000 Forward Link Measurements
Setting the Measurement
Parameters
You can set the following measurement parameters using the MEAS SETUP
menu. Press the MEAS SETUP key to open the MEAS SETUP menu.
2nd Channel Offset: Sets the center frequency of the second channel. Use this
menu item when the interfering carrier may be outside of the analysis span.
Main Channel Integration BW: Sets the integration bandwidth. You can set
the value from 500 kHz to 5 MHz.
Measurement Filter Shape...: Sets the filter to be used for the measurement.
You can select Rect (Rectangular), Gaussian, Nyquist, or Root Nyquist.
Rolloff Ratio: Enters the rolloff ratio when the Nyquist or Root Nyquist filter
is selected. You can set the value from 0.0001 to 1. The default value is 0.5.
Limits: Sets the pass/fail limits for the intermodulation measurement. When
pressing this side key, the measurement limits editor appears. Refer to Editing
the Measurement Limits on page 2-57 for more information.
NOTE. Refer to the WCA230A & WCA280A Portable Wireless Communication
Analyzers User Manual for information about the scale settings for the display.
WCA230A & WCA280A Option 25 cdma2000 Analysis Software User Manual 2-29
Page 48

cdma2000 Forward Link Measurements
CCDF Measurement
The CCDF (Complementary Cumulative Distribution Function) measurement
displays the peak-to-average power ratio along the horizontal axis, and the
probability that the ratio is exceeded along the vertical axis. This display is useful
in designing digital communications systems. Figure 2-17 shows an example of the
CCDF measurement.
Figure 2-17: CCDF measurement (single view)
2-30 WCA230A & WCA280A Option 25 cdma2000 Analysis Software User Manual
Page 49

cdma2000 Forward Link Measurements
Setting the Timing
Parameters
Setting the Measurement
Parameters
You can set the following timing parameters using the TIMING menu. Press the
TIMING key to open the TIMING menu.
Acquisition Length (s): Sets the acquisition length in seconds.
Acquisition History: Specifies the number of the block to display and
analyze. The latest block is number zero. Older blocks have larger negative
numbers.
Spectrum Length: Display the time length for FFT processing of the spectrum
displayed in the subview. This value is equivalent to one frame acquisition
length.
Spectrum Offset: Sets the beginning of Spectrum Length with respect to the
left end of the acquisition length.
Output Trigger Indicator: Selects whether to enable the output trigger
indicator.
NOTE. Refer to the WCA230A & WCA280A Portable Wireless Communication
Analyzers User Manual for detailed information about the time parameters.
You can set the following measurement parameters using the MEAS SETUP
menu. Press the MEAS SETUP key to open the MEAS SETUP menu.
Display Gaussian Line: Selects whether to display the Gaussian line on the
graticule.
Display Reference Line: Selects whether to display the most recently stored
reference line on the graticule.
Store Reference Line: Stores a new reference line.
Reset Measurement: Restart the CCDF measurement. When you press this
key, the CCDF accumulation counter on the upper right side of the display is
reset to 0.
CCDF Auto-Scaling: Selects whether to automatically set the scaling of the
horizontal axis. When you set it to On, the signal peak value is displayed as the
maximum value on the right edge of the graticule. When you set it to Off, the
scaling of the horizontal axis can be set manually with CCDF Scale. The
default value is Off.
CCDF Scale: Sets the full-scale value of the horizontal axis of the CCDF
display when CCDF Auto-Scaling is set to Off. You can set the value from 1dB
to 100 dB.
Threshold: Sets the threshold for the measurement. You can set the value from
-250 dBm to 130 dBm.
Limits...: When pressing this side key, the measurement limits editor appears.
Refer to Editing the Measurement Limits on page 2-57 for more information.
WCA230A & WCA280A Option 25 cdma2000 Analysis Software User Manual 2-31
Page 50

cdma2000 Forward Link Measurements
Changing the View
Contents
Scale in the Main View
You can change the contents in the overview using the VIEW DEFINE menu.
Press the DEFINE key to display the VIEW DEFINE menu.
Show Views: Sets the view style on the screen. You can select Single or Multi.
When you set it to Multi, the CCDF, spectrum, and power versus time of the
measured signal are displayed simultaneously.
Overview Content...: Selects a view to display in the overview. You can
select Spectrogram or Waveform (power versus time).
Menu Off: Hides the side menu. To display the menu again, press the MENU
side key or VIEW:DEFINE key.
You can set the scale in the main view using the VIEW SCALE menu. Press the
SCALE key to open the menu.
Auto Scale: Sets the start value and the scale of the vertical axis automatically
to display the entire waveform.
Horizontal Scale: Sets the scale of the horizontal axis.
Horizontal Start: Sets the minimum (left) value of the horizontal axis.
Vertical Stop: Sets the maximum (top) value of the vertical axis. The setting
ranges are twice the Vertical Start value to 100% in a 1-2-5 sequence.
Vertical Stop
Vertical Start
Vertical Start: Sets the minimum (bottom) value of the vertical axis. The
setting ranges are 10
Full Scale: Sets the scale of the vertical axis to the default full scale value.
Sub Grid: Selects whether to display the sub-grid on the graticule.
Horizontal Start
-6
to half the Vertical Stop value in a 1-2-5 sequence.
Horizontal Scale
Figure 2-18: Scale settings in the CCDF display
2-32 WCA230A & WCA280A Option 25 cdma2000 Analysis Software User Manual
Page 51
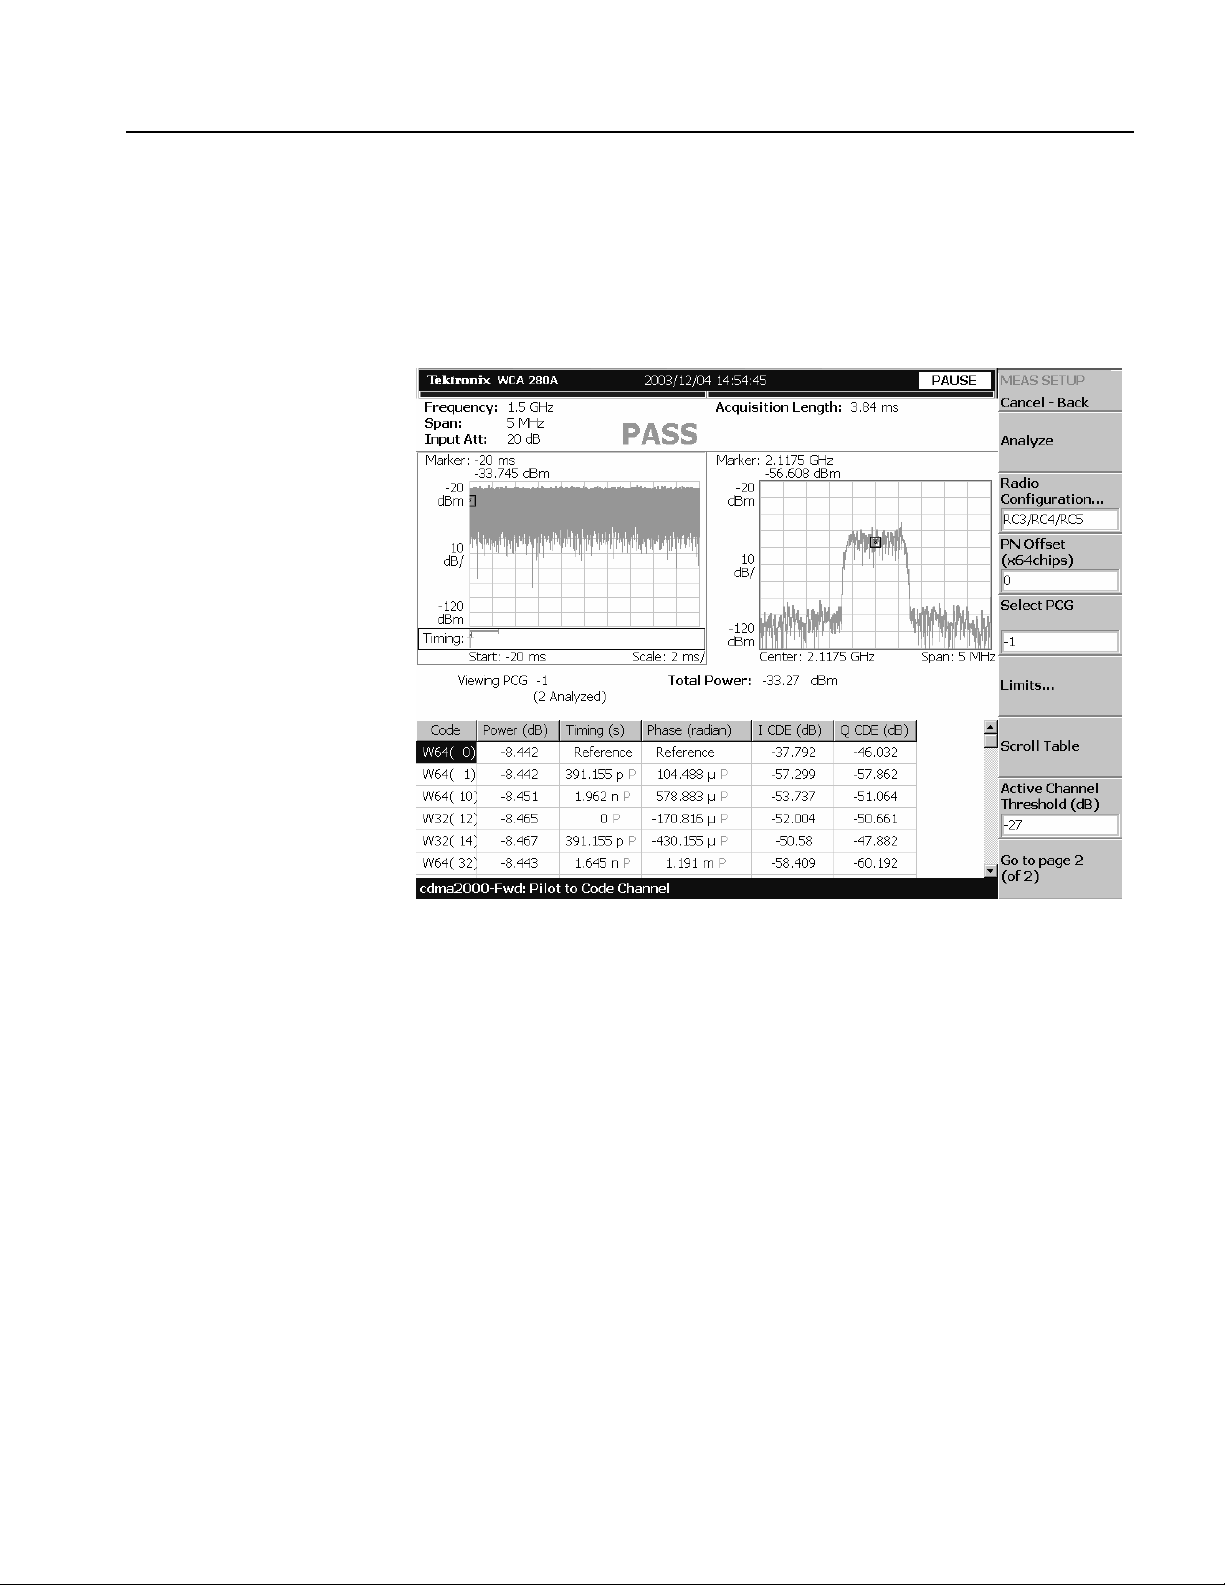
Pilot to Code Channel Measurement
The pilot to code channel measurement measures the time difference between the
pilot channel and other code channels detected in the received signal. Figure 2-19
shows an example of the pilot to code channel measurement.
cdma2000 Forward Link Measurements
Figure 2-19: Pilot to code channel measurement
WCA230A & WCA280A Option 25 cdma2000 Analysis Software User Manual 2-33
Page 52

cdma2000 Forward Link Measurements
Display Elements
Setting the Timing
Parameters
The following information is shown in the pilot to code channel measurement
display:
Overview: This view can contain power versus time or spectrogram.
Subview: This view can contain spectrum, EVM, magnitude error, phase
error, and constellation.
Main view: This view lists the following measurement results:
Power level
Timing referred to the pilot channel
Phase referred to the pilot channel
Code domain error
The display content in the subview can be changed using the VIEW DEFINE
menu. Refer to Changing the View Contents on page 2-36 for more information
about the VIEW DEFINE menu.
You can set the following timing parameters using the TIMING menu. Press the
TIMING key to open the TIMING menu.
Acquisition Length (chips): Sets the acquisition length in chips. The range
depends on the acquisition memory size and the span setting.
Acquisition Length (s): Displays the acquisition length in seconds.
Acquisition History: Specifies the number of the block to display and
analyze. The latest block is number zero. Older blocks have larger negative
numbers.
Analysis Interval: Sets the analysis interval in chips. The range depends on
the acquisition length setting.
Analysis Offset: Sets the start point of the analysis with respect to the left end
of the acquisition length in chips.
Spectrum Length: Displays the time length for FFT processing of the
spectrum displayed in the subview. This value is equivalent to one frame
acquisition length.
Spectrum Offset: Sets the beginning of Spectrum Length with respect to the
left end of the acquisition length.
NOTE. Refer to the WCA230A & WCA280A Portable Wireless Communication
Analyzers User Manual for detailed information about the timing parameters.
2-34 WCA230A & WCA280A Option 25 cdma2000 Analysis Software User Manual
Page 53

cdma2000 Forward Link Measurements
Setting the Measurement
Parameters
You can set the following measurement parameters using the MEAS SETUP
menu. Press the MEAS SETUP key to open the MEAS SETUP menu.
Analyze: Performs analysis for the time slots in the analysis range.
Radio Configuration...: Selects the radio configuration for the measurement.
You can select RC1/RC2 or RC3/RC4/RC5.
PN Offset: Sets the PN offset in units of 64 chips. You can set the value from
0 to 511.
Select PCG: Sets the PCG (power control groups) for the measurement.
Limits...: Sets the pass/fail limits for the pilot to code channel measurement.
When pressing this side key, the measurement limits editor appears. Refer to
Editing the Measurement Limits on page 2-57 for more information.
Scroll Table: Scrolls the table displayed in the view.
Active Channel Threshold: Sets the active channel threshold level (in dB
from the pilot) used for deciding whether a code channel is active or inactive.
You can set the value from -50 dB to 50 dB.
IQ Swap: Sets whether to swap the I and Q data streams before demodulation.
Measurement Filter...: Selects the measurement filter to apply when
calculating pilot to code channel results. You can select None, cdma2000, or
cdma2000+EQ (equalizer).
Walsh Code Length...: Selects the Walsh code length. You can select
Composite, 64, 32, 16, 8, 4, or 2. This setting is only available when Radio
Configuration is set to RC3/RC4/RC5.
QOF: Sets the Walsh code quasi-orthogonal function. The choices are 0, 1, 2,
or 3. This setting is only available when Radio Configuration is set to
RC3/RC4/RC5. When Radio Configuration is set to RC1/RC2, the Walsh code
length is fixed at 64 and cannot be changed by the user.
WCA230A & WCA280A Option 25 cdma2000 Analysis Software User Manual 2-35
Page 54

cdma2000 Forward Link Measurements
Changing the View
Contents
You can change the contents in the overview and subview using the VIEW
DEFINE menu. Press the DEFINE key to display the VIEW DEFINE menu.
Show Views: Sets the view style on the screen. You can select Single or Multi.
Overview Content...: Selects a view to display in the overview. You can
select Spectrogram or Waveform (spectrum).
Subview Content...: Selects a view to display in the subview:
Spectrum: Displays spectrum of the input signal.
EVM: Displays changes of EVM (Error Vector Magnitude) over time.
MagErr: Displays changes of magnitude error over time.
PhaseErr: Displays changes of phase error over time.
Constellation: Displays the signal as an I-Q constellation.
Menu Off: Hides the side menu. To display the menu again, press the MENU
side key or VIEW: DEFINE key.
2-36 WCA230A & WCA280A Option 25 cdma2000 Analysis Software User Manual
Page 55

cdma2000 Reverse Link Measurements
This section describes the functions and features of the cdma2000 reverse link
measurements. Each measurement description contains general information about
the measurement, descriptions of the measurement displays and functions available
through menu selections.
The information is divided into the following subsections:
Modulation accuracy measurement
Code domain power measurement
Pilot to code channel measurement
Gated output power measurement
The following measurement items available in the cdma2000 reverse link
measurements are the same as those in the cdma2000 forward link measurements.
Refer to cdma2000 Forward Link Measurements beginning on page 2-3.
Channel power measurement
OBW measurement
ACPR measurement
Spectrum emission mask measurement
Intermodulation measurement
CCDF measurement
NOTE. If you are not familiar with the operation of the WCA230A/WCA280A, refer
to the WCA230A & WCA280A Portable Wireless Communication Analyzers User
Manual before reading this section.
WCA230A & WCA280A Option 25 cdma2000 Analysis Software User Manual 2-37
Page 56

cdma2000 Reverse Link Measurements
Modulation Accuracy Measurement
The modulation accuracy measurement measures Rho (ratio of the correlated
power to the total power), EVM (Error Vector Magnitude), magnitude error, phase
error, frequency error, and origin offset. Figure 2-20 shows an example of the
modulation accuracy measurement.
Figure 2-20: Modulation accuracy measurement-reverse link
2-38 WCA230A & WCA280A Option 25 cdma2000 Analysis Software User Manual
Page 57

cdma2000 Reverse Link Measurements
Display Elements
Setting Timing Parameters
The following information is shown in the modulation accuracy measurement
display:
Overview: This view can contain power versus time or spectrogram.
Subview: This view can contain spectrum, EVM, magnitude error, phase
error, IQ power graph, and constellation.
Main view: This view can contain modulation accuracy, EVM, magnitude
error, phase error, and symbol table.
The display contents in each view can be changed using the VIEW DEFINE menu.
Refer to Changing the View Contents on page 2-41 for more information about the
VIEW DEFINE menu.
You can set the following timing parameters using the TIMING menu. Press the
TIMING key to open the TIMING menu.
Acquisition Length (chips): Sets the acquisition length in chips. The range
depends on the acquisition memory size and the span setting.
Acquisition Length (s): Displays the acquisition length in seconds.
Acquisition History: Specifies the number of the block to display and
analyze. The latest block is number zero. Older blocks have larger negative
numbers.
Analysis Interval: Sets the analysis interval in chips. The range depends on
the acquisition length setting.
Analysis Offset: Sets the start point of the analysis with respect to the left end
of the acquisition length in chips.
Spectrum Length: Displays the time length for FFT processing of the
spectrum displayed in the subview. This value is equivalent to one frame
acquisition length.
Spectrum Offset: Sets the beginning of Spectrum Length with respect to the
left end of the acquisition length.
NOTE. Refer to the WCA230A & WCA280A Portable Wireless Communication
Analyzers User Manual for detailed information about the timing parameters.
WCA230A & WCA280A Option 25 cdma2000 Analysis Software User Manual 2-39
Page 58

cdma2000 Reverse Link Measurements
Setting Measurement
Parameters
You can set the following measurement parameters using the MEAS SETUP
menu. Press the MEAS SETUP key to open the MEAS SETUP menu.
Analyze: Performs analysis for the time slots in the analysis range.
Measurement Level: Selects the measurement level for the measurement.
You can select Chip (chip level) or Symbol (symbol level). This setting is only
available when Radio Configuration is set to RC3/RC4.
Radio Configuration...: Selects the radio configuration for the measurement.
You can select RC1/RC2 or RC3/RC4.
NOTE. When you select RC1/RC2 in this measurement, you cannot access the code
domain power measurement or pilot to code channel measurement.
When you select RC1/RC2 in this measurement, you cannot perform the analysis
with a span of 2 MHz.
Select PCG: Sets the PCG (power control group) for the measurement.
Select Code: Sets the code in the PCG for the measurement. This setting is
only available when Radio Configuration is set to RC3/RC4 and Measurement
Level is set to Symbol.
Limits...: Sets the pass/fail limits for the modulation accuracy measurement.
When pressing this side key, the measurement limits editor appears. Refer to
Editing the Measurement Limits on page 2-57 for more information.
Active Channel Threshold: Sets the active channel threshold level (in dB
from the pilot) used for deciding whether a code channel is active or inactive.
You can set the value from -100 dB to 0 dB. This setting is only available when
Radio Configuration is set to RC3/RC4.
IQ Swap: Sets whether to swap the I and Q data streams before demodulation.
Measurement Filter...: Selects the measurement filter to apply when
calculating EVM and other modulation accuracy results. You can select None,
cdma2000, or cdma2000+EQ (equalizer).
Walsh Code Length...: Selects the Walsh code length. You can select
Composite, 64, 32, 16, 8, 4, or 2. This setting is only available when
Measurement Level is set to Symbol and Radio Configuration is set to
RC3/RC4. When Radio Configuration is set to RC1/RC2, the Walsh code
length is fixed at 64 and cannot be changed by the user.
2-40 WCA230A & WCA280A Option 25 cdma2000 Analysis Software User Manual
Page 59

cdma2000 Reverse Link Measurements
Changing the View
Contents
You can change the view contents in the overview, subview, and main view using
the VIEW DEFINE menu. Press the DEFINE key to display the VIEW DEFINE
menu.
Show Views: Selects the view style on the screen. You can select Single or
Multi.
Overview Content...: Selects a view to display in the overview. You can
select Spectrogram or Waveform (power versus time).
Subview Content...: Selects a view to display in the subview:
Spectrum: Displays spectrum of the measured signal.
EVM: Displays changes of EVM (Error Vector Magnitude) over time.
MagErr: Displays changes of magnitude error over time.
PhaseErr: Displays changes of phase error over time.
IQ Power Graph: Displays the code domain power for each symbol.
Refer to IQ Power Graph Display on page 2-21.
Constellation: Displays the signal as an I-Q constellation.
Mainview Content...: Selects a view to display in the main view. You can
select Modulation Accuracy, EVM, MagErr, PhaseErr, or Symbol Table. Refer
to Scale and Format in the Main View on page 2-42 for more information about
the views.
Menu Off: Hides the side menu. To display the menu again, press the MENU
side key or VIEW:DEFINE key.
WCA230A & WCA280A Option 25 cdma2000 Analysis Software User Manual 2-41
Page 60

cdma2000 Reverse Link Measurements
Scale and Format in the
Main View
This subsection describes the scale settings and display format in the main view.
Modulation Accuracy Display. When you select Mainview Content from the VIEW
DEFINE menu and then select Modulation Accuracy from the Mainview Content
submenu, an IQ rectangular graph and the measured value for Rho, peak code
domain error, rms and peak EVM, magnitude error, phase error, frequency error,
and IQ origin offset are displayed (see Figure 2-21). The peak code domain error
is displayed only when the Measurement Level menu item is set to Symbol.
IQ rectangular graph
(vector display)
Figure 2-21: Modulation accuracy display-reverse link
You can set the scale of the display using the VIEW SCALE menu. Press the
SCALE key to open the menu.
Measurement Content...: Selects vector or constellation display.
Ve ct or: Selects vector display. A signal represented with phase and amplitude
is displayed in rectangular (I and Q) coordinates. The red point indicates the
symbol position on the measured signal, and the yellow trace indicates the
locus of signal between symbols.
Constellation: Selects constellation display. It is the same as the vector
display, except that only symbols of the measured signal are indicated in red,
and the locus between symbols is not shown. The cross marks indicate symbol
positions of an ideal signal.
NOTE. I and Q signals are normalized to prevent the scale from changing when
signal attenuation changes.
2-42 WCA230A & WCA280A Option 25 cdma2000 Analysis Software User Manual
Page 61

cdma2000 Reverse Link Measurements
EVM Display. When you select Mainview Content from the VIEW DEFINE menu
and then select EVM from the Mainview Content submenu, changes of EVM
(Error Vector Magnitude) over time are displayed for each chip or symbol (see
Figure 2-22).
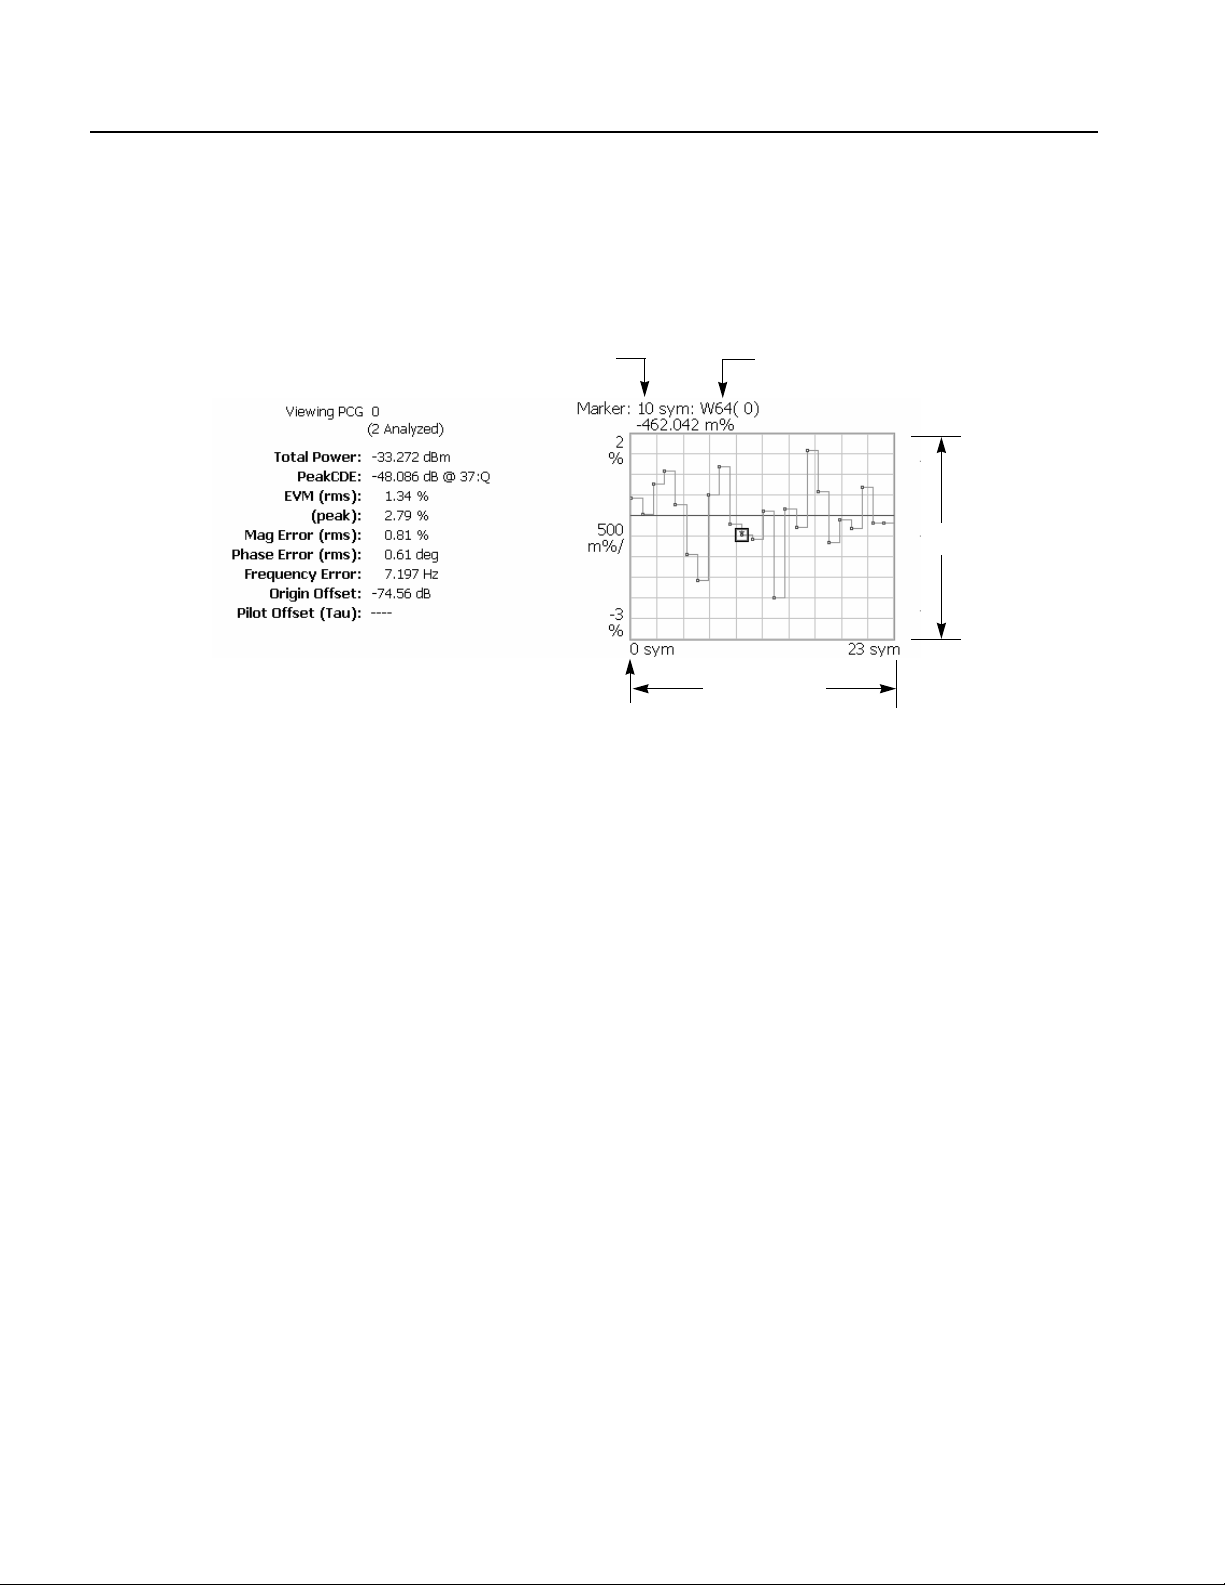
Chip number
Vertical Sca le
Vertical Start
Horizontal Scale
Horizontal Start
Figure 2-22: EVM display-reverse link
You can set the scale of the display using the VIEW SCALE menu. Press the
SCALE key to open the menu.
Auto Scale: Sets the start value and the scale of the vertical axis to display the
entire waveform.
Horizontal Scale: Sets the scale of the horizontal axis (number of chips or
symbols).
Horizontal Start: Sets the chip number or symbol number of the first (left)
value of the horizontal axis.
Vertical Scale: Sets the scale of the vertical axis.
Vertical Start: Sets the minimum (bottom) value of the vertical axis.
Full Scale: Sets the scale of vertical axis to the default full-scale value.
Measurement Content...: Selects the display content in the main view. You
can select EVM, MagErr, or PhaseErr. This selection can also be made from
Mainview Content in the VIEW DEFINE menu.
WCA230A & WCA280A Option 25 cdma2000 Analysis Software User Manual 2-43
Page 62

cdma2000 Reverse Link Measurements
MagErr Display. When you select Mainview Content from the VIEW DEFINE
menu and then select MagErr from the Mainview Content submenu, changes of
magnitude error over time are displayed for each chip or symbol (see
Figure 2-23).
Chip number
Vertical Scale
Horizontal Scale
Horizontal Start
Figure 2-23: MagErr display-reverse link
You can set the scale of the display using the VIEW SCALE menu. Press the
SCALE key to open the menu.
Auto Scale: Sets the start value and the scale of the vertical axis automatically
to display the entire waveform.
Horizontal Scale: Sets the scale of the horizontal axis (number of chips or
symbols).
Horizontal Start: Sets the chip number or symbol number of the first (left)
value of the horizontal axis.
Vertical Scale: Sets the scale of the vertical axis.
Vertical Offset: Sets the offset value of the vertical axis. You can set the value
from -200% to 200%.
Full Scale: Sets the scale of vertical axis to the default full-scale value.
Measurement Content...: Selects the display content in the main view. You
can select EVM, MagErr, or PhaseErr. This selection can also be made from
Mainview Content in the VIEW DEFINE menu.
2-44 WCA230A & WCA280A Option 25 cdma2000 Analysis Software User Manual
Page 63
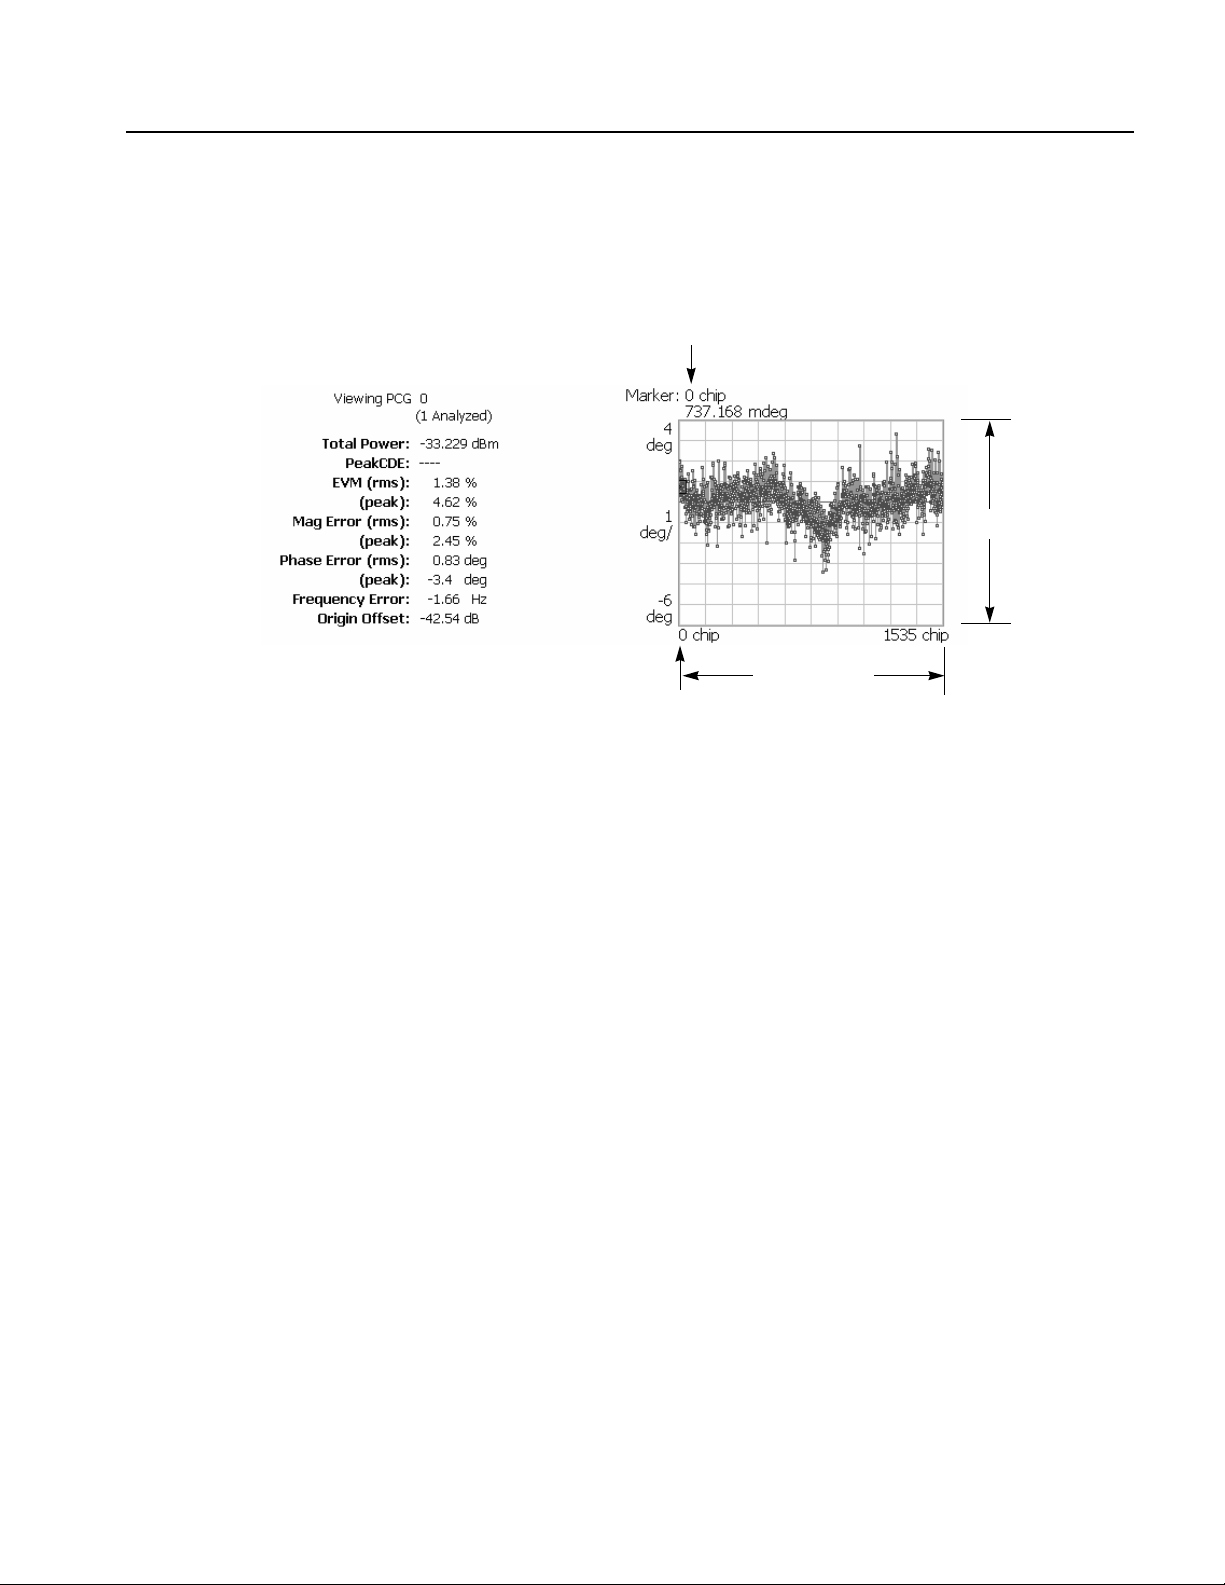
cdma2000 Reverse Link Measurements
PhaseErr Display. When you select Mainview Content from the VIEW DEFINE
menu and then select PhaseErr from the Mainview Content submenu, changes of
phase error over time are displayed for each chip or symbol (see Figure 2-24).
Chip number
Vertical Scale
Horizontal Scale
Horizontal Start
Figure 2-24: PhaseErr display-reverse link
You can set the scale of the display using the VIEW SCALE menu. Press the
SCALE key to open the menu.
Auto Scale: Sets the start value and the scale of the vertical axis automatically
to display the entire waveform.
Horizontal Scale: Sets the scale of the horizontal axis (number of chips or
symbols).
Horizontal Start: Sets the chip number or symbol number of the first (left)
value of the horizontal axis.
Vertical Scale: Sets the scale of the vertical axis.
Vertical Offset: Sets the offset value of the vertical axis. You can set the value
from -450 to 450 degrees.
Full Scale: Sets the scale of vertical axis to the default full-scale value.
Measurement Content...: Selects the display content in the main view. You
can select EVM, MagErr, or PhaseErr. This selection can also be made from
Mainview Content in the VIEW DEFINE menu.
WCA230A & WCA280A Option 25 cdma2000 Analysis Software User Manual 2-45
Page 64
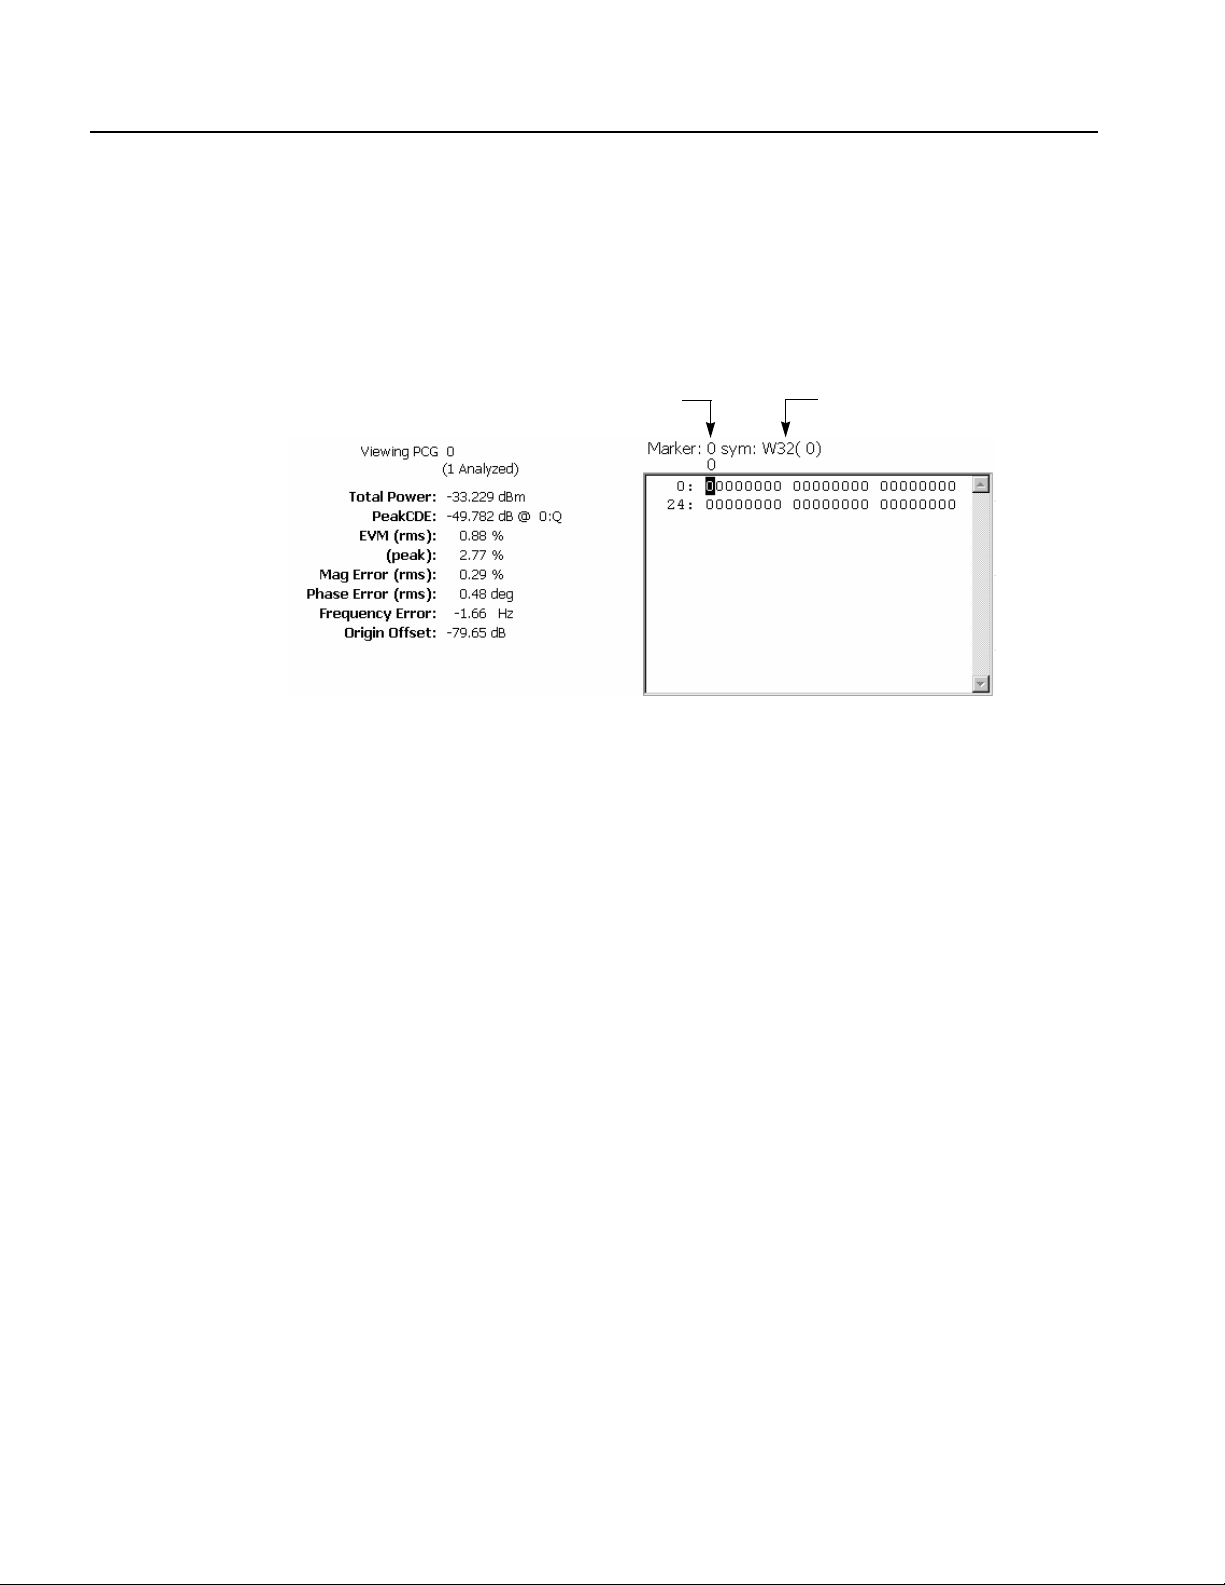
cdma2000 Reverse Link Measurements
Symbol Table Display. When you select Mainview Content from the VIEW
DEFINE menu and then select Symbol Table from the Mainview Content
submenu, the symbol table is displayed (see Figure 2-25). This display is only
available when the Measurement Level menu item is set to Symbol.
Symbol number
Code length and channel number
Figure 2-25: Symbol table display-reverse link
You can set the radix for the display using the VIEW SCALE menu. Press the
SCALE key to open the menu.
Radix...: Sets the radix for displaying the table. You can select Hex
(hexadecimal), Oct (octal), or Bin (binary).
2-46 WCA230A & WCA280A Option 25 cdma2000 Analysis Software User Manual
Page 65

Code Domain Power Measurement
NOTE. To access the code domain power measurement, you need to set the radio
configuration setting to RC3/RC4 in the modulation accuracy measurement.
The code domain power measurement measures the distribution of signal power
across the set of code channels, normalized to the total signal power. This
measurement allows you to verify that each code channel is operating at its proper
level. Figure 2-26 shows an example of the code domain power measurement.
cdma2000 Reverse Link Measurements
Figure 2-26: Code domain power measurement-reverse link
WCA230A & WCA280A Option 25 cdma2000 Analysis Software User Manual 2-47
Page 66

cdma2000 Reverse Link Measurements
Display Elements
Setting the Timing
Parameters
The following information is shown in the code domain power measurement
display:
Overview: This view can contain power versus time or spectrogram.
Subview: This view can contain spectrum, EVM, magnitude error, phase
error, IQ power graph, and constellation.
Main view: This view can contain code domain power, power codogram, and
IQ power graph. This view also lists the following measurement results:
Total power
Active code power versus total power
Active/inactive code power
The display contents in each view can be changed using the VIEW DEFINE menu.
Refer to Changing the View Contents on page 2-50 for more information about the
VIEW DEFINE menu.
You can set the following timing parameters using the TIMING menu. Press the
TIMING key to open the TIMING menu.
Acquisition Length (chips): Sets the acquisition length in chips. The range
depends on the acquisition memory size and the span setting.
Acquisition Length (s): Displays the acquisition length in seconds.
Acquisition History: Specifies the number of the block to display and
analyze. The latest block is number zero. Older blocks have larger negative
numbers.
Analysis Interval: Sets the analysis interval in chips. The range depends on
the acquisition length setting.
Analysis Offset: Sets the start point of the analysis with respect to the left end
of the acquisition length in chips.
Spectrum Length: Displays the time length for FFT processing of the
spectrum displayed in the subview. This value is equivalent to one frame
acquisition length.
Spectrum Offset: Sets the beginning of Spectrum Length with respect to the
left end of the acquisition length.
NOTE. Refer to the WCA230A & WCA280A Portable Wireless Communication
Analyzers User Manual for detailed information about the timing parameters.
2-48 WCA230A & WCA280A Option 25 cdma2000 Analysis Software User Manual
Page 67

cdma2000 Reverse Link Measurements
Setting the Measurement
Parameters
You can set the following measurement parameters using the MEAS SETUP
menu. Press the MEAS SETUP key to open the MEAS SETUP menu.
Analyze: Performs analysis for the time slots in the analysis range.
Radio Configuration...: Select the radio configuration for the measurement.
You can select only RC3/RC4.
Select PCG: Sets the PCG (power control group) for the measurement.
Select Code: Sets the code in the PCG for the measurement.
Limits...: Sets the pass/fail limits for the code domain power measurement.
When pressing this side key, the measurement limits editor appears. Refer to
Editing the Measurement Limits on page 2-57 for more information.
Active Channel Threshold: Sets the active channel threshold level (in dB
from the pilot) used for deciding whether a code channel is active or inactive.
You can set the value from -50 dB to 50 dB.
IQ Swap: Sets whether to swap the I and Q data streams before demodulation.
Measurement Filter...: Selects the measurement filter to apply when
calculating code domain power results. You can select None, cdma2000, or
cdma2000+EQ (equalizer).
Walsh Code Length...: Selects the Walsh code length. You can select
Composite, 64, 32, 16, 8, 4, or 2. This setting is only available when
Measurement Level is set to Symbol and Radio Configuration is set to
RC3/RC4. When Radio Configuration is set to RC1/RC2, the Walsh code
length is fixed at 64 and cannot be changed by the user.
WCA230A & WCA280A Option 25 cdma2000 Analysis Software User Manual 2-49
Page 68

cdma2000 Reverse Link Measurements
Changing the View
Contents
You can change the contents in the overview, subview, and main view using the
VIEW DEFINE menu. Press the DEFINE key to display the VIEW DEFINE
menu.
Show Views: Selects the view style on the screen. You can select Single or
Multi.
Overview Content...: Selects a view to display in the overview. You can
select Spectrogram or Waveform (power versus time).
Subview Content...: Selects a view to display in the subview:
Spectrum: Displays spectrum of the input signal.
EVM: Displays changes of EVM (Error Vector Magnitude) over time.
MagErr: Displays changes of magnitude error over time.
PhaseErr: Displays changes of phase error over time.
IQ Power Graph: Displays the code domain power for each symbol.
Refer to IQ Power Graph Display on page 2-21.
Constellation: Displays the signal as an I-Q constellation.
Mainview Content...: Selects a view to display in the main view. You can
select Code Domain Power, Power Codogram, or IQ Power Graph. Refer to
Scale and Format in the Main View on page 2-17 for more information about
the views.
Code Order...: Sets the way that code channels are arranged on the display.
You can select Hadamard or BitReverse.
Menu Off: Hides the side menu. To display the menu again, press the MENU
side key or VIEW:DEFINE key.
2-50 WCA230A & WCA280A Option 25 cdma2000 Analysis Software User Manual
Page 69

Pilot to Code Channel Measurement
NOTE. To access the pilot to code channel measurement, you need to set the radio
configuration setting to RC3/RC4 in the modulation accuracy measurement.
The pilot to code channel measurement measures the time difference between the
pilot channel and other code channels detected in the received signal. Figure 2-27
shows an example of the pilot to code channel measurement.
cdma2000 Reverse Link Measurements
Figure 2-27: Pilot to code channel measurement-reverse link
WCA230A & WCA280A Option 25 cdma2000 Analysis Software User Manual 2-51
Page 70

cdma2000 Reverse Link Measurements
Display Elements
Setting the Timing
Parameters
The following information is shown in the pilot to code channel measurement
display:
Overview: This view can contain power versus time or spectrogram.
Subview: This view can contain spectrum, EVM, magnitude error, phase
error, and constellation.
Main view: This view lists the following measurement results for the selected
PCG:
Power level
Timing referred to the pilot channel
Phase referred to the pilot channel
Code domain error
The display content in the subview can be changed using the VIEW DEFINE
menu. Refer to Changing the View Contents on page 2-54 for more information
about the VIEW DEFINE menu.
You can set the following timing parameters using the TIMING menu. Press the
TIMING key to open the TIMING menu.
Acquisition Length (chips): Sets the acquisition length in chips. The range
depends on the acquisition memory size and the span setting.
Acquisition Length (s): Displays the acquisition length in seconds.
Acquisition History: Specifies the number of the block to display and
analyze. The latest block is number zero. Older blocks have larger negative
numbers.
Analysis Interval: Sets the analysis interval in chips. The range depends on
the acquisition length setting.
Analysis Offset: Sets the start point of the analysis with respect to the left end
of the acquisition length in chips.
Spectrum Length: Displays the time length for FFT processing of the
spectrum displayed in the subview. This value is equivalent to one frame
acquisition length.
Spectrum Offset: Sets the beginning of Spectrum Length with respect to the
left end of the acquisition length.
NOTE. Refer to the WCA230A & WCA280A Portable Wireless Communication
Analyzers User Manual for detailed information about the timing parameters.
2-52 WCA230A & WCA280A Option 25 cdma2000 Analysis Software User Manual
Page 71

cdma2000 Reverse Link Measurements
Setting the Measurement
Parameters
You can set the following measurement parameters using the MEAS SETUP
menu. Press the MEAS SETUP key to open the MEAS SETUP menu.
Analyze: Performs analysis for the time slots in the analysis range.
Radio Configuration...: Select the radio configuration for the measurement.
You can select only RC3/RC4.
Select PCG: Sets the PCG (power control groups) for the measurement.
Limits...: Sets the pass/fail limits for the pilot to code channel measurement.
When pressing this side key, the measurement limits editor appears. Refer to
Editing the Measurement Limits on page 2-57 for more information.
Scroll Table: Scrolls the table displayed in the view.
Active Channel Threshold: Sets the active channel threshold level (in dB
from the pilot) used for deciding whether a code channel is active or inactive.
You can set the value from -50 dB to 50 dB.
IQ Swap: Sets whether to swap the I and Q data streams before demodulation.
Measurement Filter...: Selects the measurement filter to apply when
calculating pilot to code channel results. You can select None, cdma2000, or
cdma2000+EQ (equalizer).
Walsh Code Length...: Selects the Walsh code length. You can select
Composite, 64, 32, 16, 8, 4, or 2. This setting is only available when
Measurement Level is set to Symbol and Radio Configuration is set to
RC3/RC4. When Radio Configuration is set to RC1/RC2, the Walsh code
length is fixed at 64 and cannot be changed by the user.
WCA230A & WCA280A Option 25 cdma2000 Analysis Software User Manual 2-53
Page 72

cdma2000 Reverse Link Measurements
Changing the View
Contents
You can change the contents in the subview using the VIEW DEFINE menu. Press
the DEFINE key to display the VIEW DEFINE menu.
Show Views: Selects the view style on the screen. You can select Single or
Multi.
Overview Content...: Selects a view to display in the overview. You can
select Spectrogram or Waveform (power versus time).
Subview Content...: Selects a view to display in the subview:
Spectrum: Displays spectrum of the input signal.
EVM: Displays changes of EVM (Error Vector Magnitude) over time.
MagErr: Displays changes of magnitude error over time.
PhaseErr: Displays changes of phase error over time.
Constellation: Displays the signal as an I-Q constellation.
Menu Off: Hides the side menu. To display the menu again, press the MENU
side key or VIEW:DEFINE key.
2-54 WCA230A & WCA280A Option 25 cdma2000 Analysis Software User Manual
Page 73

Gated Output Power Measurement
The Gated Output power measurement measures the total RF power in a selected
channel. Figure 2-28 shows an example of the gated output power measurement.
cdma2000 Reverse Link Measurements
Display Elements
Setting the Timing
Parameters
Figure 2-28: Gated output power measurement
The following information is shown in the gated output power measurement
display:
Overview: This view can contain power versus time or spectrogram.
Subview: This view can contain spectrum.
Main view: This view can contain power versus time.
The display content in the overview can be changed using the VIEW DEFINE
menu. Refer to Changing the View Contents on page 2-56 for more information
about the VIEW DEFINE menu.
You can set the following timing parameter using the TIMING menu. Press the
TIMING key to open the TIMING menu.
Acquisition History: Specifies the block number to be analyzed. Block
number “0” corresponds to the latest block.
WCA230A & WCA280A Option 25 cdma2000 Analysis Software User Manual 2-55
Page 74

cdma2000 Reverse Link Measurements
Setting the Measurement
Parameters
You can set the following measurement parameters using the MEAS SETUP
menu. Press the MEAS SETUP key to open the MEAS SETUP menu.
In the MEAS SETUP menu, you can set the following parameters:
Analyze: Performs analysis for the time slots in the analysis range.
Burst Sync...: Sets the burst point to be measured. You can select Rising Edge,
Mid Point, or Trigger Position.
Burst Offset: Sets the burst offset between the trigger position and the burst
position for the measurement. You can set the value from -1 ms to 1ms. This
setting is only available when Burst Sync is set to Trigger Position.
Ref. Channel Select: Selects the reference mode used to measure the power
level. You can select Auto or Man (manual). For Auto, the reference level is
measured from the input signal. For Man, you can set the reference level in the
Ref. Channel Level menu item.
Ref. Channel Level: Sets the reference level used to measure the power level.
You can set the value from -150 dBm to 30 dBm. This setting is only available
when Ref.Channel Select is set to Man (manual).
Limits...: Sets the pass/fail limits for the gated output power measurement.
When pressing this side key, the measurement limits editor appears. Refer to
Editing the Measurement Limits on page 2-57 for more information.
Changing the View
Contents
Scale in the Main View
You can change the contents in the overview using the VIEW DEFINE menu.
Press the DEFINE key to display the VIEW DEFINE menu.
Show Views: Sets the view style on the screen. You can select Single or Multi.
Overview Content...: Selects a view to display in the overview. You can
select Spectrogram or Waveform (power versus time).
Menu Off: Hides the side menu. To display the menu again, press the MENU
side key or VIEW:DEFINE key.
You can set the scale of the main view using the VIEW SCALE menu. Press the
SCALE key to open the menu.
Auto Scale: Sets the start value and the scale of the vertical axis to display the
entire waveform.
Horizontal Scale: Sets the scale of the horizontal axis.
Horizontal Start: Sets the minimum (left) value of the horizontal axis.
Vertical Scale: Sets the scale of the vertical axis.
Vertical Stop: Sets the maximum (top) value of the vertical axis.
Full Scale: Sets the scale of the vertical axis to the default full scale value.
2-56 WCA230A & WCA280A Option 25 cdma2000 Analysis Software User Manual
Page 75
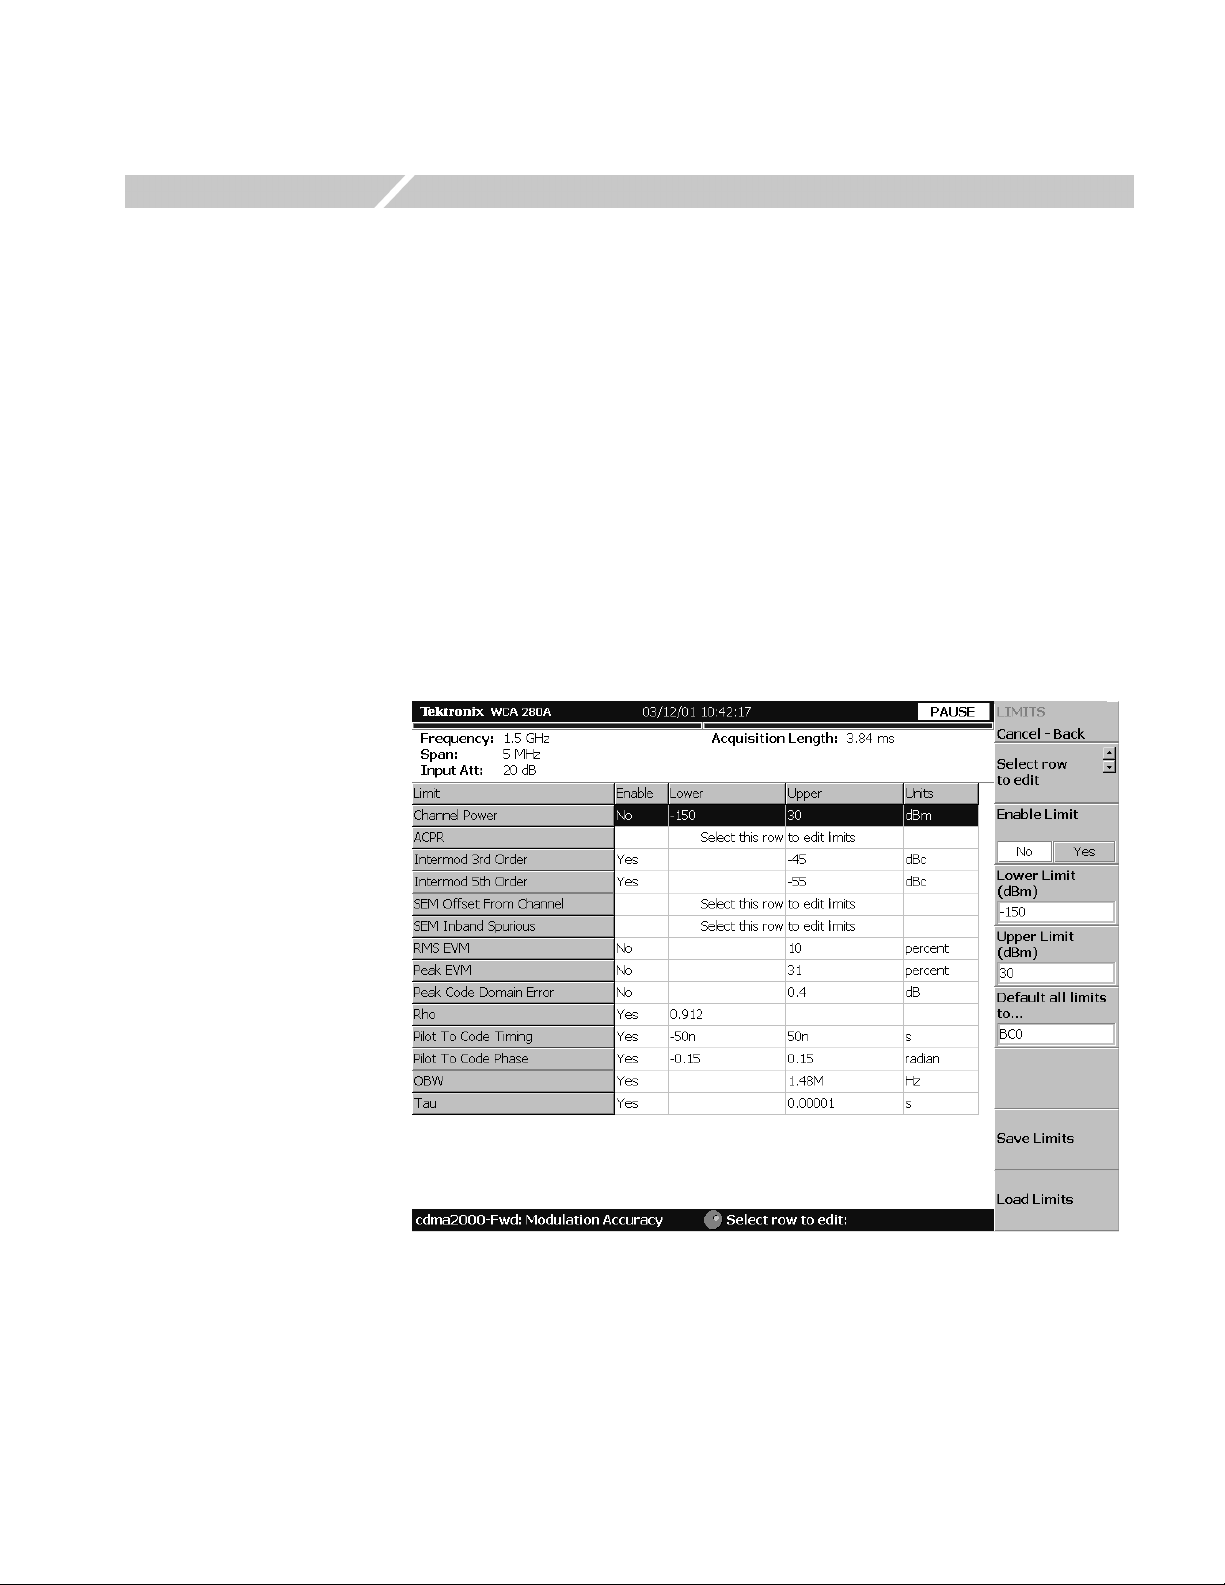
Editing the Measurement Limits
This section describes how to set measurement limits that can be used to perform
pass/fail testing for the cdma2000 measurements.
Refer to Measurement Limit Defaults on page 2-67 for information about the
default settings of each measurement limit.
Using the Measurement Limits Editor
All of the measurement limits are set in the measurement limits editor, which you
access from the Limits... side key on the MEAS SETUP menu.
Figure 2-29 shows the measurement limits editor for the cdma2000 forward link
measurements.
Figure 2-29: Measurement limits editor
WCA230A & WCA280A Option 25 cdma2000 Analysis Software User Manual 2-57
Page 76

Editing the Measurement Limits
Table 2-1 describes all of the measurement limit items available in the
measurement limits editor.
Table 2-1: Measurement limits items
Limit item Description Lower limit range Upper limit range
Channel power Sets the lower and upper limits for the Channel
Power measurement.
ACPR Select this item to access another measurement
limits editor to edit ACPR limits.
Intermod 3rd Order Sets the upper limit of the third harmonic distortion
component for the Intermodulation measurement.
Intermod 5th Order Sets the upper limit of the fifth harmonic distortion
component for the Intermodulation measurement.
SEM Offset From Channel Select this item to access another measurement
limits editor to edit SEM offset from channel limits.
SEM Inband Spurious Select this item to access another measurement
limits editor to edit SEM Inband spurious limits.
RMS EVM Sets the upper limit for the RMS EVM measurement. Not settable 0 to 100%
Sets the upper limit for the Peak EVM
Peak EVM
Peak Code Domain Error Sets the upper limit for the Peak code domain error
Rho Sets the lower limit of Rho for the modulation
Pilot To Code Timing Sets the upper limit for the pilot to code timing
Pilot To Code Phase Sets the lower and upper limits for the pilot to code
OBW Sets the upper and lower limits for the OBW
Ta u* Sets the lower limit of Tau for the modulation
Gated Output Power* Select this item to access another measurement
* These items are only available in the cdma2000 reverse link measurements.
measurement. Not settable 0 to 100%
measurement.
accuracy measurement.
measurement.
phase measurement.
measurement.
accuracy measurement.
limits editor to edit gated output power limits.
-200 to 200 dBm -200 to 200 dBm
Not settable -200 to 200 dBc
Not settable -200 to 200 dBc
Not settable -200 to 200 dBc
------------------ ------------------
------------------ ------------------
Not settable -200 to 200 dB
0 to 1 Not settable
Not settable 0 to 10 s
Not settable 0 to 100 degree
0 to 30 MHz 0 to 30 MHz
0 to 1 s Not settable
------------------ ------------------
2-58 WCA230A & WCA280A Option 25 cdma2000 Analysis Software User Manual
Page 77

Editing the Measurement Limits
Setting a Measurement
Limit
Perform the following procedure to set measurement limits:
1. Press the MEAS SETUP menu key to open the MEAS SETUP menu.
2. Press the Limits... side key to open the measurement limits editor with
LIMITS menu.
3. Press the Select row to edit side key.
4. Turn the rotary knob or press the arrow keys to select the row that you want to
edit.
5. Press the Enable Limit side key to enable or disable the pass/fail testing for
the specified limit(s).
6. Press the Lower Limit side key to set the lower limit for the selected
measurement item, if applicable.
7. Press the Upper Limit side key to set the upper limit for the selected
measurement item.
When you want to set limits for the spectrum emission mask or gated output power
measurement, perform the following steps to open another measurement limits
editor:
1. Press the Select row to edit side key.
2. Turn the rotary knob or press the arrow keys to select ACPR, SEM Offset
From Channel, SEM Inband Spurious, or Gated Output Power row.
3. Press the Edit ACPR Limits..., Edit SEM Offset Limits..., Edit SEM
Inband Limits..., or Edit Gated Output Power Limits... (reverse link
measurements only) side key. This opens the limits editor to set more complex
limits for the ACPR, spectrum emission mask or gated output power
measurement. Figure 2-31 shows the measurement limits editor for the ACPR
measurement.
WCA230A & WCA280A Option 25 cdma2000 Analysis Software User Manual 2-59
Page 78
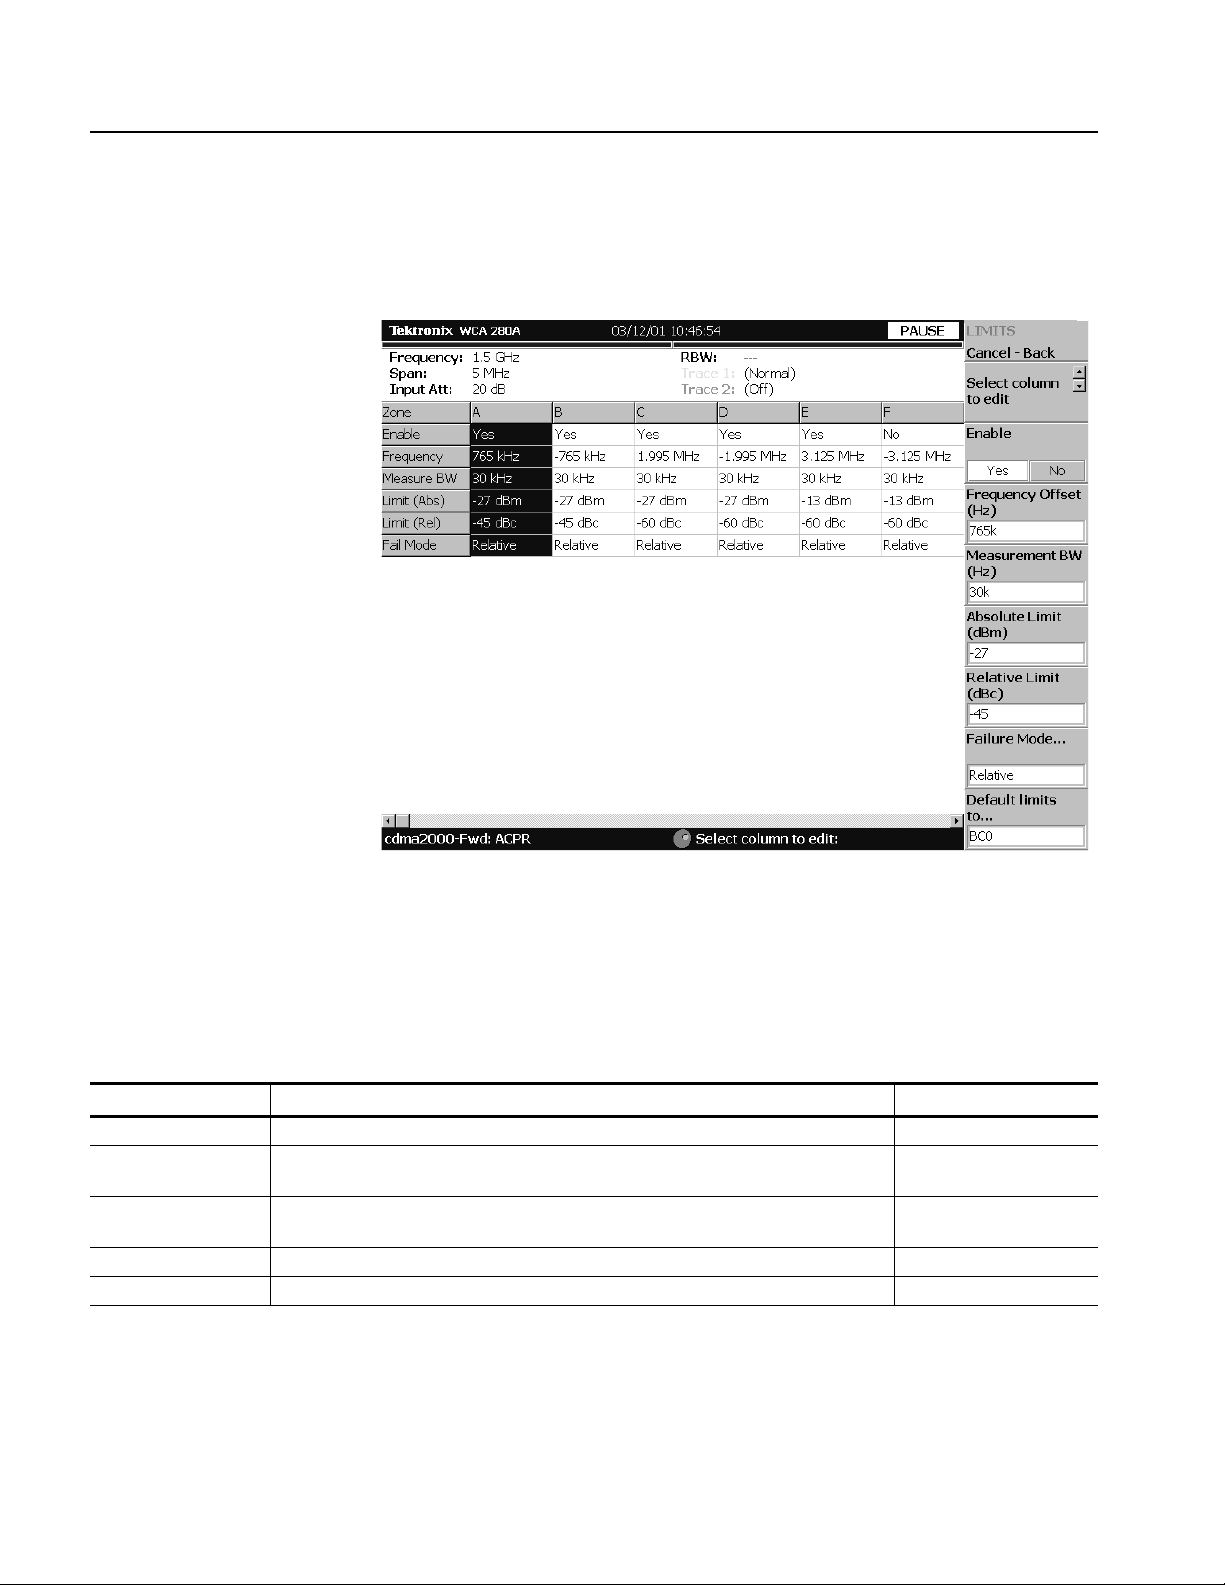
Editing the Measurement Limits
Setting the ACPR Limits
When you select the ACPR row in the measurement limits editor, another
measurement limits editor for the ACPR measurement is displayed. Figure 2-30
shows the measurement limits editor for the ACPR measurement.
Figure 2-30: ACPR measurement limits editor
Table 2-2 lists the measurement limit items that can be set in the measurement
limits editor.
Table 2-2: Measurement limit items for the ACPR measurement
Item Description Limit ranges
Enable Enables or disables use of the limits in the specified zone (A to L). -------------------
Frequency Sets the frequency offset for the zone. -3 to 3 GHz (WCA230A)
-8 to 8 GHz (WCA280A)
Measurement BW Sets the measurement bandwidth for the zone. -3 to 3 GHz (WCA230A)
-8 to 8 GHz (WCA280A)
Limit (Abs) Sets a relative level limit. -200 to 200 dBm
Limit (Rel) Sets an absolute level limit. -200 to 200 dBc
2-60 WCA230A & WCA280A Option 25 cdma2000 Analysis Software User Manual
Page 79

Editing the Measurement Limits
Table 2-2: Measurement limit items for the ACPR measurement (cont.)
Item Description Limit ranges
Fail Mode Selects the fail mode to detect fail conditions between the measurement results and
the test limits. The choices are:
Absolute: Fail is detected when the absolute measurement result is larger than
the limit for Limit (Abs).
Relative: Fail is detected when the relative measurement result is larger than the
limit for Limit (Rel).
-------------------
Perform the following steps to set measurement limits in the limits editor:
1. Press the Select column to edit side key.
2. Turn the rotary knob or press the arrow keys to select the column that you want
to edit.
3. Press the Enable side key to enable or disable use of the limits for the zone.
4. Press the side key corresponding to the limit item, and then use the rotary knob
or arrow keys to set the value.
5. Press the Failure Mode... side key to select the failure mode.
6. Press the Default limits to... side key if you want to use a given measurement
limit for the measurement. Refer to Measurement Limit Defaults on page 2-67
for information about the default settings of each measurement limit.
WCA230A & WCA280A Option 25 cdma2000 Analysis Software User Manual 2-61
Page 80

Editing the Measurement Limits
Setting the Spectrum
Emission Mask Limits
When you select the SEM Offset From Channel or SEM Inband Spurious row in
the measurement limits editor, another measurement limits editor for the spectrum
emission mask measurement is displayed. Figure 2-31 shows the measurement
limits editor for the spectrum emission mask measurement.
Figure 2-31: Spectrum emission mask measurement limits editor
Table 2-3 lists the measurement limit items that can be set in the measurement
limits editor.
Table 2-3: Measurement limit items for the spectrum emission mask measurement
Item Description Limit ranges
Enable Enables or disables use of the mask in the specified zone (A, B, C, D, or E). ------------------Beginning Frequency Sets the beginning frequency for the zone. -3 to 3 GHz (WCA230A)
-8 to 8 GHz (WCA280A)
Ending Frequency Sets the ending frequency for the zone. -3 to 3 GHz (WCA230A)
-8 to 8 GHz (WCA280A)
Measurement
Bandwidth
Offset from Carrier* Specifies which offset side is to be measured You can select Upper (positive), Lower
Sets the measurement bandwidth. -3 to 3 GHz (WCA230A)
-8 to 8 GHz (WCA280A)
-------------------
(negative), or Both.
2-62 WCA230A & WCA280A Option 25 cdma2000 Analysis Software User Manual
Page 81

Editing the Measurement Limits
Table 2-3: Measurement limit items for the spectrum emission mask measurement (cont.)
Item Description Limit ranges
Fail if signal exceeds Selects the fail mode to detect fail conditions between the measurement results and
the test limits. The choices are:
-------------------
Absolute: Fail is detected when one of the absolute measurement results is
larger than the limit for Beginning Absolute Limit and/or Ending Absolute Limit.
Relative: Fail is detected when one of the relative measurement results is larger
than the limit for Beginning Relative Limit and/or Ending Relative Limit.
Rel OR Abs: Fail is detected when one of the absolute measurement results is
larger than the limit for Beginning Absolute Limit and Ending Absolute Limit OR
one of the relative measurement results is larger than the limit for Beginning
Relative Limit and Ending Relative Limit.
Rel AND Abs: Fail is detected when one of the absolute measurement results is
larger than the limit for Beginning Absolute Limit and Ending Absolute Limit AND
one of the relative measurement results is larger than the limit for Beginning
Relative Limit and Ending Relative Limit.
Beginning Absolute
Limit
Ending Absolute Limit Sets an absolute level limit at Ending Frequency. -200 to 200 dBm
Beginning Relative
Limit
Ending Relative Limit Sets a relative level limit at Ending Frequency. -200 to 200 dBc
* This item is only available when SEM Offset From Channel is selected..
Sets an absolute level limit at Beginning Frequency. -200 to 200 dBm
Sets a relative level limit at Beginning Frequency. -200 to 200 dBc
Perform the following steps to set measurement limits in the limits editor:
1. Press the Select column to edit side key.
2. Turn the rotary knob or press the arrow keys to select the column that you want
to edit.
3. Press the Enable side key to enable or disable use of the limits for the zone.
4. Press the side key corresponding to the limit item, and then use the rotary knob
or arrow keys to set the value.
5. Press the Default limits to... side key if you want to use a given measurement
limit for the measurement. Refer to Measurement Limit Defaults on page 2-67
for information about the default settings of each measurement limit.
6. When you press the Rescale Graph side key, the graph is rescaled to match
the set limits.
WCA230A & WCA280A Option 25 cdma2000 Analysis Software User Manual 2-63
Page 82

Editing the Measurement Limits
Setting the Gated Output
Power Limits (Reverse
Link Only)
When you select the Gated Output Power row in the measurement limits editor,
another measurement limits editor for the gated output power measurement is
displayed. Figure 2-32 shows the measurement limits editor for the gated output
power measurement.
Figure 2-32: Gated output power measurement limits editor
Table 2-4 lists the measurement limit items that can be set in the measurement
limits editor.
Table 2-4: Measurement limit items for the gated output power measurement
Item Description Limit ranges
Enable Enables or disables use of the mask in the specified zone (A, B, C, D, or E). ------------------Beginning Time Offset Sets the beginning time for the zone. -10 to 10 s
Ending Time Offset Sets the ending time for the zone. -10 to 10 s
Limit Type Sets the limit type for the measurement. You can select Upper or Lower. ------------------Offset Side Specifies which offset side is to be measured. You can select Upper (positive), Lower
(negative), or Both.
-------------------
2-64 WCA230A & WCA280A Option 25 cdma2000 Analysis Software User Manual
Page 83

Editing the Measurement Limits
Table 2-4: Measurement limit items for the gated output power measurement (cont.)
Item Description Limit ranges
Fail if signal exceeds Selects the fail mode to detect fail conditions between the measurement results and
the test limits. The choices are:
-------------------
Absolute: Fail is detected when one of the absolute measurement results is
larger than the limit for Beginning Absolute Limit and/or Ending Absolute Limit.
Relative: Fail is detected when one of the relative measurement results is larger
than the limit for Beginning Relative Limit and/or Ending Relative Limit.
Rel OR Abs: Fail is detected when one of the absolute measurement results is
larger than the limit for Beginning Absolute Limit and Ending Absolute Limit OR
one of the relative measurement results is larger than the limit for Beginning
Relative Limit and Ending Relative Limit.
Rel AND Abs: Fail is detected when one of the absolute measurement results is
larger than the limit for Beginning Absolute Limit and Ending Absolute Limit AND
one of the relative measurement results is larger than the limit for Beginning
Relative Limit and Ending Relative Limit.
Beginning Absolute
Limit
Ending Absolute Limit Sets an absolute level limit at Ending Time Offset. -200 to 200 dBm
Beginning Relative
Limit
Ending Relative Limit Sets a relative level limit at Ending Time Offset. -200 to 200 dB
Sets an absolute level limit at Beginning Time Offset. -200 to 200 dBm
Sets a relative level limit at Beginning Time Offset. -200 to 200 dB
Perform the following steps to set measurement limits in the limits editor:
1. Press the Select column to edit side key.
2. Turn the rotary knob or press the arrow keys to select the column that you want
to edit.
3. Press the Enable side key to enable or disable use of the limits for the zone.
4. Press the side key corresponding to the limit item, and then use the rotary knob
or arrow keys to set the value.
5. Press the Default limits to... side key if you want to use a given measurement
limits for the measurement. Refer to Measurement Limit Defaults on page 2-67
for information about the default settings of each measurement limit.
6. When you press the Rescale Graph side key, the graph is rescaled to match the
set limits.
WCA230A & WCA280A Option 25 cdma2000 Analysis Software User Manual 2-65
Page 84

Editing the Measurement Limits
Saving and Loading Measurement Limits
Measurement limits that set in the measurement limits editor can be saved as a file
and loaded from a file. This section describes how to save and load measurement
limits.
Refer to the WCA230A & WCA280A Portable Wireless Communication Analyzers
User Manual, for further information about file operation including how to enter a
file name and how to delete a file.
Saving Measurement
Limits
Loading Measurement
Limits
Perform the following steps to save the current measurement limits to a file:
1. When you open the spectrum emission mask measurement limits editor or
gated output power measurement limits editor, press the Cancel-Back
(MENU) side key to return the measurement limit editor (see Figure 2-29).
2. Press the Save Limits side key to open the Save to File menu.
You can save the limits by using the preset file name or by entering a new file
name.
3. To use the preset file name, press one of the following side keys: Save to
LimitsA, Save to LimitsB, or Save to LimitsC.
4. To enter a new file name, type a file name in the text box at the top of the menu,
and then press the Save File Now side key.
The file extension *.lmt is automatically added to the limits file.
Perform the following steps to load measurement limits from a file:
1. When you open the spectrum emission mask measurement limits editor or
gated output power measurement limits editor, press the Cancel-Back
(MENU) side key to return the measurement limit editor (see Figure 2-29).
2. Press the Load Limits side key to open the Load From File menu.
3. To load limits from the preset file, press one of the following side keys: Load
from LimitsA, Load from LimitsB, or Load from LimitsC.
4. To load limits from an existing file, select the file from the file list, and then
press the Load File Now side key.
2-66 WCA230A & WCA280A Option 25 cdma2000 Analysis Software User Manual
Page 85

Measurement Limit Defaults
Tables 2-5 through 2-21 list the default limit settings used to perform the pass/file
testing for the cdma2000 measurements. Refer to Using the Measurement Limits
Editor on page 2-57 for procedures to edit the measurement limits.
Editing the Measurement Limits
Common Limits
Tables 2-5 and 2-6 list the common measurement limits that can be used for the
measurements other than the ACPR, Spectrum Emission Mask, and Gated Output
Power measurements.
Table 2-5: Forward link common limits
Limit Enable Lower Upper Units
Channel Power No -150 30 dBm
Intermod 3rd Order Yes N.A -45 dBc
Intermod 5th Order Yes N.A -55 dBc
RMS EVM No N.A 10 percent
Peak EVM No N.A 31 percent
Peak Code Domain Error No N.A 0.4 dB
Rho Yes 0.912 N.A N.A
Pilot To Code Timing Yes -50 n 50 n s
Pilot To Code Phase Yes -0.15 0.15 radian
OBW Yes N.A 1.48 M Hz
Tau Yes N.A 0.00001 s
Table 2-6: Reverse link common limits
Limit Enable Lower Upper Units
Channel Power No -150 30 dBm
Intermod 3rd Order Yes N.A -42 dBc
Intermod 5th Order Yes N.A -50 dBc
RMS EVM No N.A 10 percent
Peak EVM No N.A 24 percent
Peak Code Domain Error No N.A 0.25 dB
Rho Yes 0.994 N.A N.A
Pilot To Code Timing Yes -10 n 10 n s
Pilot To Code Phase Yes -0.15 0.15 radian
OBW Yes N.A 1.48 M Hz
WCA230A & WCA280A Option 25 cdma2000 Analysis Software User Manual 2-67
Page 86

Editing the Measurement Limits
ACPR Limits
Tables 2-7 and 2-8 list the measurement limits that can be used for the ACPR
measurement.
Table 2-7: Forward link: all band classes
Zone Enable Frequency Measure BW Limit (Abs) Limit (Rel) Fail Mode
A Yes 750 kHz 30 kHz -27 dBm -45 dBc Relative
B Yes -750 kHz 30 kHz -27 dBm -45 dBc Relative
C Yes 1.995 MHz 30 kHz -27 dBm -60 dBc Relative
D Yes -1.995 MHz 30 kHz -27 dBm -60 dBc Relative
E Yes 3.125 MHz 30 kHz -13 dBm -60 dBc Relative
F No -3.125 MHz 30 kHz -13 dBm -60 dBc Relative
G No 4 MHz 30 kHz -13 dBm -60 dBc Relative
H No -4 MHz 30 kHz -13 dBm -60 dBc Relative
I No 7.5 MHz 30 kHz -13 dBm -60 dBc Relative
J No -7.5 MHz 30 kHz -13 dBm -60 dBc Relative
K No 0 Hz 30 kHz -13 dBm -60 dBc Relative
L No 0 Hz 30 kHz -13 dBm -60 dBc Relative
Table 2-8: Reverse link: all band classes
Zone Enable Frequency Measure BW Limit (Abs) Limit (Rel) Fail Mode
A Yes 900 kHz 30 kHz -27 dBm -42 dBc Relative
B Yes -900 kHz 30 kHz -27 dBm -42 dBc Relative
C Yes 1.995 MHz 30 kHz -27 dBm -54 dBc Relative
D Yes -1.995 MHz 30 kHz -27 dBm -54 dBc Relative
E Yes 3.125 MHz 30 kHz -13 dBm -54 dBc Relative
F No -3.125 MHz 30 kHz -13 dBm -54 dBc Relative
G No 4 MHz 30 kHz -13 dBm -54 dBc Relative
H No -4 MHz 30 kHz -13 dBm -54 dBc Relative
I No 7.5 MHz 30 kHz -13 dBm -54 dBc Relative
J No -7.5 MHz 30 kHz -13 dBm -54 dBc Relative
K No 0 Hz 30 kHz -13 dBm -54 dBc Relative
L No 0 Hz 30 kHz -13 dBm -54 dBc Relative
2-68 WCA230A & WCA280A Option 25 cdma2000 Analysis Software User Manual
Page 87
Editing the Measurement Limits
SEM Offset from Channel
Limits
Tables 2-9 through 2-17 list the measurement limits that can be used for the SEM
Offset From Channel measurement.
Table 2-9: Forward link: BC (band class) 0, 2, 3, 5, and 9
Zone ABCDE
Enable Yes Yes Yes No No
Start Frequency 750 kHz 1.98 MHz 4 MHz 4 MHz 20 MHz
Stop Frequency 1.98 MHz 4.00 MHz 20 MHz 3 GHz 8 GHz
Measurement BW 30 kHz 30 kHz 1 MHz 1 MHz 1 MHz
Offset Side Both Both Both Both Both
Failure Mode Relative Rel OR Abs Absolute Absolute Absolute
Absolute Start 30 dBm -27 dBm -36 dBm -13 dBm -13 dBm
Absolute Stop 30 dBm -27 dBm -36 dBm -13 dBm -13 dBm
Relative Start -45 dBc -55 dBc 0 dBc 0 dBc 0 dBc
Relative Stop -45 dBc -55 dBc 0 dBc 0 dBc 0 dBc
Table 2-10: Forward link: BC (band class) 1, 4, and 8
Zone ABCDE
Enable Yes Yes Yes Yes No
Start Frequency 885 kHz 1.25 MHz 2.25 MHz 4 MHz 4 MHz
Stop Frequency 1.25 MHz 2.25 MHz 4 MHz 20 MHz 3 GHz
Measurement BW 30 kHz 30 kHz 1 MHz 1 MHz 1 MHz
Offset Side Both Both Both Both Both
Failure Mode Relative Rel OR Abs Absolute Absolute Absolute
Absolute Start 30 dBm -9 dBm -13 dBm -36 dBm -13 dBm
Absolute Stop 30 dBm -9 dBm -13 dBm -36 dBm -13 dBm
Relative Start -45 dBc -45 dBc 0 dBc 0 dBc 0 dBc
Relative Stop -45 dBc -45 dBc 0 dBc 0 dBc 0 dBc
WCA230A & WCA280A Option 25 cdma2000 Analysis Software User Manual 2-69
Page 88

Editing the Measurement Limits
Table 2-11: Forward link: BC (band class) 3b
Zone ABCDE
E na bl e Ye s Yes Ye s No N o
Start Frequency 750 kHz 1.98 MHz 4 MHz 4 MHz 20 MHz
Stop Frequency 1.98 MHz 4 MHz 20 MHz 3 MHz 8 GHz
Measurement BW 30 kHz 30 kHz 1 MHz 1 MHz 1 MHz
Offset Side Both Both Both Both Both
Failure Mode Relative Relative Absolute Absolute Absolute
Absolute Start 30 dBm -27 dBm -36 dBm -13 dBm -13 dBm
Absolute Stop 30 dBm -27 dBm -36 dBm -13 dBm -13 dBm
Relative Start -45 dBc -60 dBc 0 dBc 0 dBc 0 dBc
Relative Stop -45 dBc -60 dBc 0 dBc 0 dBc 0 dBc
Table 2-12: Forward link: BC (band class) 6
Zone ABCDE
E na bl e Ye s Yes Ye s Yes Ye s
Start Frequency 885 kHz 1.25 MHz 1.45 MHz 2.25 MHz 4 MHz
Stop Frequency 1.25 MHz 1.45 MHz 2.25 MHz 4 MHz 20 MHz
Measurement BW 30 kHz 30 kHz 30 kHz 1 MHz 1 MHz
Offset Side Both Both Both Both Both
Failure Mode Relative Rel OR Abs Rel OR Abs Absolute Absolute
Absolute Start 30 dBm -13 dBm -13 dBm -13 dBm -36 dBm
Absolute Stop 30 dBm -13 dBm -26.6 dBm
Relative Start -45 dBc -45 dBc -45 dBc 0 dBc 0 dBc
Relative Stop -45 dBc -45 dBc -45 dBc 0 dBc 0 dBc
1 Based on -[13+17x( ∆f-1.45 MHz)] dBm when ∆f is 2.25 MHz.
1
-13 dBm -36 dBm
2-70 WCA230A & WCA280A Option 25 cdma2000 Analysis Software User Manual
Page 89

Editing the Measurement Limits
Table 2-13: Forward link: BC (band class) 7
Zone ABCDE
Enable Yes Yes Yes Yes Yes
Start Frequency 750 kHz 1.98 MHz 3.25 MHz 4 MHz 4 MHz
Stop Frequency 1.98 MHz 3.25 MHz 4 MHz 20 MHz 20 MHz
Measurement BW 30 kHz 30 kHz 30 kHz 1 MHz 1 MHz
Offset Side Both Both Both Both Both
Failure Mode Relative Rel OR Abs Rel OR Abs Absolute Absolute
Absolute Start 30 dBm -27 dBm -46 dBm -36 dBm -36 dBm
Absolute Stop 30 dBm -27 dBm -46 dBm -36 dBm -36 dBm
Relative Start -45 dBc -55 dBc -55 dBc 0 dBc 0 dBc
Relative Stop -45 dBc -55 dBc -55 dBc 0 dBc 0 dBc
.
Table 2-14: Reverse link: BC (band class) 0, 2, 3, 5, and 9
Zone ABCDE
Enable Yes Yes Yes No No
Start Frequency 885 kHz 1.98 MHz 4 MHz 4 MHz 20 MHz
Stop Frequency 1.98 MHz 4 MHz 20 MHz 3 GHz 8 GHz
Measurement BW 30 kHz 30 kHz 1 MHz 1 MHz 1 MHz
Offset Side Both Both Both Both Both
Failure Mode Rel AND Abs Rel AND Abs Absolute Absolute Absolute
Absolute Start -54 dBm -54 dBm -36 dBm -13 dBm -13 dBm
Absolute Stop -54 dBm -54 dBm -36 dBm -13 dBm -13 dBm
Relative Start -42 dBc -55 dBc 0 dBc 0 dBc 0 dBc
Relative Stop -42 dBc -55 dBc 0 dBc 0 dBc 0 dBc
WCA230A & WCA280A Option 25 cdma2000 Analysis Software User Manual 2-71
Page 90

Editing the Measurement Limits
.
Table 2-15: Reverse link: BC (band class) 1, 4, and 8
Zone ABCDE
E na bl e Ye s Yes Ye s No N o
Start Frequency 1.25 MHz 1.98 MHz 4 MHz 4 MHz 20 MHz
Stop Frequency 1.98 MHz 4 MHz 20 MHz 3 GHz 8 GHz
Measurement BW 30 kHz 30 kHz 1 MHz 1 MHz 1 MHz
Offset Side Both Both Both Both Both
Failure Mode Relative Rel OR Abs Absolute Absolute Absolute
Absolute Start -54 dBm -54 dBm -36 dBm -13 dBm -13 dBm
Absolute Stop -54 dBm -54 dBm -36 dBm -13 dBm -13 dBm
Relative Start -42 dBc -50 dBc 0 dBc 0 dBc 0 dBc
Relative Stop -42 dBc -50 dBc 0 dBc 0 dBc 0 dBc
.
Table 2-16: Reverse link: BC (band class) 6
Zone ABCDE
E na bl e Ye s Yes Ye s No N o
Start Frequency 1.25 MHz 1.98 MHz 2.25 MHz 2.25 MHz 4 MHz
Stop Frequency 1.98 MHz 2.25 MHz 4 MHz 4 MHz 20 MHz
Measurement BW 30 kHz 30 kHz 1 MHz 1 MHz 1 MHz
Offset Side Both Both Both Both Both
Failure Mode Rel AND Abs Rel OR Abs Rel OR Abs Absolute Absolute
Absolute Start -54 dBm -54 dBm -13 dBm -13 dBm -36 dBm
Absolute Stop -54 dBm -54 dBm -14.75 dBm
Relative Start -42 dBc -50 dBc -45 dBc 0 dBc 0 dBc
Relative Stop -42 dBc -50 dBc -45 dBc 0 dBc 0 dBc
2 Based on -[13+1x( ∆f-2.25 MHz)] dBm when ∆f is 4 MHz.
2
-13 dBm -36 dBm
2-72 WCA230A & WCA280A Option 25 cdma2000 Analysis Software User Manual
Page 91

Editing the Measurement Limits
.
Table 2-17: Reverse link: BC (band class) 7
Zone ABCDE
Enable Yes Yes Yes Yes Yes
Start Frequency 885 kHz 1.98 MHz 2.25 MHz 4 MHz 4 MHz
Stop Frequency 1.98 MHz 2.25 MHz 4 MHz 20 MHz 20 MHz
Measurement BW 30 kHz 30 kHz 30 kHz 1 MHz 1 MHz
Offset Side Both Both Both Both Both
Failure Mode Rel AND Abs Rel AND Abs Rel AND Abs Absolute Absolute
Absolute Start -54 dBm -54 dBm -35 dBm -36 dBm -36 dBm
Absolute Stop -54 dBm -54 dBm -35 dBm -36 dBm -36 dBm
Relative Start -42 dBc -54 dBc -55 dBc 0 dBc 0 dBc
Relative Stop -42 dBc -54 dBc -55 dBc 0 dBc 0 dBc
SEM Inband Spurious
Limits
Tables 2-18 through 2-20 list the measurement limits that can be used for the SEM
Inband Spurious measurement.
Table 2-18: Forward and reverse link: BC (band class) 0, 1, 2, 3, 4, 5, 7, 8, and 9
Zone ABCDE
Enable Yes Yes No No No
Start Frequency 1 GHz 925 MHz 935 MHz 1.805 GHz 4 MHz
Stop Frequency 3 GHz 935 MHz 960 MHz 1.880 GHz 8 GHz
Measurement BW 1 MHz 100 kHz 100 kHz 100 kHz 1 MHz
Failure Mode Absolute Absolute Absolute Absolute Absolute
Absolute Start -36 dBm -67 dBm -79 dBm -71 dBm -36 dBm
Absolute Stop -36 dBm -67 dBm -79 dBm -71 dBm -36 dBm
Relative Start 0 dBc 0 dBc 0 dBc 0 dBc 0 dBc
Relative Stop 0 dBc 0 dBc 0 dBc 0 dBc 0 dBc
WCA230A & WCA280A Option 25 cdma2000 Analysis Software User Manual 2-73
Page 92

Editing the Measurement Limits
Table 2-19: Forward link: BC (band class) 6
Zone ABCDE
E na bl e Ye s Yes Ye s Yes N o
Start Frequency 1.8935 GHz 925 MHz 935 MHz 1.805 GHz 4 MHz
Stop Frequency 1.9196 GHz 935 MHz 960 MHz 1.880 GHz 20 MHz
Measurement BW 300 kHz 100 kHz 100 kHz 100 kHz 1 MHz
Failure Mode Absolute Absolute Absolute Absolute Absolute
Absolute Start -41 dBm -67 dBm -79 dBm -71 dBm -36 dBm
Absolute Stop -41 dBm -67 dBm -79 dBm -71 dBm -36 dBm
Relative Start 0 dBc 0 dBc 0 dBc 0 dBc 0 dBc
Relative Stop 0 dBc 0 dBc 0 dBc 0 dBc 0 dBc
Table 2-20: Reverse link: BC (band class) 6
Zone ABCDE
E na bl e Ye s Yes Ye s Yes Ye s
Start Frequency 1.8935 GHz 876 MHz 921 MHz 1.710 GHz 1.805 GHz
Stop Frequency 1.9196 GHz 915 MHz 960 MHz 1.785 GHz 1.880 GHz
Measurement BW 300 kHz 100 kHz 100 kHz 100 kHz 100 kHz
Failure Mode Absolute Absolute Absolute Absolute Absolute
Absolute Start -41 dBm -98 dBm -57 dBm -98 dBm -47 dBm
Absolute Stop -41 dBm -98 dBm -57 dBm -98 dBm -47 dBm
Relative Start 0 dBc 0 dBc 0 dBc 0 dBc 0 dBc
Relative Stop 0 dBc 0 dBc 0 dBc 0 dBc 0 dBc
2-74 WCA230A & WCA280A Option 25 cdma2000 Analysis Software User Manual
Page 93

Editing the Measurement Limits
Gated Output Power Limits
Table 2-21 list the measurement limits that can be used for the gated output power
measurement.
Table 2-21: Reverse link: all band classes
Zone ABCDE
Enable Yes Yes No No No
Start Time 0 s 630.5 µs 0 s 1.2555 ms 0 s
Stop Time 623.5 µs 3.125 ms 1.2485 ms 3.125 ms 3.125 ms
Upper/Lower Lower Upper Lower Upper Upper
Offset Side Both Both Both Both Both
Failure Mode Relative Relative Relative Relative Absolute
Absolute Start -150 dBm 30 dBm -150 dBm 30 dBm 30 dBm
Absolute Stop -150 dBm 30 dBm -150 dBm 30 dBm 30 dBm
Relative Start -3 dB -20 dB -3 dB -20 dB -150 dB
Relative Stop -3 dB -20 dB -3 dB -20 dB -150 dB
WCA230A & WCA280A Option 25 cdma2000 Analysis Software User Manual 2-75
Page 94

Editing the Measurement Limits
2-76 WCA230A & WCA280A Option 25 cdma2000 Analysis Software User Manual
Page 95

Syntax and Commands
Page 96

Page 97
Command Groups
This section shows the organization of the Option 25 commands in a number of
functional groups.
For detailed information about other commands can be used with the WCA230A
or WCA280A, refer to the WCA230A & WCA280A Wireless Communication
Analyzers Programmer Manual.
Items followed by question marks are queries; items without question marks are
commands. Some items in this section have a question mark in parentheses (?) in
the command header section; this indicates that the item can be both a command
and a query.
You need to select one of the following measurement modes before executing any
commands for the Option 25. To set the measurement mode, use the
:INSTrument[:SELect] command using one of the mnemonics listed below:
Table 3-1: Measurement modes
Mnemonic Meaning
DEMFLCDMA2K cdma2000 forward link analysis
DEMRLCDMA2K cdma2000 reverse link analysis
For more information on SCPI commands and programming structure, refer to
WCA230A & WCA280A Wireless Communication Analyzers Programmer
Manual.
NOTE. Throughout the header descriptions in this section, the word Standard in
italics is substituted for either of the following two measurement standards;
FLCDMA2K (cdma2000 forward link) or RLCDMA2K (cdma2000 reverse link).
WCA230A & WCA280A Option 25 cdma2000 Analysis Software User Manual 3-1
Page 98

Command Groups
:CONFigure Commands
Use these commands to set up the analyzer to perform the specified measurement.
Table 3-2: :CONFigure commands
Header Description
:CONFigure:Standard:ACPower Sets up the analyzer to the ACPR measurement default settings.
:CONFigure:Standard:CCDF Sets up the analyzer to the CCDF measurement default settings.
:CONFigure:Standard:CDPower Sets up the analyzer to the code domain power measurement default settings.
:CONFigure:Standard:CHPower Sets up the analyzer to the channel power measurement default settings.
:CONFigure:Standard:IM Sets up the analyzer to the intermodulation measurement default settings.
:CONFigure:Standard:MACCuracy Sets up the analyzer to the modulation accuracy measurement default settings.
:CONFigure:Standard:OBWidth Sets up the analyzer to the occupied band width measurement default settings.
:CONFigure:Standard:PCCHannel Sets up the analyzer to the pilot to code channel measurement default settings.
:CONFigure:RLCDMA2K:PVTime Sets up the analyzer to the gated output power measurement default settings.
:CONFigure:Standard:SEMask Sets up the analyzer to the spectrum emission mask measurement default settings.
:DISPlay Commands
Use these commands to control how to show measurement data on the screen.
Table 3-3: :DISPlay commands
Header Description
:DISPlay:Standard:CCDF subgroup
:DISPlay:Standard:CCDF:LINE:GAUSsian
[:STATe] (?)
:DISPlay:Standard:CCDF:LINE:REFerence
[:STATe] (?)
:DISPlay:Standard:CCDF:LINE:REFerence:STORe Stores a new reference line.
:DISPlay:Standard:CCDF:X[:SCALe]:AUTO (?) Determines whether to set the horizontal scale automatically in the CCDF view.
:DISPlay:Standard:CCDF:X[:SCALe]
:MAXimum (?)
:DISPlay:Standard:CCDF:X[:SCALe]
:OFFSet (?)
:DISPlay:Standard:CCDF:Y[:SCALe]:FIT Runs auto-scale on the CCDF view.
:DISPlay:Standard:CCDF:Y[:SCALe]:FULL Sets the vertical axis to the default full-scale value in the CCDF view.
:DISPlay:Standard:CCDF:Y[:SCALe]
:MAXimum (?)
:DISPlay:Standard:CCDF:Y[:SCALe]
:MINimum (?)
Sets whether to display the Gaussian line on the CCDF view.
Sets whether to display the reference line on the CCDF view.
Sets the horizontal maximum value (right end) in the CCDF view.
Sets the minimum horizontal value (left end) in the CCDF view.
Sets the maximum vertical value (top end) in the CCDF view.
Sets the minimum vertical value (bottom end) in the CCDF view.
3-2 WCA230A & WCA280A Option 25 cdma2000 Analysis Software User Manual
Page 99

Table 3-3: :DISPlay commands (cont.)
Header Description
:DISPlay:Standard:DDEMod subgroup
:DISPlay:Standard:DDEMod:MVIew:CORDer (?) Sets the code order.
:DISPlay:Standard:DDEMod:MVIew:FORMat (?) Selects the main view display format.
:DISPlay:Standard:DDEMod:MVIew:X[:SCALe]
:OFFSet (?)
:DISPlay:Standard:DDEMod:MVIew:X[:SCALe]
:RANGe (?)
:DISPlay:Standard:DDEMod:MVIew:Y[:SCALe]:FIT Runs auto-scale on the main view.
:DISPlay:Standard:DDEMod:MVIew:Y[:SCALe]
:FULL
:DISPlay:Standard:DDEMod:MVIew:Y[:SCALe]
:OFFSet (?)
:DISPlay:Standard:DDEMod:MVIew:Y[:SCALe]
:PUNit (?)
:DISPlay:Standard:DDEMod:MVIew:Y[:SCALe]
:RANGe (?)
:DISPlay:Standard:DDEMod:SVIew:FORMat (?) Selects the subview display format.
:DISPlay:Standard:DDEMod:SVIew:X[:SCALe]
:OFFSet (?)
:DISPlay:Standard:DDEMod:SVIew:X[:SCALe]
:RANGe (?)
:DISPlay:Standard:DDEMod:SVIew:Y[:SCALe]:FIT Runs auto-scale on the subview.
:DISPlay:Standard:DDEMod:SVIew:Y[:SCALe]
:FULL
:DISPlay:Standard:DDEMod:SVIew:Y[:SCALe]
:OFFSet (?)
:DISPlay:Standard:DDEMod:SVIew:Y[:SCALe]
:RANGe (?)
:DISPlay:Standard:SPECtrum subgroup
:DISPlay:Standard:SPECtrum:X[:SCALe]
:OFFSet (?)
:DISPlay:Standard:SPECtrum:X[:SCALe]
:PDIVision (?)
:DISPlay:Standard:SPECtrum:Y[:SCALe]:FIT Runs auto-scale on the spectrum view.
:DISPlay:Standard:SPECtrum:Y[:SCALe]:FULL Sets the vertical axis to the default full-scale value.
:DISPlay:Standard:SPECtrum:Y[:SCALe]
:OFFSet (?)
:DISPlay:Standard
:PDIVision (?)
:SPECtrum:Y[:SCALe]
Sets the minimum horizontal value (left end) in the main view.
Sets the horizontal full-scale value in the main view.
Sets the main view’s vertical axis to the default full-scale value.
Sets the minimum vertical value (bottom end) in the main view.
Sets the unit of the vertical axis in the main view.
Sets the vertical full-scale value in the main view.
Sets the minimum horizontal value (left end) in the subview.
Sets the horizontal full-scale value in the subview.
Sets the subview’s vertical axis to the default full-scale value.
Sets the minimum vertical value (bottom end) in the subview.
Sets the vertical full-scale value in the subview.
Sets the minimum horizontal value (left end) in the spectrum view.
Sets the horizontal scale in the spectrum view.
Sets the minimum vertical value (bottom end) in the spectrum view.
Sets the vertical scale in the spectrum view.
Command Groups
WCA230A & WCA280A Option 25 cdma2000 Analysis Software User Manual 3-3
Page 100

Command Groups
Table 3-3: :DISPlay commands (cont.)
Header Description
:DISPlay:RLCDMA2K:WAVeform subgroup
:DISPlay:RLCDMA2K:WAVeform:X[:SCALe]
:OFFSet (?)
:DISPlay:RLCDMA2K:WAVeform:X[:SCALe]
:PDIVision (?)
:DISPlay:RLCDMA2K:WAVeform:Y[:SCALe]:FIT Runs auto-scale on the time domain display.
:DISPlay:RLCDMA2K:WAVeform:Y[:SCALe]:FULL Sets the vertical axis to the default full scale.
:DISPlay:RLCDMA2K:WAVeform:Y[:SCALe]
:OFFSet (?)
:DISPlay:RLCDMA2K:WAVeform:Y[:SCALe]
:PDIVision (?)
Sets the minimum horizontal value in the time domain display.
Sets the horizontal or time scale per division in the spectrum view.
Sets the minimum vertical value in the time domain display.
Sets the vertical scale per division in the time domain display.
:FETCh Commands
Use these commands to retrieve the measurement from the data taken by the latest
:INITiate command.
If you want to perform a FETCh operation on fresh data, use the :READ
commands, which acquire a new input signal and fetch the measurement results
from that data.
Table 3-4: :FETCh commands
Header Description
:FETCh:Standard:ACPower? Returns the ACPR measurement results.
:FETCh:Standard:CCDF? Returns the CCDF measurement results.
:FETCh:Standard:CDPower? Returns the code domain power measurement results.
:FETCh:Standard:CHPower? Returns the channel power measurement results.
:FETCh:Standard:IM? Returns the intermodulation measurement results.
:FETCh:Standard:MACCuracy? Returns the modulation accuracy measurement results.
:FETCh:Standard:OBWidth? Returns the occupied bandwidth measurement results.
:FETCh:Standard:PCCHannel? Returns the pilot-to-code channel measurement results.
:FETCh:RLCDMA2K:PVTime? Returns the gated output power measurement results.
:FETCh:Standard:SEMask? Returns the spectrum emission mask measurement results.
:FETCh:Standard:DISTribution:CCDF? Returns the distribution data of the CCDF measurement.
:FETCh:RLCDMA2K:TAMPlitude:PVTime? Returns the time amplitude for the gated output power measurement.
:FETCh:Standard:SPECtrum:ACPower? Returns the spectrum waveform data of the ACPR measurement.
:FETCh:Standard:SPECtrum:CHPower? Returns the spectrum waveform data of the channel power measurement.
:FETCh:Standard:SPECtrum:IM? Returns the spectrum waveform data of the intermodulation measurement.
:FETCh:Standard:SPECtrum:OBWidth? Returns the spectrum waveform data of the occupied bandwidth measurement.
3-4 WCA230A & WCA280A Option 25 cdma2000 Analysis Software User Manual
 Loading...