

Page 1

User Manual
WCA230A & WCA280A Option 24
GSM/EDGE Analysis Software
071-1479-00
This document applies to firmware version 2.0
and above.
www.tektronix.com
Page 2

Copyright © Tektronix Japan, Ltd. All rights reserved.
Copyright © Tektronix, Inc. All rights reserved.
Tektronix products are covered by U.S. and foreign patents, issued and pending. Information in this publication supercedes
that in all previously published material. Specifications and price change privileges reserved.
Tektronix Japan, Ltd., Shinagawa Intercity Building B 6th Floor, 2-15-2 Konan, Minato-ku, Tokyo 108-6106 Japan
Tektronix, Inc., P.O. Box 500, Beaverton, OR 97077
TEKTRONIX and TEK are registered trademarks of Tektronix, Inc.
Windows and Windows 98 are trademarks of Microsoft Corporation.
Page 3

Hardware Warranty
Tektronix warrants that the products that it manufactures and sells will be free from defects in materials and workmanship
for a period of one (1) year from the date of shipment. If a product proves defective during this warranty period, Tektronix,
at its option, either will repair the defective product without charge for parts and labor, or will provide a replacement in
exchange for the defective product.
In order to obtain service under this warranty, Customer must notify Tektronix of the defect before the expiration of the
warranty period and make suitable arrangements for the performance of service. Customer shall be responsible for
packaging and shipping the defective product to the service center designated by Tektronix, with shipping charges prepaid.
Tektronix shall pay for the return of the product to Customer if the shipment is to a location within the country in which the
Tektronix service center is located. Customer shall be responsible for paying all shipping charges, duties, taxes, and any
other charges for products returned to any other locations.
This warranty shall not apply to any defect, failure or damage caused by improper use or improper or inadequate
maintenance and care. Tektronix shall not be obligated to furnish service under this warranty a) to repair damage resulting
from attempts by personnel other than Tektronix representatives to install, repair or service the product; b) to repair
damage resulting from improper use or connection to incompatible equipment; c) to repair any damage or malfunction
caused by the use of non-Tektronix supplies; or d) to service a product that has been modified or integrated with other
products when the effect of such modification or integration increases the time or difficulty of servicing the product.
THIS WARRANTY IS GIVEN BY TEKTRONIX IN LIEU OF ANY OTHER WARRANTIES, EXPRESS OR
IMPLIED. TEKTRONIX AND ITS VENDORS DISCLAIM ANY IMPLIED WARRANTIES OF
MERCHANTABILITY OR FITNESS FOR A PARTICULAR PURPOSE. TEKTRONIX’ RESPONSIBILITY TO
REPAIR OR REPLACE DEFECTIVE PRODUCTS IS THE SOLE AND EXCLUSIVE REMEDY PROVIDED TO
THE CUSTOMER FOR BREACH OF THIS WARRANTY. TEKTRONIX AND ITS VENDORS WILL NOT BE
LIABLE FOR ANY INDIRECT, SPECIAL, INCIDENTAL, OR CONSEQUENTIAL DAMAGES IRRESPECTIVE
OF WHETHER TEKTRONIX OR THE VENDOR HAS ADVANCE NOTICE OF THE POSSIBILITY OF SUCH
DAMAGES.
Page 4

Software Warranty
Tektronix warrants that the media on which this software product is furnished and the encoding of the programs on the
media will be free from defects in materials and workmanship for a period of three (3) months from the date of shipment.
If a medium or encoding proves defective during the warranty period, Tektronix will provide a replacement in exchange
for the defective medium. Except as to the media on which this software product is furnished, this software product is
provided “as is” without warranty of any kind, either express or implied. Tektronix does not warrant that the functions
contained in this software product will meet Customer’s requirements or that the operation of the programs will be
uninterrupted or error–free.
In order to obtain service under this warranty, Customer must notify Tektronix of the defect before the expiration of the
warranty period. If Tektronix is unable to provide a replacement that is free from defects in materials and workmanship
within a reasonable time thereafter, Customer may terminate the license for this software product and return this software
product and any associated materials for credit or refund.
THIS WARRANTY IS GIVEN BY TEKTRONIX IN LIEU OF ANY OTHER WARRANTIES, EXPRESS OR
IMPLIED. TEKTRONIX AND ITS VENDORS DISCLAIM ANY IMPLIED WARRANTIES OF
MERCHANTABILITY OR FITNESS FOR A PARTICULAR PURPOSE. TEKTRONIX’ RESPONSIBILITY TO
REPLACE DEFECTIVE MEDIA OR REFUND CUSTOMER’S PAYMENT IS THE SOLE AND EXCLUSIVE
REMEDY PROVIDED TO THE CUSTOMER FOR BREACH OF THIS WARRANTY. TEKTRONIX AND ITS
VENDORS WILL NOT BE LIABLE FOR ANY INDIRECT, SPECIAL, INCIDENTAL, OR CONSEQUENTIAL
DAMAGES IRRESPECTIVE OF WHETHER TEKTRONIX OR THE VENDOR HAS ADVANCE NOTICE OF
THE POSSIBILITY OF SUCH DAMAGES.
Page 5

Table of Contents
Getting Started
Operating Basics
Preface v. . . . . . . . . . . . . . . . . . . . . . . . . . . . . . . . . . . . . . . . . . . . . . . . . . .
Definition of the GSM/EDGE Analysis 1–2. . . . . . . . . . . . . . . . . . . . . . . . . . . . . . . .
Channel Frequencies 1–2. . . . . . . . . . . . . . . . . . . . . . . . . . . . . . . . . . . . . . . . . . . . . .
Measurement Functions 1–3. . . . . . . . . . . . . . . . . . . . . . . . . . . . . . . . . . . . . . . . . . . .
Measurement Menu 1–8. . . . . . . . . . . . . . . . . . . . . . . . . . . . . . . . . . . . . . . . . . . . . . .
Burst Analysis 2–1. . . . . . . . . . . . . . . . . . . . . . . . . . . . . . . . . . . . . . . . . . . . .
Measurement Procedure 2–1. . . . . . . . . . . . . . . . . . . . . . . . . . . . . . . . . . . . . . . . . . . .
Meas Setup Menu 2–4. . . . . . . . . . . . . . . . . . . . . . . . . . . . . . . . . . . . . . . . . . . . . . . . .
Modulation Accuracy Measurement 2–6. . . . . . . . . . . . . . . . . . . . . . . . . . . . . . . . . .
Mean Carrier Power Measurement 2–7. . . . . . . . . . . . . . . . . . . . . . . . . . . . . . . . . . .
Power versus Time Measurement 2–8. . . . . . . . . . . . . . . . . . . . . . . . . . . . . . . . . . . .
Modulation Spectrum Measurement 2–9. . . . . . . . . . . . . . . . . . . . . . . . . . . . . . . . . .
Switching Spectrum Measurement 2–10. . . . . . . . . . . . . . . . . . . . . . . . . . . . . . . . . . .
Spurious Analysis 2–11. . . . . . . . . . . . . . . . . . . . . . . . . . . . . . . . . . . . . . . . . .
Measurement Procudure 2–11. . . . . . . . . . . . . . . . . . . . . . . . . . . . . . . . . . . . . . . . . . . .
Meas Setup Menu 2–12. . . . . . . . . . . . . . . . . . . . . . . . . . . . . . . . . . . . . . . . . . . . . . . . .
Measurement Example 2–13. . . . . . . . . . . . . . . . . . . . . . . . . . . . . . . . . . . . . . . . . . . . .
Scale and Format of View 2–15. . . . . . . . . . . . . . . . . . . . . . . . . . . . . . . . . . . .
Constellation View 2–16. . . . . . . . . . . . . . . . . . . . . . . . . . . . . . . . . . . . . . . . . . . . . . . .
EVM View 2–18. . . . . . . . . . . . . . . . . . . . . . . . . . . . . . . . . . . . . . . . . . . . . . . . . . . . . .
Power vs. Time View 2–20. . . . . . . . . . . . . . . . . . . . . . . . . . . . . . . . . . . . . . . . . . . . . .
Syntax and Commands
Command Groups 3–1. . . . . . . . . . . . . . . . . . . . . . . . . . . . . . . . . . . . . . . . . .
Functional Groups 3–2. . . . . . . . . . . . . . . . . . . . . . . . . . . . . . . . . . . . . . . . . . . . . . . .
:CONFigure Commands 3–3. . . . . . . . . . . . . . . . . . . . . . . . . . . . . . . . . . . . . . . . . . . .
:DISPlay Commands 3–4. . . . . . . . . . . . . . . . . . . . . . . . . . . . . . . . . . . . . . . . . . . . . .
:FETCh Commands 3–5. . . . . . . . . . . . . . . . . . . . . . . . . . . . . . . . . . . . . . . . . . . . . . .
:READ Commands 3–6. . . . . . . . . . . . . . . . . . . . . . . . . . . . . . . . . . . . . . . . . . . . . . . .
:SENSe Commands 3–7. . . . . . . . . . . . . . . . . . . . . . . . . . . . . . . . . . . . . . . . . . . . . . .
:CONFigure Commands 3–9. . . . . . . . . . . . . . . . . . . . . . . . . . . . . . . . . . . . .
:DISPlay Commands 3–17. . . . . . . . . . . . . . . . . . . . . . . . . . . . . . . . . . . . . . . .
:FETCh Commands 3–45. . . . . . . . . . . . . . . . . . . . . . . . . . . . . . . . . . . . . . . .
:READ Commands 3–57. . . . . . . . . . . . . . . . . . . . . . . . . . . . . . . . . . . . . . . . .
:SENSe Commands 3–69. . . . . . . . . . . . . . . . . . . . . . . . . . . . . . . . . . . . . . . . .
WCA230A & WCA280A Option 24 User Manual
i
Page 6

Table of Contents
Appendices
Index
Appendix A: Specifications A–1. . . . . . . . . . . . . . . . . . . . . . . . . . . . . . . . . . .
Electrical Characteristics A–1. . . . . . . . . . . . . . . . . . . . . . . . . . . . . . . . . . . . . . . . . . .
Appendix B: Factory Initialization Settings B–1. . . . . . . . . . . . . . . . . . . . .
Appendix C: Scale Setting Range C–1. . . . . . . . . . . . . . . . . . . . . . . . . . . . .
Appendix D: SCPI Conformance Information D–1. . . . . . . . . . . . . . . . . . .
ii
WCA230A & WCA280A Option 24 User Manual
Page 7

List of Figures
Table of Contents
Figure 1–1: An example of the GSM/EDGE analysis display 1–1. . . . . . .
Figure 1–2: Slot data structure 1–3. . . . . . . . . . . . . . . . . . . . . . . . . . . . . . .
Figure 1–3: GSM/EDGE standard masks for Power versus Time
measurement 1–4. . . . . . . . . . . . . . . . . . . . . . . . . . . . . . . . . . . . . . . . . . .
Figure 1–4: GSM/EDGE measurement menu 1–8. . . . . . . . . . . . . . . . . . .
Figure 2–1: Setting analysis range on the overview 2–2. . . . . . . . . . . . . . .
Figure 2–2: Modulation accuracy measurement 2–6. . . . . . . . . . . . . . . . .
Figure 2–3: Mean carrier power measurement 2–7. . . . . . . . . . . . . . . . . .
Figure 2–4: Power versus Time measurement 2–8. . . . . . . . . . . . . . . . . . .
Figure 2–5: Modulation spectrum measurement 2–9. . . . . . . . . . . . . . . . .
Figure 2–6: Switching spectrum measurement 2–10. . . . . . . . . . . . . . . . . .
Figure 2–7: Spurious measurement 2–13. . . . . . . . . . . . . . . . . . . . . . . . . . . .
Figure 2–8: Vector and Constellation display 2–16. . . . . . . . . . . . . . . . . . . .
Figure 2–9: EVM, amplitude error, and phase error display 2–18. . . . . . .
Figure 2–10: Expanding a burst 2–20. . . . . . . . . . . . . . . . . . . . . . . . . . . . . . .
WCA230A & WCA280A Option 24 User Manual
iii
Page 8

Table of Contents
List of Tables
Table 1–1: Additional functions in Option 24 1–1. . . . . . . . . . . . . . . . . . .
Table 1–2: Channel Frequencies 1–2. . . . . . . . . . . . . . . . . . . . . . . . . . . . . .
Table 1–3: Measurement items 1–3. . . . . . . . . . . . . . . . . . . . . . . . . . . . . . .
Table 1–4: Modulation spectrum standard masks 1 1–5. . . . . . . . . . . . .
Table 1–5: Switching spectrum standard masks 1 1–6. . . . . . . . . . . . . . .
Table 1–6: Spurious measurement conditions 1–7. . . . . . . . . . . . . . . . . . .
Table 3–1: Measurement mode added in Option 24 3–1. . . . . . . . . . . . . .
Table 3–2: List of command groups 3–2. . . . . . . . . . . . . . . . . . . . . . . . . . .
Table 3–3: :CONFigure commands 3–3. . . . . . . . . . . . . . . . . . . . . . . . . . .
Table 3–4: :DISPlay commands 3–4. . . . . . . . . . . . . . . . . . . . . . . . . . . . . .
Table 3–5: :FETCh commands 3–5. . . . . . . . . . . . . . . . . . . . . . . . . . . . . . .
Table 3–6: :READ commands 3–6. . . . . . . . . . . . . . . . . . . . . . . . . . . . . . . .
Table 3–7: :SENSe commands 3–7. . . . . . . . . . . . . . . . . . . . . . . . . . . . . . . .
Table 3–8: :DISPlay command subgroups 3–17. . . . . . . . . . . . . . . . . . . . . .
Table 3–9: Main view display formats 3–20. . . . . . . . . . . . . . . . . . . . . . . . .
Table 3–10: Subview display formats 3–27. . . . . . . . . . . . . . . . . . . . . . . . . .
Table 3–11: X offset setting range 3–35. . . . . . . . . . . . . . . . . . . . . . . . . . . . .
Table 3–12: :SENSe command subgroups 3–69. . . . . . . . . . . . . . . . . . . . . .
Table 3–13: GSM/EDGE measurement items 3–79. . . . . . . . . . . . . . . . . . .
Table A–1: GSM/EDGE (Option 24) A–1. . . . . . . . . . . . . . . . . . . . . . . . . .
Table B–1: Factory initialization settiings — :DISPlay commands B–1. .
Table B–2: Factory initialization settiings — :SENSe commands B–2. . .
Table C–1: Display format and scale C–1. . . . . . . . . . . . . . . . . . . . . . . . . .
Table D–1: SCPI conformance information — :CONFigure
commands D–1. . . . . . . . . . . . . . . . . . . . . . . . . . . . . . . . . . . . . . . . . . . . .
Table D–2: SCPI conformance information — :DISPlay commands D–1
Table D–3: SCPI conformance information — :FETCh commands D–2.
Table D–4: SCPI conformance information — :READ commands D–3.
Table D–5: SCPI conformance information — :SENSe commands D–4.
iv
WCA230A & WCA280A Option 24 User Manual
Page 9

Preface
About This Manual
This manual describes how to use the WCA230A and WCA280A Option 24
GSM/EDGE Analysis Software. For details on the standard functions of the
analyzer, refer to the WCA230A and WCA280A Wireless Communication
Analyzers User Manual.
The manual consists of the following sections:
H Getting Started describes the overview of the GSM/EDGE analysis.
H Operating Basics explains the menu functions and measurement procedures.
H Syntax and Commands presents descriptions of the GPIB commands
provided in Option 24.
H Appendices provide additional information including factory initialization
settings, scale setting ranges, and SCPI conformance informatin.
Related Documents
The following documents are also available for the analyzer.
H WCA230A and WCA280A User Manual
(Standard accessory; Tektronix part number 071-1253-XX)
Describes how to install the analyzer and how to work with the menus, and
details the standard functions. Also shows the specifications.
H WCA230A and WCA280A Programmer Manual
(Standard accessory; Tektronix part number 071-1255-XX)
Contains an alphabetical listing of the programming commands and other
information related to controlling the analyzer over the GPIB interface.
WCA230A & WCA280A Option 24 User Manual
v
Page 10

Preface
Conventions
This manual uses the following conventions:
H Front-panel button and control labels are printed in the manual in upper case
text. For example, SPAN, PEAK, PRINT. If it is part of a procedure, the
button or control label is printed in boldface. For example:
Press SPAN.
H To easily find buttons on the front panel, the area name label is printed together
with the button by concatenating with a colon (:), as in MODE: DEMOD,
VIEW: SCALE, MARKERS: SELECT, etc. For example:
Press the MODE: DEMOD key.
H Menu and on-screen form titles are printed in the manual in the same case
(initial capitals) as they appear on the analyzer screen, such as Span, Source,
and Channel Power. If it is part of a procedure, the menu title is shown in
boldface. For example:
Press the Source side key.
H A list of keys, controls, and/or menu items separated by an arrow symbol
(Õ) indicates the order in which to perform the listed tasks. For example:
Select RBW/FFT Õ Filter Shape...Õ Gaussian.
vi
WCA230A & WCA280A Option 24 User Manual
Page 11

Contacting Tektronix
Preface
Phone 1-800-833-9200*
Address Tektronix, Inc.
Department or name (if known)
14200 SW Karl Braun Drive
P.O. Box 500
Beaverton, OR 97077
USA
Web site www.tektronix.com
Sales support 1-800-833-9200, select option 1*
Service support 1-800-833-9200, select option 2*
Technical support Email: techsupport@tektronix.com
1-800-833-9200, select option 3*
6:00 a.m. – 5:00 p.m. Pacific time
* This phone number is toll free in North America. After office hours, please leave a
voice mail message.
Outside North America, contact a Tektronix sales office or distributor; see the
Tektronix web site for a list of offices.
WCA230A & WCA280A Option 24 User Manual
vii
Page 12

Preface
viii
WCA230A & WCA280A Option 24 User Manual
Page 13

Getting Started
Page 14

Getting Started
This section outlines the modulation analysis according to the GSM/EDGE
standard using WCA230A and WCA280A Option 24. Table 1–1 summarizes the
additional functions in Option 24 by measurement mode.
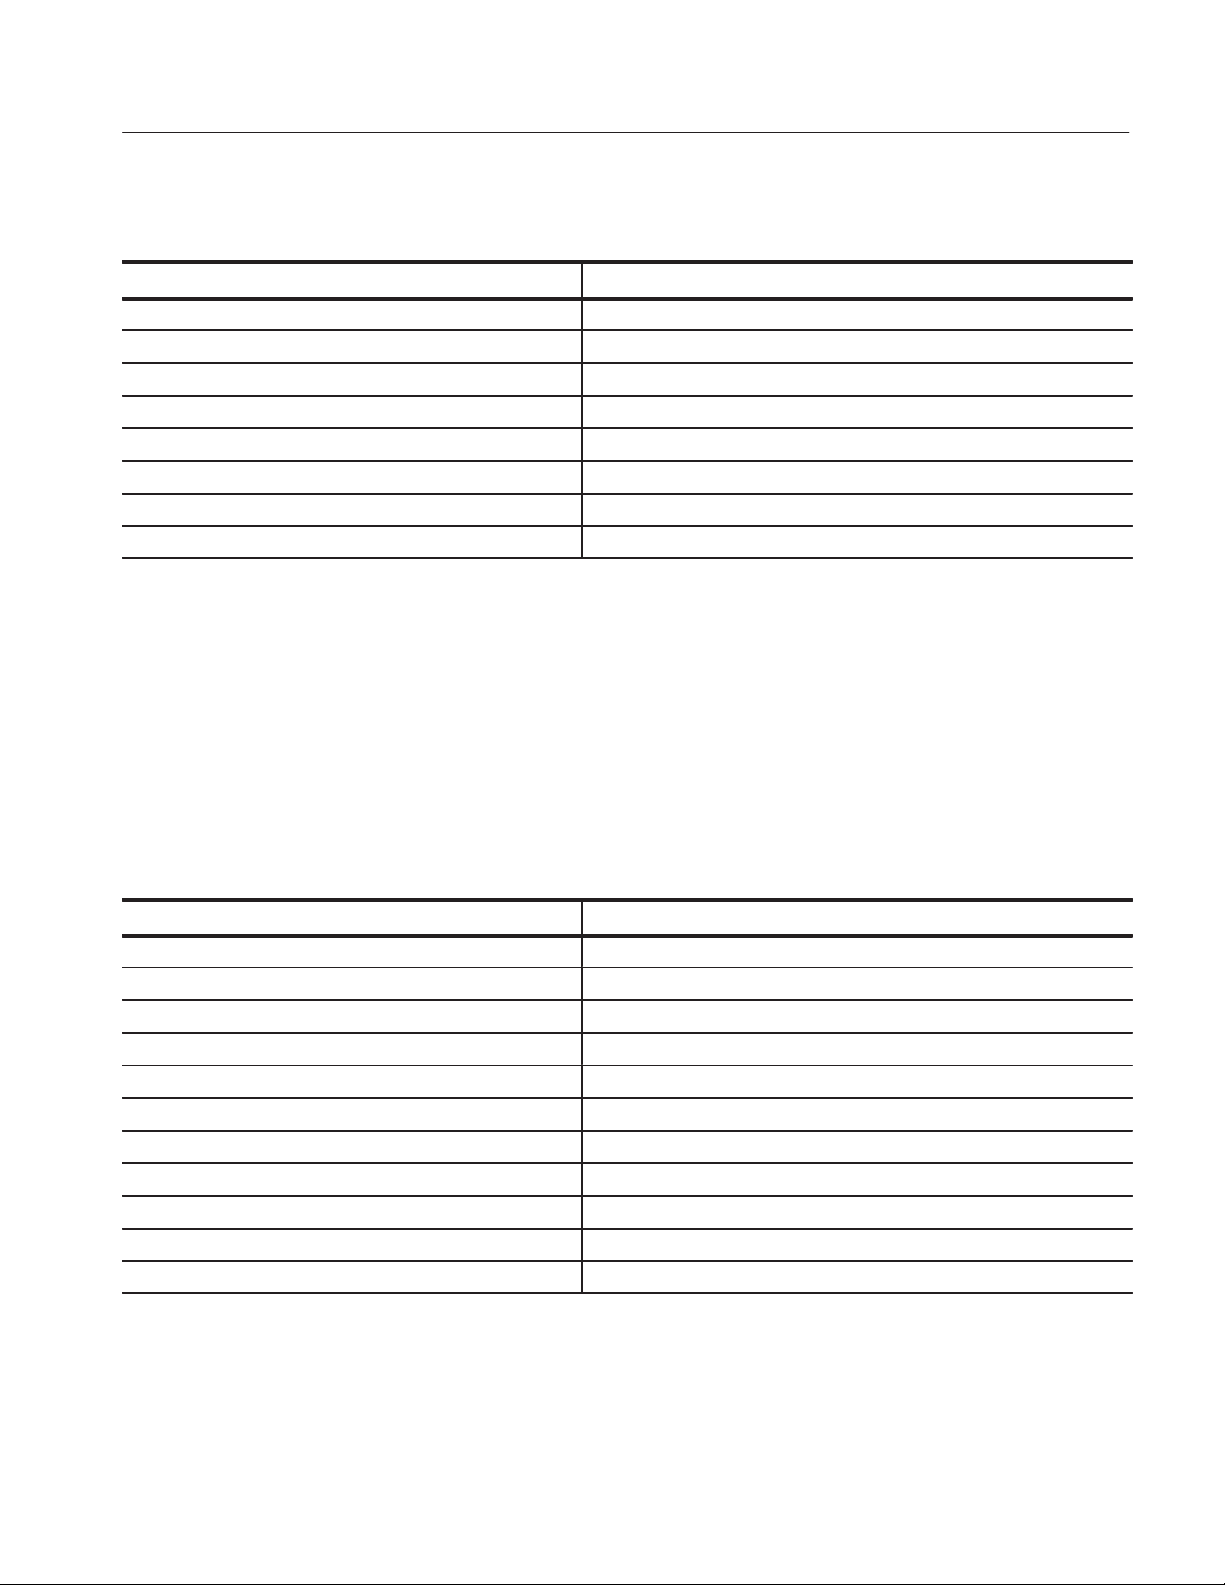
Table 1-1: Additional functions in Option 24
Measurement mode Additional functions
S/A (spectrum analysis) None
Demod (modulation analysis) Six measurement functions under the GSM/EDGE standard
Time (time analysis) None
Figure 1–1 shows an example of the GSM/EDGE analysis.
Figure 1-1: An example of the GSM/EDGE analysis display
WCA230A & WCA280A Option 24 User Manual
1-1
Page 15

Getting Started
Definition of the GSM/EDGE Analysis
The analyzer performs GSM/EDGE analysis that conforms to the
3GPP TS45.005 V4.1.0.5 standard.
Channel Frequencies
The analyzer includes GSM/EDGE channel tables as shown in Table 1–2:
Table 1-2: Channel Frequencies
Channel
Standard Link
GSM850 Uplink 128 to 251 824.2 to 848.8 0.2 (N - 128) + 824.2
Downlink 128 to 251 869.2 to 893.8 0.2 (N - 128) + 869.2
GSM900 Uplink 0 to 124 890 to 914.8 0.2N + 890
Downlink 0 to 124 935 to 959.8 0.2N + 935
DCS1800 Uplink 512 to 885 1710.2 to 1784.8 0.2 (N - 512) + 1710.2
Downlink 512 to 885 1805.2 to 1879.8 0.2 (N -512) + 1805.2
PCS1900 Uplink 512 to 810 1850.2 to 1908.8 0.2 (N - 512) + 1850.2
Downlink 512 to 810 1930.2 to 1989.8 0.2 (N - 512) + 1930.2
(N)
975 to 1023 880.2 to 889.8 0.2 (N - 1024) + 890
975 to 1023 925.2 to 934.8 0.2 (N - 1024) + 935
Frequency range
(MHz)
Frequency calculation
formula (MHz)
1-2
WCA230A & WCA280A Option 24 User Manual
Page 16

Measurement Functions
Getting Started
The analyzer provides six GSM/EDGE measurement functions as shown in
Table 1–3:
Table 1-3: Measurement items
Measurement item Standard
Modulation accuracy GSM 11.20 - 2.1.6.2
Mean carrier power GSM 11.20 - 2.1.6.3
Power versus Time GSM 11.20 - 2.1.6.4
Modulation spectrum GSM 11.20 - 2.1.6.5.1
Switching spectrum GSM 11.20 - 2.1.6.5.2
Spurious signals within transmisĆ
sion band
GSM 5.05 v.8.5.0/4.3.3
Modulation Accuracy
Mean Carrier Power
The analyzer measures EVM (Error Vector Magnitude), amplitude error, and
phase error in accordance with the GSM standard 11.20 – 2.1.6.2.
The analyzer uses the 147 symbols located at the center of a specified burst to
measure EVM, amplitude error, phase error, waveform quality (r), frequency
error, and origin offset. (“Origin offset” is also called “IQ feedthrough”.)
The analyzer measures mean carrier power in accordance with the GSM standard
11.20 – 2.1.6.3.
Figure 1–2 illustrates the data structure of a slot. The analyzer measures power in
the interval E (Data 2) located after TS (Training Sequence) for each burst to
calculate the mean value of the power within the measurement range.
T (#H0) G (#HFF)
T (#H0)
E
(Data 1)
58
3
TS
(#H0970897)
26
E
(Data 2)
58
3 bit
8.25
Figure 1-2: Slot data structure
WCA230A & WCA280A Option 24 User Manual
1-3
Page 17

Getting Started
Power versus Time
[dB]
+4
+1
0
-1
-6
-30
*1
10 8 10 542.8 10 8 10 [ms]
The analyzer measures Power versus Time in accordance with the GSM standard
11.20 – 2.1.6.4.
The analyzer demodulates a specified burst and synchronizes with the TS
(Training Sequence). The analyzer uses the comparison between the spectrum
and the GSM/EDGE standard mask (see Figure 1–3), to determine the Pass/Fail
status of the test.
GMSK (GSM850/900, DCS1800)
[dB]
+4
+1
0
-1
-6
-30
*1
10 8 10 542.8 10 8 10 [ms]
GMSK (PCS1900)
[dB]
+4
+2.4
+1
-1
-6
-15
-30
0
*1
10 8 10 542.8 10 8 10 [ms]
2222
EDGE
*1. -59 dBc or -54 dBm (whichever is higher)
for GSM850/900 uplink bands
-48 dBc or -48 dBm (whichever is higher)
for DCS1800 and PCS1900 uplink bands
-30 dBc for all downlink bands
Figure 1-3: GSM/EDGE standard masks for Power versus Time measurement
1-4
WCA230A & WCA280A Option 24 User Manual
Page 18

Getting Started
Modulation Spectrum
The analyzer measures the spectrum generated by the modulation process in
accordance with the GSM standard 11.20 – 2.1.6.5.1.
The analyzer acquires the input signal with a span of 15 MHz and demodulates a
single burst. The spectrum of the burst is calculated from the center of the
training sequence over an interval of 320 ms. This spectrum is calculated using a
30 kHz RBW up to 1.8 MHz from the carrier, and 100 kHz RBW from 1.8 to 6
MHz from the carrier. Finally, the analyzer compares the spectrum and
GSM/EDGE standard masks (see Table 1–4 below) to determine pass/fail status
of testing.
-54
-54
1
≥1.8<3≥3
<1.8
-60 -63 -65 -71
≥1.8<3≥3
<1.8
-70 -73 -75 -80
<6
<6
≥6
≥6
Table 1-4: Modulation spectrum standard masks
GSM850/900 uplink
Offset (MHz) 0.1 0.2 0.25 0.4 ≥0.6
Level (dBc) +0.5 -30 -33 -60
GSM850/900 downlink
Offset (MHz) 0.1 0.2 0.25 0.4 ≥0.6
Level (dBc) +0.5 -30 -33 -60
DCS1800 uplink
Offset (MHz) 0.1 0.2 0.25 0.4 ≥0.6
<1.8
Level (dBc) +0.5 -30 -33 -60
-54
DCS1800 downlink
Offset (MHz) 0.1 0.2 0.25 0.4 ≥0.6
Level (dBc) +0.5 -30 -33 -60
-56
1
The levels are common for GMSK and EDGE. In cases where two values are
indicated in a single column, however, values in the upper line are for GMSK and
values in the lower line are for EDGE.
-60 -59 -67
<1.2
-70 -73 -75 -80
≥1.8<6≥6
≥1.2
<1.8
≥1.8<6≥6
WCA230A & WCA280A Option 24 User Manual
1-5
Page 19

Getting Started
Switching Spectrum
-54
-56
1
(Cont.)
≥1.2
<1.2
-60 -60 -59 -67
<1.2
-70 -73 -75 -80
<1.8
≥1.2
<1.8
≥1.8<6≥6
≥1.8<6≥6
Table 1-4: Modulation spectrum standard masks
PCS1900 uplink
Offset (MHz) 0.1 0.2 0.25 0.4 ≥0.6
Level (dBc) +0.5 -30 -33 -60
PCS1900 downlink
Offset (MHz) 0.1 0.2 0.25 0.4 ≥0.6
Level (dBc) +0.5 -30 -33 -60
The analyzer measures the spectrum due to switching transients in accordance
with the GSM standard 11.20 – 2.1.6.5.2.
The analyzer acquires the input signal with a span of 5 MHz, and calculates the
spectrum using a 30 kHz RBW conversion. The analyzer uses peak hold for
multiple bursts, and compares the spectrum with GSM/EDGE masks (see
Table 1–5) to determine pass/fail status of the test.
Table 1-5: Switching spectrum standard masks
GSM850/900, DCS1800, and PCS1900 uplink
Offset (MHz) 0.4 0.6 1.2 1.8
Level (dBc) -23 -26 -32 -36
GSM850/900 downlink
Offset (MHz) 0.4 0.6 1.2 1.8
Level (dBc) -57 / -52 -67 / -62 -74 -74
DCS1800 and PCS1900 downlink
Offset (MHz) 0.4 0.6 1.2 1.8
Level (dBc) -50 -58 -66 -66
1
The levels are common for GMSK and EDGE. In cases where two values are
indicated in a single column, however, the values to the left are for GMSK and the
values to the right are for EDGE.
1
1-6
WCA230A & WCA280A Option 24 User Manual
Page 20

Getting Started
( )
36 dBm
Inband Spurious Signals
The analyzer detects the spurious signals existing within the transmission band
in accordance with the GSM standard 5.05 version 8.5.0/4.3.3.
The analyzer calculates the spectrum of the input signal, using the correct RBW
for the frequency offset from the carrier, as shown in Table 1–6. The largest peak
in the specified transmission band is assumed to be the carrier and all other peaks
are assumed to be spurious responses.
Table 1-6: Spurious measurement conditions
Standard Transmission band RBW Threshold
GSM850 824 to 849 MHz (Uplink)
869 to 894 MHz (Downlink)
GSM900 876 to 915 MHz (Uplink)
921 to 960 MHz (Downlink)
DCS1800 1710 to 1785 MHz (Uplink)
1805 to 1880 MHz (Downlink)
PCS1900 1850 to 1910 MHz (Uplink)
1930 to 1960 MHz (Downlink)
1
UserĆdefinable
30 kHz (Offset ≥1.8 MHz)
100 kHz (Offset ≥6 MHz)
-
1
WCA230A & WCA280A Option 24 User Manual
1-7
Page 21

Getting Started
Measurement Menu
Figure 1–4 shows the measurement menu items added in Option 24.
Standard... GSM/EDGE Modulation Accuracy
Mean Carrier Power
Power versus Time
Modulation Spectrum
Switching Spectrum
Inband Spurious
Figure 1-4: GSM/EDGE measurement menu
The following sections provide the measurement procedures.
1-8
WCA230A & WCA280A Option 24 User Manual
Page 22

Operating Basics
Page 23

Burst Analysis
The following five measurements can be performed on one or more GSM/EDGE
bursts:
H Modulation accuracy
H Mean carrier power
H Power versus time
H Modulation spectrum
H Switching spectrum
The burst analysis is based on the digital modulation analysis function. For the
digital modulation analysis, refer to the WCA230A and WCA280A User Manual.
For the spurious signal analysis, refer to page 2–11.
Measurement Procedure
Use the following steps to perform the burst analysis:
1. Select the measurement:
a. Press the DEMOD key on the front panel.
b. Press the Standard... side key and then the GSM/EDGE side key.
c. Press one of the following side keys to select the measurement:
Modulation Accuracy
Mean Carrier Power
Power vs. Time
Modulation Spectrum
Switching Spectrum
2. Acquire the waveform of signal to be measured:
NOTE. When the input signal is not according to the GSM/EDGE standard, no
measurement result may be displayed. However, the waveform of the signal will
still be displayed in the overview.
a. Press the FREQUENCY/CHANNEL key on the front panel to set
center frequency.
WCA230A & WCA280A Option 24 User Manual
2-1
Page 24

Burst Analysis
How to use the channel table:
H Press Channel Table... side key.
H Select one of the GSM/EDGE standards.
H Use Channel side key to select a channel.
b. Press the SPAN key on the front panel to set span. Range: 1 to 15 MHz
NOTE. It is important to set the span as narrow as possible for the selected
modulation type, and to adjust the reference level carefully. Setting these
parameters incorrectly can result in incorrect recognition of the signal’s
modulation type.
c. Press the AMPLITUDE key on the front panel to set up the amplitude
of the signal near the full scale in the overview.
d. Press the TRIG key on the front panel to set up the trigger as necessary.
e. Press the TIMING key on the front panel, and then press the Acquisi-
tion Length side key to set the number of slots for one acquisition block
(see Figure 2–1). Default: 17 slots.
f. After you have acquired the measurement data, you can stop the
acquisition using the RUN/STOP key.
Acquisition History
(Block number)
Overview
The burst specified with the Burst Select
side key selects the burst to be analyzed.
The area between two vertical green lines
indicates the analysis range. The result of
analysis is displayed in the main view.
The area between two vertical pink lines
indicates the range of the FFT process, that
is one FFT frame, to display the spectrum in
the subview.
Acquisition Length
(Time length to acquire one block)
Figure 2-1: Setting analysis range on the overview
2-2
WCA230A & WCA280A Option 24 User Manual
Page 25

Burst Analysis
3. From the overview, select the burst to be analyzed (see Figure 2–1).
a. Press the TIMING key on the front panel.
b. If you acquired the signal in continuous trigger repeat:
Press the Acquisition History side key to specify the block number to
be analyzed. Block number “0” corresponds to the latest block.
c. Press the Burst Select side key to specify the burst number to be
analyzed. Burst number “0” corresponds to the latest burst.
How to return to the first burst:
To select the first burst of all the data that has been acquired in memory,
press the Return to First Burst side key.
NOTE. In GSM/EDGE, the analysis length must be at least 1.28 ms.
The specified burst is analyzed and the result of the analysis is displayed on
the screen.
4. Press the MEAS SETUP key and change the measurement conditions as
necessary.
For the Meas Setup menu, refer to page 2–4.
5. In repeating the analysis of waveform data that has been acquired in
memory, do the following steps:
a. Press the TIMING key on the front panel.
b. If you acquired the signal in continuous trigger repeat:
Press the Acquisition History side key to specify the block number to
be analyzed.
c. Press the Burst Select side key to specify the burst number to be
analyzed.
How to return to the first burst:
To select the first burst of all the data that has been acquired in memory,
press the Return to First Burst side key.
d. Press the MEAS SETUP key on the front panel and then press the
Analyze from Selected Burst side key.
The analyzer performs analysis from the burst specified in step c to the end
of the waveform data. To interrupt the analysis, press the Cancel-Back (top)
side key.
WCA230A & WCA280A Option 24 User Manual
2-3
Page 26

Burst Analysis
Meas Setup Menu
The Meas Setup menu items for the burst analysis are as follows:
Modulation Type. Selects the modulation type.
H GMSK. Default. Selects GMSK (Gaussian filtered Minimum Shift Keying).
H EDGE. Selects EDGE (Enhanced Data rate for GSM Evolution).
Standard... Selects specification of the mask for comparison with the spectrum
waveform:
H GSM850-UL
H GSM850-DL
H GSM900-UL
H GSM900-DL
H DCS1800-UL
H DCS1800-DL
H PCS1900-UL
H PCS1900-DL
UL and DL mean uplink and downlink, respectively.
This menu item is unavailable in the mean carrier power measurement.
Burst Select. Sets the burst number to be analyzed. This menu item is the same as
the Burst Index parameter in the Timing menu. Burst number “0” corresponds to
the latest burst. The larger the negative values, the older the bursts.
Return to First Burst. Selects the first burst of all the data that has been acquired
in memory. This menu item is invalid during acquisition of an input signal.
Analyze from Selected Burst. Press this key for repeated analysis of waveform
data that has previously been acquired in memory. The analysis is done from the
selected burst. This menu item is invalid during acquisition of an input signal.
2-4
WCA230A & WCA280A Option 24 User Manual
Page 27

Burst Analysis
TS Code Filtering. Determines whether to perform the analysis while specifying
Training Sequence (TS) or not.
H Off. Default. No training sequence is specified. The analyzer will perform
the analysis for all the training sequences.
H 0 to 7. Sets the training sequence code number to be analyzed. The analysis
result is displayed in the main view only for the bursts containing the
specified training sequence, and only results from bursts containing the
specified training sequence are included in averaged results.
This menu item is unavailable in the switching spectrum measurement.
Analyze Includes. Sets the number of symbols for EVM calculation in the
modulation accuracy measurement.
H 142. Measures 142 symbols excluding the tail bits for the EDGE signal.
H 147. Measures 147 symbols specified for the GMSK signal.
H 148. Measures all symbols in a burst.
Midpoint shift. Defines the center of the mask in the power versus time measurement.
H Off. Positions the center of the mask halfway between symbol 13 and 14 in
the training sequence.
H On. Aligns the center of the mask with symbol 14 in the training sequence.
Auto Carrier. Determines whether to activate the automatic carrier detection.
H On. Default. The carrier is automatically detected during data analysis.
H Off. No detection of carrier frequency is performed. Set the carrier frequency
offset in Frequency Offset below.
This menu item is unavailable in the switching spectrum measurement.
Frequency Offset. When Off is selected in Auto Carrier above, it is necessary to
set the carrier frequency offset with reference to the center frequency.
This setup item is unavailable in the switching spectrum measurement.
WCA230A & WCA280A Option 24 User Manual
2-5
Page 28

Burst Analysis
Modulation Accuracy Measurement
Figure 2–2 shows an example of the modulation accuracy measurement.
H Overview: Power versus Time for the specified block
H Subview: Constellation for the specified burst
H Main view: Measurement results and EVM view
Pass/Fail status
Measurement results
H EVM (RMS/Peak/95
H Amplitude error (RMS/Peak)
H Phase error (RMS/Peak)
H Frequency error
H Origin offset (IQ feedthrough)
H Training sequence code
The pass/fail test item is
displayed in green when passed
or in red when failed.
th
percentile)
Figure 2-2: Modulation accuracy measurement
Changing Views. You can change the presentation of the overview, the subview
and the main view. Procedures to change the presentation of the overview or the
subview are common with those for the modulation analysis. Refer to the
WCA230A and WCA280A User Manual for the details.
To change the presentation of the main view, proceed as follows:
2-6
1. Press the VIEW: DEFINE key on the front panel.
2. Press the Mainview Content... side key and select the main view content:
H Constellation
H EVM (Error Vector Magnitude)
WCA230A & WCA280A Option 24 User Manual
Page 29

Mean Carrier Power Measurement
Figure 2–3 shows an example of the mean carrier power measurement.
H Overview: Power versus Time for the specified block
H Subview: Constellation for the specified burst
H Main view: Power versus Time for the specified burst
The blue domain in the Power versus Time display on the right of the main view
shows the range of calculation process. The mean power, maximum power, and
minimum power are indicated on the left of the main view for each burst.
Burst Analysis
Burst number
Training sequence code
Figure 2-3: Mean carrier power measurement
Changing Views. You can change the presentation of the overview and the
subview. The procedures to change the presentation of the overview and the
subview are common with those of the modulation analysis. Refer to the
WCA230A and WCA280A User Manual for the details.
WCA230A & WCA280A Option 24 User Manual
Measurement results:
Mean power
Blue domain indicates
the range of calculation
2-7
Page 30

Burst Analysis
Power versus Time Measurement
Figure 2–4 shows an example of the power versus time measurement.
H Overview: Power versus Time for the specified block
H Subview: Constellation for the specified burst
H Main view: Measurement results and the mask for the specified burst
The Power versus Time waveform and the GSM/EDGE standard mask are
shown on the right of the main view. The mean power as well as Pass/Fail status
of testing are shown on the left of the main view for each burst.
Pass/Fail status
2-8
Burst number
Training sequence code
Measurement results
H Mean power
H Pass/Fail
GSM/EDGE standard mask
Figure 2-4: Power versus Time measurement
Changing Views. You can change the presentation of the overview and the
subview. The procedures to change the presentation of the overview and the
subview are common with those of the modulation analysis. Refer to the
WCA230A and WCA280A User Manual for the details.
WCA230A & WCA280A Option 24 User Manual
Page 31

Modulation Spectrum Measurement
Figure 2–5 shows an example of the modulation spectrum measurement.
H Overview: Power versus Time for the specified block
H Subview: Constellation for the specified burst
H Main view: Spectrum and the mask for the specified burst
The spectrum waveform and the GSM/EDGE specification mask are displayed in
the main view. To select the mask specification, use the Standard... side key in
the Meas Setup menu.
Burst Analysis
Pass/Fail status
Standard...
Select a mask specification.
The mask selected with the Standard... side key
Figure 2-5: Modulation spectrum measurement
Changing Views. You can change the presentation of the overview and the
subview. The procedures to change the presentation of the overview and the
subview are common with those of the modulation analysis. Refer to the
WCA230A and WCA280A User Manual for the details.
WCA230A & WCA280A Option 24 User Manual
2-9
Page 32

Burst Analysis
Switching Spectrum Measurement
Figure 2–6 shows an example of the switching spectrum measurement.
H Overview: Power versus Time for the specified block
H Subview: Constellation for the specified burst
H Main view: Spectrum and the mask for the specified burst
The spectrum waveform and the GSM/EDGE specification mask are shown in
the main view. To select the mask specification, use the Standard... side key in
the Meas Setup menu.
Pass/Fail status
Standard...
Select a mask specification.
Figure 2-6: Switching spectrum measurement
Changing Views. You can change the presentation of the overview. The procedure
to change the presentation of the overview is common with that of the modulation analysis. Refer to the WCA230A and WCA280A User Manual for the details.
2-10
The mask selected with the Standard... side key
WCA230A & WCA280A Option 24 User Manual
Page 33

Spurious Analysis
This section describes operating basics for the measurement of spurious signals
within a transmission band. The spurious signal measurement in GSM/EDGE is
based on that function in the normal spectrum analysis. For the basics, refer to
Spurious Signal Measurement in the WCA230A and WCA280A User Manual.
Measurement Procudure
The following is the fundamental procedure for the spurious signal measurement.
1. Press the DEMOD key on the front panel.
2. Press the side key GSM/EDGE → Inband Spurious.
3. Display the spectrum waveform of the measurement signal:
NOTE. For details on setting frequency, span, and amplitude, refer to the
WCA230A and WCA280A User Manual.
a. Press the RUN/STOP key on the front panel to start data acquisition.
b. Set the frequency by pressing the FREQUENCY/CHANNEL key on
the front panel.
How to use the channel table:
H Press the Channel Table... side key.
H Select one of the GSM/EDGE standards.
H Use the Channel side key to select a channel.
c. Set the span by pressing the SPAN key on the front panel.
d. Set the amplitude by pressing the AMPLITUDE key on the front panel.
4. Set the following measurement setup controls by pressing the
MEAS SETUP key on the front panel.
WCA230A & WCA280A Option 24 User Manual
2-11
Page 34

Spurious Analysis
Meas Setup Menu
The Meas Setup menu for the spurious signal measurement contains the
following controls:
Standard... Selects a specification of the mask for comparison with the spectrum
waveform:
H GSM850-UL
H GSM850-DL
H GSM900-UL
H GSM900-DL
H DCS1800-UL
H DCS1800-DL
H PCS1900-UL
H PCS1900-DL
UL and DL mean uplink and downlink, respectively.
Signal Threshold. Sets the threshold for detecting the carrier. A signal with the
amplitude larger than this threshold is regarded as a carrier.
Range: –100 to +30 dBm (default: –20 dBm)
Spurious Threshold. Sets the threshold for detecting spurious signals. A signal
with the amplitude larger than this threshold is regarded as a spurious signal.
Range: –150 to 0 dBm (default: –36 dBm)
Scroll Table. Horizontally scrolls the spurious table displayed in the lower part of
the screen. Up to 10 spurious signals are displayed.
2-12
WCA230A & WCA280A Option 24 User Manual
Page 35

Measurement Example
Pass/Fail status of testing
Signal Threshold:
A signal with larger amplitude than this
level is regarded as a standard signal.
Spurious Analysis
Figure 2–7 shows an example of the spurious measurement. The analyzer
compares the spectrum waveform with the standard mask to extract 10 peaks that
exceeded the spurious threshold in ascending order. Detected spurious signals are
assigned markers, numbered in descending order by amplitude. The frequency
and the amplitude are shown in the table at the bottom of the screen.
Spurious marker
Spurious Threshold:
A signal with larger amplitude than this
level is regarded as a spurious signal.
Measurement results
(10 spurious points)
H Frequency
H Amplitude
Figure 2-7: Spurious measurement
The region within (carrier frequency) ±1.6 MHz is
out of test range in the spurious measurement.
WCA230A & WCA280A Option 24 User Manual
2-13
Page 36

Spurious Analysis
2-14
WCA230A & WCA280A Option 24 User Manual
Page 37

Scale and Format of View
Setup procedures for the scale and format of views in the GSM/EDGE analysis
are the same with those in other measurement modes, except the following
views:
H Constellation view
H EVM view
H Power versus Time view (for the Power versus Time measurement only)
This section describes the View: Scale menus for these three views. For details
on setup procedures for the other views, refer to Scale and Format of Views in
the WCA230A and WCA280A User Manual.
WCA230A & WCA280A Option 24 User Manual
2-15
Page 38

Scale and Format of View
Constellation View
The View: Scale menu for the constellation view in the GSM/EDGE analysis has
the following controls:
Measurement Content. Select vector or constellation display.
H Vector. Selects the vector display. The phase and amplitude of the input
signal is displayed in a two-dimensional IQ diagram. The red points indicate
the symbol positions of the measured signal, and the yellow trace indicates
the IQ trajectory between symbols.
H Constellation. Selects the constellation display. It is basically the same as
the vector display, except that symbols of the measured signal are indicated
in red, and the IQ trajectory between the symbols is not shown. The cross
marks (+) indicate symbol positions of ideal signal.
Vector display Constellation display
Figure 2-8: Vector and Constellation display
EDGE Inverse Filter. Determines whether or not to apply the inverse filter to the
received data for displaying the waveform of an EDGE signal.
H Off. Displays the waveform without applying the inverse filter to the
received data.
H On. Default. Displays the waveform while applying the inverse filter to the
received data.
This menu item is invalid for a GMSK signal. It is available when you select
EDGE with Modulation Type in the Meas Setup menu.
2-16
WCA230A & WCA280A Option 24 User Manual
Page 39

Scale and Format of View
Slice Timing. Selects the positions on which the red points are to be located.
H 0. Default for GMSK. The red points are located at the ideal symbol
positions.
H 0.5. Default for EDGE. The red points are located at positions halfway
between the ideal symbols.
For the EDGE modulation analysis, this menu item is available when you select
Off with EDGE Inverse Filter above.
WCA230A & WCA280A Option 24 User Manual
2-17
Page 40

Scale and Format of View
EVM View
The View: Scale menu for the EVM view in the GSM/EDGE analysis has the
following controls:
Measurement Content.... Selects one of the following formats for view (see
Figure 2–9).
H EVM. Default. Displays the temporal response of EVM (Error Vector
Magnitude) versus time.
H Mag Error. Displays the amplitude error versus time.
H Phase Error. Displays the phase error versus time.
EVM display Magnitude error display Phase error display
Figure 2-9: EVM, amplitude error, and phase error display
EVM Bandpass Filter. Turns on or off the Raised Cosine Windowed Raised
Cosine filter. The default setting is On according to the GSM/EDGE standard.
Auto Scale. Executes the auto scale function. When activated the auto scale, the
starting value and the scale of the vertical axis are automatically set so that the
waveform will be displayed for optimal viewing.
2-18
WCA230A & WCA280A Option 24 User Manual
Page 41

Scale and Format of View
Horizontal Scale. Sets the scale of the horizontal axis.
Horizontal Start. Sets the starting value of the horizontal axis.
Vertical Scale. Sets the of the scale of the vertical axis scale.
Vertical Stop. Sets the maximum value (top edge) of the vertical axis.
Full Scale. Sets the scale of the vertical axis to the default full-scale value.
WCA230A & WCA280A Option 24 User Manual
2-19
Page 42

Scale and Format of View
Power vs. Time View
The View: Scale menu for the power versus time display on the main view in the
Power versus Time measurement has the following controls:
View Full Burst. Displays the entire burst (see Figure 2–10).
View Rising Edge. Expands the rising edge horizontally (see Figure 2–10).
View Falling Edge. Expands the falling edge horizontally (see Figure 2–10).
View Full Burst View Rising Edge View Falling Edge
Figure 2-10: Expanding a burst
Auto Scale. Sets the start value and scale of the vertical axis to automatically
display the entire waveform.
Horizontal Scale. Sets the scale of the horizontal axis.
Horizontal Start. Sets the minimum value (left edge) of the horizontal axis.
Vertical Scale. Sets the scale of the vertical axis.
Vertical Stop. Sets the maximum value (top edge) of the vertical axis.
Full Scale. Sets the scale and start value of the vertical axis to the default
full-scale value.
2-20
WCA230A & WCA280A Option 24 User Manual
Page 43

Syntax and Commands
Page 44

Command Groups
This section lists the commands added in Option 24 in two ways. It first presents
them by functional groups. It then lists them alphabetically. The functional group
list starts below. The alphabetical list provides more detail on each command and
starts on page 3–9.
For details on the standard analyzer commands, refer to the WCA230A and
WCA280A Programmer Manual.
Items followed by question marks are queries; items without question marks are
commands. Some items in this section have a question mark in parentheses (?) in
the command header section; this indicates that the item can be both a command
and a query.
Each command may be available or unavailable, depending on the current
measurement mode. The “Measurement Modes” in each command description
shows the measurement mode in which the command is available. To set the
measurement mode, use the :INSTrument[:SELect] command (refer to the
WCA230A and WCA280A Programmer Manual) using one of the mnemonics
listed below:
Table 3-1: Measurement mode added in Option 24
Mnemonic Meaning
DEMGSMEDGE GSM/EDGE modulation analysis
The WCA200A Series analyzers conform to the Standard Commands for
Programmable Instruments (SCPI) 1999.0 and IEEE Std 488.2-1987 except
where noted.
WCA230A & WCA280A Option 24 User Manual
3-1
Page 45

Command Groups
Functional Groups
The commands are divided into the groups listed below.
Table 3-2: List of command groups
Command group Function
:CONFigure Configure the analyzer for each measurement session.
:DISPlay Control how to show waveform and measurement result on the screen.
:FETCh Retrieve the measurements from the data last acquired.
:READ Obtain the measurement results with acquiring data.
:SENSe Set up detailed conditions for each measurement.
The following sections list the commands by group.
3-2
WCA230A & WCA280A Option 24 User Manual
Page 46

Command Groups
:CONFigure Commands
Set up the analyzer in order to perform the specified measurement.
Table 3-3: :CONFigure commands
Header Description
:CONFigure::GSMedge:MACCuracy Sets up the analyzer to the modulation accuracy measurement default settings.
:CONFigure::GSMedge:MCPower Sets up the analyzer to the mean carrier power measurement default settings.
:CONFigure::GSMedge:MODulation Sets up the analyzer to the modulation spectrum measurement default settings.
:CONFigure::GSMedge:PVTime Sets up the analyzer to the power versus time measurement default settings.
:CONFigure::GSMedge:SPURious Sets up the analyzer to the spurious measurement default settings.
:CONFigure::GSMedge:SWITching Sets up the analyzer to the switching spectrum measurement default settings.
WCA230A & WCA280A Option 24 User Manual
3-3
Page 47

Command Groups
:DISPlay Commands
Control how to show measurement data on the screen.
Table 3-4: :DISPlay commands
Header Description
:DISPlay:GSMedge:DDEMod subgroup Main view and subview related in the GSM/EDGE analysis.
:DISPlay:GSMedge:DDEMod:MVIew:FILTer:EINVerse (?) Determines whether to enable the EDGE inverse filter in the main view
:DISPlay:GSMedge:DDEMod:MVIew:FORMat (?) Selects the main view display format.
:DISPlay:GSMedge:DDEMod:MVIew:STIMe (?) Sets the slice time on the constellation view
:DISPlay:GSMedge:DDEMod:MVIew:X[:SCALe]:OFFSet (?) Sets the minimum horizontal value (left end) in the main view.
:DISPlay:GSMedge:DDEMod:MVIew:X[:SCALe]:RANGe (?) Sets the horizontal fullĆscale in the main view.
:DISPlay:GSMedge:DDEMod:MVIew:Y[:SCALe]:FIT Runs autoĆscale on the main view.
:DISPlay:GSMedge:DDEMod:MVIew:Y[:SCALe]:FULL Sets the main view's vertical axis to the default fullĆscale.
:DISPlay:GSMedge:DDEMod:MVIew:Y[:SCALe]:OFFSet (?) Sets the minimum vertical value (bottom end) in the main view.
:DISPlay:GSMedge:DDEMod:MVIew:Y[:SCALe]:RANGe (?) Sets the vertical fullĆscale in the main view.
:DISPlay:GSMedge:DDEMod:SVIew:FILTer:EINVerse (?) Determines whether to enable the EDGE inverse filter in the subview
:DISPlay:GSMedge:DDEMod:SVIew:FORMat (?) Selects the subview display format.
:DISPlay:GSMedge:DDEMod:SVIew:STIMe (?) Sets the slice time on the constellation view
:DISPlay:GSMedge:DDEMod:SVIew:X[:SCALe]:OFFSet (?) Sets the minimum horizontal value (left end) in the subview.
:DISPlay:GSMedge:DDEMod:SVIew:X[:SCALe]:RANGe (?) Sets the horizontal fullĆscale in the subview.
:DISPlay:GSMedge:DDEMod:SVIew:Y[:SCALe]:FIT Runs autoĆscale on the subview.
:DISPlay:GSMedge:DDEMod:SVIew:Y[:SCALe]:FULL Sets the vertical axis to the default fullĆscale in the subview.
:DISPlay:GSMedge:DDEMod:SVIew:Y[:SCALe]:OFFSet (?) Sets the minimum vertical value (bottom end) in the subview.
:DISPlay:GSMedge:DDEMod:SVIew:Y[:SCALe]:RANGe (?) Sets the vertical fullĆscale in the subview.
:DISPlay:GSMedge:SPECtrum subgroup Spectrum measurement related in the GSM/EDGE analysis.
:DISPlay:GSMedge:SPECtrum:BMARker:STATe (?) Turns on or off the spurious marker in the spurious measurement.
:DISPlay:GSMedge:SPECtrum:X[:SCALe]:OFFSet (?) Sets the minimum horizontal value (start frequency).
:DISPlay:GSMedge:SPECtrum:X[:SCALe]:PDIVision (?) Sets the horizontal scale (span/div).
:DISPlay:GSMedge:SPECtrum:Y[:SCALe]:FIT Runs autoĆscale.
:DISPlay:GSMedge:SPECtrum:Y[:SCALe]:FULL Sets the vertical axis to the default fullĆscale.
:DISPlay:GSMedge:SPECtrum:Y[:SCALe]:OFFSet (?) Sets the minimum vertical, or amplitude, value (bottom end).
:DISPlay:GSMedge:SPECtrum:Y[:SCALe]:PDIVision (?) Sets the vertical, or amplitude, scale per division.
3-4
WCA230A & WCA280A Option 24 User Manual
Page 48
Command Groups
Table 3-4: :DISPlay commands (Cont.)
Header Description
:DISPlay:GSMedge:WAVeform subgroup Time domain display related in the GSM/EDGE analysis.
:DISPlay:GSMedge:WAVeform:BURSt (?) Selects how to expand waveform in the power versus time measurement
:DISPlay:GSMedge:WAVeform:X[:SCALe]:OFFSet (?) Sets the minimum horizontal, or time, value (left end).
:DISPlay:GSMedge:WAVeform:X[:SCALe]:PDIVision (?) Sets the horizontal, or time, scale per division.
:DISPlay:GSMedge:WAVeform:Y[:SCALe]:FIT Runs autoĆscale.
:DISPlay:GSMedge:WAVeform:Y[:SCALe]:FULL Sets the vertical axis to the default fullĆscale.
:DISPlay:GSMedge:WAVeform:Y[:SCALe]:OFFSet (?) Sets the minimum vertical, or amplitude, value (bottom end).
:DISPlay:GSMedge:WAVeform:Y[:SCALe]:PDIVision (?) Sets the vertical, or amplitude, scale.
:FETCh Commands
The :FETCh commands retrieve the measurements from the data taken by the
latest INITiate command.
If you want to perform a FETCh operation on fresh data, use the :READ
commands, which acquire a new input signal and fetch the measurement results
from that data.
Table 3-5: :FETCh commands
Header Description
:FETCh:GSMedge:MACCuracy? Returns the GSM/EDGE modulation accuracy measurement results.
:FETCh:GSMedge:MCPower? Returns the GSM/EDGE mean carrier power measurement results.
:FETCh:GSMedge:MODulation? Returns the GSM/EDGE modulation spectrum measurement results.
:FETCh:GSMedge:PVTime? Returns the GSM/EDGE power versus time measurement results.
:FETCh:GSMedge:SPECtrum:MODulation? Returns the time amplitude for the modulation spectrum measurement.
:FETCh:GSMedge:SPECtrum:SWITching? Returns the time amplitude for the switching spectrum measurement.
:FETCh:GSMedge:SPURious? Returns the GSM/EDGE spurious measurement results.
:FETCh:GSMedge:SWITching? Returns the GSM/EDGE switching spectrum measurement results.
:FETCh:GSMedge:TAMPlitude:MCPower? Returns the time amplitude for the mean carrier power measurement.
:FETCh:GSMedge:TAMPlitude:PVTime? Returns the time amplitude for the power versus time measurement.
:FETCh:GSMedge:TSCode? Returns the training sequence code in the GSM/EDGE analysis.
WCA230A & WCA280A Option 24 User Manual
3-5
Page 49

Command Groups
:READ Commands
The :READ commands acquire an input signal once in the single mode and
obtain the measurement results from that data.
If you want to fetch the measurement results from the data currently residing in
the memory without acquiring the input signal, use the :FETCh commands.
Table 3-6: :READ commands
Header Description
:READ:GSMedge:MACCuracy? Returns the GSM/EDGE modulation accuracy measurement results.
:READ:GSMedge:MCPower? Returns the GSM/EDGE mean carrier power measurement results.
:READ:GSMedge:MODulation? Returns the GSM/EDGE modulation spectrum measurement results.
:READ:GSMedge:PVTime? Returns the GSM/EDGE power versus time measurement results.
:READ:GSMedge:SPECtrum:MODulation? Returns the time amplitude for the modulation spectrum measurement.
:READ:GSMedge:SPECtrum:SWITching? Returns the time amplitude for the switching spectrum measurement.
:READ:GSMedge:SPURious? Returns the GSM/EDGE spurious measurement results.
:READ:GSMedge:SWITching? Returns the GSM/EDGE switching spectrum measurement results.
:READ:GSMedge:TAMPlitude:MCPower? Returns the time amplitude for the mean carrier power measurement.
:READ:GSMedge:TAMPlitude:PVTime? Returns the time amplitude for the power versus time measurement.
3-6
WCA230A & WCA280A Option 24 User Manual
Page 50

Command Groups
:SENSe Commands
Set the detailed measurement conditions.
Table 3-7: :SENSe commands
Header Description
[:SENSe]:GSMedge subgroup GSM/EDGE analysis related.
[:SENSe]:GSMedge:ABITs (?) Sets the number of symbols for EVM measurement
[:SENSe]:GSMedge:BLOCk (?) Sets the number of the block to be measured.
[:SENSe]:GSMedge:BURSt:INDex (?) Sets the number of the burst to be measured.
[:SENSe]:GSMedge:BURSt:MPOint (?) Defines center of the mask in the power vs. time measurement
[:SENSe]:GSMedge:BURSt:RTFirst (?) Return to the first burst.
[:SENSe]:GSMedge:CARRier:OFFSet (?) Sets the carrier frequency offset.
[:SENSe]:GSMedge:CARRier:SEARch (?) Determines whether to detect the carrier automatically.
[:SENSe]:GSMedge:FILTer:RCWRcosine (?) Determines whether to enable the RCW raised cosine filter.
[:SENSe]:GSMedge[:IMMediate] Starts calculation for the GSM/EDGE analysis.
[:SENSe]:GSMedge:LIMit:SIGNal (?) Sets the threshold level to determine the normal signal.
[:SENSe]:GSMedge:LIMit:SPURious (?) Sets the threshold level to determine the spurious signal.
[:SENSe]:GSMedge:MEASurement (?) Selects the GSM/EDGE measurement item.
[:SENSe]:GSMedge:MODulation (?) Selects the modulation system for the GSM/EDGE analysis.
[:SENSe]:GSMedge:SLOT (?) Sets the number of slots for one block
[:SENSe]:GSMedge:STANdard:BAND (?) Selects the standard for the GSM/EDGE analysis.
[:SENSe]:GSMedge:STANdard:DIRection (?) Selects the link direction for the GSM/EDGE analysis.
[:SENSe]:GSMedge:STINdex (?) Sets the column number in the spurious table.
[:SENSe]:GSMedge:TSCode:AUTO (?) Determines whether to set TSC number automatically.
[:SENSe]:GSMedge:TSCode[:NUMBer] (?) Sets the TSC (Training Sequence Code) number.
WCA230A & WCA280A Option 24 User Manual
3-7
Page 51

Command Groups
3-8
WCA230A & WCA280A Option 24 User Manual
Page 52

:CONFigure Commands
The :CONFigure commands set up the analyzer to the default settings for the
specified measurement.
Command Tree
Header Parameter
:CONFigure
:GSMedge
:MACCuracy
:MCPower
:MODulation
:PVTime
:SPURious
:SWITching
NOTE. Data acquisition stops on completion of a :CONFigure command. The
following each command description shows the front-panel key operation
equivalent to running the command except data acquisition control.
WCA230A & WCA280A Option 24 User Manual
3-9
Page 53

:CONFigure Commands
:CONFigure:GSMedge:MACCuracy (No Query Form)
Sets up the analyzer to the default settings for the modulation accuracy measurement under the GSM/EDGE standard. Running this command is equivalent to
pressing the following front panel keys:
DEMOD key → Standard... side key → GSM/EDGE side key
→ PRESET key → Modulation Accuracy side key
Syntax
Arguments
Measurement Modes
Examples
Related Commands
:CONFigure:GSMedge:MACCuracy
None
DEMGSMEDGE
:CONFigure:GSMedge:MACCuracy
sets up the analyzer to the default settings for the modulation accuracy measurement under the GSM/EDGE standard.
:INSTrument[:SELect]
3-10
WCA230A & WCA280A Option 24 User Manual
Page 54

:CONFigure:GSMedge:MCPower (No Query Form)
Sets up the analyzer to the default settings for the mean carrier power measurement under the GSM/EDGE standard. Running this command is equivalent to
pressing the following front panel keys:
DEMOD key → Standard... side key → GSM/EDGE side key
→ PRESET key → Mean Carrier Power side key
:CONFigure Commands
Syntax
Arguments
Measurement Modes
Examples
Related Commands
:CONFigure:GSMedge:MCPower
None
DEMGSMEDGE
:CONFigure:GSMedge:MCPower
sets up the analyzer to the default settings for the mean carrier power measurement under the GSM/EDGE standard.
:INSTrument[:SELect]
WCA230A & WCA280A Option 24 User Manual
3-11
Page 55

:CONFigure Commands
:CONFigure:GSMedge:MODulation (No Query Form)
Sets up the analyzer to the default settings for the modulation spectrum
measurement under the GSM/EDGE standard. Running this command is
equivalent to pressing the following front panel keys:
DEMOD key → Standard... side key → GSM/EDGE side key
→ PRESET key → Modulation Spectrum side key
Syntax
Arguments
Measurement Modes
Examples
Related Commands
:CONFigure:GSMedge:MODulation
None
DEMGSMEDGE
:CONFigure:GSMedge:MODulation
sets up the analyzer to the default settings for the modulation spectrum measurement under the GSM/EDGE standard.
:INSTrument[:SELect]
3-12
WCA230A & WCA280A Option 24 User Manual
Page 56

:CONFigure:GSMedge:PVTime (No Query Form)
Sets up the analyzer to the default settings for the power versus time measurement under the GSM/EDGE standard. Running this command is equivalent to
pressing the following front panel keys:
DEMOD key → Standard... side key → GSM/EDGE side key
→ PRESET key → Power versus Time side key
:CONFigure Commands
Syntax
Arguments
Measurement Modes
Examples
Related Commands
:CONFigure:GSMedge:PVTime
None
DEMGSMEDGE
:CONFigure:GSMedge:PVTime
sets up the analyzer to the default settings for the power versus time measurement under the GSM/EDGE standard.
:INSTrument[:SELect]
WCA230A & WCA280A Option 24 User Manual
3-13
Page 57

:CONFigure Commands
:CONFigure:GSMedge:SPURious (No Query Form)
Sets up the analyzer to the default settings for the spurious measurement under
the GSM/EDGE standard. Running this command is equivalent to pressing the
following front panel keys:
DEMOD key → Standard... side key → GSM/EDGE side key
→ PRESET key → Inband Spurious side key
Syntax
Arguments
Measurement Modes
Examples
Related Commands
:CONFigure:GSMedge:SPURious
None
DEMGSMEDGE
:CONFigure:GSMedge:SPURious
sets up the analyzer to the default settings for the spurious measurement under
the GSM/EDGE standard.
:INSTrument[:SELect]
3-14
WCA230A & WCA280A Option 24 User Manual
Page 58

:CONFigure:GSMedge:SWITching (No Query Form)
Sets up the analyzer to the default settings for the switching spectrum measurement under the GSM/EDGE standard. Running this command is equivalent to
pressing the following front panel keys:
DEMOD key → Standard... side key → GSM/EDGE side key
→ PRESET key → Switching Spectrum side key
:CONFigure Commands
Syntax
Arguments
Measurement Modes
Examples
Related Commands
:CONFigure:GSMedge:SWITching
None
DEMGSMEDGE
:CONFigure:GSMedge:SWITching
sets up the analyzer to the default settings for the switching spectrum measurement under the GSM/EDGE standard.
:INSTrument[:SELect]
WCA230A & WCA280A Option 24 User Manual
3-15
Page 59

:CONFigure Commands
3-16
WCA230A & WCA280A Option 24 User Manual
Page 60

:DISPlay Commands
The :DISPlay commands control how to show measurement data on the screen.
These commands are divided into the following subgroups:
Table 3-8: :DISPlay command subgroups
Command header Function Refer to:
:DISPlay:GSMedge:DDEMod Control display of the GSM/EDGE analysis. p. 3-18
:DISPlay:GSMedge:SPECtrum Control spectrum view in the GSM/EDGE analysis. p. 3-33
:DISPlay:GSMedge:WAVeform Control time domain view in the GSM/EDGE analysis. p. 3-39
NOTE. The :DISPlay commands concern the measurement display only, and do
not affect the hardware settings.
WCA230A & WCA280A Option 24 User Manual
3-17
Page 61

:DISPlay Commands
:DISPlay:GSMedge:DDEMod Subgroup
The :DISPlay:GSMedge:DDEMod commands control display of the main view
and subview for the GSM/EDGE analysis.
NOTE. To use a command of this group, you must have selected DEMGSMEDGE
(GSM/EDGE analysis) in the :INSTrument[:SELect] command.
Command Tree
Header Parameter
:DISPlay
:GSMedge
:DDEMod
:MVIew
FILTer
:EINVerse <boolean>
:FORMat CONSte | VECTor | EVM | MERRor
| PERRor | OFF
:STIMe SYMBol | ISYMbol
:X
[:SCALe]
:OFFSet <numeric_value>
:RANGe <numeric_value>
:Y
[:SCALe]
:FIT
:FULL
:OFFSet <numeric_value>
:RANGe <numeric_value>
:SVIew
FILTer
:EINVerse <boolean>
:FORMat IQVTime | SPECtrum | CONSte
| VECTor | EVM | MERRor | PERRor
| IEYE | QEYE | TEYE | STABle
:STIMe SYMBol | ISYMbol
:X
[:SCALe]
:OFFSet <numeric_value>
:RANGe <numeric_value>
:Y
[:SCALe]
:FIT
:FULL
:OFFSet <numeric_value>
:RANGe <numeric_value>
3-18
WCA230A & WCA280A Option 24 User Manual
Page 62

:DISPlay:GSMedge:DDEMod:MVIew:FILTer:EINVerse (?)
Determines whether to enable or disable the inverse filter for the EDGE signal
on the main view set to constellation in the GSM/EDGE analysis.
This command is valid when :DISPlay:GSMedge:DDEMod:MVIew:FORMat is
CONSte and [:SENSe]:GSMedge:MODulation is EDGE.
:DISPlay Commands
Syntax
Arguments
Measurement Modes
Examples
Related Commands
:DISPlay:GSMedge:DDEMod:MVIew:FILTer:EINVerse { OFF | ON | 0
|1}
:DISPlay:GSMedge:DDEMod:MVIew:FILTer:EINVerse?
OFF or 0 disables the inverse filter for the EDGE signal.
ON or 1 enables the inverse filter for the EDGE signal.
DEMGSMEDGE
:DISPlay:GSMedge:DDEMod:MVIew:FILTer:EINVerse ON
enables the inverse filter for the EDGE signal.
:DISPlay:GSMedge:DDEMod:MVIew:FORMat, [:SENSe]:GSMedge:MODulation
WCA230A & WCA280A Option 24 User Manual
3-19
Page 63

:DISPlay Commands
:DISPlay:GSMedge:DDEMod:MVIew:FORMat (?)
Selects or queries the display format of the main view in the GSM/EDGE
analysis.
Syntax
Arguments
Measurement Modes
:DISPlay:GSMedge:DDEMod:MVIew:FORMat { CONSte | VECTor | EVM
| MERRor | PERRor | OFF }
:DISPlay:GSMedge:DDEMod:MVIew:FORMat?
Table 3–9 shows the arguments and the display formats.
Table 3-9: Main view display formats
Argument Display format
CONSte Constellation
VECTor Vector
EVM Error vector magnitude (EVM)
MERRor Magnitude error
PERRor Phase error
OFF Hides all measurement results.
DEMGSMEDGE
3-20
Examples
Related Commands
:DISPlay:GSMedge:DDEMod:MVIew:FORMat CONSte
selects constellation for the main view.
:DISPlay:GSMedge:DDEMod:SVIew:FORMat
WCA230A & WCA280A Option 24 User Manual
Page 64

:DISPlay:GSMedge:DDEMod:MVIew:STIMe (?)
Sets or queries the slice timing on the main view set to constellation in the
GSM/EDGE analysis.
This command is valid when :DISPlay:GSMedge:DDEMod:MVIew:EINVerse is OFF, :DISPlay:GSMedge:DDEMod:MVIew:FORMat is CONSte and
[:SENSe]:GSMedge:MODulation is EDGE.
:DISPlay Commands
Syntax
Arguments
Measurement Modes
Examples
Related Commands
:DISPlay:GSMedge:DDEMod:MVIew:STIMe { SYMBol | ISYMbol }
:DISPlay:GSMedge:DDEMod:MVIew:STIMe?
SYMBol displays a red point at the symbol position.
ISYMbol displays a red point halfway between two symbols.
DEMGSMEDGE
:DISPlay:GSMedge:DDEMod:MVIew:STIMe SYMBol
displays a red point at the symbol position.
:DISPlay:GSMedge:DDEMod:MVIew:EINVerse,
:DISPlay:GSMedge:DDEMod:MVIew:FORMat, [:SENSe]:GSMedge:MODulation
WCA230A & WCA280A Option 24 User Manual
3-21
Page 65

:DISPlay Commands
:DISPlay:GSMedge:DDEMod:MVIew:X[:SCALe]:OFFSet (?)
Sets or queries the minimum horizontal value (left end) in the main view in the
GSM/EDGE analysis.
Syntax
Arguments
Measurement Modes
Examples
Related Commands
:DISPlay:GSMedge:DDEMod:MVIew:X[:SCALe]:OFFSet <value>
:DISPlay:GSMedge:DDEMod:MVIew:X[:SCALe]:OFFSet?
<value>::=<NRf> specifies the minimum horizontal value in the main view. The
valid range depends on the display format. Refer to Table C–1 in Appendix C.
DEMGSMEDGE
:DISPlay:GSMedge:DDEMod:MVIew:X:SCALe:OFFSet -20ms
sets the minimum horizontal value to –20 ms when the main view displays
EVM.
:DISPlay:GSMedge:DDEMod:MVIew:FORMat
:DISPlay:GSMedge:DDEMod:MVIew:X[:SCALe]:RANGe (?)
Sets or queries the full-scale of the horizontal axis in the main view in the
GSM/EDGE analysis.
Measurement Modes
Related Commands
3-22
Syntax
Arguments
Examples
:DISPlay:GSMedge:DDEMod:MVIew:X[:SCALe]:RANGe <value>
:DISPlay:GSMedge:DDEMod:MVIew:X[:SCALe]:RANGe?
<value>::=<NRf> specifies the full-scale of the horizontal axis in the main view.
The valid range depends on the display format. Refer to Table C–1 in
Appendix C.
DEMGSMEDGE
:DISPlay:GSMedge:DDEMod:MVIew:X:SCALe:RANGe 50us
sets the full-scale of the horizontal axis to 50 ms when the main view displays
EVM.
:DISPlay:GSMedge:DDEMod:MVIew:FORMat
WCA230A & WCA280A Option 24 User Manual
Page 66

:DISPlay Commands
:DISPlay:GSMedge:DDEMod:MVIew:Y[:SCALe]:FIT (No Query Form)
Runs the auto-scale on the main view in the GSM/EDGE analysis. The
auto-scale automatically sets the start value and scale of the vertical axis to
display the whole waveform.
This command is valid when :DISPlay:GSMedge:DDEMod:MVIew:FORMat is
set to EVM, MERRor, or PERRor.
Syntax
Arguments
Measurement Modes
Examples
Related Commands
:DISPlay:GSMedge:DDEMod:MVIew:Y[:SCALe]:FIT
None
DEMGSMEDGE
:DISPlay:GSMedge:DDEMod:MVIew:Y:SCALe:FIT
runs the auto-scale on the main view.
:DISPlay:GSMedge:DDEMod:MVIew:FORMat
:DISPlay:GSMedge:DDEMod:MVIew:Y[:SCALe]:FULL (No Query Form)
Sets the vertical axis in the main view to the default full-scale in the
GSM/EDGE analysis.
This command is valid when :DISPlay:GSMedge:DDEMod:MVIew:FORMat is
set to EVM, MERRor, or PERRor.
Syntax
Arguments
Measurement Modes
Examples
Related Commands
WCA230A & WCA280A Option 24 User Manual
:DISPlay:GSMedge:DDEMod:MVIew:Y[:SCALe]:FULL
None
DEMGSMEDGE
:DISPlay:GSMedge:DDEMod:MVIew:Y:SCALe:FULL
sets the main view’s vertical axis to the default full-scale:
:DISPlay:GSMedge:DDEMod:MVIew:FORMat
3-23
Page 67

:DISPlay Commands
:DISPlay:GSMedge:DDEMod:MVIew:Y[:SCALe]:OFFSet (?)
Sets or queries the minimum vertical value in the main view (bottom edge) in the
GSM/EDGE analysis.
This command is valid when :DISPlay:GSMedge:DDEMod:MVIew:FORMat is
set to EVM, MERRor, or PERRor.
Syntax
Arguments
Measurement Modes
Examples
Related Commands
:DISPlay:GSMedge:DDEMod:MVIew:Y[:SCALe]:OFFSet <value>
:DISPlay:GSMedge:DDEMod:MVIew:Y[:SCALe]:OFFSet?
<value>::=<NRf> specifies the minimum vertical value in the main view. The
valid range depends on the display format. Refer to Table C–1 in Appendix C.
DEMGSMEDGE
:DISPlay:GSMedge:DDEMod:MVIew:Y:SCALe:OFFSet 10pct
sets the minimum vertical value to 10% when the main view displays EVM.
:DISPlay:GSMedge:DDEMod:MVIew:FORMat
3-24
WCA230A & WCA280A Option 24 User Manual
Page 68

:DISPlay:GSMedge:DDEMod:MVIew:Y[:SCALe]:RANGe (?)
Sets or queries full-scale of the vertical axis in the main view in the GSM/EDGE
analysis.
This command is valid when :DISPlay:GSMedge:DDEMod:MVIew:FORMat is
set to EVM, MERRor, or PERRor.
:DISPlay Commands
Syntax
Arguments
Measurement Modes
Examples
Related Commands
:DISPlay:GSMedge:DDEMod:MVIew:Y[:SCALe]:RANGe <value>
:DISPlay:GSMedge:DDEMod:MVIew:Y[:SCALe]:RANGe?
<value>::=<NRf> specifies full-scale of the vertical axis in the main view. The
valid range depends on the display format. Refer to Table C–1 in Appendix C.
DEMGSMEDGE
:DISPlay:GSMedge:DDEMod:MVIew:Y:SCALe:RANGe 50pct
sets full-scale of the vertical axis to 50% when the the main view displays EVM.
:DISPlay:GSMedge:DDEMod:MVIew:FORMat
WCA230A & WCA280A Option 24 User Manual
3-25
Page 69

:DISPlay Commands
:DISPlay:GSMedge:DDEMod:SVIew:FILTer:EINVerse (?)
Determines whether to enable or disable the inverse filter for the EDGE signal
on the subview set to constellation in the GSM/EDGE analysis.
This command is valid when :DISPlay:GSMedge:DDEMod:SVIew:FORMat is
CONSte and [:SENSe]:GSMedge:MODulation is EDGE.
Syntax
Arguments
Measurement Modes
Examples
Related Commands
:DISPlay:GSMedge:DDEMod:SVIew:FILTer:EINVerse { OFF | ON | 0
|1}
:DISPlay:GSMedge:DDEMod:SVIew:FILTer:EINVerse?
OFF or 0 disables the inverse filter for the EDGE signal.
ON or 1 enables the inverse filter for the EDGE signal.
DEMGSMEDGE
:DISPlay:GSMedge:DDEMod:SVIew:FILTer:EINVerse ON
enables the inverse filter for the EDGE signal in the subview.
:DISPlay:GSMedge:DDEMod:SVIew:FORMat, [:SENSe]:GSMedge:MODulation
:DISPlay:GSMedge:DDEMod:SVIew:FORMat (?)
Selects or queries the display format of the subview in the GSM/EDGE analysis.
3-26
Syntax
This command is valid when the measurement item is modulation accuracy
(MACCuracy), mean carrier power (MCPower), modulation spectrum (MODulation), or power versus time (PVTime).
:DISPlay:GSMedge:DDEMod:SVIew:FORMat { IQVTime | FVTime | CONSte
| VECTor | EVM | MERRor | PERRor | IEYE | QEYE | TEYE | STABle }
:DISPlay:GSMedge:DDEMod:SVIew:FORMat?
WCA230A & WCA280A Option 24 User Manual
Page 70

:DISPlay Commands
Arguments
The arguments and display formats are listed below:
Table 3-10: Subview display formats
Argument Display format
IQVTime IQ level vs. Time
SPECtrum Spectrum
CONSte Constellation
VECTor Vector
EVM Error vector magnitude (EVM)
MERRor Amplitude error
PERRor Phase error
IEYE Eye diagram (vertical axis: I data)
QEYE Eye diagram (vertical axis: Q data)
TEYE Eye diagram (vertical axis: Phase)
STABle Symbol table
NOTE. The display format is fixed to spectrum when the measurement item is
switching spectrum (SWITching).
Measurement Modes
Examples
Related Commands
DEMGSMEDGE
:DISPlay:GSMedge:DDEMod:SVIew:FORMat CONSte
displays the constellation in the subview.
:DISPlay:GSMedge:DDEMod:MVIew:FORMat, [:SENSe]:GSMedge:MEASurement
WCA230A & WCA280A Option 24 User Manual
3-27
Page 71

:DISPlay Commands
:DISPlay:GSMedge:DDEMod:SVIew:STIMe (?)
Sets or queries the slice timing on the subview set to constellation in the
GSM/EDGE analysis.
This command is valid when :DISPlay:GSMedge:DDEMod:SVIew:EINVerse is OFF, :DISPlay:GSMedge:DDEMod:SVIew:FORMat is CONSte and
[:SENSe]:GSMedge:MODulation is EDGE.
Syntax
Arguments
Measurement Modes
Examples
Related Commands
:DISPlay:GSMedge:DDEMod:SVIew:STIMe { SYMBol | ISYMbol }
:DISPlay:GSMedge:DDEMod:SVIew:STIMe?
SYMBol displays a red point at the symbol position.
ISYMbol displays a red point halfway between two symbols.
DEMGSMEDGE
:DISPlay:GSMedge:DDEMod:SVIew:STIMe SYMBol
displays a red point at the symbol position.
:DISPlay:GSMedge:DDEMod:SVIew:EINVerse,
:DISPlay:GSMedge:DDEMod:SVIew:FORMat, [:SENSe]:GSMedge:MODulation
3-28
WCA230A & WCA280A Option 24 User Manual
Page 72

:DISPlay:GSMedge:DDEMod:SVIew:X[:SCALe]:OFFSet (?)
Sets or queries the minimum horizontal value (left end) in the subview in the
GSM/EDGE analysis.
:DISPlay Commands
Syntax
Arguments
Measurement Modes
Examples
Related Commands
:DISPlay:GSMedge:DDEMod:SVIew:X[:SCALe]:OFFSet <value>
:DISPlay:GSMedge:DDEMod:SVIew:X[:SCALe]:OFFSet?
<value>::=<NRf> specifies the minimum horizontal value in the subview. The
valid range depends on the display format. Refer to Table C–1 in Appendix C.
DEMGSMEDGE
:DISPlay:GSMedge:DDEMod:SVIew:X:SCALe:OFFSet -2.5
sets the minimum horizontal value to –2.5 when the subview displays the
constellation.
:DISPlay:GSMedge:DDEMod:SVIew:FORMat
:DISPlay:GSMedge:DDEMod:SVIew:X[:SCALe]:RANGe (?)
Sets or queries full-scale of the horizontal axis in the subview in the GSM/EDGE
analysis.
Syntax
Arguments
Measurement Modes
Examples
Related Commands
WCA230A & WCA280A Option 24 User Manual
:DISPlay:GSMedge:DDEMod:SVIew:X[:SCALe]:RANGe <value>
:DISPlay:GSMedge:DDEMod:SVIew:X[:SCALe]:RANGe?
<value>::=<NRf> specifies full-scale of the horizontal axis in the subview. The
valid range depends on the display format. Refer to Table C–1 in Appendix C.
DEMGSMEDGE
:DISPlay:GSMedge:DDEMod:SVIew:X:SCALe:RANGe 2.5
sets full-scale of the horizontal axis to 2.5 when the subview displays the
constellation.
:DISPlay:GSMedge:DDEMod:SVIew:FORMat
3-29
Page 73

:DISPlay Commands
:DISPlay:GSMedge:DDEMod:SVIew:Y[:SCALe]:FIT (No Query Form)
Runs the auto-scale on the subview in the GSM/EDGE analysis. The auto-scale
automatically sets the start value and scale of the vertical axis to display the
whole waveform.
This command is valid when :DISPlay:GSMedge:DDEMod:SVIew:FORMat is
set to IQVTime, FVTime, EVM, MERRor, or PERRor.
Syntax
Arguments
Measurement Modes
Examples
Related Commands
:DISPlay:GSMedge:DDEMod:SVIew:Y[:SCALe]:FIT
None
DEMGSMEDGE
:DISPlay:GSMedge:DDEMod:SVIew:Y:SCALe:FIT
runs the auto-scale on the subview.
:DISPlay:GSMedge:DDEMod:SVIew:FORMat
:DISPlay:GSMedge:DDEMod:SVIew:Y[:SCALe]:FULL (No Query Form)
Sets the vertical axis in the subview to the default full-scale in the GSM/EDGE
analysis.
This command is valid when :DISPlay:GSMedge:DDEMod:SVIew:FORMat is
set to IQVTime, FVTime, EVM, MERRor, or PERRor.
Measurement Modes
Related Commands
3-30
Syntax
Arguments
Examples
:DISPlay:GSMedge:DDEMod:SVIew:Y[:SCALe]:FULL
None
DEMGSMEDGE
:DISPlay:GSMedge:DDEMod:SVIew:Y:SCALe:FULL
sets the vertical axis in the subview to the default full-scale.
:DISPlay:GSMedge:DDEMod:SVIew:FORMat
WCA230A & WCA280A Option 24 User Manual
Page 74

:DISPlay:GSMedge:DDEMod:SVIew:Y[:SCALe]:OFFSet (?)
Sets or queries the minimum vertical value (bottom edge) in the subview in the
GSM/EDGE analysis.
This command is valid when :DISPlay:GSMedge:DDEMod:SVIew:FORMat is
set to IQVTime, FVTime, EVM, MERRor, or PERRor.
:DISPlay Commands
Syntax
Arguments
Measurement Modes
Examples
Related Commands
:DISPlay:GSMedge:DDEMod:SVIew:Y[:SCALe]:OFFSet <value>
<value>::=<NRf> specifies the minimum vertical value in the subview. The
valid range depends on the display format. Refer to Table C–1 in Appendix C.
DEMGSMEDGE
:DISPlay:GSMedge:DDEMod:SVIew:Y:SCALe:OFFSet 10pct
sets the minimum vertical value to 10% when the subview displays EVM.
:DISPlay:GSMedge:DDEMod:SVIew:FORMat
WCA230A & WCA280A Option 24 User Manual
3-31
Page 75

:DISPlay Commands
:DISPlay:GSMedge:DDEMod:SVIew:Y[:SCALe]:RANGe (?)
Sets or queries full-scale of the vertical axis in the subview in the GSM/EDGE
analysis.
This command is valid when :DISPlay:GSMedge:DDEMod:SVIew:FORMat is
set to IQVTime, FVTime, EVM, MERRor, or PERRor.
Syntax
Arguments
Measurement Modes
Examples
Related Commands
:DISPlay:GSMedge:DDEMod:SVIew:Y[:SCALe]:RANGe <value>
:DISPlay:GSMedge:DDEMod:SVIew:Y[:SCALe]:RANGe?
<value>::=<NRf> specifies full-scale of the vertical axis in the subview. The
valid range depends on the display format. Refer to Table C–1 in Appendix C.
DEMGSMEDGE
:DISPlay:GSMedge:DDEMod:SVIew:Y:SCALe:RANGe 50pct
sets full-scale of the vertical axis to 50% when the subview displays EVM.
:DISPlay:GSMedge:DDEMod:SVIew:FORMat
3-32
WCA230A & WCA280A Option 24 User Manual
Page 76

:DISPlay:GSMedge:SPECtrum Subgroup
The :DISPlay:GSMedge:SPECtrum commands control the spectrum display in
the modulation spectrum, the switching spectrum, and the spurious measurements under the GSM/EDGE standard.
:DISPlay Commands
Command Tree
Prerequisites for Use
Header Parameter
:DISPlay
:GSMedge
:SPECtrum
:BMARker
:STATe <boolean>
:X
[:SCALe]
:OFFSet <frequency>
:PDIVsion <frequency>
:Y
[:SCALe]
:FIT
:FULL
:OFFSet <amplitude>
:PDIVsion <amplitude>
To use a command of this group, you must have run at least the following two
commands:
1. Run the following command to set the measurement mode to GSM/EDGE:
:INSTrument[:SELect] "DEMGSMEDGE"
2. Run one of the following commands to start the modulation spectrum, the
switching spectrum, or the spurious measurement.
H To start the measurement with the default settings:
:CONFigure:GSMedge:MODulation
:CONFigure:GSMedge:SWITching or
:CONFigure:GSMedge:SPURious
H To start the measurement without modifying the current settings:
[:SENSe]:GSMedge:MEASurement { MODulation | SWITching
| SPURious }
WCA230A & WCA280A Option 24 User Manual
3-33
Page 77

:DISPlay Commands
:DISPlay:GSMedge:SPECtrum:BMARker:STATe (?)
Determines whether to show the spurious marker in the spurious (SPURious)
measurement.
Syntax
Arguments
Measurement Modes
Examples
:DISPlay:GSMedge:SPECtrum:BMARker:STATe { OFF | ON|0|1}
:DISPlay:GSMedge:SPECtrum:BMARker:STATe?
OFF or 0 hides the spurious marker.
ON or 1 shows the spurious marker.
DEMGSMEDGE
:DISPlay:GSMedge:SPECtrum:BMARker:STATe ON
shows the spurious marker in the spurious measurement.
3-34
WCA230A & WCA280A Option 24 User Manual
Page 78

:DISPlay:GSMedge:SPECtrum:X[:SCALe]:OFFSet (?)
Sets or queries the minimum value (left edge) of the horizontal axis (frequency)
in the spectrum view.
:DISPlay Commands
Syntax
Arguments
Measurement Modes
Examples
:DISPlay:GSMedge:SPECtrum::X[:SCALe]:OFFSet <freq>
:DISPlay:GSMedge:SPECtrum::X[:SCALe]:OFFSet?
<freq>::=<NRf> specifies the minimum horizontal value in the spectrum view.
The valid range depends on the measurement frequency band, which can be
queried with the [:SENSe]:FREQuency:BAND? command. Refer to Table 3–11.
Table 3-11: X offset setting range
Argument Frequency range
BAS DC to 20 MHz
RF1B 15 MHz to 3 GHz (WCA230A)
15 MHz to 3.5 GHz (WCA280A)
RF2B 3.5 to 6.5 GHz (WCA280A)
RF3B 5 to 8 GHz (WCA280A)
DEMGSMEDGE
:DISPlay:GSMedge:SPECtrum:X:SCALe:OFFSet 100MHz
sets the minimum horizontal value to 100 MHz.
Related Commands
WCA230A & WCA280A Option 24 User Manual
[:SENSe]:FREQuency:BAND?
3-35
Page 79

:DISPlay Commands
:DISPlay:GSMedge:SPECtrum:X[:SCALe]:PDIVision (?)
Sets or queries the horizontal scale (frequency per division) in the spectrum
view.
Syntax
Arguments
Measurement Modes
Examples
:DISPlay:GSMedge:SPECtrum:X[:SCALe]:PDIVision <freq>
:DISPlay:GSMedge:SPECtrum:X[:SCALe]:PDIVision?
<freq>::=<NRf> sets the horizontal scale (frequency per division).
Range: 5 Hz to 2 MHz (Baseband), 5 Hz to 300 MHz (RF)
DEMGSMEDGE
:DISPlay:GSMedge:SPECtrum:X:SCALe:PDIVision 100.0E+3
sets the horizontal scale to 100 kHz/div.
3-36
WCA230A & WCA280A Option 24 User Manual
Page 80

:DISPlay:GSMedge:SPECtrum:Y[:SCALe]:FIT (No Query Form)
Runs the auto-scale on the spectrum view. The auto-scale automatically sets the
start value and scale of the vertical axis to display the whole waveform.
:DISPlay Commands
Syntax
Arguments
Measurement Modes
Examples
:DISPlay:GSMedge:SPECtrum:Y[:SCALe]:FIT
None
DEMGSMEDGE
:DISPlay:GSMedge:SPECtrum:Y:SCALe:FIT
runs the auto-scale on the spectrum view.
:DISPlay:GSMedge:SPECtrum:Y[:SCALe]:FULL (No Query Form)
Sets the vertical axis to the default full-scale in the spectrum view.
Syntax
Arguments
Measurement Modes
:DISPlay:GSMedge:SPECtrum:Y[:SCALe]:FULL
None
DEMGSMEDGE
Examples
WCA230A & WCA280A Option 24 User Manual
:DISPlay:GSMedge:SPECtrum:Y:SCALe:FULL
sets the vertical axis to the default full-scale in the spectrum view.
3-37
Page 81

:DISPlay Commands
:DISPlay:GSMedge:SPECtrum:Y[:SCALe]:OFFSet (?)
Sets or queries the minimum vertical, or amplitude, value (bottom end) in the
spectrum view.
Syntax
Arguments
Measurement Modes
Examples
:DISPlay:GSMedge:SPECtrum:Y[:SCALe]:OFFSet <ampl>
:DISPlay:GSMedge:SPECtrum:Y[:SCALe]:OFFSet?
<ampl>::=<NRf> sets the minimum vertical value. Range: –200 to +100 dBm.
DEMGSMEDGE
:DISPlay:GSMedge:SPECtrum:Y:SCALe:OFFSet -100
sets the minimum vertical value to –100 dBm.
:DISPlay:GSMedge:SPECtrum:Y[:SCALe]:PDIVision (?)
Sets or queries the vertical, or amplitude, scale (per division) in the spectrum
view.
Syntax
:DISPlay:GSMedge:SPECtrum:Y[:SCALe]:PDIVision <ampl>
:DISPlay:GSMedge:SPECtrum:Y[:SCALe]:PDIVision?
Measurement Modes
3-38
Arguments
Examples
<freq>::=<NRf> specifies the horizontal scale in the spectrum view.
Range: 0 to 10 dB/div.
DEMGSMEDGE
:DISPlay:GSMedge:SPECtrum:Y:SCALe:PDIVision 10
sets the vertical scale to 10 dB/div.
WCA230A & WCA280A Option 24 User Manual
Page 82

:DISPlay:GSMedge:WAVeform Subgroup
The :DISPlay:GSMedge:WAVeform commands control the time domain display
in the main view of the mean carrier power and the power versus time measurements under the GSM/EDGE standard.
:DISPlay Commands
Command Tree
Prerequisites for Use
Header Parameter
:DISPlay
:GSMedge
:WAVeform
:BURSt FULL | REDGe | FEDGe
:X
[:SCALe]
:OFFSet <time>
:PDIVsion <time>
:Y
[:SCALe]
:FIT
:FULL
:OFFSet <amplitude>
:PDIVsion <amplitude>
To use a command of this group, you must have run at least the following two
commands:
1. Run the following command to set the measurement mode to GSM/EDGE:
:INSTrument[:SELect] "DEMGSMEDGE"
2. Run one of the following commands to start the mean carrier power or the
power versus time measurement:
H To start the measurement with the default settings:
:CONFigure:GSMedge:MCPower or
:CONFigure:GSMedge:PVTime
H To start the measurement without modifying the current settings:
[:SENSe]:GSMedge:MEASurement { MCPower | PVTime }
WCA230A & WCA280A Option 24 User Manual
3-39
Page 83

:DISPlay Commands
:DISPlay:GSMedge:WAVeform:BURSt (?)
Selects or queries how to expand a burst in the power versus time (PVTime)
measurement.
This command is executed only when display data exists.
Syntax
Arguments
Measurement Modes
Examples
:DISPlay:GSMedge:WAVeform:BURSt { FULL | REDGe | FEDGe }
:DISPlay:GSMedge:WAVeform:BURSt?
FULL displays the entire burst.
REDGe expands the rising edge horizontally.
FEDGe expands the falling edge horizontally.
DEMGSMEDGE
:DISPlay:GSMedge:WAVeform:BURSt REDGe
expands the rising edge horizontally.
3-40
WCA230A & WCA280A Option 24 User Manual
Page 84

:DISPlay:GSMedge:WAVeform:X[:SCALe]:OFFSet (?)
Sets or queries the minimum value of the horizontal axis (left end) in the
time domain display.
:DISPlay Commands
Syntax
Arguments
Measurement Modes
Examples
:DISPlay:GSMedge:WAVeform:X[:SCALe]:OFFSet <time>
:DISPlay:GSMedge:WAVeform:X[:SCALe]:OFFSet?
<time>::=<NRf> sets the minimum horizontal value.
For the setting range, refer to Table C–1 in Appendix C.
DEMGSMEDGE
:DISPlay:GSMedge:WAVeform:X:SCALe:OFFSet -100us
sets the minimum horizontal value to –100 ms.
:DISPlay:GSMedge:WAVeform:X[:SCALe]:PDIVision (?)
Sets or queries the horizontal, or time, scale (per division) in the time domain
display.
Syntax
:DISPlay:GSMedge:WAVeform:X[:SCALe]:PDIVision <time>
:DISPlay:GSMedge:WAVeform:X[:SCALe]:PDIVision?
Arguments
Measurement Modes
Examples
WCA230A & WCA280A Option 24 User Manual
<time>::=<NRf> specifies the horizontal scale.
For the setting range, refer to Table C–1 in Appendix C.
DEMGSMEDGE
:DISPlay:GSMedge:WAVeform:X:SCALe:PDIVision 10us
sets the horizontal scale to 10 ms/div.
3-41
Page 85

:DISPlay Commands
:DISPlay:GSMedge:WAVeform:Y[:SCALe]:FIT (No Query Form)
Runs the auto-scale on the time domain display. The auto-scale automatically
sets the start value and scale of the vertical axis to display the whole waveform.
Syntax
Arguments
Measurement Modes
Examples
:DISPlay:GSMedge:WAVeform:Y[:SCALe]:FIT
None
DEMGSMEDGE
:DISPlay:GSMedge:WAVeform:Y:SCALe:FIT
runs the auto-scale.
:DISPlay:GSMedge:WAVeform:Y[:SCALe]:FULL (No Query Form)
Sets the vertical axis in the time domain display to the default full-scale.
Syntax
Arguments
Measurement Modes
:DISPlay:GSMedge:WAVeform:Y[:SCALe]:FULL
None
DEMGSMEDGE
3-42
Examples
:DISPlay:GSMedge:WAVeform:Y:SCALe:FULL
sets the vertical axis in the time domain display to the default full-scale.
WCA230A & WCA280A Option 24 User Manual
Page 86

:DISPlay:GSMedge:WAVeform:Y[:SCALe]:OFFSet (?)
Sets or queries the minimum value of the vertical axis (bottom end) in the
time domain display.
:DISPlay Commands
Syntax
Arguments
Measurement Modes
Examples
:DISPlay:GSMedge:WAVeform:Y[:SCALe]:OFFSet <ampl>
:DISPlay:GSMedge:WAVeform:Y[:SCALe]:OFFSet?
<ampl>::=<NRf> specifies the minimum value of the vertical axis.
For the setting range, refer to Table C–1 in Appendix C.
DEMGSMEDGE
:DISPlay:GSMedge:WAVeform:Y:SCALe:OFFSet -100
sets the minimum vertical value to –100 dBm.
:DISPlay:GSMedge:WAVeform:Y[:SCALe]:PDIVision (?)
Sets the vertical axis scale (per division) in the time domain display.
Syntax
:DISPlay:GSMedge:WAVeform:Y[:SCALe]:PDIVision <ampl>
:DISPlay:GSMedge:WAVeform:Y[:SCALe]:PDIVision?
Arguments
Measurement Modes
Examples
WCA230A & WCA280A Option 24 User Manual
<ampl>::=<NRf> specifies the vertical scale.
For the setting range, refer to Table C–1 in Appendix C.
DEMGSMEDGE
:DISPlay:GSMedge:WAVeform:Y:SCALe:PDIVision 10
sets the vertical scale to 10 dB/div.
3-43
Page 87

:DISPlay Commands
3-44
WCA230A & WCA280A Option 24 User Manual
Page 88

:FETCh Commands
The :FETCh commands retrieve the measurements from the data taken by the
latest INITiate command.
If you want to perform a FETCh operation on fresh data, use the :READ
commands on page 3–57. The :READ commands acquire a new input signal and
fetch the measurement results from that data.
NOTE. To use a :FETCh command, you must have set a measurement mode for
the FETCh operation using the :INSTrument[:SELect] command (refer to the
WCA230A and WCA280A Programmer Manual).
Command Tree
Header Parameter
:FETCh
:GSMedge
:MACCuracy?
:MCPower?
:MODulation?
:PVTime?
:SPECtrum
:MODulation?
:SWITching?
:SPURious?
:SWITching?
:TAMPlitude
:MCPower?
:PVTime?
:TSCode?
WCA230A & WCA280A Option 24 User Manual
3-45
Page 89

:FETCh Commands
:FETCh:GSMedge:MACCuracy? (Query Only)
Fetches the results of the GSM/EDGE modulation accuracy measurement for the
burst specified with the [:SENSe]:GSMedge:BURSt:INDex command.
Syntax
Arguments
Returns
Measurement Modes
Examples
:FETCh:GSMedge:MACCuracy?
None
<pass_fail>,<phase_error>,<peak_phase_error>,<evm>,<evm95>,
<peak_evm>,<freq_error>,<o_off>
Where
<pass_fail>::=<NR1> = 0 represents Fail; = 1 represents Pass.
<phase_error>::=<NRf> is the phase error in degree.
<peak_phase_error>::=<NRf> is the peak phase error in degree.
<evm>::=<NRf> is the EVM (Error Vector Magnitude) in percent (%).
<evm95>::=<NRf> is the EVM 95% tile in percent (%).
<peak_evm>::=<NRf> is the peak EVM in percent (%).
<freq_error>::=<NRf> is the frequency error in Hz.
<o_off>::=<NRf> is the origin offset in dB.
DEMGSMEDGE
:FETCh:GSMedge:MACCuracy?
might return 1,0.47,0.86,0.93,0.75,2.15,4.209,-64.31 for the modulation
accuracy measurement results.
3-46
Related Commands
:INSTrument[:SELect], [:SENSe]:GSMedge:BURSt:INDex
WCA230A & WCA280A Option 24 User Manual
Page 90

:FETCh:GSMedge:MCPower? (Query Only)
Fetches the results of the GSM/EDGE mean carrier power measurement for the
burst specified with the [:SENSe]:GSMedge:BURSt:INDex command.
:FETCh Commands
Syntax
Arguments
Returns
Measurement Modes
Examples
Related Commands
:FETCh:GSMedge:MCPower?
None
<mean_power>,<max_power>,<max_bi>,<min_power>,<min_bi>
Where
<mean_power>::=<NRf> is the mean power value in dBm.
<max_power>::=<NRf> is the maximum power value in dBm.
<max_bi>::=<NR1> is the burst index for the maximum power.
<min_power>::=<NRf> is the minimum power value in dBm.
<min_bi>::=<NR1> is the burst index for the minimum power.
DEMGSMEDGE
:FETCh:GSMedge:MCPower?
might return 68.081,72.4203,-3,58.229,-7 as the mean carrier power
measurement results.
:INSTrument[:SELect], [:SENSe]:GSMedge:BURSt:INDex
WCA230A & WCA280A Option 24 User Manual
3-47
Page 91

:FETCh Commands
:FETCh:GSMedge:MODulation? (Query Only)
Queries the pass/fail result of the GSM/EDGE modulation spectrum measurement for the standard specified with the [:SENSe]:GSMedge:STANdard
commands.
Syntax
Arguments
Returns
Measurement Modes
Examples
Related Commands
:FETCh:GSMedge:MODulation?
None
<NR1> = 0 indicates Fail.
<NR1> = 1 indicates Pass.
DEMGSMEDGE
:FETCh:GSMedge:MODulation?
might return 1, indicating that the modulation spectrum measurement has passed.
:INSTrument[:SELect], [:SENSe]:GSMedge:STANdard
3-48
WCA230A & WCA280A Option 24 User Manual
Page 92

:FETCh:GSMedge:PVTime? (Query Only)
Queries the pass/fail result of the GSM/EDGE power versus time measurement
for the burst specified with the [:SENSe]:GSMedge:BURSt:INDex command.
:FETCh Commands
Syntax
Arguments
Returns
Measurement Modes
Examples
Related Commands
:FETCh:GSMedge:PVTime?
None
<NR1> = 0 indicates Fail.
<NR1> = 1 indicates Pass.
DEMGSMEDGE
:FETCh:GSMedge:PVTime?
might return 1, indicating that the power versus time measurement has passed.
:INSTrument[:SELect], [:SENSe]:GSMedge:BURSt:INDex
WCA230A & WCA280A Option 24 User Manual
3-49
Page 93

:FETCh Commands
:FETCh:GSMedge:SPECtrum:MODulation? (Query Only)
Fetches the time domain amplitude data of the GSM/EDGE modulation
spectrum measurement for the burst specified with the
[:SENSe]:GSMedge:BURSt:INDex command.
Syntax
Returns
Measurement Modes
Examples
Related Commands
:FETCh:GSMedge:SPECtrum:MODulation?
#<Num_digit><Num_byte><Data(1)><Data(2)>...<Data(n)>
Where
<Num_digit> is the number of digits in <Num_byte>.
<Num_byte> is the number of bytes of the data that follow.
<Data(n)> is the modulation spectrum power data in dBm.
4-byte little endian floating-point format specified in IEEE 488.2
n: Max 512000 (= 1024 points 500 frames)
DEMGSMEDGE
:FETCh:GSMedge:SPECtrum:MODulation?
might return #510240xxx... (10240-byte data) as the results of the modulation
spectrum measurement.
:INSTrument[:SELect], [:SENSe]:GSMedge:BURSt:INDex
3-50
WCA230A & WCA280A Option 24 User Manual
Page 94

:FETCh:GSMedge:SPECtrum:SWITching? (Query Only)
Fetches the time domain amplitude data of the GSM/EDGE switching spectrum
measurement for the burst specified with the [:SENSe]:GSMedge:BURSt:INDex
command.
:FETCh Commands
Syntax
Returns
Measurement Modes
Examples
Related Commands
:FETCh:GSMedge:SPECtrum:SWITching?
#<Num_digit><Num_byte><Data(1)><Data(2)>...<Data(n)>
Where
<Num_digit> is the number of digits in <Num_byte>.
<Num_byte> is the number of bytes of the data that follow.
<Data(n)> is the switching spectrum power data in dBm.
4-byte little endian floating-point format specified in IEEE 488.2
n: Max 512000 (= 1024 points 500 frames)
DEMGSMEDGE
:FETCh:GSMedge:SPECtrum:SWITching?
might return #510240xxx... (10240-byte data) as the results of the switching
spectrum measurement.
:INSTrument[:SELect], [:SENSe]:GSMedge:BURSt:INDex
WCA230A & WCA280A Option 24 User Manual
3-51
Page 95

:FETCh Commands
:FETCh:GSMedge:SPURious? (Query Only)
Fetches the results of the GSM/EDGE spurious measurement for the standard
specified with the [:SENSe]:GSMedge:STANdard commands. The values of
frequency and level are returned for maximum 10 peaks that exceeded the
standard level in ascending order.
Syntax
Arguments
Returns
Measurement Modes
Examples
Related Commands
:FETCh:GSMedge:SPURious?
None
<snum>{,<freq>,<rdb>}
Where
<snum>::=<NR1> is the number of detected spurious signals, up to 10.
<freq>::=<NRf> is the frequency of spurious in Hz.
<rdb>::=<NRf> is the level of spurious in dBm.
DEMGSMEDGE
:FETCh:GSMedge:SPURious?
might return 3,1.2E6,-79,2.4E6,-79.59,1E6,-80.38.
:INSTrument[:SELect], [:SENSe]:GSMedge:STANdard
3-52
WCA230A & WCA280A Option 24 User Manual
Page 96

:FETCh:GSMedge:SWITching? (Query Only)
Queries the pass/fail result of the GSM/EDGE switching spectrum measurement
for the standard specified with the [:SENSe]:GSMedge:STANdard commands.
:FETCh Commands
Syntax
Arguments
Returns
Measurement Modes
Examples
Related Commands
:FETCh:GSMedge:SWITching?
None
<NR1> = 0 indicates Fail.
<NR1> = 1 indicates Pass.
DEMGSMEDGE
:FETCh:GSMedge:SWITching?
might return 1, indicating that the switching spectrum measurement has passed.
:INSTrument[:SELect], [:SENSe]:GSMedge:STANdard
WCA230A & WCA280A Option 24 User Manual
3-53
Page 97

:FETCh Commands
:FETCh:GSMedge:TAMPlitude:MCPower? (Query Only)
Fetches the time domain amplitude data of the GSM/EDGE mean carrier power
measurement for the burst specified with the [:SENSe]:GSMedge:BURSt:INDex
command.
Syntax
Returns
Measurement Modes
Examples
Related Commands
:FETCh:GSMedge:TAMPlitude:MCPower?
#<Num_digit><Num_byte><Data(1)><Data(2)>...<Data(n)>
Where
<Num_digit> is the number of digits in <Num_byte>.
<Num_byte> is the number of bytes of the data that follow.
<Data(n)> is the absolute power for each symbol in dBm.
4-byte little endian floating-point format specified in IEEE 488.2
n: Max 512000 (= 1024 points 500 frames)
Invalid data is returned as –1000.
DEMGSMEDGE
:FETCh:GSMedge:TAMPlitude:MCPower?
might return #510240xxx... (10240-byte data) as the results of the mean carrier
power measurement.
:INSTrument[:SELect], [:SENSe]:GSMedge:BURSt:INDex
3-54
WCA230A & WCA280A Option 24 User Manual
Page 98

:FETCh:GSMedge:TAMPlitude:PVTime? (Query Only)
Fetches the time domain amplitude data of the GSM/EDGE power versus time
measurement for the time slot specified with the [:SENSe]:GSMedge:BURSt:INDex command.
:FETCh Commands
Syntax
Returns
Measurement Modes
Examples
Related Commands
:FETCh:GSMedge:TAMPlitude:PVTime?
#<Num_digit><Num_byte><Data(1)><Data(2)>...<Data(n)>
Where
<Num_digit> is the number of digits in <Num_byte>.
<Num_byte> is the number of bytes of the data that follow.
<Data(n)> is the absolute power for each symbol in dBm.
4-byte little endian floating-point format specified in IEEE 488.2
n: Max 512000 (= 1024 points 500 frames)
Invalid data is returned as –1000.
DEMGSMEDGE
:FETCh:GSMedge:TAMPlitude:PVTime?
might return #510240xxx... (10240-byte data) as the results of the power
versus time measurement.
:INSTrument[:SELect], [:SENSe]:GSMedge:BURSt:INDex
WCA230A & WCA280A Option 24 User Manual
3-55
Page 99

:FETCh Commands
:FETCh:GSMedge:TSCode? (Query Only)
Queries the Training Sequence Code (TSC) number of the burst specified with
the [:SENSe]:GSMedge:BURSt:INDex command.
Syntax
Returns
Measurement Modes
Examples
Related Commands
:FETCh:GSMedge:TSCode?
<tsc>::=<NR1> is the TSC number (0 to 7).
NOTE. This command is valid when one of the following measurements is done:
MCPower (mean carrier power), PVTime (power versus time), MACCuracy
(modulation accuracy), MODulation (modulation spectrum), and SWITching
(switching spectrum). Unless it is done, the error message “–200, Execution
Error” is returned.
DEMGSMEDGE
:FETCh:GSMedge:TSCode?
might return 5 of the TSC number.
:INSTrument[:SELect], [:SENSe]:GSMedge:BURSt:INDex
3-56
WCA230A & WCA280A Option 24 User Manual
Page 100

:READ Commands
The :READ commands acquire an input signal once in the single mode and
obtain the measurement results from that data.
If you want to fetch the measurement results from the data currently residing in
the memory without acquiring the input signal, use the :FETCh commands.
Prerequisites for Use
To use a command of this group, you must have run at least the following two
commands:
1. Select a measurement mode with the :INSTrument[:SELect] command.
2. Set the acquisition mode to single with the following command:
For example, use the following command to select DEMGSMEDGE
(GSM/EDGE modulation analysis mode).
:INSTrument[:SELect] "DEMGSMEDGE"
:INITiate:CONTinuous OFF
NOTE. If a :READ command is run in the continuous mode, the acquisition mode
is changed to single.
WCA230A & WCA280A Option 24 User Manual
3-57
 Loading...