

Page 1

User Manual
WCA11G
IEEE802.11a/b/g Signal Analysis Software
071-1365-00
This document supports firmware version FV:v1.00 and above.
www.tektronix.com
Page 2

Copyright © Tektronix, Inc. All rights reserved.
Tektronix products are covered by U.S. and foreign patents, issued and pending. Information in this publication
supercedes that in all previously published material. Specifications and price change privileges reserved.
Tektronix, Inc., P.O. Box 500, Beaverton, OR 97077
TEKTRONIX and TEK are registered trademarks of Tektronix, Inc.
Page 3

SOFTWARE WARRANTY SUMMARY
Tektronix warrants that its software products will conform to the specifications in the documentation provided with
the product, when used properly in the specified operating environment, for a period of three (3) months. The warranty
period begins on the date of shipment, except that if the program is installed by Tektronix, the warranty period begins
on the date of installation or one month after the date of shipment, whichever is earlier. If the software product does
not conform as warranted, Tektronix will provide the remedial services as described in the documentation provided
with the product.
For products offered without documentation, Tektronix warrants that the media on which the software product is
furnished and the encoding of the programs on the media will be free from defects in materials and workmanship for
a period of three (3) months from the date of shipment. If any such medium or encoding proves defective during the
warranty period, Tektronix will provide a replacement in exchange for the defective medium. Except as to the media
on which the software product is furnished, the software product is provided ”as is” without warranty of any kind,
either express or implied.
Tektronix does not warrant that the functions contained in any software product will meet Customer’s requirements or
that the operation of the programs will be uninterrupted or error-free.
In order to obtain service under this warranty, Customer must notify Tektronix of the defect before the expiration of
the warranty period and, for warranted products, make suitable arrangements for such service in accordance with the
instructions received from Tektronix. If Tektronix is unable, within a reasonable time after receipt of such notice, to
provide remedial service for warranted products or, for ”as is” products, to provide a replacement that is free from
defects in materials and workmanship, Customer may terminate the license for the software product and return the
software product and any associated materials for credit or refund.
The above warranties shall not apply to any software product that has been modified or altered by Customer. Tektronix
shall not be obligated to furnish service under this warranty with respect to any software product a) that is used in an
operating environment other than that specified or in a manner inconsistent with the User Manual and documentation;
or b) when the software product has been integrated with other software if the result of such integration increases the
time or difficulty of analyzing or servicing the software product or the problems ascribed in the software product.
THE ABOVE WARRANTIES ARE GIVEN BY TEKTRONIX WITH RESPECT TO THE LISTED
PRODUCTS IN LIEU OF ANY OTHER WARRANTIES, EXPRESS OR IMPLIED. TEKTRONIX AND ITS
VENDORS DISCLAIM ANY IMPLIED WARRANTIES OF MERCHANTABILITY OR FITNESS FOR A
PARTICULAR PURPOSE. TEKTRONIX’ RESPONSIBILITY TO PROVIDE REMEDIAL SERVICE
WHEN SPECIFIED, REPLACE DEFECTIVE MEDIA, OR REFUND CUSTOMER’S PAYMENT, AS
APPLICABLE, IS THE SOLE AND EXCLUSIVE REMEDY PROVIDED TO CUSTOMER FOR BREACH
OF EITHER WARRANTY. TEKTRONIX AND ITS VENDORS WILL NOT BE LIABLE FOR ANY
INDIRECT, SPECIAL, INCIDENTAL, OR CONSEQUENTIAL DAMAGES IRRESPECTIVE OF
WHETHER TEKTRONIX OR THE VENDOR HAS ADVANCE NOTICE OF THE POSSIBILITY OF SUCH
DAMAGES.
Page 4

Page 5

Table of Contents
Preface . . . . . . . . . . . . . . . . . . . . . . . . . . . . . . . . . . . . . . . . . . . . . . . . . . . . . . . . . . . . . vii
Manual Structure . . . . . . . . . . . . . . . . . . . . . . . . . . . . . . . . . . . . . . . . . . . . . . . . . . . . . . vii
Related Manual and Online Document . . . . . . . . . . . . . . . . . . . . . . . . . . . . . . . . . . . . . vii
Contacting Tektronix . . . . . . . . . . . . . . . . . . . . . . . . . . . . . . . . . . . . . . . . . . . . . . . . . . viii
Glossary of Acronyms . . . . . . . . . . . . . . . . . . . . . . . . . . . . . . . . . . . . . . . . . . . . . . . . . . ix
Getting Started . . . . . . . . . . . . . . . . . . . . . . . . . . . . . . . . . . . . . . . . . . . . . . . . . . . . . 1-1
Product Overview . . . . . . . . . . . . . . . . . . . . . . . . . . . . . . . . . . . . . . . . . . . . . . . . . . . . 1-1
Hardware Configuration . . . . . . . . . . . . . . . . . . . . . . . . . . . . . . . . . . . . . . . . . . . . . . . 1-7
Accessories. . . . . . . . . . . . . . . . . . . . . . . . . . . . . . . . . . . . . . . . . . . . . . . . . . . . . . . . . . 1-8
Installation . . . . . . . . . . . . . . . . . . . . . . . . . . . . . . . . . . . . . . . . . . . . . . . . . . . . . . . . . . 1-8
System Settings . . . . . . . . . . . . . . . . . . . . . . . . . . . . . . . . . . . . . . . . . . . . . . . . . . . . . 1-10
Operating Basics . . . . . . . . . . . . . . . . . . . . . . . . . . . . . . . . . . . . . . . . . . . . . . . . . . . . 2-1
Screen Elements. . . . . . . . . . . . . . . . . . . . . . . . . . . . . . . . . . . . . . . . . . . . . . . . . . . . . . 2-1
Graph Window Pane . . . . . . . . . . . . . . . . . . . . . . . . . . . . . . . . . . . . . . . . . . . . . . . . . 2-18
Modulation Analysis . . . . . . . . . . . . . . . . . . . . . . . . . . . . . . . . . . . . . . . . . . . . . . . . . 3-1
Modulation Analysis View Formats . . . . . . . . . . . . . . . . . . . . . . . . . . . . . . . . . . . . . . 3-2
IEEE802.11a Measurements. . . . . . . . . . . . . . . . . . . . . . . . . . . . . . . . . . . . . . . . . . 1-3
IEEE802.11b Measurements . . . . . . . . . . . . . . . . . . . . . . . . . . . . . . . . . . . . . . . . . 1-4
IEEE802.11g Measurements . . . . . . . . . . . . . . . . . . . . . . . . . . . . . . . . . . . . . . . . . 1-5
Difference between WCA330 and WCA380 Analyzers . . . . . . . . . . . . . . . . . . . . 1-7
PC System Requirements . . . . . . . . . . . . . . . . . . . . . . . . . . . . . . . . . . . . . . . . . . . . 1-8
Installation Instructions . . . . . . . . . . . . . . . . . . . . . . . . . . . . . . . . . . . . . . . . . . . . . 1-8
Created Folders. . . . . . . . . . . . . . . . . . . . . . . . . . . . . . . . . . . . . . . . . . . . . . . . . . . . 1-9
Sharing the Folders on a PC . . . . . . . . . . . . . . . . . . . . . . . . . . . . . . . . . . . . . . . . . 1-10
Setting the Network Parameters of the Analyzer . . . . . . . . . . . . . . . . . . . . . . . . . 1-12
Network Setting of Windows 98 PC. . . . . . . . . . . . . . . . . . . . . . . . . . . . . . . . . . . 1-17
Network Setting of a PC Running Windows 2000 or Windows XP . . . . . . . . . . 1-19
Registering a User Name for MS Windows 2000 or MS Windows XP. . . . . . . . 1-22
Menu Bar . . . . . . . . . . . . . . . . . . . . . . . . . . . . . . . . . . . . . . . . . . . . . . . . . . . . . . . . 2-2
Analysis Type buttons. . . . . . . . . . . . . . . . . . . . . . . . . . . . . . . . . . . . . . . . . . . . . . . 2-5
Graph Frame . . . . . . . . . . . . . . . . . . . . . . . . . . . . . . . . . . . . . . . . . . . . . . . . . . . . . . 2-5
Modulation Analysis Setting Window . . . . . . . . . . . . . . . . . . . . . . . . . . . . . . . . . . 2-6
Power Analysis Setting Window . . . . . . . . . . . . . . . . . . . . . . . . . . . . . . . . . . . . . 2-17
View Function. . . . . . . . . . . . . . . . . . . . . . . . . . . . . . . . . . . . . . . . . . . . . . . . . . . . 2-19
Scale Adjustment . . . . . . . . . . . . . . . . . . . . . . . . . . . . . . . . . . . . . . . . . . . . . . . . . 2-23
Modulation Analysis Test Procedure . . . . . . . . . . . . . . . . . . . . . . . . . . . . . . . . . . . 3-1
Power vs. All Time. . . . . . . . . . . . . . . . . . . . . . . . . . . . . . . . . . . . . . . . . . . . . . . . . 3-2
Average Power vs. Time. . . . . . . . . . . . . . . . . . . . . . . . . . . . . . . . . . . . . . . . . . . . . 3-3
Power Analysis Display . . . . . . . . . . . . . . . . . . . . . . . . . . . . . . . . . . . . . . . . . . . . . 3-4
Power vs. SC_No . . . . . . . . . . . . . . . . . . . . . . . . . . . . . . . . . . . . . . . . . . . . . . . . . . 3-5
Power vs. Time. . . . . . . . . . . . . . . . . . . . . . . . . . . . . . . . . . . . . . . . . . . . . . . . . . . . 3-6
Flatness . . . . . . . . . . . . . . . . . . . . . . . . . . . . . . . . . . . . . . . . . . . . . . . . . . . . . . . . . . 3-7
Constellation Analysis Display . . . . . . . . . . . . . . . . . . . . . . . . . . . . . . . . . . . . . . . 3-7
Constellation/Symbol Constellation . . . . . . . . . . . . . . . . . . . . . . . . . . . . . . . . . . . . 3-8
WCA11G IEEE802.11a/b/g User Manual i
Page 6

Table of Contents
Constellation/Segment Constellation. . . . . . . . . . . . . . . . . . . . . . . . . . . . . . . . . . . 3-11
Average EVM vs. Time . . . . . . . . . . . . . . . . . . . . . . . . . . . . . . . . . . . . . . . . . . . . . 3-12
EVM Analysis Display . . . . . . . . . . . . . . . . . . . . . . . . . . . . . . . . . . . . . . . . . . . . . 3-13
EVM vs. SC_No . . . . . . . . . . . . . . . . . . . . . . . . . . . . . . . . . . . . . . . . . . . . . . . . . . 3-13
EVM vs. Time . . . . . . . . . . . . . . . . . . . . . . . . . . . . . . . . . . . . . . . . . . . . . . . . . . . . 3-15
Average MagErr vs Time. . . . . . . . . . . . . . . . . . . . . . . . . . . . . . . . . . . . . . . . . . . . 3-16
MagErr Analysis Display. . . . . . . . . . . . . . . . . . . . . . . . . . . . . . . . . . . . . . . . . . . . 3-17
MagErr vs. SC_No. . . . . . . . . . . . . . . . . . . . . . . . . . . . . . . . . . . . . . . . . . . . . . . . . 3-18
MagErr vs. Time . . . . . . . . . . . . . . . . . . . . . . . . . . . . . . . . . . . . . . . . . . . . . . . . . . 3-19
Average PhaseErr vs Time. . . . . . . . . . . . . . . . . . . . . . . . . . . . . . . . . . . . . . . . . . . 3-20
PhaseErr Analysis Display. . . . . . . . . . . . . . . . . . . . . . . . . . . . . . . . . . . . . . . . . . . 3-21
PhaseErr vs SC_No . . . . . . . . . . . . . . . . . . . . . . . . . . . . . . . . . . . . . . . . . . . . . . . . 3-22
PhaseErr vs Time. . . . . . . . . . . . . . . . . . . . . . . . . . . . . . . . . . . . . . . . . . . . . . . . . . 3-23
Center Frequency Error . . . . . . . . . . . . . . . . . . . . . . . . . . . . . . . . . . . . . . . . . . . . . 3-24
OFDM Linearity . . . . . . . . . . . . . . . . . . . . . . . . . . . . . . . . . . . . . . . . . . . . . . . . . . 3-25
Symbol Table . . . . . . . . . . . . . . . . . . . . . . . . . . . . . . . . . . . . . . . . . . . . . . . . . . . . . 3-26
Power Analysis . . . . . . . . . . . . . . . . . . . . . . . . . . . . . . . . . . . . . . . . . . . . . . . . . . . . . 3-28
Power Analysis Test Procedure . . . . . . . . . . . . . . . . . . . . . . . . . . . . . . . . . . . . . . . 3-28
Power Analysis View Formats . . . . . . . . . . . . . . . . . . . . . . . . . . . . . . . . . . . . . . . . . . 3-29
Spectrum Mask (OFDM). . . . . . . . . . . . . . . . . . . . . . . . . . . . . . . . . . . . . . . . . . . . 3-29
Spectrum Mask (DSSS). . . . . . . . . . . . . . . . . . . . . . . . . . . . . . . . . . . . . . . . . . . . . 3-31
Transmit Power On . . . . . . . . . . . . . . . . . . . . . . . . . . . . . . . . . . . . . . . . . . . . . . . . 3-32
Transmit Power Off . . . . . . . . . . . . . . . . . . . . . . . . . . . . . . . . . . . . . . . . . . . . . . . . 3-33
Index . . . . . . . . . . . . . . . . . . . . . . . . . . . . . . . . . . . . . . . . . . . . . . . . . . . . . . . . . . Index-1
ii WCA11G IEEE802.11a/b/g User Manual
Page 7

List of Figures
List of Figures
Figure 1-1: WCA11G signal analysis system hardware configuration . . . . . . . . 1-7
Figure 1-2: ShareFolder Properties dialog box (MS Windows 98) . . . . . . . . . . 1-11
Figure 1-3: ShareFolder Properties dialog box (MS Windows 2000) . . . . . . . . 1-11
Figure 1-4: Network dialog box (Identification tab) . . . . . . . . . . . . . . . . . . . . . . 1-12
Figure 1-5: TCP/IP Properties dialog box . . . . . . . . . . . . . . . . . . . . . . . . . . . . . . 1-13
Figure 1-6: TCP/IP Properties dialog box for address setting . . . . . . . . . . . . . . 1-14
Figure 1-7: CONFIG:UTILITY submenu . . . . . . . . . . . . . . . . . . . . . . . . . . . . . . 1-15
Figure 1-8: Util:More: submenu . . . . . . . . . . . . . . . . . . . . . . . . . . . . . . . . . . . . . . 1-15
Figure 1-9: [Util H] Remote submenu . . . . . . . . . . . . . . . . . . . . . . . . . . . . . . . . . . 1-16
Figure 1-10: [Util H] Remote TCP/IP submenu . . . . . . . . . . . . . . . . . . . . . . . . . . 1-16
Figure 1-11: Network dialog box showing Identification tab . . . . . . . . . . . . . . . 1-17
Figure 1-12: Identification Changes dialog box . . . . . . . . . . . . . . . . . . . . . . . . . . 1-19
Figure 1-13: Internet Protocol (TCP/IP) Properties dialog box . . . . . . . . . . . . . 1-20
Figure 1-14: Internet Protocol (TCP/IP) Properties for IP Address Assignment . . . .
1-21
Figure 2-1: Screen elements . . . . . . . . . . . . . . . . . . . . . . . . . . . . . . . . . . . . . . . . . . . 2-1
Figure 2-2: Ethernet Setup dialog box . . . . . . . . . . . . . . . . . . . . . . . . . . . . . . . . . . 2-4
Figure 2-3: Folder Setup dialog box . . . . . . . . . . . . . . . . . . . . . . . . . . . . . . . . . . . . 2-5
Figure 2-4: Read From WCA dialog box . . . . . . . . . . . . . . . . . . . . . . . . . . . . . . . . 2-8
Figure 2-5: Read From WCA dialog box (IQT file) . . . . . . . . . . . . . . . . . . . . . . 2-12
Figure 2-6: Display Modulation Type dialog box . . . . . . . . . . . . . . . . . . . . . . . . 2-16
Figure 2-7: 1 * 1 screen display . . . . . . . . . . . . . . . . . . . . . . . . . . . . . . . . . . . . . . . 2-18
Figure 2-8: 2 * 2 screen display . . . . . . . . . . . . . . . . . . . . . . . . . . . . . . . . . . . . . . . 2-18
Figure 2-9: View format pull-down list . . . . . . . . . . . . . . . . . . . . . . . . . . . . . . . . . 2-19
Figure 2-10: Scale input box . . . . . . . . . . . . . . . . . . . . . . . . . . . . . . . . . . . . . . . . . 2-23
Figure 3-1: Power vs. All Time display . . . . . . . . . . . . . . . . . . . . . . . . . . . . . . . . . . 3-2
Figure 3-2: Average Power vs. Time . . . . . . . . . . . . . . . . . . . . . . . . . . . . . . . . . . . . 3-3
Figure 3-3: Power vs. SC_No display . . . . . . . . . . . . . . . . . . . . . . . . . . . . . . . . . . . 3-5
Figure 3-4: Power vs. Time . . . . . . . . . . . . . . . . . . . . . . . . . . . . . . . . . . . . . . . . . . . 3-6
Figure 3-5: Flatness measurement . . . . . . . . . . . . . . . . . . . . . . . . . . . . . . . . . . . . . . 3-7
Figure 3-6: Constellation display . . . . . . . . . . . . . . . . . . . . . . . . . . . . . . . . . . . . . . . 3-8
Figure 3-7: Symbol Constellation display . . . . . . . . . . . . . . . . . . . . . . . . . . . . . . . . 3-9
Figure 3-8: Pop-up View menu . . . . . . . . . . . . . . . . . . . . . . . . . . . . . . . . . . . . . . . 3-10
Figure 3-9: Segment Constellation display . . . . . . . . . . . . . . . . . . . . . . . . . . . . . . 3-11
Figure 3-10: Average EVM vs. Time display . . . . . . . . . . . . . . . . . . . . . . . . . . . . 3-12
Figure 3-11: EVM vs. SC_No display . . . . . . . . . . . . . . . . . . . . . . . . . . . . . . . . . . 3-13
Figure 3-12: EVM vs. Time display . . . . . . . . . . . . . . . . . . . . . . . . . . . . . . . . . . . . 3-15
Figure 3-13: Average MagErr vs. Time . . . . . . . . . . . . . . . . . . . . . . . . . . . . . . . . 3-16
Figure 3-14: MagErr vs. SC_No display . . . . . . . . . . . . . . . . . . . . . . . . . . . . . . . . 3-18
Figure 3-15: MagErr vs. Time . . . . . . . . . . . . . . . . . . . . . . . . . . . . . . . . . . . . . . . . 3-19
Figure 3-16: Average PhaseErr vs. Time display . . . . . . . . . . . . . . . . . . . . . . . . . 3-20
Figure 3-17: PhaseErr vs. SC_No display . . . . . . . . . . . . . . . . . . . . . . . . . . . . . . . 3-22
Figure 3-18: PhaseErr vs. Time display . . . . . . . . . . . . . . . . . . . . . . . . . . . . . . . . 3-23
Figure 3-19: Center frequency error display . . . . . . . . . . . . . . . . . . . . . . . . . . . . 3-24
Figure 3-20: OFDM Linearity display . . . . . . . . . . . . . . . . . . . . . . . . . . . . . . . . . 3-25
Figure 3-21: Symbol table (Hex) . . . . . . . . . . . . . . . . . . . . . . . . . . . . . . . . . . . . . . 3-26
WCA11G IEEE802.11a/b/g User Manual iii
Page 8

List of Figures
Figure 3-22: Symbol table (Bin) . . . . . . . . . . . . . . . . . . . . . . . . . . . . . . . . . . . . . . . 3-26
Figure 3-23: Spectrum mask (OFDM) . . . . . . . . . . . . . . . . . . . . . . . . . . . . . . . . . . 3-29
Figure 3-24: IEEE802.11a spectrum mask . . . . . . . . . . . . . . . . . . . . . . . . . . . . . . 3-30
Figure 3-25: Spectrum mask (DSSS) . . . . . . . . . . . . . . . . . . . . . . . . . . . . . . . . . . . 3-31
Figure 3-26: IEEE802.11b spectrum mask . . . . . . . . . . . . . . . . . . . . . . . . . . . . . . 3-31
Figure 3-27: Transmit Power On display . . . . . . . . . . . . . . . . . . . . . . . . . . . . . . . 3-32
Figure 3-28: IEEE802.11b Transmit power-on ramp . . . . . . . . . . . . . . . . . . . . . . 3-32
Figure 3-29: Transmit Power Off display . . . . . . . . . . . . . . . . . . . . . . . . . . . . . . . 3-33
Figure 3-30: IEEE802.11b Transmit power-down ramp . . . . . . . . . . . . . . . . . . . 3-33
iv WCA11G IEEE802.11a/b/g User Manual
Page 9

List of Tables
List of Tables
Table 1-1: WCA11G measurement items . . . . . . . . . . . . . . . . . . . . . . . . . . . . . . . . 1-1
Table 1-2: Measurements for IEEE802.11a signals . . . . . . . . . . . . . . . . . . . . . . . . 1-3
Table 1-3: Measurements for IEEE802.11b signals . . . . . . . . . . . . . . . . . . . . . . . . 1-4
Table 1-4: Measurements for IEEE802.11g signals . . . . . . . . . . . . . . . . . . . . . . . . 1-5
Table 1-5: Equipment used in the WCA11G signal analysis system . . . . . . . . . . 1-7
Table 2-1: Menu Bar Items . . . . . . . . . . . . . . . . . . . . . . . . . . . . . . . . . . . . . . . . . . . 2-2
Table 2-2: Modulation Analysis SETUP Parameters . . . . . . . . . . . . . . . . . . . . . . 2-6
Table 2-3: Modulation types . . . . . . . . . . . . . . . . . . . . . . . . . . . . . . . . . . . . . . . . . . 2-7
Table 2-4: Read From WCA dialog box parameters . . . . . . . . . . . . . . . . . . . . . . . 2-9
Table 2-5: Channel list . . . . . . . . . . . . . . . . . . . . . . . . . . . . . . . . . . . . . . . . . . . . . . 2-10
Table 2-6: Read From WCA dialog box (IQT) parameters . . . . . . . . . . . . . . . . 2-12
Table 2-7: Modulation Analysis VIEW Parameters . . . . . . . . . . . . . . . . . . . . . . 2-13
Table 2-8: Power Analysis SETUP Parameters . . . . . . . . . . . . . . . . . . . . . . . . . . 2-17
Table 2-9: Power Analysis Test Items . . . . . . . . . . . . . . . . . . . . . . . . . . . . . . . . . . 2-17
Table 2-10: View format - IEEE802.11a signals . . . . . . . . . . . . . . . . . . . . . . . . . 2-19
Table 2-11: View format - IEEE802.11b signals . . . . . . . . . . . . . . . . . . . . . . . . . 2-20
Table 2-12: View format - IEEE802.11g signals . . . . . . . . . . . . . . . . . . . . . . . . . 2-21
Table 3-1: Power vs. All Time parameters . . . . . . . . . . . . . . . . . . . . . . . . . . . . . . . 3-2
Table 3-2: Average Power vs. Time setup parameters . . . . . . . . . . . . . . . . . . . . . 3-3
Table 3-3: Average Power vs. Time measurements . . . . . . . . . . . . . . . . . . . . . . . . 3-4
Table 3-4: Power vs. SC_No parameter . . . . . . . . . . . . . . . . . . . . . . . . . . . . . . . . . 3-5
Table 3-5: Setup parameters . . . . . . . . . . . . . . . . . . . . . . . . . . . . . . . . . . . . . . . . . . 3-8
Table 3-6: View menu setup parameters . . . . . . . . . . . . . . . . . . . . . . . . . . . . . . . 3-10
Table 3-7: Segment Constellation setup parameters . . . . . . . . . . . . . . . . . . . . . . 3-11
Table 3-8: Average EVM vs. Time setup parameters . . . . . . . . . . . . . . . . . . . . . 3-12
Table 3-9: Average EVM vs. Time measurements . . . . . . . . . . . . . . . . . . . . . . . . 3-12
Table 3-10: EVM vs. SC_No measurements . . . . . . . . . . . . . . . . . . . . . . . . . . . . . 3-14
Table 3-11: EVM allowable value for IEEE802.11a . . . . . . . . . . . . . . . . . . . . . . 3-14
Table 3-12: Average MagErr vs. Time setup parameters . . . . . . . . . . . . . . . . . . 3-16
Table 3-13: Average MagErr vs. Time measurements . . . . . . . . . . . . . . . . . . . . 3-17
Table 3-14: Average PhaseErr vs. Time setup parameters . . . . . . . . . . . . . . . . . 3-20
Table 3-15: Average PhaseErr vs. Time measurements . . . . . . . . . . . . . . . . . . . 3-21
Table 3-16: Center frequency error measurements . . . . . . . . . . . . . . . . . . . . . . . 3-24
Table 3-17: Symbol Table parameter . . . . . . . . . . . . . . . . . . . . . . . . . . . . . . . . . . 3-27
Table 3-18: Menu bar setup parameters for Symbol Table . . . . . . . . . . . . . . . . 3-27
WCA11G IEEE802.11a/b/g User Manual v
Page 10

List of Tables
vi WCA11G IEEE802.11a/b/g User Manual
Page 11

Preface
Manual Structure
This manual provides user information about the WCA11G IEEE802.11a/b/g
Signal Analysis Software.
The manual contains the following sections:
Getting Started describes the product overview, system configuration, and
installation procedures of the WCA11G IEEE802.11a/b/g Signal Analysis
Software.
Operating Basics describes the software screen elements and provides basic
operating information about the WCA11G software interface.
Reference provides in-depth descriptions of the WCA11G view formats for the
following two analyses:
Modulation Analysis such as Spectral Power, Constellation, EVM, Symbol
Table, and Center Frequency Error.
Power Analysis such as Spectrum Mask and Transmit Power On/Off.
Related Manual and Online Document
The following additional manuals are available for the WCA11G IEEE802.11a/b/g
Signal Analysis Software:
The WCA330 & WCA380 Wireless Communication Analyzer User Manual
(Tektronix part number 070-A792-XX) describes how to use the WCA330 and
WCA380.
The WCA330 & WCA380 Wireless Communication Analyzer Programmer Manual
(Tektronix part number 070-A794-XX) provides complete information on
programming and remote control of the instrument through the GPIB/Ethernet
interfaces.
The WCA11G Help system provides online user manual. The online user manual
is integrated with the user interface application. The online user manual is
preconfigured in the WCA11G software.
WCA11G IEEE802.11a/b/g User Manual vii
Page 12

Preface
Contacting Tektronix
Phone 1-800-833-9200*
Address Tektronix, Inc.
Web site www.tektronix.com
Sales support 1-800-833-9200, select option 1*
Service support 1-800-833-9200, select option 2*
Technical support E-mail: techsupport@tektronix.com
Department or name (if known)
14200 SW Karl Braun Drive
P.O. Box 500
Beaverton, OR 97077
USA
1-800-833-9200, select option 3*
6:00 a.m. - 5:00 p.m. Pacific time
*
This phone number is toll free in North America. After office hours, please leave a voice
mail message.
Outside North America, contact a Tektronix sales office or distributor; see the Tektronix web
site for a list of offices.
viii WCA11G IEEE802.11a/b/g User Manual
Page 13

Glossary of Acronyms
8PSK
8 Phase Shift Keying
16QAM
16 Quardrature Amplitude Modulation
64QAM
64 Quardrature Amplitude Modulation
AP
Access Point
BPSK
Binary Phase Shift Keying
CCK
Complementary Code Keying
Preface
DSSS
Direct Sequence Spread Spectrum
EVM
Error Vector Magnitude
IEEE
Institute of Electrical and Electronic Engineers
LAN
Local Area Network
MT
Mobile Terminal
OFDM
Orthogonal Frequency Division Multiplexing
PBCC
Packet Binary Convolutional Coding
PLCP
Physical Layer Convergence Protocol
QPSK
Quardrature Phase Shift Keying
WCA
Wireless Communication Analyzer
WCA11G IEEE802.11a/b/g User Manual ix
Page 14

Preface
x WCA11G IEEE802.11a/b/g User Manual
Page 15

Getting Started
This section provides the following information:
Product overview
Hardware configuration
Accessories
Installation
System settings
Product Overview
The WCA11G is an IEEE802.11a/b/g signal analysis software that performs a
signal analysis of 5 GHz band high-speed wireless LAN transmitters (IEEE802.11a
standard) and 2.4 GHz band high-speed wireless LAN transmitters (IEEE802.11b
and IEEE802.11g standards).
You can configure an analysis system for the IEEE802.11a/b/g LAN transmitters
by using the WCA11G software in combination with the WCA330/WCA380
Wireless Communication Analyzers. This system provides OFDM/DSSS
modulation signal spectrum power analysis, constellation display, modulation
accuracy measurement (EVM), a symbol table, center frequency deviation
measurement, and spectrum mask.
Table 1-1 shows all the measurement items available in the WCA11G
IEEE802.11a/b/g Signal Analysis Software and the supported standards.
Table 1-1: WCA11G measurement items
Items Page 802.11a 802.11b 802.11g
Modulation Analysis (OFDM)
Power vs. All Time 3-2 x
Average Power vs. Time 3-3 x x
Power Analysis Display 3-4 x
Power vs. SC_No 3-5 x
Flatness 3-7 x x
Constellation Analysis Display 3-7 x
Constellation/Symbol Constellation 3-8 x
Average EVM vs. Time 3-12 x x
EVM Analysis Display 3-13 x
EVM vs. SC_No 3-13 x
Average MagErr vs. Time 3-16 x x
WCA11G IEEE802.11a/b/g User Manual 1-1
Page 16
Getting Started
Table 1-1: WCA11G measurement items (cont.)
Items Page 802.11a 802.11b 802.11g
MagErr Analysis Display 3-17 x
MagErr vs. SC_No 3-18 x
Average PhaseErr vs. Time 3-20 x x
PhaseErr Analysis Display 3-21 x
PhaseErr vs. SC_No 3-22 x
Center Frequency Error 3-24 x x
OFDM Linearity 3-25 x x
Symbol Table 3-26 x x
Modulation Analysis (DSSS/CCK/PBCC)
Power vs. All Time 3-2 x x
Average Power vs. Time 3-3 x x
Power Analysis Display 3-4 x
Power vs. Time 3-6 x
Constellation Analysis Display 3-7 x
Constellation/Segment Constellation 3-11 x
Average EVM vs. Time 3-12 x x
EVM Analysis Display 3-13 x
EVM vs. Time 3-15 x
Average MagErr vs. Time 3-16 x x
MagErr Analysis Display 3-17 x
MagErr vs. Time 3-19 x
Average PhaseErr vs. Time 3-20 x x
PhaseErr Analysis Display 3-21 x
PhaseErr vs. Time 3-23 x
Center Frequency Error 3-24 x x
Symbol Table 3-26 x x
Power Analysis
Spectrum Mask (OFDM) 3-29 x x
Spectrum Mask (DSSS) 3-31 x x
Transmit Power On 3-32 x x
Transmit Power Off 3-33 x x
1-2 WCA11G IEEE802.11a/b/g User Manual
Page 17

Getting Started
IEEE802.11a
Measurements
Table 1-2 shows the measurement items that are required for the IEEE802.11a
standard.
Table 1-2: Measurements for IEEE802.11a signals
Item Description Page
Power vs. All Time Displays power in a line graph. The vertical axis
represents power [dBm], and the horizontal axis
represents time [ms]. This graph is displayed only in Main
View. The analysis of the area between D_Marker 1 and
D_Marker 2 is interlocked with other Views [View 1, View
2, or View 3]. The Main View always displays Power vs. All
Time.
Average Power vs. Time Displays power of one or all subcarriers in a line graph.
The vertical axis represents power [dBm], and the
horizontal axis represents time [ms].
Power vs. SC_No Displays each subcarrier wave power as a symbol in a bar
graph. The vertical axis represents power [dBm], and the
horizontal axis represents subcarrier wave number [-26 to
+26]
.
Flatness Displays each subcarrier wave flatness in a bar graph.
The vertical axis represents average energy deviation
power [dB], and the horizontal axis represents subcarrier
wave number [-26 to +26]
Constellation Displays constellation of one or all subcarriers in a
rectangular coordinates graph. The vertical axis
represents Q, and the horizontal axis represents I.
Symbol Constellation Displays constellation as a symbol in a rectangular
coordinates graph. The vertical axis represents Q, and the
horizontal axis represents I.
Average EVM vs. Time Displays EVM of one or all subcarriers in a line graph. The
vertical axis represents EVM [%], and the horizontal axis
represents time [ms].
EVM vs. SC_No Displays EVM as a symbol in a bar graph. The vertical axis
represents EVM [%], and the horizontal axis represents
subcarrier wave number [-26 to +26]
Average MagErr vs. Time Displays magnitude error of one or all subcarriers in a line
graph. The vertical axis represents magnitude error [%],
and the horizontal axis represents time [ms].
MagErr vs. SC_No Displays magnitude error as a symbol in a bar graph. The
vertical axis represents magnitude error [%], and the
horizontal axis represents subcarrier number [-26 to +26]
Average PhaseErr vs. Time Displays phase error of one or all subcarriers in a line
graph. The vertical axis represents phase error [Degree],
and the horizontal axis represents time [ms].
PhaseErr vs. SC_No Displays phase error as a symbol in a bar graph. The
vertical axis represents phase error [Degree], and the
horizontal axis represents subcarrier number [-26 to +26].
Center Frequency Error Displays carrier wave frequency deviation as a symbol in
a line graph. The vertical axis represents deviation [kHz],
and the horizontal axis represents time [ms].
.
.
3-2
3-3
3-5
3-7
3-8
3-12
3-13
3-16
3-18
.
3-20
3-22
3-24
WCA11G IEEE802.11a/b/g User Manual 1-3
Page 18

Getting Started
Table 1-2: Measurements for IEEE802.11a signals (cont.)
Item Description Page
OFDM Linearity Displays linearity of OFDM modulation in a line graph. The
vertical axis represents actual measurement values [mW],
and the horizontal axis represents ideal values [mW].
Symbol Table Displays a table of symbol values (hexadecimal and
binary).
Spectrum Mask Displays spectrum waveform and mask in a line graph
under PeakHold condition. The vertical axis represents
power [dBm], and the horizontal axis represents frequency
[Hz].
3-25
3-26
3-29
IEEE802.11b
Measurements
Table 1-3 shows the measurement items that are required for IEEE802.11b
standard.
Table 1-3: Measurements for IEEE802.11b signals
Item Description Page
Power vs. All Time Refer to Table 1-2 on page 1-3. 3-2
Average Power vs. Time Displays power of carriers in a line graph. The vertical axis
represents power [dBm], and the horizontal axis
represents time [ms].
Power vs. Time Displays power of carriers by segment in a bar graph. The
vertical axis represents power [dBm], and the horizontal
axis represents time [ms].
Constellation Displays constellation of carriers in a rectangular
coordinates graph. The vertical axis represents Q, and the
horizontal axis represents I.
Segment Constellation Displays constellation of carriers by segment in a
rectangular coordinates graph. The vertical axis
represents Q, and the horizontal axis represents I.
Average EVM vs. Time Displays EVM of carriers in a line graph. The vertical axis
represents EVM [%], and the horizontal axis represents
time [ms].
EVM vs. Time Displays EVM of carriers by segment in a bar graph. The
vertical axis represents EVM [%], and the horizontal axis
represents time [ms].
Average MagErr vs. Time Displays magnitude error of carriers in a line graph. The
vertical axis represents magnitude error [%], and the
horizontal axis represents time [ms].
MagErr vs. Time Displays magnitude error of carriers by segment in a bar
graph. The vertical axis represents magnitude error [%],
and the horizontal axis represents time [ms].
Average PhaseErr vs. Time Displays phase error of carriers in a line graph. The
vertical axis represents phase error [Degree], and the
horizontal axis represents time [ms].
PhaseErr vs. Time Displays phase error of carriers by segment in a bar graph.
The vertical axis represents phase error [Degree], and the
horizontal axis represents time [ms].
3-3
3-6
3-11
3-12
3-15
3-16
3-19
3-20
3-23
1-4 WCA11G IEEE802.11a/b/g User Manual
Page 19
Getting Started
Table 1-3: Measurements for IEEE802.11b signals (cont.)
Item Description Page
Center Frequency Error Displays carrier wave frequency deviation in a line graph.
The vertical axis represents deviation [kHz], and the
horizontal axis represents time [ms].
Symbol Table Displays a table of symbol values (hexadecimal and
binary).
Spectrum Mask Displays spectrum waveform and mask in a line graph
under PeakHold condition. The vertical axis represents
power [dBm], and the horizontal axis represents frequency
[Hz].
Transmit Power On Displays the transmit power on ramp in a line graph. The
vertical axis represents power [W], and the horizontal axis
represents time [s].
Transmit Power Off Displays the transmit power down ramp in a line graph.
The vertical axis represents power [W], and the horizontal
axis represents time [s].
3-24
3-26
3-31
3-32
3-33
IEEE802.11g
Measurements
Table 1-4 shows the measurement items that are required for IEEE802.11g
standard.
Table 1-4: Measurements for IEEE802.11g signals
Item Description Page
Power vs. All Time Refer to Table 1-2 on page 1-3. 3-2
Average Power vs. Time Displays power of carriers, or one or all subcarriers in a
line graph. The vertical axis represents power [dBm], and
the horizontal axis represents time [ms].
Power Analysis Display Displays each subcarrier wave power as an OFDM
symbol, or power by segment in a bar graph. The vertical
axis represents power [dBm], and the horizontal axis
represents subcarrier wave number [-26 to +26] or time
[ms]
.
Flatness Displays each subcarrier wave flatness in a bar graph.
The vertical axis represents average energy deviation
power [dB], and the horizontal axis represents subcarrier
wave number [-26 to +26]
Constellation Analysis
Display
Constellation Displays constellation in a rectangular coordinates graph.
Average EVM vs. Time Displays EVM of carriers, or one or all subcarriers in a line
Displays constellation of each subcarrier as an OFDM
symbol, or constellation by segment in a rectangular
coordinates graph. The vertical axis represents Q, and the
horizontal axis represents I.
The vertical axis represents Q, and the horizontal axis
represents I.
graph. The vertical axis represents EVM [%], and the
horizontal axis represents time [ms].
.
3-3
3-4
3-7
3-7
3-8,
3-11
3-12
WCA11G IEEE802.11a/b/g User Manual 1-5
Page 20

Getting Started
Table 1-4: Measurements for IEEE802.11g signals (cont.)
Item Description Page
EVM Analysis Display Displays EVM as an OFDM symbol, or EVM by segment
in a bar graph. The vertical axis represents EVM [%], and
the horizontal axis represents subcarrier wave number
[-26 to +26] or time [ms]
Average MagErr vs. Time Displays magnitude error of carriers, or one or all
subcarriers in a line graph. The vertical axis represents
magnitude error [%], and the horizontal axis represents
time [ms].
MagErr Analysis Display Displays magnitude error as an OFDM symbol, or
magnitude error by segment in a bar graph. The vertical
axis represents magnitude error [%], and the horizontal
axis represents subcarrier number [-26 to +26] or time
[ms]
.
Average PhaseErr vs. Time Displays phase error of carriers, or one or all subcarriers
in a line graph. The vertical axis represents phase error
[Degree], and the horizontal axis represents time [ms].
PhaseErr Analysis Display Displays phase error as an OFDM symbol, or phase error
by segment in a bar graph. The vertical axis represents
phase error [Degree], and the horizontal axis represents
subcarrier number [-26 to +26] or time [ms]
Center Frequency Error Displays carrier wave frequency deviation as an OFDM
symbol in a line graph. The vertical axis represents
deviation [kHz], and the horizontal axis represents time
[ms].
Symbol Table Displays a table of symbol values (hexadecimal and
binary).
OFDM Linearity Displays linearity of OFDM modulation in a line graph. The
vertical axis represents actual measurement values [mW],
and the horizontal axis represents ideal values [mW].
Spectrum Mask Displays spectrum waveform and mask in a line graph
under PeakHold condition. The vertical axis represents
power [dBm], and the horizontal axis represents frequency
[Hz].
Transmit Power On Displays the transmit power on ramp in a line graph. The
vertical axis represents power [W], and the horizontal axis
represents time [s].
Transmit Power Off Displays the transmit power down ramp in a line graph.
The vertical axis represents power [W], and the horizontal
axis represents time [s].
.
.
3-13
3-16
3-17
3-20
3-21
3-24
3-26
3-25
3-29,
3-31
3-32
3-33
1-6 WCA11G IEEE802.11a/b/g User Manual
Page 21
Hardware Configuration
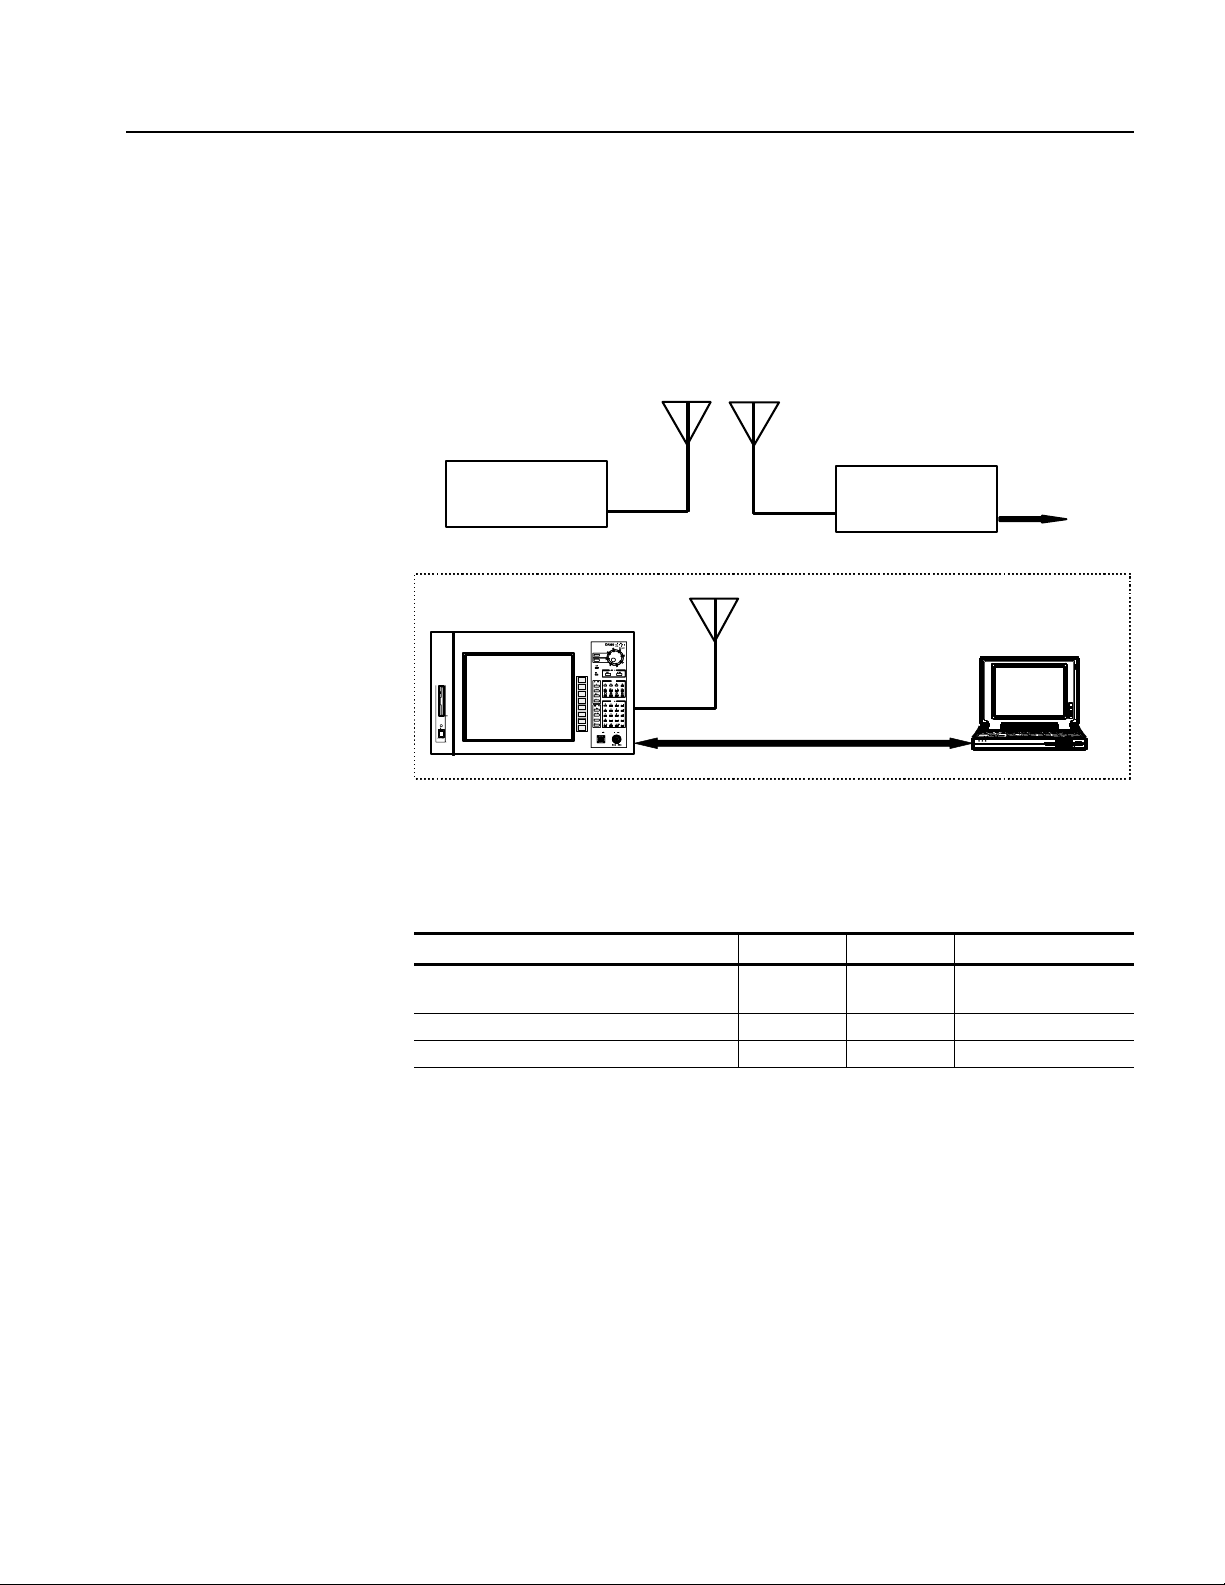
Figure 1-1 shows the hardware configuration of an IEEE802.11a/b/g signal
analysis system with the combination of the WCA11G software and the
WCA330/WCA380 Wireless Communication Analyzer. Table 1-5 lists the
equipment used in the system
High-speed wireless LAN
Getting Started
.
Mobile terminal
WCA330/WCA380
Access point
LAN cross cable
Electric circuit
PC
Figure 1-1: WCA11G signal analysis system hardware configuration
Table 1-5: Equipment used in the WCA11G signal analysis system
Items Type Quantity Note
Wireless Communication Analyzer WCA330/
WCA380
LAN cross cable 1
2.4 GHz and 5.2 GHz Bandwidth Antenna 1 Prepare separately
1
Difference between
WCA330 and WCA380
The WCA330 and WCA380 Wireless Communication Analyzers have the same
functions except for their measurement frequency ranges:
Analyzers
WCA330: DC to 3 GHz
WCA380: DC to 8 GHz
The descriptions in this manual apply to both the WCA330 and the WCA380
analyzers, unless otherwise noted. The word "analyzer" refers to both products.
WCA11G IEEE802.11a/b/g User Manual 1-7
Page 22

Getting Started
Accessories
Installation
The following accessories are shipped with the WCA11G IEEE802.11a/b/g Signal
Analysis Software:
User manual, Tektronix part number 071-1365-XX
LAN cross cable (3 m), 012-A228-00
This subsection contains instructions for installing the WCA11G software on your
PC and provides information about the created folders.
PC System Requirements
Installation Instructions
Your PC requires the following minimum system requirements to install and
operate the WCA11G software:
OS: Microsoft Windows 98SE / Windows 2000 / Windows XP
CPU: Pentium III Processor, at least 866 MHz
RAM: At least 512 MB
HDD: At least 100 MB available memory
Display resolution: At least 1280 x 1024
Network card: Ethernet card of 10BASE-T or 100BASE-T
The following installation instructions require that you are familiar with the basics
of using the MS Windows operating system. If necessary, read your MS Windows
user documentation before installing the WCA11G software.
Perform the following procedure to install the WCA11G software:
1. Be sure that your PC meets the requirements listed under PC System
Requirements on page 1-8 before proceeding with the installation.
2. Insert the WCA11G IEEE802.11a/b/g Signal Analysis Software CD-ROM
into a CD-ROM drive on your PC.
3. Double-click the My computer icon.
4. Double-click the D: drive icon (substitute your CD-ROM drive letter if it is
different from D). The PC will display the contents of the WCA11G Signal
Analysis Software CD-ROM.
5. Open the DISK1 folder.
1-8 WCA11G IEEE802.11a/b/g User Manual
Page 23

Getting Started
6. Double-click Setup.exe in the folder.
This copies initial files of the WCA11G software. For a while, the Welcome
window appears on the PC desktop. Follow the on-screen instructions.
7. If the installation completes successfully, the Setup Complete window appears.
Click the Finish button.
Created Folders
When the installation completes properly, the following folders are created:
C:\Program Files\Tektronix\WCA11g. This folder contains the WCA11g.exe
program and other related files. The related files include the parameters required
for communication and analysis. Do not delete or change the files.
C:\Program Files\Tektronix\WCA11g\CWX. This folder contains the graphic display
formats. Do not delete or change the files.
C:\Program Files\Tektronix\WCA11g\ShareFolder\CFG. This folder contains the
WCA330/WCA380 configuration files and trigger files. The analyzer refers to
these setting files. Since the remote controlled analyzer directly accesses these
files, the CFG folder must be shared.
C:\Program Files\Tektronix\WCA11g\ShareFolder\Data. This folder contains the
measurement result files of the WCA11G software.
C:\Program Files\Tektronix\WCA11g\SystemDefault. This folder is used to recall the
factory default settings of the WCA330/WCA380 instruments.
The path names listed above are the examples when you install the WCA11G
software into the C drive.
WCA11G IEEE802.11a/b/g User Manual 1-9
Page 24

Getting Started
System Settings
This subsection describes the initial settings of your analyzer and your PC. It is
divided into the following three steps:
Share the folders on your PC, page 1-10
Configure the network settings of the analyzer, page 1-12
Configure the network settings of your PC
MS Windows 98, page 1-17
MS Windows 2000 or MS Windows XP, page 1-19
NOTE. The following procedure requires that you are familiar with the basics of
using the MS Windows 98/MS Windows 2000/MS Windows XP operating systems.
If necessary, consult the MS Windows documentation.
Sharing the Folders on a
PC
Since the analyzer accesses the setting file in the PC through a network, you must
share the setting files of the PC. Otherwise, an access error will appear on the
analyzer display upon execution. Allow full access to ShareFolder. See Figure 1-2
and Figure 1-3.
1-10 WCA11G IEEE802.11a/b/g User Manual
Page 25
Getting Started
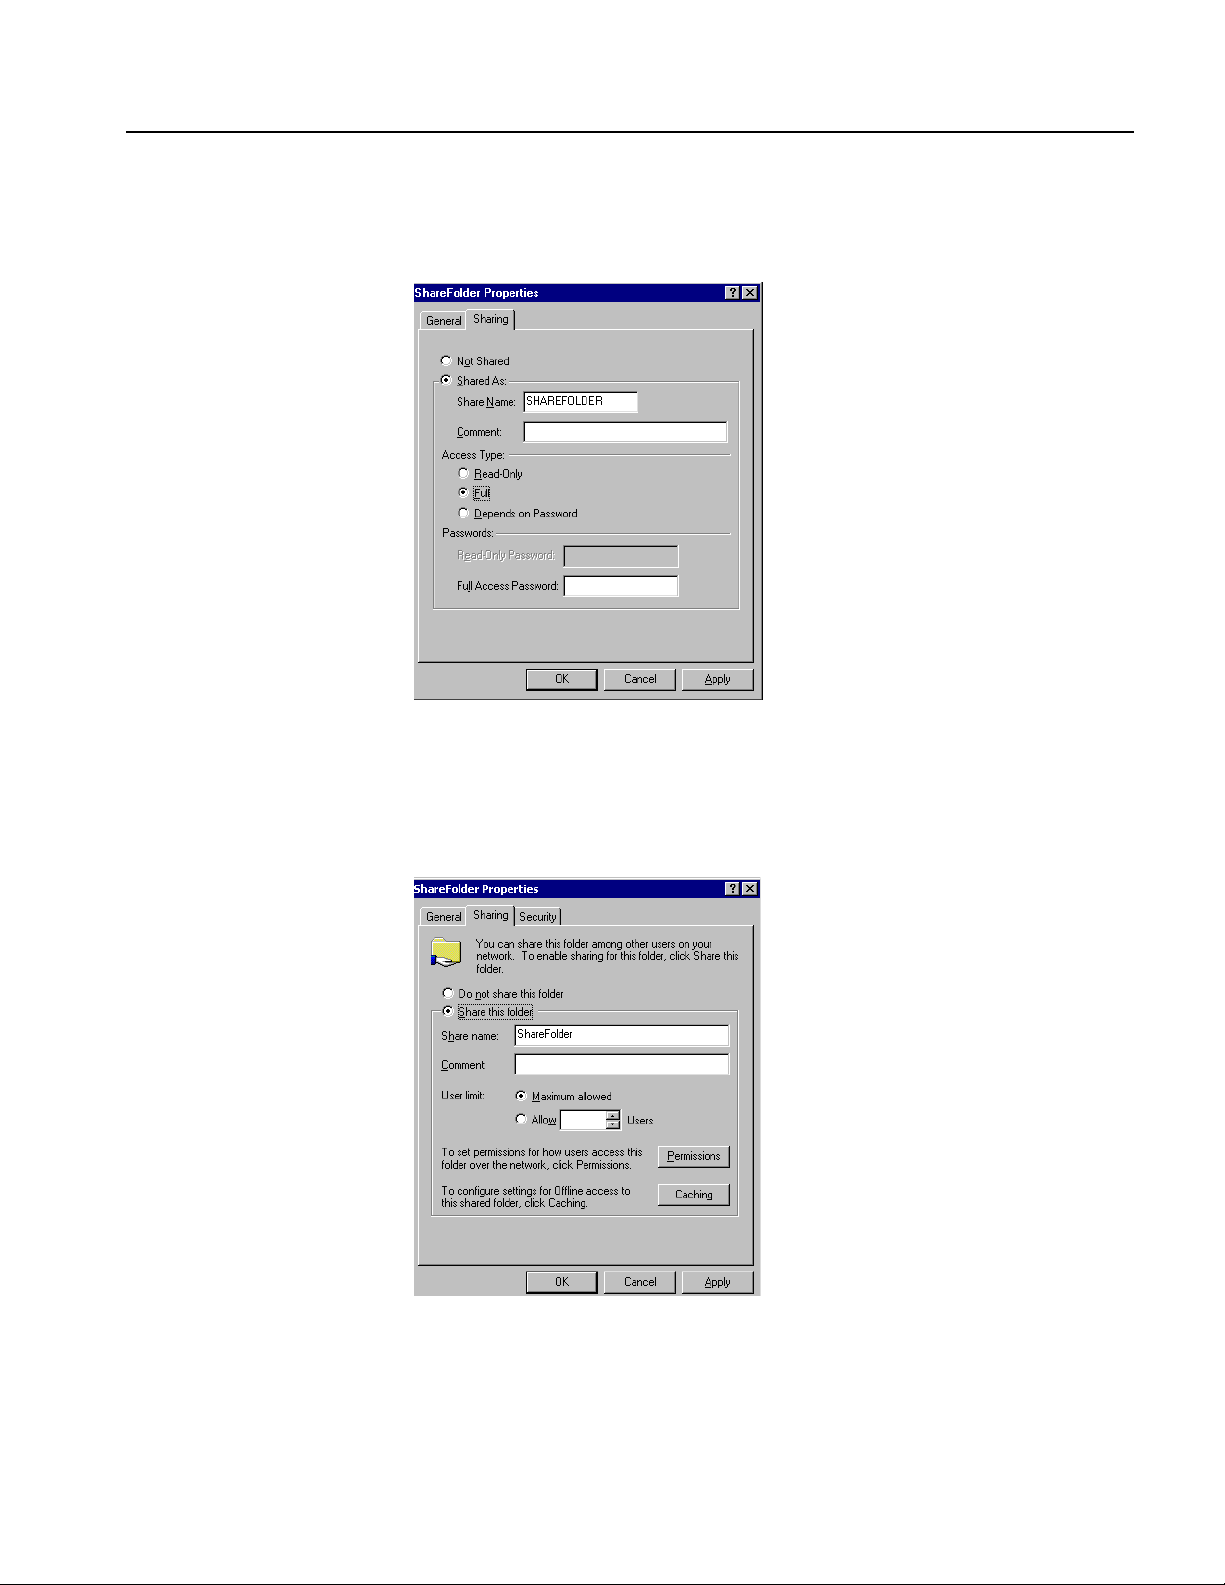
For a PC running MS Windows 98. In the ShareFolder Properties dialog box, click
Shared As and Full. See Figure 1-2.
Figure 1-2: ShareFolder Properties dialog box (MS Windows 98)
For a PC running MS Windows 2000 or MS Windows XP. In the SharedFolder
Properties dialog box, click Share this folder and Maximum allowed.
See Figure 1-3.
Figure 1-3: ShareFolder Properties dialog box (MS Windows 2000)
WCA11G IEEE802.11a/b/g User Manual 1-11
Page 26
Getting Started
Setting the Network
Parameters of the Analyzer
Perform the following procedure to set the network parameters of your analyzer:
1. Confirm that your analyzer is not powered on.
2. Connect the keyboard and mouse provided with the analyzer to the keyboard
and mouse connectors on the rear panel of the analyzer.
3. Use a LAN cable to connect the analyzer and a hub.
4. Power on the analyzer.
5. Move the pointer to the bottom of the screen. The Windows 98 taskbar appears.
6. Select Settings > Control Panel from the Start menu. The Control Panel
window appears.
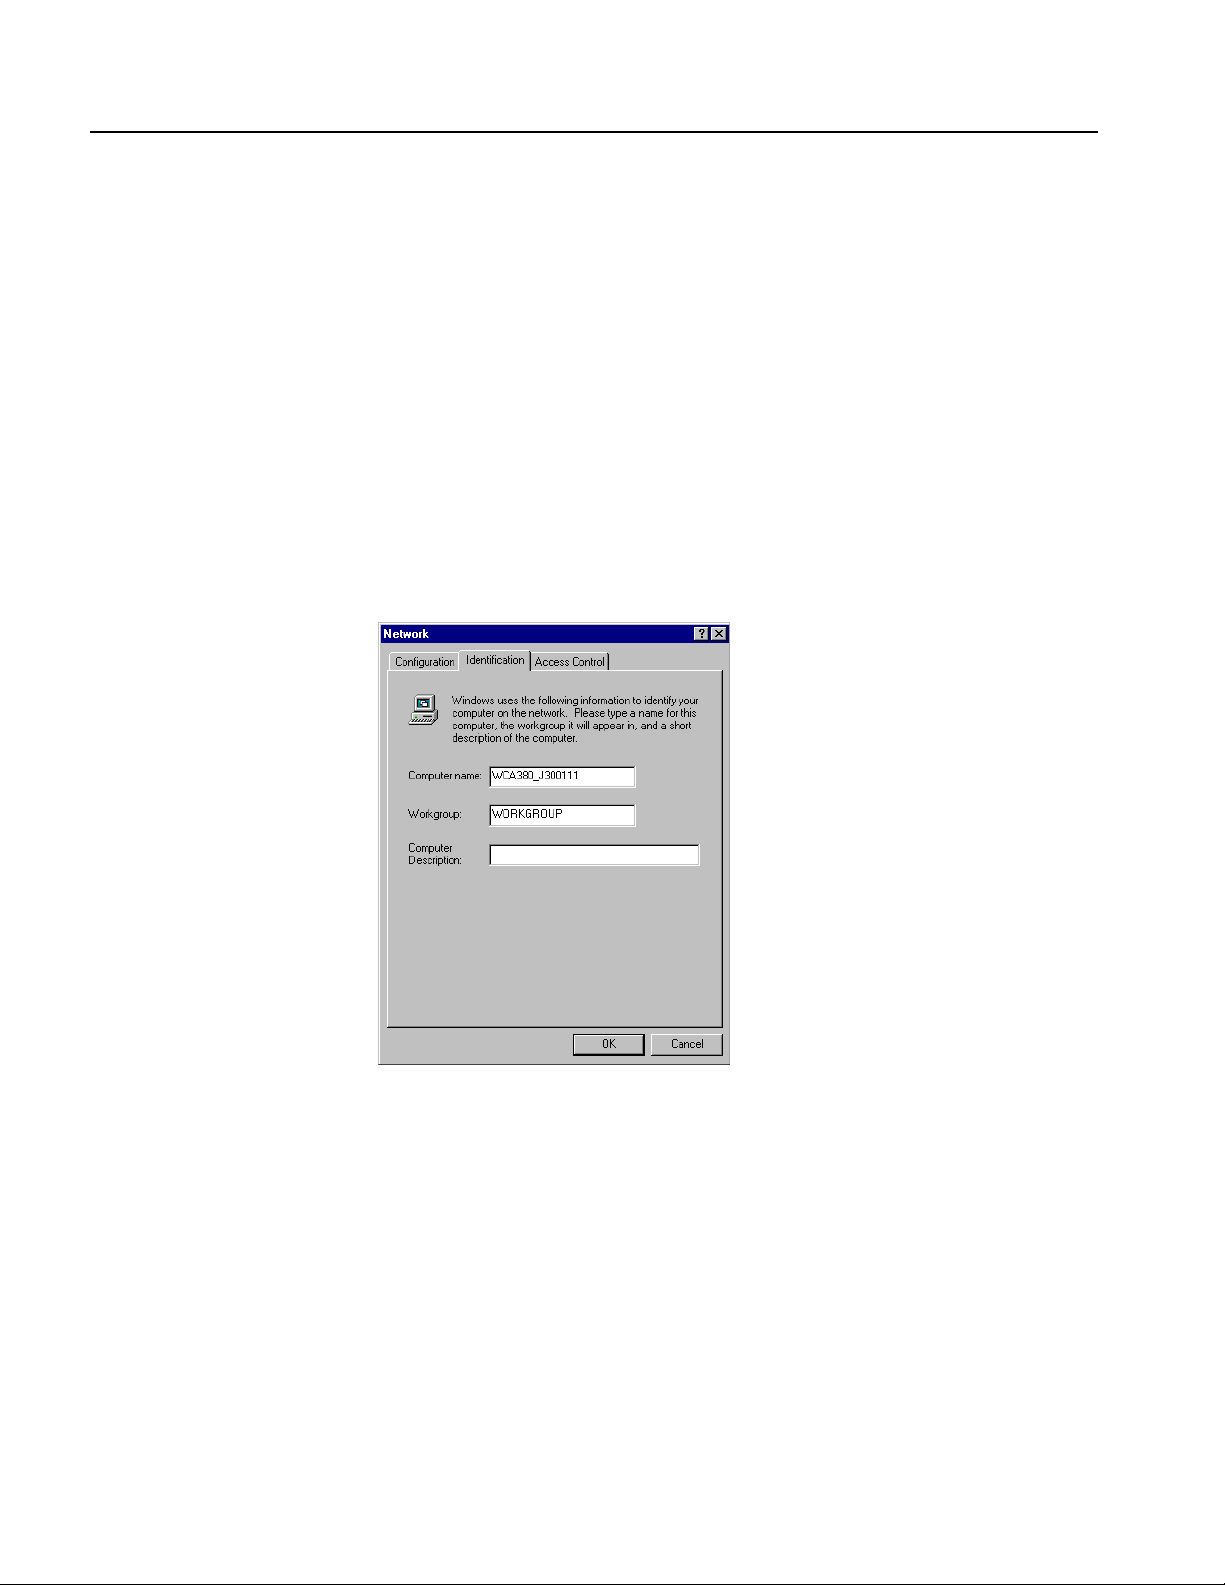
7. Double-click the Network icon in the window. The Network dialog box
appears as shown in Figure 1-4.
Figure 1-4: Network dialog box (Identification tab)
8. Click the Identification tab.
9. Check that WCA380_J300XXX or WCA330_J300XXX (XXX is the specific
serial number of the analyzer) is displayed in the Computer name text box. This
is the default computer name for the analyzer.
10. Check that WORKGROUP is displayed in the Workgroup text box.
1-12 WCA11G IEEE802.11a/b/g User Manual
Page 27
Getting Started
To Automatically Acquire an IP Address. Do the following steps to connect the
analyzer to a LAN. An IP address must be assigned by the name server. You need
to use the same settings parameters between the analyzer and your PC.
1. Click the Configuration tab in the Network window.
2. In the network component field, click Internet Protocol (TCP/IP).
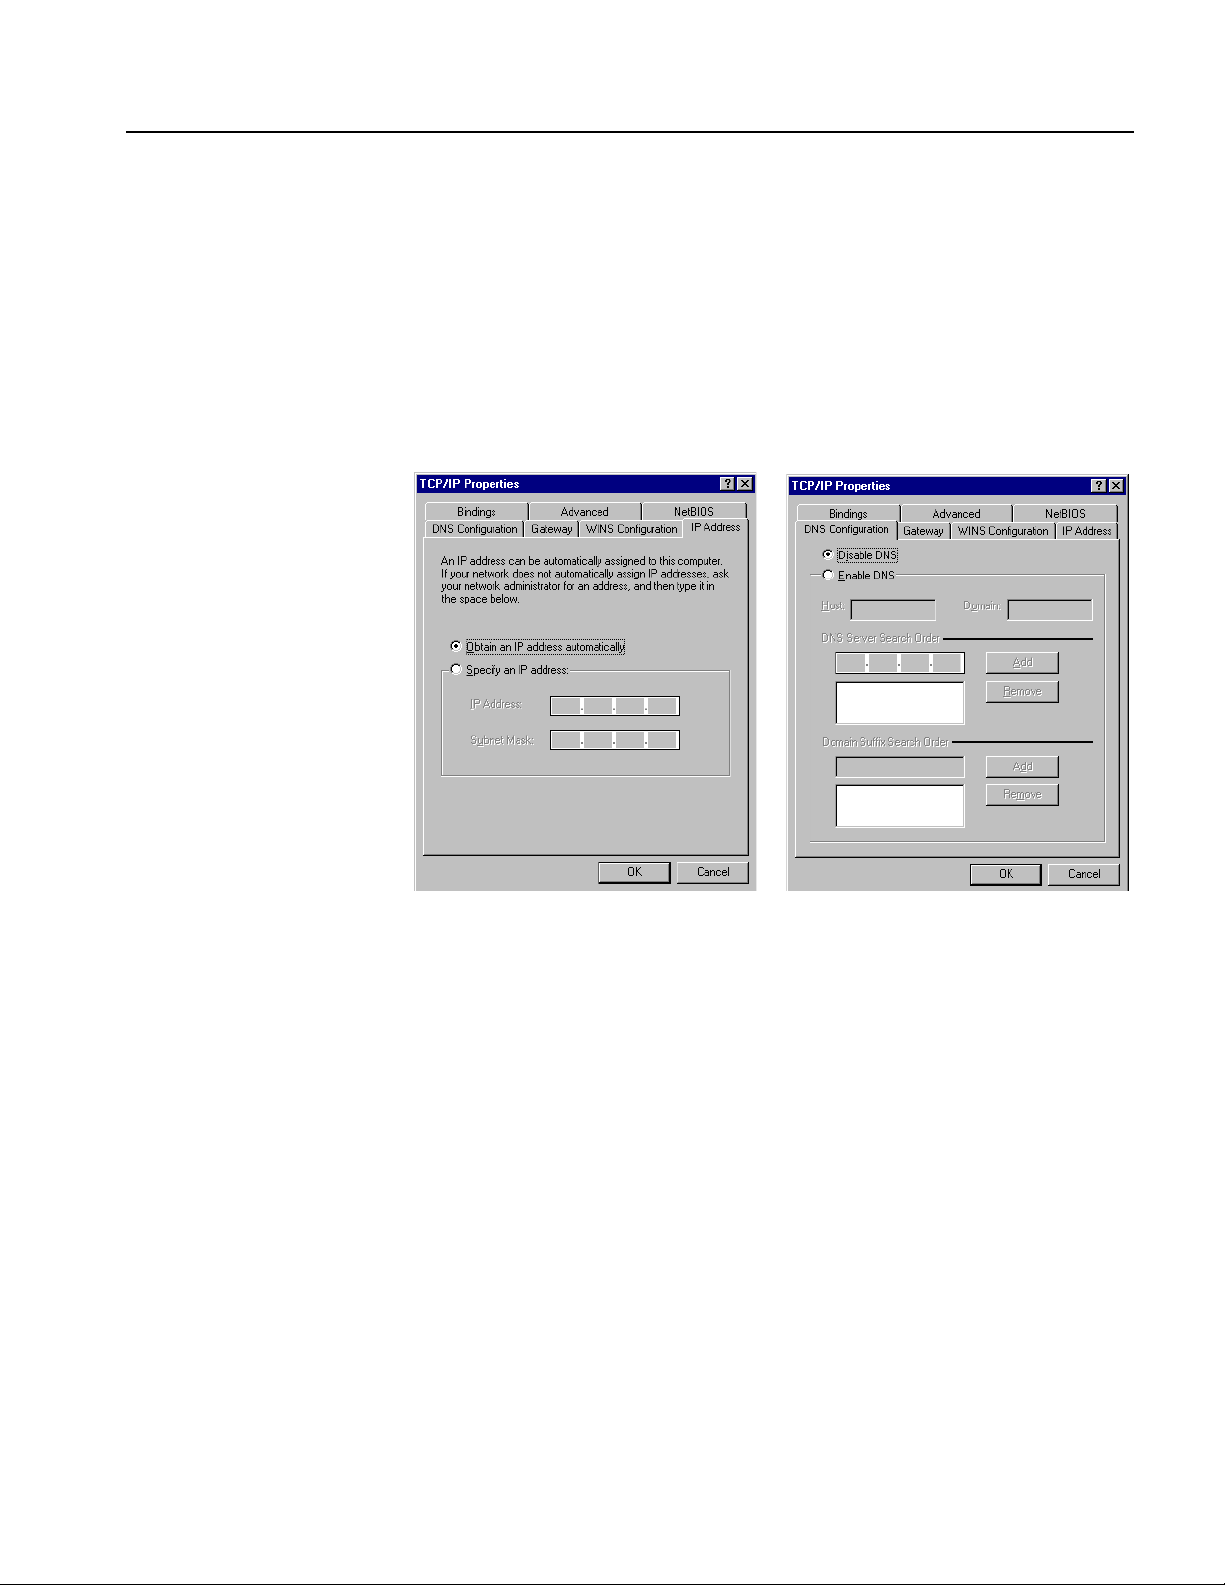
3. Click the Properties button. The TCP/IP Properties dialog box appears as
shown in Figure 1-5.
Figure 1-5: TCP/IP Properties dialog box
4. Click the IP Address tab, and then select Obtain an IP address
automatically.
5. Click the DNS Configuration tab, and then select Disable DNS.
6. Click the OK button.
WCA11G IEEE802.11a/b/g User Manual 1-13
Page 28
Getting Started
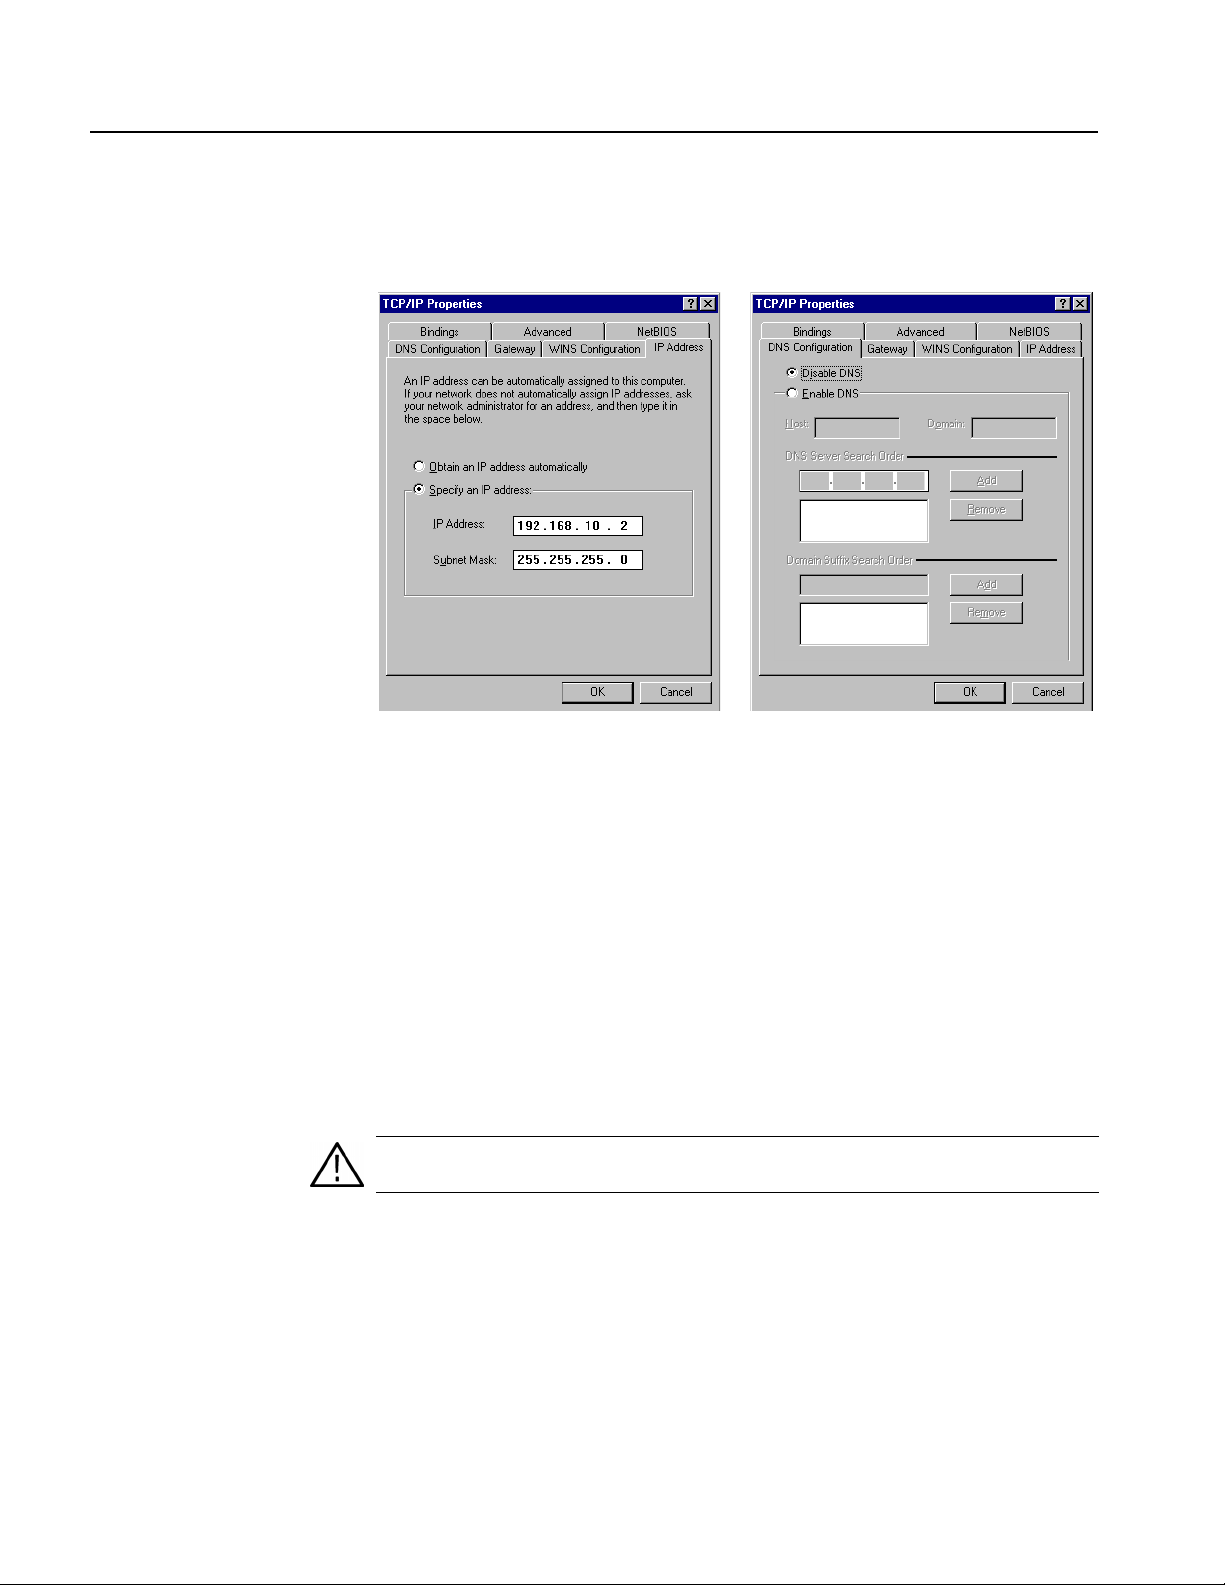
To Assign IP Address. When the name server is not in the network, perform the
following procedure to set the network parameters:
Figure 1-6: TCP/IP Properties dialog box for address setting
1. If you connect the analyzer directly to a single PC:
a. In the TCP/IP Properties dialog box, select Specify an IP address.
b. Set the IP Address parameter to the same IP address as the PC's address
except for the last number. The last number must be different from the last
number in the PC's IP address.
c. Set the Subnet Mask parameter to the same subnet mask used by the PC.
Do not enter a number if the PC does not have a net mask.
2. If you connect the analyzer to your network:
a. In the TCP/IP Properties dialog box, select Specify an IP address.
b. Ask your local network administrator and enter the appropriate addresses.
CAUTION. To prevent communication conflicts on your network, ask your local
network administrator for the correct numbers to enter in the dialog box.
3. In the TCP/IP Properties dialog box, click the DNS Configuration tab and
then select Disable DNS.
4. Click the OK button.
1-14 WCA11G IEEE802.11a/b/g User Manual
Page 29
Getting Started
I/O Port and Line Code Settings of the Analyzer. Set the command input/output port
for TCP/IP and new line code for reply message returned via the TCP/IP network.
Do the following steps to set the TCP/IP parameters of the analyzer:
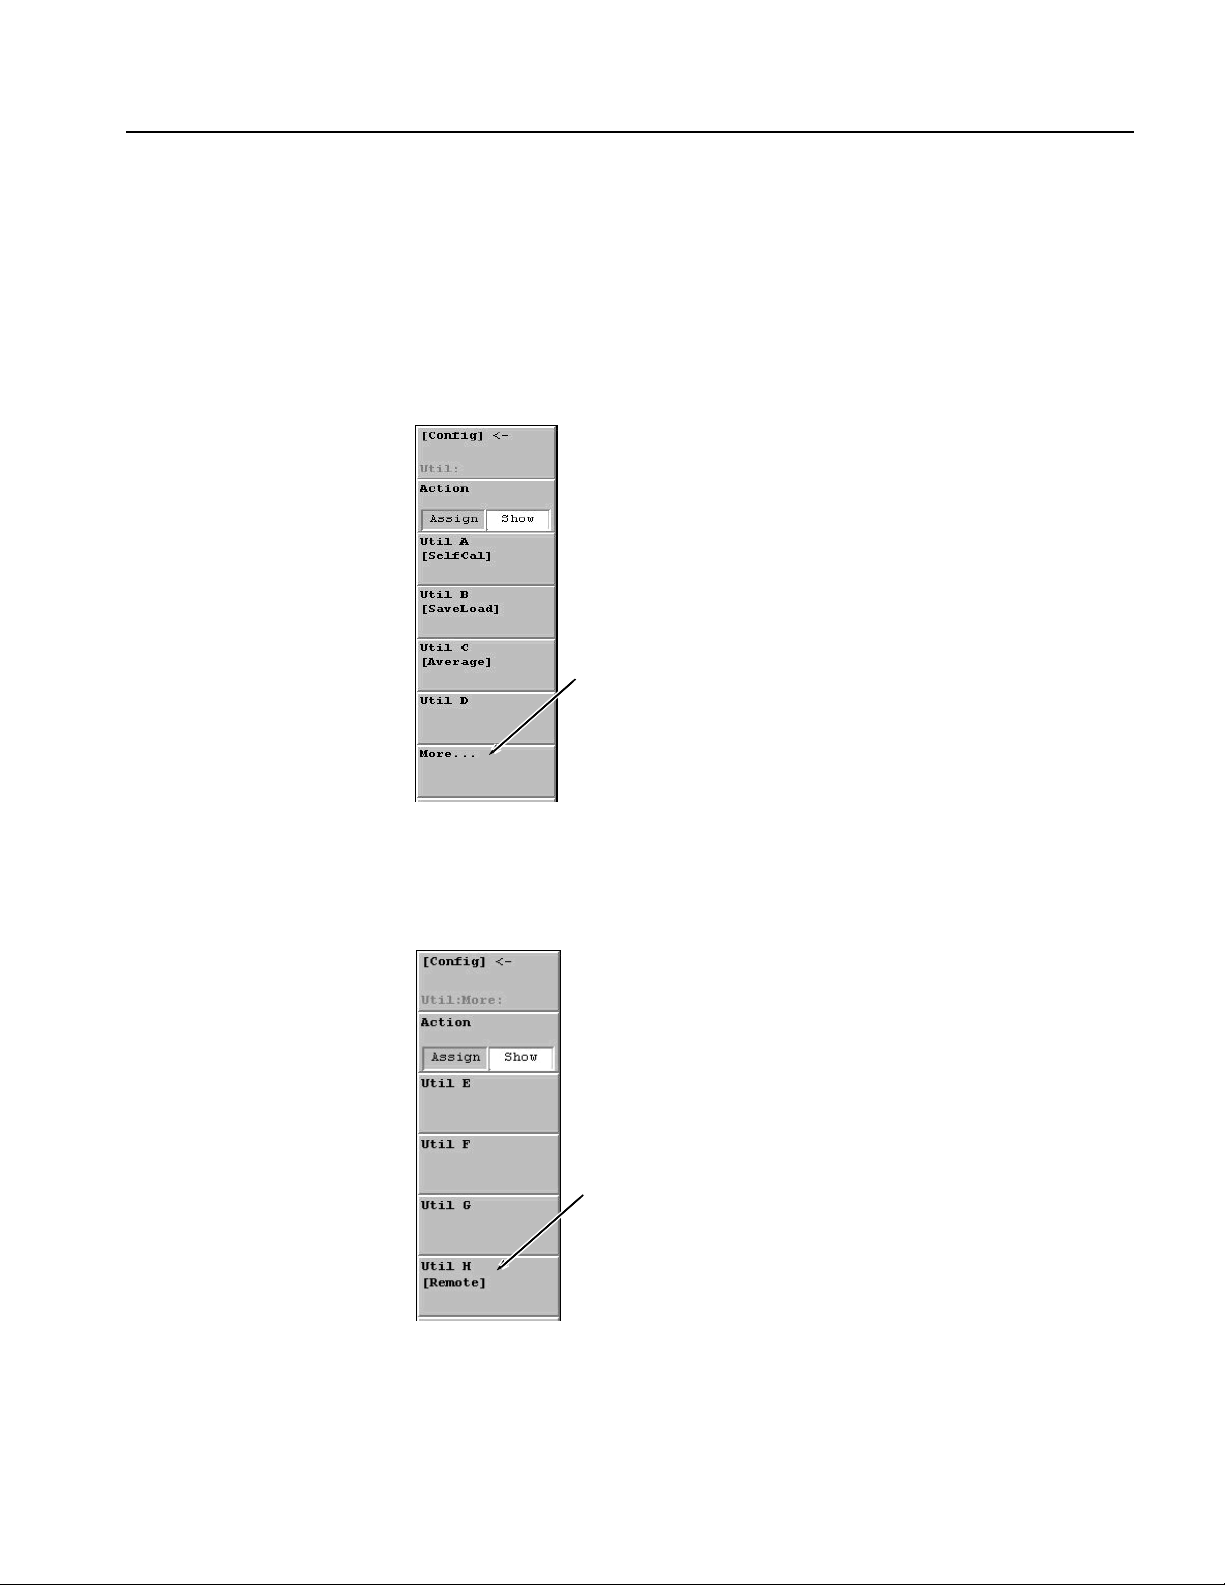
1. Push the WCA330/WCA380 front panel CONFIG: UTILITY button to
display the Utility submenu as shown in Figure 1-7.
2. Click More....
Click
Figure 1-7: CONFIG:UTILITY submenu
3. The Util:More submenu appears as shown in Figure 1-8.
Click Util H [Remote].
Click
Figure 1-8: Util:More: submenu
WCA11G IEEE802.11a/b/g User Manual 1-15
Page 30
Getting Started
4. Another submenu appears as shown in Figure 1-9. Click TCP/IP....
Click
Figure 1-9: [Util H] Remote submenu
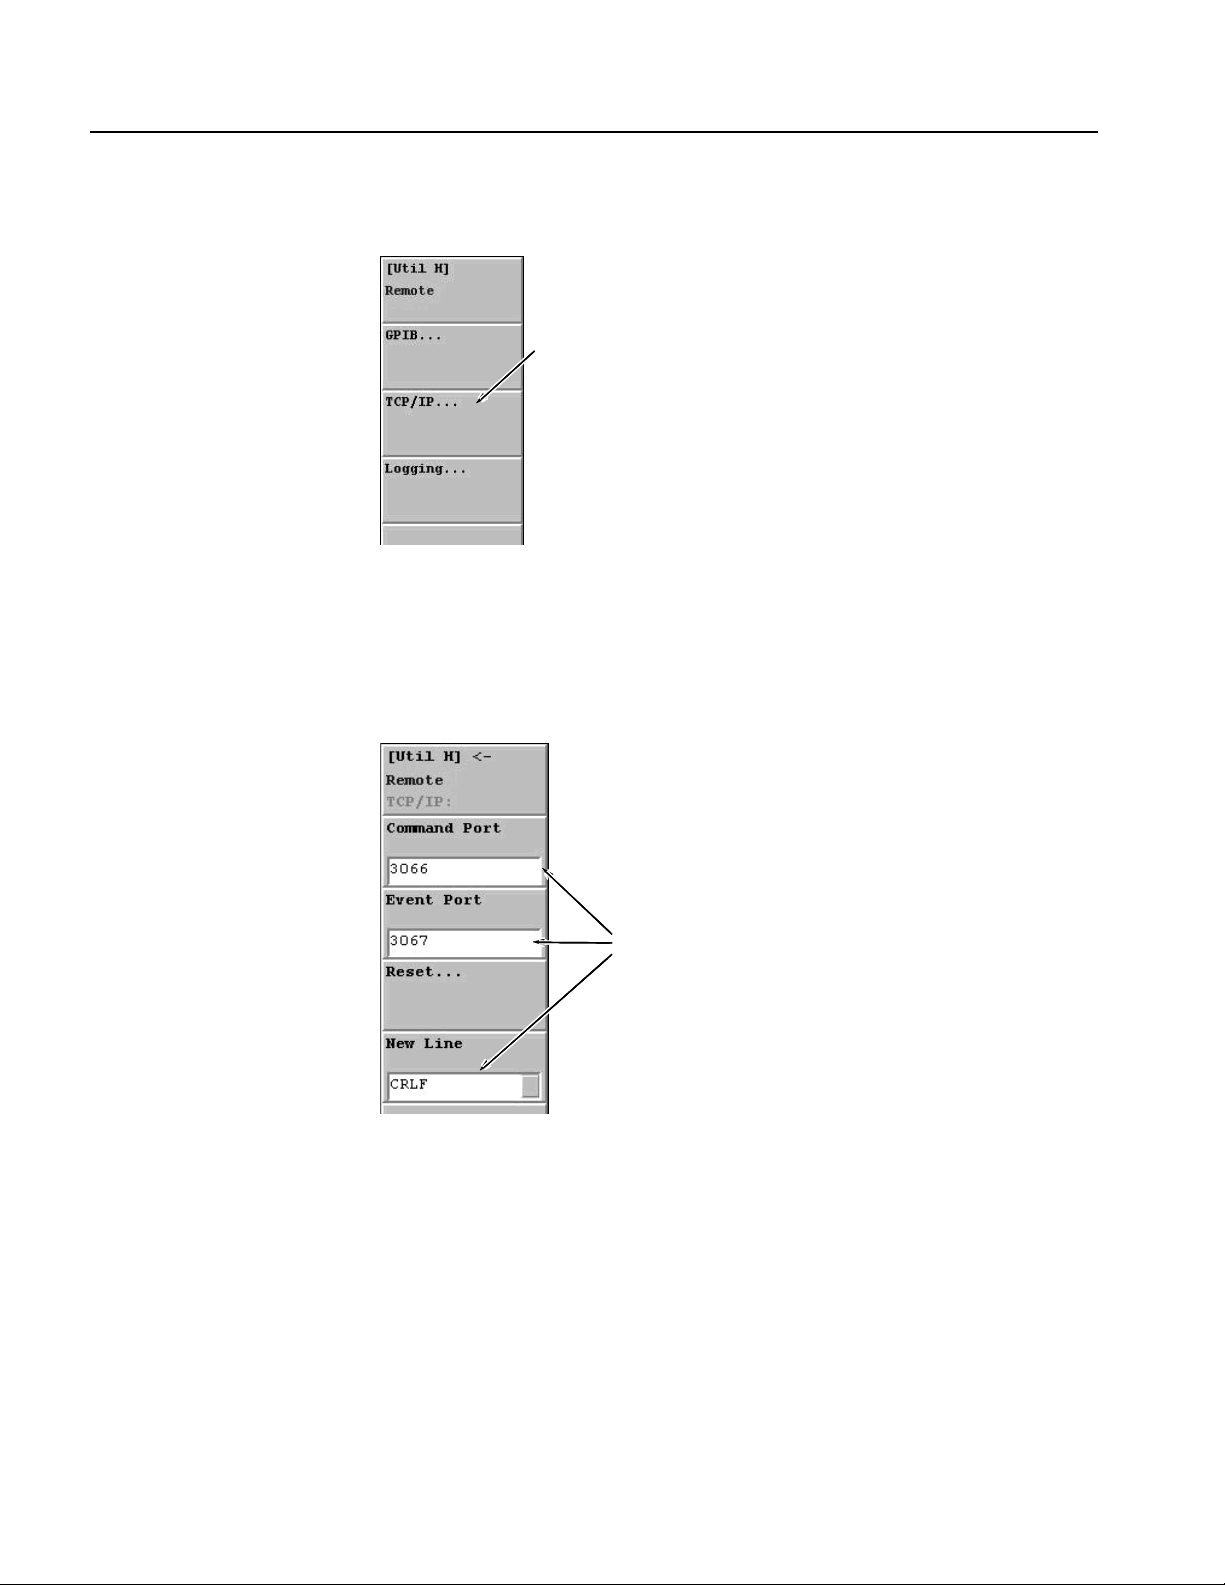
5. The Remote TCP/IP submenu appears as shown in Figure 1-10. Click the
Command Port to set the number to 3066, then click the Event Port to set the
number to 3067, and then click the New Line to set a new line code to CRLF.
Set parameters
as shown.
Figure 1-10: [Util H] Remote TCP/IP submenu
6. Use a LAN cable to connect the analyzer and a hub.
7. When the dialog box displays: "Do you want to reboot?", click Ye s.
8. Push the STANDBY switch to reboot the analyzer.
1-16 WCA11G IEEE802.11a/b/g User Manual
Page 31

Getting Started
Network Setting of
Windows 98 PC
Perform the following procedures to set the network parameters of your PC. If your
PC is running MS Windows 2000 or MS Windows XP, refer to page 1-19.
Do the following steps to set the network parameters of your PC running MS
Windows 98:
1. Confirm that your PC is connected to a network.
2. Select Settings > Control Panel from the Start menu. The Control Panel
window appears.
3. Double-click the Network icon in the window. The Network dialog box
appears as shown in Figure 1-11.
Figure 1-11: Network dialog box showing Identification tab
4. Click the Identification tab.
5. Enter your PC name (for example, PC123) in the Computer name text box.
6. Enter WORKGROUP in the Workgroup text box.
7. Click the OK button.
WCA11G IEEE802.11a/b/g User Manual 1-17
Page 32

Getting Started
To Obtain an IP Address Automatically. Do the following steps to connect your PC
to the LAN. An IP address must be assigned by the name server. You need to use
the same settings parameters between the analyzer and your PC.
1. Click the Configuration tab in the Network dialog box.
2. In the network component field, click Internet Protocol (TCP/IP).
3. Click the Properties button. The TCP/IP Properties dialog box appears.
4. Click the IP Address tab, and then select Obtain an IP address
automatically.
5. Click the DNS Configuration tab, and then select Disable DNS.
6. Click the OK button.
To Assign an IP Address. When the name server is not in the network, do the
following steps to set the network parameters:
1. If you connect the PC directly to the analyzer:
a. In the TCP/IP Properties dialog box, select Specify an IP address.
b. Set the IP Address parameter to the same IP address as the analyzer's
address except for the last number. The last number must be different from
the last number in the analyzer's IP address.
c. Set the Subnet Mask parameter to the same subnet mask used by the
analyzer. Do not enter a number if the analyzer does not have a net mask.
2. If you connect your PC to a network:
a. In the TCP/IP Properties dialog box, select Specify an IP address.
b. Ask your local network administrator and enter the appropriate addresses.
CAUTION. To prevent communication conflicts on your network, ask your local
network administrator for the correct numbers to enter in the dialog box.
3. In the TCP/IP Properties dialog box, click the DNS Configuration tab and
then select Disable DNS.
4. Click the OK button.
1-18 WCA11G IEEE802.11a/b/g User Manual
Page 33

Getting Started
Network Setting of a PC
Running Windows 2000 or
Windows XP
Perform the following procedure to set the network parameters of the PC running
MS Window 2000. For a PC running Windows XP, refer to the Windows
documentation.
1. Confirm that your PC is connected to a network.
2. Select Settings > Control Panel from the Start menu. The Control Panel
window appears.
3. Double-click the System icon in the window.
4. On the Network Identification tab, click Properties. The Identification
Changes dialog box appears as shown Figure 1-12.
Figure 1-12: Identification Changes dialog box
5. Enter your PC name (for example, PC 123) in the Computer name text box.
6. Enter WORKGROUP in the Workgroup text box.
WCA11G IEEE802.11a/b/g User Manual 1-19
Page 34

Getting Started
To Obtain an IP Address Automatically. Do the following steps to connect your PC
to the LAN. An IP address must be assigned by the name server. You need to use
the same settings parameters for both the analyzer and your PC.
1. Double-click the Network and Dial-up Connections icon in the Control
Panel window. The Network and Dial-up Connections window appears.
2. Double-click the Local Area Connection icon. The Local Area Connection
Properties dialog box appears.
3. Click the Properties button. The Local Area Connection Properties dialog box
appears.
4. In the network component field, select Internet Protocol (TCP/IP) and then
click the Properties button to display the dialog box shown below.
Figure 1-13: Internet Protocol (TCP/IP) Properties dialog box
5. In the dialog box, select Obtain an IP address automatically and Obtain
DNS server address automatically.
6. Click the OK button.
1-20 WCA11G IEEE802.11a/b/g User Manual
Page 35

Getting Started
To Assign an IP Address. When the name server is not in the network, do the
following steps to set the network parameters:
1. Repeat the same steps described on page 1-20 to display the Internet Protocol
(TCP/IP) Properties dialog box.
Figure 1-14: Internet Protocol (TCP/IP) Properties for IP Address Assignment
2. If you connect the PC directly to the analyzer:
a. In the Internet Protocol (TCP/IP) Properties dialog box, select Use the
following IP address and Use the following DNS server address.
b. Set the IP address parameter to be the same IP address as the analyzer's
address except for the last number. The last number must be different from
the last number in the analyzer's IP address.
c. Set the Subnet mask parameter to be the same subnet mask used by the
analyzer. Do not enter a number if the analyzer does not have a net mask.
3. If you connect the PC to your network:
a. In the dialog box, select Use the following IP address.
b. Ask your local network administrator and enter the appropriate addresses.
CAUTION. To prevent communication conflicts on your network, ask your local
network administrator for the correct numbers to enter in the dialog box.
WCA11G IEEE802.11a/b/g User Manual 1-21
Page 36

Getting Started
Registering a User Name
for MS Windows 2000 or
MS Windows XP
You need to register a PC running MS Windows 2000 or MS Windows XP and the
analyzer with the same user name (for example, test). Without the settings, you
cannot access the PC because of the security features of MS Windows 2000 or MS
Windows XP. If your PC is running on MS Windows 98, ignore this section.
Registering a User Name on the PC running MS Windows 2000. Do the following
steps to set a user name for the PC.
For a PC running Windows XP, refer to the Windows documentation.
NOTE. Communication between the analyzer and PC may not be performed
properly when you log on to the network with a different user name from that used
to register with MS Windows 2000 or MS Windows XP.
1. Confirm that your PC is connected to a network.
2. Click the icon on the Control Panel to open the Users and Passwords
dialog box.
1-22 WCA11G IEEE802.11a/b/g User Manual
Page 37

Getting Started
3. Click the Add... button on the Users tab. The Add New User dialog box
appears.
4. In the User name text box, enter test.
5. Click the Next> button to proceed to the next dialog box.
6. Click the Next> button without entering a password to proceed to the next
dialog box.
7. Select Power Users from the list box at the right side of the Other option
button.
WCA11G IEEE802.11a/b/g User Manual 1-23
Page 38

Getting Started
8. Click the Finish button, and make sure that test is displayed on the Users and
Passwords dialog box.
9. Clear the Users must enter a user name and password to use this computer
check box.
10. Click the OK button to complete the settings for the PC.
1-24 WCA11G IEEE802.11a/b/g User Manual
Page 39

Getting Started
Registering a User Name for the Analyzer. Do the following steps to set up a user
name for the WCA330/WCA380 analyzer:
1. Select Start > Settings > Control Panel from the Start menu. The Control
Panel window appears.
2. Click the icon on the Control Panel. The User Settings dialog box
appears.
3. Click the New User... button in the dialog box. The Add User dialog box
appears.
4. Enter test in the User name text box, and click the Next> button. The Enter
New Password dialog box appears.
WCA11G IEEE802.11a/b/g User Manual 1-25
Page 40

Getting Started
5. Click the Next> button without entering a password in the Password text box.
The Personalized Items Settings dialog box appears.
6. In the dialog box, select Create copies of the current items and their
content, and click the Next> button. The Ready to Finish dialog box appears.
7. Confirm the messages in the dialog box, and click the Finish button.
8. Click the icon in the Control Panel again to check that the user is added
to the User List.
1-26 WCA11G IEEE802.11a/b/g User Manual
Page 41

Operating Basics
This section describes the basic operation of the WCA11G IEEE802.11a/b/g
Signal Analysis Software.
Screen Elements
Figure 2-1 shows the screen elements of the WCA11G software. The operation
screen consists of four domains: Menu Bar on page 2-2, Analysis Type buttons on
page 2-5, Graph Frame on page 2-5, and Analysis Setting window on page 2-6.
Menu bar
Analysis Type buttons
Graph Frame Analysis Setting window
Figure 2-1: Screen elements
WCA11G IEEE802.11a/b/g User Manual 2-1
Page 42

Operating Basics
Menu Bar
A menu bar appears at the top of the screen. Table 2-1 shows the list of Menu Bar
items.
Table 2-1: Menu Bar Items
Main Sub Function
File (F) Select
Source(S)
Result File(R) Save(S)... Opens save/recall dialog box, where you
Setting File(I) Save(S)... Opens save/recall dialog box, where you
Save Symbol Table(T)... Saves symbol table as text file. (Binary or
Exit(E) Exits from WCA11G software.
View (V) PlotClear(P) Clears displays in the Graph frame.
WCA(W)... Opens Read From WCA dialog box,
where you can set WCA300 series
analysis parameters. See Figure 2-4 on
page 2-8.
IQT(I)... Opens Read From WCA dialog box,
where you can specify the files to be
analyzed (IQT files). See Figure 2-5 on
page 2-12.
can save the analysis result.
Recall(R)... Opens save/recall dialog box, where you
can recall the analysis result file.
can customize the default view format and
save it as a customized setting file.
Recall(R)... Opens save/recall dialog box, where you
can recall the customized view format.
Hexadecimal format can be selected.)
Main (M)
View1 (1)
View2 (2)
View3 (3)
Pan(P) Moves the display area by dragging on
the screen. Zoom function and Pan are
exclusive.
Zoom(Z) Magnifies the display area on the screen.
Zoom function and Pan are exclusive.
1
1
View Reset(V) Resets Zoom and Pan scale;
automatically optimizes the scale of the
graph display.
M_Marker1(1) Check this menu to display the readings
of M_Marker1 on each View screen.
M_Marker2(2) Check this menu to display the readings
of M_Marker2 on each View screen.
1
2,3
2,3
M_Marker Reset(M) Check this menu to reset the positions of
M_Marker1 and M_Marker2. The two
markers return to their initial positions.
Available when you use M_Marker1 or
M_Marker2.
3
Despread or FFT
On(N) Displays pre-analysis data of
modulation.
Off(F) Displays post-analysis data of
modulation.
3,4
3,4
2-2 WCA11G IEEE802.11a/b/g User Manual
Page 43

Operating Basics
Table 2-1: Menu Bar Items (cont.)
Main Sub Function
Normalization(N)
On(N) Applies normalization to the constellation
Off(F) Excludes normalization from the
Normalization Factor
(F)
AUTO (A)
BPSK (B)
QPSK (Q)
8PSK (8)
16QAM (1)
64QAM (6)
Vector(L)
On(N) Activates vector between symbols in the
Off(F) Inactivates vector between symbols in the
Symbol Table(T)
Hex(H) Displays symbol table values as
Bin(B) Displays symbol table values as binary.
Select View(S) Specifies View1, View2, View3, or Main
Main View (M)
View1 (1)
View2 (2)
View3 (3)
Tool (T) WCA300 Factory Reset(W)... Resets WCA300 series instrument to the
Ethernet Setup(E)... Opens Ethernet Setup dialog box.
Folder Setup(F)... Opens Folder Setup dialog box.
Set Default(D) Restore the setting file (*.ini) to the initial
Help (H) Help (H)... Opens WCA11G Help system.
3
display.
constellation display.
3
In the constellation display, you can select
the modulation format for normalization.
These buttons are exclusive.
constellation display.
constellation display.
hexadecimal.
3
3
3
3
View.
factory shipping conditions.
See Figure 2-2.
See Figure 2-3.
conditions.
3
Version Information(V)... Displays version information of WCA11G
software.
1. Pan, Zoom, and View Reset are not available when you select Symbol Table.
WCA11G IEEE802.11a/b/g User Manual 2-3
Page 44

Operating Basics
2. M_Marker1 and M_Marker2 are exclusive. You cannot use M_Marker1 or M_Marker2 when you specify
one of the following formats for a View screen:
Constellation
Symbol Constellation
Segment Constellation
Constellation Analysis Display
Symbol Table
3. This submenu is not available when you select Main View.
4. You cannot use Despread or FFT when you specify one of the following formats for a View screen:
Constellation
Symbol Constellation
Segment Constellation
Constellation Analysis Display
Flatness
Center Frequency Error
OFDM Linearity
Symbol Table
Spectrum Mask
Transmit Power On
Transmit Power Off
Ethernet Setup dialog box. When you select Ethernet Setup (E) in the Tool (T)
menu, the Ethernet Setup dialog box appears.
Figure 2-2: Ethernet Setup dialog box
In this dialog box, you can set the Ethernet connection parameters as follows:
Computer: Enter the Computer Name that you used in step 9 on page 1-12.
Command Port: Displays the TCP/IP command port number.
Event port: Displays the TCP/IP event port number.
2-4 WCA11G IEEE802.11a/b/g User Manual
Page 45

Operating Basics
Folder Setup dialog box. When you select Folder Setup (D) in the Tool (T) menu,
the Folder Setup dialog box appears.
Figure 2-3: Folder Setup dialog box
Data Folder: Displays the path name of the sharing folder DATA.
CFG Folder: Displays the path name of the sharing folder CFG.
Analysis Type buttons
Graph Frame
You can start the measurement by selecting the Analysis Type buttons located at
the upper right of the screen. By clicking these buttons, you can toggle the
parameter setting window. Two types of analysis buttons are provided as shown
below:
MODULATION button. Click this button to activate the modulation analysis setting
window. In this setting window, you can set the various parameters such as the
WCA300 control parameters and the analysis processing parameters, or you can
change the analyzed graph display.
POWER button. Click this button to activate the power analysis setting window. In
this setting window, you can set the WCA300 control parameters, or you can
change the analyzed graph display.
Displays the analysis and measurement results in this area. For details on the
modulation analysis view formats, refer to page 3-2. For the power analysis view
formats, refer to page 3-29.
WCA11G IEEE802.11a/b/g User Manual 2-5
Page 46

Operating Basics
Modulation Analysis
Setting Window
The setting window for the modulation analysis allows you to set the following
menus:
SETUP menu, page 2-6
VIEW menu, page 2-13
Table 2-2 lists the modulation analysis SETUP menu. The SETUP parameters
become available when you push the START button to start the analysis.
The SETUP parameters for currently displayed data are displayed in the RESULT
INFORMATION field.
Table 2-2: Modulation Analysis SETUP Parameters
Menu item Option Description
Standard Selects the wireless LAN standard type.
IEEE802.11a Analyzes IEEE802.11a modulation.
IEEE802.11b Analyzes IEEE802.11b modulation.
IEEE802.11g Analyzes IEEE802.11g modulation.
Modulation Type See Table 2-3. Selects the modulation type (data transmission rate)
from the pull-down menu.
Long Training Symbol
Synchronization
Equalization Check this box to apply the data correction to long
SELECT SOURCE Selects the analysis method.
WCA Check this radio button to set up the WCA300 series
IQT Check this radio button to select the IQT files. Select
SETUP... Click this button to open Read From WCA dialog box.
START Click to start the analysis.
CANCEL Click to stop the analysis.
Check this box to apply the synchronization function
to long training symbol during the analysis.
training symbol during the analysis.
parameters. Select WCA and then click the SETUP...
button to open Read From WCA dialog box. This
dialog box enables you to set the analyzer
parameters, acquire the data (IQT files), and create a
graphical display. See Figure 2-4 on page 2-8.
IQT and then click the SETUP... button to open Read
From WCA dialog box, where you can perform the
analysis and create a graphical display from IQT files.
See Figure 2-5 on page 2-12.
After specifying the analysis method from the
SELECT SOURCE menu, you can use this button.
2-6 WCA11G IEEE802.11a/b/g User Manual
Page 47

Operating Basics
Table 2-3 shows the modulation type for the IEEE802.11a/b/g standards. You must
specify the modulation type before you start an analysis.
Table 2-3: Modulation types
Standard Modulation Type Data Rate Modulation First/Second Encoding Rate Note
IEEE802.11a
IEEE802.11b
IEEE802.11g DSSS.DBPSK (1 Mbps) 1 Mbps DBPSK/ERP_DSSS LongPLCP
OFDM.BPSK (6 Mbps) 6 Mbps BPSK/OFDM 1/2
OFDM.BPSK (9 Mbps) 9 Mbps BPSK/OFDM 3/4
OFDM.QPSK (12 Mbps) 12 Mbps QPSK/OFDM 1/2
OFDM.QPSK (18 Mbps) 18 Mbps QPSK/OFDM 3/4
OFDM.16QAM (24 Mbps) 24 Mbps 16QAM/OFDM 1/2
OFDM.16QAM (36 Mbps) 36 Mbps 16QAM/OFDM 3/4
OFDM.64QAM (48 Mbps) 48 Mbps 64QAM/OFDM 2/3
OFDM.64QAM (54 Mbps) 54 Mbps 64QAM/OFDM 3/4
AUTO Auto Auto
DSSS.DBPSK (1 Mbps) 1 Mbps DBPSK/DSSS LongPLCP
DSSS.DQPSK (2 Mbps) 2 Mbps DQPSK/DSSS
CCK (5.5 Mbps) 5.5 Mbps CCK
CCK (11 Mbps) 11 Mbps CCK
PBCC.BPSK (5.5 Mbps) 5.5 Mbps BPSK/PBCC
PBCC.QPSK (11 Mbps) 11 Mbps QPSK/PBCC
AUTO Auto Auto
DSSS.DQPSK (2 Mbps) 2 Mbps DQPSK/ERP_DSSS
CCK (5.5 Mbps) 5.5 Mbps CCK
CCK (11 Mbps) 11 Mbps CCK
PBCC.BPSK (5.5 Mbps) 5.5 Mbps BPSK/ERP_PBCC
PBCC.QPSK (11 Mbps) 11 Mbps QPSK/ERP_PBCC
PBCC.8PSK (22 Mbps) 22 Mbps 8PSK/ER_PBCC
PBCC.8PSK (33 Mbps) 33 Mbps 8PSK/ER_PBCC
OFDM.BPSK (6 Mbps) 6 Mbps BPSK/DSSS_OFDM 1/2
OFDM.BPSK (9 Mbps) 9 Mbps BPSK/DSSS_OFDM 3/4
OFDM.QPSK (12 Mbps) 12 Mbps BPSK/DSSS_OFDM 1/2
OFDM.QPSK (18 Mbps) 18 Mbps BPSK/DSSS_OFDM 3/4
OFDM.16QAM (24 Mbps) 24 Mbps 16QAM/DSSS_OFDM 1/2
OFDM.16QAM (36 Mbps) 36 Mbps 16QAM/DSSS_OFDM 3/4
OFDM.64QAM (48 Mbps) 48 Mbps 64QAM/DSSS_OFDM 2/3
OFDM.64QAM (54 Mbps) 54 Mbps 64QAM/DSSS_OFDM 3/4
AUTO Auto Auto
LongPLCP or
ShortPLCP
LongPLCP or
ShortPLCP
WCA11G IEEE802.11a/b/g User Manual 2-7
Page 48

Operating Basics
Table 2-3: Modulation types (cont.)
Standard Modulation Type Data Rate Modulation First/Second Encoding Rate Note
IEEE802.11g OFDM.BPSK (6 Mbps) 6 Mbps BPSK/ERP_OFDM 1/2
OFDM.BPSK (9 Mbps) 9 Mbps BPSK/ERP_OFDM 3/4
OFDM.QPSK (12 Mbps) 12 Mbps QPSK/ERP_OFDM 1/2
OFDM.QPSK (18 Mbps) 18 Mbps QPSK/ERP_OFDM 3/4
OFDM.16QAM (24 Mbps) 24 Mbps 16QAM/ERP_OFDM 1/2
OFDM.16QAM (36 Mbps) 36 Mbps 16QAM/ERP_OFDM 3/4
OFDM.64QAM (48 Mbps) 48 Mbps 64QAM/ERP_OFDM 2/3
OFDM.64QAM (54 Mbps) 54 Mbps 64QAM/ERP_OFDM 3/4
AUTO Auto Auto
UltraShortPLCP
SELECT SOURCE. The following information describes the details about the
SELECT SOURCE menu on the modulation analysis setting window.
Select the WCA radio button and then click the SETUP... button in the SELECT
SOURCE field to open the Read From WCA dialog box as shown in Figure 2-4. In
this dialog box, you can set the analyzer parameters.
Figure 2-4: Read From WCA dialog box
2-8 WCA11G IEEE802.11a/b/g User Manual
Page 49

Operating Basics
Table 2-4 shows the parameters you can set in the Read From WCA dialog box.
Table 2-4: Read From WCA dialog box parameters
Items Option Description
No Remote Control Click this box to use local settings. It makes
the WCA300s parameters inactive.
This selection is available when you check
the WCA radio button in the SELECT
SOURCE.
WCA300s
Input IQ
RF
Channel Table Selects the channel from the pull-down
Center Frequency Sets the center frequency of the analyzer.
Ref Level 30, 20, 10, 0, -10, -20,
-30, -40, -50
Block Size 2000, 1000, 400, 200,
100, 40, 20, 10, 1
Trigger Mode Manual
ExtTrigger
LevelTrigger
Trigger Position 100, 50, 10, 0 Selects the trigger position of the analyzer.
Trigger Level 30, 20, 10, 0, -10, -20,
-30, -40, -50, -60, -70,
-80, -90, -100, -110,
-120, -130, -140, -150
Trigger Slope Rise
Fall
REPETITIVE
ACQUISITION
FILE
Path File Name field Text input Enters text to specify the file name and
REFER button Opens the dialog box to specify the file
CLOSE Exits the Read From WCA dialog box.
Specifies the input (IQ or RF) for the
analyzer.
menu. See Table 2-5.
Available when you specify VALUE for
Channel Table.
Selects the reference level of the analyzer.
Selects the block size of the analyzer.
Specifies the trigger mode of the analyzer.
Available when the Trigger Mode is set to
either ExtTrigger or LevelTrigger.
Selects the trigger level of the analyzer.
Available when the Trigger Mode is set to
LevelTrigger.
Selects the trigger slope of the
Available when the Trigger Mode is set to
LevelTrigger.
Click this box to perform repetitive
acquisition.
destination.
name.
analyzer.
WCA11G IEEE802.11a/b/g User Manual 2-9
Page 50

Operating Basics
In the Channel Table, you can select the channel from the following channel list.
Table 2-5: Channel list
Standard Channel number Carrier frequency
[GHz]
IEEE802.11a 34 5.170
36 5.180
38 5.190
40 5.200
42 5.210
44 5.220
46 5.230
48 5.240
52 5.260
56 5.280
60 5.300
64 5.320
100 5.500
104 5.520
108 5.540
112 5.560
116 5.580
120 5.600
124 5.620
128 5.640
132 5.660
136 5.680
140 5.700
149 5.745
153 5.765
157 5.785
161 5.805
VALUE Center Frequency Inputs a value for
Note
center frequency.
2-10 WCA11G IEEE802.11a/b/g User Manual
Page 51

Table 2-5: Channel list (cont.)
Operating Basics
Standard Channel number Carrier frequency
[GHz]
IEEE802.11b
and
IEEE802.11g
1 2.412
2 2.417
3 2.422
4 2.427
5 2.432
6 2.437
7 2.442
8 2.447
9 2.452
10 2.457
11 2.462
12 2.467
13 2.472
14 2.484
VALUE Center Frequency Inputs a value for
Note
center frequency.
WCA11G IEEE802.11a/b/g User Manual 2-11
Page 52

Operating Basics
Select the IQT radio button and then click the SETUP... button in the SELECT
SOURCE field to open the Read From WCA dialog box as shown in Figure 2-5. In
this dialog box, you can specify the files to be analyzed (IQT files).
Figure 2-5: Read From WCA dialog box (IQT file)
Table 2-6 shows the parameters you can set in the Read From WCA dialog box.
Table 2-6: Read From WCA dialog box (IQT) parameters
Items Option Description
No Remote Control Not available when you check the IQT
WCA300s
Input
Channel Table
Center Frequency
Ref Level
Block Size
Trigger Mode
Trigger Position
Trigger Level
Trigger Slope
REPETITIVE
ACQUISITION
FILE
Path File Name field Text input Enters text to specify the file name and
REFER button Opens the dialog box to specify the file
CLOSE Exits the Read From WCA dialog box.
radio button in the SELECT SOURCE.
destination.
name.
2-12 WCA11G IEEE802.11a/b/g User Manual
Page 53

Operating Basics
Table 2-7 lists the VIEW menus of the modulation analysis setting window.
Table 2-7: Modulation Analysis VIEW Parameters
Menu item Option Description
View Style 1 *1 Displays one graph on the screen.
2 * 2 Displays four graphs on the screen.
DISPLAY MOD.
TYPE...
Select Subcarrier Selects subcarrier(s) from the pull-down list for a
Click this button to open DISPLAY MOD. TYPE
dialog box. See Figure 2-6 on page 2-16.
displayed line graph.
All Data
All Pilot
All
Single Subcarrier
Subcarrier # Specifies the subcarrier number from the list.
Symbol or
Segment #
Displays only Data.
Displays only Pilot.
Displays Data + Pilot.
Displays the subcarrier wave specified by
Subcarrier #.
This menu item is available when you specify one of
the following formats for a View screen.
Average Power vs. Time
Average EVM vs. Time
Average MagErr vs. Time
Average PhaseErr vs. Time
Constellation
Center Frequency
[-26 to -1, +1 to +26]
The Subcarrier # is available when you specify
Single Subcarrier for Select Subcarrier.
Specifies the symbol number or segment number.
See page 2-15 for details on segment.
This menu item is available when you specify one of
the following format for a View screen.
Power vs. SC_No
EVM vs. SC_No
MagErr vs. SC_No
PhaseErr vs. SC_No
Symbol Constellation
Power vs. Time
EVM vs. Time
MagErr vs. Time
PhaseErr vs. Time
Segment Constellation
Power Analysis Display
EVM Analysis Display
MagErr Analysis Display
PhaseErr Analysis Display
Constellation Analysis Display
WCA11G IEEE802.11a/b/g User Manual 2-13
Page 54

Operating Basics
Table 2-7: Modulation Analysis VIEW Parameters (cont.)
Menu item Option Description
RESULT
INFORMATION
Displays the setting parameters when you performed
an analysis for the currently selected signal.
The following parameters are displayed:
IQT File Name
Standard
Modulation Type
Long Training Symbol Synchronization On/Off
Equalization On/Off.
2-14 WCA11G IEEE802.11a/b/g User Manual
Page 55

Operating Basics
Segment and Modulation Analysis. In Modulation Analysis, it is important to
calculate average values of RMS voltage or center frequency error for the enough
length of time in order to get good analysis results. The length of signal to calculate
the RMS voltage or center frequency error is called “segment” in the WCA11G
software. For example, frequency error by the segment is displayed on the Center
Frequency Error view format.
The following view formats display the averaged values by the segment for power,
EVM, magnitude error, and phase error, respectively.
Average Power vs. Time, page 3-3
Average EVM vs. Time, page 3-15
Average MagErr vs. Time, page 3-19
Average PhaseErr vs. Time, page 3-23
The length of segment is different depending on the modulation type as follows:
Data part
OFDM:80 sample points (1 symbol)
DSSS: 88 chips (8 symbols)
CCK: 80 chips (10 symbols)
PBCC: 80 symbols
Preamble, Header part
Short OFDM training symbol:16 sample points
Long OFDM training symbol:160 sample points
PLCP preamble:1584 chips (144 symbols)
Short PLCP preamble:792 chips (72 symbols)
PLCP Header:528 chips (48 symbols)
Short PLCP Header:264 chips (24 symbols)
The following view formats display the detailed analysis data of power, EVM,
magnitude error, and phase error for each symbol, chip, or subcarrier wave
contained in one segment.
IEEE802.11a IEEE802.11b IEEE802.11g
Power vs. SC_No Power vs. Time Power Analysis Display
EVM vs. SC No EVM vs. Time EVM Analysis Display
MagErr vs. SC_No MagErr vs. Time MagErr Analysis Display
PhaseErr vs. SC_No PhaseErr vs. Time PhaseErr Analysis Display
WCA11G IEEE802.11a/b/g User Manual 2-15
Page 56

Operating Basics
Display Modulation Type dialog box. Click the DISPLAY MOD. TYPE button on
the setting window to open the Display Modulation Type dialog box as shown in
Figure 2-6, where you can select the modulation type by clicking each desired box.
Only the checked modulation type signals have an effect on the graph display
except for the Main View. Unchecked modulation type signals are ignored.
Figure 2-6: Display Modulation Type dialog box
Do the following steps to use the Display Modulation Type dialog box:
1. Select a standard you want to analyze from the Standard pull-down list on the
SETUP menu in the Modulation Analysis setting window. Refer to page 2-6.
2. Click the DISPLAY MOD. TYPE button on the VIEW menu of the setting
window.
3. Select the desired individual modulation type(s) or select CHECK ALL.
CHECK ALL: Click this button to check all the boxes.
CHECK NONE: Click this button to deselect all the boxes.
4. Click the APPLY button to apply the selected type(s) to the measurement data,
and then display the graph for the modulation type(s) specified.
5. Click the CLOSE button to close the dialog box.
2-16 WCA11G IEEE802.11a/b/g User Manual
Page 57

Operating Basics
Power Analysis Setting
Window
The setting window for power analysis allows you to access the SETUP menu.
Table 2-8 lists the power analysis SETUP menus.
Table 2-8: Power Analysis SETUP Parameters
Menu item Option Description
Standard Selects the wireless LAN standard type.
IEEE802.11a Analyzes IEEE802.11a power.
IEEE802.11b Analyzes IEEE802.11b power.
IEEE802.11g Analyzes IEEE802.11g power.
Test See Table 2-9. Selects the test item.
MEASUREMENT Specifies the analysis parameters.
SETUP... Click this button to open the Read From WCA dialog
box, where you can set the analyzer parameters.
START Click to start the analysis.
After specifying the analysis method from the
MEASUREMENT menu, you can use this button.
CANCEL Click to stop the analysis.
Power Analysis Test Items. Table 2-9 lists the power analysis test items.
Table 2-9: Power Analysis Test Items
Standard Test Items Description
IEEE802.11a Spectrum Mask Displays spectrum waveform and mask in a line
graph under PeakHold condition. The vertical axis
represents power [dBm], and the horizontal axis
represents frequency [Hz].
IEEE802.11b
or
IEEE802.11g
Spectrum Mask Displays spectrum waveform and mask in a line
graph under PeakHold condition. The vertical axis
represents power [dBm], and the horizontal axis
represents frequency [Hz].
Transmit Power On Displays the transmit power on ramp in a line graph.
The vertical axis represents power [W], and the
horizontal axis represents time [ms].
Transmit Power Off Displays the transmit power down ramp in a line
graph. The vertical axis represents power [W], and
the horizontal axis represents time [ms].
WCA11G IEEE802.11a/b/g User Manual 2-17
Page 58

Operating Basics
Graph Window Pane
Analysis and measurement results are displayed as a graph in this area. You can
select either 1 * 1 or 2 * 2 display format by selecting View Style in the SETUP
menu in the modulation analysis setting window. For power analysis, the graph
display is fixed to 1 * 1 format.
Figure 2-7: 1 * 1 screen display
Figure 2-8: 2 * 2 screen display
In the modulation analysis 1 * 1 view style, you can toggle the view screen by
double-clicking on the screen. The screen display changes in the order of Main
View > View 1 > View 2 > View 3 > Main View.
2-18 WCA11G IEEE802.11a/b/g User Manual
Page 59

Operating Basics
D_Marker1 and D_Marker2. In the Main View screen, D_Marker1 and D_Marker2
are displayed in yellow. You can specify the display range for a View screen by
using these Markers.
These Marker readouts are displayed in the Main View screen:
Start: Time data of D_Marker1
Length: D_Marker2 - D_Marker1
End: Time data of D_Marker2
View Function
You can specify a graphical view format for each of the three View screens from
the pull-down list located at the top of each View screen. See Figure 2-9.
Figure 2-9: View format pull-down list
View Format. Table 2-10 lists the view formats for the IEEE802.11a standard.
Table 2-10: View format - IEEE802.11a signals
Item Description
Average Power vs. Time Displays power of one or all subcarriers in a line graph. The
vertical axis represents power [dBm], and the horizontal axis
represents time [ms].
Power vs. SC_No Displays each subcarrier wave power as a symbol in a bar
graph. The vertical axis represents power [dBm], and the
horizontal axis represents subcarrier wave number [-26 to +26]
Flatness Displays each subcarrier wave flatness in a bar graph. The
vertical axis represents average energy deviation power [dB],
and the horizontal axis represents subcarrier wave number [-26
to +26]
.
Constellation Displays constellation of one or all subcarriers in a rectangular
coordinates graph. The vertical axis represents Q, and the
horizontal axis represents I.
Symbol Constellation Displays constellation as a symbol in a rectangular coordinates
graph. The vertical axis represents Q, and the horizontal axis
represents I.
.
WCA11G IEEE802.11a/b/g User Manual 2-19
Page 60

Operating Basics
Table 2-10: View format - IEEE802.11a signals (cont.)
Item Description
Average EVM vs. Time Displays EVM of one or all subcarriers in a line graph. The
vertical axis represents EVM [%], and the horizontal axis
represents time [ms].
EVM vs. SC_No Displays EVM as a symbol in a bar graph. The vertical axis
represents EVM [%], and the horizontal axis represents
subcarrier wave number [-26 to +26]
Average MagErr vs. Time Displays magnitude error of one or all subcarriers in a line
graph. The vertical axis represents magnitude error [%], and
the horizontal axis represents time [ms].
MagErr vs. SC_No Displays magnitude error as a symbol in a bar graph. The
vertical axis represents magnitude error [%], and the horizontal
axis represents subcarrier number [-26 to +26]
Average PhaseErr vs. Time Displays phase error of one or all subcarriers in a line graph.
The vertical axis represents phase error [Degree], and the
horizontal axis represents time [ms].
PhaseErr vs. SC_No Displays phase error as a symbol in a bar graph. The vertical
axis represents phase error [Degree], and the horizontal axis
represents subcarrier number [-26 to +26]
Center Frequency Error Displays carrier wave frequency deviation as a symbol in a line
graph. The vertical axis represents deviation [kHz], and the
horizontal axis represents time [ms].
OFDM Linearity Displays linearity of OFDM modulation in a line graph. The
vertical axis represents actual measurement values [mW], and
the horizontal axis represents ideal values [mW].
Symbol Table Displays a table of symbol values (hexadecimal and binary).
Spectrum Mask Displays spectrum waveform and mask in a line graph under
PeakHold condition. The vertical axis represents power [dBm],
and the horizontal axis represents frequency [Hz].
.
.
.
Table 2-11 lists the view format for the IEEE802.11b standard.
Table 2-11: View format - IEEE802.11b signals
Item Description
Average Power vs. Time Displays power of carriers in a line graph. The vertical axis
represents power [dBm], and the horizontal axis represents
time [ms].
Power vs. Time Displays power of carriers by the segment in a bar graph. The
vertical axis represents power [dBm], and the horizontal axis
represents time [ms].
Constellation Displays constellation of carriers in a rectangular coordinates
graph. The vertical axis represents Q, and the horizontal axis
represents I.
Segment Constellation Displays constellation of carriers by the segment in a
rectangular coordinates graph. The vertical axis represents Q,
and the horizontal axis represents I.
2-20 WCA11G IEEE802.11a/b/g User Manual
Page 61

Operating Basics
Table 2-11: View format - IEEE802.11b signals (cont.)
Item Description
Average EVM vs. Time Displays EVM of carriers in a line graph. The vertical axis
represents EVM [%], and the horizontal axis represents time
[ms].
EVM vs. Time Displays EVM of carriers by the segment in a bar graph. The
vertical axis represents EVM [%], and the horizontal axis
represents time [ms].
Average MagErr vs. Time Displays magnitude error of carriers in a line graph. The vertical
axis represents magnitude error [%], and the horizontal axis
represents time [ms].
MagErr vs. Time Displays magnitude error of carriers by the segment in a bar
graph. The vertical axis represents magnitude error [%], and
the horizontal axis represents time [ms].
Average PhaseErr vs. Time Displays phase error of carriers in a line graph. The vertical axis
represents phase error [Degree], and the horizontal axis
represents time [ms].
PhaseErr vs. Time Displays phase error of carriers by the segment in a bar graph.
The vertical axis represents phase error [Degree], and the
horizontal axis represents time [ms].
Center Frequency Error Displays carrier wave frequency deviation in a line graph. The
vertical axis represents deviation [kHz], and the horizontal axis
represents time [ms].
Symbol Table Displays a table of symbol values (hexadecimal and binary).
Spectrum Mask Displays spectrum waveform and mask in a line graph under
PeakHold condition. The vertical axis represents power [dBm],
and the horizontal axis represents frequency [Hz].
Transmit Power On Displays the transmit power on ramp in a line graph. The
vertical axis represents power [W], and the horizontal axis
represents time [ms].
Transmit Power Off Displays the transmit power down ramp in a line graph. The
vertical axis represents power [W], and the horizontal axis
represents time [ms].
Table 2-12 lists the view format for the IEEE802.11g standard.
Table 2-12: View format - IEEE802.11g signals
Item Description
Average Power vs. Time Displays power of carriers, or one or all subcarriers in a line
graph. The vertical axis represents power [dBm], and the
horizontal axis represents time [ms].
Power Analysis Display Displays each subcarrier wave power as an OFDM symbol, or
power by the segment in a bar graph. The vertical axis
represents power [dBm], and the horizontal axis represents
subcarrier wave number [-26 to +26] or time [ms]
.
WCA11G IEEE802.11a/b/g User Manual 2-21
Page 62

Operating Basics
Table 2-12: View format - IEEE802.11g signals (cont.)
Item Description
Flatness Displays each subcarrier wave flatness in a bar graph. The
vertical axis represents average energy deviation power [dB],
and the horizontal axis represents subcarrier wave number [-26
to +26]
.
Constellation Displays constellation of carriers, or constellation of one or all
subcarriers in a rectangular coordinates graph. The vertical
axis represents Q, and the horizontal axis represents I.
Constellation Analysis Display Displays constellation of each subcarrier as an OFDM symbol,
constellation by the segment in a rectangular coordinates
graph. The vertical axis represents Q, and the horizontal axis
represents I.
Average EVM vs. Time Displays EVM of carriers, or one or all subcarriers in a line
graph. The vertical axis represents EVM [%], and the horizontal
axis represents time [ms].
EVM Analysis Display Displays EVM as an OFDM symbol, or EVM by the segment in
a bar graph. The vertical axis represents EVM [%], and the
horizontal axis represents subcarrier wave number [-26 to +26]
or time [ms]
Average MagErr vs. Time Displays magnitude error of carriers, or one or all subcarriers in
a line graph. The vertical axis represents magnitude error [%],
and the horizontal axis represents time [ms].
MagErr Analysis Display Displays magnitude error as an OFDM symbol, or magnitude
error by the segment in a bar graph. The vertical axis
represents magnitude error [%], and the horizontal axis
represents subcarrier number [-26 to +26] or time [ms]
Average PhaseErr vs. Time Displays phase error of carriers, or one or all subcarriers in a
line graph. The vertical axis represents phase error [Degree],
and the horizontal axis represents time [ms].
PhaseErr Analysis Display Displays phase error as an OFDM symbol, or phase error by
the segment in a bar graph. The vertical axis represents phase
error [Degree], and the horizontal axis represents subcarrier
number [-26 to +26] or time [ms]
Center Frequency Error Displays carrier wave frequency deviation as an OFDM symbol
in a line graph. The vertical axis represents deviation [kHz], and
the horizontal axis represents time [ms].
Symbol Table Displays a table of symbol values (hexadecimal and binary).
OFDM Linearity Displays linearity of OFDM modulation in a line graph. The
vertical axis represents actual measurement values [mW], and
the horizontal axis represents ideal values [mW].
Spectrum Mask Displays spectrum waveform and mask in a line graph under
PeakHold condition. The vertical axis represents power [dBm],
and the horizontal axis represents frequency [Hz].
Transmit Power On Displays the transmit power on ramp in a line graph. The
vertical axis represents power [W], and the horizontal axis
represents time [ms].
Transmit Power Off Displays the transmit power down ramp in a line graph. The
vertical axis represents power [W], and the horizontal axis
represents time [ms].
.
.
.
2-22 WCA11G IEEE802.11a/b/g User Manual
Page 63

Operating Basics
Scale Adjustment
You can change the scale of a View screen by the following steps:
1. In the view in which you want to change the scale, double-click the start or end
point of the horizontal (or vertical) axis.
The scale input box appears as shown in Figure 2-10.
Scale input box
Figure 2-10: Scale input box
2. Input t a new value in the box, and then press the Enter key to change the scale.
If you want to change the vertical scale, double-click the start or end point of the
vertical axis, repeating the same steps above.
WCA11G IEEE802.11a/b/g User Manual 2-23
Page 64

Operating Basics
2-24 WCA11G IEEE802.11a/b/g User Manual
Page 65

Modulation Analysis
This section provides information about the view formats of the WCA11G
IEEE802.11a/b/g Signal Analysis Software. The view format descriptions are
divided into two subsections: Modulation Analysis and Power Analysis.
Modulation Analysis Test
Procedure
Do the following steps to perform the modulation analysis:
1. Confirm that MODULATION is selected as the ANALYSIS TYPE.
The modulation analysis setting window becomes available.
2. Use the SETUP menu to input analysis parameters.
a. Specify the standard you want to test from the Standard pull-down list.
b. Select the modulation type (data rate) or specify AUTO from the
Modulation Type pull-down list.
c. Select or clear the Long Training Symbol Synchronization and
Equalization options as necessary.
3. Click either the WCA or the IQT radio button in the SELECT SOURCE to
open the Read From WCA dialog box. Refer to page 2-8 for the details on the
SELECT SOURCE menu and the Read From WCA dialog box.
Set the parameters in the Read From WCA dialog box, and then close the
dialog box.
4. Click the START button to start the analysis.
Click the CANCEL button if you want to cancel the analysis.
5. Use the View menu to modify the displayed graph.
6. If you want to change the view format, use the pull-down list on the View
screen as shown in Figure 2-9 on page 2-19.
WCA11G IEEE802.11a/b/g User Manual 3-1
Page 66

Modulation Analysis
Modulation Analysis View Formats
This subsection describes each modulation analysis view format.
Power vs. All Time
This display shows the power in a line graph as shown in Figure 3-1. The vertical
axis represents power [dBm], and the horizontal axis represents time [ms].
The Main View (upper left window in 2 x 2 view style) is fixed to Power vs. All
Time view format, and D_Marker1 and D_Marker2 are always displayed.
Figure 3-1: Power vs. All Time display
Setup Parameters. In the Power vs. All Time display, you can set the parameters
listed in Table 3-1.
Table 3-1: Power vs. All Time parameters
Standard Item Description
IEEE802.11a/b/g D_Marker1
D_Marker2
Start Time data of D_Marker1
End Time data of D_Marker2
Length D_Marker2 - D_Marker1
Two markers (D_Marker1 and D_Marker2) are
displayed in the Main View. You can use these
markers to specify the display range for View1,
View2, or View3.
3-2 WCA11G IEEE802.11a/b/g User Manual
Page 67

Modulation Analysis
Average Power vs. Time
This display shows the power in a line graph as shown in Figure 3-2. The vertical
axis represents power [dBm], and the horizontal axis represents time [ms].
Figure 3-2: Average Power vs. Time
Table 3-2 lists the setup parameters for this view format.
Table 3-2: Average Power vs. Time setup parameters
Standard Parameter Description
IEEE802.11a Select Subcarrier Specify the data format. Available options are
All Data, All Pilot, All, and Single Subcarrier.
Subcarrier # Sets the subcarrier number when Single
Subcarrier is selected for Select Subcarrier (-26
to 26).
IEEE802.11b Select Subcarrier These parameters are not available.
Subcarrier #
IEEE802.11g (OFDM) Select Subcarrier Specify the data format. Available options are
All Data, All Pilot, All, and Single Subcarrier.
Subcarrier # Sets the subcarrier number when Single
Subcarrier is selected for Select Subcarrier
(-26 to 26).
IEEE802.11g (DSSS) Select Subcarrier These parameters are not available.
Subcarrier #
WCA11G IEEE802.11a/b/g User Manual 3-3
Page 68

Modulation Analysis
Table 3-3 shows the initial measurement items. The measurement results are
recalculated for each symbol or segment.
Table 3-3: Average Power vs. Time measurements
Standard Readout Description
IEEE802.11a Max Displays the maximum power [W] and
[dBm] of one or all subcarriers.
Min Displays the minimum power [W] and
[dBm] of one or all subcarriers.
Ave Displays the average power [W] and [dBm]
of one or all subcarriers.
IEEE802.11b Max Displays the maximum power [W] and
[dBm] of carriers.
Min Displays the minimum power [W] and
[dBm] of carriers.
Ave Displays the average power [W] and [dBm]
of carriers.
IEEE802.11g Max Displays the maximum power [W] and
[dBm] of carriers, or one or all subcarriers.
Min Displays the minimum power [W] and
[dBm] of carriers, or one or all subcarriers.
Ave Displays the average power [W] and [dBm]
of carriers, or one or all subcarriers.
Power Analysis Display
This analysis display is the same as one of the following view formats depending
on the modulation signal. If you select Power Analysis Display, the displayed
graph automatically toggles depending on the modulation format.
If the displayed data is OFDM, refer to Power vs. SC_No on page 3-5.
If the displayed data is DSSS, refer to Power vs. Time on page 3-6.
3-4 WCA11G IEEE802.11a/b/g User Manual
Page 69

Modulation Analysis
Power vs. SC_No
This bar graph shows the power in each subcarrier of one OFDM symbol;
designates the symbol in the setting window by setting the Symbol or Segment #.
The vertical axis represents Power [dBm], and the horizontal axis represents
subcarrier number (-26 to +26).
Figure 3-3: Power vs. SC_No display
Table 3-4 lists the setup parameters for this view format.
Table 3-4: Power vs. SC_No parameter
Standard Parameter Description
IEEE802.11a Symbol or Segment # Specifies or changes the symbol number for the
currently displayed bar graph.
The following list shows the initial measurement items.
Readout Description
Max Displays the maximum power [W] and [dBm], and its subcarrier
number.
Min Displays the minimum power [W] and [dBm], and its subcarrier
number.
Ave Displays the average power of all subcarrier [W] and [dBm].
WCA11G IEEE802.11a/b/g User Manual 3-5
Page 70

Modulation Analysis
Power vs. Time
The Power vs. Time display shows the power of carriers by the segment in a bar
graph, as shown in Figure 3-4. The vertical axis represents power [dBm], and the
horizontal axis represents time [ms].
Figure 3-4: Power vs. Time
The following table shows the setup parameters for this view format.
Standard Parameter Description
IEEE802.11b Symbol or Segment # Specifies or changes the segment number for
the currently displayed bar graph.
The following list shows the initial measurement items.
Readout Description
Max Displays [W] and [dBm] of maximum power.
Min Displays [W] and [dBm] of minimum power.
Ave Displays [W] and [dBm] of average power.
3-6 WCA11G IEEE802.11a/b/g User Manual
Page 71

Modulation Analysis
Flatness
This display shows each subcarrier wave flatness in a bar graph, as shown in Figure
3-5. The vertical axis represents average energy deviation power [dB], and the
horizontal axis represents subcarrier wave number [-26 to +26].
Constellation Analysis
Display
Figure 3-5: Flatness measurement
Verify that the measurement results (bar graph) fall within the threshold level (two
red lines).
The following list shows the initial measurement item.
Readout Description
Center Frequency Leakage Displays the carrier leakage power [dB] (<2 dB in IEEE802.11a
standard).
This analysis display is the same as one of the following view formats depending
on the modulation signal. If you select Constellation Analysis Display, the
displayed graph automatically toggles depending on the modulation format.
If the displayed data is OFDM, refer to Constellation/Symbol Constellation on
page 3-8.
If the displayed data is DSSS, refer to Constellation/Segment Constellation on
page 3-11.
WCA11G IEEE802.11a/b/g User Manual 3-7
Page 72

Modulation Analysis
Constellation/Symbol
Constellation
The Constellation display shows constellation of one or all subcarriers in a
rectangular coordinates graph, as shown in Figure 3-6. The vertical axis represents
I, and the horizontal axis represents Q.
Figure 3-6: Constellation display
Table 3-5 lists the setup parameters for the Constellation and Symbol Constellation
view formats.
Table 3-5: Setup parameters
Standard View Format Item Description
IEEE802.11a Constellation Select Subcarrier Specify the data format. Available
options are All Data, All Pilot, All, and
Single Subcarrier.
Subcarrier # Sets the subcarrier number when
Single Subcarrier is selected for
Select Subcarrier (-26 to 26).
Symbol
Constellation
Symbol or
Segment #
Specifies or changes the symbol
number for the currently displayed
data.
3-8 WCA11G IEEE802.11a/b/g User Manual
Page 73

Modulation Analysis
The Symbol Constellation display shows constellation as a symbol in a rectangular
coordinates graph, as shown in Figure 3-7. The vertical axis represents I, and the
horizontal axis represents Q.
Figure 3-7: Symbol Constellation display
WCA11G IEEE802.11a/b/g User Manual 3-9
Page 74

Modulation Analysis
Pop-up View Menu. Table 3-6 lists the View menu items from the Menu bar. You
can also set up these parameters with pop-up menus on each of the View screens.
Right-click the view screen to display the pop-up menus. See Figure 3-8.
Table 3-6: View menu setup parameters
Main/Sub menu Option Description
View/Main Normalization On Applies normalization to the
constellation display.
Off Excludes normalization from the
constellation display.
Normalization Factor AUTO Selects modulation format for
BPSK
QPSK
8PSK
16QAM
64QAM
Vector On Activates vector between symbols.
Off Inactivates vector between symbols.
normalization. These selections are
exclusive.
Figure 3-8: Pop-up View menu
3-10 WCA11G IEEE802.11a/b/g User Manual
Page 75

Modulation Analysis
Constellation/Segment
Constellation
This display shows a constellation of carriers in a rectangular coordinates graph, as
shown in Figure 3-9. The vertical axis represents I, and the horizontal axis
represents Q.
Figure 3-9: Segment Constellation display
Table 3-7 lists the setup parameters for the Constellation and Segment
Constellation view formats.
Table 3-7: Segment Constellation setup parameters
Standard View Format Item Description
IEEE802.11b Constellation None
Segment
Constellation
Symbol or
Segment #
Specifies or changes the segment
number for the currently displayed
data.
Table 3-6 on page 3-10 lists the View menu items from the Menu bar. You can also
set up these parameters with the pop-up menus on each View screen, as shown in
Figure 3-8.
WCA11G IEEE802.11a/b/g User Manual 3-11
Page 76

Modulation Analysis
Average EVM vs. Time
This display shows the EVM of carriers, or one or all subcarriers in a line graph, as
shown in Figure 3-10. The vertical axis represents EVM [%], and the horizontal
axis represents time [ms].
Figure 3-10: Average EVM vs. Time display
Table 3-8 lists the setup parameters for this view format.
Table 3-8: Average EVM vs. Time setup parameters
Standard Parameter Description
IEEE802.11a/g Select Subcarrier Specify the data format. Available options are
All Data, All Pilot, All, and Single Subcarrier.
Subcarrier # Sets the subcarrier number when Single
Subcarrier is selected for Select Subcarrier (-26
to 26).
IEEE802.11b Select Subcarrier These parameters are not available.
Subcarrier #
Table 3-9 shows the initial measurement items. The measurement results are
recalculated.
Table 3-9: Average EVM vs. Time measurements
Readout Description
Max Displays the maximum value of EVM.
Min Displays the minimum value of EVM.
Ave Displays the average value of EVM.
3-12 WCA11G IEEE802.11a/b/g User Manual
Page 77

Modulation Analysis
EVM Analysis Display
EVM vs. SC_No
This analysis display is the same as one of the following view formats depending
on the modulation signal. If you select EVM Analysis Display, the displayed graph
automatically toggles depending on the modulation format.
If the displayed data is OFDM, refer to EVM vs. SC_No on page 3-13.
If the displayed data is DSSS, refer to EVM vs. Time on page 3-15.
This bar graph shows the EVM in each subcarrier of one OFDM symbol designated
with the Symbol or Segment # in the setting window. The vertical axis represents
EVM [%], and the horizontal axis represents subcarrier number (-26 to +26).
Figure 3-11: EVM vs. SC_No display
The following table lists the setup parameters for this view format.
Standard Parameter Description
IEEE802.11a Symbol or Segment # Specifies or changes the symbol number for the
currently displayed bar graph.
WCA11G IEEE802.11a/b/g User Manual 3-13
Page 78

Modulation Analysis
Table 3-10 shows the initial measurement items. The measurement results are
recalculated.
Table 3-10: EVM vs. SC_No measurements
Readout Description
Max Displays the maximum value of EVM.
Min Displays the minimum value of EVM.
Ave Displays the average value of EVM.
Table 3-11 lists the allowed relative constellation error versus data rate.
Table 3-11: EVM allowable value for IEEE802.11a
Data rate [Mb/s] Allowable EVM [dB]
6-5
9-8
12 -10
18 -13
24 -16
36 -19
48 -22
54 -25
3-14 WCA11G IEEE802.11a/b/g User Manual
Page 79

Modulation Analysis
EVM vs. Time
This display shows the EVM of carriers by the segment in a bar graph, as shown in
Figure 3-12. The vertical axis represents EVM [%], and the horizontal axis
represents time [ms].
Figure 3-12: EVM vs. Time display
The following table shows the setup parameter for this view format.
Standard Parameter Description
IEEE802.11b Symbol or Segment # Specifies or changes the segment number for
the currently displayed bar graph.
The following list shows the initial measurement items.
Readout Description
Max Displays the maximum value of magnitude EVM.
Min Displays the minimum value of magnitude EVM.
Ave Displays the average value of magnitude EVM.
WCA11G IEEE802.11a/b/g User Manual 3-15
Page 80

Modulation Analysis
Average MagErr vs Time
This display shows the magnitude error of carriers, or one or all subcarriers in a line
graph, as shown in Figure 3-13. The vertical axis represents magnitude error [%],
and the horizontal axis represents time [ms].
Figure 3-13: Average MagErr vs. Time
Table 3-12 lists the setup parameters for this view format.
Table 3-12: Average MagErr vs. Time setup parameters
Standard Parameter Description
IEEE802.11a/g Select Subcarrier Specify the data format. Available options are
All Data, All Pilot, All, and Single Subcarrier.
Subcarrier # Sets the subcarrier number when Single
Subcarrier is selected for Select Subcarrier (-26
to 26).
IEEE802.11b Select Subcarrier These parameters are not available.
Subcarrier #
3-16 WCA11G IEEE802.11a/b/g User Manual
Page 81

Modulation Analysis
Table 3-13 shows the initial measurement items. The measurement results are
recalculated.
Table 3-13: Average MagErr vs. Time measurements
Readout Description
Max Displays the maximum value of magnitude error.
Min Displays the minimum value of magnitude error.
Ave Displays the average value of magnitude error.
MagErr Analysis Display
This analysis display is the same as one of the following view formats depending
on the modulation signal. If you select MagErr Analysis Display, the displayed
graph automatically toggles depending on the modulation format.
If the displayed data is OFDM, refer to MagErr vs. SC_No 3-18.
If the displayed data is DSSS, refer to MagErr vs. Time on page 3-19.
WCA11G IEEE802.11a/b/g User Manual 3-17
Page 82

Modulation Analysis
MagErr vs. SC_No
This display shows the magnitude error of each OFDM symbol in a bar graph, as
shown in Figure 3-14. The vertical axis represents magnitude error [%], and the
horizontal axis represents the subcarrier wave number (-26 to +26).
Figure 3-14: MagErr vs. SC_No display
The following table lists the setup parameters for this view format.
Standard Parameter Description
IEEE802.11a Symbol or Segment # Specifies or changes the symbol number for the
currently displayed bar graph.
The following table shows the initial measurement items. The measurement results
are recalculated for each symbol.
Readout Description
Max Displays the maximum value of magnitude error.
Min Displays the minimum value of magnitude error.
Ave Displays the average value of magnitude error.
3-18 WCA11G IEEE802.11a/b/g User Manual
Page 83

Modulation Analysis
MagErr vs. Time
This display shows the magnitude error of carriers by the segment in a bar graph,
as shown in Figure 3-15. The vertical axis represents magnitude error [%], and the
horizontal axis represents time [ms].
Figure 3-15: MagErr vs. Time
The following table shows the setup parameter for this view format.
Standard Parameter Description
IEEE802.11b Symbol or Segment # Specifies or changes the segment number for
the currently displayed bar graph.
The following list shows the initial measurement items.
Readout Description
Max Displays the maximum value of magnitude error.
Min Displays the minimum value of magnitude error.
Ave Displays the average value of magnitude error.
WCA11G IEEE802.11a/b/g User Manual 3-19
Page 84

Modulation Analysis
Average PhaseErr vs Time
This display shows the Phase Error of carriers, or one or all subcarriers in a line
graph, as shown in Figure 3-16. The vertical axis represents phase error [Degree],
and the horizontal axis represents time [ms].
Figure 3-16: Average PhaseErr vs. Time display
Table 3-14 lists the setup parameters for this view format.
Table 3-14: Average PhaseErr vs. Time setup parameters
Standard Parameter Description
IEEE802.11a/g Select Subcarrier Specify the data format. Available options are
All Data, All Pilot, All, and Single Subcarrier.
Subcarrier # Sets the subcarrier number when Single
Subcarrier is selected for Select Subcarrier (-26
to 26).
IEEE802.11b Select Subcarrier These parameters are not available.
Subcarrier #
3-20 WCA11G IEEE802.11a/b/g User Manual
Page 85

Modulation Analysis
Table 3-15 shows the initial measurement items. The measurement results are
recalculated.
Table 3-15: Average PhaseErr vs. Time measurements
Readout Description
Max Displays the maximum value of phase error.
Min Displays the minimum value of phase error.
Ave Displays the average value of phase error.
PhaseErr Analysis Display
This analysis display is the same as the following view format depending on the
modulation signal. If you select PhaseErr Analysis Display, the displayed graph
automatically toggles depending on the modulation format.
If the displayed data is OFDM, refer to PhaseErr vs. SC_No on page 3-22.
If the displayed data is DSSS, refer to PhaseErr vs. Time on page 3-23.
WCA11G IEEE802.11a/b/g User Manual 3-21
Page 86

Modulation Analysis
PhaseErr vs SC_No
This display shows the Phase Error of each OFDM symbol in a line graph, as
shown in Figure 3-17. The vertical axis represents phase error [Degree], and the
horizontal axis represents the subcarrier wave number (-26 to +26).
Figure 3-17: PhaseErr vs. SC_No display
The following list shows the setup parameter for this view format.
Standard Parameter Description
IEEE802.11a Symbol or Segment # Specifies or changes the symbol number for the
currently displayed bar graph.
The following list shows the initial measurement items. The measurement results
are recalculated for each symbol.
Readout Description
Max Displays the maximum value of phase error.
Min Displays the minimum value of phase error.
Ave Displays the average value of phase error.
3-22 WCA11G IEEE802.11a/b/g User Manual
Page 87

Modulation Analysis
PhaseErr vs Time
This display shows Phase Error of carriers by the segment in a bar graph, as shown
in Figure 3-18. The vertical axis represents phase error [Degree], and the horizontal
axis represents time [ms].
Figure 3-18: PhaseErr vs. Time display
The following table shows the setup parameter for this view format.
Standard Parameter Description
IEEE802.11b Symbol or Segment # Specifies or changes the segment number for
the currently displayed bar graph.
The following list shows the initial measurement items.
Readout Description
Max Displays the maximum value of phase error.
Min Displays the minimum value of phase error.
Ave Displays the average value of phase error.
WCA11G IEEE802.11a/b/g User Manual 3-23
Page 88

Modulation Analysis
Center Frequency Error
This display shows the center frequency error versus time in a line graph, as shown
in Figure 3-19. The vertical axis represents frequency error [kHz], and the
horizontal axis represents time [ms].
Figure 3-19: Center frequency error display
Table 3-16 shows the initial measurement items.
Table 3-16: Center frequency error measurements
Readout Description
Max Displays the maximum frequency error and its time.
Min Displays the minimum frequency error and its time.
Ave Displays the average frequency error.
3-24 WCA11G IEEE802.11a/b/g User Manual
Page 89

Modulation Analysis
OFDM Linearity
This display shows the linearity of OFDM modulation in a line graph, as shown in
Figure 3-20, where the vertical axis represents actual measurement values [mW],
and the horizontal axis represents the ideal values [mW].
Figure 3-20: OFDM Linearity display
This view does not display the measurement readouts.
WCA11G IEEE802.11a/b/g User Manual 3-25
Page 90

Modulation Analysis
Symbol Table
This display shows the symbol tables, as shown in Figure 3-21 and Figure 3-22.
The tables can be displayed with hexadecimal digits (Hex) or binary (Bin).
Figure 3-21: Symbol table (Hex)
.
Figure 3-22: Symbol table (Bin)
3-26 WCA11G IEEE802.11a/b/g User Manual
Page 91

Modulation Analysis
File (F) Menu. If you want to save the symbol table in text format, select File from
the Menu bar, and then select Save SymbolTable. You can select the format (Hex
or Bin) in the displayed dialog box.
Table 3-17 lists the setup parameters for this view format.
Table 3-17: Symbol Table parameter
Standard Parameter Description
IEEE802.11a/b/g Symbol or Segment # Specifies or changes the symbol number for the
currently displayed table.
Table 3-18 lists the setup parameters from the Menu bar. You can also use the
pop-up View menus on each View screen, as shown in Figure 3-8 on page 3-10.
Table 3-18: Menu bar setup parameters for Symbol Table
Main/Sub menu Option Description
View/Main Symbol Table Hex Displays symbol table values as
hexadecimal.
Bin Displays symbol table values as bin.
File SaveSymbolTable Saves the symbol table as a text file.
WCA11G IEEE802.11a/b/g User Manual 3-27
Page 92

Power Analysis
Power Analysis
The power analysis consists of Spectrum Mask, Transmit Power On, and Transmit
Power Off.
Power Analysis Test
Procedure
Do the following steps to perform the power measurement:
1. Confirm that POWER is selected as the ANALYSIS TYPE.
The power analysis setting window becomes active.
2. Use the SETUP menu to set the following parameters:
a. Specify the standard you want to test from the Standard pull-down list.
b. Select the test item from the Test pull-down list.
3. Click the SETUP... button in the MEASUREMENT field to open the Read
From WCA dialog box.
Use the Read From WCA dialog box to set the parameters as necessary.
4. Click the START button to start the analysis.
Click the CANCEL button if you want to cancel the analysis.
3-28 WCA11G IEEE802.11a/b/g User Manual
Page 93

Power Analysis View Formats
This subsection describes each view format for the power analysis.
Power Analysis
Spectrum Mask (OFDM)
This display shows the spectrum waveform and mask in a line graph under
PeakHold condition, as shown in Figure 3-23. The vertical axis represents power
[dBm], and the horizontal axis represents frequency [Hz].
Figure 3-23: Spectrum mask (OFDM)
Verify that the measurement results (line graph) fall within the threshold level. This
view does not display the measurement readouts.
WCA11G IEEE802.11a/b/g User Manual 3-29
Page 94

Power Analysis
Figure 3-24 shows the IEEE802.11a standard for Spectrum Mask.
Power Spectral Density (dB)
Typical Signal Spectrum
-30 -20 -11 -9 9 11 20 30
Figure 3-24: IEEE802.11a spectrum mask
Transmit Spectrum Mask
-20dB
-28dB
-40dB
fc
Frequency (MHz)
3-30 WCA11G IEEE802.11a/b/g User Manual
Page 95

Power Analysis
Spectrum Mask (DSSS)
This display shows the spectrum waveform and mask in a line graph under
PeakHold condition, as shown in Figure 3-25. The vertical axis represents power
[dBm], and the horizontal axis represents frequency [Hz].
Figure 3-25: Spectrum mask (DSSS)
Verify that the measurement results (line graph) fall within the threshold level. This
view does not display the measurement readouts.
Figure 3-26 shows the IEEE802.11b standard for Spectrum Mask.
Transmit Spectrum Mask
0 dB
fc-11MHzfc-22MHz
fc
Unfiltered Sinx/x
-30 dB
-50 dB
fc+11MHz fc+22MHz
Figure 3-26: IEEE802.11b spectrum mask
WCA11G IEEE802.11a/b/g User Manual 3-31
Page 96

Power Analysis
Transmit Power On
This display shows the transmit power on ramp in a line graph. The vertical axis
represents power [W], and the horizontal axis represents time [s].
Figure 3-27: Transmit Power On display
Verify that the measurement results (line graph) fall within the threshold level. This
view does not display the measurement readouts.
Figure 3-28 shows the IEEE802.11b standard for the transmit power-on ramp.
Max Tx Power
Transmit
Power
Output
10% Max
01 2 34
Time µsec
90% Max
Figure 3-28: IEEE802.11b Transmit power-on ramp
3-32 WCA11G IEEE802.11a/b/g User Manual
Page 97

Power Analysis
Transmit Power Off
This display shows the transmit power down ramp in a line graph. The vertical axis
represents power [W], and the horizontal axis represents time [s].
Figure 3-29: Transmit Power Off display
Verify that the measurement results (line graph) fall within the threshold level. This
view does not display the measurement readouts.
Figure 3-30 shows the IEEE802.11b standard for the transmit power-down ramp.
Max Tx Power
Transmit
Power
Output
012 3 4
Time µsec
90% Max
10% Max
Figure 3-30: IEEE802.11b Transmit power-down ramp
WCA11G IEEE802.11a/b/g User Manual 3-33
Page 98

Power Analysis
3-34 WCA11G IEEE802.11a/b/g User Manual
Page 99

Index
A
Address
Tektronix
All
Select Subcarrier
All Data
Select Subcarrier
All Pilot
Select Subcarrier
Analysis Type buttons
screen elements
Average EVM vs. Time
IEEE802.11a signals
IEEE802.11b signals
IEEE802.11g signals
view format
Average MagErr vs. Time
IEEE802.11a signals
IEEE802.11b signals
IEEE802.11g signals
view format
Average PhaseErr vs. Time
IEEE802.11a signals
IEEE802.11b signals
IEEE802.11g signals
view format
Average Power vs. Time
IEEE802.11a signals
IEEE802.11b signals
IEEE802.11g signals
view format
viii
2-13
2-13
2-13
2-5
1-3, 2-20
1-4, 2-21
1-5, 2-22
3-12
1-3, 2-20
1-4, 2-21
1-6, 2-22
3-16
1-3, 2-20
1-4, 2-21
1-6, 2-22
3-20
1-3, 2-19
1-4, 2-20
1-5, 2-21
3-3
B
Block Size
Read From WCA dialog box parameter
C
2-9
Center Frequency Error
IEEE802.11a signals
IEEE802.11b signals
IEEE802.11g signals
view format
Channel Table
Read From WCA dialog box parameter
CHECK ALL
Display Modulation Type dialog box
CHECK NONE
Display Modulation Type dialog box
CLOSE
Read From WCA dialog box (IQT) parameter
2-12
Read From WCA dialog box parameter
Constellation
IEEE802.11a signals
IEEE802.11b signals
IEEE802.11g signals
view format
Constellation Analysis Display
IEEE802.11g signals
view format
Contacting Tektronix
Created Folders
installation
3-24
3-8, 3-11
3-7
1-9
1-3, 2-20
1-5, 2-21
1-6, 2-22
2-9, 2-10
2-16
2-16
2-9
1-3, 2-19
1-4, 2-20
1-5, 2-22
1-5, 2-22
viii
D
Data part
length of segment
Despread or FFT
View menu
DISPLAY MOD. TYPE...
modulation analysis VIEW parameter
Display Modulation Type dialog box
D_Marker1
D_Marker2
DSSS
length of segment
2-19
2-19
2-15
2-2
2-13
2-16
2-15
CANCEL
2-17
2-6
2-9
E
Equalization
modulation analysis SETUP parameter
Ethernet Setup
Tool menu
2-3
2-6
modulation analysis SETUP parameter
Power Analysis SETUP parameter
CCK
length of segment
Center Frequency
Read From WCA dialog box parameter
WCA11G IEEE802.11a/b/g User Manual Index-1
2-15
Page 100

Index
EVM Analysis Display
IEEE802.11g signals
view format
EVM vs. SC_No
IEEE802.11a signals
view format
EVM vs. Time
IEEE802.11b signals
view format
Exit submenu
File menu
3-13
3-13
3-15
2-2
1-6, 2-22
1-3, 2-20
1-4, 2-21
F
File menu 2-2
Flatness
IEEE802.11a signals
IEEE802.11g signals
view format
Folder Setup
Tool menu
3-7
2-3
1-3, 2-19
1-5, 2-22
G
Glossary ix
Graph Frame
screen elements
Graph Window Pane
2-5
2-18
H
Hardware Configuration 1-7
Header part
length of segment
Help menu
Help...
Helpr menu
2-3
2-15
2-3
Input
Read From WCA dialog box parameter
Installation
1-8
L
LAN cross cable
standard accessory
Line Code Settings
WCA330/WCA380
Long OFDM training symbol
length of segment
Long Training Symbol Synchronization
modulation analysis SETUP parameter
1-8
1-15
2-15
M
MagErr Analysis Display
IEEE802.11g signals
view format
MagErr vs. SC_No
IEEE802.11a signals
view format
MagErr vs. Time
IEEE802.11b signals
view format
Main submenu
View menu
Manual Structure
MEASUREMENT
Power Analysis SETUP parameter
Menu Bar
Menu Items
M_Marker1
View menu
M_Marker2
View menu
M_MarkerReset
View menu
3-17
3-18
3-19
2-2
2-2
2-2
2-2
2-2
2-2
1-6, 2-22
1-3, 2-20
1-4, 2-21
vii
2-17
2-9
2-6
I
I/O Port
WCA330/WCA380
IEEE802.11a signals
view format
IEEE802.11b signals
view format
IEEE802.11g signals
view format
Index-2 WCA11G IEEE802.11a/b/g User Manual
2-19
2-20
2-21
1-15
1-3
1-4
1-5
 Loading...