


User Manual
TLA 700 Series
Logic Analyzer
070-9775-04
This document supports application software
version 2.0 and above.

Copyright © T ektronix, Inc. All rights reserved. Licensed software products are owned by Tektronix or its suppliers and
are protected by United States copyright laws and international treaty provisions.
Use, duplication, or disclosure by the Government is subject to restrictions as set forth in subparagraph (c)(1)(ii) of the
Rights in T echnical Data and Computer Software clause at DFARS 252.227-7013, or subparagraphs (c)(1) and (2) of the
Commercial Computer Software – Restricted Rights clause at F AR 52.227-19, as applicable.
T ektronix products are covered by U.S. and foreign patents, issued and pending. Information in this publication supercedes
that in all previously published material. Specifications and price change privileges reserved.
Printed in the U.S.A.
T ektronix, Inc., P.O. Box 1000, Wilsonville, OR 97070–1000
TEKTRONIX and TEK are registered trademarks of T ektronix, Inc.
MagniVu is a trademark of Tektronix, Inc.
Windows and Windows 95 are trademarks of Microsoft Corporation.

WARRANTY
T ektronix warrants that the products that it manufactures and sells will be free from defects in materials and workmanship
for a period of one (1) year from the date of shipment. If a product proves defective during this warranty period, T ektronix,
at its option, either will repair the defective product without charge for parts and labor, or will provide a replacement in
exchange for the defective product.
In order to obtain service under this warranty, Customer must notify Tektronix of the defect before the expiration of the
warranty period and make suitable arrangements for the performance of service. Customer shall be responsible for
packaging and shipping the defective product to the service center designated by T ektronix, with shipping charges prepaid.
T ektronix shall pay for the return of the product to Customer if the shipment is to a location within the country in which the
T ektronix service center is located. Customer shall be responsible for paying all shipping charges, duties, taxes, and any
other charges for products returned to any other locations.
This warranty shall not apply to any defect, failure or damage caused by improper use or improper or inadequate
maintenance and care. T ektronix shall not be obligated to furnish service under this warranty a) to repair damage resulting
from attempts by personnel other than T ektronix representatives to install, repair or service the product; b) to repair
damage resulting from improper use or connection to incompatible equipment; c) to repair any damage or malfunction
caused by the use of non-T ektronix supplies; or d) to service a product that has been modified or integrated with other
products when the effect of such modification or integration increases the time or difficulty of servicing the product.
THIS WARRANTY IS GIVEN BY TEKTRONIX IN LIEU OF ANY OTHER WARRANTIES, EXPRESS OR
IMPLIED. TEKTRONIX AND ITS VENDORS DISCLAIM ANY IMPLIED WARRANTIES OF
MERCHANTABILITY OR FITNESS FOR A PAR TICULAR PURPOSE. TEKTRONIX’ RESPONSIBILITY TO
REP AIR OR REPLACE DEFECTIVE PRODUCTS IS THE SOLE AND EXCLUSIVE REMEDY PROVIDED TO
THE CUSTOMER FOR BREACH OF THIS WARRANTY. TEKTRONIX AND ITS VENDORS WILL NOT BE
LIABLE FOR ANY INDIRECT , SPECIAL, INCIDENTAL, OR CONSEQUENTIAL DAMAGES IRRESPECTIVE
OF WHETHER TEKTRONIX OR THE VENDOR HAS ADVANCE NOTICE OF THE POSSIBILITY OF SUCH
DAMAGES.


WARRANTY
T ektronix warrants that the media on which this software product is furnished and the encoding of the programs on the
media will be free from defects in materials and workmanship for a period of three (3) months from the date of shipment.
If a medium or encoding proves defective during the warranty period, T ektronix will provide a replacement in exchange
for the defective medium. Except as to the media on which this software product is furnished, this software product is
provided “as is” without warranty of any kind, either express or implied. T ektronix does not warrant that the functions
contained in this software product will meet Customer’s requirements or that the operation of the programs will be
uninterrupted or error-free.
In order to obtain service under this warranty, Customer must notify Tektronix of the defect before the expiration of the
warranty period. If T ektronix is unable to provide a replacement that is free from defects in materials and workmanship
within a reasonable time thereafter, Customer may terminate the license for this software product and return this software
product and any associated materials for credit or refund.
THIS WARRANTY IS GIVEN BY TEKTRONIX IN LIEU OF ANY OTHER WARRANTIES, EXPRESS OR
IMPLIED. TEKTRONIX AND ITS VENDORS DISCLAIM ANY IMPLIED WARRANTIES OF
MERCHANTABILITY OR FITNESS FOR A PAR TICULAR PURPOSE. TEKTRONIX’ RESPONSIBILITY TO
REPLACE DEFECTIVE MEDIA OR REFUND CUSTOMER’S PAYMENT IS THE SOLE AND EXCLUSIVE
REMEDY PROVIDED TO THE CUSTOMER FOR BREACH OF THIS WARRANTY. TEKTRONIX AND ITS
VENDORS WILL NOT BE LIABLE FOR ANY INDIRECT , SPECIAL, INCIDENTAL, OR CONSEQUENTIAL
DAMAGES IRRESPECTIVE OF WHETHER TEKTRONIX OR THE VENDOR HAS ADVANCE NOTICE OF
THE POSSIBILITY OF SUCH DAMAGES.


Table of Contents
Getting Started
Operating Basics
General Safety Summary xi. . . . . . . . . . . . . . . . . . . . . . . . . . . . . . . . . . . .
Preface xiii. . . . . . . . . . . . . . . . . . . . . . . . . . . . . . . . . . . . . . . . . . . . . . . . . . .
Related Documentation xiii. . . . . . . . . . . . . . . . . . . . . . . . . . . . . . . . . . . . . . . . . . . .
Contacting T ektronix xv. . . . . . . . . . . . . . . . . . . . . . . . . . . . . . . . . . . . . . . . . . . . . .
Getting Started 1–1. . . . . . . . . . . . . . . . . . . . . . . . . . . . . . . . . . . . . . . . . . . .
Product Description 1–1. . . . . . . . . . . . . . . . . . . . . . . . . . . . . . . . . . . . . . . . . . . . . . .
Installation 1–2. . . . . . . . . . . . . . . . . . . . . . . . . . . . . . . . . . . . . . . . . . . . . . . . . . . . . .
Powering On the Logic Analyzer 1–2. . . . . . . . . . . . . . . . . . . . . . . . . . . . . . . . . . . . .
Powering Off the Logic Analyzer 1–3. . . . . . . . . . . . . . . . . . . . . . . . . . . . . . . . . . . .
Connecting Probes to the T arget System 1–3. . . . . . . . . . . . . . . . . . . . . . . . . . . . . . .
Approaching the Windows 1–6. . . . . . . . . . . . . . . . . . . . . . . . . . . . . . . . . . . . . . . . . .
Programmatic Control 1–17. . . . . . . . . . . . . . . . . . . . . . . . . . . . . . . . . . . . . . . . . . . . .
Backing Up User Files 1–17. . . . . . . . . . . . . . . . . . . . . . . . . . . . . . . . . . . . . . . . . . . . .
Portable Mainframe Front Panel Controls 1–18. . . . . . . . . . . . . . . . . . . . . . . . . . . . . .
For Further Information 1–20. . . . . . . . . . . . . . . . . . . . . . . . . . . . . . . . . . . . . . . . . . . .
Sampling and Digitizing a Signal 2–1. . . . . . . . . . . . . . . . . . . . . . . . . . . . . . . . . . . .
LA Module Block Diagram 2–2. . . . . . . . . . . . . . . . . . . . . . . . . . . . . . . . . . . . . . . . .
DSO Module Block Diagram 2–4. . . . . . . . . . . . . . . . . . . . . . . . . . . . . . . . . . . . . . . .
Logic Analyzer Physical Model 2–5. . . . . . . . . . . . . . . . . . . . . . . . . . . . . . . . . . . . . .
Logic Analyzer Conceptual Model 2–6. . . . . . . . . . . . . . . . . . . . . . . . . . . . . . . . . . .
Intermodule Interactions and Time Correlation 2–7. . . . . . . . . . . . . . . . . . . . . . . . . .
Listing-Data Concepts 2–8. . . . . . . . . . . . . . . . . . . . . . . . . . . . . . . . . . . . . . . . . . . . .
Microprocessor Support 2–9. . . . . . . . . . . . . . . . . . . . . . . . . . . . . . . . . . . . . . . . . . . .
High-Level Language (HLL) Support 2–10. . . . . . . . . . . . . . . . . . . . . . . . . . . . . . . . .
Waveform Data Concepts 2–11. . . . . . . . . . . . . . . . . . . . . . . . . . . . . . . . . . . . . . . . . . .
Performance Analysis Concepts 2–17. . . . . . . . . . . . . . . . . . . . . . . . . . . . . . . . . . . . .
Comparing Acquired Data Against Saved Data 2–18. . . . . . . . . . . . . . . . . . . . . . . . . .
Repetitive Acquisitions 2–19. . . . . . . . . . . . . . . . . . . . . . . . . . . . . . . . . . . . . . . . . . . .
TLA 700 Programmatic Interface (TPI) 2–20. . . . . . . . . . . . . . . . . . . . . . . . . . . . . . .
Symbol Support 2–21. . . . . . . . . . . . . . . . . . . . . . . . . . . . . . . . . . . . . . . . . . . . . . . . . .
Reference
Setup 3–1. . . . . . . . . . . . . . . . . . . . . . . . . . . . . . . . . . . . . . . . . . . . . . . . . . . . .
Starting From the System Window 3–1. . . . . . . . . . . . . . . . . . . . . . . . . . . . . . . . . . .
Setting Up the LA Module 3–3. . . . . . . . . . . . . . . . . . . . . . . . . . . . . . . . . . . . . . . . . .
Setting Up the Trigger Program 3–12. . . . . . . . . . . . . . . . . . . . . . . . . . . . . . . . . . . . . .
Setting Up the DSO Module 3–24. . . . . . . . . . . . . . . . . . . . . . . . . . . . . . . . . . . . . . . .
System Trigger 3–30. . . . . . . . . . . . . . . . . . . . . . . . . . . . . . . . . . . . . . . . . . . . . . . . . . .
Arming Modules 3–31. . . . . . . . . . . . . . . . . . . . . . . . . . . . . . . . . . . . . . . . . . . . . . . . .
Intermodule and External Signaling 3–32. . . . . . . . . . . . . . . . . . . . . . . . . . . . . . . . . .
Merging Modules 3–34. . . . . . . . . . . . . . . . . . . . . . . . . . . . . . . . . . . . . . . . . . . . . . . . .
TLA 700 Series Logic Analyzer User Manual
i

Table of Contents
Saving and Loading Setups, Triggers, and Data 3–35. . . . . . . . . . . . . . . . . . . . . . . . .
System Options 3–39. . . . . . . . . . . . . . . . . . . . . . . . . . . . . . . . . . . . . . . . . . . . . . . . . .
Menu Shortcut Keys 3–40. . . . . . . . . . . . . . . . . . . . . . . . . . . . . . . . . . . . . . . . . . . . . . .
Acquisition 3–41. . . . . . . . . . . . . . . . . . . . . . . . . . . . . . . . . . . . . . . . . . . . . . . .
Starting and Stopping Acquisition 3–41. . . . . . . . . . . . . . . . . . . . . . . . . . . . . . . . . . . .
Viewing Acquisition Activity 3–43. . . . . . . . . . . . . . . . . . . . . . . . . . . . . . . . . . . . . . .
If the Logic Analyzer Does Not Trigger 3–44. . . . . . . . . . . . . . . . . . . . . . . . . . . . . . .
Display 3–47. . . . . . . . . . . . . . . . . . . . . . . . . . . . . . . . . . . . . . . . . . . . . . . . . . .
Opening an Existing Data Window 3–48. . . . . . . . . . . . . . . . . . . . . . . . . . . . . . . . . . .
Opening a Saved Data Window 3–49. . . . . . . . . . . . . . . . . . . . . . . . . . . . . . . . . . . . . .
Aligning Saved Data with Current Data 3–49. . . . . . . . . . . . . . . . . . . . . . . . . . . . . . .
Creating a New Data Window 3–50. . . . . . . . . . . . . . . . . . . . . . . . . . . . . . . . . . . . . . .
General Purpose Data Window Shortcut Keys 3–51. . . . . . . . . . . . . . . . . . . . . . . . . .
Waveform Window 3–53. . . . . . . . . . . . . . . . . . . . . . . . . . . . . . . . . . . . . . . . .
Types of Waveforms 3–54. . . . . . . . . . . . . . . . . . . . . . . . . . . . . . . . . . . . . . . . . . . . . . .
Reading the Waveform Indicators 3–56. . . . . . . . . . . . . . . . . . . . . . . . . . . . . . . . . . . .
Cursor Measurements 3–58. . . . . . . . . . . . . . . . . . . . . . . . . . . . . . . . . . . . . . . . . . . . . .
Jumping to Specific Data Locations 3–59. . . . . . . . . . . . . . . . . . . . . . . . . . . . . . . . . .
Searching Data 3–60. . . . . . . . . . . . . . . . . . . . . . . . . . . . . . . . . . . . . . . . . . . . . . . . . . .
Locking Windows 3–61. . . . . . . . . . . . . . . . . . . . . . . . . . . . . . . . . . . . . . . . . . . . . . . .
MagniV u Data 3–62. . . . . . . . . . . . . . . . . . . . . . . . . . . . . . . . . . . . . . . . . . . . . . . . . . .
Comparing Waveform Data 3–63. . . . . . . . . . . . . . . . . . . . . . . . . . . . . . . . . . . . . . . . .
Adjusting the Waveform Data View 3–65. . . . . . . . . . . . . . . . . . . . . . . . . . . . . . . . . .
Customizing the Waveform Window Data 3–68. . . . . . . . . . . . . . . . . . . . . . . . . . . . .
Exporting Waveform Data 3–68. . . . . . . . . . . . . . . . . . . . . . . . . . . . . . . . . . . . . . . . . .
Printing Waveform Data 3–69. . . . . . . . . . . . . . . . . . . . . . . . . . . . . . . . . . . . . . . . . . .
Waveform Window Shortcut Keys 3–70. . . . . . . . . . . . . . . . . . . . . . . . . . . . . . . . . . . .
Listing Window 3–71. . . . . . . . . . . . . . . . . . . . . . . . . . . . . . . . . . . . . . . . . . . .
Reading the Listing Window Indicators 3–71. . . . . . . . . . . . . . . . . . . . . . . . . . . . . . . .
Jumping to Specific Data Locations 3–73. . . . . . . . . . . . . . . . . . . . . . . . . . . . . . . . . .
Measuring Listing Data 3–75. . . . . . . . . . . . . . . . . . . . . . . . . . . . . . . . . . . . . . . . . . . .
Comparing Listing Data 3–75. . . . . . . . . . . . . . . . . . . . . . . . . . . . . . . . . . . . . . . . . . . .
Searching Data 3–77. . . . . . . . . . . . . . . . . . . . . . . . . . . . . . . . . . . . . . . . . . . . . . . . . . .
Locking Windows 3–78. . . . . . . . . . . . . . . . . . . . . . . . . . . . . . . . . . . . . . . . . . . . . . . .
MagniV u Data 3–79. . . . . . . . . . . . . . . . . . . . . . . . . . . . . . . . . . . . . . . . . . . . . . . . . . .
Adjusting the Listing Data View 3–79. . . . . . . . . . . . . . . . . . . . . . . . . . . . . . . . . . . . .
Customizing the Listing Window Data Area 3–81. . . . . . . . . . . . . . . . . . . . . . . . . . . .
Exporting Listing Data 3–82. . . . . . . . . . . . . . . . . . . . . . . . . . . . . . . . . . . . . . . . . . . . .
Printing Listing Data 3–85. . . . . . . . . . . . . . . . . . . . . . . . . . . . . . . . . . . . . . . . . . . . . .
Listing Window Shortcut Keys 3–86. . . . . . . . . . . . . . . . . . . . . . . . . . . . . . . . . . . . . .
Source Window 3–87. . . . . . . . . . . . . . . . . . . . . . . . . . . . . . . . . . . . . . . . . . . .
Creating a Source Window 3–88. . . . . . . . . . . . . . . . . . . . . . . . . . . . . . . . . . . . . . . . .
Reading the Source Window Indicators 3–89. . . . . . . . . . . . . . . . . . . . . . . . . . . . . . . .
Jumping to Specific Data Locations 3–90. . . . . . . . . . . . . . . . . . . . . . . . . . . . . . . . . .
Moving Through Source Files 3–92. . . . . . . . . . . . . . . . . . . . . . . . . . . . . . . . . . . . . . .
Searching for Source Data 3–95. . . . . . . . . . . . . . . . . . . . . . . . . . . . . . . . . . . . . . . . . .
Adjusting the Source Data View 3–96. . . . . . . . . . . . . . . . . . . . . . . . . . . . . . . . . . . . .
Customizing the Source Window Data Area 3–97. . . . . . . . . . . . . . . . . . . . . . . . . . . .
Locating Source Files 3–97. . . . . . . . . . . . . . . . . . . . . . . . . . . . . . . . . . . . . . . . . . . . . .
Printing Source Data 3–99. . . . . . . . . . . . . . . . . . . . . . . . . . . . . . . . . . . . . . . . . . . . . .
Source Window Shortcut Keys 3–100. . . . . . . . . . . . . . . . . . . . . . . . . . . . . . . . . . . . . .
ii
TLA 700 Series Logic Analyzer User Manual

Appendices
Table of Contents
Histogram Window 3–101. . . . . . . . . . . . . . . . . . . . . . . . . . . . . . . . . . . . . . . . .
Measuring Histogram Data 3–102. . . . . . . . . . . . . . . . . . . . . . . . . . . . . . . . . . . . . . . . .
Creating a Histogram Window 3–103. . . . . . . . . . . . . . . . . . . . . . . . . . . . . . . . . . . . . . .
Adjusting the Histogram Data View 3–104. . . . . . . . . . . . . . . . . . . . . . . . . . . . . . . . . .
Customizing the Histogram Window Data Area 3–105. . . . . . . . . . . . . . . . . . . . . . . . .
Exporting Histogram Data 3–106. . . . . . . . . . . . . . . . . . . . . . . . . . . . . . . . . . . . . . . . . .
Printing Histogram Data 3–107. . . . . . . . . . . . . . . . . . . . . . . . . . . . . . . . . . . . . . . . . . .
Histogram Window Shortcut Keys 3–108. . . . . . . . . . . . . . . . . . . . . . . . . . . . . . . . . . .
Appendix A: Specifications A–1. . . . . . . . . . . . . . . . . . . . . . . . . . . . . . . . . . .
Characteristic Tables A–1. . . . . . . . . . . . . . . . . . . . . . . . . . . . . . . . . . . . . . . . . . . . . .
TLA 704 Color Portable Mainframe Characteristics A–8. . . . . . . . . . . . . . . . . . . . . .
TLA 711 Color Benchtop Chassis Characteristics A–12. . . . . . . . . . . . . . . . . . . . . . . .
TLA 711 Color Benchtop Controller Characteristics A–15. . . . . . . . . . . . . . . . . . . . .
TLA 700 Series Logic Analyzer Module Characteristics A–17. . . . . . . . . . . . . . . . . .
TLA 700 Series Digitizing Oscilloscope Module Characteristics A–24. . . . . . . . . . . .
Appendix B: TLA 700 Symbol File Format B–1. . . . . . . . . . . . . . . . . . . . .
TSF Headers B–2. . . . . . . . . . . . . . . . . . . . . . . . . . . . . . . . . . . . . . . . . . . . . . . . . . . . .
TSF Pattern Symbols B–3. . . . . . . . . . . . . . . . . . . . . . . . . . . . . . . . . . . . . . . . . . . . . .
TSF Range Symbols B–4. . . . . . . . . . . . . . . . . . . . . . . . . . . . . . . . . . . . . . . . . . . . . . .
Appendix C: User Service C–1. . . . . . . . . . . . . . . . . . . . . . . . . . . . . . . . . . . .
General Care C–1. . . . . . . . . . . . . . . . . . . . . . . . . . . . . . . . . . . . . . . . . . . . . . . . . . . . .
Module Self Calibration C–1. . . . . . . . . . . . . . . . . . . . . . . . . . . . . . . . . . . . . . . . . . . .
Preventive Maintenance C–2. . . . . . . . . . . . . . . . . . . . . . . . . . . . . . . . . . . . . . . . . . . .
In Case of Problems C–4. . . . . . . . . . . . . . . . . . . . . . . . . . . . . . . . . . . . . . . . . . . . . . .
Repacking for Shipment C–4. . . . . . . . . . . . . . . . . . . . . . . . . . . . . . . . . . . . . . . . . . . .
Appendix D: Probe and Connector Information D–1. . . . . . . . . . . . . . . . .
P6417 Probe Information D–1. . . . . . . . . . . . . . . . . . . . . . . . . . . . . . . . . . . . . . . . . . .
P6434 Probe Information D–2. . . . . . . . . . . . . . . . . . . . . . . . . . . . . . . . . . . . . . . . . . .
Benchtop Mainframe Remote On/Standby Switch D–3. . . . . . . . . . . . . . . . . . . . . . .
Glossary Index
TLA 700 Series Logic Analyzer User Manual
iii

Table of Contents
List of Figures
Figure 1–1: Portable and benchtop mainframes 1–1. . . . . . . . . . . . . . . . .
Figure 1–2: On/Standby switch locations 1–2. . . . . . . . . . . . . . . . . . . . . . .
Figure 1–3: P6417 17-channel probe 1–4. . . . . . . . . . . . . . . . . . . . . . . . . . .
Figure 1–4: P6434 high-density probe connections 1–5. . . . . . . . . . . . . . .
Figure 1–5: Window usage control flow 1–6. . . . . . . . . . . . . . . . . . . . . . . .
Figure 1–6: System window 1–7. . . . . . . . . . . . . . . . . . . . . . . . . . . . . . . . . .
Figure 1–7: DSO Setup window 1–8. . . . . . . . . . . . . . . . . . . . . . . . . . . . . . .
Figure 1–8: LA Setup window 1–8. . . . . . . . . . . . . . . . . . . . . . . . . . . . . . . .
Figure 1–9: LA Trigger window 1–9. . . . . . . . . . . . . . . . . . . . . . . . . . . . . . .
Figure 1–10: Trigger library 1–10. . . . . . . . . . . . . . . . . . . . . . . . . . . . . . . . . .
Figure 1–11: DSO Trigger window 1–10. . . . . . . . . . . . . . . . . . . . . . . . . . . .
Figure 1–12: Listing window 1–11. . . . . . . . . . . . . . . . . . . . . . . . . . . . . . . . .
Figure 1–13: Waveform window 1–12. . . . . . . . . . . . . . . . . . . . . . . . . . . . . .
Figure 1–14: Histogram window 1–13. . . . . . . . . . . . . . . . . . . . . . . . . . . . . .
Figure 1–15: Source window 1–14. . . . . . . . . . . . . . . . . . . . . . . . . . . . . . . . .
Figure 1–16: Comparing regular and MagniVu data 1–15. . . . . . . . . . . . .
Figure 1–17: Save and Load operations in the File menu 1–16. . . . . . . . . .
Figure 1–18: Using a property sheet to customize the display 1–17. . . . . .
Figure 1–19: Portable mainframe front panel 1–18. . . . . . . . . . . . . . . . . . .
Figure 1–20: GlidePoint pad 1–18. . . . . . . . . . . . . . . . . . . . . . . . . . . . . . . . .
Figure 1–21: Locations of external connectors 1–19. . . . . . . . . . . . . . . . . . .
Figure 2–1: Acquiring a digital signal (LA module) 2–1. . . . . . . . . . . . . .
Figure 2–2: Acquiring an analog signal (DSO module) 2–2. . . . . . . . . . . .
Figure 2–3: Block diagram of the LA module acquisition and
storage 2–2. . . . . . . . . . . . . . . . . . . . . . . . . . . . . . . . . . . . . . . . . . . . . . . .
Figure 2–4: Block diagram of the DSO module acquisition and
storage 2–5. . . . . . . . . . . . . . . . . . . . . . . . . . . . . . . . . . . . . . . . . . . . . . . .
Figure 2–5: Logic analyzer physical model 2–6. . . . . . . . . . . . . . . . . . . . . .
Figure 2–6: Logic analyzer conceptual model 2–7. . . . . . . . . . . . . . . . . . .
Figure 2–7: Listing data 2–8. . . . . . . . . . . . . . . . . . . . . . . . . . . . . . . . . . . . .
Figure 2–8: Listing window with analog data 2–9. . . . . . . . . . . . . . . . . . . .
Figure 2–9: Listing data using a microprocessor support package 2–9. .
Figure 2–10: High-level source code 2–10. . . . . . . . . . . . . . . . . . . . . . . . . . .
Figure 2–11: Source code viewed as acquired data 2–11. . . . . . . . . . . . . . .
Figure 2–12: Waveform data 2–11. . . . . . . . . . . . . . . . . . . . . . . . . . . . . . . . .
Figure 2–13: Using the DSO module to capture a runt pulse 2–13. . . . . . .
iv
TLA 700 Series Logic Analyzer User Manual

Table of Contents
Figure 2–14: LA module sampling resolution 2–14. . . . . . . . . . . . . . . . . . . .
Figure 2–15: Aliasing 2–15. . . . . . . . . . . . . . . . . . . . . . . . . . . . . . . . . . . . . . . .
Figure 2–16: LA module triggering on a glitch 2–16. . . . . . . . . . . . . . . . . .
Figure 2–17: DSO module triggering on a glitch 2–17. . . . . . . . . . . . . . . . .
Figure 2–18: Viewing the performance of code with a Histogram
window 2–18. . . . . . . . . . . . . . . . . . . . . . . . . . . . . . . . . . . . . . . . . . . . . . . .
Figure 2–19: Using color to show memory differences in a Listing
window 2–19. . . . . . . . . . . . . . . . . . . . . . . . . . . . . . . . . . . . . . . . . . . . . . . .
Figure 2–20: Defining repetitive setups 2–20. . . . . . . . . . . . . . . . . . . . . . . . .
Figure 2–21: Using symbols in a trigger program 2–21. . . . . . . . . . . . . . . .
Figure 2–22: Waveforms using pattern symbols 2–23. . . . . . . . . . . . . . . . .
Figure 2–23: Listing data using range symbols 2–23. . . . . . . . . . . . . . . . . .
Figure 2–24: Symbols dialog box 2–24. . . . . . . . . . . . . . . . . . . . . . . . . . . . . .
Figure 2–25: Load Symbol Options dialog box 2–25. . . . . . . . . . . . . . . . . .
Figure 3–1: System window 3–1. . . . . . . . . . . . . . . . . . . . . . . . . . . . . . . . . .
Figure 3–2: Opening a Waveform window from the System window 3–2
Figure 3–3: The LA module Setup window 3–3. . . . . . . . . . . . . . . . . . . . .
Figure 3–4: Setup window with the QSTART support package 3–4. . . . .
Figure 3–5: Selecting channels for memory compare 3–5. . . . . . . . . . . . .
Figure 3–6: Enabling data compare 3–6. . . . . . . . . . . . . . . . . . . . . . . . . . .
Figure 3–7: Channel grouping table in the Setup window 3–10. . . . . . . . .
Figure 3–8: The Activity Indicators dialog box 3–11. . . . . . . . . . . . . . . . . .
Figure 3–9: Probe Thresholds dialog box 3–12. . . . . . . . . . . . . . . . . . . . . . .
Figure 3–10: LA module Trigger window 3–13. . . . . . . . . . . . . . . . . . . . . . .
Figure 3–11: Trigger window structure 3–14. . . . . . . . . . . . . . . . . . . . . . . . .
Figure 3–12: Overview portion of LA Trigger window 3–15. . . . . . . . . . . .
Figure 3–13: Trigger detail portion of LA Trigger window 3–15. . . . . . . .
Figure 3–14: Using trigger storage 3–23. . . . . . . . . . . . . . . . . . . . . . . . . . . .
Figure 3–15: DSO Setup window 3–25. . . . . . . . . . . . . . . . . . . . . . . . . . . . . .
Figure 3–16: DSO Setup window vertical input settings 3–27. . . . . . . . . . .
Figure 3–17: DSO Setup window Horizontal settings 3–28. . . . . . . . . . . . .
Figure 3–18: Signals property page 3–32. . . . . . . . . . . . . . . . . . . . . . . . . . . .
Figure 3–19: Merging modules 3–34. . . . . . . . . . . . . . . . . . . . . . . . . . . . . . . .
Figure 3–20: Logic analyzer conceptual model 3–35. . . . . . . . . . . . . . . . . .
Figure 3–21: Saving a system with data 3–36. . . . . . . . . . . . . . . . . . . . . . . .
Figure 3–22: Load System Options dialog box 3–37. . . . . . . . . . . . . . . . . . .
Figure 3–23: Saving a file in a personalized trigger library 3–38. . . . . . . .
Figure 3–24: Defining setups for Repetitive mode 3–43. . . . . . . . . . . . . . . .
TLA 700 Series Logic Analyzer User Manual
v

Table of Contents
Figure 3–25: The Status Monitor 3–43. . . . . . . . . . . . . . . . . . . . . . . . . . . . . .
Figure 3–26: The Listing and Waveform windows 3–47. . . . . . . . . . . . . . .
Figure 3–27: Opening a data window 3–48. . . . . . . . . . . . . . . . . . . . . . . . . .
Figure 3–28: New Data Window wizard 3–50. . . . . . . . . . . . . . . . . . . . . . . .
Figure 3–29: Waveform window 3–53. . . . . . . . . . . . . . . . . . . . . . . . . . . . . .
Figure 3–30: Waveform types 3–54. . . . . . . . . . . . . . . . . . . . . . . . . . . . . . . . .
Figure 3–31: Magnitude waveform 3–55. . . . . . . . . . . . . . . . . . . . . . . . . . . .
Figure 3–32: Range readouts 3–55. . . . . . . . . . . . . . . . . . . . . . . . . . . . . . . . .
Figure 3–33: Waveform window cursors and marks 3–56. . . . . . . . . . . . . .
Figure 3–34: Using the Go To dialog box to jump to the
system trigger 3–59. . . . . . . . . . . . . . . . . . . . . . . . . . . . . . . . . . . . . . . . . .
Figure 3–35: Using the Overview Mark bar to jump to a
data location 3–59. . . . . . . . . . . . . . . . . . . . . . . . . . . . . . . . . . . . . . . . . . .
Figure 3–36: Defining search criteria 3–61. . . . . . . . . . . . . . . . . . . . . . . . . .
Figure 3–37: Lock Windows dialog box 3–61. . . . . . . . . . . . . . . . . . . . . . . .
Figure 3–38: MagniVu data 3–62. . . . . . . . . . . . . . . . . . . . . . . . . . . . . . . . . .
Figure 3–39: Adding a MagniVu data source to a data window 3–63. . . . .
Figure 3–40: Selecting compare data colors in the Waveform
Window property page 3–64. . . . . . . . . . . . . . . . . . . . . . . . . . . . . . . . . . .
Figure 3–41: Viewing LA compare data in a Waveform window 3–65. . . .
Figure 3–42: Add Waveform dialog box 3–66. . . . . . . . . . . . . . . . . . . . . . . .
Figure 3–43: Waveform with a glitch 3–67. . . . . . . . . . . . . . . . . . . . . . . . . .
Figure 3–44: Property page 3–68. . . . . . . . . . . . . . . . . . . . . . . . . . . . . . . . . .
Figure 3–45: Listing window 3–71. . . . . . . . . . . . . . . . . . . . . . . . . . . . . . . . .
Figure 3–46: Listing window cursors and marks 3–72. . . . . . . . . . . . . . . . .
Figure 3–47: Using the Go To dialog box to jump to the
system trigger 3–74. . . . . . . . . . . . . . . . . . . . . . . . . . . . . . . . . . . . . . . . . .
Figure 3–48: Using the Overview Mark bar to jump to a
data location 3–74. . . . . . . . . . . . . . . . . . . . . . . . . . . . . . . . . . . . . . . . . . .
Figure 3–49: Selecting compare data colors in the Listing
Window property page 3–76. . . . . . . . . . . . . . . . . . . . . . . . . . . . . . . . . . .
Figure 3–50: Viewing LA compare data in a Listing window 3–77. . . . . . .
Figure 3–51: Defining search criteria 3–78. . . . . . . . . . . . . . . . . . . . . . . . . .
Figure 3–52: Lock Windows dialog box 3–79. . . . . . . . . . . . . . . . . . . . . . . .
Figure 3–53: Add Column dialog box 3–80. . . . . . . . . . . . . . . . . . . . . . . . . .
Figure 3–54: Export Data dialog box 3–82. . . . . . . . . . . . . . . . . . . . . . . . . .
Figure 3–55: Export Data Options dialog box 3–83. . . . . . . . . . . . . . . . . . .
Figure 3–56: Source window 3–87. . . . . . . . . . . . . . . . . . . . . . . . . . . . . . . . .
Figure 3–57: Source window cursors and marks 3–89. . . . . . . . . . . . . . . . .
vi
TLA 700 Series Logic Analyzer User Manual

Table of Contents
Figure 3–58: Using the Go To dialog box to jump to the
cursor location 3–91. . . . . . . . . . . . . . . . . . . . . . . . . . . . . . . . . . . . . . . . . .
Figure 3–59: Using the Overview Mark bar to jump to a
data location 3–91. . . . . . . . . . . . . . . . . . . . . . . . . . . . . . . . . . . . . . . . . . .
Figure 3–60: Source window controls 3–92. . . . . . . . . . . . . . . . . . . . . . . . . .
Figure 3–61: Defining source search criteria 3–96. . . . . . . . . . . . . . . . . . . .
Figure 3–62: Source Files property page 3–98. . . . . . . . . . . . . . . . . . . . . . . .
Figure 3–63: Histogram window 3–101. . . . . . . . . . . . . . . . . . . . . . . . . . . . . .
Figure 3–64: Selecting the data source for the Histogram window 3–102. .
Figure 3–65: Measuring events with the Histogram window 3–103. . . . . . .
Figure 3–66: Export Histogram dialog box 3–106. . . . . . . . . . . . . . . . . . . . .
Figure 3–67: ASCII histogram data file 3–107. . . . . . . . . . . . . . . . . . . . . . . .
Figure A–1: Front and side views of TLA 704 Color Portable
Mainframe A–11. . . . . . . . . . . . . . . . . . . . . . . . . . . . . . . . . . . . . . . . . . . . .
Figure A–2: Front view and side view of standard Benchtop chassis A–14
Figure A–3: Front view and side view of Benchtop chassis with
Rackmount Option A–14. . . . . . . . . . . . . . . . . . . . . . . . . . . . . . . . . . . . . .
Figure D–1: P6417 probe footprints D–1. . . . . . . . . . . . . . . . . . . . . . . . . . .
Figure D–2: P6417 probe podlet clearance D–1. . . . . . . . . . . . . . . . . . . . . .
Figure D–3: Connector used for remote On/Standby switch D–3. . . . . . .
TLA 700 Series Logic Analyzer User Manual
vii

Table of Contents
List of Tables
Table 2–1: Using symbols in logic analyzer windows 2–22. . . . . . . . . . . . .
Table 3–1: LA Trigger library 3–16. . . . . . . . . . . . . . . . . . . . . . . . . . . . . . . .
Table 3–2: Trigger events 3–20. . . . . . . . . . . . . . . . . . . . . . . . . . . . . . . . . . . .
Table 3–3: Trigger resources 3–21. . . . . . . . . . . . . . . . . . . . . . . . . . . . . . . . .
Table 3–4: Trigger actions 3–22. . . . . . . . . . . . . . . . . . . . . . . . . . . . . . . . . . .
Table 3–5: Menu shortcut keys 3–40. . . . . . . . . . . . . . . . . . . . . . . . . . . . . . .
Table 3–6: General purpose data window shortcut keys 3–51. . . . . . . . . .
Table 3–7: Waveform window cursor and mark summary 3–57. . . . . . . .
Table 3–8: Waveform window shortcut keys 3–70. . . . . . . . . . . . . . . . . . . .
Table 3–9: Listing window cursor and mark summary 3–72. . . . . . . . . . .
Table 3–10: Listing window shortcut keys 3–86. . . . . . . . . . . . . . . . . . . . . .
Table 3–11: Source window cursor and mark summary 3–89. . . . . . . . . .
Table 3–12: Source window shortcut keys 3–100. . . . . . . . . . . . . . . . . . . . . .
Table 3–13: Histogram window shortcut keys 3–108. . . . . . . . . . . . . . . . . . .
Table A–1: Atmospheric characteristics (mainframes and modules) A–2
Table A–2: Backplane interface (portable and benchtop
mainframes) A–3. . . . . . . . . . . . . . . . . . . . . . . . . . . . . . . . . . . . . . . . . . .
Table A–3: External signal interface (portable and benchtop
mainframes) A–5. . . . . . . . . . . . . . . . . . . . . . . . . . . . . . . . . . . . . . . . . . .
Table A–4: Certifications and compliances: TLA 704 Color Portable
Mainframe1 and TLA 711 Color Benchtop Mainframe1 A–7. . . . . .
Table A–5: Portable mainframe internal controller A–8. . . . . . . . . . . . . .
Table A–6: Portable mainframe display system A–8. . . . . . . . . . . . . . . . .
Table A–7: Portable mainframe front-panel interface A–9. . . . . . . . . . . .
Table A–8: Portable mainframe rear-panel interface A–9. . . . . . . . . . . . .
Table A–9: Portable mainframe AC power source A–10. . . . . . . . . . . . . . .
Table A–10: Portable mainframe secondary power A–10. . . . . . . . . . . . . . .
Table A–11: Portable mainframe cooling A–11. . . . . . . . . . . . . . . . . . . . . . .
Table A–12: Portable mainframe mechanical A–11. . . . . . . . . . . . . . . . . . .
Table A–13: Benchtop chassis AC power source A–12. . . . . . . . . . . . . . . . .
Table A–14: Benchtop chassis secondary power A–12. . . . . . . . . . . . . . . . .
Table A–15: Benchtop chassis cooling A–13. . . . . . . . . . . . . . . . . . . . . . . . .
Table A–16: Benchtop chassis mechanical A–13. . . . . . . . . . . . . . . . . . . . . .
Table A–17: Benchtop controller characteristics A–15. . . . . . . . . . . . . . . .
Table A–18: Benchtop controller mechanical characteristics A–16. . . . . .
Table A–19: LA module channel width and depth A–17. . . . . . . . . . . . . . .
viii
TLA 700 Series Logic Analyzer User Manual

Table of Contents
Table A–20: LA module clocking A–17. . . . . . . . . . . . . . . . . . . . . . . . . . . . .
Table A–21: LA module trigger system A–19. . . . . . . . . . . . . . . . . . . . . . . .
Table A–22: LA module input parameters (with P6417 Probe) A–21. . . . .
Table A–23: LA module MagniVu feature A–21. . . . . . . . . . . . . . . . . . . . . .
Table A–24: Merged LA modules A–22. . . . . . . . . . . . . . . . . . . . . . . . . . . . .
Table A–25: LA module data handling A–22. . . . . . . . . . . . . . . . . . . . . . . .
Table A–26: LA module mechanical A–23. . . . . . . . . . . . . . . . . . . . . . . . . . .
Table A–27: DSO module signal acquisition system A–24. . . . . . . . . . . . . .
Table A–28: DSO module timebase system A–27. . . . . . . . . . . . . . . . . . . . .
Table A–29: DSO module trigger system A–27. . . . . . . . . . . . . . . . . . . . . . .
Table A–30: DSO module front-panel connectors A–29. . . . . . . . . . . . . . . .
Table A–31: DSO module certifications and compliances A–29. . . . . . . . .
Table A–32: DSO module mechanical A–30. . . . . . . . . . . . . . . . . . . . . . . . .
TLA 700 Series Logic Analyzer User Manual
ix

Table of Contents
x
TLA 700 Series Logic Analyzer User Manual

General Safety Summary
Review the following safety precautions to avoid injury and prevent damage to
this product or any products connected to it. To avoid potential hazards, use this
product only as specified.
Only qualified personnel should perform service procedures.
To Avoid Fire or
Personal Injury
Use Proper Power Cord. Use only the power cord specified for this product and
certified for the country of use.
Connect and Disconnect Properly . Do not connect or disconnect probes or test
leads while they are connected to a voltage source.
Ground the Product. This product is grounded through the grounding conductor
of the power cord. To avoid electric shock, the grounding conductor must be
connected to earth ground. Before making connections to the input or output
terminals of the product, ensure that the product is properly grounded.
Observe All Terminal Ratings. To avoid fire or shock hazard, observe all ratings
and marking on the product. Consult the product manual for further ratings
information before making connections to the product.
The common terminal is at ground potential. Do not connect the common
terminal to elevated voltages.
Do not apply a potential to any terminal, including the common terminal, that
exceeds the maximum rating of that terminal.
Use Proper AC Adapter. Use only the AC adapter specified for this product.
Do Not Operate Without Covers. Do not operate this product with covers or panels
removed.
Use Proper Fuse. Use only the fuse type and rating specified for this product.
Avoid Exposed Circuitry. Do not touch exposed connections and components
when power is present.
Do Not Operate With Suspected Failures. If you suspect there is damage to this
product, have it inspected by qualified service personnel.
Do Not Operate in Wet/Damp Conditions.
Do Not Operate in an Explosive Atmosphere.
Keep Product Surfaces Clean and Dry .
Provide Proper Ventilation. Refer to the manual’s installation instructions for
details on installing the product so it has proper ventilation.
TLA 700 Series Logic Analyzer User Manual
xi
General Safety Summary
Symbols and Terms
T erms in this Manual. These terms may appear in this manual:
WARNING. Warning statements identify conditions or practices that could result
in injury or loss of life.
CAUTION. Caution statements identify conditions or practices that could result in
damage to this product or other property.
T erms on the Product. These terms may appear on the product:
DANGER indicates an injury hazard immediately accessible as you read the
marking.
WARNING indicates an injury hazard not immediately accessible as you read the
marking.
CAUTION indicates a hazard to property including the product.
Symbols on the Product. The following symbols may appear on the product:
WARNING
High Voltage
Protective Ground
(Earth) T erminal
CAUTION
Refer to Manual
Double
Insulated
xii
TLA 700 Series Logic Analyzer User Manual

Preface
This manual contains operating information for the TLA 700 Series Logic
Analyzer. The manual consists of the following sections:
H Chapter 1: Getting Started. Provides basic information about using the logic
analyzer.
H Chapter 2: Operating Basics. Describes some logic analyzer concepts.
H Chapter 3: Reference. Describes how to configure and operate the logic
analyzer.
H Appendix A: Specifications. Lists the environmental, physical, and electrical
properties of the logic analyzer and LA module probes.
H Appendix B: TLA 700 Symbol File Format. Provides information on the
contents of symbol files using the TLA 700 Symbol File format.
H Appendix C: User Service. Provides user service information.
H Appendix D: Probe and Connector Information. Provides logic analyzer
probe and connector information.
Related Documentation
In addition to this user manual, the following documentation is available for your
TLA 700 Series Logic Analyzer:
H The TLA 700 Series Logic Analyzer Installation Manual provides installa-
tion information for the TLA 700 Series Logic Analyzer.
H The online help provides information about the TLA 700 Series user
interface and the TLA 700 Programmatic Interface (TPI). To view the online
help, select Help Topics from the Help menu.
H The online release notes provide last-minute product and software informa-
tion not included in this manual. Refer to Release Notes on page 1–21 for
information on viewing the release notes.
H A series of microprocessor support instruction manuals provide operating
and service instructions for the individual microprocessor support packages.
H The TLA 700 Series TLA 7QS QuickStart Training Manual provides training
exercises to help you learn key features of the TLA 700 Series Logic
Analyzer. The training manual is designed to be used with the TLA 7QS
QuickStart training board.
TLA 700 Series Logic Analyzer User Manual
xiii

Preface
H The TLA 700 Series TLA 7QS QuickStart Technical Reference Manual
provides technical and service information for the TLA 7QS QuickStart
training board.
H The TLA 700 Series Performance Verification and Adjustment Technical
Reference Manual provides performance verification and adjustment
procedures for the major components of the TLA 700 Series Logic Analyzer.
The manual includes the performance verification and adjustment software.
H The TLA 711 Color Benchtop Chassis Service Manual provides board-level
service information for the benchtop chassis.
H The TLA 711 Color Benchtop Controller Service Manual provides board-
level service information for the benchtop mainframe controller module.
H The TLA 704 Color Portable Mainframe Service Manual provides board-
level service information for the portable mainframe.
H The TLA 700 Series Logic Analyzer Modules TLA 7Lx and TLA 7Mx Service
Manual provides board-level service information for the LA modules.
H The TLA 700 Series DSO Modules TLA 7Dx and TLA 7Ex Service Manual
provides board-level service information for the DSO modules.
H The P6434 Mass Termination Probe Instructions provides instructions for
using the P6434 probes.
xiv
TLA 700 Series Logic Analyzer User Manual

Contacting Tektronix
Preface
Product
Support
Service
Support
For other
information
To write us Tektronix, Inc.
For application-oriented questions about a Tektronix measurement product, call toll free in North America:
1-800-TEK-WIDE (1-800-835-9433 ext. 2400)
6:00 a.m. – 5:00 p.m. Pacific time
Or, contact us by e-mail:
tm_app_supp@tek.com
For product support outside of North America, contact your
local Tektronix distributor or sales office.
Contact your local Tektronix distributor or sales office. Or, visit
our web site for a listing of worldwide service locations.
http://www.tek.com
In North America:
1-800-TEK-WIDE (1-800-835-9433)
An operator will direct your call.
P.O. Box 1000
Wilsonville, OR 97070-1000
U.S.A.
TLA 700 Series Logic Analyzer User Manual
xv

Preface
xvi
TLA 700 Series Logic Analyzer User Manual

Getting Started

Getting Started
Product Description
This chapter provides basic information about using the logic analyzer. There is
information about the physical instrument and introductory information about
how to operate it. Once you have a basic grasp of this information, proceed to
the next chapter, Operating Basics, for a conceptual model of how the logic
analyzer works.
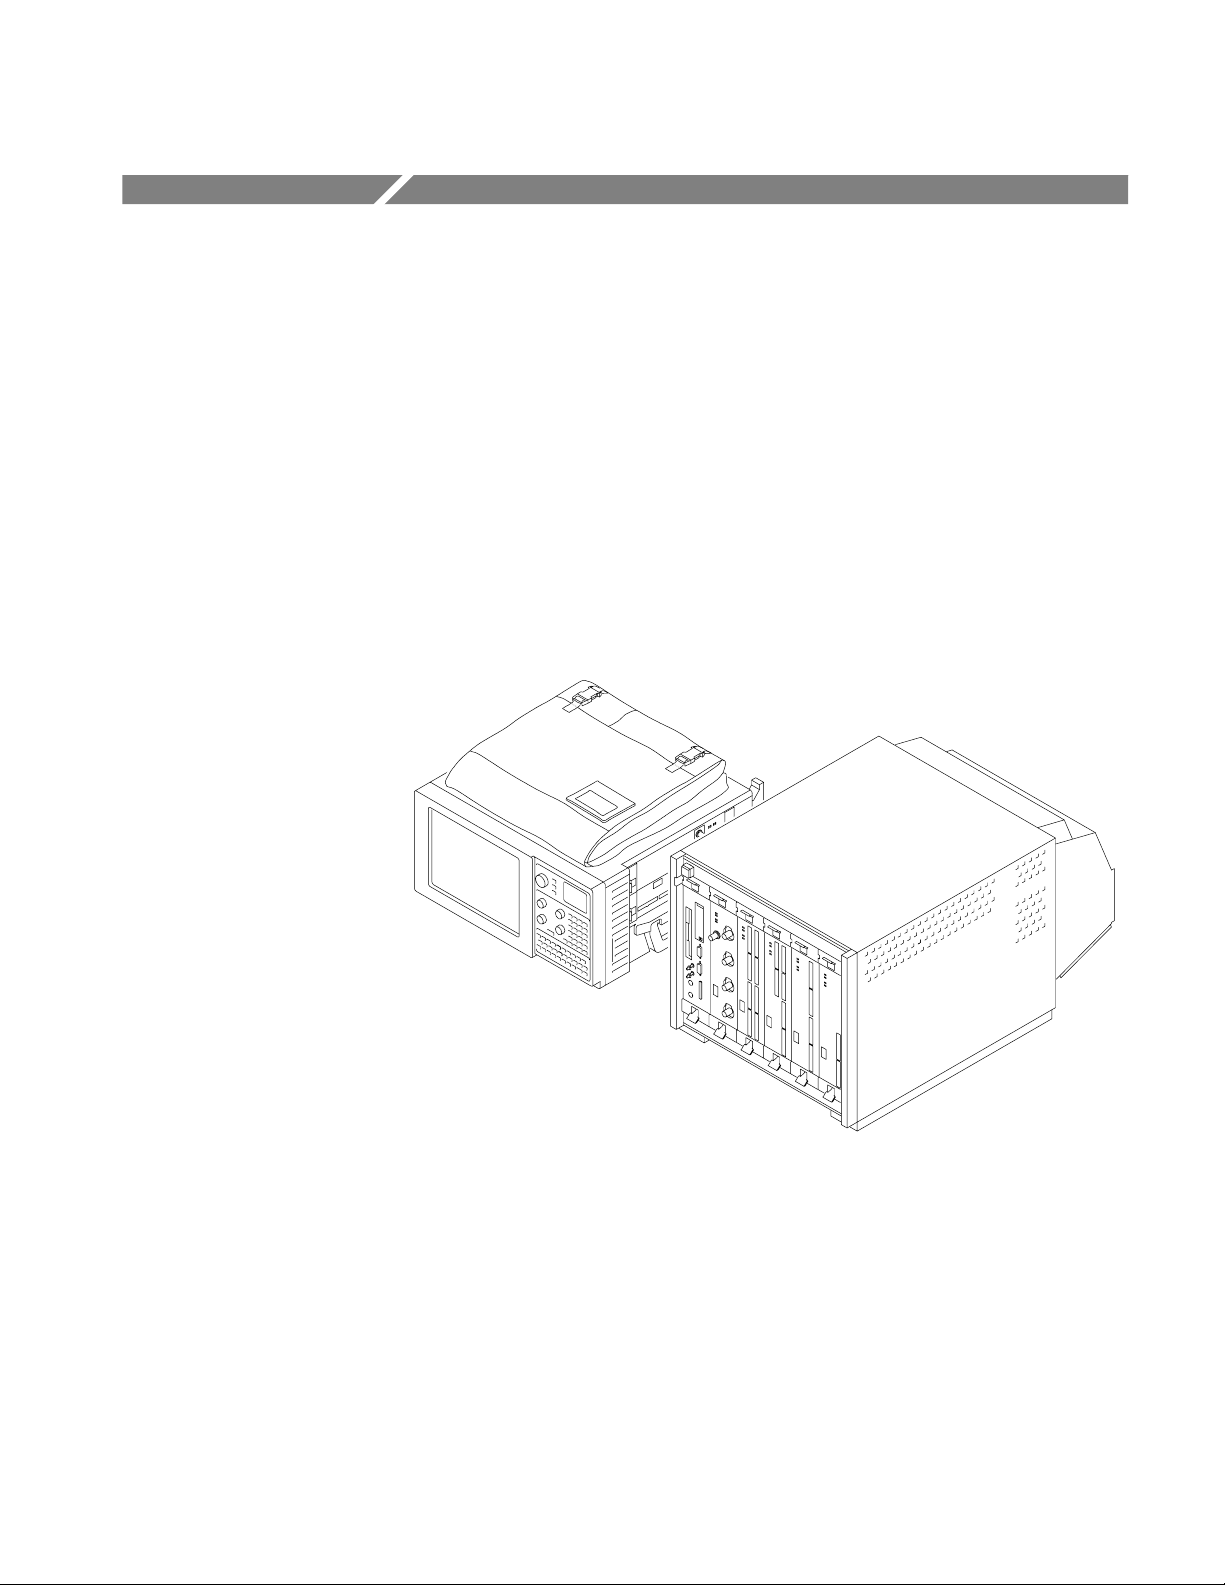
The TLA 700 Series Logic Analyzer is a configurable instrument that combines
a high-performance logic analyzer with a digitizing storage oscilloscope. There
are two mainframe styles, portable and benchtop, as shown in Figure 1–1.
Figure 1–1: Portable and benchtop mainframes
Several logic analyzer (LA) modules are available, in various combinations of
channel width and memory depth. All provide simultaneous state and timing
measurements through a single probe.
The LA module implements a feature called MagniVu, an acquisition technology
that enables each of the LA modules to offer 500 picosecond timing resolution
on all channels. MagniVu data is always available for all channels and requires
no additional probing.
TLA 700 Series Logic Analyzer User Manual
1–1

Getting Started
The digitizing storage oscilloscope (DSO) module incorporates digital real-time
signal acquisition. DSO module data is tightly correlated with data from other
modules, for displays and for intermodule triggering and signalling.
The user interface is built on the familiar Windows 95 operating system. In
addition to using an interface you probably already know, this means that you
can install any PC-compatible, third-party hardware and software on the
instrument.
Installation
Installation information for the TLA 700 Series mainframe, modules, and
software is located in the TLA 700 Series Logic Analyzer Installation Manual.
Powering On the Logic Analyzer
Power on the logic analyzer as follows:
1. Press the On/Standby switch to power on the logic analyzer (see Figure 1–2
for the switch location).
2. Wait for the logic analyzer to complete power-on self-tests, start Windows,
and start the TLA 700 application.
Figure 1–2: On/Standby switch locations
1–2
TLA 700 Series Logic Analyzer User Manual
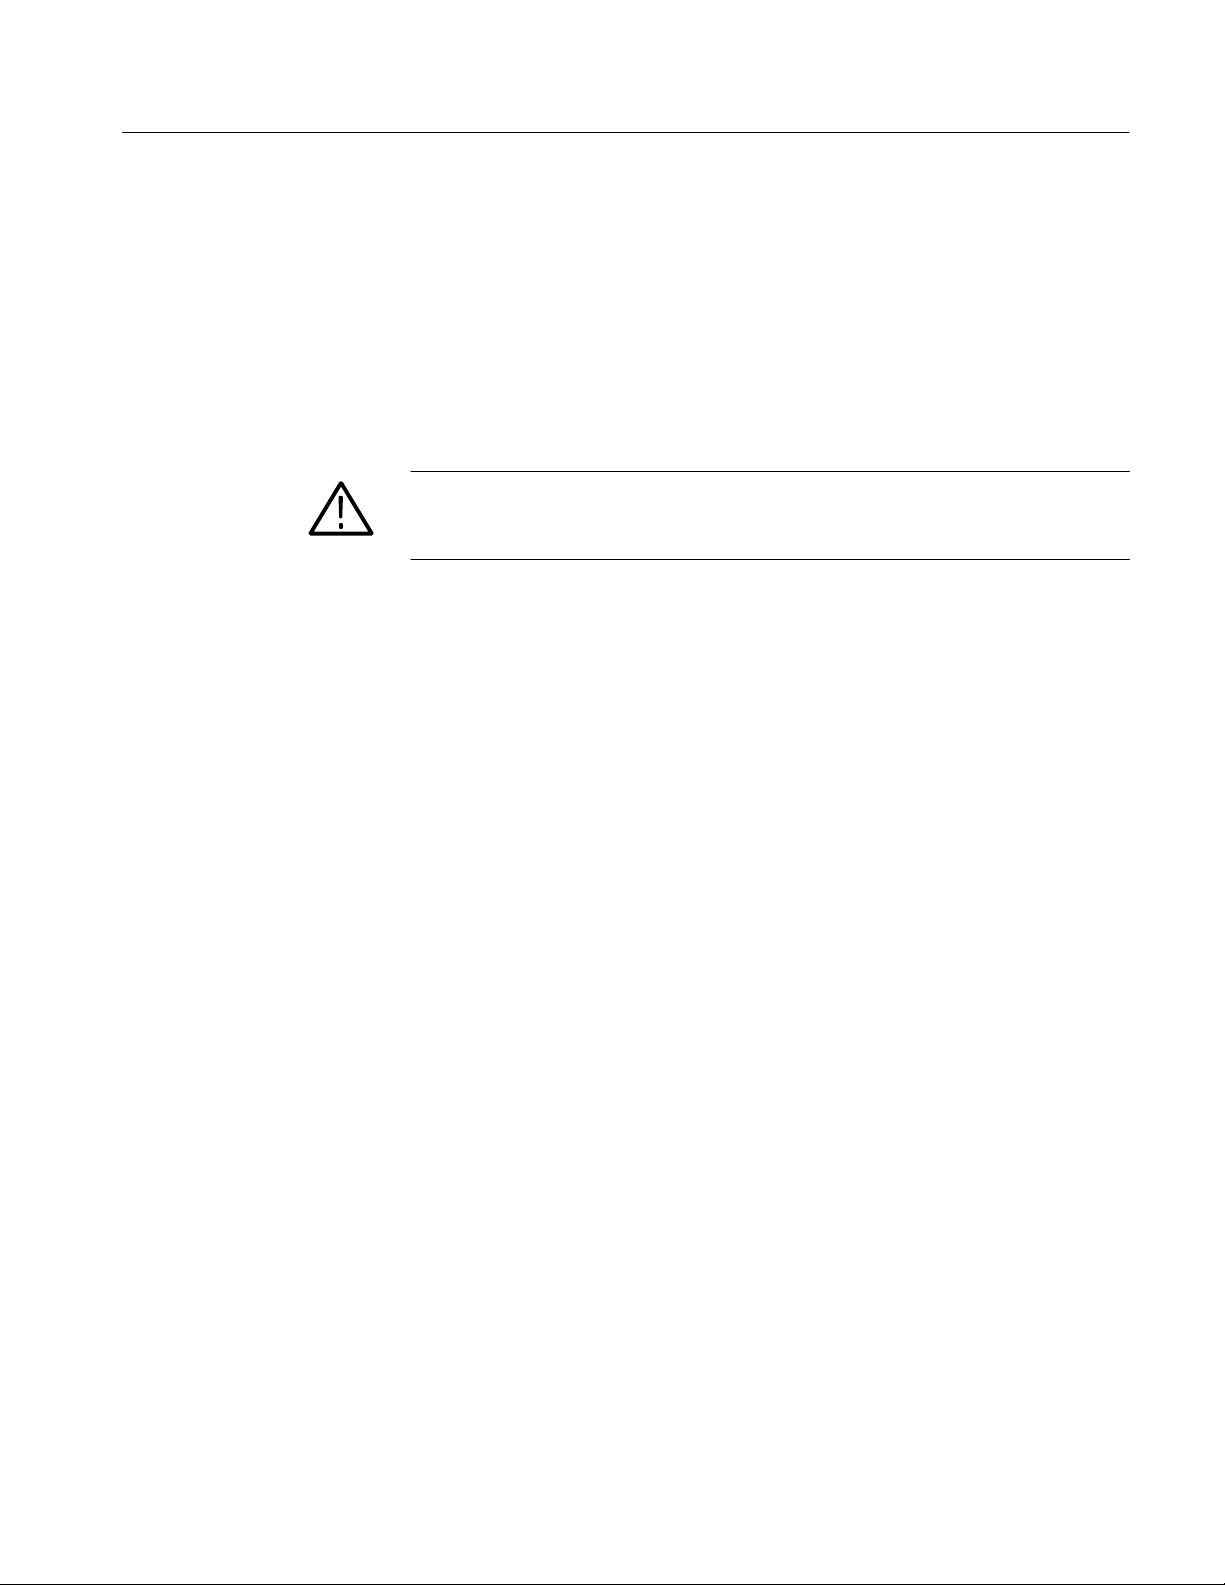
Powering Off the Logic Analyzer
The portable mainframe has a built-in soft power-off function that safely powers
off the mainframe when you press the On/Standby switch. If you have the
benchtop mainframe, you must power off the mainframe using the Windows 95
shutdown process before depressing the On/Standby switch.
You can set the shutdown mode in the Mainframe Utilities tool in the Windows 95 control panel.
CAUTION. When powering off the benchtop mainframe, use the Windows 95 shut
down procedure. Powering down the benchtop mainframe prematurely can
corrupt the software on the hard disk.
Connecting Probes to the Target System
Getting Started
General Purpose
Connections
The logic analyzer connects to the target system through probes. The LA probes
allow you to connect to the target system in several different ways as shown in
the following illustrations. You can use the color-coded probe channels to map
the hardware connections to the channel settings in the LA Setup window. Each
LA probe group consists of eight channels that can be individually named in the
LA Setup menu.
Connect the probes to the logic analyzer by matching the color-coded label to the
label on the LA module. To provide a secure connection to the LA module, you
can optionally use the probe retainer bracket with the probe connector.
The P6417 probes provide a means to connect to the target system for most
applications. Figure 1–3 shows different ways to connect the probe to the target
system.
Note the location of the ground connections for the probe:
H The individual podlets have the ground (GND) engraved on the podlet.
H When you use the 8-channel leadsets, the ground lead is a single black
connector. Make sure you connect the ground side of the 8-channel lead set
to the ground side of the 8-channel podlet holder.
Refer to Appendix D: Probe and Connector Information for information on
dimensions for the P6417 probes.
TLA 700 Series Logic Analyzer User Manual
1–3

Getting Started
1–4
Figure 1–3: P6417 17-channel probe
TLA 700 Series Logic Analyzer User Manual

Getting Started
High-Density Probe
Connections
The P6434 Mass Termination Probe allows you to connect 34 LA channels to a
microprocessor probe adapter or directly to the target system. To connect to the
target system directly, you must include compatible Mictor connectors in your
circuit board design.
Figure 1–4 shows two ways of connecting the LA module to a target system. For
more information on the P6434 Mass Termination Probe and how to connect it to
your target system, refer to the P6434 Mass Termination Probe Instructions.
Figure 1–4: P6434 high-density probe connections
Microprocessor
Connections
TLA 700 Series Logic Analyzer User Manual
Both the P6417 and the P6434 probes can be connected to microprocessor
adapters. Refer to the documentation that comes with your microprocessor
disassembler package for details about connecting the probes to the microprocessor adapters and to the target system.
1–5
Getting Started
Approaching the Windows
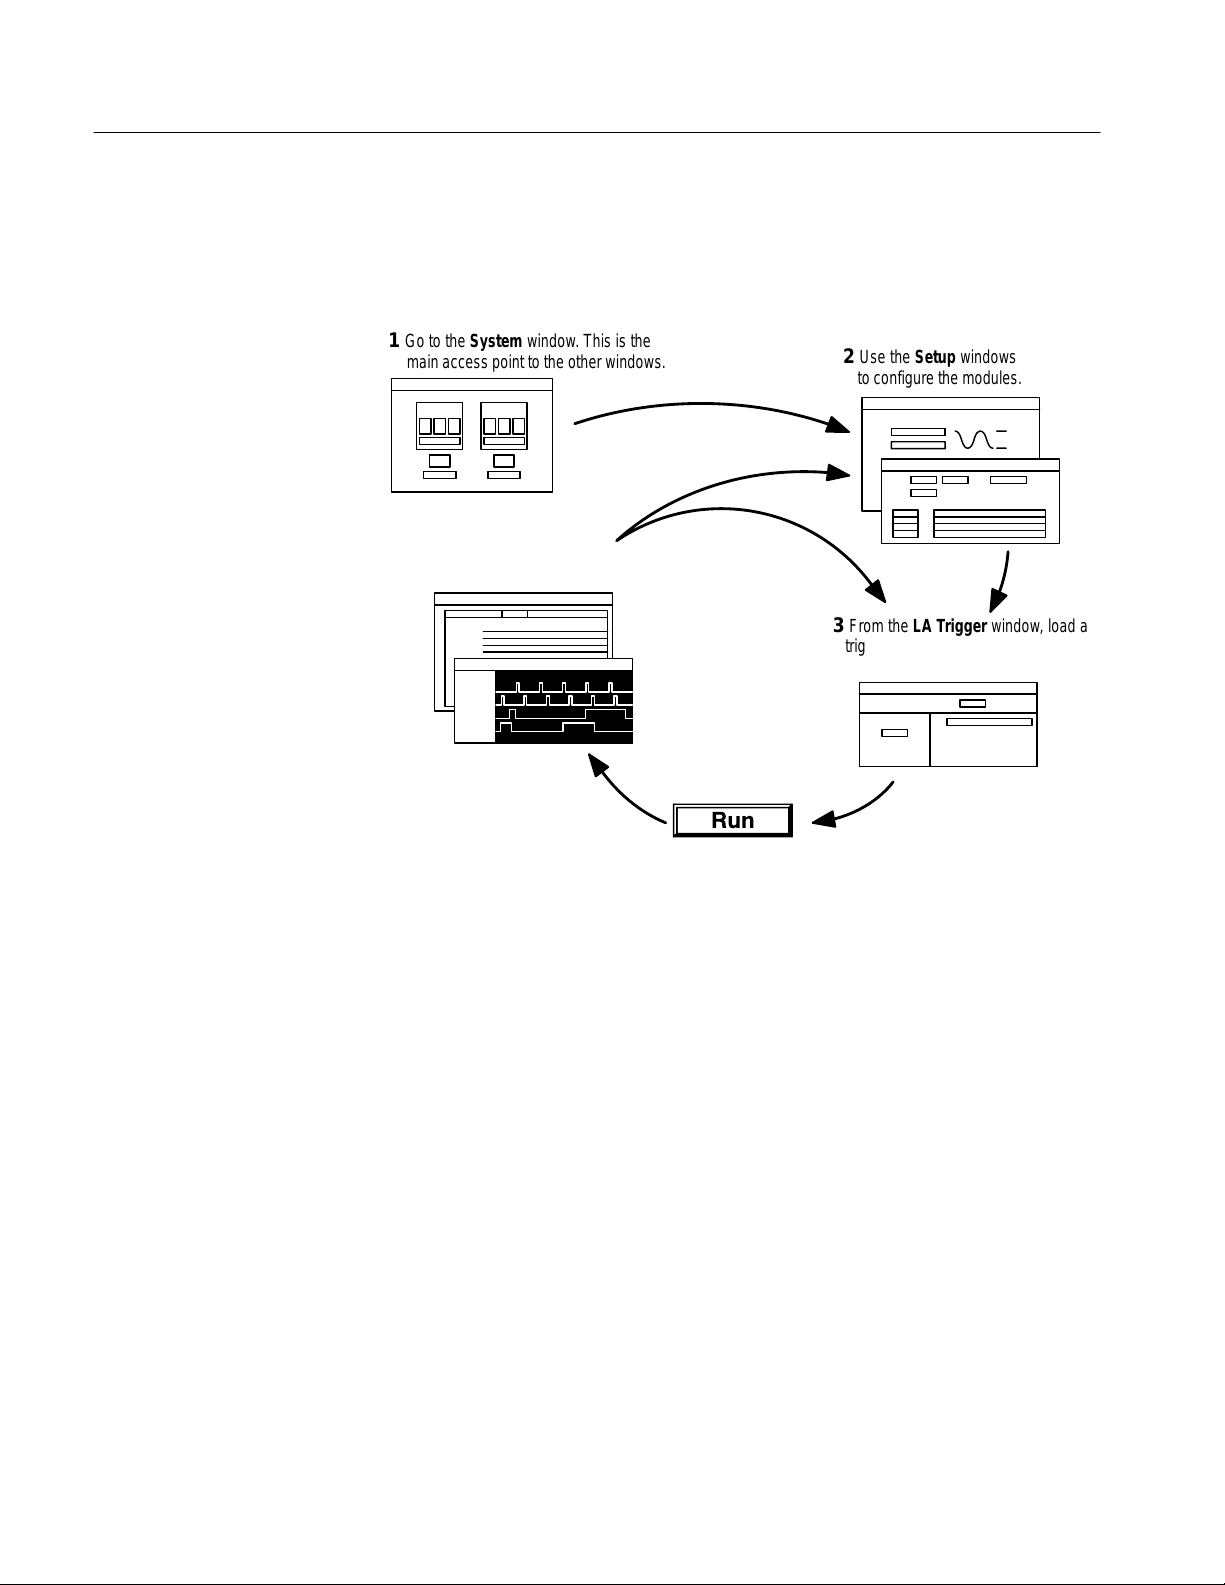
Typically, you use the windows in this application as shown in Figure 1–5.
1 Go to the System window. This is the
main access point to the other windows.
5 View data in the data
windows.
4 Click the Run toolbar
button to acquire data.
Figure 1–5: Window usage control flow
2 Use the Setup windows
to configure the modules.
3 From the LA Trigger window, load a
trigger program from the library and
customize it for your application.
1–6
TLA 700 Series Logic Analyzer User Manual

Getting Started
System Window
The System window is your point-of-entry into the logic analyzer, and functions
as the overall control center.
You can perform the following functions from the System window:
H Open module and data windows by clicking their buttons. To select a module
without opening its windows, click inside the icon (but not on its buttons).
H Create new data windows through the New Data Window wizard. You can
create Histogram windows for performance analysis operations and Source
windows to track the execution of source code. You can also create
additional Listing and Waveform windows.
H Use the System window for an overview of how the modules and data
windows relate to one another. Relationships between modules (if any) are
always shown; to view which modules are associated with a data window,
you must select the module icon.
H View which modules provide data to each window by clicking the window
name.
H Enable and disable modules by clicking their On/Off buttons.
H Save and load files containing setup, trigger, and data information, by means
of selections from the File menu.
Figure 1–6: System window
TLA 700 Series Logic Analyzer User Manual
1–7

Getting Started
Setup Windows
Before you acquire and display data, you must first configure the modules using
the module Setup windows. Each module has its own Setup and Trigger
window; each is set up individually. Generally, you should configure the Setup
windows before the Trigger windows, because some of the Setup window
settings affect Trigger window selections.
Figure 1–7: DSO Setup window
Figure 1–8: LA Setup window
1–8
TLA 700 Series Logic Analyzer User Manual

Getting Started
Trigger Windows
Both modules have their own Trigger windows. The primary purposes of the
Trigger windows are to specify the trigger conditions.
LA Trigger Window. The LA Trigger window is the heart of the logic analyzer.
You can use the Trigger window to define the conditions when the logic analyzer
acquires and stores data. See Figure 1–9.
Figure 1–9: LA Trigger window
You can define simple or complex trigger programs one step at a time to
determine how the logic analyzer finds the data you are interested in.
TLA 700 Series Logic Analyzer User Manual
1–9

Getting Started
Another common method for setting up a trigger program is to load a trigger
program from the trigger library (see Figure 1–10). You can then alter the trigger
program details as necessary.
Figure 1–10: Trigger library
DSO Trigger Window. The DSO Trigger window lets you define how to trigger the
DSO on analog and digital signals.
1–10
Figure 1–11: DSO Trigger window
TLA 700 Series Logic Analyzer User Manual

Getting Started
Data Windows
You can use data windows to display and analyze acquired data from the LA or
DSO modules. The most common data windows are the Listing windows and
Waveform windows. These are the two default windows for a logic analyzer with
a DSO module and a LA module installed.
To display and evaluate complex logic analyzer data, you can create other types
of data windows using the New Data Window wizard (such as the Histogram
window and the Source window). Refer to Creating a New data Window
beginning on page 3–50 for information on creating data windows.
You can have as many data windows as you want to display different data or
different views of the same data.
Listing Windows. Listing windows (see Figure 1–12) display LA data in lists or
columns.
Figure 1–12: Listing window
You can perform the following functions in Listing windows:
H Place user marks to flag specific data samples for evaluation.
H Use the scroll bars to move through the data or jump to a specific point in
the data by clicking the Go To toolbar button and selecting a mark.
H Search for a data event by clicking the Define Search button in the toolbar.
H Move columns by clicking on their labels to select them, and then dragging
them to a new location.
H Add columns by clicking the Add Column toolbar button.
TLA 700 Series Logic Analyzer User Manual
1–11

Getting Started
H Split the window into two panes for viewing data that is offscreen.
Waveform WIndows. Waveform windows (see Figure 1–13) display DSO or LA
waveform data.
Figure 1–13: Waveform window
You can perform the following functions in Waveform windows:
H Use the cursors to take time or voltage measurements.
H Place user marks to flag specific data samples for evaluation.
H Use the scroll bars to move through the data, or jump to a specific point in
the data by clicking the Go To toolbar button and selecting a mark.
H Search for a data event by clicking the Define Search button in the toolbar.
H Move waveforms by clicking on their labels to select them, and then
dragging them to a new location.
H Add waveforms by clicking the Add Waveform toolbar button.
H Split the window into two panes for viewing data that is offscreen.
H View collections of LA module waveforms as busforms.
H View the value of a LA module waveform group versus time using magni-
tude mode.
1–12
TLA 700 Series Logic Analyzer User Manual

Getting Started
Histogram Window. Histogram windows (see Figure 1–14) display LA data as
histograms. You use Histogram windows to evaluate the performance of
software; this is also known as performance analysis.
Figure 1–14: Histogram window
You can perform the following functions in Histogram windows:
H Use the scroll bars to move through the data.
H Sort histogram data by ranges, counts, or percentages.
H Change the magnification of histogram bars to view the data in greater
detail.
H Split the window into two panes for viewing data that is off screen.
H View various statistics on the acquired data.
TLA 700 Series Logic Analyzer User Manual
1–13

Getting Started
Source Windows. Source windows (see Figure 1–15) display source data. You
can track the execution of source code based on the data displayed in a Listing
window.
Figure 1–15: Source window
You can perform the following functions in Source windows:
H Step through source code statements.
H Turn source code line numbers on or off.
H Place user marks to flag specific data samples for evaluation.
H Use the scroll bars to move through the data, or jump to a specific point in
the data by clicking the Go To toolbar button and selecting a mark.
H Search for source code statements by clicking the Define Search button in
the toolbar.
H Determine whether there is any acquired data for the corresponding source
file displayed in the Source window.
1–14
TLA 700 Series Logic Analyzer User Manual

Getting Started
MagniVu Data
The LA modules have MagniVu data acquisition as a standard feature. MagniVu
acquisition offers 500 picosecond high-resolution timing simultaneous with
200 MHz state on all channels through the same probes; no double-probing is
required. The example shown in Figure 1–16 shows regular data and MagniVu
data for the same channels. You can easily add MagniVu data with the Add
Waveform toolbar button.
Saving and Loading
Setups and Data
Figure 1–16: Comparing regular and MagniVu data
Once you set up the logic analyzer to your satisfaction you will probably want to
save the setup for future use. You can save setup information in two ways, as a
saved system file or as a saved module file.
Saved system files contain setup and trigger information for each module as well
as system level information (such as repetitive properties) and data windows for
the logic analyzer. Saved module files contain setup and trigger information for
only the module specified. In both cases you have the option of saving acquired
data with the files.
Execute Save and Load operations from the File menu. For module Save or Load
operations, you must first go to the module Setup or Trigger window.
Save the setups and data in a folder where you can easily retrieve them. For
example, you may want to save the data in the My Documents folder or within a
folder of your own choosing. You should not save the data in a location that may
be difficult to find or in a location (such as the Windows System folder) that may
cause problems with your operating system.
TLA 700 Series Logic Analyzer User Manual
1–15

Getting Started
Avoid using file name extensions other than the default ones supplied by the
system. The logic analyzer may not recognize saved setups with nonstandard file
name extensions.
Saved system and module files both contain trigger program information. When
you load a trigger from the LA Trigger window, you can select a saved system or
module file as the source. When you do so, the logic analyzer extracts only the
trigger information from the file and loads it to the module.
Customizing the Display
Figure 1–17: Save and Load operations in the File menu
You can customize your data windows. Using property sheets, you can control
data window display parameters. Also, many screen elements, such as waveforms, columns, and marks, have their own property sheets.
Open data window property sheets by clicking the Properties toolbar button in
the data window. Open screen element property sheets by double-clicking on the
element or its label.
1–16
TLA 700 Series Logic Analyzer User Manual

Getting Started
Programmatic Control
Backing Up User Files
Figure 1–18: Using a property sheet to customize the display
In addition to controlling the logic analyzer from the user interface, you can use
the TLA 700 Programmatic Interface (TPI) to control the logic analyzer from a
separate program running on the logic analyzer or on a remote host. Information
for using TPI is included as part of the TLA 700 online help. An online TPI user
manual (available in PDF format) can be printed from the logic analyzer.
You should back up your user files on a regular basis. Use the Windows Back Up
tool to back up files stored on the hard disk. The Back Up tool is located in the
System Tools folder in the Accessories folder. Start the tool and determine which
files and folders you want to back up. Use the Windows online help for
information on using the Back Up tool.
In particular, you should frequently back up your user-generated files. For the
logic analyzer, the user-generated files consist of saved system and module files,
which have a .tla file name extension.
TLA 700 Series Logic Analyzer User Manual
1–17

Getting Started
Portable Mainframe Front Panel Controls
The portable version of the mainframe has front panel controls which you can
operate the logic analyzer without the mouse or keyboard.
Keys
Changes the value in a selected
box (such as sample rate or
memory depth). With a cursor
selected, the knob controls cursor
position. Does not scroll data.
Scrolls data vertically.
Changes the height of
selected waveform
(Waveform window only).
Moves the display pointer
and selects objects. See
GlidePoint Pad for more
information.
Scrolls data horizontally.
Changes Time/Div in
the Waveform window.
Figure 1–19: Portable mainframe front panel
For the portable mainframe, you can use the front panel keys as an alternative to
the detachable keyboard. Most keys and key combinations are available via the
front panel.
For key combinations, it is not necessary to hold down more than one key at a
time. For example, you can press SHIFT in the hexadecimal keypad, and then
press a QWERTY key to accomplish a Shift+key combination. The same is true
for other key combinations, such as CTRL and ALT keys.
1–18
GlidePoint Pad
For the portable mainframe, you can use the GlidePoint pad as an alternative to
the mouse. To move the pointer, slide your finger lightly over the surface of the
pad. Tap the surface to simulate a click of the left mouse button, or use the
control buttons to select the type of operation.
Figure 1–20: GlidePoint pad
TLA 700 Series Logic Analyzer User Manual

Getting Started
External Connectors
The mainframe external connectors are shown in Figure 1–21. The following
connections are available:
H System Trigger In and System Trigger Out, used to receive or send a trigger
from/to an external source.
H External Signal In and External Signal Out, used to receive or send a signal
from/to an external source.
H Accessory connections.
For information about the accessory connections, refer to the TLA 700 Series
Logic Analyzer Installation Manual.
PCMCIA
PC cards (2)
SYSTEM TRIG IN
SYSTEM TRIG OUT
EXTERNAL SIG IN
EXTERNAL SIG OUT
SVGA OUT port
COM port
LPT printer port
Portable mainframe (rear view)
PCMCIA
SYSTEM TRIG IN
SYSTEM TRIG OUT
EXTERNAL SIG IN
EXTERNAL SIG OUT
PC cards (2)
SVGA OUT port
COM port
LPT printer port
Benchtop mainframe (front view)
Figure 1–21: Locations of external connectors
TLA 700 Series Logic Analyzer User Manual
1–19

Getting Started
For Further Information
In addition to the information in this manual, you may want to refer to other
documentation for this TLA 700 Series Logic Analyzer.
Online Help
The online help gives detailed information about the logic analyzer and its
modules. Look in the online help for details about user interface selections that
are not described in this manual. The online help also has basic operating
information for microprocessor support products.
To access online help, go to the Help menu, or click the toolbar buttons shown:
Click for Topic help.
Click for What’s This? help on selected object.
Help T opics. Help topics tell you how to perform tasks and describe software
features and selections shown on the screen. There are two types of help topics,
overview topics and task topics.
Overview topics describe application features, such as windows. Overview topics
may also describe concepts. Overview topics are available through the Help
menu and through Help buttons in dialog boxes. From the Help menu, click Help
Topics, and locate the topic using the Contents or Index tab. The Help on
Window selection in the Help menu provides overview help for the currently-selected window.
1–20
Task topics provide procedure information about how to perform specific tasks.
Task topics are available through the Help menu. From the Help menu, click
Help Topics, and locate the topic using the Contents or Index tab.
What’s This? Help. What’s This? help provides a short description of the control
or screen feature selected. First click the What’s This? button on the toolbar, and
then click the item of interest. For further information about the item, go to the
Topic help.
TPI Online Help. Select Help on TPI from the drop-down help menu for
information on using the TLA 700 Programmatic Interface. You can also print
hard copies of the TPI help from a PDF file.
TLA 700 Series Logic Analyzer User Manual

Getting Started
Windows 95 Online Help. Information about Windows features is available
through the Windows help system. Access Windows help as you would with any
Windows application:
1. Go to the Windows 95 toolbar and click Start.
2. Select Help.
Release Notes
Additional Related
Documentation
The online Release Notes contain information about this release of the logic
analyzer application. Check the Release Notes for information such as software
compatibility and software version differences from last release.
To access the Release Notes, follow these steps:
1. Go to the Windows 95 toolbar and click Start.
2. Select Programs → Tektronix TLA 700 → TLA 700 Release Notes.
Refer to Related Documentation on page xiii for a list of documentation for your
TLA 700 Series Logic Analyzer.
TLA 700 Series Logic Analyzer User Manual
1–21

Getting Started
1–22
TLA 700 Series Logic Analyzer User Manual

Operating Basics


Operating Basics
This chapter provides an overview of the TLA 700 logic analyzer and basic logic
analyzer concepts.
To acquire and display signals from the target system, the logic analyzer must
perform a complex series of actions. For the most part, these actions are
transparent. However, it can be helpful to understand how the logic analyzer
operates. This knowledge can influence how you approach a logic analysis
problem.
Sampling and Digitizing a Signal
Acquisition is the process of sampling the input signal, digitizing it to convert it
into digital data, and assembling it into a waveform record. The order and
method of accomplishing these functions is different between the LA and DSO
modules.
The LA module converts incoming data into ones and zeros using a comparator
with a user-selectable threshold voltage. If the incoming signal is above the
threshold voltage, it is converted to a one; if it is below the threshold voltage, it
is converted to a zero. After digitizing the data, the LA module samples it at
regular time intervals. The sampled and digitized points are stored in memory
along with corresponding timing information. (See Figure 2–1.)
Threshold voltage
Input signal
Sample clock
Figure 2–1: Acquiring a digital signal (LA module)
The DSO module samples the voltage level of the signal at regular intervals, and
then converts the sampled analog data into 8-bit digital values. (See Figure 2–2.)
The sampled and digitized points are stored in memory along with corresponding
timing information.
TLA 700 Series Logic Analyzer User Manual
1
1 1
1
0 0
0 0
0 0
1 1
1 1
0
0
Digital values
2–1

Operating Basics
Analog signal
+6.0 V
+5.5 V
+5.0 V
Digital values
2.5 V
+2.0 V
Sample clock
Figure 2–2: Acquiring an analog signal (DSO module)
LA Module Block Diagram
The LA module is the key element of the instrument. Functionally, the LA module can be divided into several blocks, as shown in Figure 2–3. Refer to the
figure as you read about the functional blocks.
Data from
target
system
0 V
Probes
0 V
Comparator
Threshold
voltage
Sampler
Clock
Internal (asynchronous) or
External (synchronous)
0 V
Memory
Trigger
2–2
Clocking
Figure 2–3: Block diagram of the LA module acquisition and storage
Clocks control when data is sampled. Naturally, the point at which you sample
data has a great deal to do with the type and quality of data you acquire. For the
LA module, there are two primary approaches to clocking, external (synchronous) clocking and internal (asynchronous) clocking.
External (Synchronous) Clocking. This clocking mode is called an external or
synchronous clock because the clock is external to the logic analyzer, and is
synchronized to the target system.
TLA 700 Series Logic Analyzer User Manual

Operating Basics
The signal you chose as the external clock to the logic analyzer should be the
same signal that controls the activity of the other signals you want to observe.
For example, to observe the output states of a counter chip, you might use the
clock input to the counter chip to act as the external clock source to the logic
analyzer. With this setup, each clock pulse to the counter chip could also be used
to clock data from the counter’s output lines into the logic analyzer. As another
example, to record the data being written to a latch, you could use the load signal
to the latch as the external clock source to the logic analyzer.
Internal (Asynchronous) Clocking. Much activity can occur in the target system
between system clock signals. Using the LA module’s internal (asynchronous)
clock, you can view all activity in the target system, not just the data available at
the target system clock signal.
Internal clocking is the best choice when you are primarily interested in the
timing aspects of the data. Internal clocking is a natural choice for waveform
timing analysis. It is important to note, however, that the value of internal
clocking is not limited to just displaying waveforms. For a detailed picture of
data activity both during and between state changes, use internal clocking. For
example, when you use internal clocking you are able to acquire and display
glitch information in either the Waveform or Listing windows.
Acquiring Data
Triggering and Storage
Qualification
When you start an acquisition, the logic analyzer begins sampling data from the
probes. Then, each time a sample clock occurs, data is sampled. Sampled data is
then sent to the trigger functional block and to the main memory.
The trigger program looks at sampled data for specific events and then takes a
specified action. The trigger program can look for events, such as data values,
data ranges, or signals from another module. You can also use internal counters
to trigger when the counter reaches a specified value.
When the trigger condition is satisfied, the LA module enables its posttrigger
delay counter to allow the posttrigger portion of the acquisition memory to fill
before stopping acquisition.
The trigger function block includes storage qualification that looks at sampled
data. If the storage conditions are met, a storage qualifier signal enables sampled
data to pass into the acquisition memory as qualified data. Any unqualified data
samples are excluded.
TLA 700 Series Logic Analyzer User Manual
2–3

Operating Basics
Storing Data in Memory
The acquisition memory works like a circular buffer, storing every qualified data
sample until the entire memory is full. After that, each new data sample
overwrites the oldest existing sample. This process continues until the trigger
event is found and the posttrigger delay counter reaches the specified value
(based on the trigger position selection), which stops acquisition. During
acquisition, you can monitor the progress of the data storage process using the
Status Monitor.
After storing the data you can display the acquired data in the Listing or
Waveform data windows.
DSO Module Block Diagram
The DSO module adds analog analysis capability to the instrument. Functionally,
the DSO module can be divided into several blocks, as shown in Figure 2–4.
Refer to the figure as you read about the functional blocks.
Probes
Acquiring Data
A probe interface detects the attenuation factor of each probe. This information is
used to set the vertical scale.
When you start an acquisition, the DSO module begins sampling data from the
probes. Each time a sample clock occurs, data is sampled. Signals from the
probes go to the attenuators/preamp functional block, which is responsible for
input coupling, termination, bandwidth, offset, and full scale range. The DSO
module always uses internal clocking.
2–4
Acquisition Unit
Triggering
From the attenuators/preamp, signals are sent to the acquisition unit and trigger
functional blocks.
The acquisition unit functional block samples the input signals and converts
them to digital data.
The DSO trigger looks at sampled data for a specific event. The trigger can look
for various types of events, such as glitches, setup and hold violations, runt
pulses, or signals from another module.
When the trigger event is found, the DSO module enables its posttrigger delay
counter to allow the posttrigger portion of the acquisition memory to fill before
stopping acquisition. When triggered, the DSO module performs its specified
trigger action (for example, triggering all modules).
TLA 700 Series Logic Analyzer User Manual

System clock
Operating Basics
Data from
target
system
Figure 2–4: Block diagram of the DSO module acquisition and storage
Storing Data in Memory
The acquisition memory works like a circular buffer, storing data samples until
the entire memory is full. After that, each new data sample overwrites the oldest
existing sample. This process continues until the trigger occurs and the posttrigger delay counter reaches the specified value (based on the trigger position
selection), which stops acquisition. During acquisition, you can monitor the
progress of the data storage process using the Status Monitor.
After storing the data you can display the acquired data in the data windows. In
the Waveform window, the data is shown as analog waveforms. In the Listing
window, the data is shown as a series of voltage values.
Logic Analyzer Physical Model
Probes
Attenuators/
preamp
Acquisition
unit
Trigger
Memory
Physically, the logic analyzer is made up of two main parts: the modules and the
mainframe. Figure 2–5 illustrates the relationship between the logic analyzer and
its subparts.
TLA 700 Series Logic Analyzer User Manual
2–5

Operating Basics
Logic Analyzer
Mainframe
Mechanical housing
Display
Communications bus
Controller
Disk drives
Power supply
User interface software
Low-level software
Module 1
Module
Probes
Firmware
Figure 2–5: Logic analyzer physical model
Logic Analyzer Conceptual Model
Conceptually, the logic analyzer is made up of two main parts: the modules and
the system. From the operational perspective, a module encompasses the setup,
trigger, and data associated with the physical LA or DSO module installed in the
logic analyzer. See Figure 2–6. The system refers to the setup and data for the
whole logic analyzer, including all the modules.
Some actions occur at the module level, some at the system level. For example,
you can save either module or system files. When you save a module, you save
all the setup and trigger information for that module. (You also have the option
of saving the data for that module.) When you save a system, you save all the
setup information for the system, including data window display settings, and all
the module information, as well.
Module 2 Module n
Module
Probes
Firmware
Module
Probes
Firmware
2–6
TLA 700 Series Logic Analyzer User Manual

System
Data Windows
General Settings
Operating Basics
Module 1
Setup
Trigger
Data
Module 2 Module n
Setup
Trigger
Data
Figure 2–6: Logic analyzer conceptual model
Intermodule Interactions and Time Correlation
Each module has its own setup, trigger, and clocking functions. (LA modules
may include microprocessor support as part of their setup.) Each module also
acquires and stores its own data.
When you start an acquisition, all modules start acquiring data together.
(Exceptions are when one module has been programmed to arm another or when
a module has been turned off.) Modules stop acquiring data individually,
according to their trigger programming. You also have the option of setting the
logic analyzer to operate in repetitive mode, in which the modules acquire data
and update the data windows continually until you manually stop the acquisition.
Setup
Trigger
Data
Modules readily communicate with one another by means of their trigger
programs. You can specify functions such as the following:
H Trigger all modules (system trigger)
H One module arms another
H Modules respond to events declared by another module (internal signals)
After the modules have captured and stored data, you can view the data in a
Listing or Waveform window. All data is time-correlated in the display,
regardless of its source. Due to the precise time stamp information stored with
the data, and the tightly-integrated communications between modules, the logic
analyzer interleaves data acquired from various sources. Because time stamp
information is always stored with the data, you can also compare saved data and
current data with no loss of accuracy.
MagniVu data is also time-correlated with regular data. Because MagniVu data is
always present, you can easily compare a normal acquisition with its MagniVu
counterpart.
TLA 700 Series Logic Analyzer User Manual
2–7

Operating Basics
Listing-Data Concepts
In many cases, you will use the logic analyzer to observe the data flow in the
target system. The data recorded by the logic analyzer can be displayed in a
listing format, as shown in Figure 2–7.
Listing data is a table of sequential operations performed by the target system. In
the Listing window, each data sample is displayed sequentially. Because each
data sample includes time stamp information, it is a straightforward process to
display acquisitions from multiple data sources. Samples from all specified data
sources are interleaved in chronological order. For clarity, each line in the table
represents a single data sample from a single data source.
You control the presentation of the data by selecting the display radix of the
columns. You can also make other format selections such as font size, color, and
column width.
2–8
Figure 2–7: Listing data
You can include data acquired by the DSO module in the Listing window. The
Listing window in Figure 2–8 shows DSO module Channel 1 data as discrete
voltage levels. As with any module, the data samples from the DSO module are
time-correlated with the other data and appear on separate lines.
TLA 700 Series Logic Analyzer User Manual

Figure 2–8: Listing window with analog data
Operating Basics
Microprocessor Support
For microprocessor applications, the acquired data can be disassembled back into
the assembly language mnemonics used by a particular microprocessor.
Figure 2–9 shows an example of the disassembled mnemonic display format.
Microprocessor support usually requires a special input probe dedicated to a
specific microprocessor.
Figure 2–9: Listing data using a microprocessor support package
TLA 700 Series Logic Analyzer User Manual
2–9

Operating Basics
The logic analyzer provides support for a wide variety of different microprocessors. Microprocessor support packages include the software, probe adapters, and
documentation.
High-Level Language (HLL) Support
You can correlate the high-level language (HLL) source code that you wrote with
your code as it was executed on your target system and acquired by the logic
analyzer. The correlation is based on symbolic information which is extracted
from your object file or load module. You configure the logic analyzer to access
your source files.
You can step through each executed source statement in the Source window and
view the results in a correlated Listing window. You can also set user-defined
marks as break points within the code and then trace the execution of the code
between the marks. Figure 2–10 shows an example of viewing source code in a
Source window, while Figure 2–11 on page 2–11 shows the actual acquired data
in an associated Listing window.
2–10
Figure 2–10: High-level source code
TLA 700 Series Logic Analyzer User Manual

Figure 2–11: Source code viewed as acquired data
Operating Basics
The LA module supports a wide variety of object files including IEEE695,
OMF86, OMF286, OMF386, COFF, Elf/Dwarf, Elf/Stabs, and the TLA 700
Symbol File format (TSF).
Waveform Data Concepts
You can use the logic analyzer to observe the timing relationships between
signals by displaying the recorded signal activity as a series of waveforms in the
Waveform window. Figure 2–12 shows waveform data from an LA module.
Figure 2–12: Waveform data
TLA 700 Series Logic Analyzer User Manual
2–11

Operating Basics
Each waveform is displayed in a separate track, but all waveforms are timealigned horizontally and displayed in the same time per division. Again, the
inclusion of time stamp information with the stored data samples makes it a
straightforward process to display time-correlated acquisitions from multiple
data sources.
You control the horizontal scale of the acquired data in the display. (You do not,
however, change setup parameters by changing settings in the waveform
display.) You can also make other format selections such as channel group radix,
waveform color, and track height. To show when the logic analyzer sampled the
data, you can add Sample using the Add Waveform toolbar button.
When viewing LA data, you can view the data as individual channels. You can
also display the LA data in groups of channels known as busforms. Use the
busforms to display when data changes with respect to clock or control signals.
When you are interested in displaying the value of a group of channels over a
period of time, you can use magnitude mode. For example, using magnitude
mode, you can view the channels connected to a 16-bit digital counter. The
magnitude waveform appears as a sawtooth waveform as the counter values
increment from the minimum value (00) to the maximum value (FF).
LA Module Versus DSO
Module Waveforms
A logic analyzer waveform appears to have zero-length rise and fall times. This
is because the logic analyzer is recreating the waveform from the samples stored
in its memory, which are either ones or zeros.
No electronic signal is perfectly digital in nature; there is always some analog
component. Consider a fast-rising pulse with ringing on the front edge, or
glitches that can occur in a noisy circuit. If you suspect problems caused by
analog signal characteristics (such as signal voltages higher or lower than
specified voltage levels, or slow transition times), you should use a DSO module
to observe the voltage characteristics of the signal. Figure 2–13 shows where the
DSO module captured a runt pulse that was below the logic analyzer’s threshold.
2–12
TLA 700 Series Logic Analyzer User Manual

Figure 2–13: Using the DSO module to capture a runt pulse
Operating Basics
Sampling Resolution
The accuracy of the waveform recreated from the sampled data depends on the
sample clock rate used to record the incoming signals. This is due to the fact that
the waveform re-created by the logic analyzer is based on the sampled signals
stored in its memory. If the sample clock rate is too low, the recorded data will
produce an inaccurate display. Figure 2–14 shows how the sample clock rate can
affect an LA module waveform.
Insufficient DSO module sampling resolution can result in aliasing. For
information about aliasing, see page 2–14.
TLA 700 Series Logic Analyzer User Manual
2–13

Operating Basics
Example 1: Slow sample clock
Original waveform
Sample clock
Displayed waveform
Example 2: Fast sample clock
Original waveform
Sample clock
Displayed waveform
Signal Resolution and
Signal Duration
Preventing Aliasing
Figure 2–14: LA module sampling resolution
There is an important trade-off between the resolution of the recorded signal and
its duration in terms of elapsed time. Because the total number of samples that
can be recorded by the logic analyzer is fixed by the depth of the logic analyzer’s acquisition memory, increasing the sample clock rate provides better signal
resolution at the expense of reducing the duration of the captured signal. That is,
a faster sample clock rate will record a smaller portion of the signal, but with
better resolution.
For the LA module it is important to remember that you have an additional tool
to offset the signal resolution/signal duration relationship. By using the MagniVu
data feature, you can view high-resolution data centered about the LA module
trigger. This allows you to zoom in on the data of particular interest while still
maintaining visibility of a more extended signal duration.
Under certain conditions, an analog waveform can be aliased on screen. When a
waveform aliases, it appears on screen with a frequency lower than the actual
waveform being input or it appears unstable. Aliasing occurs because the
instrument cannot sample the signal fast enough to construct an accurate
waveform record. (See Figure 2–15.)
2–14
TLA 700 Series Logic Analyzer User Manual

Operating Basics
Actual high-frequency
waveform
Apparent low-frequency
waveform due to aliasing
Sampled points
Figure 2–15: Aliasing
To check for aliasing, increase the sampling rate (decrease the clock sample
period) in the module Setup window. If the shape of the displayed waveform
changes drastically or becomes stable at a faster clock sample period setting,
your waveform was probably aliased.
Although the principles of sampling theory define a minimum sample rate of 2X,
a good rule of thumb is to choose a sample clock rate five times faster than the
speed of the fastest signal being measured. A faster sample clock rate results in a
more accurate reconstructed waveform.
Displaying Waveforms
High-Speed Timing
Waveforms are rarely displayed at an exact one sample point per pixel. Waveforms are usually displayed in a compressed or expanded format. As a general
rule, waveforms are compressed when the time per pixel is greater than the time
per sample clock. Waveforms are expanded when the time per pixel is less than
the time per sample clock.
For compressed DSO module waveforms, the display shows the lowest and
highest point that occupy a given pixel column joined by a vertical line. For
expanded waveforms, the display points between the actual sample points are
calculated.
For expanded DSO module waveforms, Sin(x)/x interpolation computes the
display points between the actual values acquired.
The LA module provides high-speed timing support through MagniVu data. The
MagniVu data is stored in a separate memory that is parallel to the main
memory. All data from the sampler goes directly to the MagniVu memory. The
MagniVu memory also works like a circular buffer. Unlike the acquisition
memory, the MagniVu memory does not qualify data storage through the trigger
function block.
MagniVu data is continuously acquired on all channels at the fastest sample rate
of 500 ps. Like normal acquisition data, MagniVu data can be displayed in the
Listing or Waveform data windows. The MagniVu data is centered on the
LA module trigger in the data window. For additional information, see MagniVu
Data on page 3–62.
TLA 700 Series Logic Analyzer User Manual
2–15

Operating Basics
Detecting Glitches
One of the logic analyzer’s most useful features is its ability to detect and trigger
on signal glitches. A glitch is a signal that makes a transition through the
threshold voltage two or more times between successive sample clocks. Because
glitches are often signal transitions that occur intermittently, they can cause
circuit malfunctions that are extremely difficult to diagnose.
Although you could try using a very fast sample clock rate to ensure that you
never miss any glitches, a better solution is to use the glitch-detection feature.
The logic analyzer can trigger on a glitch, either alone or in combination with
other signal events. This capability is useful for catching intermittent glitches
that might not occur very often, or only when a particular operation is taking
place.
You can capture noise spikes and pulse ringing using the glitch capture feature.
Figures 2–16 and 2–17 show data captured by triggering on a glitch. In the
Waveform window, a glitch captured by an LA module is indicated by a band of
color. (See Figure 2–16. For clarity, an arrow identifies the glitch in the figure.)
You must select internal clocking to use the glitch detection feature.
2–16
Figure 2–16: LA module triggering on a glitch
TLA 700 Series Logic Analyzer User Manual

Figure 2–17: DSO module triggering on a glitch
Performance Analysis Concepts
Operating Basics
For performance analysis applications, you can use the Histogram window to
view the performance of your software. The actual data is displayed as horizontal
bars in a histogram.
You may want to use the Histogram window to see which one of your software
routines is taking up most of the CPU time. Or, you can use the Histogram
window to measure the amount of time used by a particular subroutine. You can
use a symbol file to view each of the routines by name.
Figure 2–18 shows an example of the Histogram window where the StopLite
routine is taking up most of the computer resources.
TLA 700 Series Logic Analyzer User Manual
2–17

Operating Basics
Figure 2–18: Viewing the performance of code with a Histogram window
Comparing Acquired Data Against Saved Data
You can use the LA module to compare acquired data against saved reference
data. Use the LA Setup menu to define the data channels that you want to use
during the compare operations. You can further define the number of samples
that you want to compare as well as data alignment offset.
In the Listing and Waveform windows, you can use color to quickly identify the
compared data. You can set up one color to show where the acquired data does
not equal the reference data. You can use another color to show where the
acquired data equals the reference data.
Figure 2–19 shows a Listing window during a memory compare operation;
notice that some of the data under the LA 2 A2 column appears in a different
color, indicating that there were differences between the acquired data and the
reference data.
2–18
TLA 700 Series Logic Analyzer User Manual

Operating Basics
Figure 2–19: Using color to show memory differences in a Listing window
Repetitive Acquisitions
Use the Repetitive acquisition features of the logic analyzer to automate
repetitive and time-consuming tasks. For example, you can specify the number
of times that you want the logic analyzer to acquire data. With each acquisition,
you can save the data to a file for analysis. You can also set up the logic analyzer
to open a file or execute a program when all of the acquisitions have been
completed.
You can set up the LA module to acquire and compare the acquisition data
against known reference data. The LA module can continue acquiring data until
there is a mismatch between the acquisition data and the reference data.
Figure 2–20 shows an example of such a setup where the acquired data is
exported to a file for each acquisition. When a data-mismatch occurs the logic
analyzer stops acquiring data and exports the data to a file. The faulty data can
now be analyzed by another application.
TLA 700 Series Logic Analyzer User Manual
2–19

Operating Basics
Figure 2–20: Defining repetitive setups
TLA 700 Programmatic Interface (TPI)
Using the TLA 700 Programmatic Interface (TPI) you can control a TLA 700
series logic analyzer from a separate user program from the logic analyzer itself
or from a remote computer. The interface is based on the Component Object
Model (COM). You can use any programming language or programming
environment that supports the Component Object Model, such as Microsoft
Visual C++ and Microsoft Visual Basic.
Using TPI, you can control various aspects of the logic analyzer. You can load
and save system and module setups. You can extract information from the logic
analyzer, such as LA module counter and timer values, configuration information, LA module data, and DSO module data for analysis by other applications.
The TLA 700 Programmatic Interface comes with its own online help (select
Help on TPI from the Help menu in the TLA application). For your convenience,
the information contained in the TPI help file is also available in Portable
Document Format (PDF) in the C:\Program Files\TLA 700\System directory.
The file name is tpi.pdf. You will need the Adobe Acrobat Reader application to
view or print tpi.pdf. If you do not have Adobe Acrobat Reader on your
machine, you can download a free copy from the Adobe site at http://www.adobe.com/acrobat/.
2–20
TLA 700 Series Logic Analyzer User Manual

Symbol Support
Operating Basics
Symbols simplify tasks, such as setting up triggers or identifying specific values
within the data. When you program a trigger or view data, it is cumbersome to
remember which numeric channel group values correspond to particular machine
instructions or code modules. The logic analyzer makes this task more manageable by allowing you to assign symbolic names or mnemonics to group values.
For example, you might assign the symbol WRITE to the control bus event that
causes the target system to write to a memory location. Then, if you wanted to
trigger when a write cycle occurs, you could enter WRITE in the trigger program
in place of the actual data value. You could also choose to have WRITE appear
in the Listing window for quick identification of the instruction.
In Figure 2–21, the example shows a trigger program which uses the symbol
SYSTEM_RESET as part of the trigger clause.
Symbol Files
Figure 2–21: Using symbols in a trigger program
You can use symbol files with a Source window and an associated Listing
window to track the execution of source code. The symbol file provides the
information to associate a line of source code to an address in a Listing window.
When you move a cursor in one window, the symbol file provides the necessary
information to move the cursor to the correct location in the other window.
Often, the application software will define symbols for you. For example, when
you load a microprocessor support package, symbols are also loaded (typically,
to the control group). These symbols represent data values that correspond to bus
cycle types. Other software applications produce range symbol files which you
can load (typically, these files are loaded to the address group).
To use symbols, you must first load or create one or more symbol files that
define the symbols. Symbol files contain symbol names and their associated data
values. You can use symbol files created by another application, edit symbol files
from other applications, or you can create your own symbol files using a text
editor.
TLA 700 Series Logic Analyzer User Manual
2–21

Operating Basics
Wi
Each entry in a symbol file consists of an alphanumeric symbol name with its
associated numeric value or range of values. After you create a symbol file, you
can specify the symbol file for the appropriate channel group in the Waveform or
Listing window, use symbolic names as a substitute for numeric values in the
Trigger and data windows, and use symbols for tracing source code in a Source
window.
Symbol files perform like look-up tables. For example, if the address of a printer
I/O port is at address F734BC, you can define a symbol, printer-port, that
corresponds to that value. Then, in the Trigger window, you can specify the
symbol name as an event in the trigger program and cause the module to trigger
when printer-port (F734BC) appears on the address bus. You can also specify the
symbolic display radix for the address channel group and the symbol name
printer-port will show in the Listing window every time F734BC appears on the
address bus.
Symbol Types. Two main types of symbol files are possible: pattern symbol files
and range symbol files. Range symbols can be further divided into three different
categories: functions, variables, and source code (source). Table 2–1 shows the
different types of symbols and the windows where they are commonly used.
T able 2–1: Using symbols in logic analyzer windows
Range symbols
ndow Pattern symbols
Listing Yes Yes Yes Yes
Waveform Yes Yes Yes Yes
Histogram No Yes Yes No
Source No No No Yes
LA Trigger Yes Yes Yes Yes
Functions Variables Source code
Pattern Symbols. Pattern symbols consist of data patterns up to 32 bits. Each bit
in a pattern symbol can be 0, 1, or X (don’t care). Pattern symbols are used when
a group of signals define a logical state. For example, a microprocessor has a set
of pins that indicate the type of bus cycle in progress. A memory read cycle is
indicated when the RD~ and MREQ~ pins are 0 (logic low) and the BUSAK~
and M1~ pins are 1 (logic high). You can define a pattern symbol name called
mem-read that corresponds to bit pattern 1100 and thereby mark all memory read
bus cycles in the Listing window. For other bus cycles the logic state of these
pins is also important and you can define different bit patterns for each cycle
type.
2–22
TLA 700 Series Logic Analyzer User Manual

Operating Basics
Figure 2–22 shows pattern symbols used in a Waveform window.
Figure 2–22: Waveforms using pattern symbols
Range Symbols. Range symbols define a range of 32-bit addresses represented by
a contiguous set of integers, marked by specific lower and upper bounds. The
different types of range symbols are discussed in detail under TLA 700 Symbol
File Format beginning on page 0–1.
When defining a range symbol file, do not overlap ranges of values. If ranges
overlap, they may not be recognized. For example, if SYM1 covers the range
1000–3FFF, and SYM2 covers 2000–2FFF, then the values in range 2000–2FFF
may be recognized as either SYM1 or SYM2, and the values in the range
3000–3FFF may not be recognized as SYM1 at all.
The range symbols shown in Figure 2–23 define subroutine boundaries.
Figure 2–23: Listing data using range symbols
TLA 700 Series Logic Analyzer User Manual
2–23

Operating Basics
Symbols Dialog Box
Use the Symbols dialog box to provide an overview of all currently loaded
symbol files (see Figure 2–24). You can display information on all symbol files
currently used by the logic analyzer.
The following status information is available for each currently-loaded symbol
file:
H The last time the file was loaded into the TLA 700 application software. It
also includes error and warning messages associated with the last load.
H When the file was last modified. The logic analyzer also displays a message
if the file may need to be reloaded (such as when the file is modified after it
was first loaded).
H The format of the loaded file.
H If the file can be unloaded or if the file is currently in use. Symbol files can
only be unloaded if no data windows or setups are using them.
2–24
Figure 2–24: Symbols dialog box
TLA 700 Series Logic Analyzer User Manual

Operating Basics
The following content information is displayed in the Symbols dialog box:
H Whether the file is a pattern symbol file or a range symbol file. If the file is a
range file, this field also lists the types of symbols loaded.
H The number of symbols loaded from the file. Symbol files can have an
unlimited number of symbols. The number of symbols is limited by the
amount of memory. When you load a symbol file, the symbols are placed in
memory. Because symbol files consume memory, you should unload unused
symbol files to keep memory available for your main application.
H The number of source files referenced by source code symbols loaded from
the file.
H The minimum and maximum address values and offset information.
Click the Load button (see Figure 2–24) to open the Select Symbol File dialog
box and load a new symbol file. You can browse the file system for the symbol
file. If the symbol file is a range file, you can click the Options button in the
Select Symbol File dialog box to open the Load Symbols Options dialog box.
Load Symbol Options
Dialog Box
Click the Export button to save the current file as a TSF-format symbol file. You
can view the exported symbol file with applications such as Wordpad. Edit the
symbol file by saving it under a new name and using a text editor. Save the
edited file in text format. You can then load the edited symbol file.
Use the Load Symbols Options dialog box (see Figure 2–25) to specify options
for range symbol files before loading them into the system.
Figure 2–25: Load Symbol Options dialog box
TLA 700 Series Logic Analyzer User Manual
2–25

Operating Basics
Select one or more of the symbols types to load. If you want to use the symbol
file with the Source window, you should be sure to select Source Code symbols.
You can enter a decimal number for the maximum number of symbols to load.
The maximum number of symbols that you can load is limited only by the
amount of memory available. The file loads symbols until the specified
maximum number of symbols is reached. Additional symbols are ignored, even
if they fall within the Bound 1 and Bound 2 range limits.
The Bound 1 and Bound 2 fields define the range of symbol addresses that will
be loaded. You can enter any hexadecimal values from 0 through FFFFFFFF.
Symbols with values outside of these limits are ignored and will not be loaded.
NOTE. If the lower bound of the range symbol is within the Bound 1 and Bound 2
limits and the higher bound is not, the entire symbol will be valid. However, if
the higher bound is within the Bound 1 and Bound 2 limits and the lower bound
is not, the entire symbol will be ignored.
Select either Default Offset or Custom Offset to apply an offset to the symbol
values. If you select Default Offset, the default offset is read from the source file
and applied to each symbol in the file as it is loaded. If you select Custom
Offset, you can add or subtract the specified offset value to each symbol in the
file as it is loaded. You can choose any 32-bit hexadecimal value from 0 to
FFFFFFFF.
When you enter bound values, enter the values without an offset value. If your
application adds an offset, you must subtract the offset value before you enter the
bound values.
2–26
TLA 700 Series Logic Analyzer User Manual

Reference


Setup
This section describes how to set up the logic analyzer (LA) and DSO modules,
and how to load an LA module trigger program.
For further details, particularly about selections available to you in windows and
dialog boxes, please refer to the online help.
Starting From the System Window
The System window gives an overview of the logic analyzer configuration,
arming, and triggering relationships. The System window also indicates whether
LA modules are merged to increase the number of channels. See Figure 3–1.
A black arrow from one module to another indicates that one module is set up to
arm another. Figure 3–1 shows the merged LA module arming the DSO module.
A module that is programmed to cause a system trigger has an indicator symbol
on the right edge of the module graphic.
Figure 3–1: System window
Arm indicator
System trigger indicator
Overlapped icons indicating
merged modules
Data source indicator
TLA 700 Series Logic Analyzer User Manual
3–1

Setup
Opening Other Windows
from the System Window
You can use the System window as a quick navigation tool.
H To open a module Setup or Trigger window from the System window, click
the Setup or Trigger button in the module icon.
H To open a data window from the System window, click the data window
button. See Figure 3–2.
Disabling Modules
Renaming Windows
Identifying Modules
Figure 3–2: Opening a Waveform window from the System window
If you are not using a module, you can disable it by clicking the module’s On/Off
button. When you disable a module, make sure that no other trigger programs
depend on that module’s output.
You can rename the windows by selecting the current window labels and
overtyping. Names must be unique and are limited to the space available.
If you are unsure which physical module is represented by an icon, double-click
on the icon to open its System Properties page. This property page lists
information about the module, including the mainframe slot numbers in which it
is installed. (Slot numbers are indicated on the mainframe.)
3–2
TLA 700 Series Logic Analyzer User Manual

Setting Up the LA Module
The primary function of the Setup window is to configure the LA module for
compatibility with the target system. This is where you specify channel groups,
set thresholds, and select the sample clock rate. Additional selections configure
the LA module for best compatibility with the type of data you want to acquire.
Before you acquire and display data, you must first set up the LA module using
the LA Setup and Trigger windows. Together, these windows determine the data
to be acquired.
Each module has its own Setup window and Trigger window, each is set up
individually. Generally, you should configure the Setup window before the
Trigger window, because some of the Setup window settings affect Trigger
window selections.
H To open the LA module Setup window, go to the System window and click
Setup
the LA module Setup button.
Figure 3–3: The LA module Setup window
NOTE. If you intend to use merged modules, turn to page 3–34 for information
before you proceed with the setup procedure.
TLA 700 Series Logic Analyzer User Manual
3–3

Setup
Microprocessor Support
Setup
If you intend to use a microprocessor support package, load it before completing
the entries in the Setup window. The microprocessor support package configures
the Setup window for you.
H To load a microprocessor support package, go to the File menu, click Load
Support Package, select the support package you want to load, and then click
Load.
After loading the microprocessor support package, the LA Setup window shows
the channel definitions, channel groups, and clocking requirements for the
microprocessor support package. Figure 3–4 shows an example of the LA Setup
window after loading the QSTART support package.
Performance Analysis
Memory Compare
3–4
Setups
Figure 3–4: Setup window with the QSTART support package
For information about microprocessor support packages, refer to the online help
and to the instruction manual that came with your microprocessor support
package.
If you intend to do performance analysis with your LA module, you need to
define the channel and clocking setups in the Setup window. You may also want
to load a microprocessor support package which contains the predefined channel
setups and clocking setups.
Memory Compare allows you to compare the current acquisition data of an LA
module against a known reference data. You can quickly view data differences
and similarities in a Listing or Waveform window using user-defined colors.
TLA 700 Series Logic Analyzer User Manual

Setup
Selecting Channels for the Memory Compare. Choose the channels that you want
to compare in the LA Setup window by selecting Channel Compare in the Table
Shows box (see Figure 3–5). You can then compare all data channels, specific
channel groups, or individual channels by selecting the appropriate channels in
the Probe Channels/Names table.
Figure 3–5: Selecting channels for memory compare
After selecting the channels that you want to compare, click the Define Compare
button in the lower-right corner of the Setup window to define the compare
actions.
TLA 700 Series Logic Analyzer User Manual
3–5

Setup
Defining Memory Compare Parameters. Select Enable Data Compare in the
Compare Definition dialog box as shown in Figure 3–6. Select the reference data
source in the box; if the data source that you are interested in does not appear in
the list, click Add Data Source to browse for the data source in the file system.
Figure 3–6: Enabling data compare
After you select the data source, define the amount of data that you want to
compare against. You can compare all data or a portion of the data by filling in
the appropriate information. You can also define the alignment of the data by
filling in the appropriate information. A summary of your setup displays at the
bottom of the dialog.
NOTE. After defining the compare setup, remember to select Show Compare in
the Listing Window or Waveform Window property page
Guidelines for Memory Compare. There are a few guidelines that you should be
aware of when using memory compare:
H You must enable the memory compare in the Compare Definition dialog box
(see Figure 3–6).
H Acquisition modules and reference modules must be the same width.
H Specify the color of compare data in the Listing Window or Waveform
Window property sheet, or use the default colors.
3–6
H You can search for data differences or data equalities.
TLA 700 Series Logic Analyzer User Manual

Setup
H You can use memory compare with repetitive acquisitions.
H You can compare only the main LA data, you cannot compare glitch data,
disassembler group data, or MagniVu data.
NOTE. Although you cannot compare disassembler group data directly, you can
compare the raw nondisassembled data by using the channel groups as defined
in the Setup window. To view these channel groups in a Listing window, use the
Add Column toolbar button to add the channel group to the window.
Clocking
Use Clocking to specify the clock(s) used to sample data. Select one of two basic
clocking modes, Internal (asynchronous) or External (synchronous). A third
choice, Custom, is available if a microprocessor support package has been
loaded. Your clocking choice determines further clocking selections.
Internal Clocking. Internal (asynchronous) clocking uses the LA module’s internal
clock to determine when to sample data. Typically, internal clocking is used for
timing analysis (waveform data).
When you select Internal clocking, the only additional selection to make is the
clock rate in the next field.
Because the internal clock signal is asynchronous to the target system, be careful
to select a sample period that is considerably faster than the data rate of your
target system.
External Clocking. External (synchronous) clocking synchronizes data sampling
with the clock of the target system so you can be more selective about the data
you sample. This type of clocking is best for software analysis (listing data).
When you select External clocking, you have the option of further selections to
define the sample clock. You can create clocking equations in the Clocking
dialog box. Clocking equations qualify when data is sampled. The equations
consist of a Boolean combination of events, linking clock and qualifier lines.
Data is sampled and stored in memory only when this clock equation is true.
TLA 700 Series Logic Analyzer User Manual
3–7

Setup
Advanced Clocking. Advanced clocking is available only if you select External
clocking. Use advanced clocking to set up multiple-phase clocking, probe
demultiplexing, and other clocking controls. Multiple-phase clocking specifies
two different sample clock equations and assigns an equation to separate probe
groups to clock in sample data. You can also sample data from different channel
groups at different points in time relative to the sample clock through a variable
setup and hold window.
Custom Clocking. Custom clocking is used only with microprocessor support
packages. Custom clocking enables and disables a variety of microprocessor-specific clock cycle types (such as DMA cycles).
For more information, see the instructions that came with your microprocessor
support package.
Selecting the Acquisition
Mode
Use Acquire to select the acquisition mode. The acquisition mode determines the
data to store. You can store channel data only, glitch data, or blocks of data
around requested samples.
Normal Mode. Normal mode stores only the requested channel data.
Blocks Mode. Blocks mode stores a block of approximately 60 samples around
each qualified sample. In Blocks mode, only channel data is stored. If you store
blocks they will override other forms of data qualification. All samples in the
block are always stored.
Glitch Mode (Internal Clocking Mode Only). Glitch mode captures glitch data and
regular data for each data channel. You must select internal clocking for Glitch
mode to be available.
Glitch mode limits memory depth to half of the maximum depth and limits the
sample period to 10 ns or greater.
3–8
TLA 700 Series Logic Analyzer User Manual

Setup
Setting Memory Depth
Channel Grouping
Use Memory Depth to specify the total number of samples acquired by the LA
module. If you do not require full memory depth, select a lesser value because
you will have less data to search to find the data of interest.
For a given memory depth there is a tradeoff between the clock sample rate and
data record length. (A faster sample rate provides a shorter time window, but
with higher resolution.)
NOTE. If you select Glitch mode, the maximum memory depth is limited to one
half the normal value.
Use channel grouping to organize the LA probe channels to match the configuration of the target system. Depending on your application, match the channel
groups to the address and data buses, or other channels of interest. Then name
the channel groups for easy identification.
Any number of groups can be created. Each group can contain any combination
of module channels; the application does not restrict you from repeating channels
from various groups.
When using group range events (range recognizers), the probe groups and probe
channels must be used in hardware order. That is, probes must be used from the
most-significant probe group to the least-significant probe group based on the
following order:
C3 C2 C1 C0 E3 E2 E1 E0 A3 A2 D3 D2 A1 A0 D1 D0 Q3 Q2 Q1 Q0 CK3
CK2 CK1 CK0
The probe channels must be used from the most-significant channel to the
least-significant probe channel based on the following order:
7 6 5 4 3 2 1 0
If a microprocessor support package is loaded, the channel groups are defined for
you.
TLA 700 Series Logic Analyzer User Manual
3–9

Setup
NOTE. If a microprocessor support package is loaded, you should not change or
delete the default channel groups. Doing so can cause an inaccurate analysis.
You can still add and delete new channel groups.
Channel groups defined in the channel grouping table are used in other displays
and setup controls. The order of the groups in this table determines the order of
presentation in other parts of the application.
Figure 3–7: Channel grouping table in the Setup window
Channel Group Name. Each channel group must have a name. You can use the
default name, or you can enter another name, as long as it is unique within the
module. There is no limit to the number of groups you can create.
For each group name, you must list all the probe channels that make up the
group. The group names are listed in the left column of the table. The individual
probe channels that make up each group are listed in the right column of the
table. The center column of the table lists the number of channels in a group
(where a zero refers to bit 0). For example in Figure 3–7, the Address group is
made up of 32 channels, with channel 31 as the most-significant bit (A3-7) and
channel 0 as the least-significant bit (A0-0).
Probe Channels/Names T able. Use the Probe Channels/Names Table to enter
names for individual channels, add and remove channels from a group, or change
polarity of individual channels.
3–10
TLA 700 Series Logic Analyzer User Manual

Setup
Activity Indicators
Use the Activity Indicators dialog box to show the real-time signal activity at the
LA module probe tip without having to acquire data. The activity symbols
indicate whether the signals at the probe tip are high, low, or changing. See
Figure 3–8.
H In the LA Setup window, click Show Activity.
Figure 3–8: The Activity Indicators dialog box
If the activity indicators show no activity, the problem could be that there is no
signal voltage, an incorrect threshold voltage level, or the channel lead is not
connected. If all the channels associated with a probe are inactive, check the
probe connections to the LA module.
You can leave the Activity Indicators dialog box open while you set up other
windows, such as setting up the Trigger window or adding channels to the
Waveform or Listing window. This dialog box is useful for verifying that clocks
are active in external clocking and for troubleshooting complex clock setups.
TLA 700 Series Logic Analyzer User Manual
3–11

Setup
Setting Probe Thresholds
Use Set Thresholds to set the input threshold voltage settings for probe channels,
clocks, and qualifiers of the LA module. Changes are immediately executed even
during acquisition. Figure 3–9 shows the Set Thresholds dialog box.
Initially, the Probe Thresholds box contains values that are set in the Preset page
of the Options Property sheet.
Figure 3–9: Probe Thresholds dialog box
Setting Up the Trigger Program
The primary function of the LA Trigger window (see Figure 3–10) is to construct
a trigger program. You also use the Trigger window to select how and when to
store data.
A trigger program is a series of events and actions that define when to trigger
and store data. The trigger program filters acquired data to find a specific data
event, or series of data events. The trigger program can accept information from
other modules or send signals external to the logic analyzer.
3–12
TLA 700 Series Logic Analyzer User Manual

Setup
Trigger programs range from the simple to the extremely complex. They are the
key to logic analyzer operation, which is to acquire the desired data in acquisition memory and to display the data for viewing. One method for setting up a
trigger program is to load a trigger program from the trigger library. You can
then alter the trigger program details as necessary. Once you become familiar
with trigger programming, you can also create trigger programs without the help
of the trigger library. For more information, see Trigger Library on page 3–16.
Before you work in the Trigger window, you should already have configured the
LA module Setup window because some of the Setup window settings affect
Trigger window selections.
Figure 3–10 shows a Trigger window with a trigger program loaded from the
trigger library.
Figure 3–10: LA module Trigger window
Trigger Program Structure
TLA 700 Series Logic Analyzer User Manual
A trigger program is made up of one or more states (up to 16). Only one state is
active at a time.
Each state is made up of one or more clauses. If you use more than four trigger
event resources in a state, you can have up to four clauses per state. If you have
four or fewer trigger event resources in a state, you can define up to 16 clauses
per state. Clauses are made up of two parts: an If statement, that defines the data
event of interest, and the Then statement, which specifies the action taken when
the If statement is true. You can define up to eight events per If statement and up
to eight trigger actions per Then statement.
3–13

Setup
During each sample clock cycle, all clauses within the active state simultaneously evaluate each data sample. Clauses are evaluated from top (State #1, IF-Then
Clause #1) to bottom. When one of the clauses goes true (the event defined in the
If statement occurs), then the logic analyzer performs the action(s) specified in
the Then statement. There are several actions to choose from, including
triggering the system and transferring control of the trigger program to another
state.
NOTE. If multiple clauses are true in the same clock cycle, only the earliest
clause in the sequence to go true will have its action(s) executed.
Trigger Window Structure
The Trigger window summarizes the trigger program. The Overview shows the
general structure of the trigger program. The Trigger Detail, at the right of the
window, summarizes activity within individual program states. You can click the
If/Then button in the Trigger Detail to open the Clause Definition dialog box,
which is where the actual trigger programming takes place.
Overview Trigger Detail
3–14
Figure 3–11: Trigger window structure
TLA 700 Series Logic Analyzer User Manual

Setup
Overview. The Overview portion of the Trigger window shows the relationship of
the states. See Figure 3–12. This example shows a branch occurring in State 2.
This example also shows that a trigger (note the trigger indicator) occurs in
State 2 and an Arm occurs.
To view the details in a particular state, double-click on the State button in the
Overview.
Figure 3–12: Overview portion of LA Trigger window
You can view the progress of the trigger states during acquisition using the
Status Monitor. (See Status Monitor on page 3–43.)
Trigger Detail. The Trigger Detail portion, at the right of the Trigger window,
shows summary information about the clauses within the states. See Figure 3–13. For lengthy trigger programs, click on the State buttons in the
Overview to jump to the corresponding Trigger Details.
Figure 3–13: Trigger detail portion of LA Trigger window
TLA 700 Series Logic Analyzer User Manual
3–15

Setup
Click on the If/Then button to open the Clause Definition dialog box for
complete information about the clause.
Trigger Library
One advantage of a logic analyzer is that you can create sophisticated trigger
programs so that you can carefully qualify and store only the relevant data.
However, configuring such trigger programs can be time-consuming.
The TLA 700 Series Logic Analyzer simplifies this process with its trigger
library. It provides a list of trigger programs to fit most needs. The trigger
programming is partially done for you.
To use the trigger library, select a trigger program that is close to what you
require, and then alter the program as necessary. Once you have customized the
trigger, you can save it along with the rest of your setup using the Save Module
or Save System function. You can later retrieve the saved trigger program alone
or with the related saved module or system information.
Table 3–1 lists the programs in the trigger library and a brief description of each
library item.
T able 3–1: LA Trigger library
File name Description
TrigOnA Trigger on the first occurrence of Event A.
TrigOnAafterN Wait for Event A. Trigger after the specified number of
events.
TrigOnNthA Trigger after Event A has occurred a specified number of
times.
TrigOnNthAorB Trigger after Event A or Event B has occurred a specified
number of times.
TrigOnAthenB T rigger if Event B eventually follows Event A
TrigOnAimedB Trigger if Event B immediately follows Event A.
TrigOnAthenBresetC Wait for Event A. If Event C occurs before Event B, then
reset and wait for Event A again. Otherwise, trigger when
Event B occurs.
TrigOnAtoBltNCs Trigger on Event C if Event C occurs less than or equal to
the specified number of times between Event A and
Event B.
TrigOnAtoBgtNCs Trigger on Event C if Event C occurs more than the
specified number of times between Event A and Event B.
TrigOnAthenBinN Trigger when Event B occurs within a specified number of
events of Event A.
3–16
TLA 700 Series Logic Analyzer User Manual

Setup
T able 3–1: LA Trigger library (Cont.)
File name Description
TrigOnAinRange Trigger when the group event occurs within specified
upper and lower ranges.
TrigOnGlitch Trigger on glitches; valid only with Internal clocking.
TrigOnSetHold Trigger on setup and hold violations; valid only with
External or Custom clocking.
TrigOnAtoBinT Trigger when Event B follows Event A within the specified
time.
TrigOnAtoBafterT Trigger when Event B follows Event A after the specified
time.
CountA Count the occurrences of Event A. This program does not
trigger the LA module.
CountAorB Count the occurrences of Event A or Event B. This
program does not trigger the LA module.
CountCfromAtoB Count the occurrences of Event C between Event A and
Event B. This program does not trigger the LA module.
AccumCfromAtoB Accumulate the total counts of Event C between Event A
and Event B. This program does not trigger the LA
module.
AccumTfromAtoB Accumulate the total time between Event A and Event B.
This program does not trigger the LA module.
AccumTinRange Accumulate the total time spent within the specified range
in Event A. This program does not trigger the LA.
AccumToutRange Accumulate the total time spent outside the specified
range in Event A. This program does not trigger the LA.
TimeBetweenAandB Measure the delay between Event A and Event B. This
program does not trigger the LA module.
TimeInRange Measure the time spent within a specific range of events.
This program does not trigger the LA module.
TimeOutRange Measure the time spent outside a specific range of events.
This program does not trigger the LA module.
StoreOnA Store nothing except occurrences of Event A. This
program does not trigger the LA module.
StoreOnAorB Store nothing except occurrences of Event A or Event B.
This program does not trigger the LA module.
StoreFromAtoB Store nothing except the samples between Event A and
TLA 700 Series Logic Analyzer User Manual
Event B. This program does not trigger the LA module.
3–17

Setup
T able 3–1: LA Trigger library (Cont.)
File name Description
StoreExceptAtoB Store everything except those samples between Event A
and Event B. This program does not trigger the LA
module.
StoreInRange Store nothing except samples within specified ranges of
Event A. This program does not trigger the LA module.
TrigOnSignal Trigger the LA module on a signal from another module.
SendSignal Send a signal to another module when Event A occurs.
TrigSysOnA Trigger the system when Event A occurs.
Loading a Trigger from the
Trigger Library
To load a trigger program from the trigger library, follow these steps:
1. From the Trigger window, click the Load Trigger toolbar button.
2. From the Load LA Trigger dialog box, click Browse Library.
3. Select a trigger program from the list.
4. Click Open to apply the selection.
5. Click Load to load the trigger program into the module.
Once you load the trigger program, customize it for your application.
6. Click the If/Then button to open the Clause Definition dialog box. This is
where you specify trigger program details.
7. Change the Clause Definition selections to fit your application. Start with the
first box in the If statement; the selection you make affects other selections.
Enter appropriate values in the address and data boxes.
3–18
TLA 700 Series Logic Analyzer User Manual

8. If you want additional clauses, you can add to the If or Then statements
using the Add button, as shown in the following figure.
Setup
9. Click OK to complete the clause definition.
10. Check the trigger program summary in the Trigger window.
TLA 700 Series Logic Analyzer User Manual
3–19

Setup
Trigger Events
Use trigger events to define the If portion of the event clause in the trigger
program. Table 3–2 lists the trigger events available.
T able 3–2: Trigger events
Event Description
Word Tests the channel groups for the word values defined in
the Word definition dialog box.
Group Tests a specified channel group for a specific value, a
range of values, or a value change.
Channel Tests the specified channel for a value or a value change.
Glitch Detects glitches in channel groups as defined in the Glitch
Detect dialog box. Only available with internal (asynchro-
nous) clocking.
Setup & Hold fault Tests setup and hold parameters as defined in the Setup
and Hold Event dialog box. Not available as an event with
internal (asynchronous) clocking.
Counter and timer events Tests the specified counter or timer value. Timer events
are only supported by LA Modules with serial numbers
B020000 or higher.
Trigger Resources
Signal Looks for one of the four internal system signals. Only one
signal event is available in a trigger program.
Anything All sampled data makes this event true.
Nothing All sampled data makes this event false.
You can use up to 16 unique trigger resources (not including counters and timers)
in a trigger program to define the events and actions. A trigger resource can be
used more than once in a trigger program. However, some events use more than
one trigger resource. Table 3–3 lists the trigger resources and any interactions
that may occur when you use them.
3–20
TLA 700 Series Logic Analyzer User Manual

T able 3–3: Trigger resources
Resource Operator Interactions and restrictions
Word =, Is Not
One trigger resource across all defined
channel groups.
Group
Setup
Word recognizer
Range recognizer
Change detector
Channel
Word recognizer =
Change detector
Glitch
Setup & Hold Fault
Counter
=, Is Not One trigger resource per channel
group.
<, <=, >=, >, Is In,
Is Not In
Three trigger resources per channel
group.
Changes One trigger resource per group event,
one change detector allowed in a
trigger program, not available when
transitional storage is used.
One trigger resource per channel
group.
Goes, Doesn’t go One trigger resource, one change
detector allowed in a trigger program,
not available when transitional storage
is used.
One trigger resource, only available
with internal (asynchronous) clocking.
One trigger resource, only available
with external (synchronous) or custom
clocking.
>, <= 0 trigger resources, 2 counters or
2 timers.
Maximum width 51 bits
Maximum clocking 250 MHz
Maximum count 2
51
Timer
TLA 700 Series Logic Analyzer User Manual
Counter 1 and 2 events conflict with
Timer 1 and 2 events respectively.
>, <= 0 trigger resources, 2 counters or
2 timers
Maximum width 51 bits
Maximum clocking 250 MHz
Maximum time 2,000,000 S
(23 days)
Counter 1 and 2 events conflict with
Timer 1 and 2 events respectively.
3–21

Setup
T able 3–3: Trigger resources (Cont.)
Resource Interactions and restrictionsOperator
Signal (Signal in)
Is True, Is False One trigger resource, uses one of four
system signals. Only one signal event
is available in a trigger program.
Trigger Actions
Anything
0 trigger resources. Used as a placeholder. Not available with the OR
conjunction.
Nothing
0 trigger resources. Used as a placeholder with the OR conjunction.
After defining the events in the If (event) portion of the clause, you can select
one or more trigger actions to complete the clause. Table 3–4 lists the trigger
actions available for your trigger program.
T able 3–4: Trigger actions
Action Description
Trigger Triggers the current module. When you use Trigger in the
trigger program, you cannot use Trigger All Modules.
Trigger All Modules Also known as a System trigger. This signal is also
available at the System Trigger Out connector. When you
use Trigger All Modules in the trigger program, you cannot
use Trigger.
Go To Passes the program flow to a different trigger state. You
can only use one Go To action in the clause definition.
3–22
Counter and Timer actions Starts, stops, resets, or clears counters or timers.
Counter 1 and 2 actions conflict with Timer 1 and 2
actions respectively . Counter/timer actions may conflict
with counter/timer event usage.
Set and Clear Signal Sets or clears one of the four internal system signals. You
can use only one Set or Clear in a trigger program. The
Set or Clear Signal is mutually exclusive with the Arm
Module action.
Arm Module Sends an Arm signal to another module. The other
module begins running its trigger program. You can arm
only one module in a trigger program. However, you can
use actions throughout the trigger program. Arm Module
is mutually exclusive with Set and Clear Signal actions.
Store Sample Stores exactly one sample. Not available in Start/Stop
storage mode.
TLA 700 Series Logic Analyzer User Manual

Setup
T able 3–4: Trigger actions (Cont.)
Action Description
Start & Stop Storing Begins or ends storing of samples. Start and Stop Storing
actions only appear when you select Start/Stop storage
mode. Use Start and Stop Storing in conjunction with
Start/Stop storage mode in the Trigger window. Available
only in Start/Stop storage mode.
Do Nothing Use as a placeholder when defining a complicated trigger
program. Does not override other actions specified in a
clause.
Other Trigger Options
From the Trigger window, you can also make data storage and trigger position
selections.
Storage. Use the storage selections to avoid filling up the acquisition memory
with data samples that do not interest you. You can use the storage selections to
disqualify the unwanted data samples and fill memory only with the desired data.
Use the Storage box to select the default data storage rules for the module. Use
one of the storage actions in the Then statement of the clause definition to
override the default storage setting.
The example shown in Figure 3–14 is using conditional storage. Data is stored
only when the specified event is true.
Figure 3–14: Using trigger storage
TLA 700 Series Logic Analyzer User Manual
3–23

Setup
Trigger Position. The Trigger Position selects the amount of posttrigger data that
is stored and determines the position of the trigger in the data record.
After a module has triggered, it continues to acquire data until it fills a specified
amount of memory. The total memory depth that the module fills is set in the
Memory Depth box in the Setup window. The proportion of data that is stored
before and after the trigger is determined by the Trigger Position field. For
example, if the Trigger Position is set to 10%, and the module triggers, then the
module continues to acquire posttrigger data until the remaining 90% of memory
is filled.
If the trigger event occurs on any data sample before the specified amount of
pretrigger data has occurred, then the logic analyzer triggers and begins filling
memory with posttrigger data regardless of the amount of pretrigger data
specified. For example, if you set the trigger position to 50% and set the logic
anlayzer to trigger on a processor reset, start the logic analyzer, then power on
your target system, the logic analyzer will trigger. However, the logic analyzer
memory will be filled only with posttrigger data, not any pretrigger data. This is
due to the trigger event, which has higher precedence, occurring before the
pretrigger condition is satisfied.
Saving Trigger Programs
You can save your trigger programs for future use by means of the Save Module
or Save System functions. Although these functions save more than just the
trigger program, you can load just the trigger program from one of the saved
files. For more information, see Saving and Loading Setups, Triggers, and Data
on page 3–35.
Setting Up the DSO Module
Before acquiring and displaying an analog waveform, you must first set up the
DSO using the DSO Setup window. You can set the vertical, horizontal, and
trigger parameters manually, or you can use Autoset for a quick automatic setup
based on the input signal.
NOTE. The setup and data windows operate independently; you cannot change
setup parameters by changing the data display. Once you acquire data, you can
manipulate the display, but that will not change the input settings used to
acquire the data. You must return to the DSO Setup window to change input
settings which take effect with the next acquisition.
H To open the DSO Setup window, go to the System window and click the
DSO Setup button.
3–24
TLA 700 Series Logic Analyzer User Manual
 Loading...