

Page 1

TimeView™
xx
ZZZ
Modulation Domain Analyzer Software
User Manual
*P077051300*
077-0513-00
Page 2

Page 3

xx
TimeView™
ZZZ
Modulation Domain Analyzer Software
User Manual
www.tektronix.com
077-0513-00
Page 4

Copyright © Tektronix. All rights reserved. Licensed software products are owned by Tektronix or its subsidiaries
or suppliers, and are protected by national copyright laws and international treaty provisions.
Tektronix products are covered by U.S. and foreign patents, issued and pending. Information in this publication
supersedes that in all previously published material. Specifications and price change privileges reserved.
TEKTRONIX and TEK are registered trademarks of Tektronix, Inc.
TimeView is a trademark of Pendulum AB.
Contacting Tektronix
Tektronix, Inc.
14150 SW Karl Braun Drive
P.O . Bo x 5 0 0
Beaverton, OR 97077
USA
For product information, sales, service, and technical support:
In North America, call 1-800-833-9200.
Worldwide, v i s it www.tektronix.com to find contacts in your area.
Page 5

Warranty
Tektronix warrants that the media on which this software product is furnished and the encoding of the programs on
the media will be free from defects in materials and workmanship for a period of three (3) months from the date of
shipment. If any such medium or encoding proves defective during the warranty period, Tektronix will provide
a replacement in exchange for the defective medium. Except as to the media on which this software product is
furnished,
Tektronix does not warrant that the functions contained in this software product will meet Customer’s requirements
or that the operation of the programs will be uninterrupted or error-free.
In order to obtain service under this warranty, Customer must notify Tektronix of the defect before the expiration
of the warranty period. If Tektronix is unable to provide a replacement that is free from defects in materials and
workmanship within a reasonable time thereafter, Customer may terminate the license for this software product
and return this software product and any associated materials for credit or refund.
THIS WARRANTY IS GIVEN BY TEKTRONIX WITH RESPECT TO THE PRODUCT IN LIEU OF ANY
OTHER WARRANTIES, EXPRESS OR IMPLIED. TEKTRONIX AND ITS VENDORS DISCLAIM ANY
IMPLIED WARRANTIES OF MERCHANTABILITY OR FITNESS FOR A PARTICULAR PURPOSE.
TEKTRO
PAYMENT IS THE SOLE AND EXCLUSIVE REMEDY PROVIDED TO THE CUSTOMER FOR BREACH
OF THIS WARRANTY. TEKTRONIX AND ITS VENDORS WILL NOT BE LIABLE FOR ANY INDIRECT,
SPECIAL, INCIDENTAL, OR CONSEQUENTIAL DAMAGES IRRESPECTIVE OF WHETHER TEKTRONIX
OR THE VENDOR HAS ADVANCE NOTICE OF THE POSSIBILITY OF SUCH DAMAGES.
[W9b – 15AUG04]
this software product is provided “as is” without warranty of any kind, either express or implied.
NIX’ RESPONSIBILITY TO REPLACE DEFECTIVE MEDIA OR REFUND CUSTOMER’S
Page 6

Page 7

Table of Contents
Preface.............................................................................................................. iii
Running TimeView Software and Hardware Connection ............................. ......................... 1
Connecting the Instrument.................................................................................... 1
Interface O
The Menu Bar........................................ ................................ ............................... 4
File Menu................ ................................ ................................ ....................... 4
Instrument Menu.................................. ................................ ............................. 4
Capture Menu ........... ................................ ................................ ....................... 5
Tools Menu..................................................................................................... 6
Graph Me
View Menu ........................ ................................ .................................. ........... 7
Help Menu...................................................................................................... 7
The Toolbars . ................................ ................................ .................................. ..... 8
The Standard Toolbar.......................................................................................... 8
The Counter Toolbar ....................... .................................. ................................ 12
The M
The Capture Data Area.......................... ................................ .................................. 16
Measurement Data Tab....................................................................................... 16
Graph Data Tab ............................................................................................... 17
The Graph Area.................... ................................ ................................ ................ 18
Cursors ................... ................................ .................................. .................... 19
Th
The Status Readout ........................ ................................ .................................. ...... 22
Taking a Quick Measurement ...................... ................................ .............................. 23
Viewing Example Data Captures ........ ................................ ................................ ........ 24
verview ................................................................................................. 3
nu .................................................................................................... 6
easurement Toolbar ................................................................................... 13
e Graph Shortcut Menus .................................................................................. 19
TimeView User Manual i
Page 8

Table of Contents
ii TimeView User Manual
Page 9

Preface
About This Manual
This manual describes the functions and features of the TimeView™ Modulation
Domain Analyzer Software application. The TimeView application supports
the following Tektronix instruments:
FCA3000 Series (FCA3000, FCA3003, and FCA3020)
Timer/Counter/Analyzers
FCA3100 Series (FCA3100, FCA3103, and FCA3120)
Timer/Counter/Analyzers
MCA3000 Series (MCA3027 and MCA3040) Microwave Counter/Analyzers
TimeView User Manual iii
Page 10

Preface
iv TimeView User Manual
Page 11

Running TimeView Software and Hardware Connection
You must connect TimeView to the FCA3000, FCA3100, or MCA3000 Series
instrument before you can take and analyze measurements in the TimeView
application
NOTE. You can also view saved data files in TimeView. However, a very limited
set of functions is available when viewing a saved data file as opposed to taking
and analyzing a live measurement acquisition.
Connecting the Instrument
Do the following to connect the instrument to TimeView:
1. Open the TimeView application.
2. Use a USB or GPIB cable to connect the instrument to the PC with the
TimeView software.
3. Turn on the instrument and wait for about 10 seconds. Verify that the
instrument is set for the correct remote connection (USB or GPIB).
4. In TimeView, click In strument > Connect. TimeView automatically
recognizes the instrument and opens a dialog box listing the instrument.
.
Disconnecting the
Instrument from TimeView
5. Click OK. The main TimeView window changes to enable the tool bar
functions.
To disconnect the instrument from the TimeView software, click Instrument >
Disconnect. You can now disconnect the instrument from the USB or GPIB
cable and/or power off the instrument.
NOTE. You must disconnect the instrument from the TimeView software before
owering down the instrument.
p
TimeView User Manual 1
Page 12

Running TimeView Software and Hardware Connection
2 TimeView User Manual
Page 13

Interface Overview
The following pages describe the TimeView application interface and functions.
The TimeView application window contains the Menu bar, the Toolbar, the
Capture Data area, the Graph area, and the Status readout.
1. Menu bar (See page 4, The Menu Bar.)
2. Toolbars (See page 8, The Toolbars.)
3. Grapharea(Seepage18,The Graph Area.)
4. Sta
5. Information tabs (See page 16, The Capture Data Area.)
tus readout (See page 22, The Status Readout.)
TimeView User Manual 3
Page 14

The Menu Bar
The Menu Bar
File Menu
The Menu bar provides access to all TimeView functions. The following sections
describe each menu item.
Item Description
Open Opens a data file created by the TimeView application.
*.ssd – Free Running Measurement File
*.rsd – Repetitive Sampling Data File
*.wad – Waveform Data File
*.tsd–TimestampDataFile
Save As Saves the current captured waveform data (not available with
30-day trial version of software).
Load/Save settings Loads/Saves the current application configuration to allow easy,
quick switching between different types of measurements.
Print
Recent files Lists recently opened waveform data files. This area remains
Prints the active graph. If zoomed, only the zoomed part is
printed (not available with 30-day trial version of software).
blank until the first file is opened.
Instrument Menu
Item Description
Connect/Disconnect Connects or disconnects a product instrument to the TimeView
lication.
app
NOTE. Always use this menu item to disconnect the instrument
from the TimeView application before disconnecting the USB or
B cable from the instrument or computer.
GPI
IB/USB Timeout
GP
ts the amount of time the application will wait for data from
Se
the instrument before incurring a time-out error. This is an
instrument-specific menu item and is only available for particular
oduct equipment.
pr
4 TimeView User Manual
Page 15

Capture Menu
Item Description
Settings Configures con
access to all configurable settings availableontheinstrument.
The functions present in the window are instrument dependent,
that is, diffe
rent instruments may have different settings.
NOTE. Selecting Default Settings in the Counter Settings
dialog box will reset all tabs of the instrument settings to their
t just those settings on the selected tab.
ounter to its default configuration. This does not
Load Defaul
t Settings
defaults, no
Resets the c
affect TimeView application settings, though the application
toolbar will show instrument setting changes.
The Menu Bar
nected counter settings. O pens a window with
Configure
Item Description
Free Runn
Repetitive Sampling Captures the selected measurement function, such as frequency
Wavefo
Raw Ti
Totalize (FCA3100
Seri
Start selected capturing Captures waveform data as set by the current measurement
Abort current capturing
ontinuous
C
easurement Readout
M
Signal Readout Displays a snapshot summary of basic information about the
s settings to control capture and display of waveforms.
ing
rm
mestamp
es only)
Captures the selected measurement function in a continuous
block of time.
yed time intervals. Requires external arming.
at dela
es the shape of the waveform in terms of voltage versus
Captur
time.
Captures trigger level crossings on the measured waveform. The
captured data consists of groups each containing four samples.
arks are displayed by a square wave with its positive and
Time m
negative transitions corresponding to the positive and negative
transitions of the measured waveform.
Performs different arithmetic combinations of two waveforms
ured on the A and B channels. After the measurement
meas
is taken the arithmetic combinations are available through the
shortcut menu on the graph (right-clicking on the graph area).
figuration.
con
ops a continuous capture.
St
ill continuously capture waveform data per the current
W
measurement configuration until manually interrupted.
Displays a real-time readout of a selected measurement function
in a separate window. Measurement Readout is only available
when Capture Type is set to Free Running.
current signal read by the counter. Click Update to refres h the
display.
TimeView User Manual 5
Page 16

The Menu Bar
Tools Menu
Item Description
Settings The settings w
toolbar for each of the different Capture Types. (See page 11,
Time Stamp.)
Load Default Settings Loads the TimeView application default settings.
Item Description
Source Data Displays the raw data as collected per the measurement function
setting.
Histogram Displays the data as a histogram.
Spectrum Displays the data in its frequency spectrum using the FFT.
Smooth Displays a waveform based on the averaging of a user definable
number of coincident points.
Options
Displays additional settings related to the Tools menu items:
indow mirrors all of the functions available on the
Graph Menu
Bin Units toggles the y-axis to have units of either a percentage
of samples per bin, or number of samples per bin.
Number of Bins changes the granularity of the range of values
associated with each bin, or bar, in the histogram.
Auto FFT Size enables the application to determine the ideal
number of points to compute the FFT if selected.
Rectangular, Hamming, Hanning window sets the type of
windowing algorithm to use for FFT measurements.
Number of average sets the number of coincident points to use
when finding the average value for a particular point. This will
affect the total number of points displayed on the graph. For
example, with 100 samples, a value of 50 would reduce the total
number of points on the graph to 50.
Item Description
Cursor Style Changes the cursors displayed on the graph to a small circle,
medium rectangle, or large cross.
Data Draw Style Sets the line styles to use for data display.
Color Theme Controls the colors of graphical objects. You can create and
ave one custom theme, which is automatically saved when
s
you click OK.
6 TimeView User Manual
Page 17

Item Description
Zoom In/Zoom O
Clear All
ut
Zooms in and out on the graph; however, a better way to zoom
is to click-an
rectangular box formed by the click-and-hold action over the
desired region.
Deletes the collected data, removing the graphs, and numerical
data.
The Menu Bar
d-hold on the graph while dragging the dotted
View Menu
Help Menu
NOTE. You ca n
Vertical Axis Range,
Horizontal
Item Description
Panes Layout
Toolbar Standard Enables or disables displaying the Standard toolbar.
Toolbar Counter Enables or disables displaying the Counter toolbar.
Toolbar Measuring Enables or disables displaying the Measuring toolbar.
Information Pane Enables or disables displaying the data information pane.
Axis Range
Allows manu
show on the axes.
Changes the number of graphs that appear in the graph pane.
You can display up to four graphs simultaneously. Each new
graph is randomly chosen from the options remaining. To change
the graph appearing in one of the new graph sub-panes, click
that sub-pane, and select the desired graph from the Tools menu
or the toolbar.
not undo this operation.
al definition of magnitudes of units and ranges to
Item Description
Help
About TimeView
Registration
Opens the TimeView online help window.
Displays TimeView software version number and PC/instrument
figuration information.
con
ns a dialog box that lets you register the TimeView
Ope
application. Software registration is not available for the 30-day
free trial version of the software; you must purchase the
meView software CD to obtain a registration key.
Ti
TimeView User Manual 7
Page 18
The Toolbars
The Toolbars
The toolbars provide fast access to most of the functions available in the
application menus. There are three toolbars:
The Standard toolbar (See page 8, The Standard Toolbar.)
The Counter toolbar (See page 12, The Counter Toolbar.)
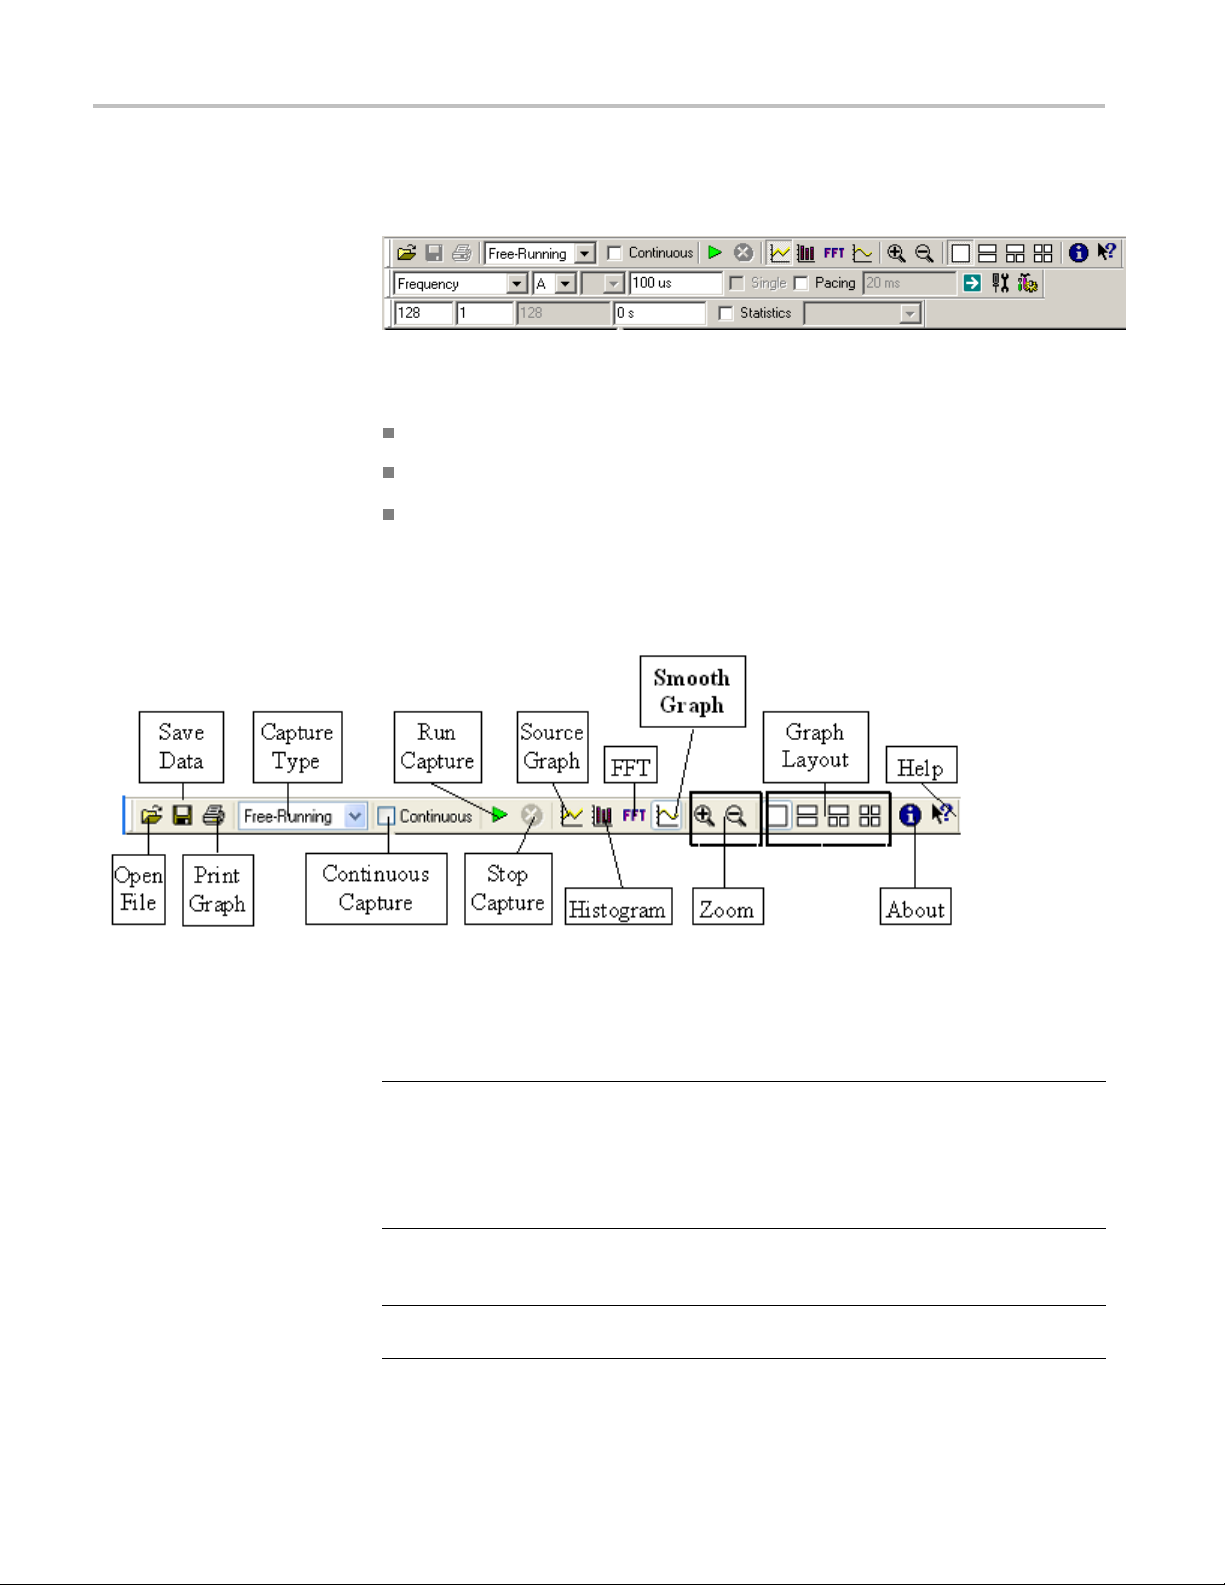
The Standard Toolbar
Figure 1: Standard toolbar
The Measu
Item Description
Open File Opens a data file created by the TimeView application.
Save Data Saves the current captured waveform data (available with the
rint
P
rement toolbar (See page 13, The Measurement Toolbar.)
*.ssd – Free Running Measurement File
sd – Repetitive Sampling Data File
*.r
*.wad – Waveform Data File
*.tsd–timestampDataFile
censed version of the application) per the types listed in Open
li
File.
Prints the active graph. If zoomed only the zoomed part is printed
(available with the licensed version of the application).
8 TimeView User Manual
Page 19

The Toolbars
Item Description
Capture Type
The list of typ
connected hardware. Five capture types exist over all hardware
lines:
Free Running c
continuous block of time.
Repetitive Sampling captures the selected measurement
function (su
external arming.
es displayed in the menu changes based on
aptures the selected measurement function in a
ch as frequency) at delayed time intervals. Requires
NOTE. Once external arming is activated, the instrument uses
external ar
Time Stamp
waveform. The captured data consists of groups each containing
four samples. Time marks are displayed by a square wave
with its po
measured waveform and its trigger level crossings with positive
and negative slope. Up to 125 kHz (interpolator calibration ON) or
250 kHz (i
stamped, both positive (+ Slope) and negative (- Slope). Above
these limits, there is a certain dead time, 8 µs or 4 µs, before the
next gro
extend the sampling interval. (See Figure 2 on page 11.)
Totalize (FCA3100 Series only) allows different arithmetic
combinations of two waveforms measured on the A and B
channe
combinations are available through the shortcut menu on the
graph (right-clicking on the graph area).
Waveform captures the shape of the waveform in terms of
volta
nuous Capture
Conti
Run Capture
Stop Capture Stops the current measurement.
Source Graph Displays a graph of the data as collected per the measurement
Histogram
FT
F
Smooth Graph Applies a smoothing algorithm to the a graph of the collected
Conti
manually stopped, at which point the last collected and displayed
data is kept.
Runs the measurement.
nction with no manipulation.
fu
splays a graph of the collected data in a histogram. Uses the
Di
Histogram settings available in the Tool Options dialog box.
Displays a graph of the collected data after application of a FFT.
Uses the FFT settings available in the Tool Options dialog box.
data. Uses the Smooth settings available in the Tool Options
dialog box.
ming for all other capture types until it is disabled.
captures trigger level crossings on the measured
sitive and negative transitions corresponding to the
nterpolator calibration OFF), all transitions can be time
up is recorded. Changing the pacing parameter can also
ls. After the measurement is performed, the arithmetic
ge versus time.
nually collects data, and displays each collection until
TimeView User Manual 9
Page 20

The Toolbars
Item Description
Zoom
Zooms the curr
x-axis by dividing or multiplying the total time displayed on the
x-axis by 2.
You can use the
the cursors on the graph (See page 19, Cursors.) Then right-click
the graph and select Zoom In To Cursors.
You can also c
of interest on the graph.
NOTE. Auto Range must be selected in the Define Axis window
to enable th
accessed in the graph shortcut menu. (See page 19, The Graph
Shortcut Menus.)
ent graph in or out about the midpoint of the
cursors to zoom on an area of interest. Position
lick and hold on the graph to zoom in on the area
e toolbar zoom functions. The Define Axis window is
Graph Layout Controls how many graphs (up to four) are displayed in the graph
pane.
You can configure each new sub-pane in the graph pane to
display a different type of graph by clicking in the desired
sub-pane and selecting one of the four different types of graphs
(Source, Histogram, F FT, Smooth) from the toolbar.
About
Help
Displays information about the TimeView application.
Opens the TimeView help documentation to information about
that specific piece of the application if it exists.
10 TimeView User Manual
Page 21

Time Stamp
The Toolbars
Figure 2: Raw time stamp example
The preceding figure displays the result of a raw time stamp function on a 10 MHz
periodic input signal, zoomed to show only one group. The group consists of
four time stamps taken on consecutive trigger level crossings, without dead
time. So the time stamps in this case are recorded every 50 ns. The time to the
next group of time stamps is set by the pacing parameter. Its setting range is 0
to 500
valid if the interpolator calibration is ON. You can see the influence of the pacing
by zooming out the graph.
However, the counter that accumulates clock ticks every 10 ns is not interrupted
but read off at the pacing intervals. From there the basic 10 n s resolution can be
improved to 100 ps (FCA3000 Series) or 50 ps (FCA3100 Series) by the analog
interpolators that are continually calibrated, if this function is activated. The
trade-off is the longer dead time. The cursors (red and green X’s) are positioned
to
with positive slope.
Yo
the input signal at the time stamps recorded for the positive transitions. You can
see the contents of this counter as a new graph by right-clicking in the graph and
then selecting Event Count from the pop-up menu.
By combining event and time stamp data in a postprocessing block, you can
calculate the statistics functions ADEV and MADEV, also by right-clicking in the
Trigger Event graph and selecting the desired function from the pop-up menu.
seconds, but the real minimum time is 4 µs or 8 µs, the latter value being
measure one period of the input waveform from one zero crossing to the next
ualsoneedaneventcountertokeeptrack of the total number of periods of
TimeView User Manual 11
Page 22

The Toolbars
The Counter To
olbar
Item Descriptio
Measurement Function
Input 1 Source Selects the source input on the counter to use as input 1 in the
Input 2 S
Measurement Time (for
frequency and period
avera
only)
Single-Cycle
Measurement
Pacing (Interval Between
Measurements)
Real-Time Measurement
Rea
Counter Settings See the instrument user manual for information on how to
Capture Settings (See page 5, Capture Menu.)
ource
ge measurements
dout
Allows sel
the connected counter. See the instrument user manual for
descriptions of the available measurements.
applicat
Selects
application. This input is only used with particular Measurement
Functions. If the Measurement Function requires this input it
will bec
selected.
Sets the time interval between samples. For Burst measurements
the time interval should be shorter than the burst.
See th
more measurement information.
The FCA3000, FCA3100, and MCA3000 Series instruments
are single-cycle measurement instruments. In the TimeView
appl
out.
Sets the time between individual measurements.
See the Single-cycle Measurement description above for more
mea
Ope
Measurement Function is selected.
configure these settings.
n
ection of the different measurements possible on
ion.
the source input on the counter to use as input 2 in the
ome available in the application when that function is
e Single-Cycle Measurement description that follows for
ication, the Single-Cycle Measurement check box is grayed
surement information.
ns a window that displays a real-time readout of whichever
12 TimeView User Manual
Page 23

The Measurement Toolbar
Unlike the other Toolbars, which activate or deactivate fields based on choice of
Capture Type, but maintain the same layout, the Measurement Toolbar changes its
layout based on the Capture Type selected. A different Measurement toolbar is
shown for each Capture Type.
The Toolbars
Free Runnin
Measurement Toolbar
g
Item Description
Samples in Block The number of samples per block.
Blocks
Total Samples Total number of samples = samples in block x blocks
Block Time Delay
Statistics Collects the data based on measurement settings, then
Statistics Function
The number of blocks of samples to collect.
The time interval to wait between capturing each block of
samples.
calculates and displays the value associated with the s elected
Statistics Function.
The selected statistics algorithm is applied to the collected data,
and the result displayed in the graph pane.
TimeView User Manual 13
Page 24

The Toolbars
Repetitive Sam
pling
Measurement Toolbar
Item Description
Start Time Sets a delay from the arming signal to the start of data collection.
Sample Interval
Number of Samples Stops the data collection after a given number of samples.
Auto Stop Automatically chooses a stop time. Stop Time in the Auto
Stop Time Stops the collection of data after a given time, or displays the
Auto Calculation
Parameter
The interval at which samples are collected.
Calculation Parameter performs the same function as this
function.
stop time that was automatically selected if Auto Stop is set up
correctly.
The TimeView application automatically selects the value for this
parameter. If Stop Time is the selected parameter, then Auto
Stop is superfluous.
Time Stamp Measure ment
bar
Tool
mber of groups. This is the only time stamp parameter that you can select.
Nu
Each group contains four samples. See Time Stamp for more information. (See
page 11.)
14 TimeView User Manual
Page 25

The Toolbars
Waveform Measu
rement
Toolbar
Item Description
Waveform Time
Resolution
Start Time Sets a delay to start the data collection.
Auto Stop Time
Stop Time Manually set the stop time of data collection.
Auto Voltage Resolution The application sets the trigger step interval between voltage
Voltage Resolution Manually set the step interval voltage between trigger events.
The minimum time between successive samples at a voltage
resolution level.
Setting the resolution higher than the period of the input wave
can cause only one cycle of the wave to be displayed even if
Stop Time is set so it would display multiple cycles.
As an example, assume a 10 MHz sine wave input signal with a
period of 100 ns. If the resolution is set at 100 ns, the expected
number of cycles is based on the Stop Time. For a Stop Time =
300 ns, the application selects 3 cycles.
If everything remains set the same, except the resolution is
changed to 150 ns, the middle cycle of the 3 expected cycles
is missing.
The application sets the stop time.
levels to a value resulting in approximately 50 steps between
peak-to-peak voltage levels.
TimeView User Manual 15
Page 26
The Capture Data Area
The Capture Da
ta Area
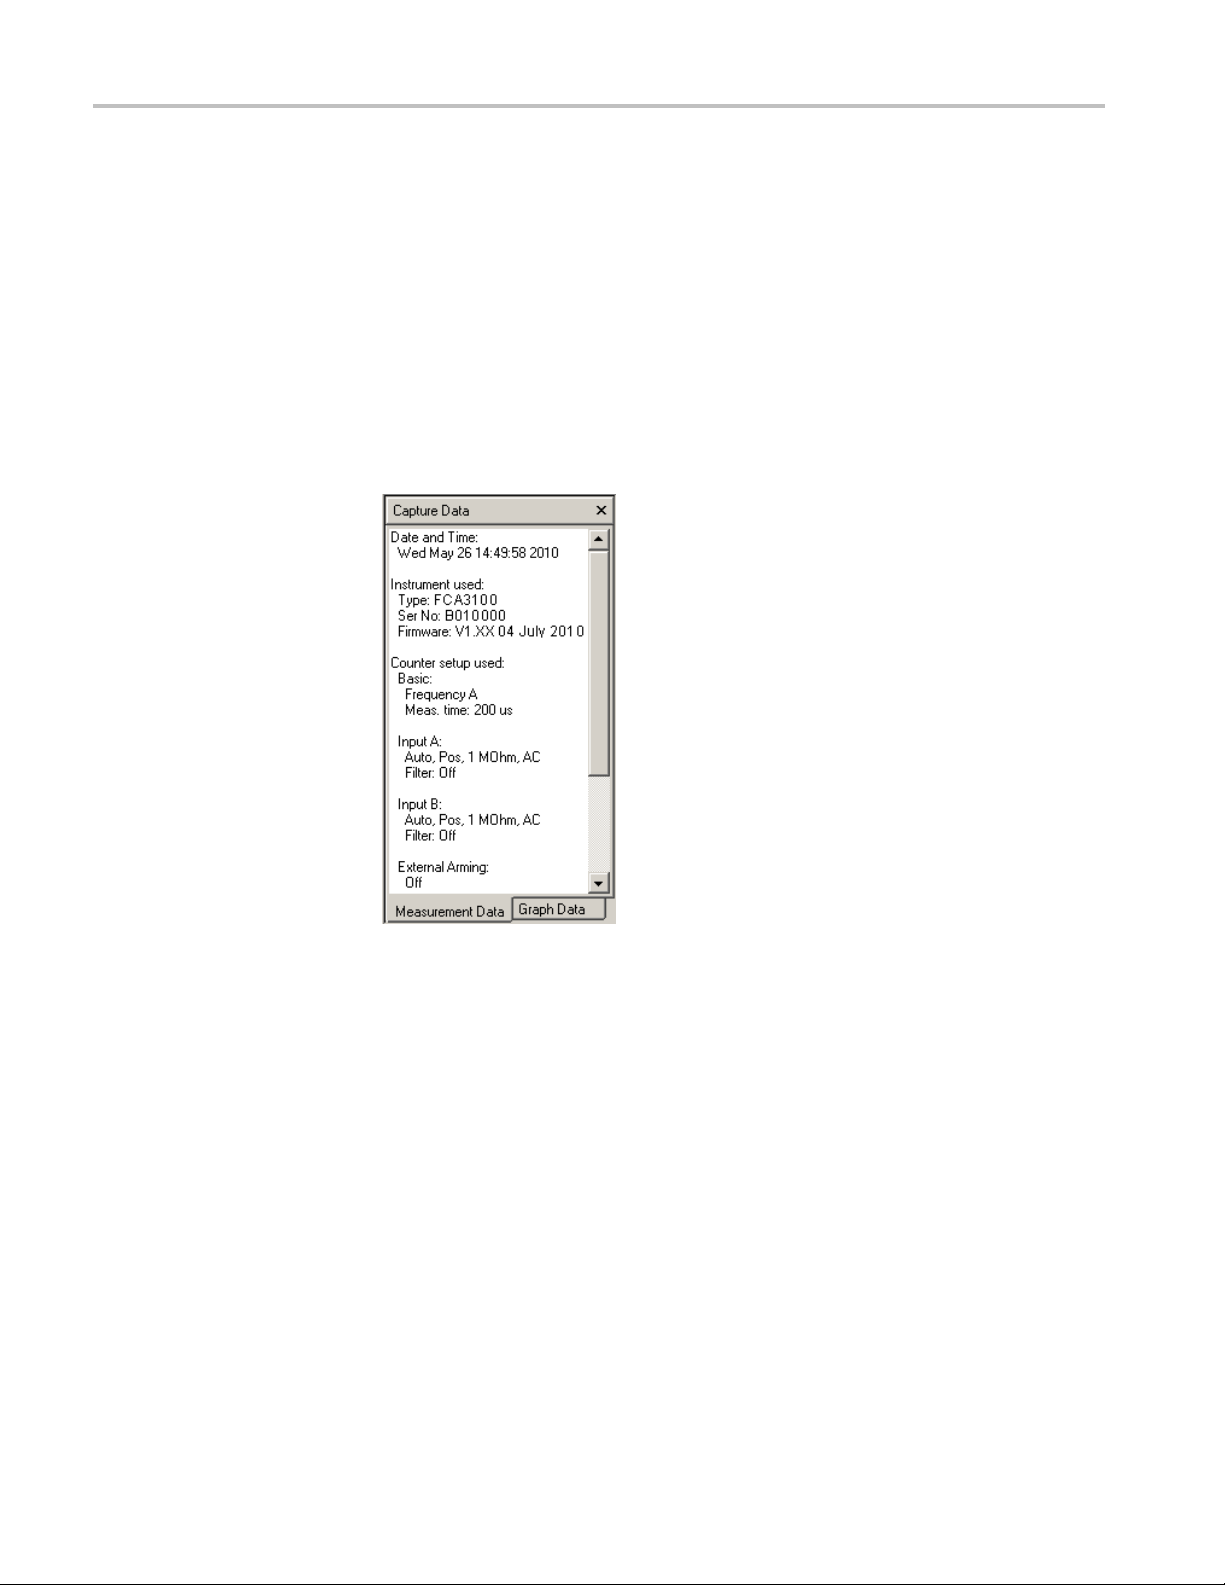
Measurement Data Tab
The Capture D
detailed information about values associated with the graph cursors. There a re two
tabs in the Capture Data area: the Measurement Data tab and the Graph Data tab.
The Measurement Data tab provides a brief summary of high-level settings for the
current measure ment.
ata area displays information about the measurement setup and
16 TimeView User Manual
Page 27
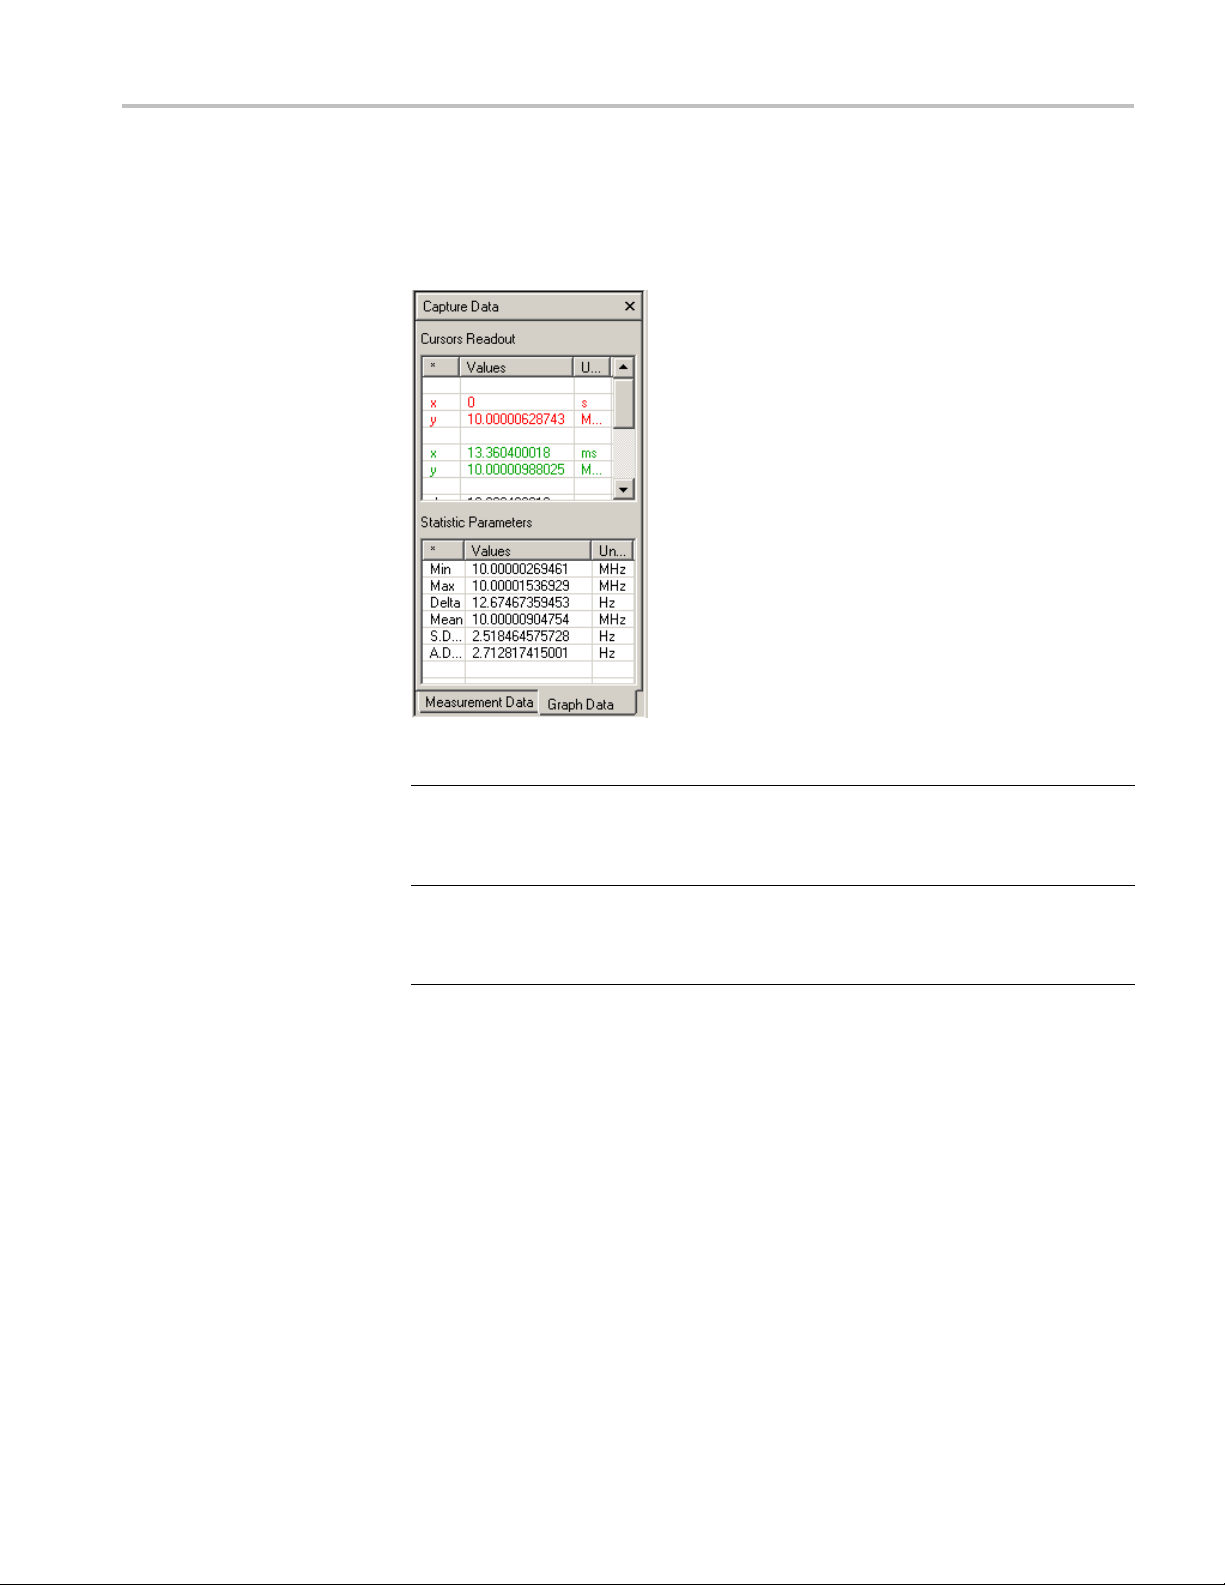
Graph Data Tab
The Capture Data Area
The Measurement Data tab provides detailed information about values associated
with the graph cursors.
Item Description
Cursors Readout Displays information about the cursors including absolute
on, distance of separation, and the associated units. These
positi
values automatically update as you move the cursors in the
graph pane.
Statistic Parameters Displays all of the statistics for the measurement without requiring
ividual run for each desired statistic. The statistics also
an ind
appear for some capture types without a statistics option on their
toolbar.
TimeView User Manual 17
Page 28

The Graph Area
The Graph Area
The Grap
visual form.
You can
screen layout. (See page 8, The Standard Toolbar.) Each sub-pane contains a
different graph type. Click a pane to activate it and update the Graph Data tab
with values from that pane.
h area displays the information collected from the measurement in
use the Graph Layout buttons to split the Graph area into the selected
18 TimeView User Manual
Page 29

The Graph Area
To change the ty
graph area and click one of the graph types from the Standard Toolbar. (See
page 8, The Standard Toolbar.)
Cursors
Two cursors appear on a graph, or on the sub-pane of the selected graph if the
graph area is split. Use the mouse to click and drag a cursor to a desired position.
You can also use the keyboard arrow keys to move the left cursor (red by default),
or press and hold the Shift key and use the arrow keys to move the right cursor
(green by d
The Graph Shortcut Menus
Ashortc
positioned within the graph area. The shortcut menu content changes depending
on the graph type.
Free Running, FFT, and
Smooth G raph Shortcut
Menus
The fol
graph types:
Zoom In/Out. Provides the same functionality as the zoom functions on the
standard toolbar.
pe of graph shown in the graph area or sub-pane, click in the
efault).
ut menu is available for each graph by right-clicking with the cursor
lowing menu items are available on Free Running, FFT, and Smooth
Zoom in to cursors. This is the best way to zoom into a particular region of a
graph. By setting the cursors to the desired range using the techniques described
in Cursors, and then selecting this function, the graph zooms the data between the
sors.
cur
Zoom out full graph. Zooms out to the extent necessary to display all of the
collected data. This is the fastest way to return the graph to its furthest zoom.
TimeView User Manual 19
Page 30
The Graph Area
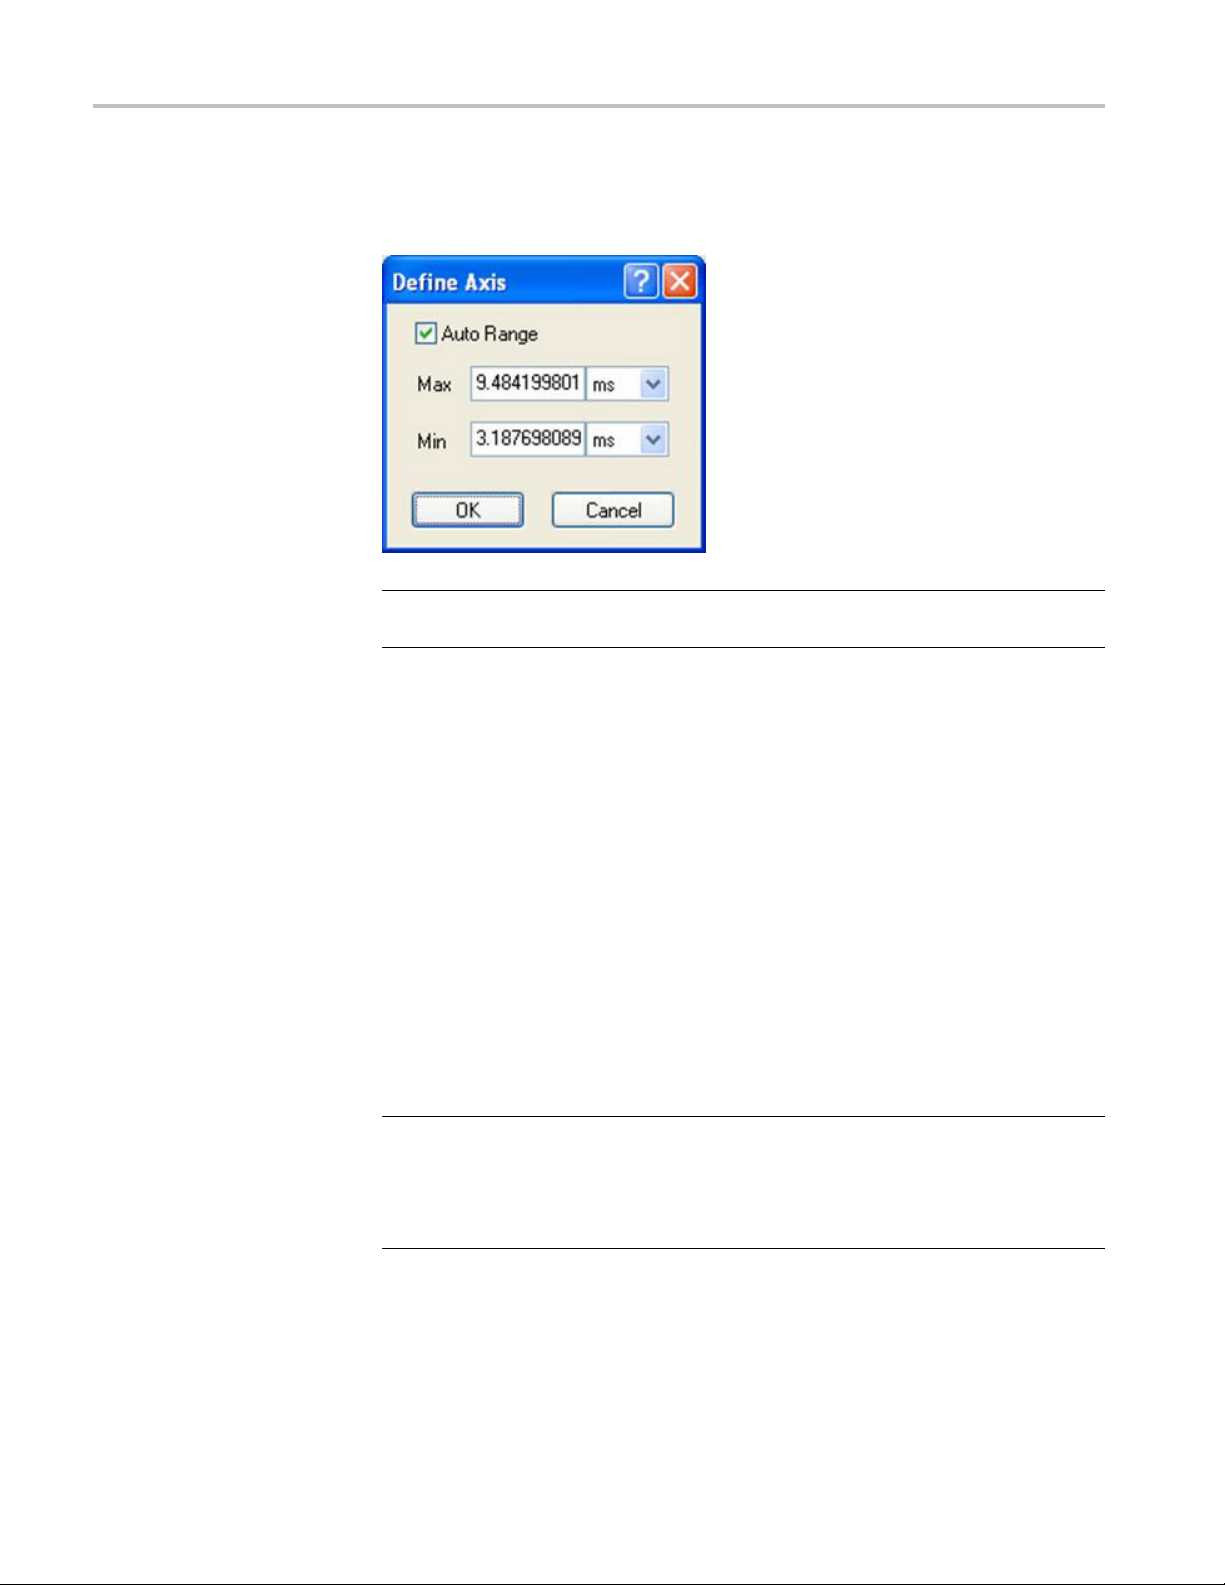
Horizontal/Ve
set the range, deselect Auto Range, and enter the desired values into the Max/Min
fields.
NOTE. Deselecting the Auto Range check box will disable the ability to zoom. The
Auto Range check box must be checked to zoom.
The Vertical Axis has an AutoZoom option. This automatically adjusts the vertical
range to create some space between min/max points and the edges of the graph. It
is reco
rtical axis. Manually sets the range of the x or y axis. To manually
mmended to leave this option selected.
Histogram Context Menu
Limited Histogram. Acts similar to a zoom. Based on the position of the cursors,
selecting this option zooms the histogram to only display the range necessary to
contain the data between the cursors.
Full Histogram. Returns the histogram to the necessary range to display all of
ollected data.
the c
Limit Statistics to Data Between Cursors. Recalculates the statistics based on the
values between the cursors, and places lines on the source graph representing the
new range of data used to calculate the statistical values.
NOTE. The application calculates the statistics based on sampled points. Even
hough the Source Graph may display lines connecting those points, and the new
t
limited range may include those lines, the lines themselves do not contain data
that can be used in the statistical calculation. This may result in an inability to
compute the statistics due to lack of data.
Reset Limits. Resets the Limit to include the entire range of data.
20 TimeView User Manual
Page 31

The Graph Area
Source Graph Shortcu t
Menu
The Source Grap
Graph shortcut menu items, and also the following menu items:
Limit Tools to Data Between Cursors. Changes the range of data used in the
calculation of the other graph types, updating those graphs to reflect their
calculations based on the newly defined data range.
Reset Limits. Resets the Limit to include the entire range of data.
h shortcut menu contains the Free Running, FFT, and Smooth
TimeView User Manual 21
Page 32

The Status Readout
The Status Rea
dout
The Status readout displays text messages relevant to the current measurement
task, the data capture completion status, and the instrument connection status.
22 TimeView User Manual
Page 33

Taking a Quick Measurement
Taking a Quick
Measurement
This section
application using the instrument 10 MHz signal output as the source. The
TimeView application must be running and the instrument connected to
TimeView. (Seepage1,Connecting the Instrument.)
1. On the FCA3000, FCA3100, or MCA3000 Series instrument, connect a 50 Ω
BNC cable from the 10 MHz output on the rear panel of the instrument to
the Input A connector.
2. In TimeView, click Instru ment > Settings.
3. Click the Basic tab, click the Default Settings button, and click OK.This
sets the instrument to its default settings.
4. Click Capture > Load Default Settings and click Yes .
5. Click Tools > Source Data.
6. Click t
and display it in the TimeView application. A complete measurement (data
capture) takes about 26 seconds. Use the toolbar buttons and functions to
explore the user interface with the newly generated capture, or recapture data
using a different capture or measurement type. (See page 8, The Toolbars.)
shows you how to take a very quick measurement in the TimeView
he green arrow button on the toolbar to capture the instrument data
TimeView User Manual 23
Page 34

Viewing Example Data Captures
Viewing Examp
le Data Captures
TimeView sof
The examples are in the C:\Program Files\Tektronix\TimeView 2\Samples folder
(default installation location). Use these capture sample files to explore TimeView
features.
Do the following to view a sample file (or any saved fi le):
1. Click File > Open in the TimeView application.
2. Navigate t
3. Select a sample file and click OK.
tware includes a file of examples for different types of data capture.
otheSamples folder.
24 TimeView User Manual
 Loading...