

Page 1
Complimentary Reference Material
This PDF has been made available as a complimentary service for you to assist in
evaluating this model for your testing requirements.
TMG offers a wide range of test equipment solutions, from renting short to long
term, buying refurbished and purchasing new. Financing options, such as
Financial Rental, and Leasing are also available on application.
TMG will assist if you are unsure whether this model will suit your requirements.
Call TMG if you need to organise repair and/or calibrate your unit.
If you click on the “Click-to-Call” logo below, you can all us for FREE!
TMG Corporate Website TMG Products Website
Disclaimer:
All trademarks appearing within this PDF are trademarks of their respective owners.
Form 080/01
Page 2

THS 710 & THS 720
TekScope
User Manual
070-9247-02
This document applies to firmware version 1.00
and above.
Page 3

Copyright Tektronix, Inc. 1995. All rights reserved.
Tektronix products are covered by U.S. and foreign patents, issued and
pending. Information in this publication supercedes that in all previously
published material. Specifications and price change privileges reserved.
Printed in the U.S.A.
Tektronix, Inc., P.O. Box 1000, Wilsonville, OR 97070–1000
TEKTRONIX and TEK are registered trademarks of Tektronix, Inc.
Tek Secure is a registered trademark of Tektronix, Inc.
TekTools, TekScope, and IsolatedChannel are trademarks of T ektronix, Inc.
Page 4

WARRANTY
Tektronix warrants that this product will be free from defects in materials and
workmanship for a period of three (3) years from the date of shipment. If any such product
proves defective during this warranty period, Tektronix, at its option, either will repair the
defective product without charge for parts and labor, or will provide a replacement in
exchange for the defective product.
In order to obtain service under this warranty , Customer must notify T ektronix of the defect
before the expiration of the warranty period and make suitable arrangements for the
performance of service. Customer shall be responsible for packaging and shipping the
defective product to the service center designated by Tektronix, with shipping charges
prepaid. Tektronix shall pay for the return of the product to Customer if the shipment is to
a location within the country in which the Tektronix service center is located. Customer
shall be responsible for paying all shipping charges, duties, taxes, and any other charges for
products returned to any other locations.
This warranty shall not apply to any defect, failure or damage caused by improper use or
improper or inadequate maintenance and care. Tektronix shall not be obligated to furnish
service under this warranty a) to repair damage resulting from attempts by personnel other
than Tektronix representatives to install, repair or service the product; b) to repair damage
resulting from improper use or connection to incompatible equipment; or c) to service a
product that has been modified or integrated with other products when the effect of such
modification or integration increases the time or difficulty of servicing the product.
THIS WARRANTY IS GIVEN BY TEKTRONIX WITH RESPECT TO THIS
PRODUCT IN LIEU OF ANY OTHER WARRANTIES, EXPRESSED OR
IMPLIED. TEKTRONIX AND ITS VENDORS DISCLAIM ANY IMPLIED
WARRANTIES OF MERCHANTABILITY OR FITNESS FOR A PARTICULAR
PURPOSE. TEKTRONIX’ RESPONSIBILITY TO REPAIR OR REPLACE
DEFECTIVE PRODUCTS IS THE SOLE AND EXCLUSIVE REMEDY
PROVIDED TO THE CUSTOMER FOR BREACH OF THIS WARRANTY.
TEKTRONIX AND ITS VENDORS WILL NOT BE LIABLE FOR ANY
INDIRECT, SPECIAL, INCIDENTAL, OR CONSEQUENTIAL DAMAGES
IRRESPECTIVE OF WHETHER TEKTRONIX OR THE VENDOR HAS
ADVANCE NOTICE OF THE POSSIBILITY OF SUCH DAMAGES.
Page 5

Service Assurance
If you have not already purchased Service Assurance for this product, you may
do so at any time during the product’s warranty period. Service Assurance
provides Repair Protection and Calibration Services to meet your needs.
Repair Protection extends priority repair services beyond the product’s
warranty period; you may purchase up to three years of Repair Protection.
Calibration Services provide annual calibration of your product, standards
compliance and required audit documentation, recall assurance, and reminder
notification of scheduled calibration. Coverage begins upon registration; you
may purchase up to five years of Calibration Service.
Service Assurance Advantages
H Priced well below the cost of a single repair or calibration
H Avoid delays for service by eliminating the need for separate purchase
authorizations from your company
H Eliminates unexpected service expenses
For Information and Ordering
For more information or to order Service Assurance, contact your Tektronix
representative and provide the information below. Service Assurance may not
be available in locations outside the United States of America.
Name VISA or Master Card expiration date or
Company purchase order number
Address Repair Protection (1,2 or 3 years)
City, State, Postal code Calibration Service (1,2,3,4 or 5 years)
Country Instrument model and serial number
Phone Instrument purchase date
Page 6

Table of Contents
General Safety Summary iii. . . . . . . . . . . . . . . . . . . . . . . . . . . .
Preface v. . . . . . . . . . . . . . . . . . . . . . . . . . . . . . . . . . . . . . . . . . . .
In This Manual v. . . . . . . . . . . . . . . . . . . . . . . . . . . . . . . . . . . . . .
Conventions vi. . . . . . . . . . . . . . . . . . . . . . . . . . . . . . . . . . . . . . . .
Getting Started
Product Description 1–1. . . . . . . . . . . . . . . . . . . . . . . . . . . . . . . . . .
Replacing the Battery Pack 1–5. . . . . . . . . . . . . . . . . . . . . . . . . . . .
Using External Power 1–7. . . . . . . . . . . . . . . . . . . . . . . . . . . . . . . .
Using the Tilt Stand 1–8. . . . . . . . . . . . . . . . . . . . . . . . . . . . . . . . . .
Functional Check 1–9. . . . . . . . . . . . . . . . . . . . . . . . . . . . . . . . . . . .
Operating Basics
Functional Overview 2–1. . . . . . . . . . . . . . . . . . . . . . . . . . . . . . . .
Understanding the Front Panel 2–1. . . . . . . . . . . . . . . . . . . . . . . . .
Using Scope Mode 2–6. . . . . . . . . . . . . . . . . . . . . . . . . . . . . . . . . . .
Using Meter Mode 2–7. . . . . . . . . . . . . . . . . . . . . . . . . . . . . . . . . . .
Compensating the Oscilloscope Probes 2–8. . . . . . . . . . . . . . . . . . .
T aking Floating Measurements 2–10. . . . . . . . . . . . . . . . . . . . . . . . .
Application Examples 2–13. . . . . . . . . . . . . . . . . . . . . . . . . . . . . . .
Displaying an Unknown Signal 2–14. . . . . . . . . . . . . . . . . . . . . . . . .
Measuring Resistance 2–16. . . . . . . . . . . . . . . . . . . . . . . . . . . . . . . .
Measuring the Frequency of a Clock Signal 2–18. . . . . . . . . . . . . . .
Measuring Propagation Delay 2–20. . . . . . . . . . . . . . . . . . . . . . . . . .
Triggering on a Missing Data Pulse 2–22. . . . . . . . . . . . . . . . . . . . .
Detecting Narrow Glitches 2–24. . . . . . . . . . . . . . . . . . . . . . . . . . . .
Testing a Switching Transistor Drive Circuit 2–26. . . . . . . . . . . . . .
Measuring Instantaneous Power Dissipation
in a Switching Transistor 2–28. . . . . . . . . . . . . . . . . . . . . . . . . . .
Triggering at a Specific Motor RPM 2–30. . . . . . . . . . . . . . . . . . . . .
Using the Oscilloscope and DMM at the Same Time 2–32. . . . . . . .
Monitoring for Power Surges and Dropouts 2–34. . . . . . . . . . . . . . .
Triggering on a Video Field 2–36. . . . . . . . . . . . . . . . . . . . . . . . . . . .
Triggering on a Video Line 2–38. . . . . . . . . . . . . . . . . . . . . . . . . . . .
THS 710 & THS 720 User Manual
i
Page 7

Table of Contents
Reference
Introduction to Reference 3–1. . . . . . . . . . . . . . . . . . . . . . . . . . . .
ACQUIRE 3–3. . . . . . . . . . . . . . . . . . . . . . . . . . . . . . . . . . . . . . . . .
AUTORANGE 3–8. . . . . . . . . . . . . . . . . . . . . . . . . . . . . . . . . . . . . .
CURSOR 3–11. . . . . . . . . . . . . . . . . . . . . . . . . . . . . . . . . . . . . . . . . .
DISPLAY 3–13. . . . . . . . . . . . . . . . . . . . . . . . . . . . . . . . . . . . . . . . . .
HARD COPY 3–17. . . . . . . . . . . . . . . . . . . . . . . . . . . . . . . . . . . . . .
HOLD 3–19. . . . . . . . . . . . . . . . . . . . . . . . . . . . . . . . . . . . . . . . . . . .
HORIZONTAL Controls 3–20. . . . . . . . . . . . . . . . . . . . . . . . . . . . . .
MEAS 3–24. . . . . . . . . . . . . . . . . . . . . . . . . . . . . . . . . . . . . . . . . . . .
METER Mode 3–31. . . . . . . . . . . . . . . . . . . . . . . . . . . . . . . . . . . . . .
SAVE/RECALL 3–37. . . . . . . . . . . . . . . . . . . . . . . . . . . . . . . . . . . . .
SCOPE Mode 3–40. . . . . . . . . . . . . . . . . . . . . . . . . . . . . . . . . . . . . . .
TRIGGER Controls 3–46. . . . . . . . . . . . . . . . . . . . . . . . . . . . . . . . . .
UTILITY 3–53. . . . . . . . . . . . . . . . . . . . . . . . . . . . . . . . . . . . . . . . . .
VERTICAL Controls 3–59. . . . . . . . . . . . . . . . . . . . . . . . . . . . . . . . .
Appendices
Appendix A: Specifications A–1. . . . . . . . . . . . . . . . . . . . . . . . . . .
Appendix B: Factory Setup B–1. . . . . . . . . . . . . . . . . . . . . . . . . .
Appendix C: Accessories C–1. . . . . . . . . . . . . . . . . . . . . . . . . . . . .
Appendix D: Performance Verification D–1. . . . . . . . . . . . . . . . .
Test Record D–2. . . . . . . . . . . . . . . . . . . . . . . . . . . . . . . . . . . . . . . .
Performance Verification Procedures D–4. . . . . . . . . . . . . . . . . . . .
Appendix E: General Care and Cleaning E–1. . . . . . . . . . . . . . .
General Care E–1. . . . . . . . . . . . . . . . . . . . . . . . . . . . . . . . . . . . . . .
Cleaning E–1. . . . . . . . . . . . . . . . . . . . . . . . . . . . . . . . . . . . . . . . . . .
Glossary and Index
Glossary
Index
ii
THS 710 & THS 720 User Manual
Page 8

General Safety Summary
Review the following safety precautions to avoid injury and prevent
damage to this product or any products connected to it.
Only qualified personnel should perform service procedures.
Injury Precautions
Use Proper Power Cord. To avoid fire hazard, use only the power cord
specified for this product.
Avoid Electric Overload. To avoid injury or fire hazard, do not apply
potential to any input, including the common inputs, that varies from
ground by more than the maximum rating for that input.
Avoid Electric Shock. To avoid injury or loss of life, do not connect or
disconnect probes or test leads while they are connected to a voltage
source.
Do Not Operate Without Covers. To avoid electric shock or fire hazard,
do not operate this product with covers or panels removed.
Do Not Operate in Wet/Damp Conditions. To avoid electric shock, do not
operate this product in wet or damp conditions.
Do Not Operate in an Explosive Atmosphere. To avoid injury or fire
hazard, do not operate this product in an explosive atmosphere.
Product Damage Precautions
Use Proper Power Source. Do not operate this product from a power
source that applies more than the voltage specified.
Do Not Operate With Suspected Failures. If you suspect there is damage
to this product, have it inspected by qualified service personnel.
THS 710 & THS 720 User Manual
iii
Page 9
General Safety Summary
Safety Terms and Symbols
Terms in This Manual. These terms may appear in this manual:
WARNING. Warning statements identify conditions or practices that
could result in injury or loss of life.
CAUTION. Caution statements identify conditions or practices that
could result in damage to this product or other property.
Terms on the Product. These terms may appear on the product:
DANGER indicates an injury hazard immediately accessible as you
read the marking.
WARNING indicates an injury hazard not immediately accessible as
you read the marking.
CAUTION indicates a hazard to property including the product.
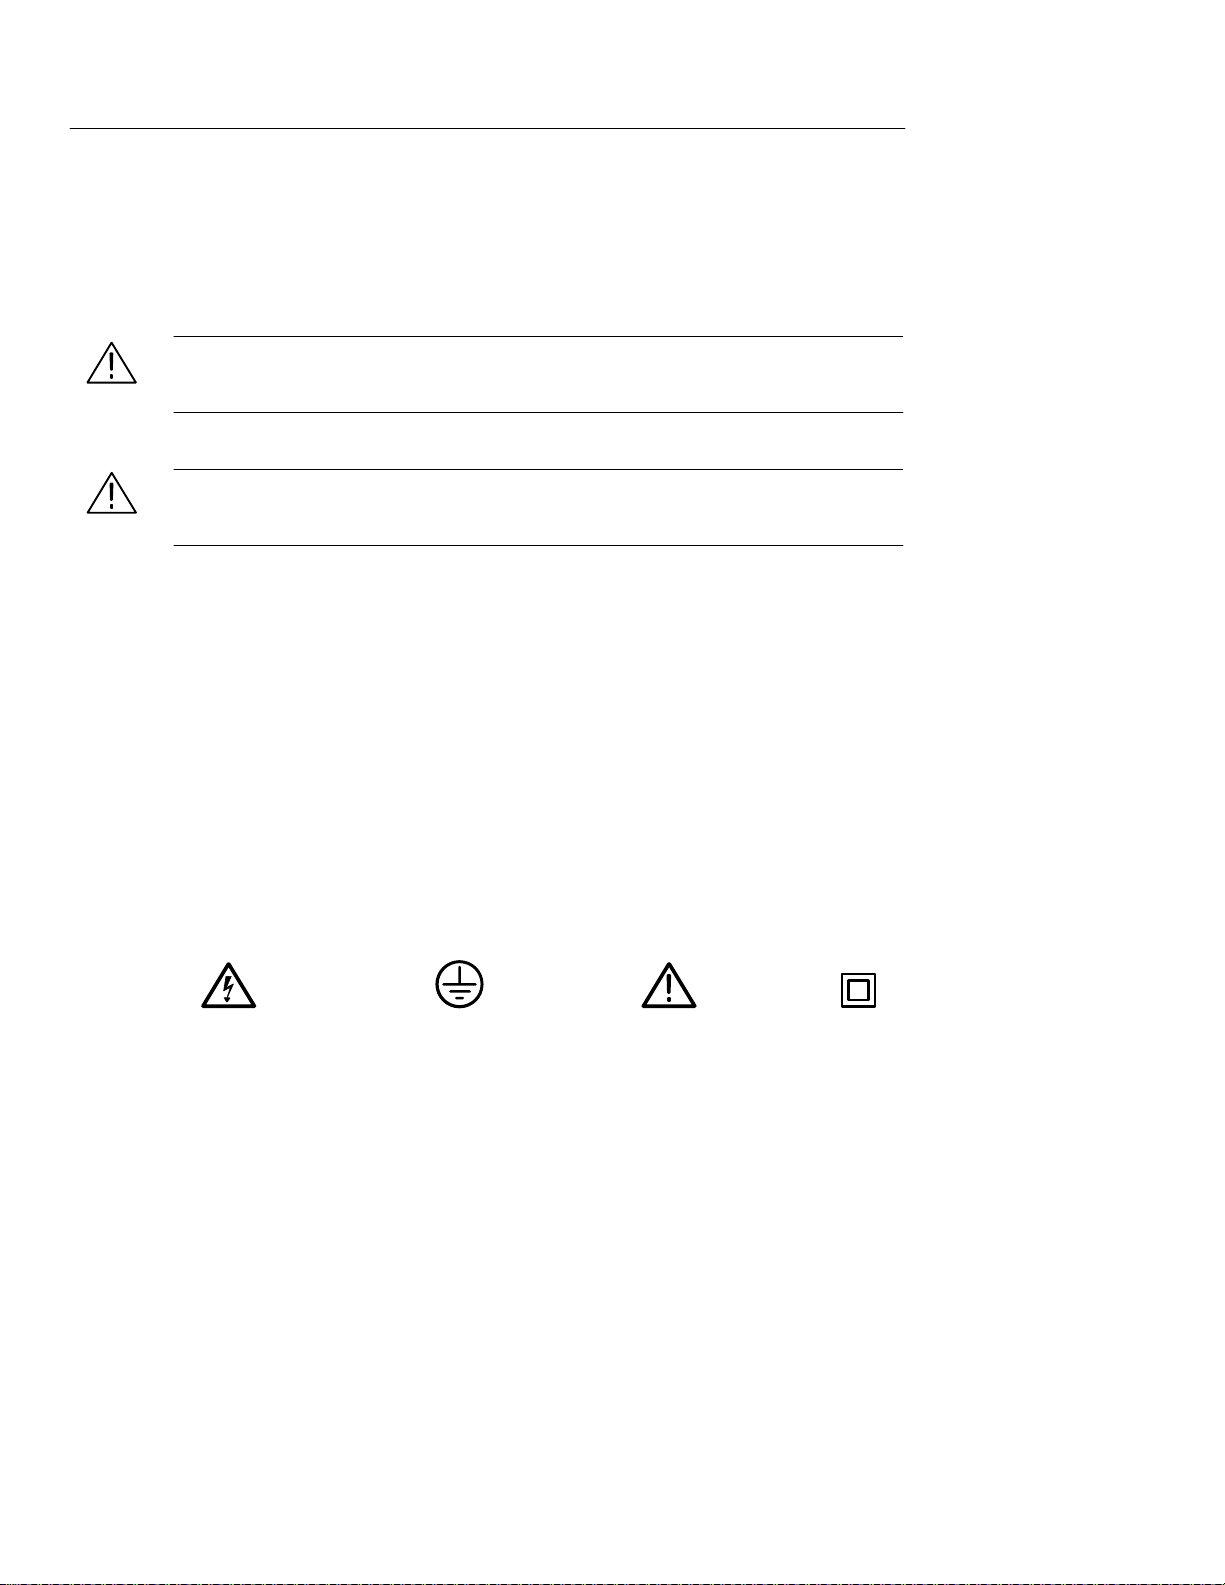
Symbols on the Product. These symbols may appear on the product:
DANGER
High Voltage
Protective Ground
(Earth) Terminal
ATTENTION
Refer to Manual
Double
Insulated
Certifications and Compliances
CSA Certified AC Adapter. CSA Certification includes the AC adapters
appropriate for use in the North America power network. All other
AC adapters supplied are approved for the country of use.
iv
Compliances. Consult the product specifications for Overvoltage
Category and Safety Class.
THS 710 & THS 720 User Manual
Page 10

Preface
This User Manual describes the capabilities, operation, and
applications of the THS 710 and THS 720 TekScope instruments.
In This Manual
The following table shows you where to find information in this
manual.
If you are looking for:
Product overview Product Description on page 1–1
Details about a product feature Reference on page 3–1
Application examples Application Examples on page 2–13
Operation instructions Understanding the Front Panel on
Information about battery operation Changing the Battery Pack on
Information about using external
power
Information about making a hard copy HARD COPY on page 3–17
Technical specifications Specifications appendix on page A–1
Recommended accessories Accessories appendix on page C–1
Turn to:
Look up the front-panel button for the
feature
page 2–1
page 1–5
Using External Power on page 1–7
THS 710 & THS 720 User Manual
v
Page 11
Preface
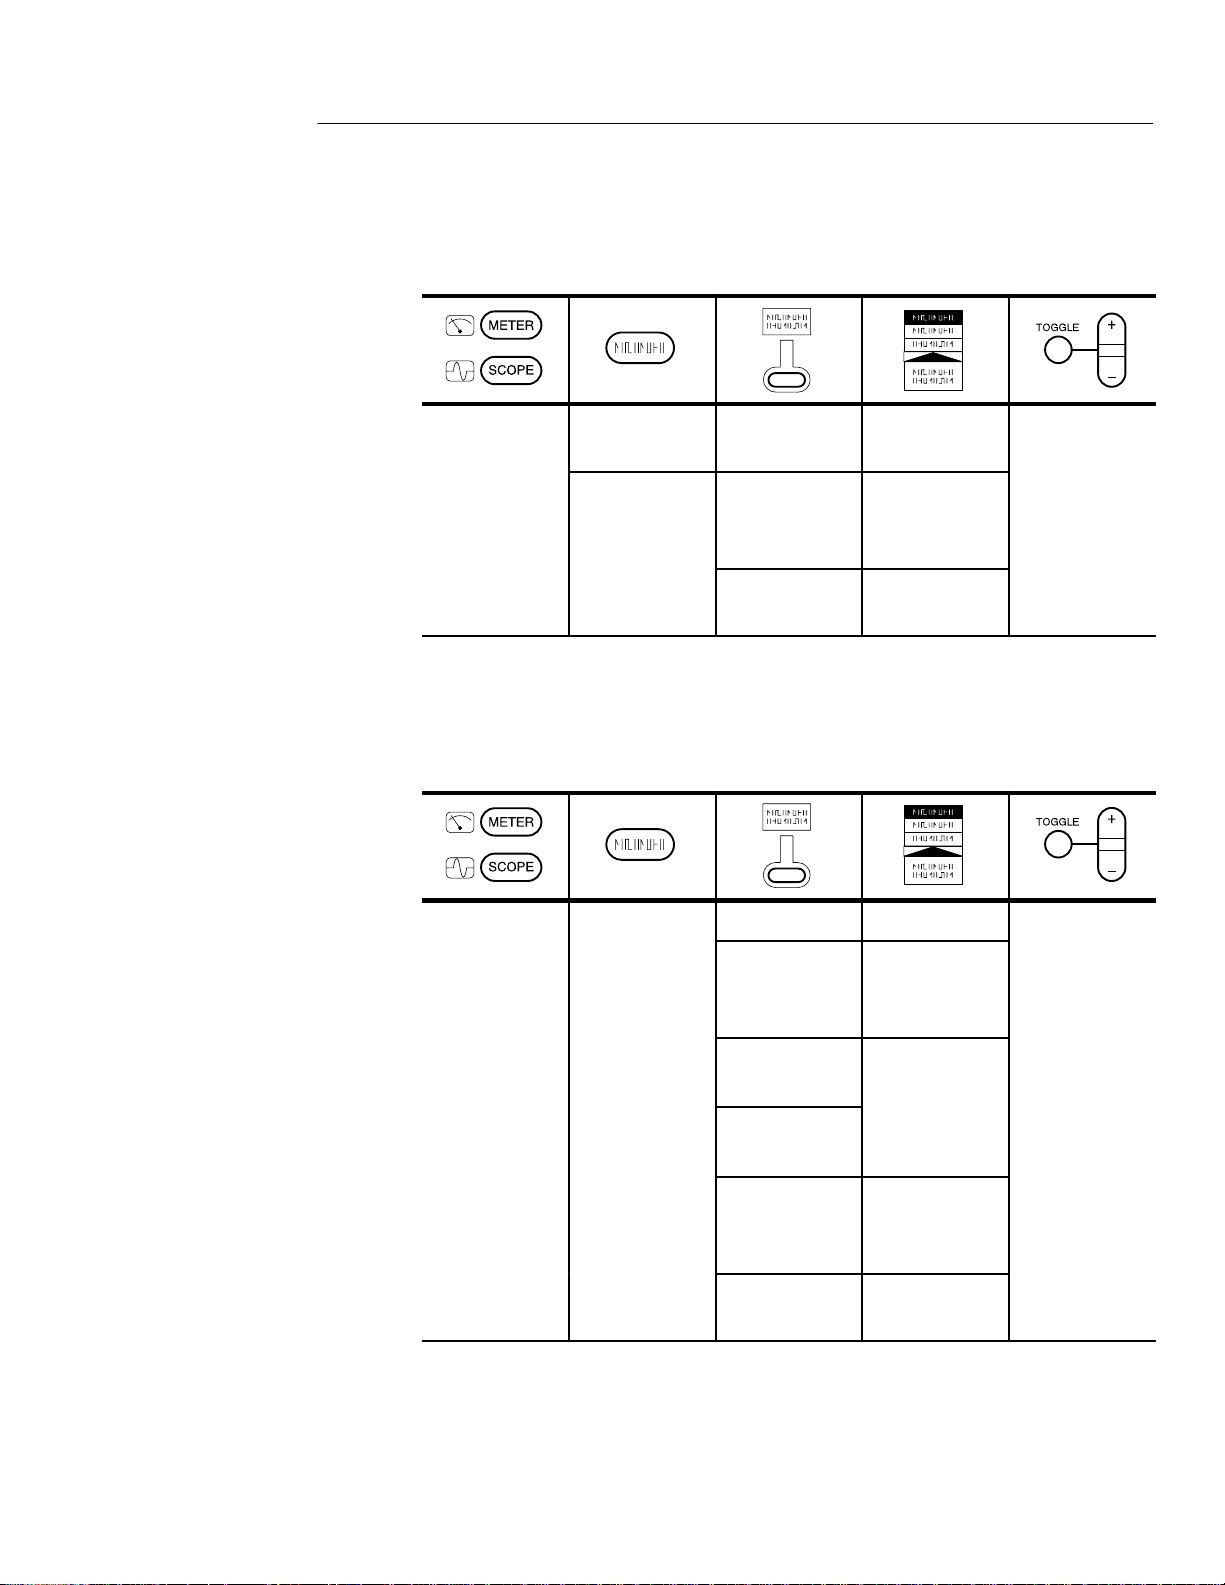
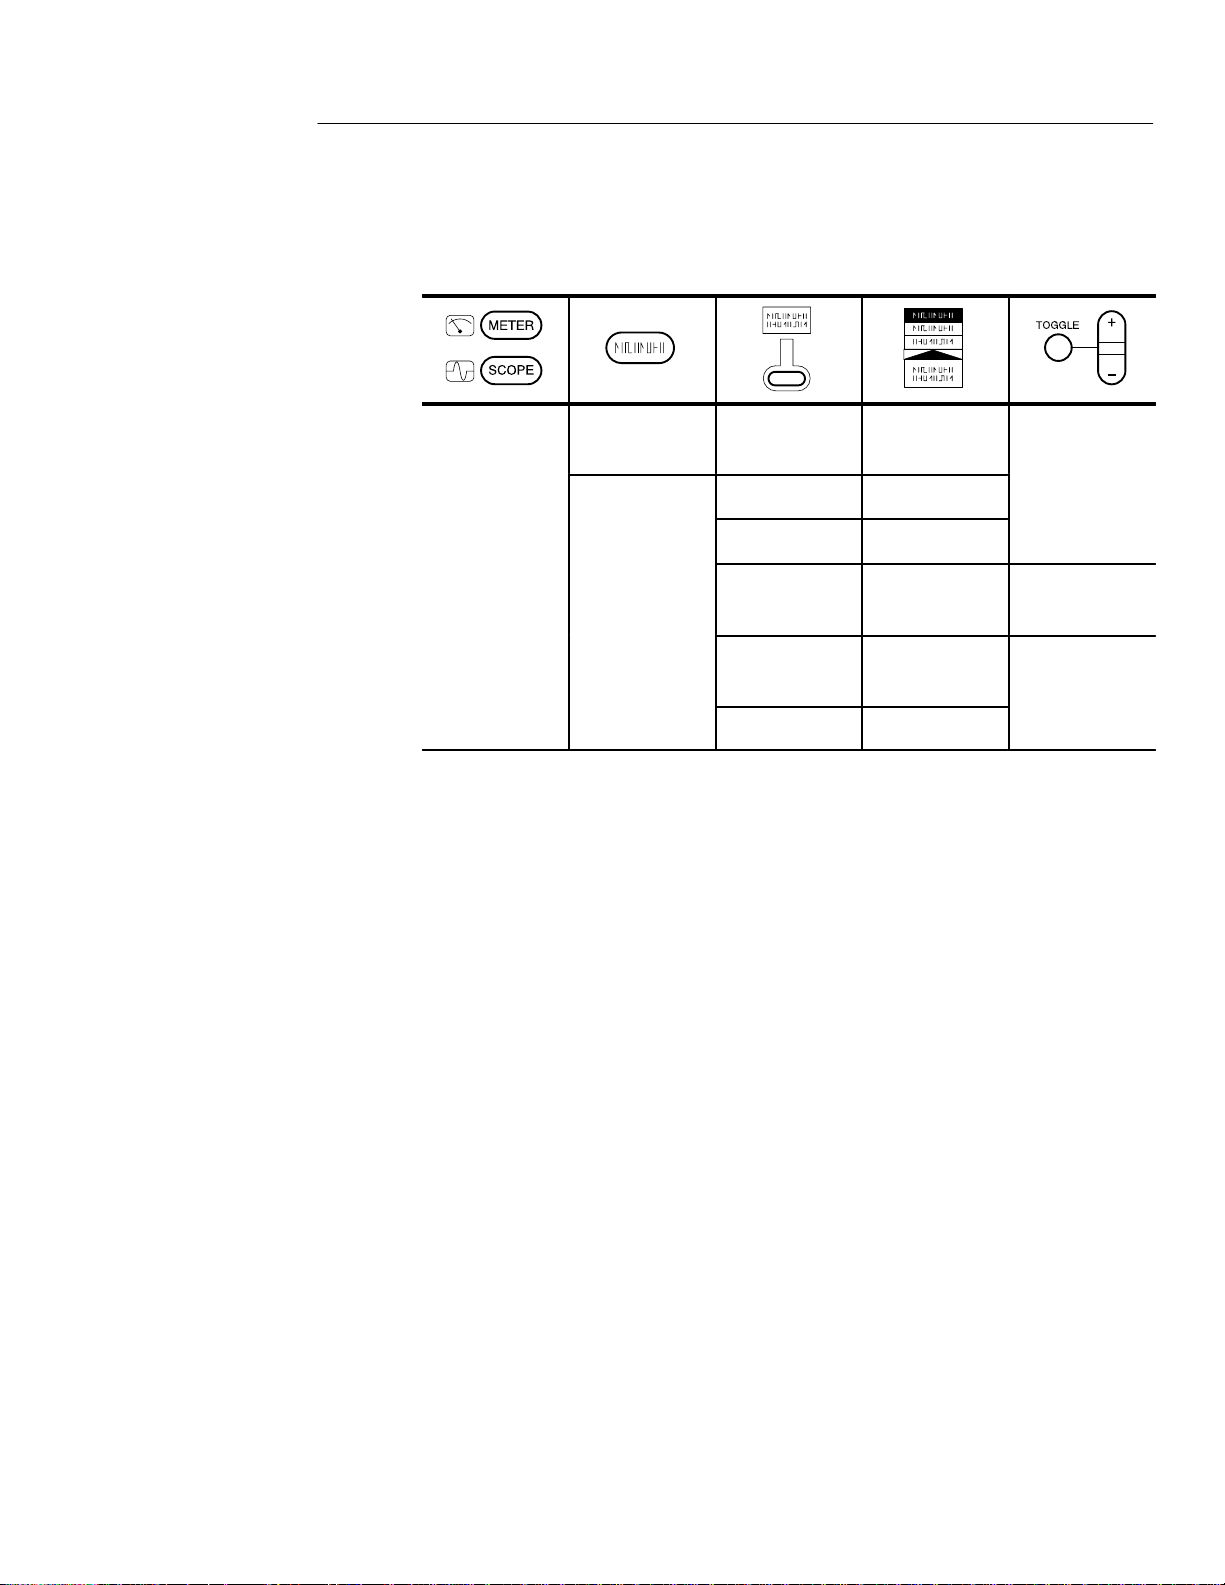
Conventions
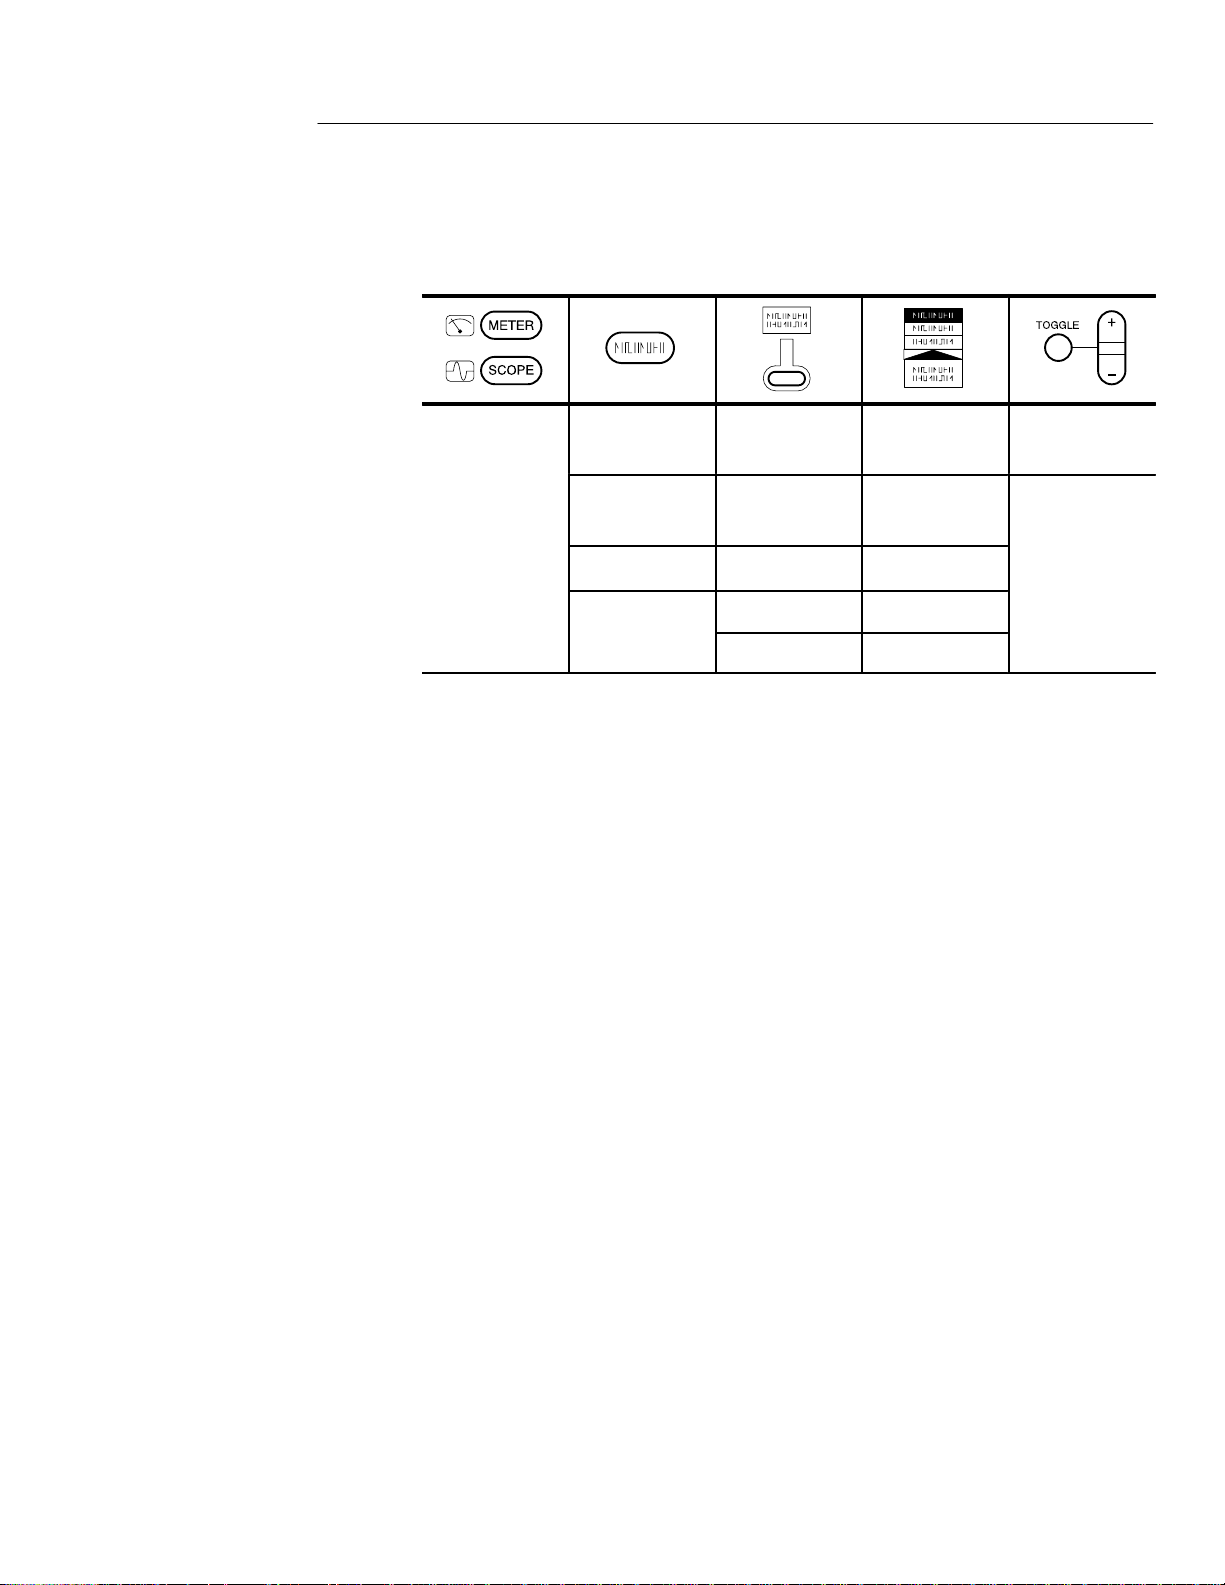
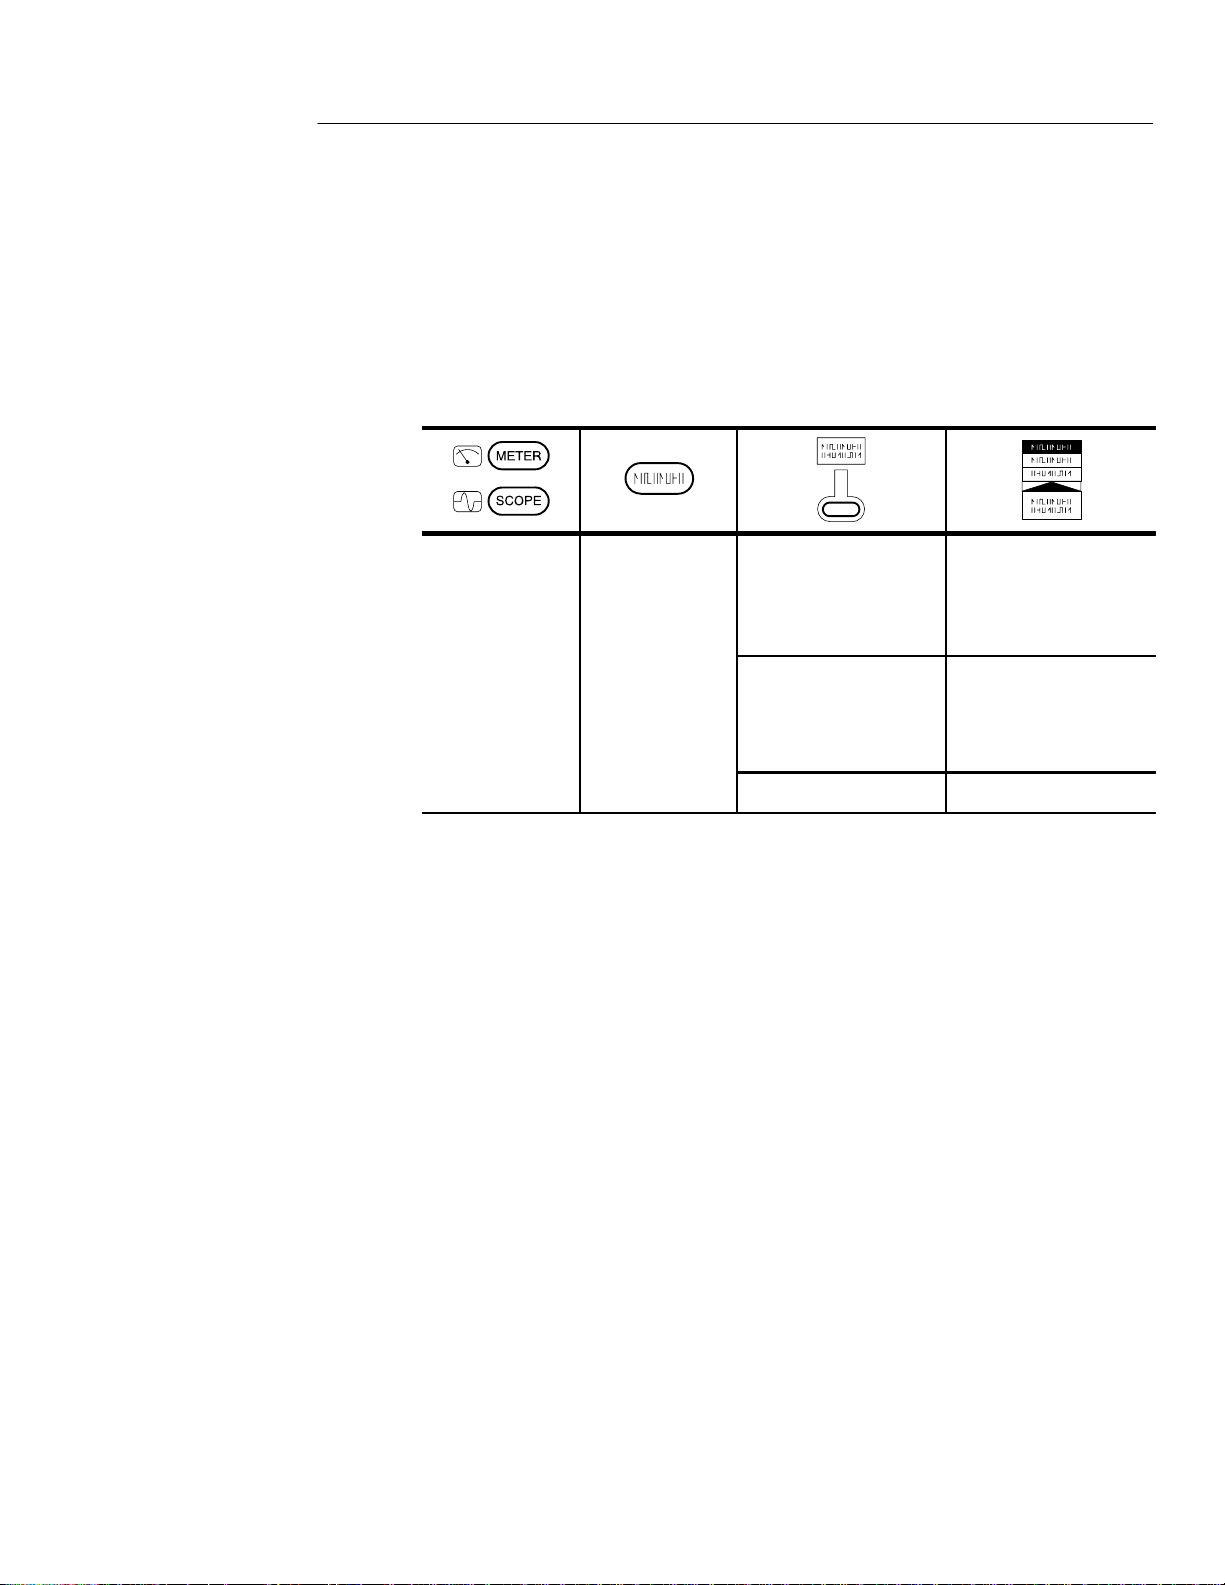
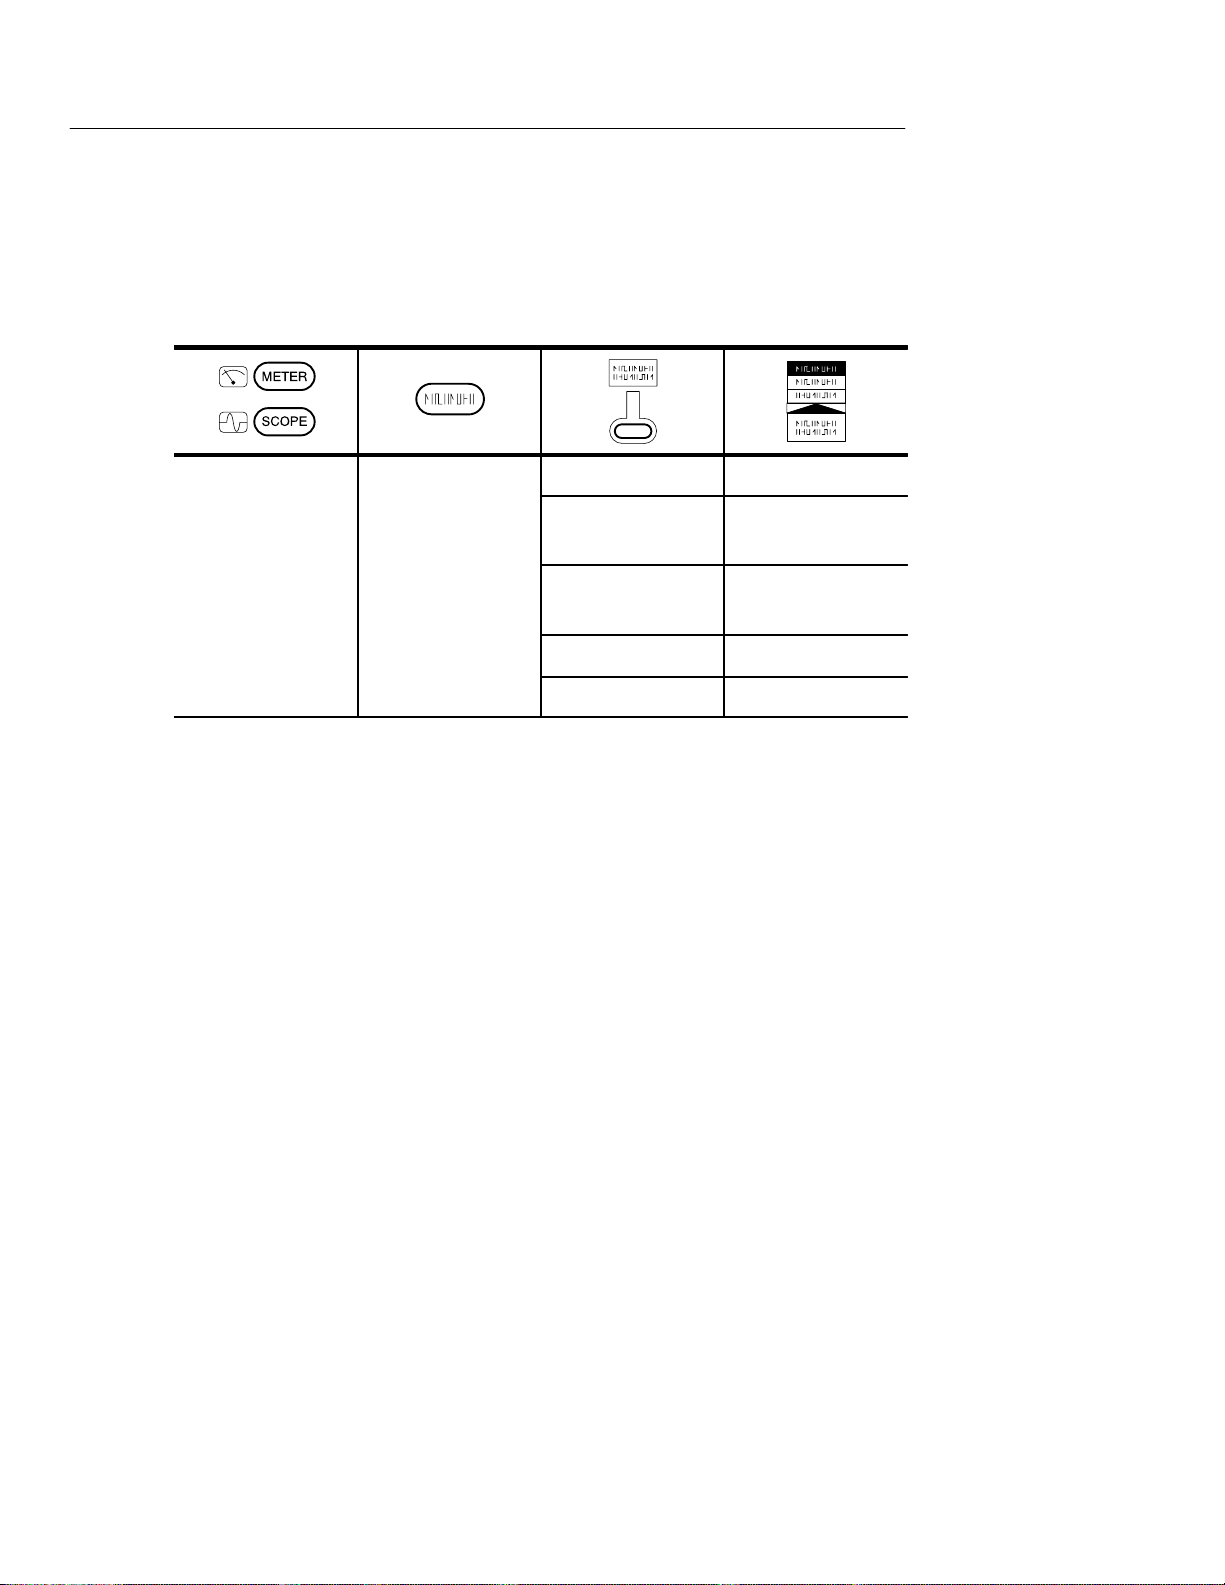
TekScope instrument setups are shown in tables. The Application
Examples and Performance Verification sections use tables to show
specific setups. The Reference section uses similar tables to show the
complete contents of the menu system.
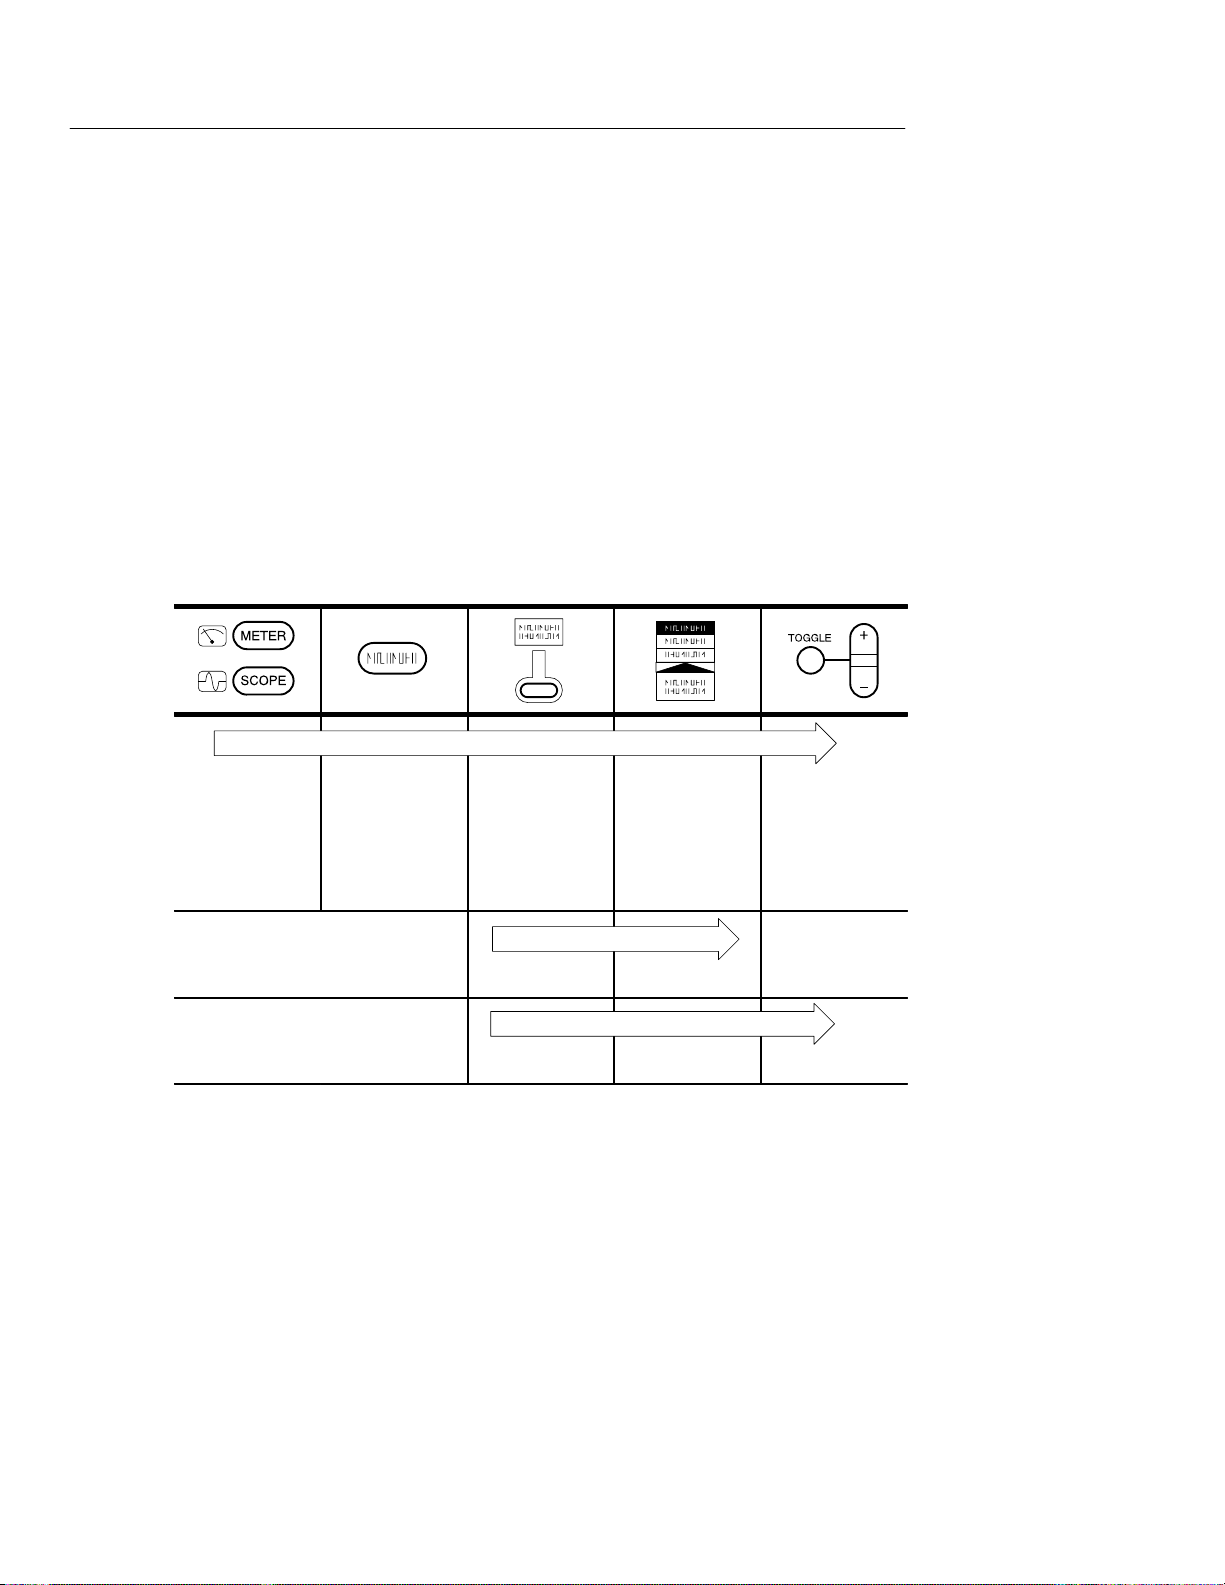
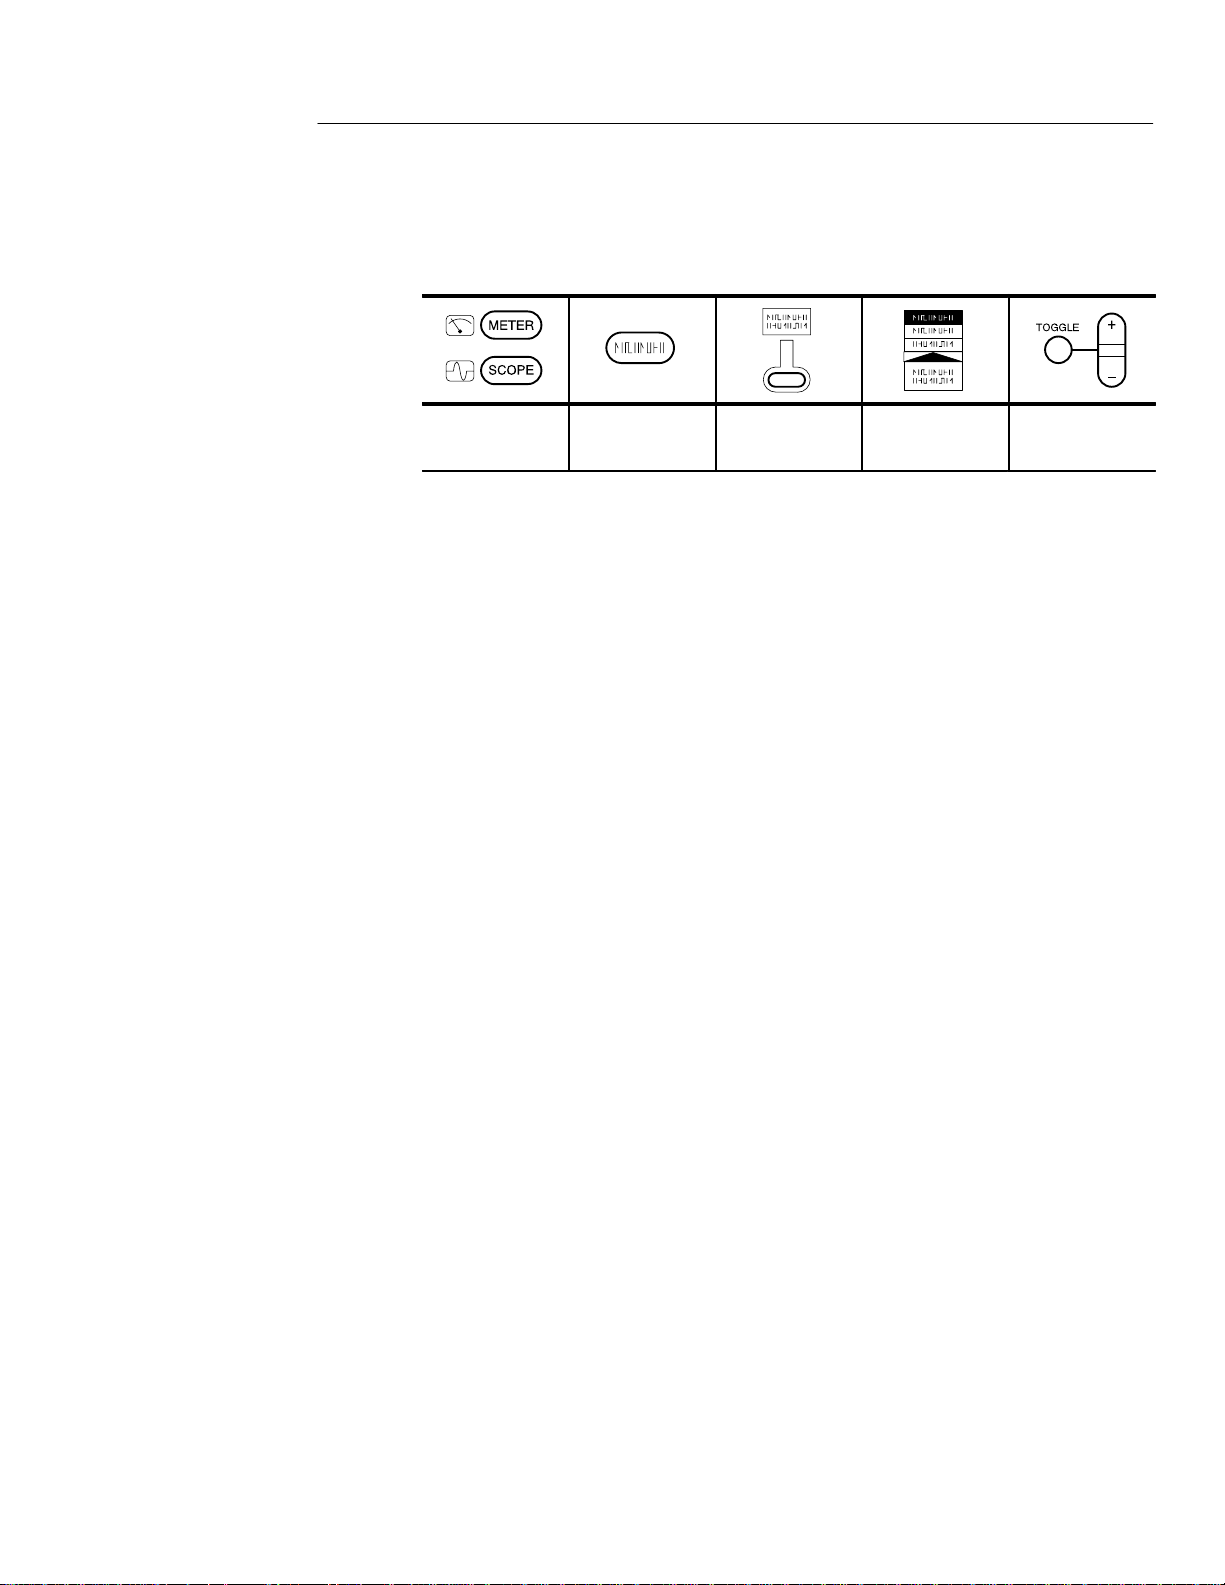
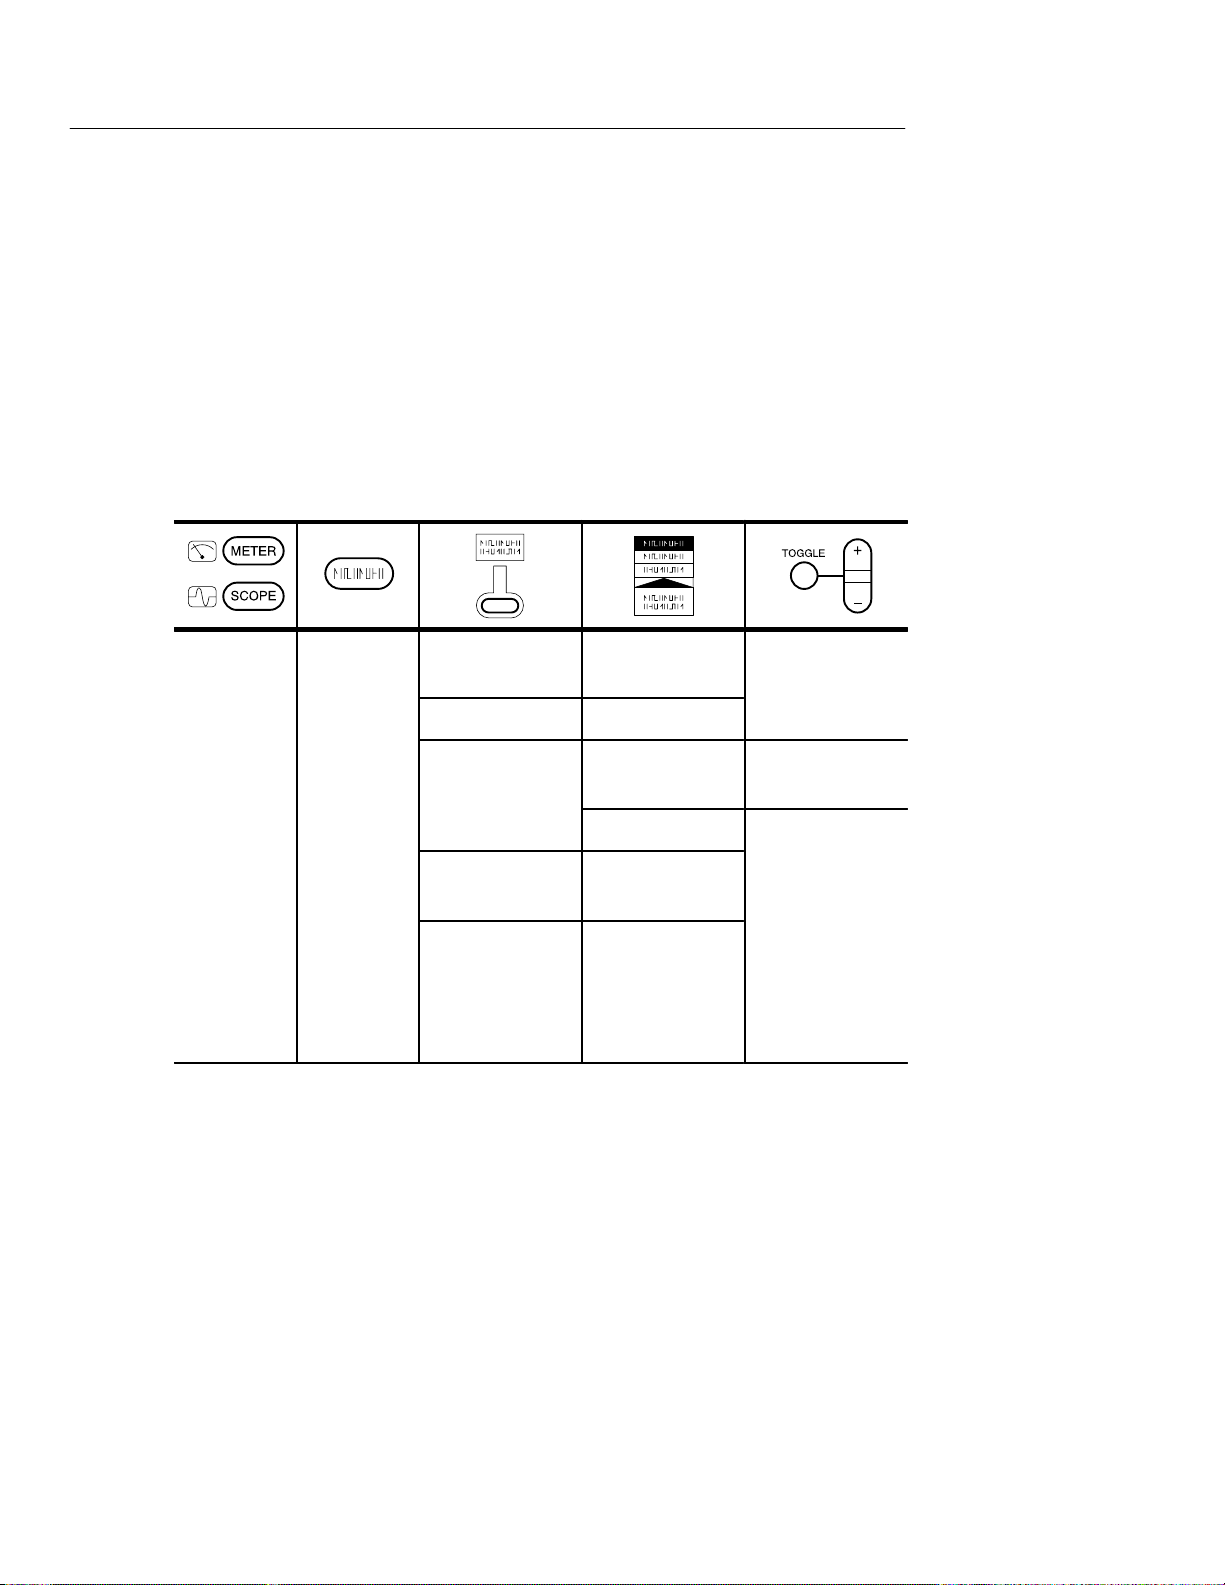
The header of each table contains icons that represent the controls
and menu items used to set up the instrument. To make a specific
setup, read the table from left to right and then from top to bottom as
shown below. The table contains the symbol “—” if no action is
required.
1. Choose
scope mode
or meter
mode.
2. Press this
button on the
front panel.
3. Press this
bezel button.
6. 7. —
8. 9. 10.
4. Press the
bezel button
again until
this selection
is highlighted.
5. Use the
+
/– rocker to
set the value
for a parameter.
vi
THS 710 & THS 720 User Manual
Page 12

Getting Started
Page 13

Page 14

Getting Started
In addition to a brief product description, this chapter covers the
following topics:
H How to change the battery pack
H How to use external power
H How to use the tilt stand
H How to perform a quick functional check
Product Description
The THS 710 and THS 720 TekScope instruments combine a
two-channel oscilloscope and a digital multimeter (DMM) in a
rugged, handheld package.
General Features
H Battery power or external power
H High-resolution, high-contrast display with temperature
compensation for clear visibility over a wide temperature range
H Onboard waveform, data, and setup storage
H RS-232 communication port to load setups, download wave-
forms, and make hard copies
H Fully programmable through the RS-232 communication port
THS 710 & THS 720 User Manual
1–1
Page 15

Getting Started
Oscilloscope Features
The T ekScope instrument is a powerful, two-channel oscilloscope
with the following features:
H Autoranging for quick setup and hands-free operation
H 100 MHz (THS 720) or 60 MHz (THS 710) bandwidth with
H 500 MS/s (THS 720) or 250 MS/s (THS 710) sample rate and
H Separate digitizers for each channel (both channels always
H Waveform averaging and enveloping with hardware peak
selectable 20 MHz bandwidth limit
2,500 point record length
acquire simultaneously)
detection
H Digital Real Time digitizing (up to five-times oversampling),
sin(x)/x interpolation, and peak-detect acquisition to limit the
possibility of aliasing
H Independently isolated channels to allow improved safety for
measurements to 1000 V
while floating up to 600 V
RMS
RMS
using P5102 probes
H Cursors and 21 continuously updated, automatic measurements
H Simultaneous oscilloscope and meter operation on the same or
on separate signals
H Advanced pulse and video trigger capability
1–2
THS 710 & THS 720 User Manual
Page 16

Getting Started
Meter Features
The TekScope instrument is also a full-featured DMM with the
following features:
H True RMS VAC, VDC, , continuity, and diode-check functions
H Autoranging or manual ranging
H Data logger plot of meter measurements over a period of time
H Max, min, delta max-min, relative-delta, and average statistics in
the readout
H Bar graph for an “analog meter” feel
H Capability to float independently to 600 V
RMS
H Overvoltage indicator warns when an overvoltage is applied to
the input
THS 710 & THS 720 User Manual
1–3
Page 17
Getting Started
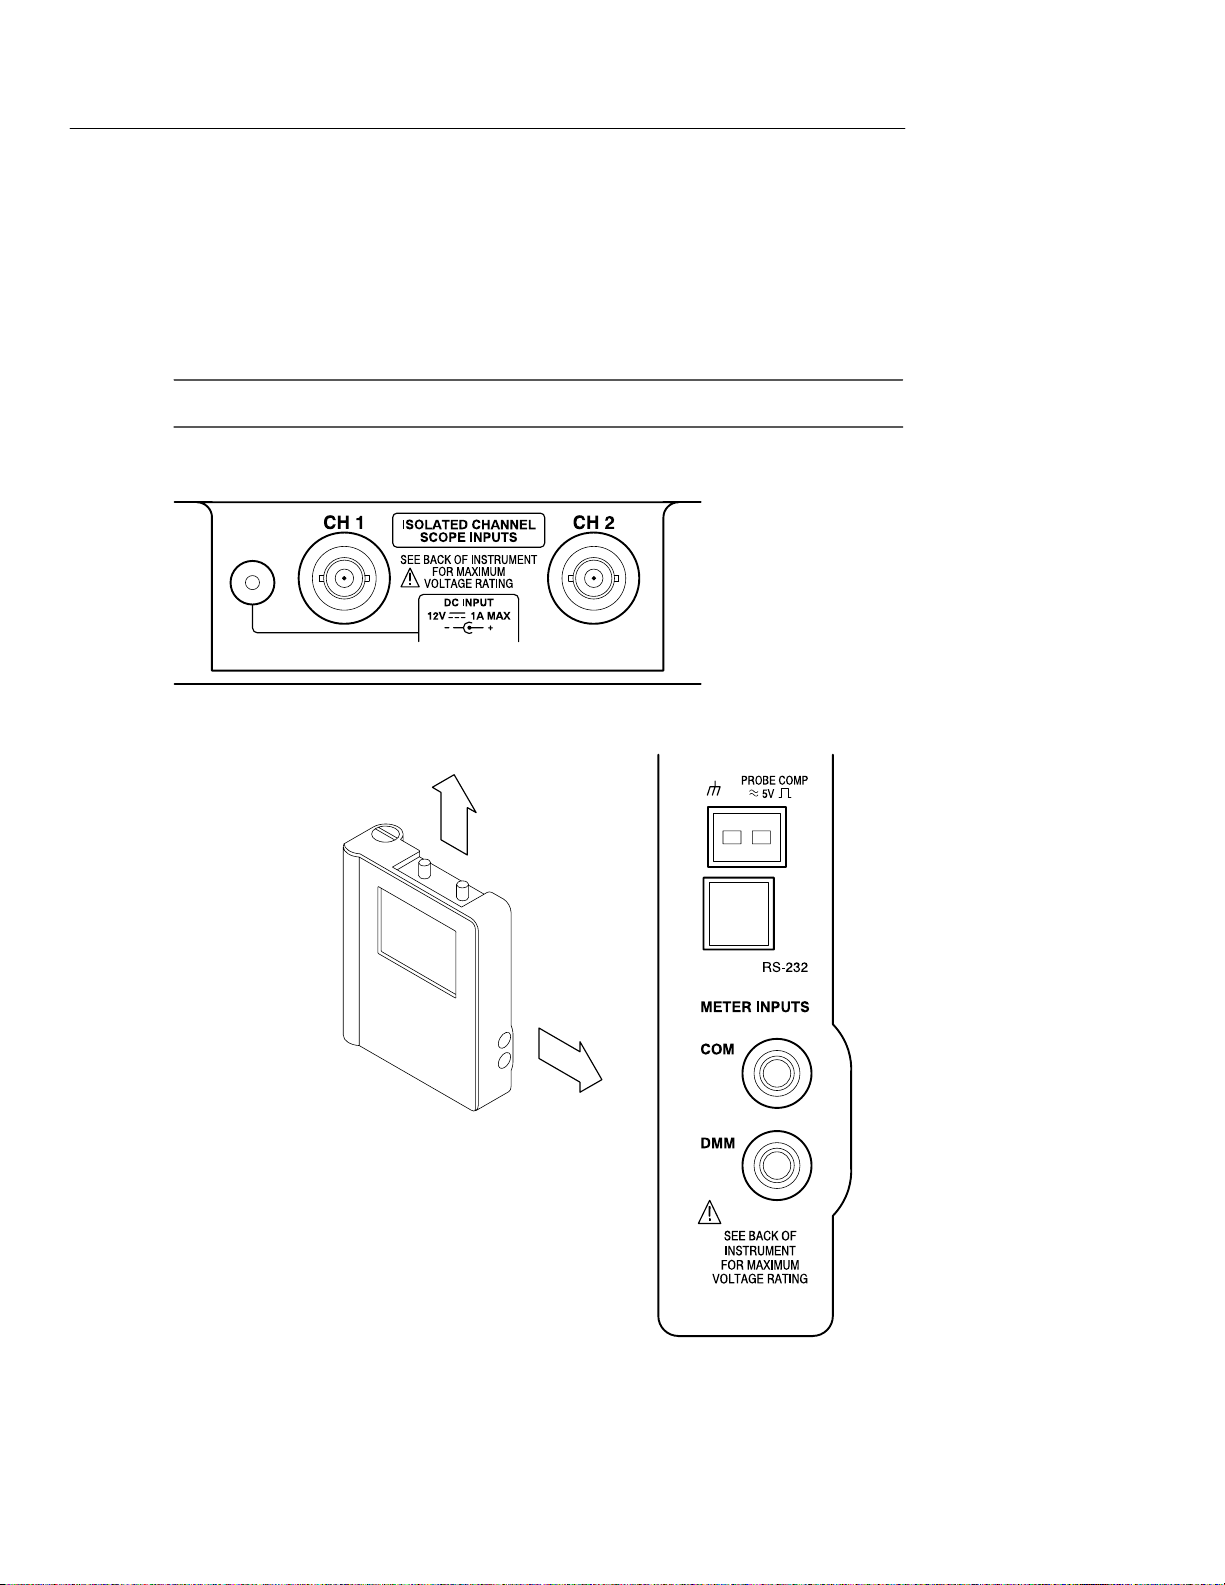
Input and Output Connectors
All input and output connectors are located on the top and side
panels as shown below.
NOTE. See the back of the instrument for maximum voltage ratings.
Top panel
1–4
Side panel
THS 710 & THS 720 User Manual
Page 18
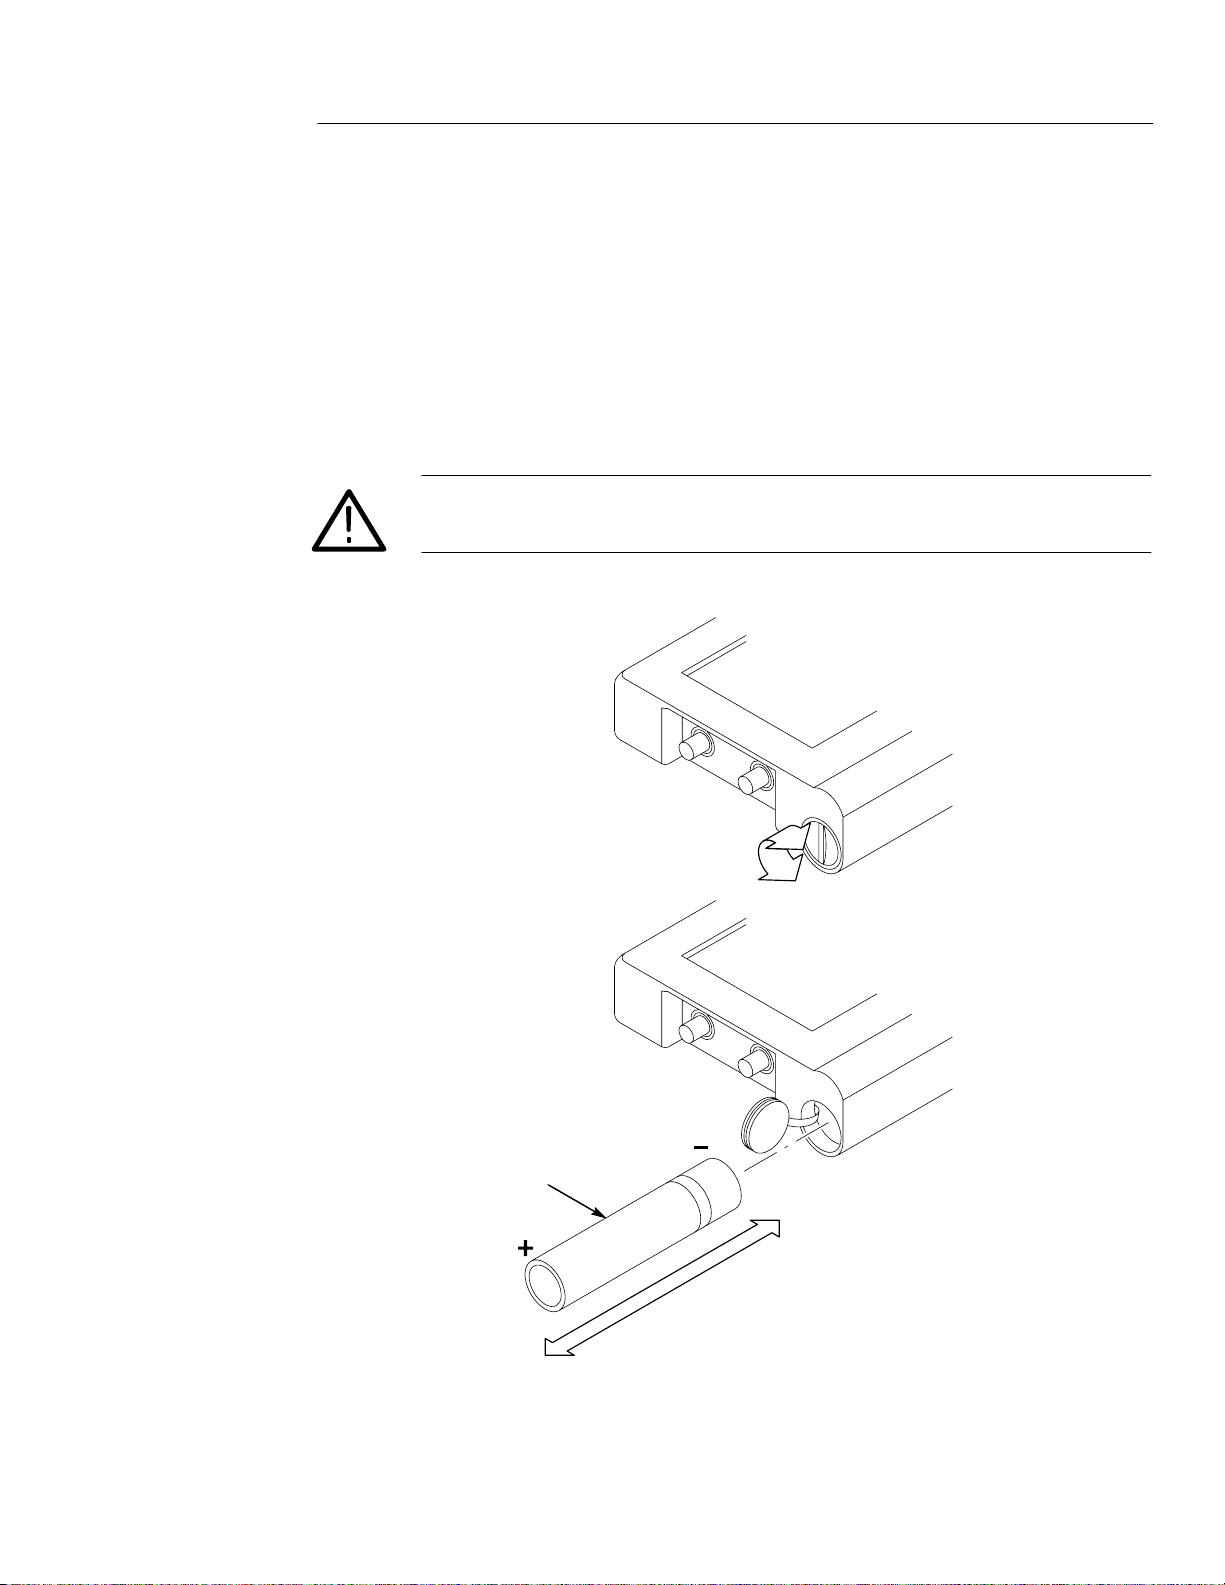
Replacing the Battery Pack
For portable operation, use the rechargeable battery pack.
You can replace the battery pack without losing any saved informa-
tion. The current setup, saved setups, saved waveforms, and saved
data are all stored in nonvolatile memory that does not depend on
battery power .
CAUTION. To prevent loss of saved information, set the ON/STBY
switch to STBY before removing the battery back.
Getting Started
Battery pack
THS 710 & THS 720 User Manual
1–5
Page 19

Getting Started
Battery Life
From a full charge, you can operate the TekScope instrument
continuously for approximately two hours. You can extend the
battery life by using automatic Power Off Time-out or Backlight
Time-out. Refer to page 3–56 for a description of these features.
The TekScope instrument turns off automatically when the battery
runs low. A low-battery message appears in the display about ten
minutes before the automatic shutdown.
Nickel-cadmium batteries can lose capacity permanently if not
allowed to discharge completely. Whenever possible, allow the
battery to discharge completely before you recharge it to minimize
this capacity loss.
Charging the Battery Pack
Before using the battery for the first time, it must be charged. You
can use external power to charge the battery pack while it is in the
TekScope instrument. Or you can charge the battery pack with the
optional external battery charger. Typical battery charging times are
listed below .
Configuration
Battery pack in TekScope instrument 20 hours
Battery pack in external charger 1.5 hours
CAUTION. To avoid loss of saved information when a battery pack is
not installed, set the ON/STBY control to STBY before disconnecting
external power.
Typical Charging Time
1–6
THS 710 & THS 720 User Manual
Page 20
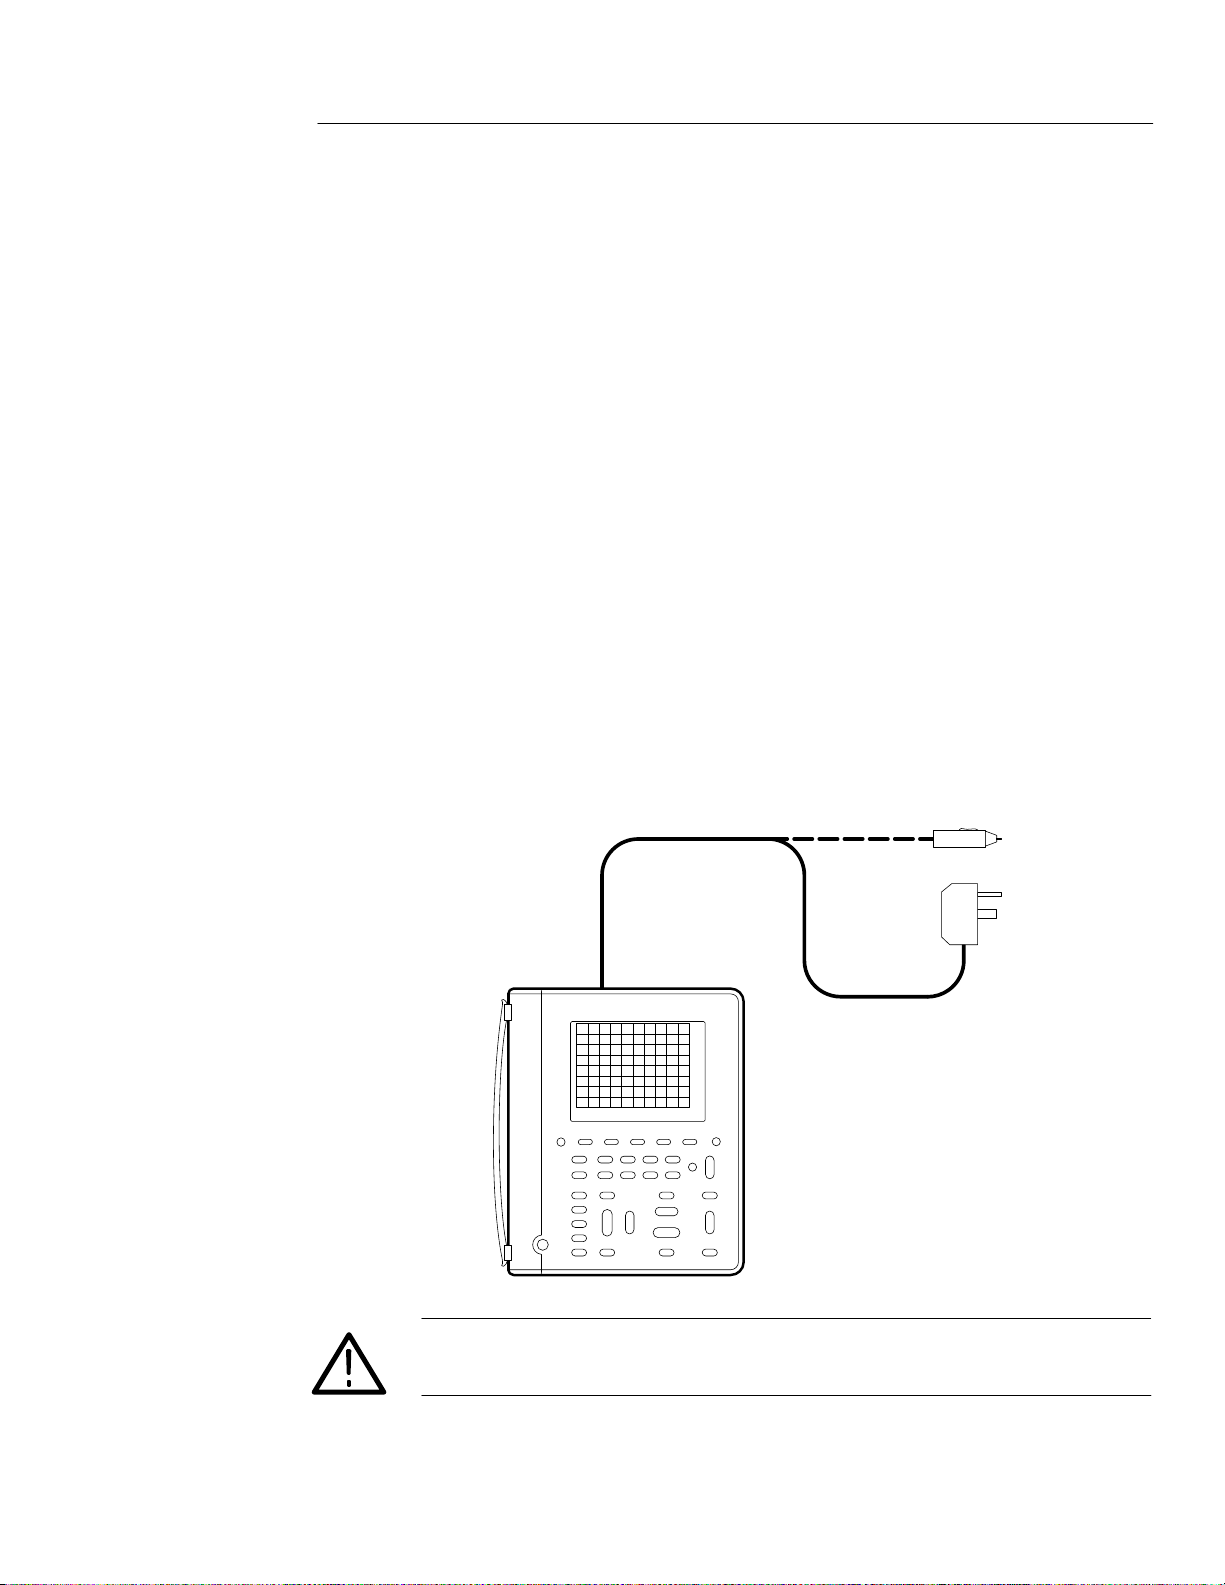
Using External Power
Using external power from the AC adapter or cigarette lighter
adapter has the following advantages:
H Saves internal battery power for portable operation later
H Charges internal battery pack
H Allows extended operation; the Standby Time-out and Backlight
Time-out features are automatically disabled when external
power is used
H Maintains floating measurement capability of the oscilloscope
channels and DMM
Attach the external power source as shown below.
Getting Started
The DC INPUT disconnects itself if an overvoltage is applied. If this
occurs, disconnect and then reconnect the AC adapter or cigarette
lighter adapter to resume operation from external power .
External power to
DC INPUT
CAUTION. To avoid overheating, do not connect external power while
the instrument is in a confined space, such as in the soft case.
THS 710 & THS 720 User Manual
1–7
Page 21
Getting Started
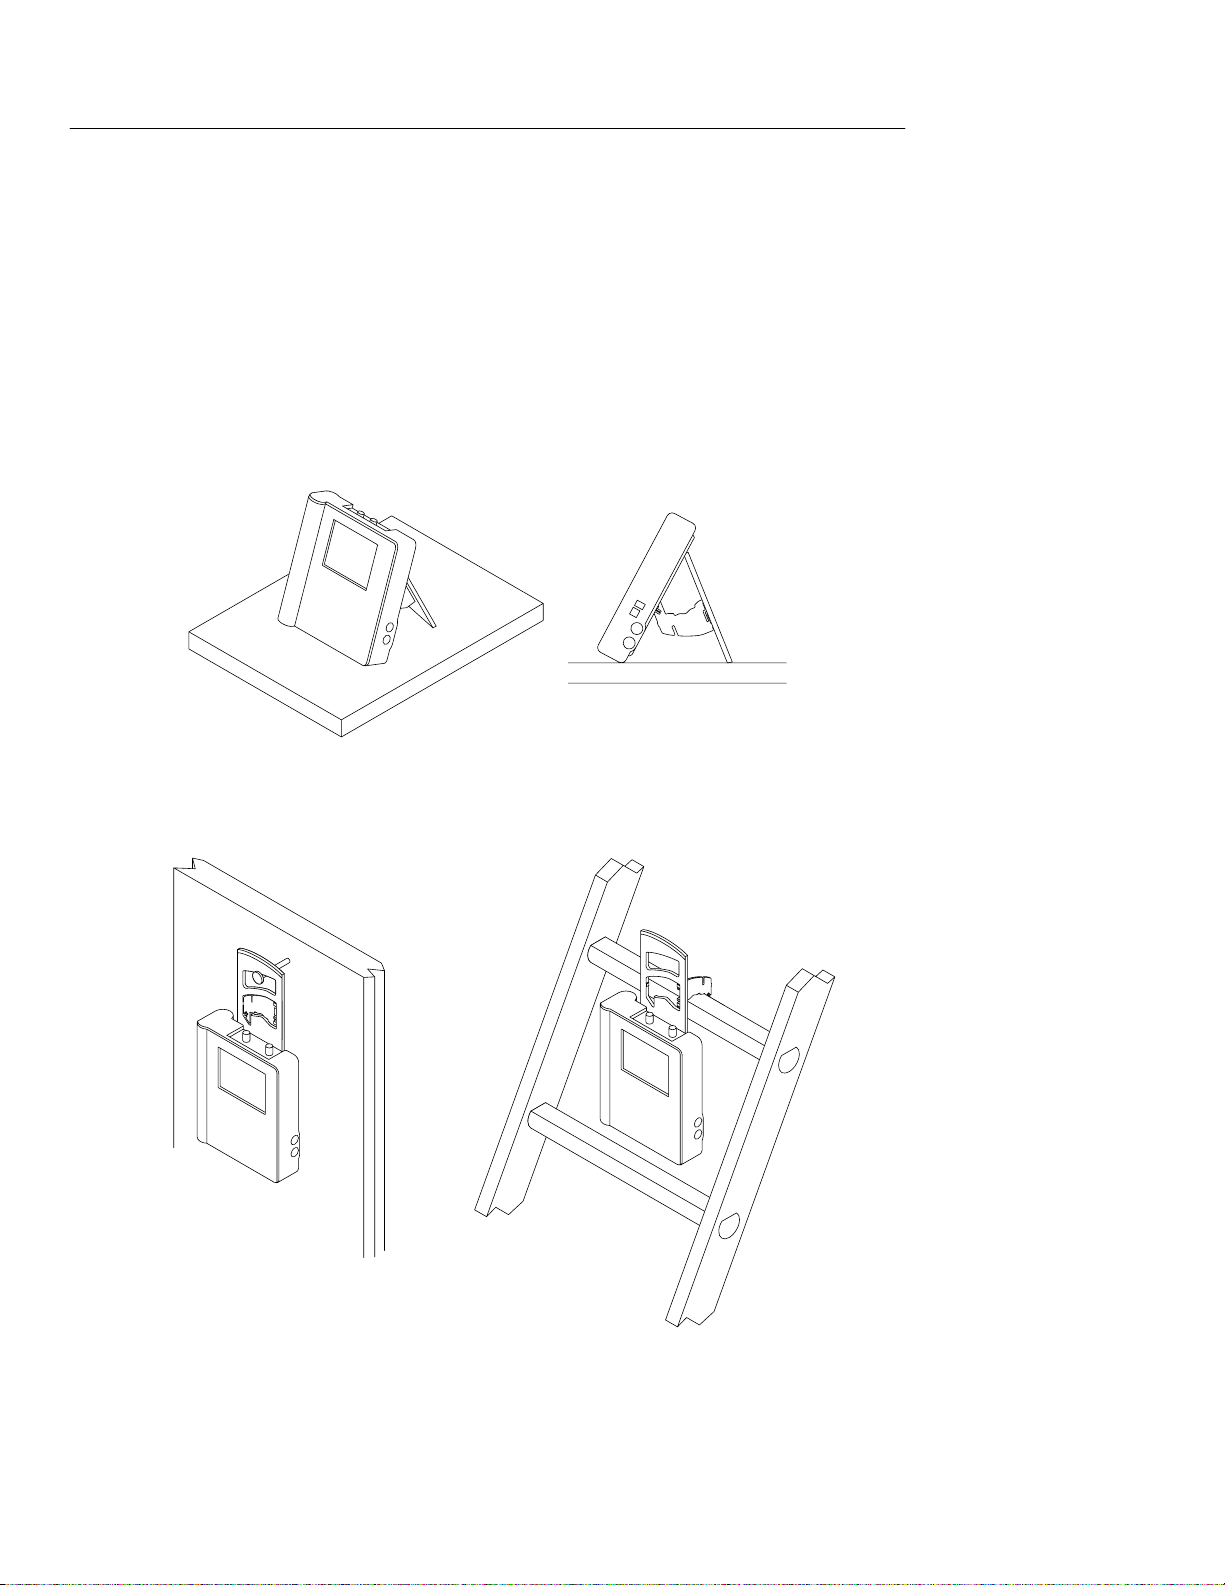
Using the Tilt Stand
A built-in tilt stand folds out and snaps back into place when not in
use. For benchtop use, lock the tilt stand in place with the hinged
flap. To hang the TekScope instrument over a nail, rotate the tilt
stand 180°. You can also extend the hinged flap as shown to hang the
instrument from a ladder rung or over the top of a door.
1–8
THS 710 & THS 720 User Manual
Page 22
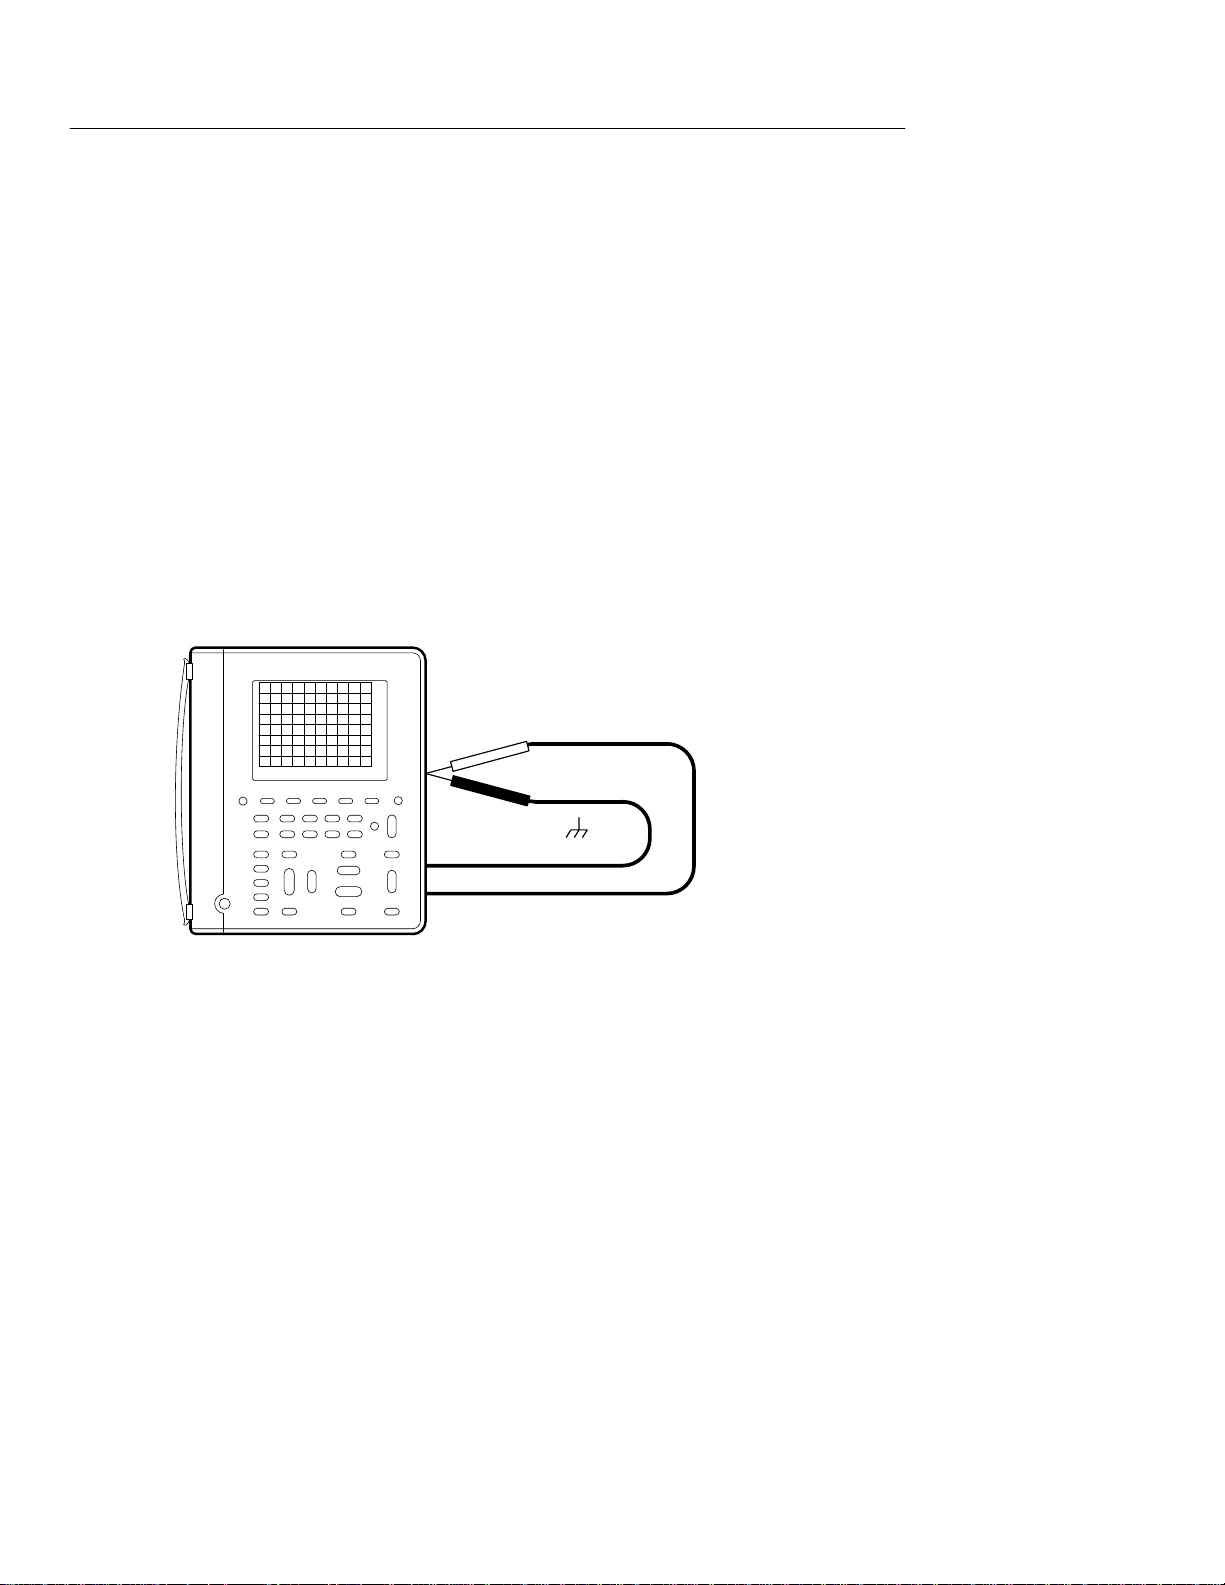
Functional Check
After you install batteries or connect external power, you can
perform this quick functional check to verify that your TekScope
instrument is operating correctly.
1. Press the ON/OFF button to turn on the TekScope instrument.
2. After a few seconds, you should see a window with the message
Power-On self check PASSED. Press the CLEAR MENU button.
3. Press the SCOPE button.
4. Connect the oscilloscope probe to the channel 1 input BNC.
Attach the probe tip and reference lead to the PROBE COMP
connectors on the right side of the TekScope instrument.
Getting Started
Ch 1
Probe reference lead to
Probe tip to PROBE COMP
THS 710 & THS 720 User Manual
1–9
Page 23
Getting Started
5. Press the AUTORANGE button. Within a few seconds, you
6. Press the METER button.
7. Press the VDC bezel button
8. Press the AUTORANGE button.
9. Connect meter leads to the TekScope instrument and touch the
should see a square wave in the display (approximately 1.2 kHz).
If you want, repeat steps 4 and 5 for channel 2 of the oscillo-
scope.
meter lead tips to the PROBE COMP output as shown below.
DMM lead to PROBE COMP
COM lead to
10.Verify that the TekScope instrument measures an average DC
voltage of 2.5 ± 0.25 V.
1–10
THS 710 & THS 720 User Manual
Page 24

Operating Basics
Page 25

Page 26

Functional Overview
This section covers the following topics:
H Understanding the front panel
H Using scope mode
H Using meter mode
H Connecting and using the probes
H Taking floating measurements
You can find specific information about each of the controls in the
Reference chapter of this manual.
Understanding the Front Panel
The front panel has buttons for the functions you use most often and
menus to access more specialized functions. With the autorange
feature, you can setup the TekScope instrument automatically in both
scope and meter modes.
Using the Menu System
To use the menu system, follow the steps shown on the next
two pages.
THS 710 & THS 720 User Manual
2–1
Page 27
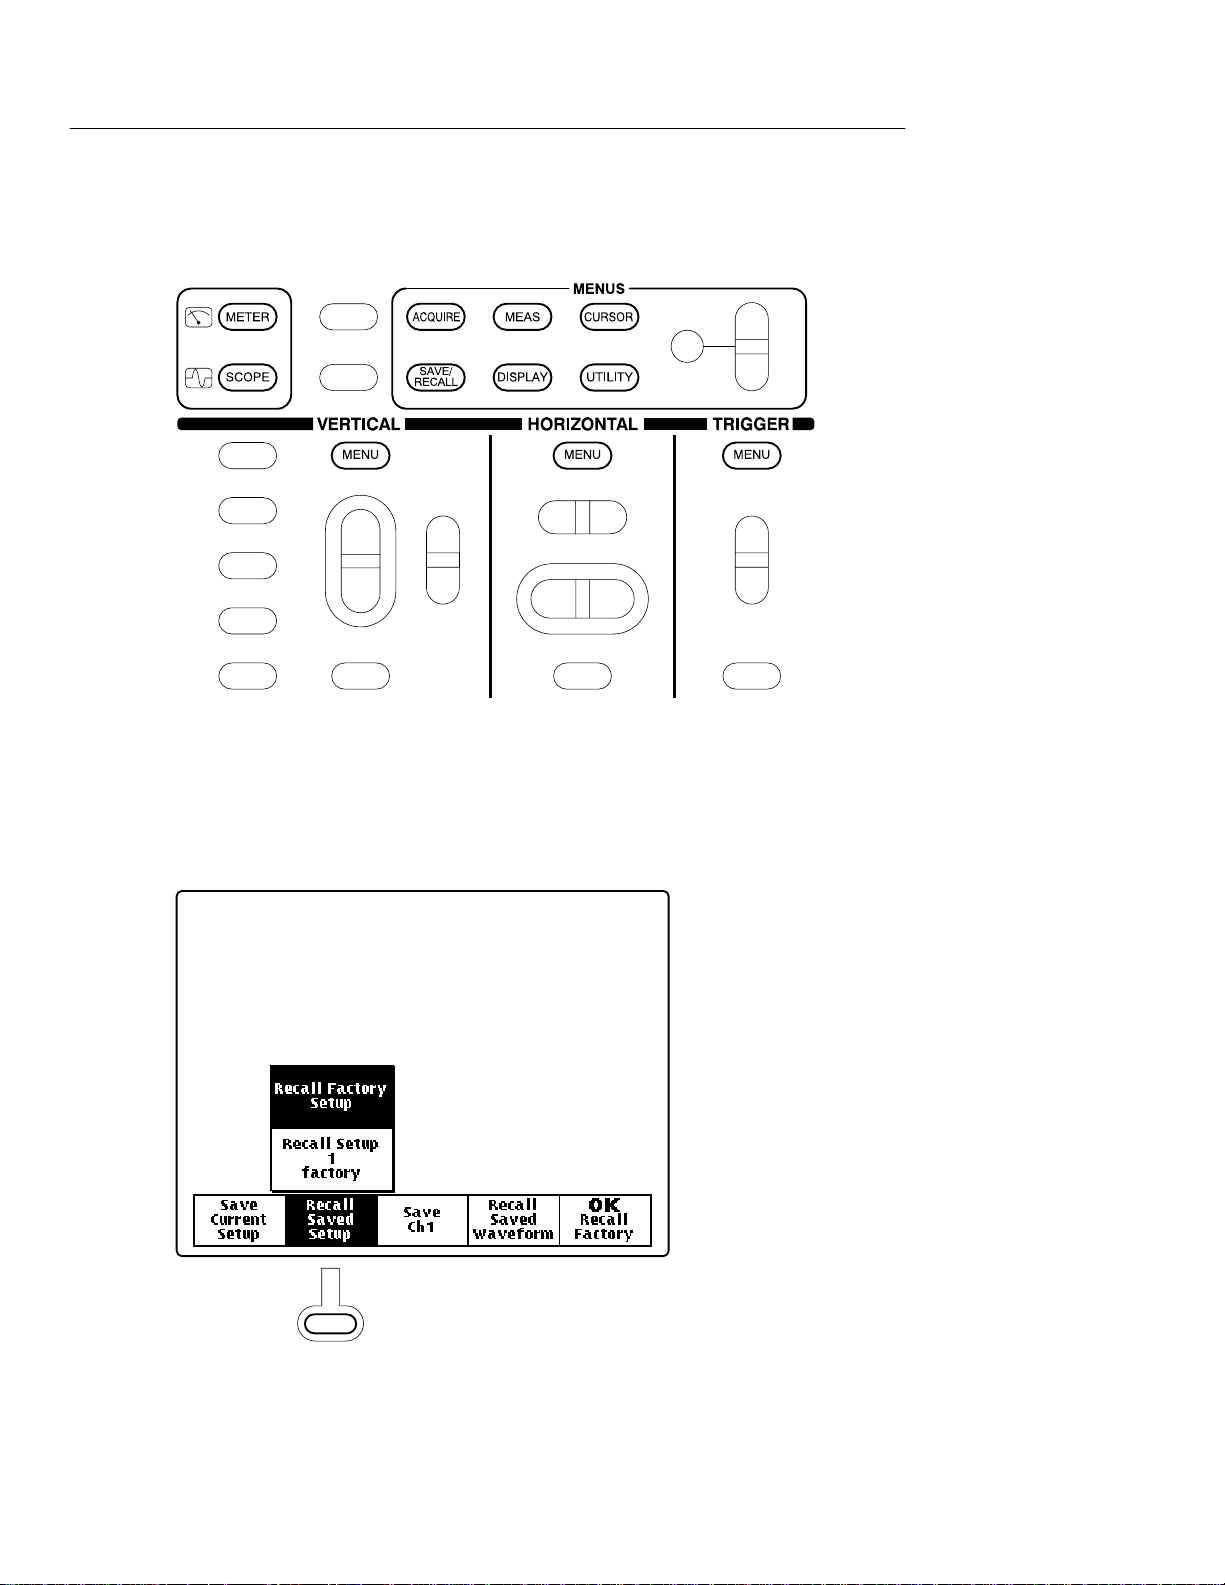
Functional Overview
1. Press a front-panel button to display the menu you want to use.
2. Press a bezel button to choose a menu item. If a pop-up menu
appears, continue to press the bezel button to choose an item in
the pop-up menu. You may need to press the Select Page bezel
button to access additional menu items.
2–2
THS 710 & THS 720 User Manual
Page 28
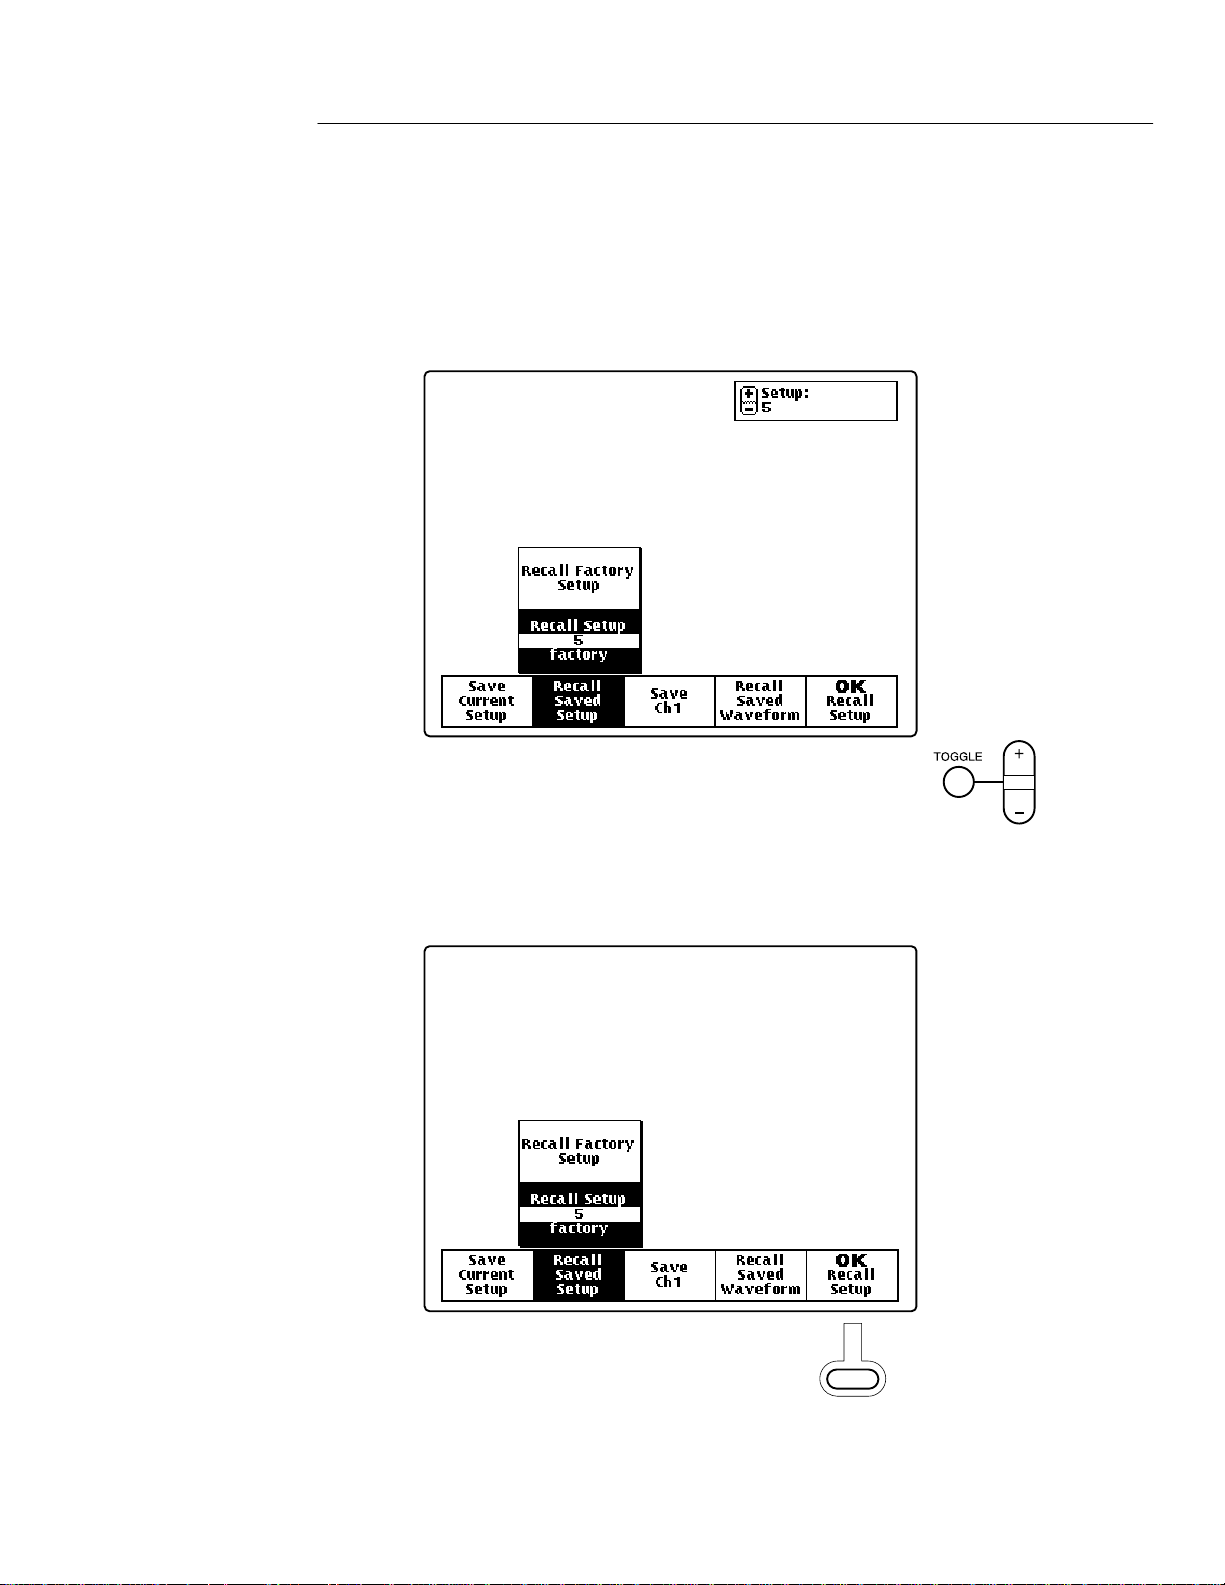
Functional Overview
3. Certain menu choices require you to set a numerical parameter to
+
complete the setup. Use the
/– rocker to adjust the parameter
value or press the TOGGLE button to reset the parameter to its
default value.
4. If the OK bezel button is displayed, press it to confirm
your choice.
THS 710 & THS 720 User Manual
2–3
Page 29
Functional Overview
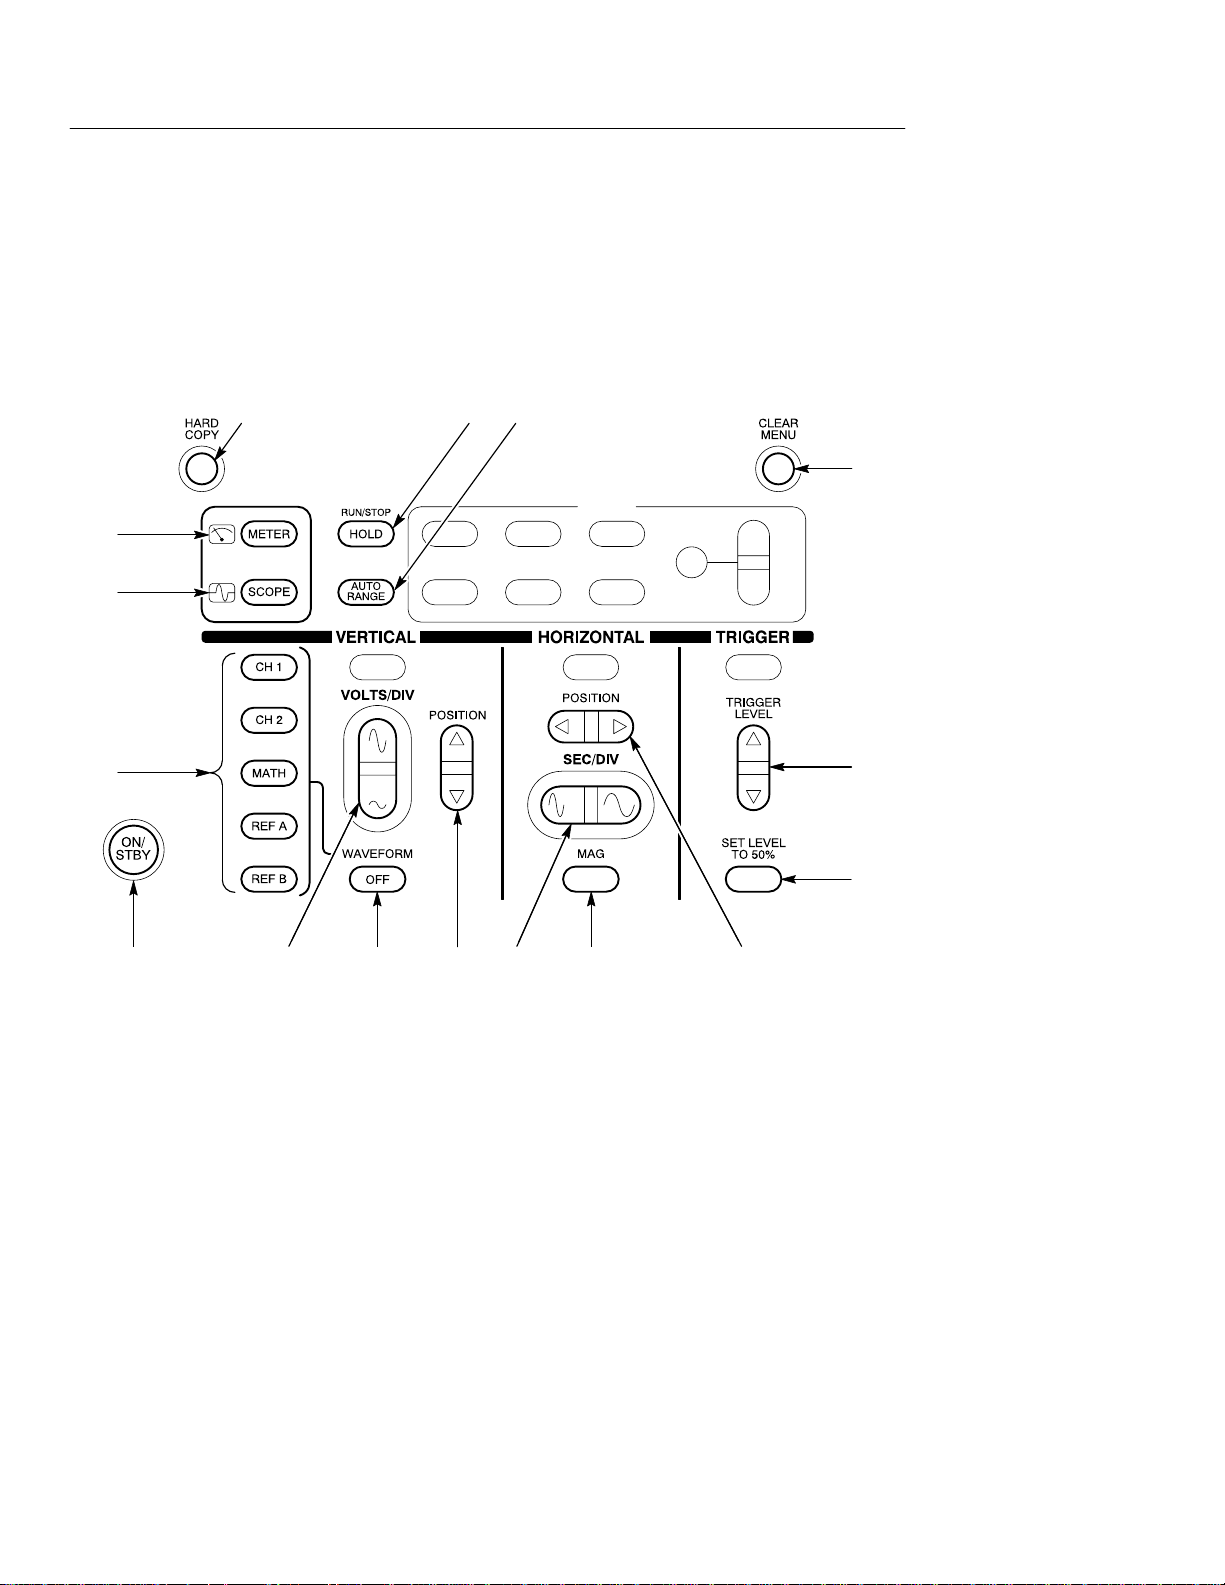
Using the Dedicated Buttons
You can use the dedicated buttons below to take direct actions.
These buttons do not require the use of menus.
16
15
31
2
4
14
5
6
87910111213
1. HARD COPY. Initiates a hard copy using the RS-232 port.
2. HOLD. Stops/restarts oscilloscope acquisition or holds/resets
meter readout.
3. AUTORANGE. Selects oscilloscope or meter Autorange
function.
2–4
THS 710 & THS 720 User Manual
Page 30

Functional Overview
4. CLEAR MENU. Clears menu from display.
5. TRIGGER LEVEL. Adjusts trigger level.
6. SET LEVEL TO 50%. Sets trigger level to midpoint of
oscilloscope waveform.
7. HORIZONTAL POSITION. Adjusts oscilloscope waveform
horizontal position.
8. MAG. Turns 10X horizontal magnification on and off.
9. SEC/DIV. Adjusts horizontal scale factor for oscilloscope or data
logger.
10. VERTICAL POSITION. Adjusts oscilloscope waveform vertical
position.
11. WAVEFORM OFF. Removes selected oscilloscope waveform
from display.
12. VOLTS/DIV. Adjusts oscilloscope vertical scale factor or meter
range.
13. ON/STBY. Selects on or standby. Does not disconnect power
from the instrument.
14. CH 1, CH 2, MATH, REF A, REF B. Displays waveform and
chooses selected waveform.
15. SCOPE. Selects scope mode.
16. METER. Selects meter mode.
THS 710 & THS 720 User Manual
2–5
Page 31

Functional Overview
Using Scope Mode
Press the front-panel SCOPE button to enter scope mode. Then,
press AUTORANGE to set the vertical, horizontal, and trigger
automatically for a usable display.
The scope-mode display, shown below, is divided into four sections.
Refer to SCOPE Mode on page 3–40 for a description of each
section.
Status line
Graticule
area
Measurement
readout area
Waveform readout lines
2–6
THS 710 & THS 720 User Manual
Page 32
Using Meter Mode
Press the front-panel METER button to enter meter mode. Press one
of the bezel buttons to choose a meter function and then press
AUTORANGE to set the range automatically.
The meter-mode display, shown below, is divided into three sections.
Refer to METER Mode on page 3–31 for a description of each
section and more information about the data logger and bar graph.
Status line
Functional Overview
Graticule area
Measurement
readout areas
THS 710 & THS 720 User Manual
2–7
Page 33
Functional Overview
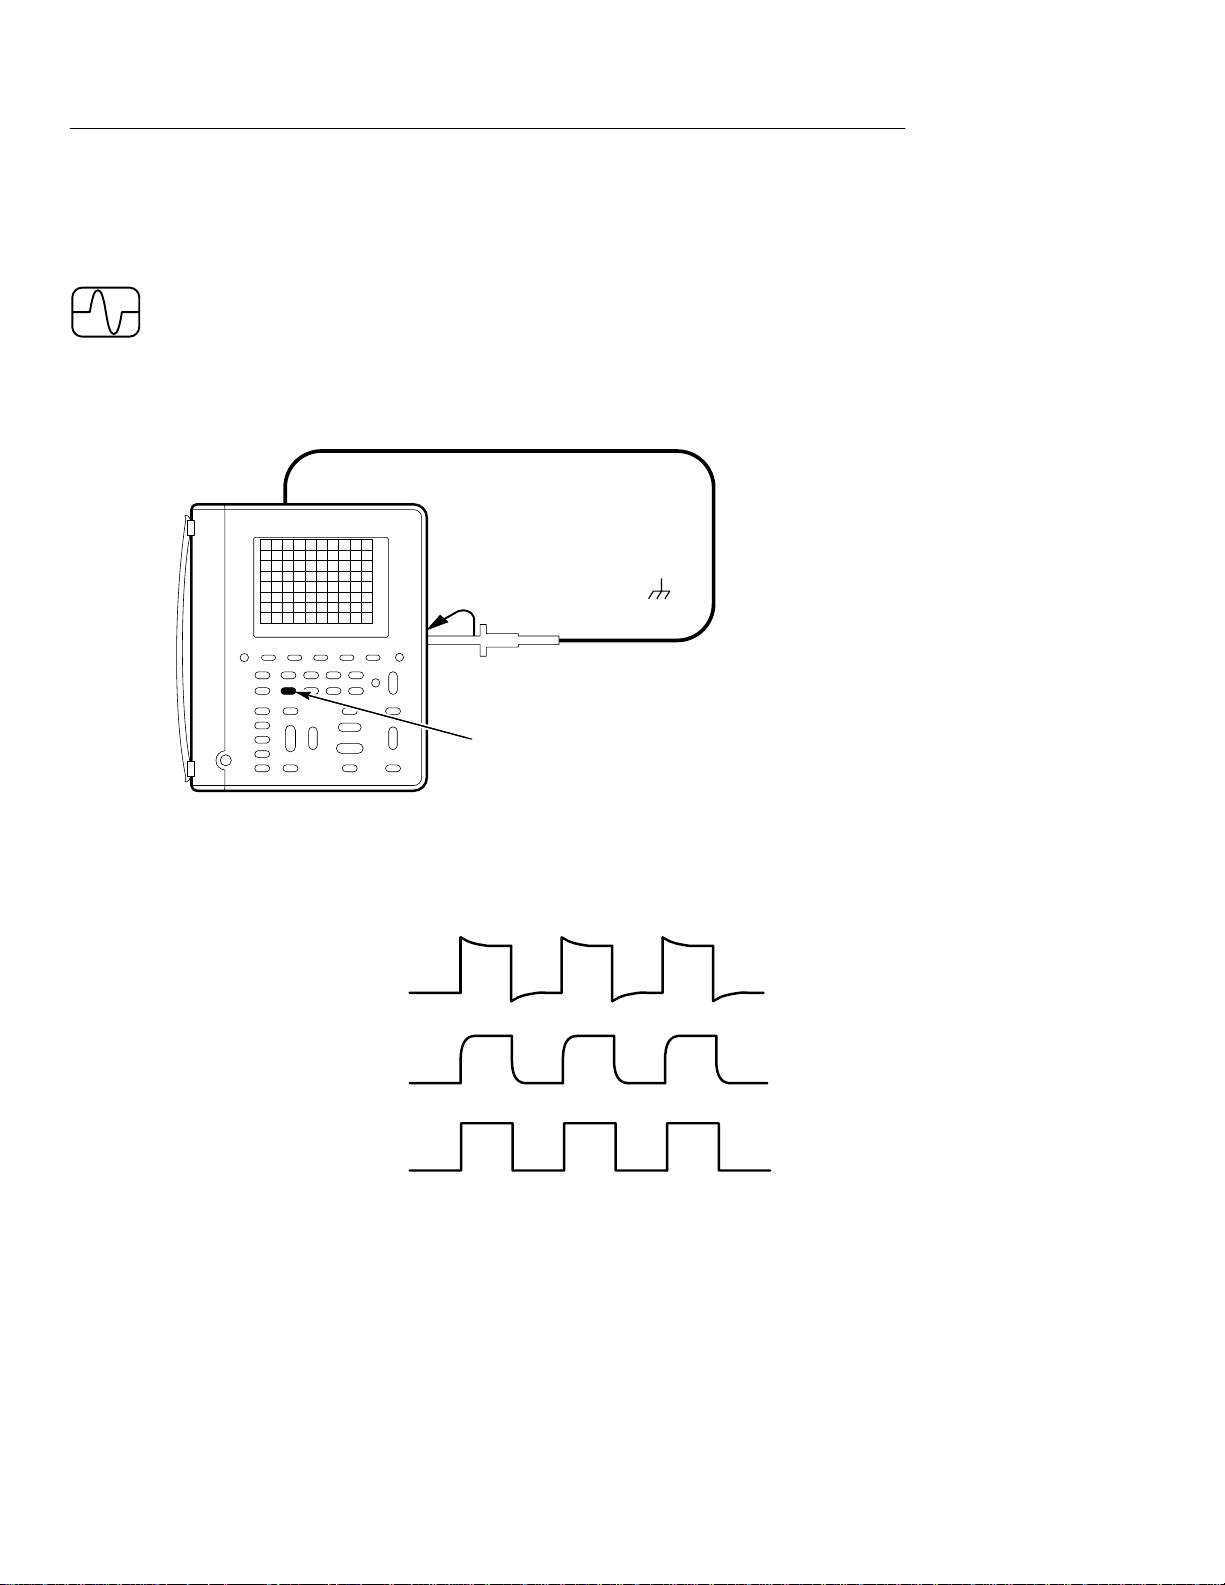
Compensating the Oscilloscope Probes
To maintain signal fidelity, you must compensate each voltage probe
for the channel input it is connected to.
1. Connect the oscilloscope probe and then press AUTORANGE.
Ch 1
Probe reference lead to
Probe tip to PROBE COMP
AUTORANGE
2. Check the shape of the displayed waveform.
Overcompensated
Undercompensated
Compensated correctly
2–8
THS 710 & THS 720 User Manual
Page 34
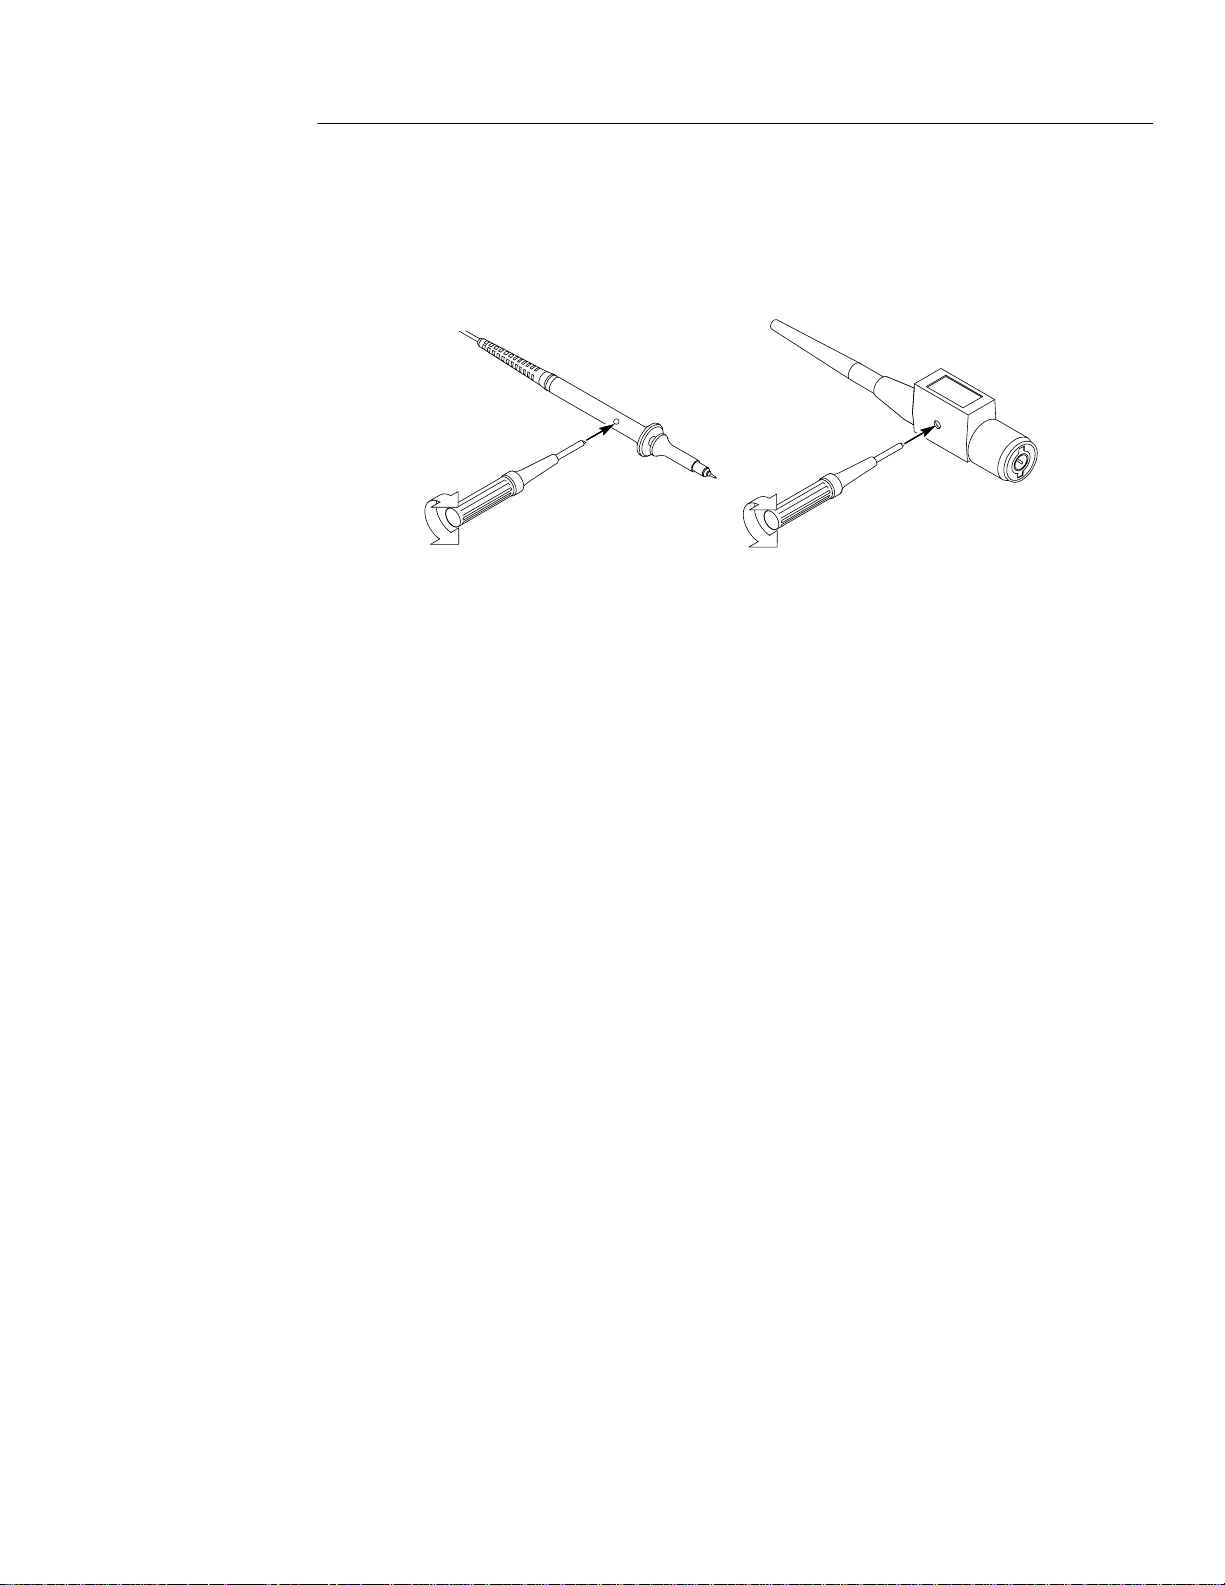
Functional Overview
3. If necessary, adjust the probe for correct compensation.
P6113B P5102
4. Repeat these steps for the other probe and channel.
THS 710 & THS 720 User Manual
2–9
Page 35
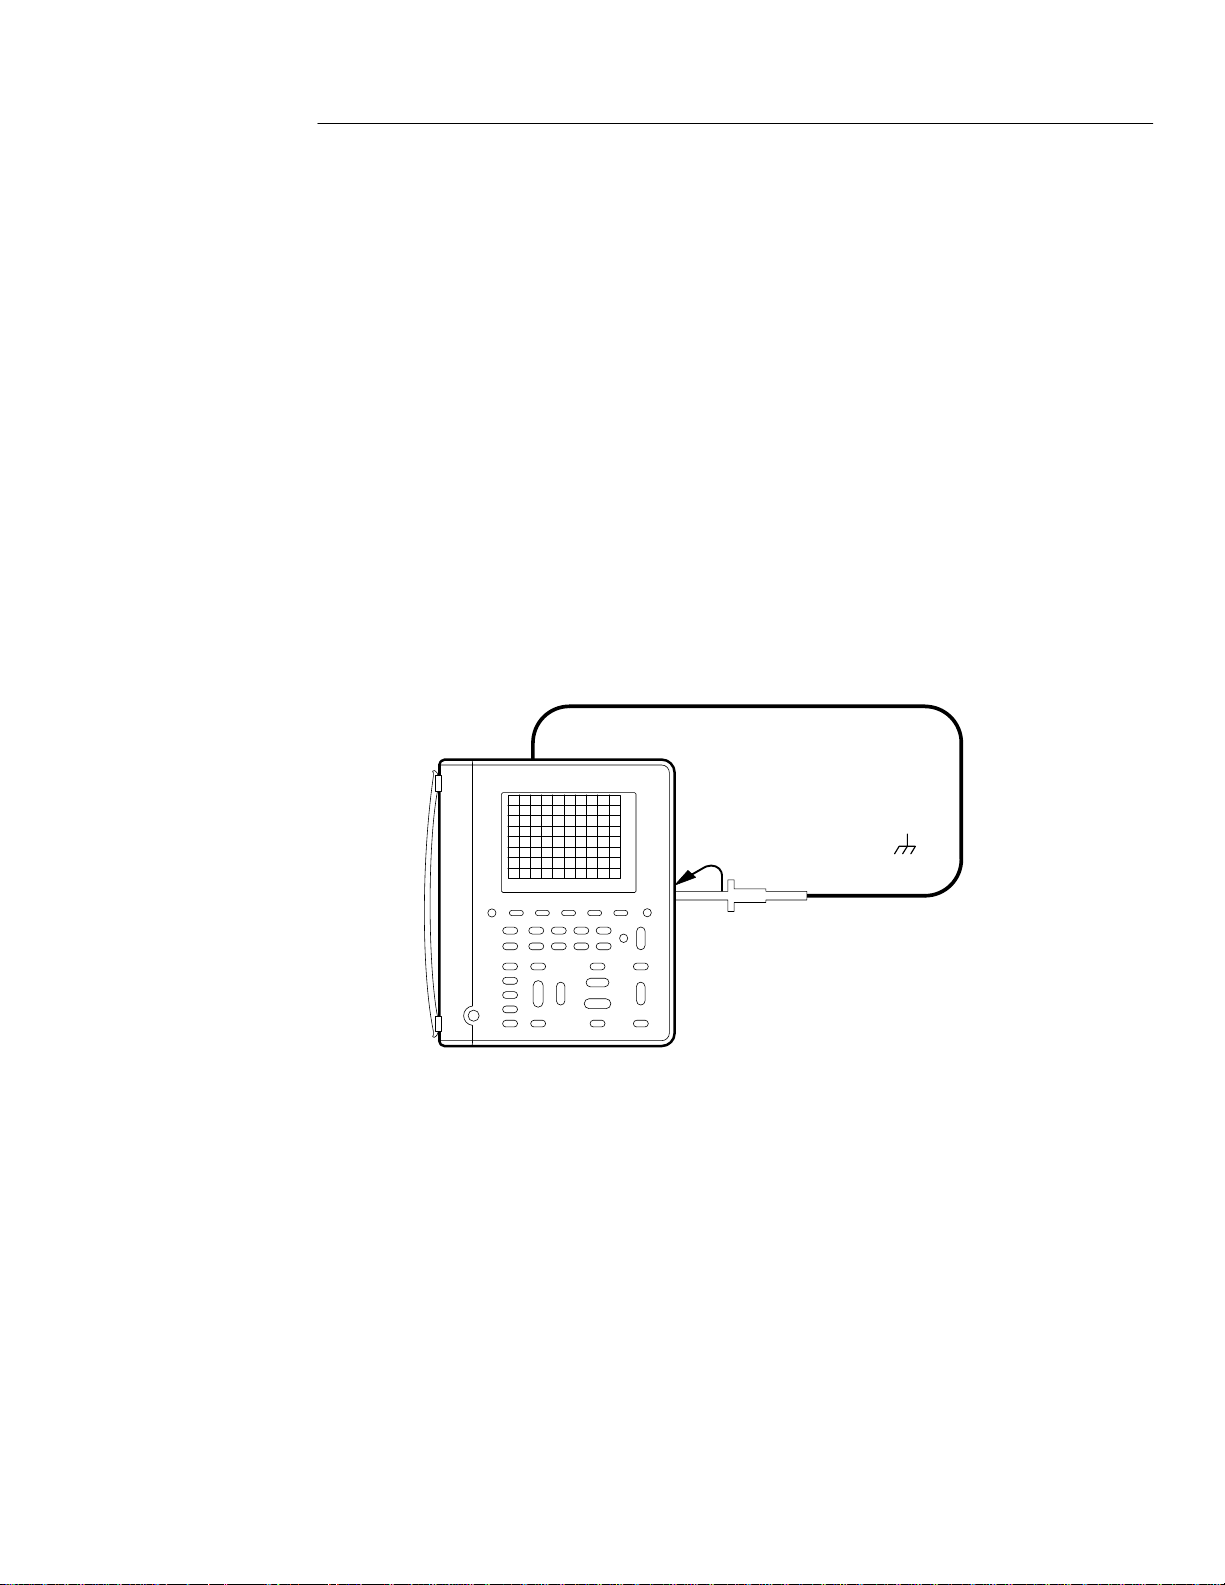
Functional Overview
Taking Floating Measurements
This section covers important issues to consider when taking floating
measurements.
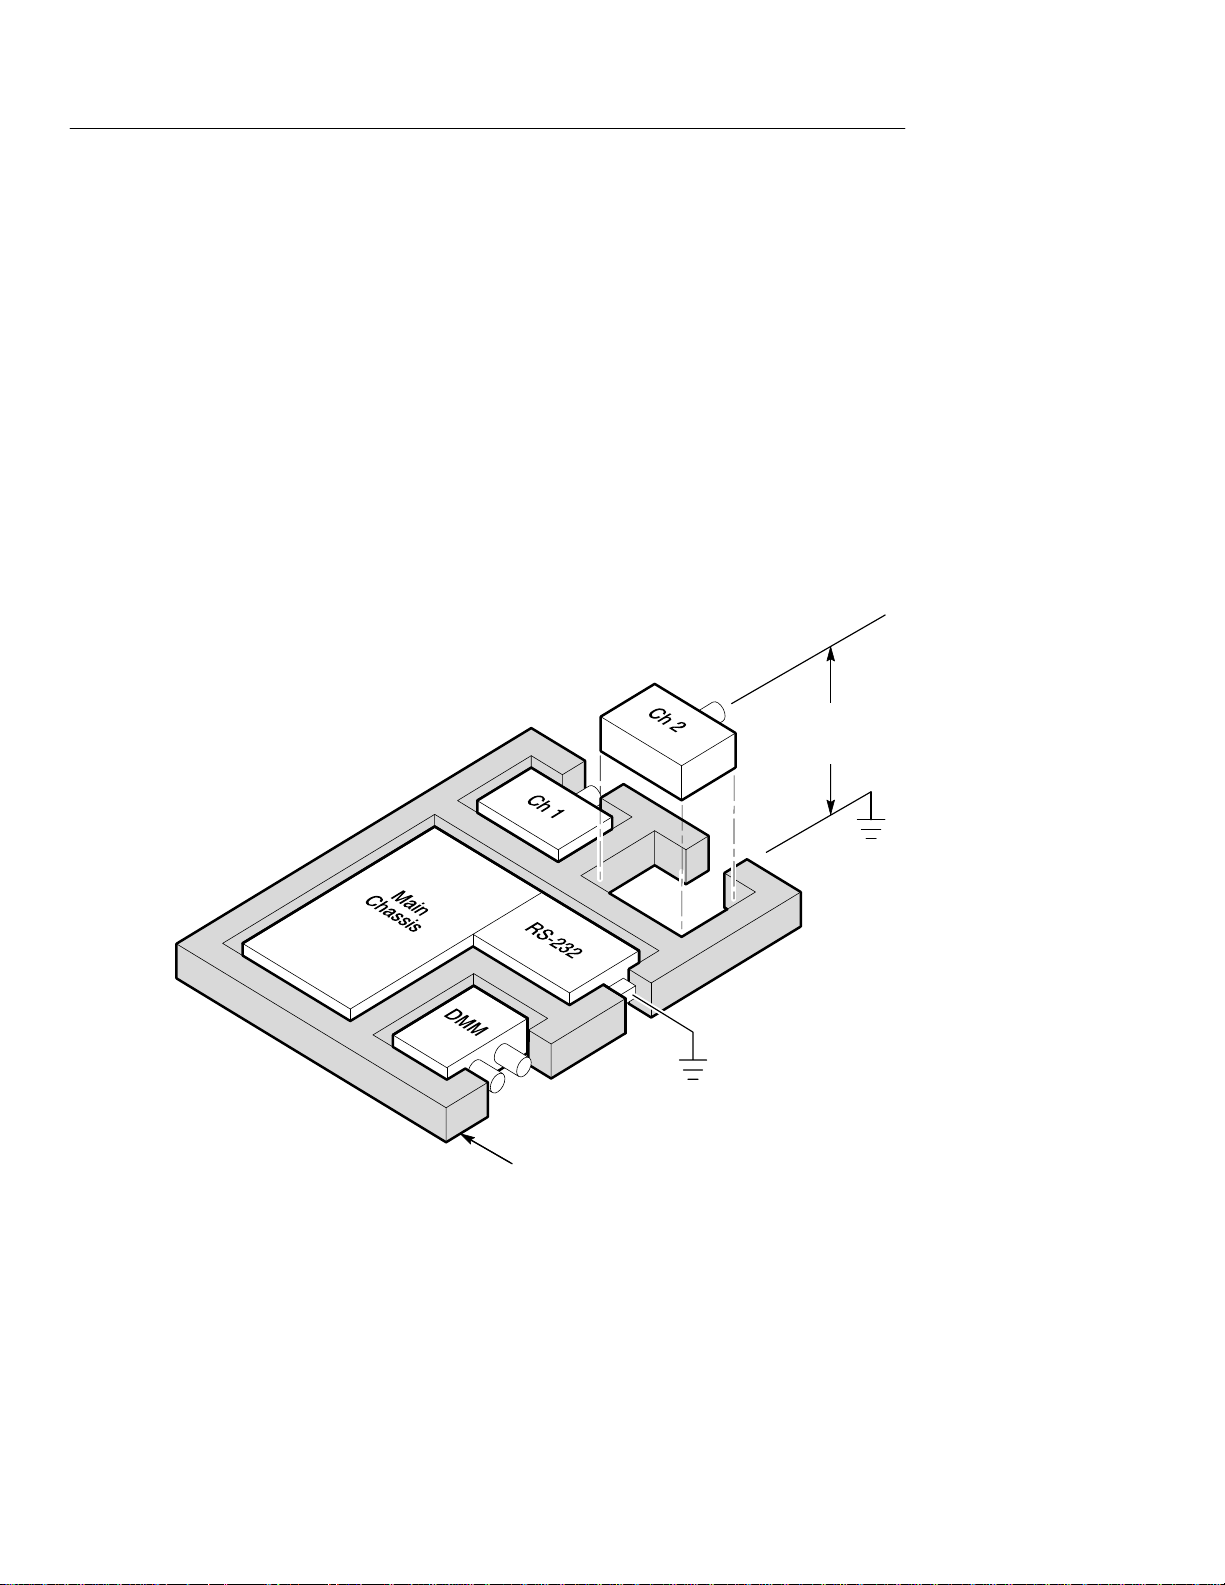
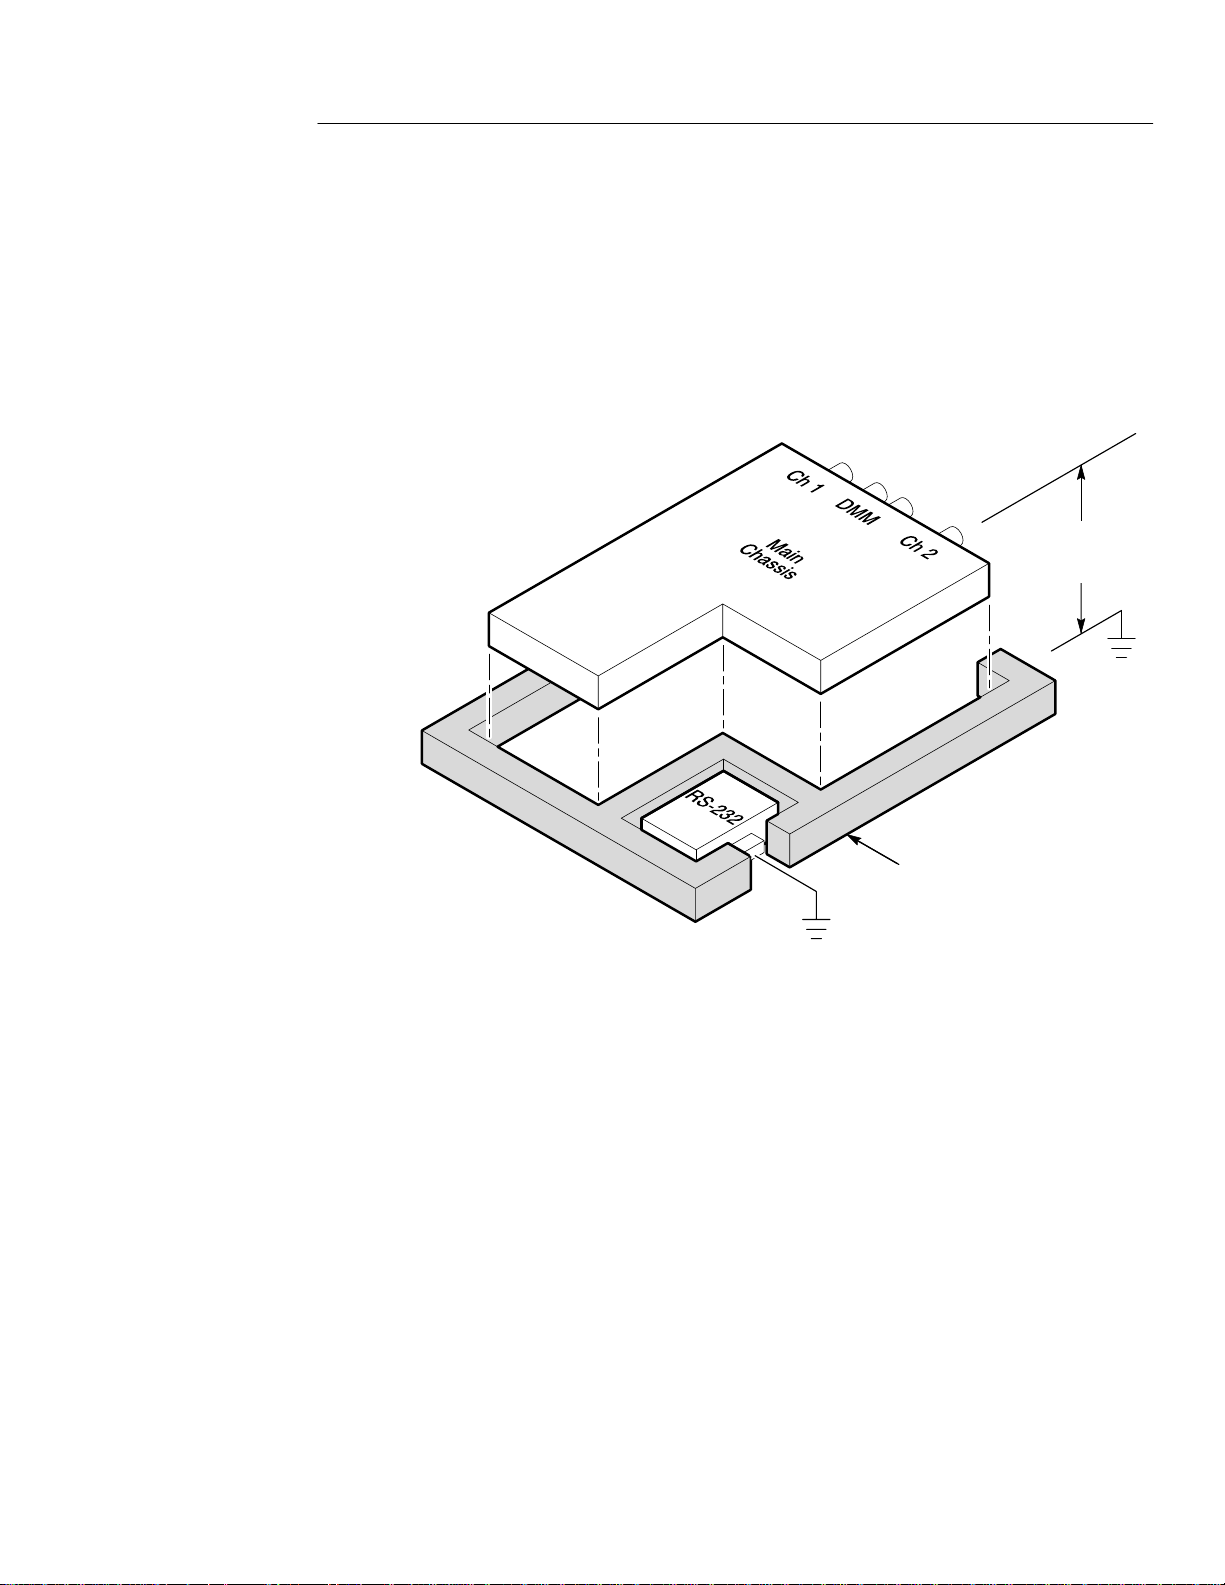
Architecture is Important
For taking floating measurements, the TekScope instrument has
an architectural difference from most other oscilloscopes. The
channel 1, channel 2, and DMM inputs are isolated from the main
chassis and from each other . This architecture allows independent
floating measurements with channel 1, channel 2, and the DMM.
Oscilloscope channels and
DMM float independently.
DC and/or
AC voltage
2–10
Electrically insulated case
THS 710 & THS 720 User Manual
Page 36
Functional Overview
Many handheld oscilloscope/DMM products have the architecture
shown below, which shares a common reference for the oscilloscope
channels and DMM. With this architecture, all input signals must
have the same voltage reference when you take any multi-channel
measurements.
Oscilloscope channels and
DMM must float together.
DC and/or
AC voltage
Electrically insulated case
Most bench-top oscilloscopes share the above architecture but
without the insulated case. Without dif ferential preamplifiers or
external signal isolators, bench-top oscillscopes are not suitable for
taking floating measurements.
THS 710 & THS 720 User Manual
2–1 1
Page 37

Functional Overview
Attach the Reference Leads Correctly
If you are using both of the oscilloscope channels, you must attach
the probe reference lead for each channel directly to your circuit.
These attachments are required because the oscilloscope channels are
electrically isolated; they do not share a common chassis connection.
Use the shortest possible reference lead with each probe to maintain
good signal fidelity. If you are also using the DMM, you must also
attach the DMM common lead to your circuit for the same reason as
above.
The probe reference lead presents a higher capacitive load to the
circuit-under-test than the probe tip. When taking a floating
measurement between two nodes of a circuit, attach the probe
reference lead to the lowest impedance or least dynamic of the two
nodes.
Beware of High Voltages
Understand the voltage ratings for the probes you are using and do
not exceed those ratings. Two ratings are important to know and
understand:
H The maximum measurement voltage from the probe tip to the
probe reference lead
H The maximum floating voltage from the probe reference lead to
earth ground
These two voltage ratings depend on the probe and your application.
Refer to Specifications beginning on page A–1 for more information.
WARNING. To prevent electrical shock, do not exceed the measurement or floating voltage ratings for the oscilloscope input BNC
connector, probe tip, probe reference lead, DMM input connector, or
DMM lead.
2–12
THS 710 & THS 720 User Manual
Page 38

Application Examples
This section presents a series of application examples. These
simplified examples highlight the features of the TekScope
instrument and give you ideas about using it to solve your own test
problems.
The first two examples demonstrate basic scope and meter operation.
The remaining examples provide an overview of applications that
cover the following areas:
H Digital circuit testing
H Analog circuit testing
H Power electronic testing
H Motor testing
H Power quality monitoring
H Video signal testing
THS 710 & THS 720 User Manual
2–13
Page 39
Application Examples
Displaying an Unknown Signal
You need to see a signal in a circuit, but you have no previous
knowledge of the signal amplitude, frequency, or shape. Connect the
TekScope instrument to quickly display the signal.
Ch 1
2–14
THS 710 & THS 720 User Manual
Page 40
Setup to Display an Unknown Signal
Application Examples
SCOPE AUTO
RANGE
The autorange feature sets the vertical, horizontal, and trigger
automatically for a usable display. If the signal changes, the setup
tracks those changes.
— — —
Going Further
If the autorange setup does not display the waveform exactly the way
you like, you can easily change the setup. Press any of the buttons
below to cancel autorange mode and modify the setup:
H VOLTS/DIV
H SEC/DIV
H TRIGGER LEVEL
H SET TRIGGER LEVEL TO 50%
THS 710 & THS 720 User Manual
2–15
Page 41
Application Examples
Measuring Resistance
You need to probe a circuit to measure point-to-point resistance.
Connect the TekScope instrument to measure a variety of resistance
values.
2–16
29.23 k
THS 710 & THS 720 User Manual
Page 42

Setup to Measure Resistance
Application Examples
METER AUTO
RANGE
— —
Going Further
If a noisy environment causes an unstable resistance measurement,
use the Average statistic to average the measurements. Refer to
page 3–29 for more information.
You can use the TekScope instrument as a continuity checker. W ith
the setup below, it beeps when the measured resistance is 50 or
less (typical).
METER —
(continuity)
You can also use the TekScope instrument as a semiconductor-junction checker . Use the setup below to measure the voltage drop across
the junction. The open-circuit voltage is limited to about 4.8 V to
prevent damage to reverse-biased junctions.
— —
METER —
THS 710 & THS 720 User Manual
— —
(diode)
2–17
Page 43
Application Examples
Measuring the Frequency of a Clock Signal
You suspect that the frequency of a TTL clock signal is out of
tolerance. Connect the TekScope instrument to the signal to display
it and measure its frequency.
Ch 1
2–18
Ch 1
Freq
30.62 MHz
THS 710 & THS 720 User Manual
Page 44
Setup to Measure Clock Frequency
—
—
—
Application Examples
SCOPE
AUTO
RANGE
MEAS
— —
Select
Measmnt for
Ch1
OK Select
Measrmnt
Frequency
—
Going Further
You can add peak-to-peak and duty cycle measurements to the
display with the following additional steps:
SCOPE MEAS
Select Page —
Select
Measrmnt for
Ch1
Positive Duty
Cycle
THS 710 & THS 720 User Manual
OK Select
Measrmt
Select Page
(press once)
Select
Measrmnt for
Ch1
OK Select
Measrmt
Pk-Pk
—
2–19
Page 45

Application Examples
Measuring Propagation Delay
You suspect that the memory timing in a microprocessor circuit is
marginal. Set up the TekScope instrument to measure the propagation delay between the chip-select signal and the data output of the
memory device.
Ch 1 Ch 2
Data CS
D: 12.6 ns
2–20
THS 710 & THS 720 User Manual
Page 46

Setup to Measure Propagation Delay
———
Application Examples
SCOPE
1
If necessary, adjust the SEC/DIV rocker to optimize display for
CH 1
CH 2
AUTO
RANGE
CURSOR Function V Bars Adjust first
1
cursor, press
TOGGLE,
and then
adjust second
cursor
the propagation delay measurement.
Set one cursor to the active edge of the chip-select signal and the
second cursor to the data output transition. Read the propagation
delay in the cursor readout.
Going Further
The above example uses cursors to take relative timing measurements (D-seconds) between two different waveforms. If you are
measuring just one waveform, select the Paired cursor function to
measure D-volts and D-seconds at the same time.
THS 710 & THS 720 User Manual
2–21
Page 47

Application Examples
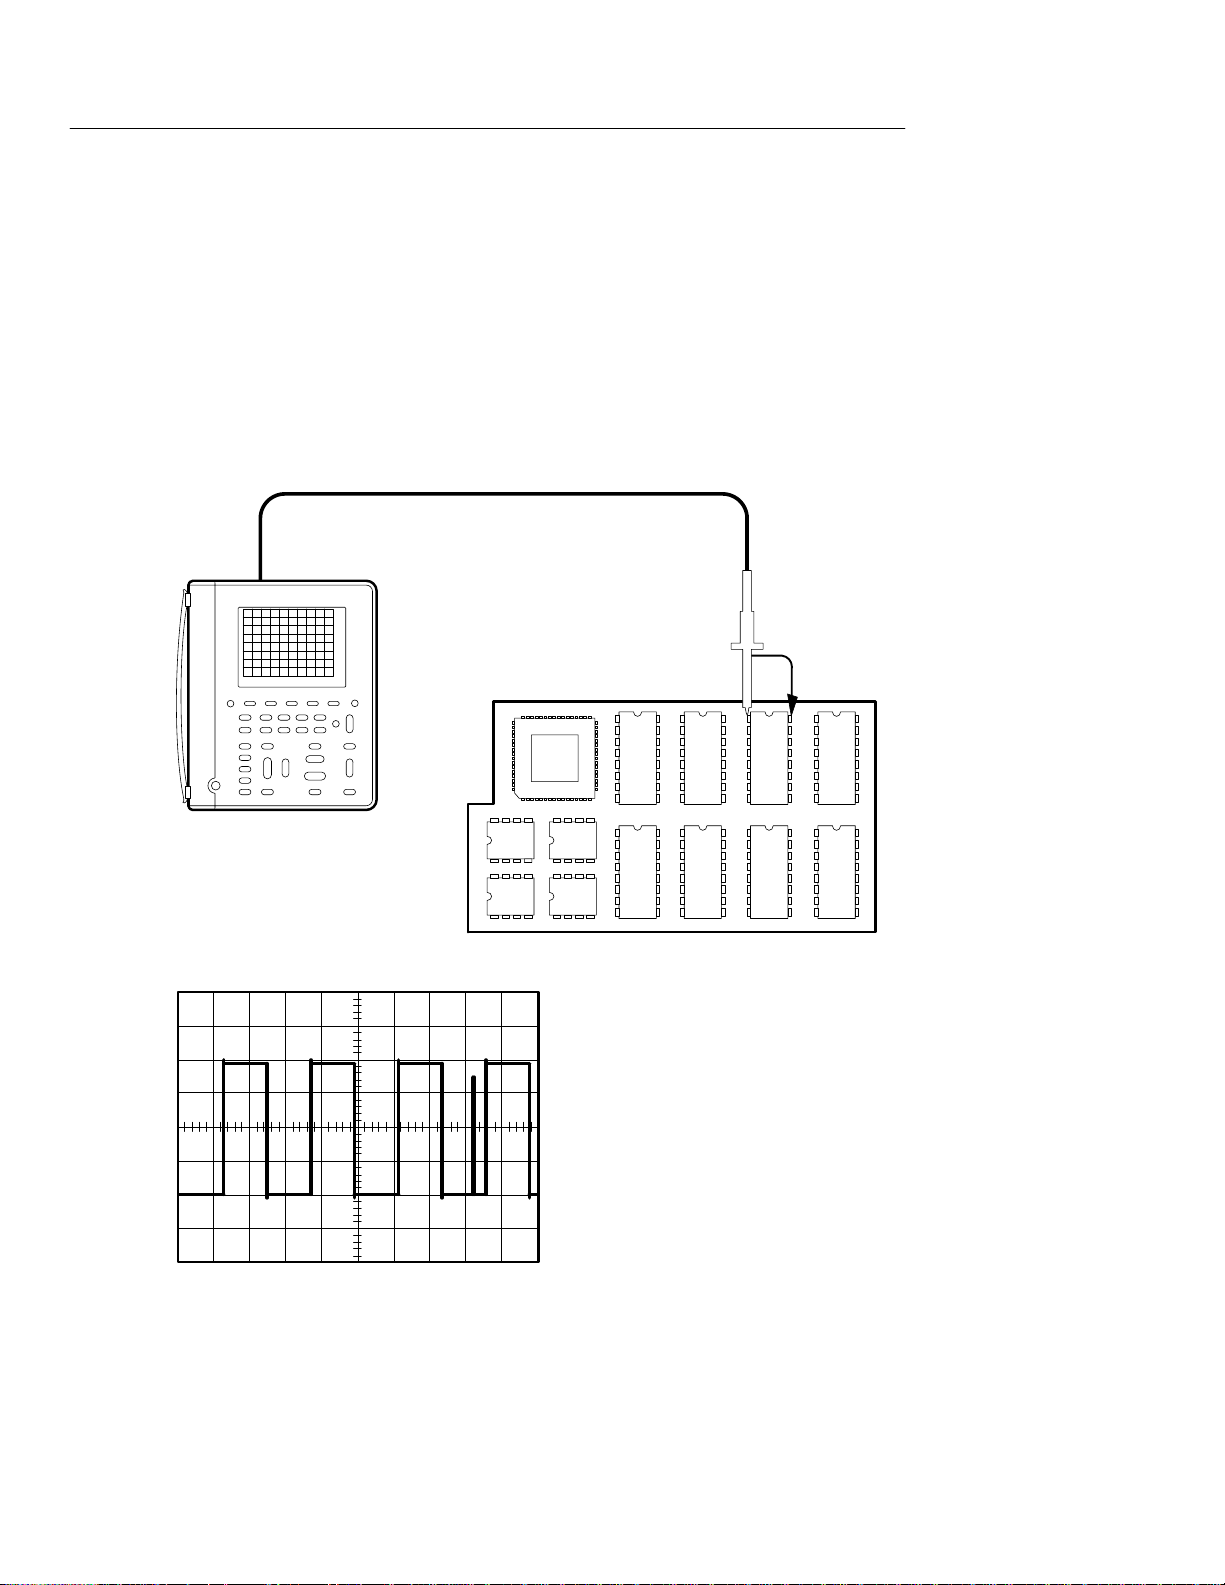
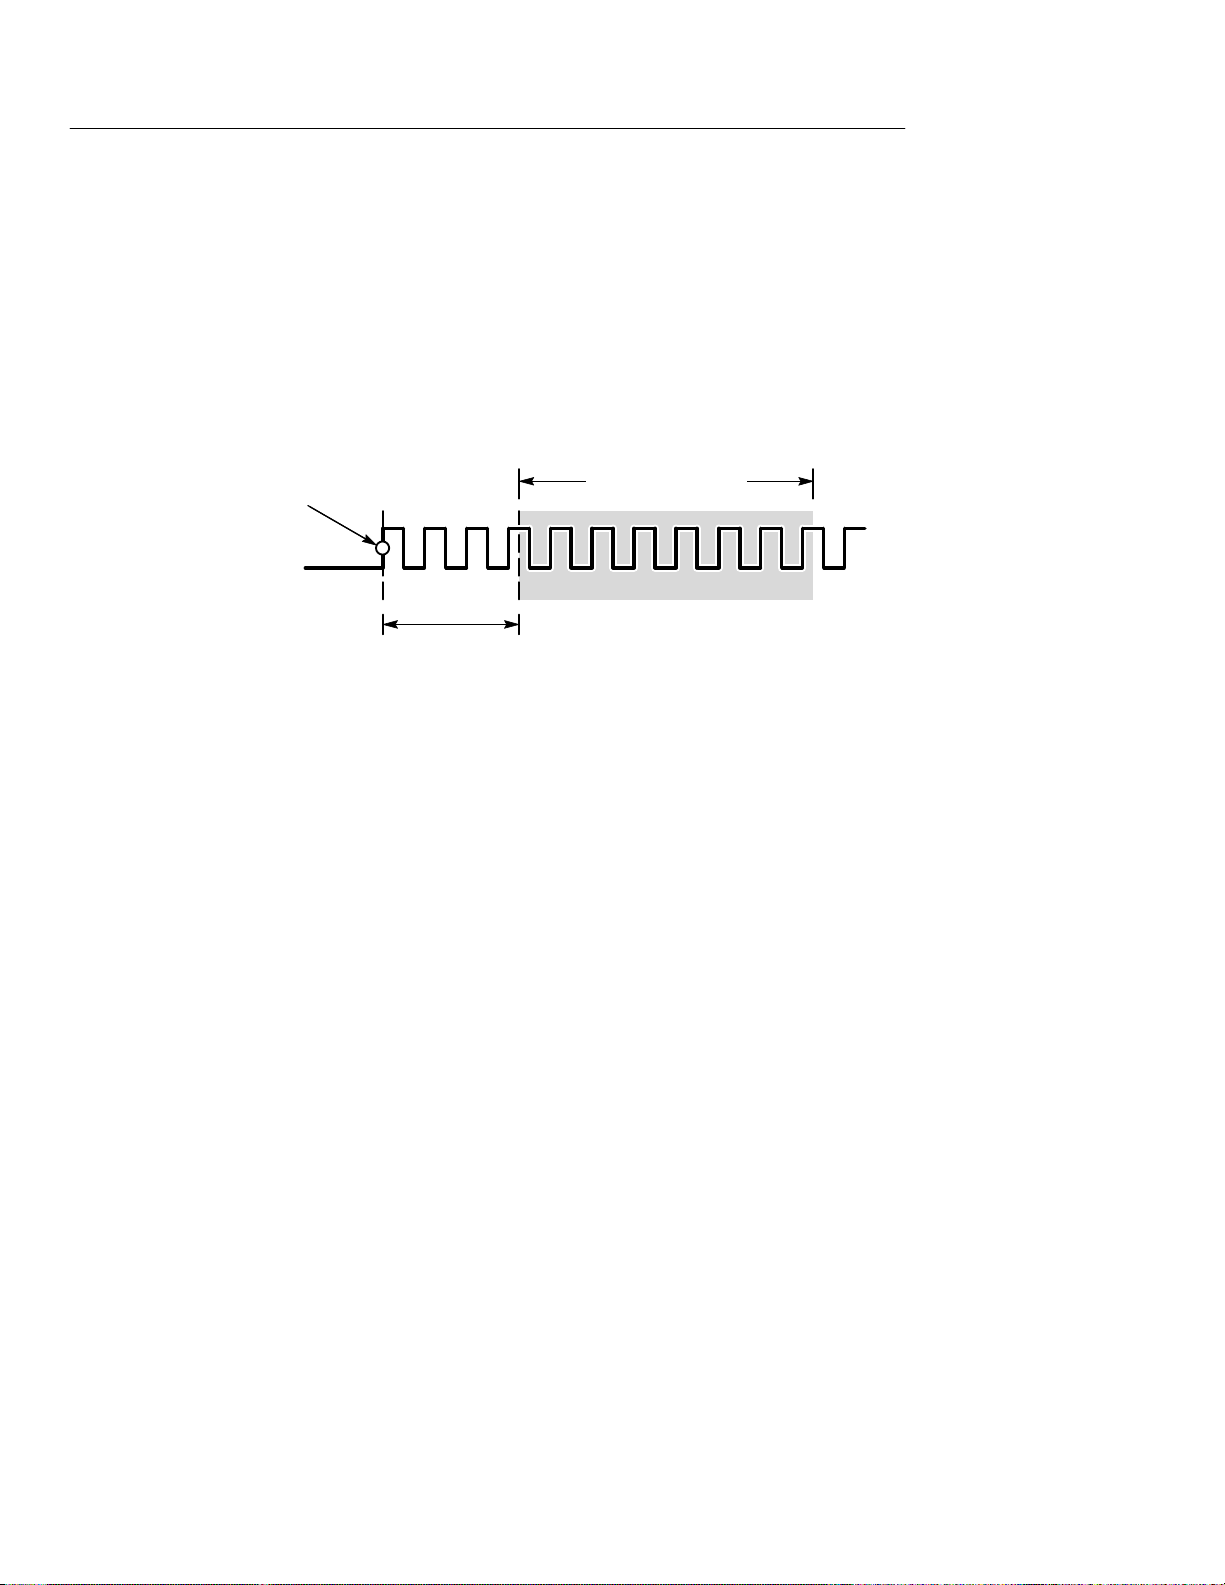
Triggering on a Missing Data Pulse
A positive-going TTL data pulse, 20 ms wide, should occur at least
once every millisecond. The circuit is not working correctly and you
suspect an occasional missing pulse. Set up the TekScope instrument to find the missing pulse.
Ch 1
2–22
THS 710 & THS 720 User Manual
Page 48
Setup to Find Missing Data Pulse
—
—
Application Examples
SCOPE
AUTO
RANGE
TRIGGER
MENU
— —
Type Pulse
Source Ch1
Polarity and
Width
Trigger When Greater Than
Mode Normal
Negative Set width to
Width
1 ms
The TekScope instrument triggers if the signal remains in the low
state longer than 1 ms. If it does, you have found an occurrence of a
missing pulse.
Going Further
You can extend this application in several ways:
H If the pulses are supposed to be periodic (1 ms period) and you
suspect an occasional extra pulse, change the width setting to
980 s and the Trigger When submenu to Less Than Width.
With this setup, TekScope instrument triggers if the spacing
between the pulses ever drops below 980 ms, which indicates an
occurrence of an extra pulse.
H Use the second channel to find the cause of the problem. You
can correlate the cause and the effect because the TekScope
instrument always acquires both channels at exactly the
same time.
THS 710 & THS 720 User Manual
2–23
Page 49
Application Examples
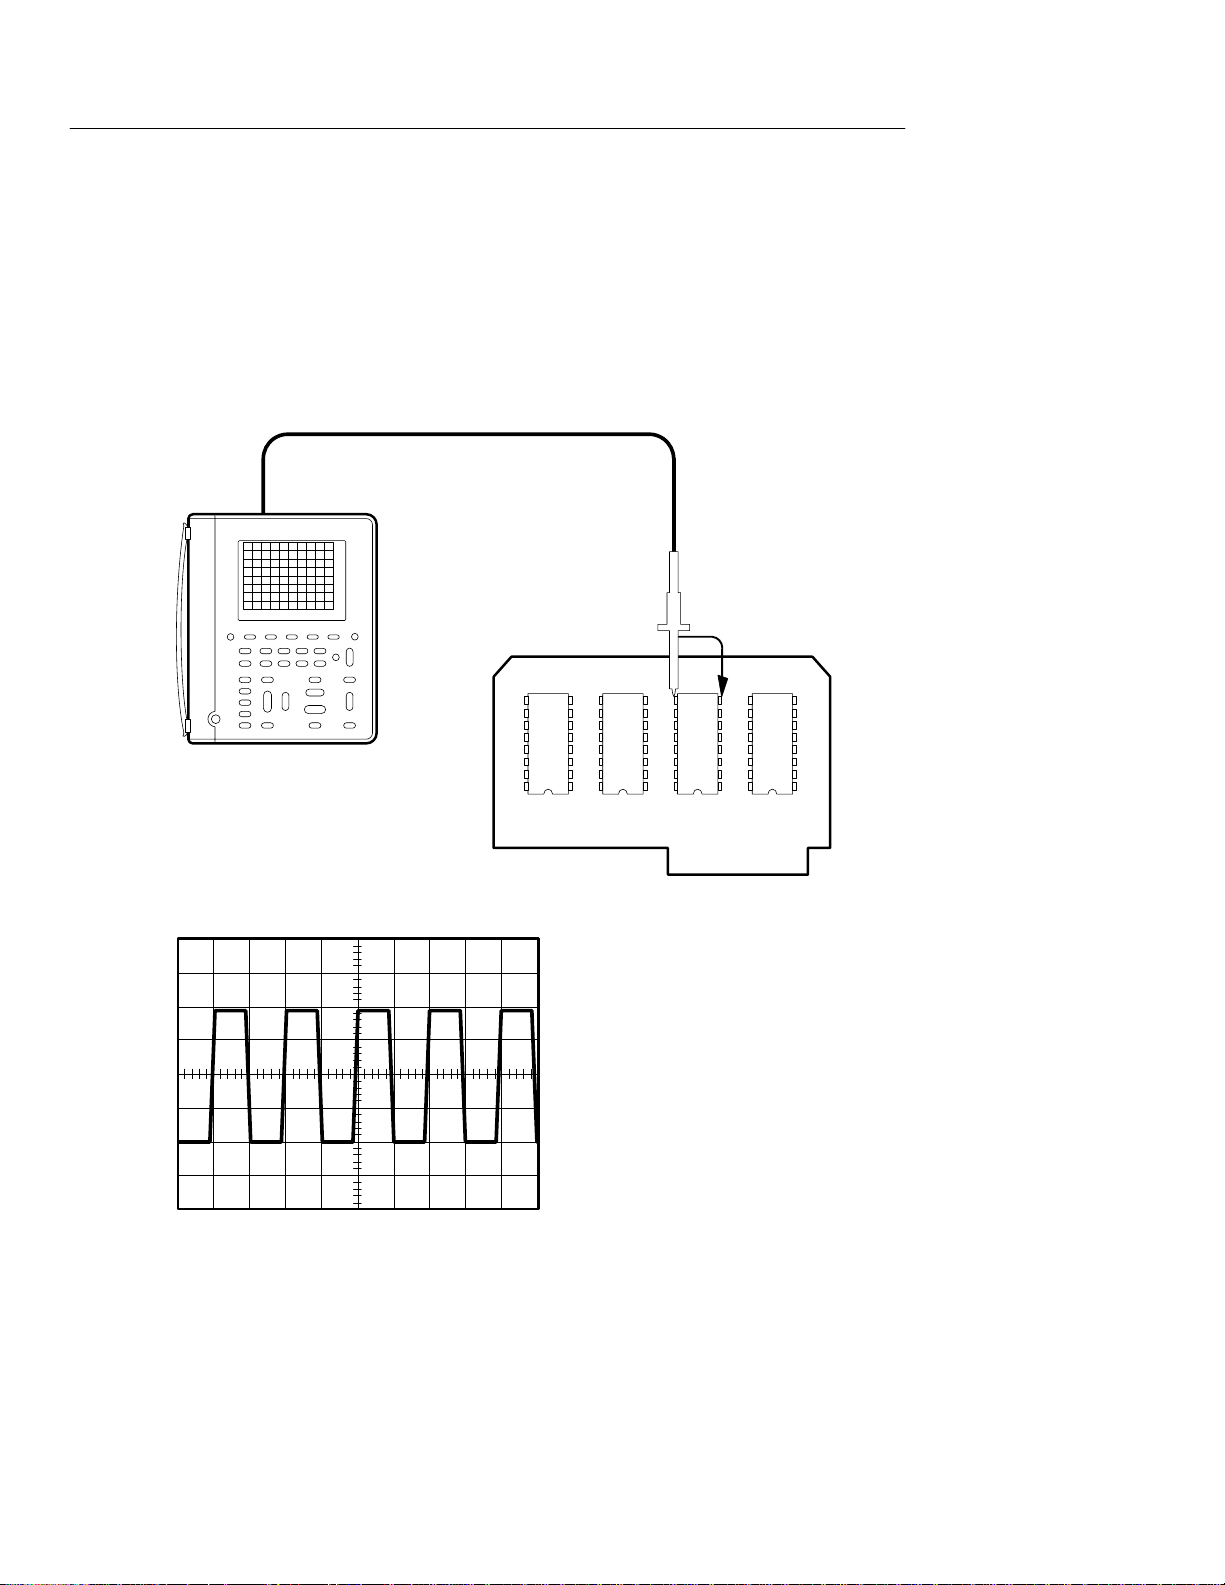
Detecting Narrow Glitches
An elapsed-time counter circuit operates from a precision, 1 kHz
square wave, clock signal supplied by another source. Occasionally,
the counter counts too fast. You suspect glitches in the clock signal
are causing the problem. Set up the TekScope instrument to look for
glitches in the clock signal.
Ch 1
2–24
THS 710 & THS 720 User Manual
Page 50

Setup to Detect Narrow Glitches
—
—
—
Application Examples
SCOPE
AUTO
RANGE
ACQUIRE Mode Envelope
— —
Monitor the clock signal for several minutes. In Envelope acquisition
mode, the TekScope instrument displays the 1 kHz square wave
clock signal plus intermittent glitches that are as narrow as 8 ns.
Going Further
You can trigger on the glitch itself with the following setup:
SCOPE TRIGGER
MENU
Type Pulse
Source Ch1
Polarity and
Width
Positive Set width to
500 s
A triggers occurs only if a positive pulse narrower than 500 ms (half
the period of the clock signal) is detected.
THS 710 & THS 720 User Manual
Trigger When Less Than
Width
Mode Normal
2–25
Page 51
Application Examples
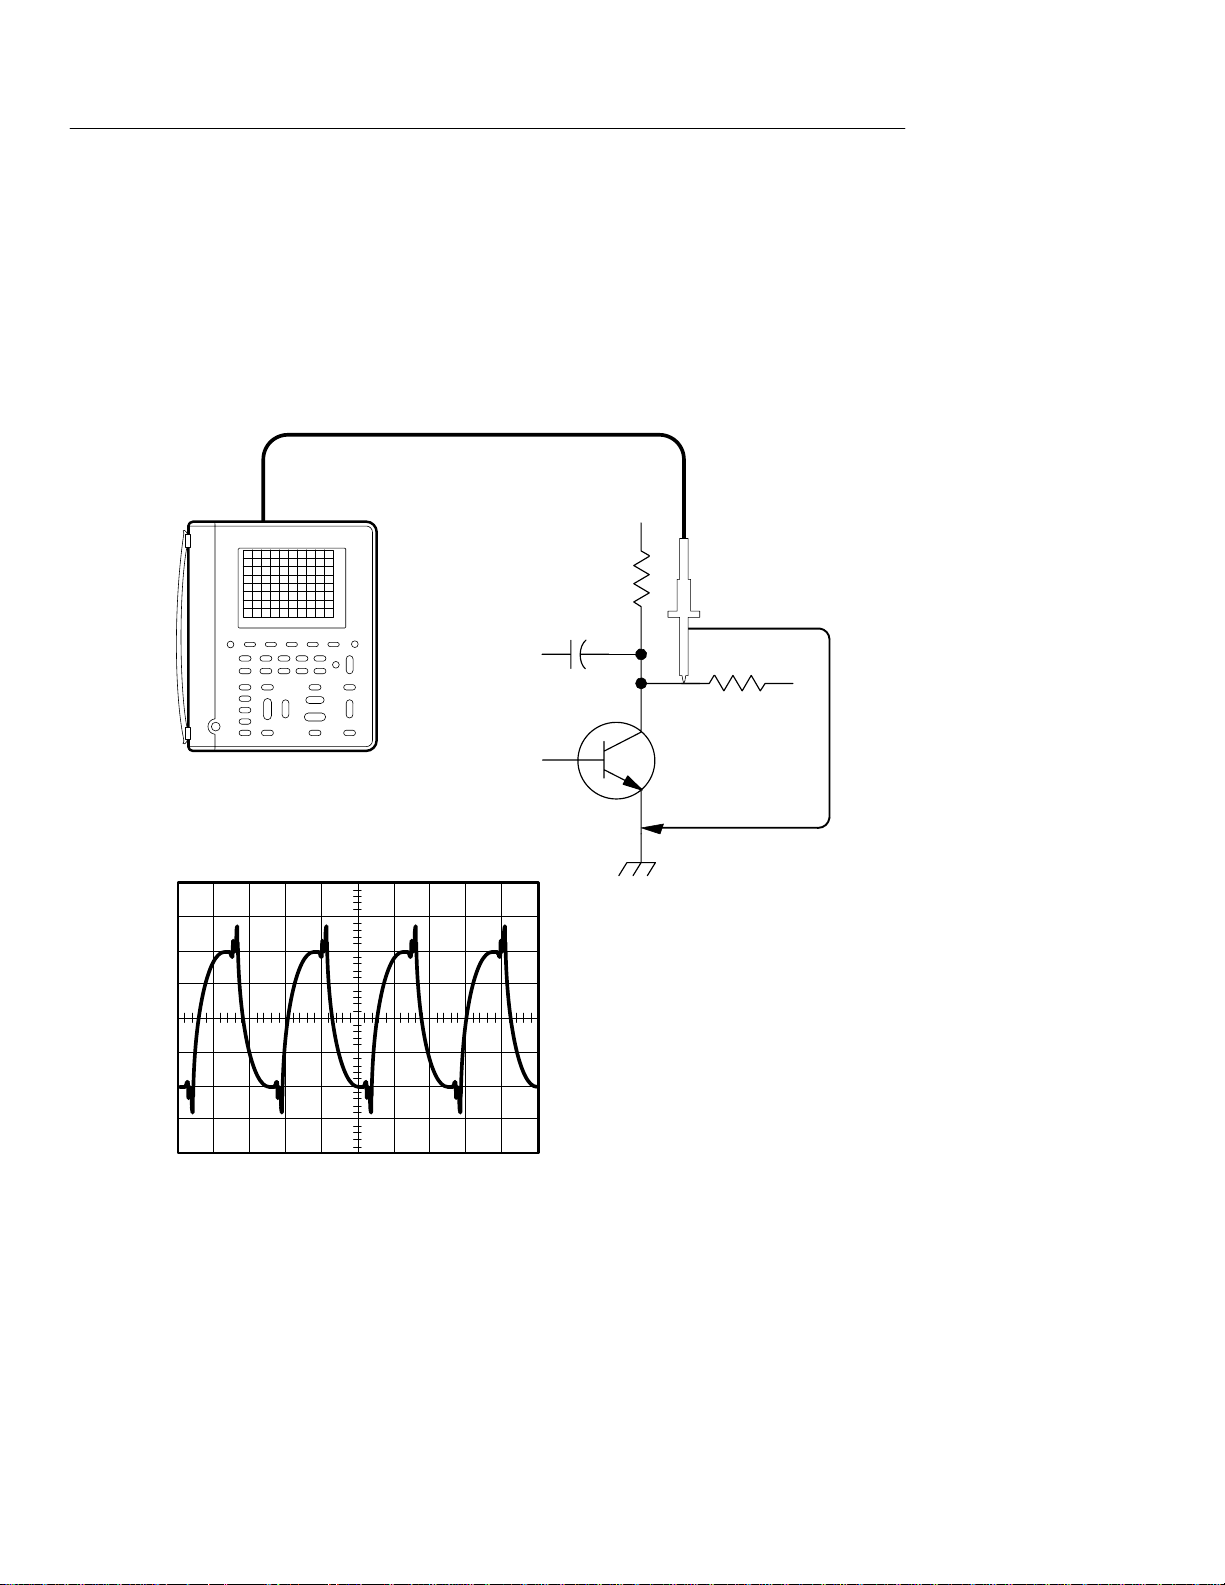
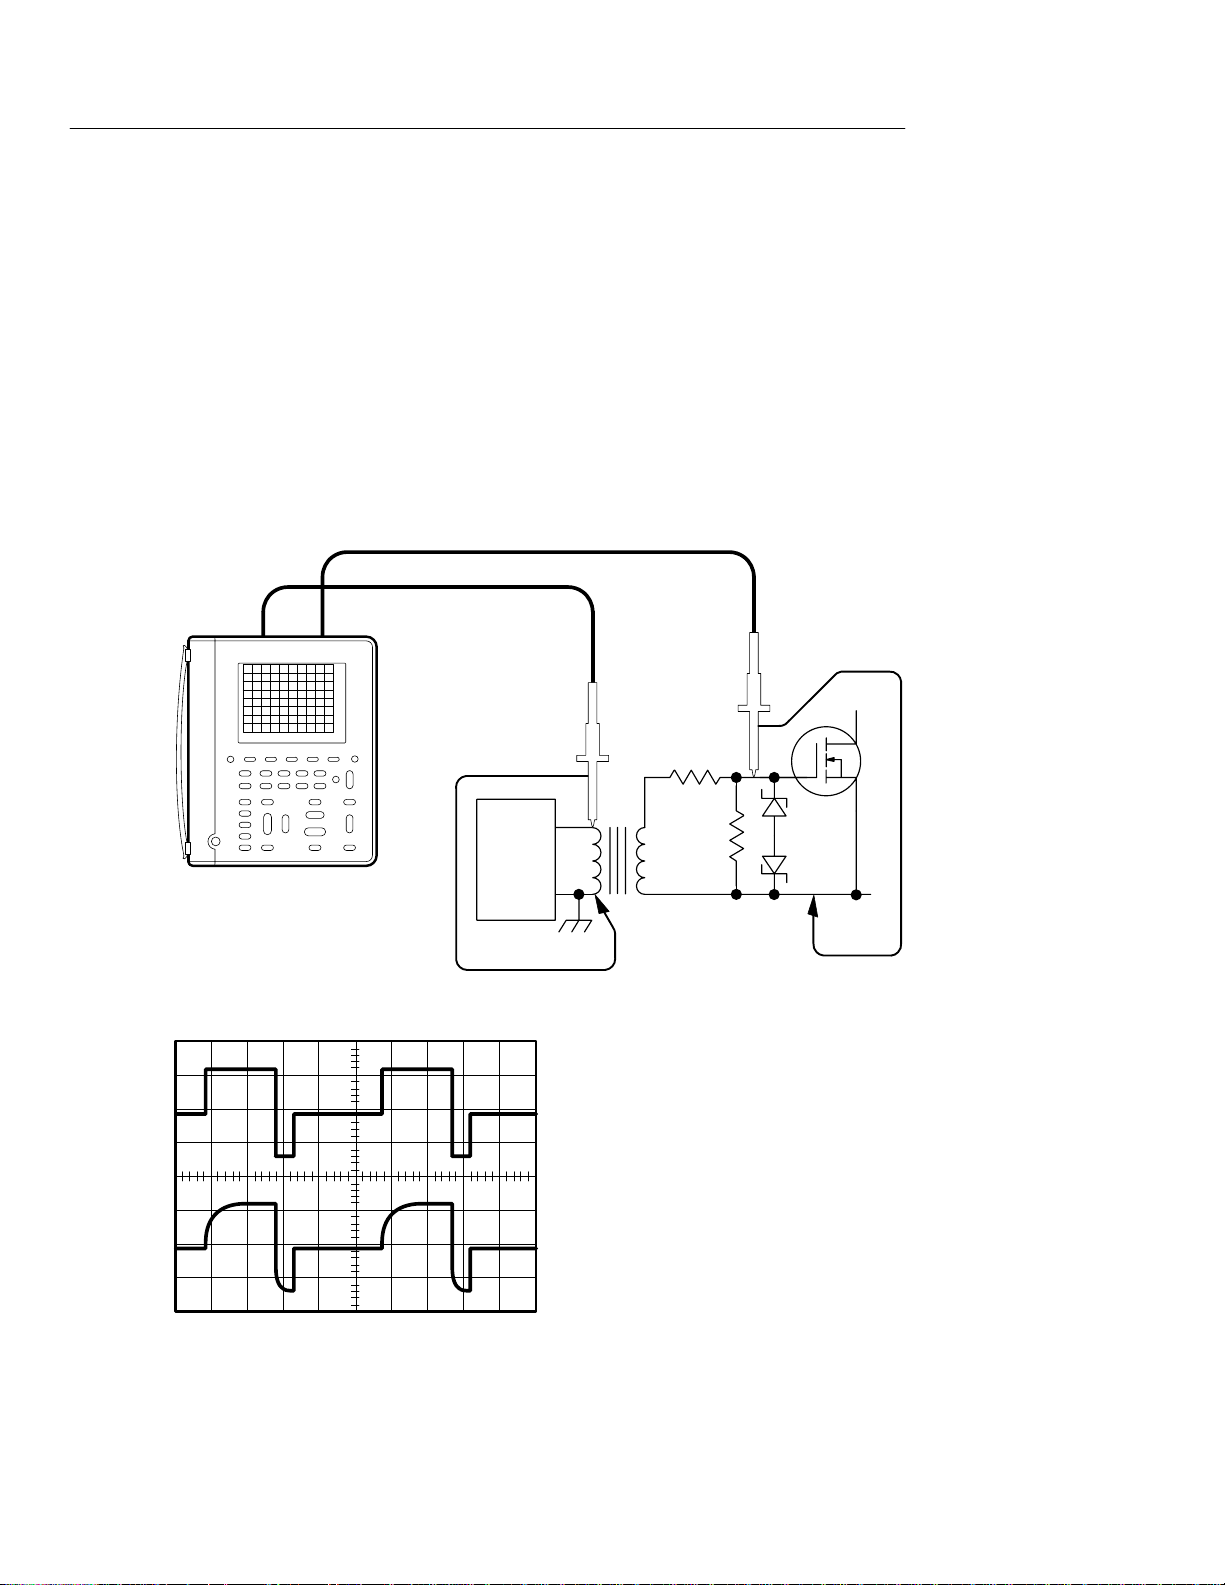
Testing a Switching Transistor Drive Circuit
You need to evaluate the gate-drive circuit for a power FET
(field-effect transistor) in a switching power supply. The gate-drive
timing circuit is referenced to chassis ground. But the gate-drive
signal is transformer-coupled to the FET, which is connected to a
–300 VDC bus. Set up the TekScope instrument to compare the
gate-drive signal at the output of the timing circuit to the signal at
the gate of the FET.
Ch 1 Ch 2
P5102
Probe
Timing
circuit
–300 VDC bus
2–26
THS 710 & THS 720 User Manual
Page 52
Setup to Test the Transistor Drive Circuit
———
Application Examples
SCOPE
CH 1
CH 2
AUTO
RANGE
You do not have to do anything special to take this difficult
measurement. Because of the isolated channels, you can reference
the channel 1 probe to chassis ground and the channel 2 probe
directly to the –300 VDC bus. Channel 1 displays the gate-drive
signal directly from the driver and channel 2 displays the signal as it
is received by the power FET.
Going Further
The isolated channels allow you to reference a channel to AC as well
as DC voltages.
H You can connect the P5102 probe reference lead to 50 Hz, 60 Hz,
or 400 Hz AC power lines (up to the maximum voltage rating).
H You can connect the P6113B or P5102 probe reference lead to
dynamic signals with slew rates up to 3000 V/ms (up to the
maximum voltage rating).
Because you can connect to references other than ground, you can
take many measurements that would otherwise require an oscilloscope with a differential input.
THS 710 & THS 720 User Manual
2–27
Page 53

Application Examples
Measuring Instantaneous Power Dissipation
in a Switching Transistor
The output transistor in a switching power supply is hotter than it
should be. You are concerned about its peak power dissipation. Set
up the T ekScope instrument to measure the instantaneous power
dissipation of the transistor using an optional current probe.
Ch 1 Ch 2
100 mV/A
2–28
Voltage waveform (Ch 1)
Current waveform (Ch 2)
Power waveform (Math)
THS 710 & THS 720 User Manual
Page 54

Application Examples
—
—
Setup to Measure Instantaneous Power Dissipation
SCOPE
CH 1 — — —
CH 2 Probe Type Current
Probe
AUTO
RANGE
MATH Function Ch1 × Ch2
CURSOR Function Paired Set cursor
— —
Set to
100 mV/A
Move the cursor along the power (MATH) waveform and read the
instantaneous power in the cursor readout (for example, @5.63 W).
Going Further
Measure the average power dissipation in the transistor (mean value
of the power waveform) with the following setup:
SCOPE MEAS
You can also display the I-V characteristic of the transistor for
comparison to its safe operating area using the XY display format.
Refer to page 3–14 for information on XY display format.
THS 710 & THS 720 User Manual
Select
Measrmnt for
MATH
OK Select
Measrmnt
Mean
—
2–29
Page 55
Application Examples
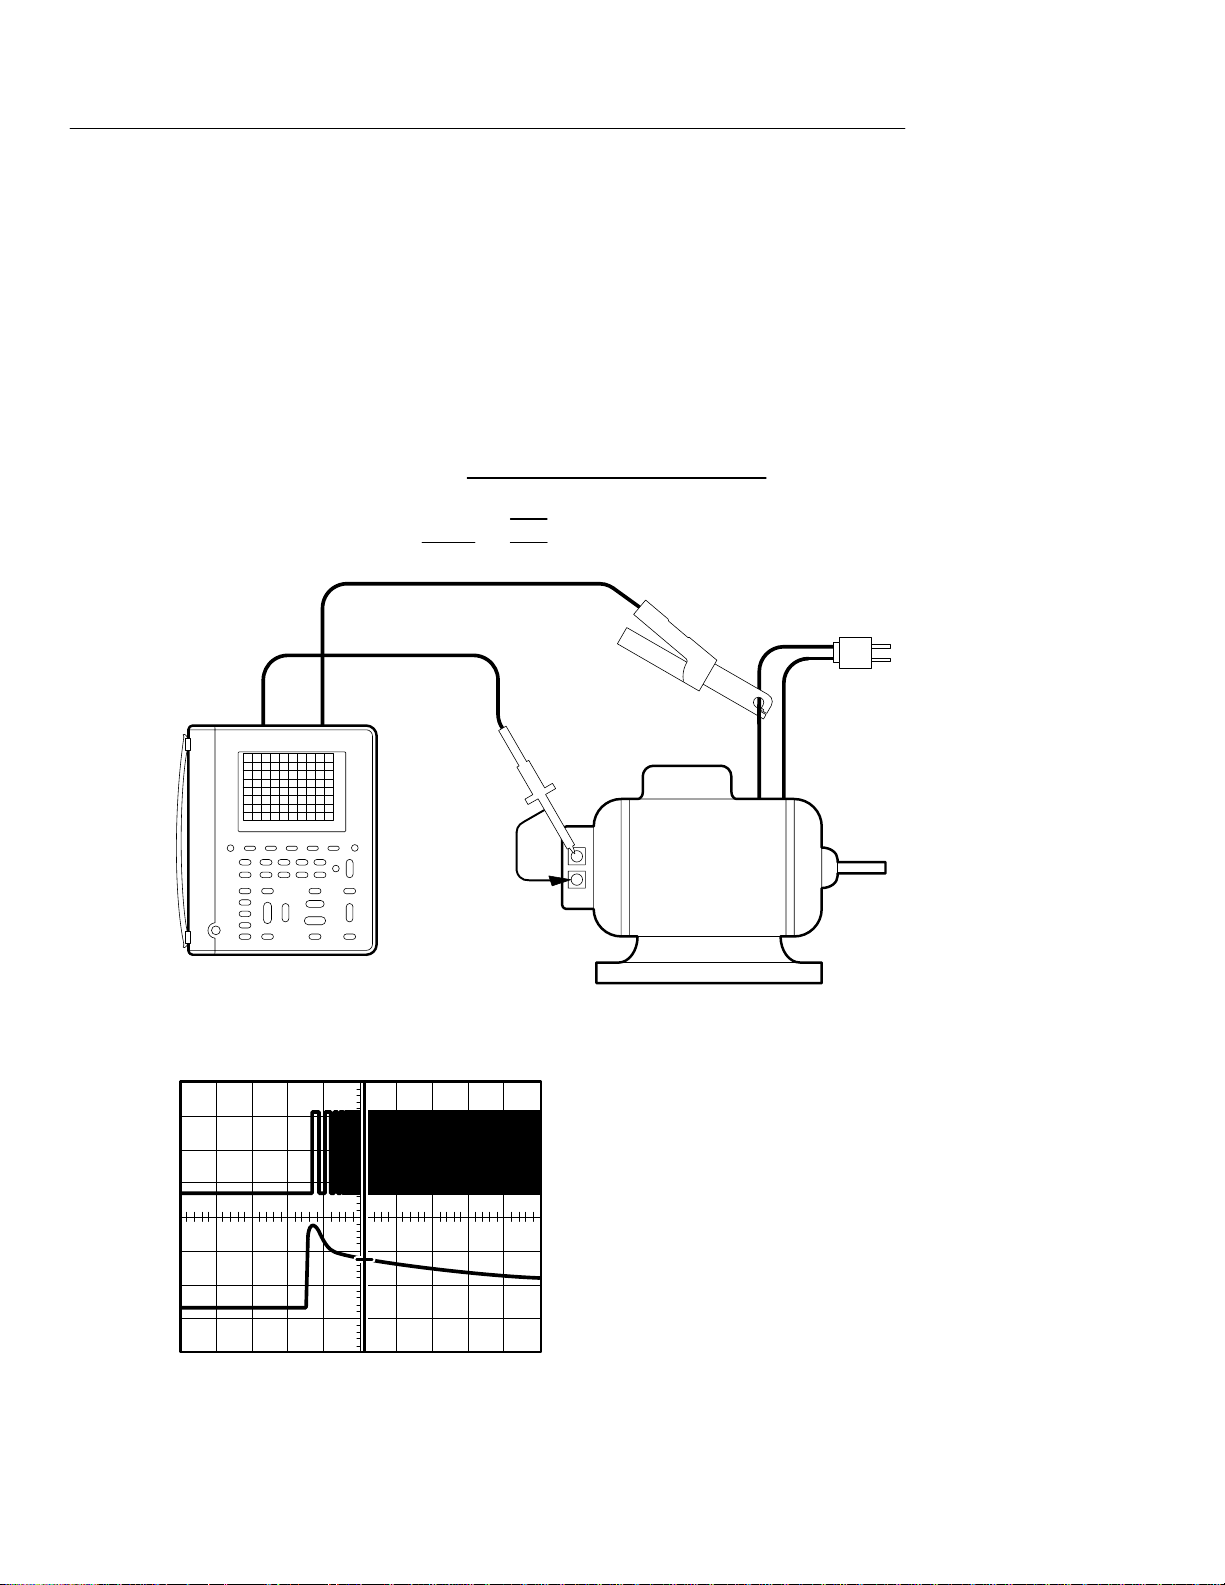
Triggering at a Specific Motor RPM
You need to measure the start-up current of a 3600-RPM motor at
several specific speeds. A tachometer, attached to the motor ,
outputs a low-voltage square wave with 100 pulses per revolution.
Set up the TekScope instrument to trigger at 1200 RPM so you can
measure the current at that speed.
Tachometer output frequency
Tachometer pulse width
Ch 1 Ch 2
period
2
1200 revmin 100 pulsesrev
60 smin
1
2 kHz
250 s
2
100 mV/A
Electric motor with
attached tachometer
2 kHz
2–30
@: 12.8 A
Tachometer signal (Ch 1)
Motor current (Ch 2)
THS 710 & THS 720 User Manual
Page 56

Setup to Trigger at 1200 RPM
—
Application Examples
SCOPE
CH 1 — — —
CH 2 Probe Type Current
Probe
HORIZONTAL MENU
TRIGGER
MENU
CURSOR Function Paired Set cursor to
Trigger
Position
Type Pulse
Source Ch1
Polarity and
Width
Trigger When Equal To
Mode Normal —
50%
Positive Set width to
Width
Set to
100 mV/A
250 s
Set ±5%
horizontal
center of
graticule
Set appropriate VOLTS/DIV for each channel. Set SEC/DIV so that
the sweep duration is approximately equal to the motor start-up time.
When the motor starts, the 1200 RPM point is displayed at the center
of the graticule. Use the cursor on channel 2 to measure the armature
current at this point.
Going Further
Change the trigger pulse width setting to trigger at other specific
motor RPMs to complete the test.
THS 710 & THS 720 User Manual
2–31
Page 57

Application Examples
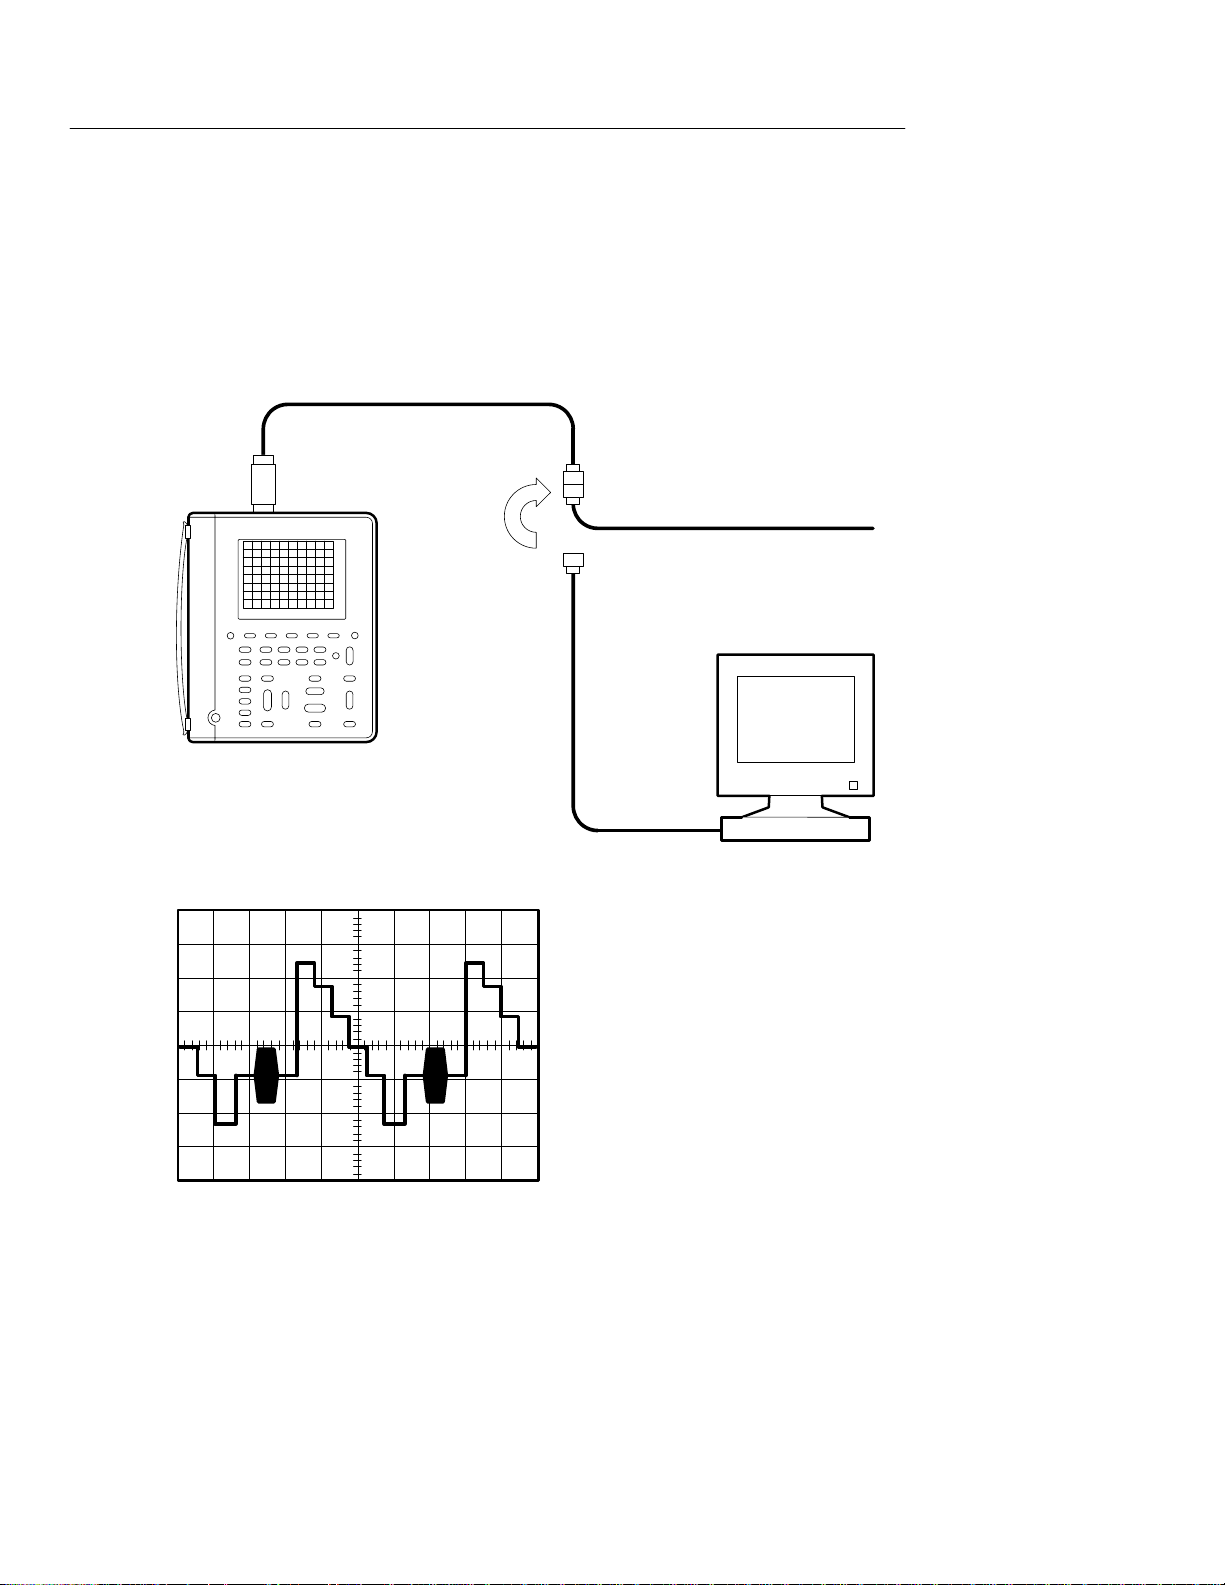
Using the Oscilloscope and DMM at the Same Time
You need to evaluate a VCO (voltage-controlled oscillator) circuit.
You want to produce a graph of the output frequency as a function of
the input control voltage. Set up the TekScope instrument to provide
you with data for your graph.
Ch 1
3.584 VDC
Ch1
Freq
26.76 MHz
VCO
circuit
OutputInput
2–32
THS 710 & THS 720 User Manual
Page 58

Setup to Use DMM and Oscilloscope Together
—
—
Application Examples
METER AUTO
RANGE
SCOPE
AUTO
RANGE
MEAS
VDC
—
Select
Measmnt for
CH1
OK Select
Measrmnt
Frequency
—
You can use the DMM to measure the VCO control voltage and the
oscilloscope to measure the output frequency at the same time.
In scope mode, the meter readout is in the upper right corner of the
display. The frequency measurement is at the right side of the
graticule. Both measurements update continuously as you adjust the
VCO control voltage.
Going Further
You may find simultaneous DMM and oscilloscope operation useful
in additional ways:
H To monitor changes in circuit operation as you adjust the power
supply voltage
H To monitor the output amplitude of an optical transmitter or
detector as you adjust its bias voltage
THS 710 & THS 720 User Manual
2–33
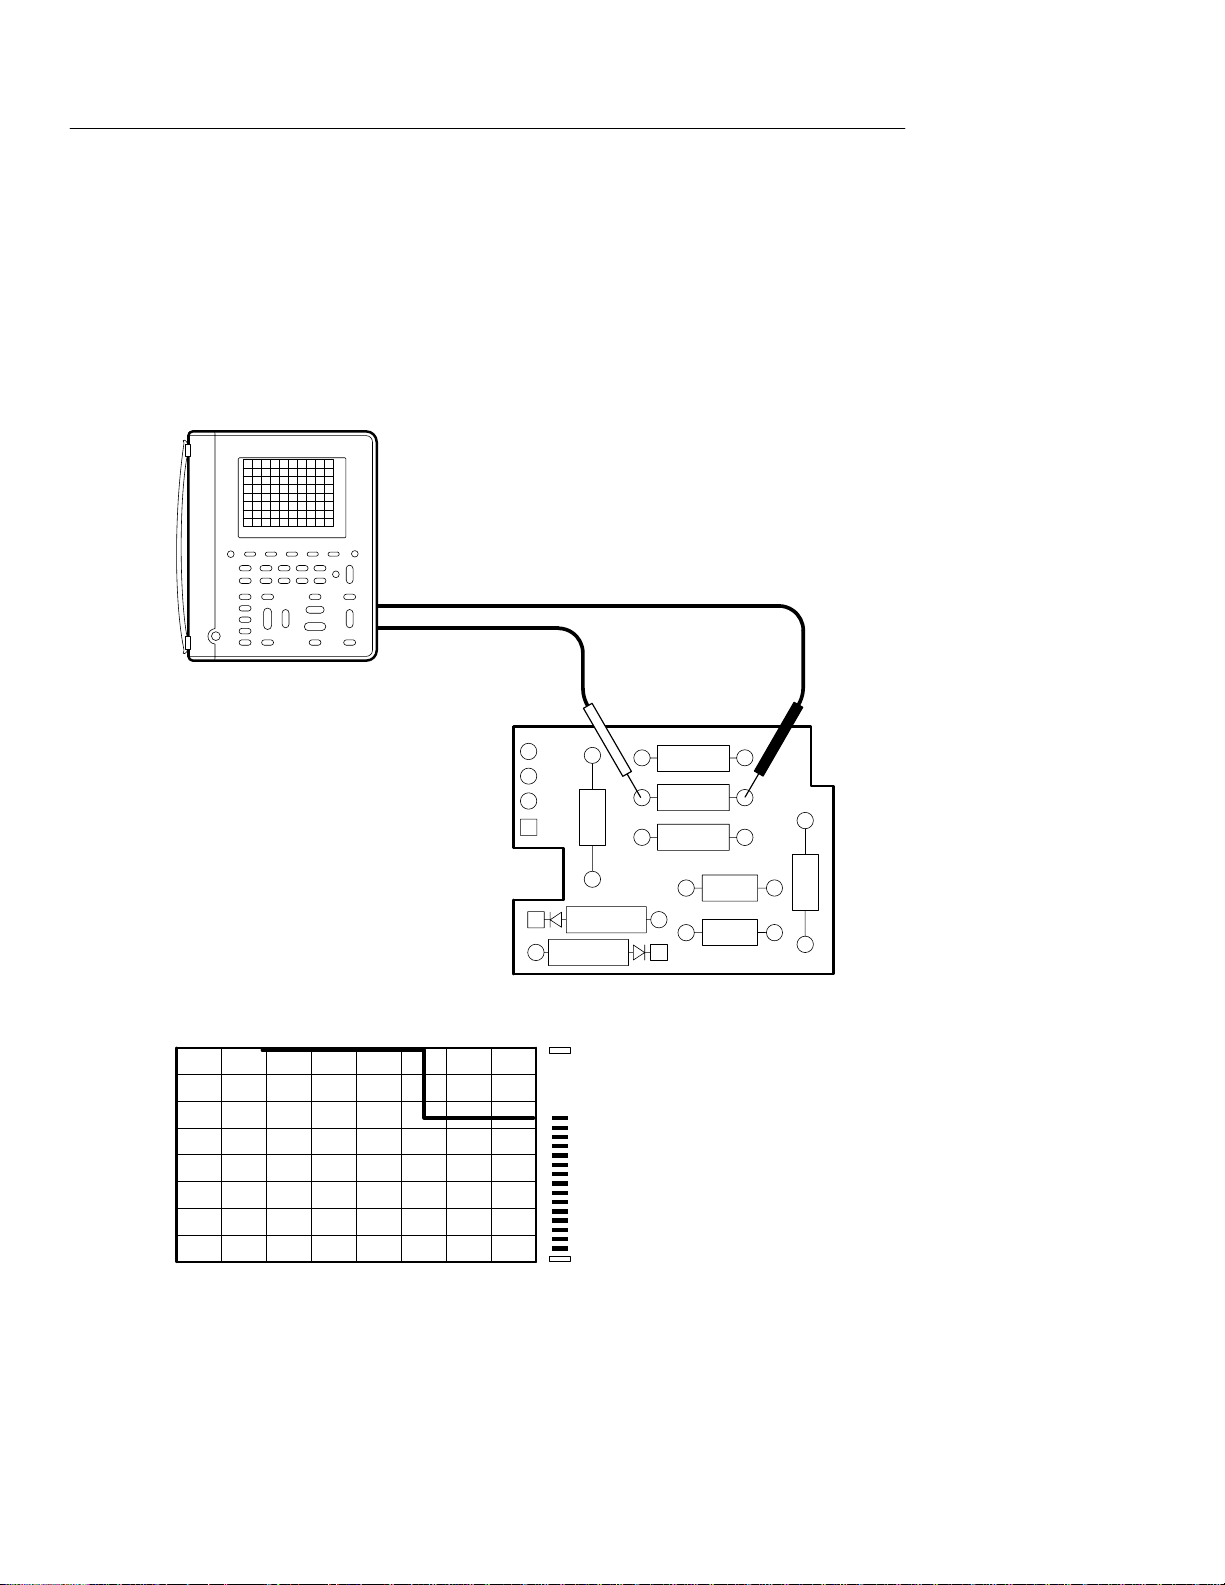
Page 59

Application Examples
Monitoring for Power Surges and Dropouts
You are having intermittent problems with some electronic
equipment that operates unattended at a remote site. You need to
determine if the problem might be caused by momentary power
quality problems in the electrical service to the equipment. Set up the
TekScope instrument to monitor the line voltage for a week and
capture any surges or dropouts that may occur.
Remote site
2–34
8 days
THS 710 & THS 720 User Manual
Page 60

Setup to Monitor for Power Quality Problems
—
Application Examples
METER
— VAC —
ACQUIRE Mode Peak Detect
You can use the DMM data logger to record measurements over an
extended period of time. Set the full-scale range to 400 V using the
VOLTS/DIV rocker. Adjust the SEC/DIV rocker so that the data
logger horizontal scale is one day per division.
Meter measurements, which occur at a rate of approximately ten per
second, are captured over an eight-day period of time.
Going Further
Use the cursors to determine when a power disturbance occurred (to
within the nearest 24 minutes).
SCOPE CURSOR Function Vertical Set cursor
Move either cursor to the location of the power disturbance. Read the
relative time in the cursor readout (for example, @ 52 h). Calculate
the absolute time and date of the disturbance using the current time
and this measurement.
THS 710 & THS 720 User Manual
2–35
Page 61

Application Examples
Triggering on a Video Field
The image quality is poor on a video monitor in a closed-circuit
security system that operates at a 15 kHz scan rate. Set up the
TekScope instrument to display and trigger on field 1 of the video
waveform coming into the monitor .
75 terminator
Ch 1
Incoming video signal
2–36
THS 710 & THS 720 User Manual
Page 62

Setup to Trigger on Field 1
—
Application Examples
SCOPE
VERTICAL
MENU
AUTO
RANGE
DISPLAY Style Dot
TRIGGER
MENU
Probe Type Voltage Probe Set to 1X
— — —
Accumulate
Type Video
Trigger On Field 1
Scan Rate — Set to
Set to 100 ms
15-20 kHz
Adjust the SEC/DIV rocker to 2 ms/div to display field 1 across
about eight divisions. The Dot Accumulate display style simulates an
analog oscilloscope display of the video signal.
Going Further
If you are testing a higher resolution video system, you can trigger
on video signals with scan rates up to 65 kHz.
THS 710 & THS 720 User Manual
2–37
Page 63
Application Examples
Triggering on a Video Line
Now you want to see one line of the staircase test pattern. Set up the
TekScope instrument to display and trigger on a video line.
75 terminator
Ch 1
Incoming video signal
2–38
THS 710 & THS 720 User Manual
Page 64
Setup to Trigger on a Video Line
—
Application Examples
SCOPE
VERTICAL
MENU
AUTO
RANGE
ACQUIRE Mode Peak Detect
TRIGGER
MENU
Probe Type Voltage Probe Set to 1X
— —
Type Video
Trigger On Lines
Adjust the SEC/DIV rocker to 10 s/div to display the lines across
about six divisions.
Going Further
If you need to display a specific video line, use the following
method:
1. Trigger on the video field that contains the line you want to
display (see the Triggering on a Video Field application
example).
2. Display the delayed time base. Set the delay time value to the
time from the start of the field to the start of the line of interest.
Refer to page 3–22 for information about using the delayed time
base.
3. Adjust the delayed time base SEC/DIV to display the video line
of interest.
THS 710 & THS 720 User Manual
2–39
Page 65

Application Examples
2–40
THS 710 & THS 720 User Manual
Page 66

Reference
Page 67

Page 68

Introduction to Reference
This chapter contains detailed information about the operation of
the THS 710 and THS 720 TekScope instruments. The topi cs in
this cha pter are arranged alphabetically by button name.
Reference Topic
Acquire 3–3
Autorange 3–8
Cursor 3–11
Display 3–13
Hard copy 3–17
Hold 3–19
Horizontal controls 3–20
Measure 3–24
Meter mode 3–31
Save/Recall 3–37
Scope mode 3–40
Trigger controls 3–46
Utility 3–53
Page
Vertical controls 3–59
THS 710 & THS 720 User Manual
3–1
Page 69

Introduction to Reference
3–2
THS 710 & THS 720 User Manual
Page 70
ACQUIRE
ACQUI
Press the ACQUIRE button to set acquisition parameters independently for scope mode and meter mode.
Acquire Menu in Scope Mode
ACQUIRE
SCOPE
RE
Mode Sample
Peak Detect
Envelope
Average
Stop After HOLD Button Only
Single Acquisition
Sequence
Force Trigger —
Key Points
Acquisition Modes. You can choose one of four acquisition modes:
Sample, Peak Detect, Envelope, or Average. The next two pages
describe these acquisition modes in detail.
THS 710 & THS 720 User Manual
3–3
Page 71

ACQUIRE
Samples acquired in four
acquisition intervals
Interval 1 2 3 4 Interval 1 2 3 4
Sample mode acquires one sample in each interval.
Peak Detect mode uses the lowest and highest samples from two consecutive intervals.
Acquisition
mode
Sample
Peak Detect
Displayed record
points
Sample. Use Sample acquisition mode for the fastest acquisition at
any SEC/DIV setting. Sample mode is the default mode.
Peak Detect. Use Peak Detect acquisition mode to limit the possibility
of aliasing. Also, use Peak Detect for glitch detection. You can see
glitches as narrow as a 8 ns.
Peak Detect is only functional at SEC/DIV settings of 1 ms/div or
slower. For SEC/DIV settings of 500 ns/div or faster, the TekScope
instrument switches to Sample acquisition mode automatically .
3–4
THS 710 & THS 720 User Manual
Page 72

Three acquisitions from one source Acquisition mode
Acquisition 1 2 3
ACQUIRE
Envelope
Envelope uses Peak Detect mode
for each individual acquisition.
Average uses Sample mode for
each individual acquisition.
Finds highest and
lowest record points over
many acquisitions
Average
Calculates average value
for each record point over
many acquisitions
Envelope and Average. Use Envelope acquisition mode to capture
variations of a signal over a longer period of time. Use Average
acquisition mode to reduce random or uncorrelated noise in the
signal you want to display.
+
The
/– rocker sets a specific number of acquisitions (N) to include
in the enveloped or averaged waveform.
H The enveloped waveform clears and then starts over after
N acquisitions.
H The averaged waveform is a running average over N acquisitions.
H If you select Stop After Single Acquisition Sequence, an
envelope or average acquisition stops after N acquisitions.
THS 710 & THS 720 User Manual
3–5
Page 73
ACQUIRE
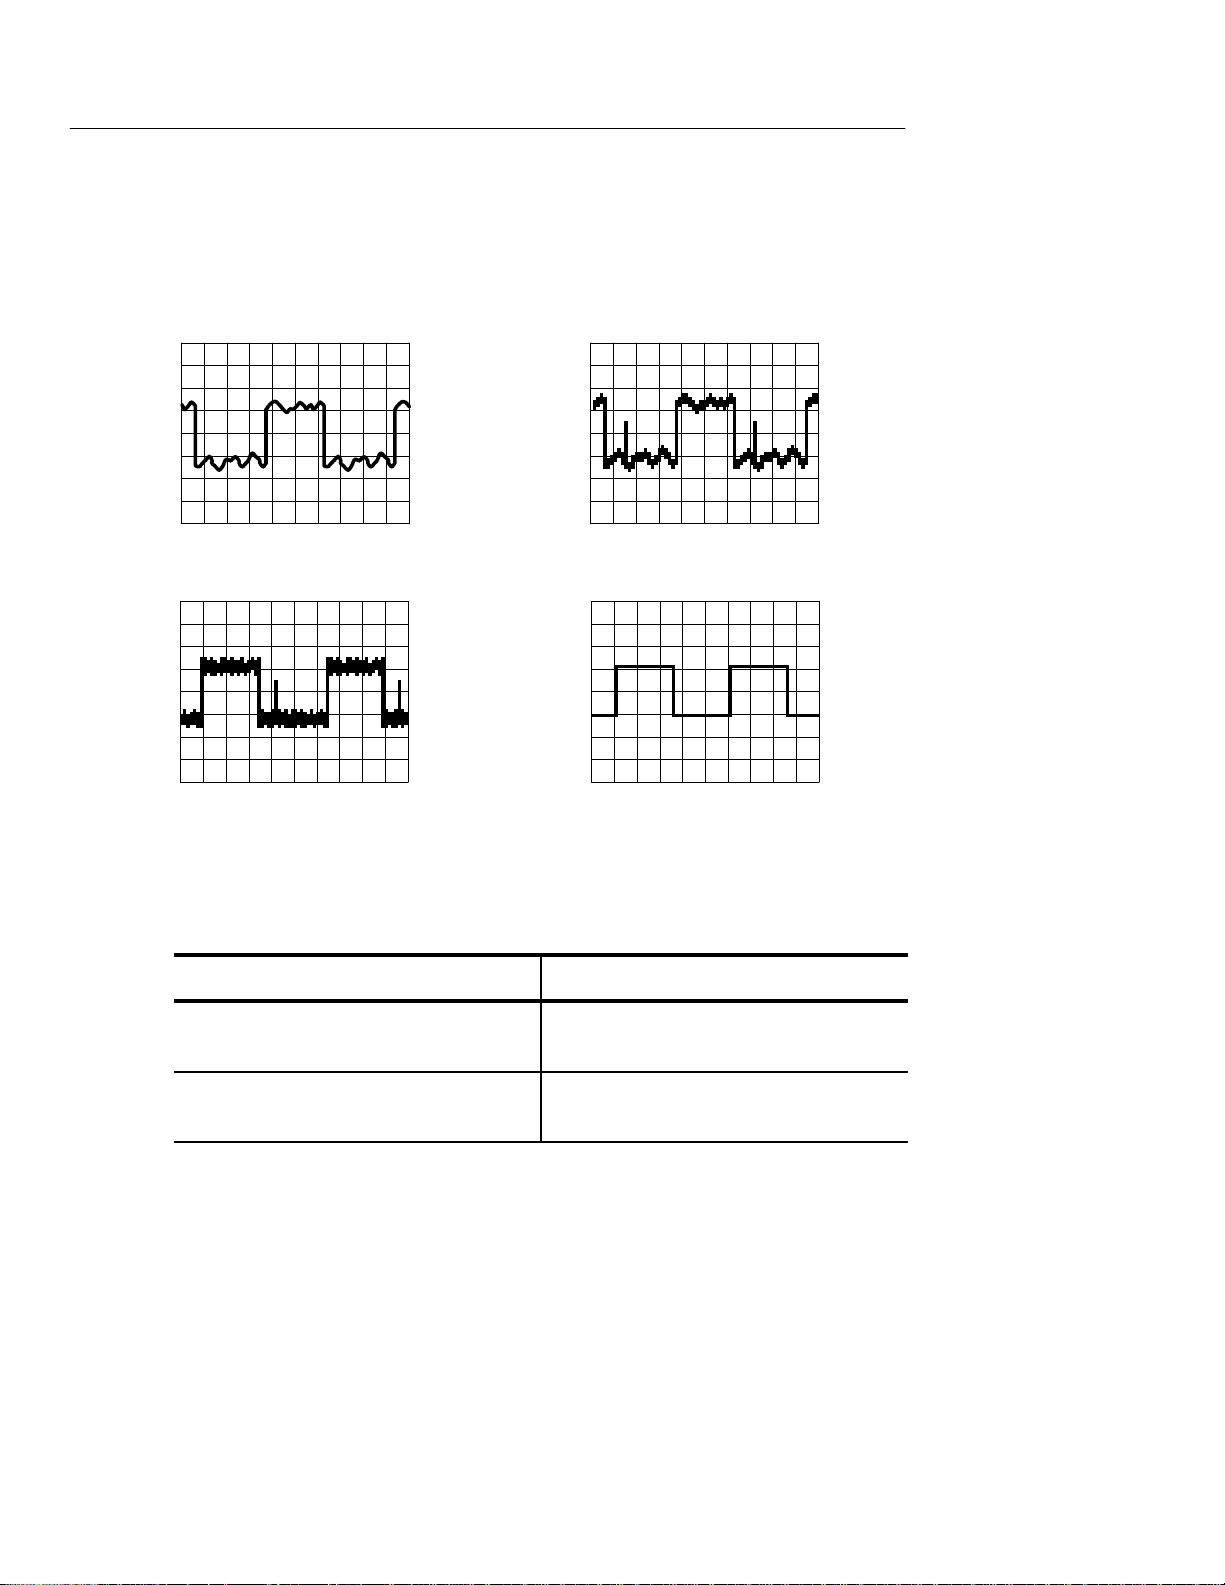
If you probe a noisy square wave signal that contains intermittent,
narrow glitches, the waveform displayed will vary depending on the
acquisition mode you choose.
Sample Peak Detect
Envelope Average
Single Acquisition Sequence. The content of a single acquisition
sequence depends on the acquisition mode.
Acquisition Mode
Sample or Peak Detect One acquisition of each displayed
Envelope or Average N acquisitions of each displayed
Single Acquisition Sequence
channel
channel (N is user adjustable)
3–6
THS 710 & THS 720 User Manual
Page 74

Acquire Menu in Meter Mode
ACQUI
ACQUIRE
METER
RE
Mode Sample
Peak Detect
Average
Rel D On (Reset D)
Off
Key Points
Acquisition Modes. The data logger compresses a sequence of meter
measurements into a point and then plots a series of those points to
form a graph. The acquisition mode determines how the graph is
calculated:
H For each point, Sample displays the first meter measurement
from the sequence.
H Peak Detect displays a column representing the maximum and
minimum meter measurements during the sequence.
H Average displays the average of all meter measurements during
the sequence.
Rel D Measurements. Rel D acquires a new baseline value for
subsequent DMM measurements. Use Rel D to store the current
DMM value and then measure the relative change from that value.
When you turn off Rel D, the baseline value resets to zero.
THS 710 & THS 720 User Manual
3–7
Page 75

AUTORANGE
AUTORANGE
Autorange automatically adjusts setup values to track a signal. If the
signal changes, the setup continues to change to track the signal.
Autorange works independently in scope and meter modes.
The following controls are preset when you first select the autorange
function.
Scope Mode
Acquire mode: Sample
Stop acquire after: HOLD button only
Vertical coupling: DC (if GND was
selected)
Bandwidth: Full
Invert: Off
Horizontal position: Centered
Horizontal magnification: Off
Trigger type: Edge
Trigger source: Lowest numbered
channel displayed
Trigger coupling: DC
Trigger slope: Positive
Meter Mode
none
3–8
Trigger holdoff: Minimum
Display style: Vectors
Display format: YT
THS 710 & THS 720 User Manual
Page 76

These conditions start an autorange cycle.
D
ceeds
600 counts
ste
AUTORANGE
Scope Mode
Too many or too few waveform
periods for a clear display of the
lower-numbered channel
Waveform amplitude too large or too
small compared to full screen if only
one channel is displayed
Waveform amplitude too large or too
small compared to half screen if two
channels are displayed
Autorange adjusts these controls.
Scope Mode
Vertical VOLTS/DIV adjusted
Horizontal SEC/DIV adjusted
Meter Mode
MM reading ex
or falls below ±330 counts
±3
Meter Mode
Range adju
d
Trigger level set to 50%
THS 710 & THS 720 User Manual
3–9
Page 77

AUTORANGE
These control changes turn off autorange.
Scope Mode
Change to Stop After Single Acquisition Sequence
Change VOLTS/DIV
Change SEC/DIV
Change trigger type
Change trigger level
Change trigger coupling
Change trigger holdoff
Change display format to XY
Change display style
Meter Mode
Change range (VOLTS/DIV)
3–10
THS 710 & THS 720 User Manual
Page 78

CURSOR
Press the CURSOR button to display the cursor menu. In scope
mode, cursors operate on the 2500-point record of the selected
waveform. In meter mode, they operate on the 250-point data
logger plot.
CURSOR
SCOPE CURSOR
METER CURSOR Function Off
Function Of f
H Bars
V Bars
Paired
Time Units Seconds
1/seconds (Hz)
H Bars
V Bars
Paired
Key Points
Cursor Movement. Use the
the TOGGLE button to change which cursor is active.
Fine Cursor Movement. If you first press MAG, you can set a cursor to
any point in the 2500-point oscilloscope waveform.
+
/– rocker to move the active cursor. Press
THS 710 & THS 720 User Manual
3–1 1
Page 79

CURSOR
Cursor Functions. H Bars measure voltage. V Bars measure time
or frequency. Paired measures both voltage and time or voltage
and frequency .
D 4.16 V
@ –1.78 V
Horizontal Bar cursors
D 6.12 ms
@ 1.06 ms
Vertical Bar cursors
D 6.32 V
D 5.86 ms
@ 3.16 V
Paired cursors
@ Readout. For V Bar cursors, the readout after the @ symbol
indicates the location of the active cursor relative to the trigger point.
For H Bars or Paired cursors, it indicates the location relative to
zero volts.
3–12
THS 710 & THS 720 User Manual
Page 80

DISPLAY
DISPLAY
le
—
Press the DISPLAY button to choose how waveforms are presented
and to change the appearance of the display.
Display Menu in Scope Mode
DISPLAY
SCOPE
Sty
Display Contrast — Set contrast
Display iTi
Trig Pt
Graticule Full
Format YT
Vectors
Dots
Vector Accumulate
Dot Accumulate
On
Off
Grid
Cross Hair
Frame
XY
—
Set accumulate time
THS 710 & THS 720 User Manual
3–13
Page 81

DISPLAY
Key Points
Display Style. Choose one of the following waveform display styles:
H Vectors fills the space between adjacent sample points in
the display. Widely spaced points are filled using (sin x)/x
interpolation.
H Dots displays only the individual sample points.
H Vector Accumulate adds persistence to the vector display. Use
+
the
/– rocker to set the accumulate time.
H Dot Accumulate adds persistence to the dot display. Use the
+
/– rocker to set the accumulate time.
NOTE. Vector Accumulate and Dot Accumulate are display functions
only. When you change most control settings, the accumulated data is
cleared. Accumulated waveforms cannot be saved.
Display iTi at Trig Pt. The trigger point on the waveform is marked
with the T symbol. The T symbol can be turned on or off.
XY Format. Choose XY display format when you want to display
channel 1 in the horizontal axis and channel 2 in the vertical axis.
The controls operate as follows:
H The channel 1 VOLTS/DIV and vertical POSITION controls now
set the horizontal scale and position.
H The channel 2 VOLTS/DIV and vertical POSITION controls
continue to set vertical scale and position.
H The SEC/DIV and horizontal POSITION controls affect the time
base and the portion of the waveform that is displayed.
3–14
THS 710 & THS 720 User Manual
Page 82

DISPLAY
NOTE. The above XY-display example shows the I-V characteristic of
a switching power MOSFET. The current waveform, displayed in the
vertical axis, is measured using a Tektronix A6302 current probe and
AM503B current-probe amplifier.
The following functions do not work in XY display format:
H Ref or Math waveforms
H Cursors
H Horizontal MAG
H Autorange (resets display format to YT)
THS 710 & THS 720 User Manual
3–15
Page 83

DISPLAY
DISPLAY
Display Menu in Meter Mode
METER
Style Thin
Thick
Display Contrast — Set contrast
Graticule Full
Grid
Cross Hair
Frame
—
—
Key Points
Data Logger Display Style. For better visibility , choose Thick for
a three-pixel-high data logger plot. The default (Thin) is one
pixel high.
3–16
THS 710 & THS 720 User Manual
Page 84

HARD COPY
You can print a hard copy of the display if a printer is connected and
properly configured. Press the HARD COPY button to start printing.
If you do not want menus to show, press CLEAR MENU before you
press HARD COPY. You cannot change instrument settings while the
hard copy is printing.
Connecting a Printer
Use the RS-232 cable to connect the printer to the RS-232 port on
the side of the TekScope instrument. The RS-232 accessory kit
includes an adapter for 9-pin RS-232 connectors.
H Refer to RS-232 System on page 3–55 for information about
setting the TekScope instrument for RS-232 communication with
your printer.
HARD COPY
H Refer to the user manual for your printer for information about
setting its baud rate and any other required parameters.
TekScope instrument
Printer
RS-232 cable
THS 710 & THS 720 User Manual
3–17
Page 85
HARD COPY
Y
Setting Up to Print
Perform the following steps to choose the printer and page layout:
SCOPE or UTILIT
METER
System Hard Copy
Layout Landscape
Portrait
Format three pages of
formats
Select Page —
OK Select Format —
The following printer and file formats are supported:
H BMP (Microsoft Windows file format)
H Deskjet (high resolution printer format)
H DPU 411/II, HC 411 (thermal printer format)
H DPU 412 (thermal printer format)
H EPS Image (encapsulated postscript image file format)
H Epson (9-pin and 24-pin dot matrix printer format)
3–18
H Interleaf .img (image object file format)
H Laserjet (laser printer format)
H PCX (PC Paintbrush monochrome image file format)
H Thinkjet (inkjet printer format)
H TIFF (tag image file format)
THS 710 & THS 720 User Manual
Page 86

HOLD
HOLD
Press the HOLD (RUN/STOP) button to stop and start data
acquisition. Because scope mode and meter mode have independent
acquisition states, the HOLD button operates independently for these
two modes.
Hold Function in Scope Mode
In scope mode, the function of the HOLD button depends on the Stop
After selection in the acquire menu.
Acquire Menu Setting
Stop After HOLD Button Only First press stops waveform acquisi-
Stop After Single Acquisition
Sequence
Functions of HOLD Button
tion.
Second press restarts waveform
acquisition.
Any press starts a new acquisition
sequence. The acquisition sequence
stops automatically.
Hold Function in Meter Mode
In meter mode, pressing the HOLD button once freezes the meter
reading, the measurement statistics (MIN, MAX, and AVG), and the
data logger display.
A second press of the HOLD button resets and restarts the data
logger display and measurement statistics, and then restarts the
meter readings.
THS 710 & THS 720 User Manual
3–19
Page 87

HORIZONTAL Controls
IZON
ime Base
Positio
HORIZONTAL Controls
You can use the horizontal controls to change the time base,
horizontal position, and horizontal magnification of waveforms.
Horizontal Operations in Scope Mode
SCOPE HOR
TAL MENU
-
T
Trigger
n
Main —
Delayed Runs
After Main
Set to 10%
Set to 50%
Set to 90%
% Pretrigger Set %
Set delay time
—
3–20
THS 710 & THS 720 User Manual
Page 88

HORIZONTAL Controls
Key Points
SEC/DIV Rocker. If waveform acquisition is stopped (using the HOLD
button), changes you make to the time base have no effect until you
restart acquisition.
Roll Mode Display. To obtain a rolling display similar to a strip-chart
recorder, select Auto trigger mode and set SEC/DIV to 500 ms/div or
slower.
POSITION Rocker. Y ou can position each of the two reference
waveforms (Ref A and Ref B) independently of the three live
waveforms (Ch 1, Ch 2, and Math). Or you can set the horizontal
position of all waveforms track each other. Refer to Ref A or Ref B
Vertical Menu on page 3–62 for information about this capability.
MAG Button. To switch between the normal and magnified displays,
press the MAG button.
H Normal display compresses the 2500-point waveform by a factor
of ten to form 250 horizontal points in the display.
H Magnified display expands the horizontal scale by a factor of ten
and displays one waveform point per pixel.
H Use the POSITION rocker to choose the section of the waveform
to magnify. The horizontal-position indicator shows you the
location of the magnified segment in the full waveform record.
MAG off MAG on
THS 710 & THS 720 User Manual
3–21
Page 89
HORIZONTAL Controls
Readout. The waveform readout shows the horizontal scale factor
below the graticule. Page 3–40 shows the location of this readout.
Time Base. Choose the Main or Delayed time base. The delayed time
base runs at the preset delay time after the trigger event for the main
time base. Use the
Main trigger
point
Main trigger
source
+
/– rocker to set the delay time.
Delayed
waveform record
Delay time
Trigger Position. Choose the amount of pretrigger:
H Set to 10% places the trigger point near the beginning of the
waveform record
H Set to 50% places the trigger point at the center of the waveform
record
H Set to 90% places the trigger point near the end of the waveform
record
H You can also set any amount of pretrigger (0% to 100%) with
+
the
/– rocker
3–22
THS 710 & THS 720 User Manual
Page 90

Horizontal Operations in Meter Mode
HORIZONTAL Controls
METER HORIZONTAL
MENU
— —
Key Points
SEC/DIV Rocker. To adjust the scroll speed of the data logger plot, use
the SEC/DIV rocker. If you change the scroll speed, data in the
logger display is erased.
Other Controls. The POSITION rocker and MAG button have no
effect in meter mode.
THS 710 & THS 720 User Manual
3–23
Page 91
MEAS
—
emove
—
MEAS
You can use the MEAS button to access the automatic measurement
capability of the TekScope instrument. In scope mode, the instrument
measures the 2500-point, selected waveform. In meter mode, the
measurements take the form of statistics, which are calculated from
successive meter readings.
Measurements in Scope Mode
SCOPE MEAS
Select
Meastmnt
Select Page —
R
Measrmnt
High-Low
Setup
OK Select
Measrmnt
OK Remove
Measrmnt
six pages of
measurements
Measrmnt Choose mea-
surement
All Measrmnts
Histogram
Min-Max
—
Key Points
Choosing Measurements. You can perform up to four automatic
measurements on the selected waveform and display them along
the right side of the graticule. The table beginning on page 3–26
describes the scope-mode measurements in detail.
3–24
THS 710 & THS 720 User Manual
Page 92

MEAS
High-Low Setup. The T ekScope instrument determines the 10%, 50%,
or 90% levels of the selected waveform and then uses them to
calculate the measurements. You can choose the method used to
determine these levels:
H Histogram sets the values statistically; it finds the most common
value either above or below the midpoint (depending on whether
it is defining the high or low reference level). Since this statistical
approach ignores short-term aberrations (overshoot, ringing,
noise), histogram is the best method for measuring digital
waveforms and pulses.
H Min-max uses the highest and lowest values of the waveform
record. This method is best for measuring waveforms that have
no large, flat portions at a common value, such as sine waves and
triangle waves.
THS 710 & THS 720 User Manual
3–25
Page 93

MEAS
Scope-Mode Measurement Definitions
Name
Definition
Ampl Measured over the entire waveform.
Amplitude = High (100%) – Low (0%)
BrstW The duration of a burst. Measured over the entire waveform.
cMean The arithmetic mean over the first cycle in the waveform.
cRMS The true Root Mean Square voltage over the first cycle in
the waveform.
Fall Time that the falling edge of the first pulse in the waveform
takes to fall from 90% to 10% of its amplitude.
Freq Reciprocal of the period of the first cycle in the waveform.
Measured in Hertz (Hz).
High The value used as 100%. Calculated using either the
min/max or the histogram method. Measured over the entire
waveform.
3–26
Low The value used as 0%. Calculated using either the min/max
or the histogram method. Measured over the entire
waveform.
THS 710 & THS 720 User Manual
Page 94

Scope-Mode Measurement Definitions (Cont.)
Name Definition
Max The maximum amplitude. The most positive peak voltage
measured over the entire waveform.
Mean The arithmetic mean over the entire waveform.
Min The minimum amplitude. The most negative peak voltage
measured over the entire waveform.
–Duty Measurement of the first cycle in the waveform.
MEAS
Negative Duty Cycle
–Over Measured over the entire waveform.
Negative Overshoot
–Width Measurement of the first negative pulse in the waveform.
The time between the 50% amplitude points.
Pk–Pk Measured over the entire waveform.
Amplitude = Max – Min
Negative Width
Period
Low–Min
Amplitude
100%
100%
THS 710 & THS 720 User Manual
3–27
Page 95

MEAS
Scope-Mode Measurement Definitions (Cont.)
Name Definition
Period Time it takes for the first complete signal cycle to complete
in the waveform. Measured in seconds.
+Duty Measurement of the first cycle in the waveform.
Positive Duty Cycle
+Over Measured over the entire waveform.
Positive Overshoot
+Width Measurement of the first positive pulse in the waveform. The
time between the 50% amplitude points.
Positive Width
Period
Max–High
Amplitude
100%
100%
Rise Time that the leading edge of the first pulse in the waveform
takes to rise from 10% to 90% of its amplitude.
RMS The true Root Mean Square voltage over the entire
waveform.
3–28
THS 710 & THS 720 User Manual
Page 96

Measurements in Meter Mode
—
emove
tistic
—
MEAS
METER MEAS
Select Statistic
for DMM
Select Page —
R
Sta
Beep New
Max-Min
OK Select
Statistic
OK Remove
Statistic
Max
Avg
Min
Rel D
Max – Min
Statistic Choose statistic
All Statistics
On
Off
—
Key Points
Data Included in Statistics. The statistics are calculated over all meter
readings since the last reset. The statistics can represent data that is
no longer displayed in the data logger plot.
Readout. The statistic readouts appear in the upper-right corner of the
display. See page 3–31 for the location.
THS 710 & THS 720 User Manual
3–29
Page 97

MEAS
Choosing Statistics. Choose up to three from the following statistics.
Statistic
Max The maximum value of all meter readings since the last reset.
Avg The arithmetic average of all meter readings since the last
Min The minimum value of all meter readings since the last reset.
D0 The baseline value used in the RelD calculation. This value is
Max–Min The difference between the maximum and minimum meter
Reset Conditions. The calculated statistics are reset to zero if you
Definition
reset.
updated only when the RelD function is turned on or off.
readings since the last reset.
make any of the following control changes:
H Turn off the HOLD function
H Change the measurement function (from VAC to VDC, for
example)
H Change the probe scale factor
H Change the RelD value
H Change the data logger scroll speed
Beep New Max/Min. You can turn on a beep that sounds any time the
TekScope instrument updates the Max or Min statistic.
3–30
THS 710 & THS 720 User Manual
Page 98

METER Mode
Press the METER button to enter meter mode. The meter reading
and statistics update about three times per second.
METER Mode
METER METER
VAC —
VDC —
(continuity)
(diode)
—
—
—
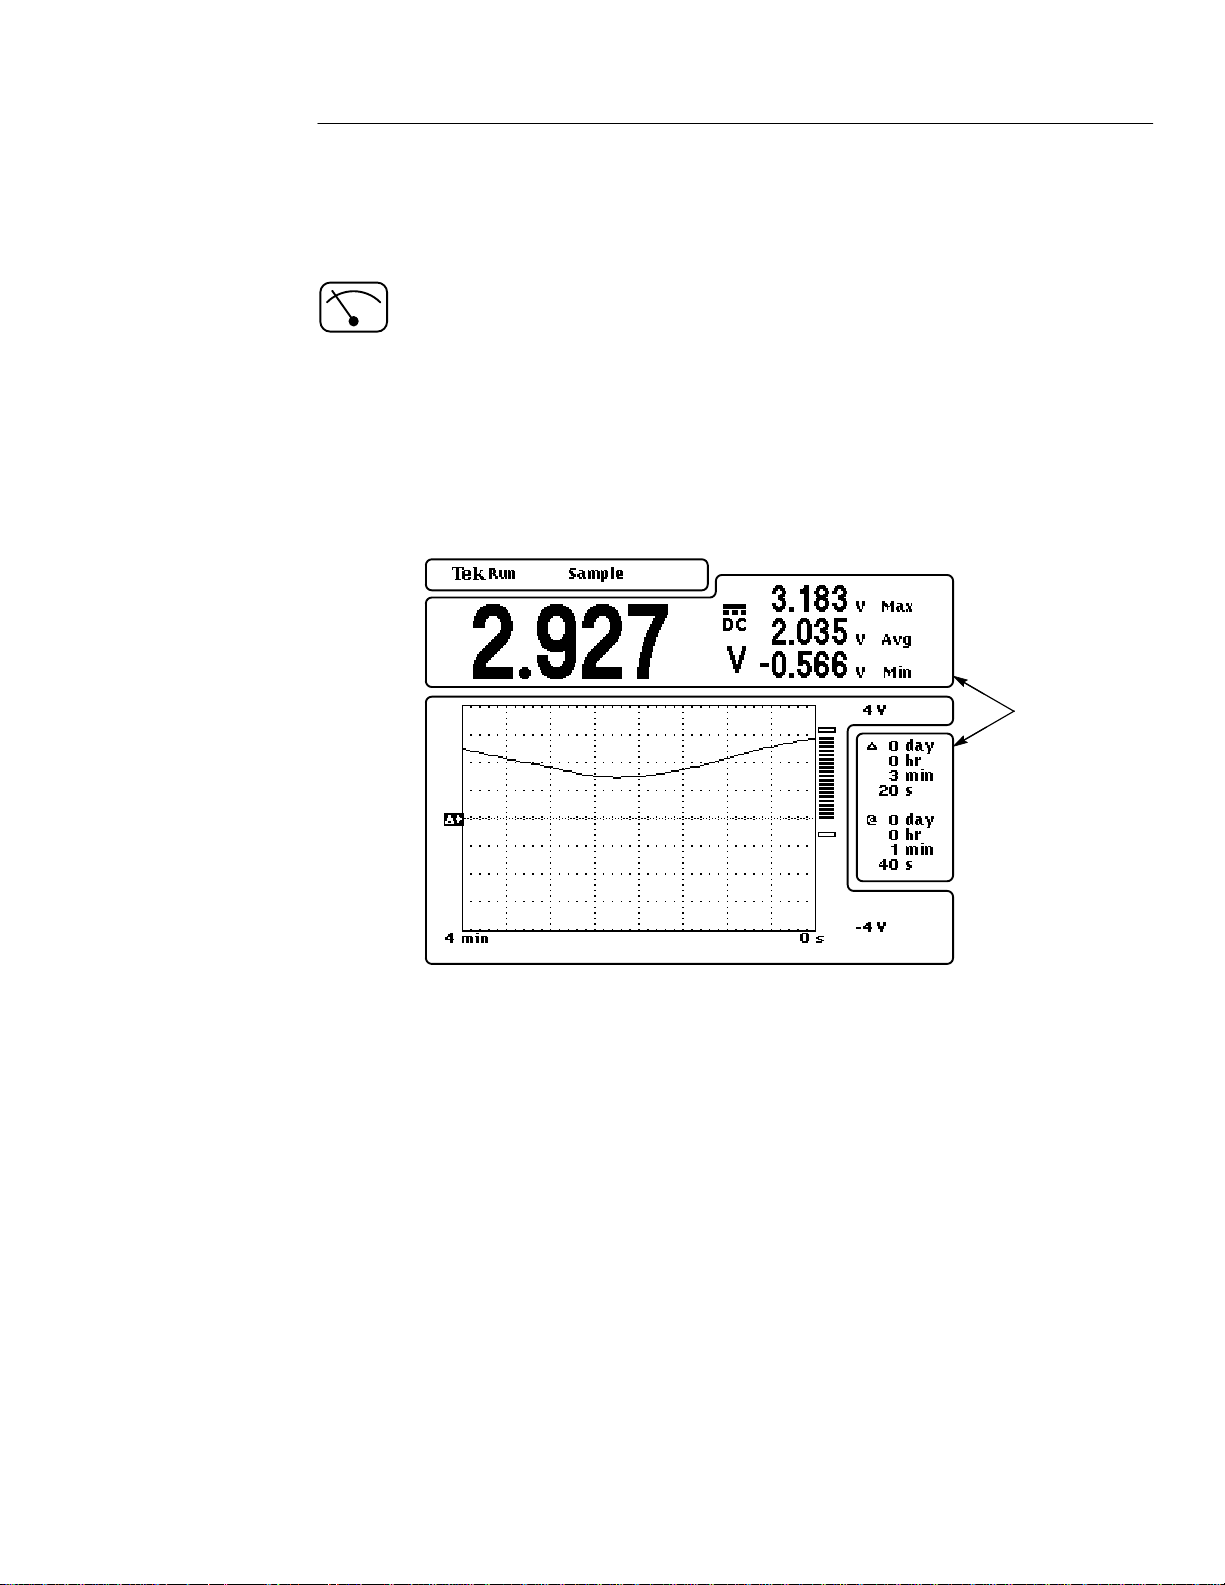
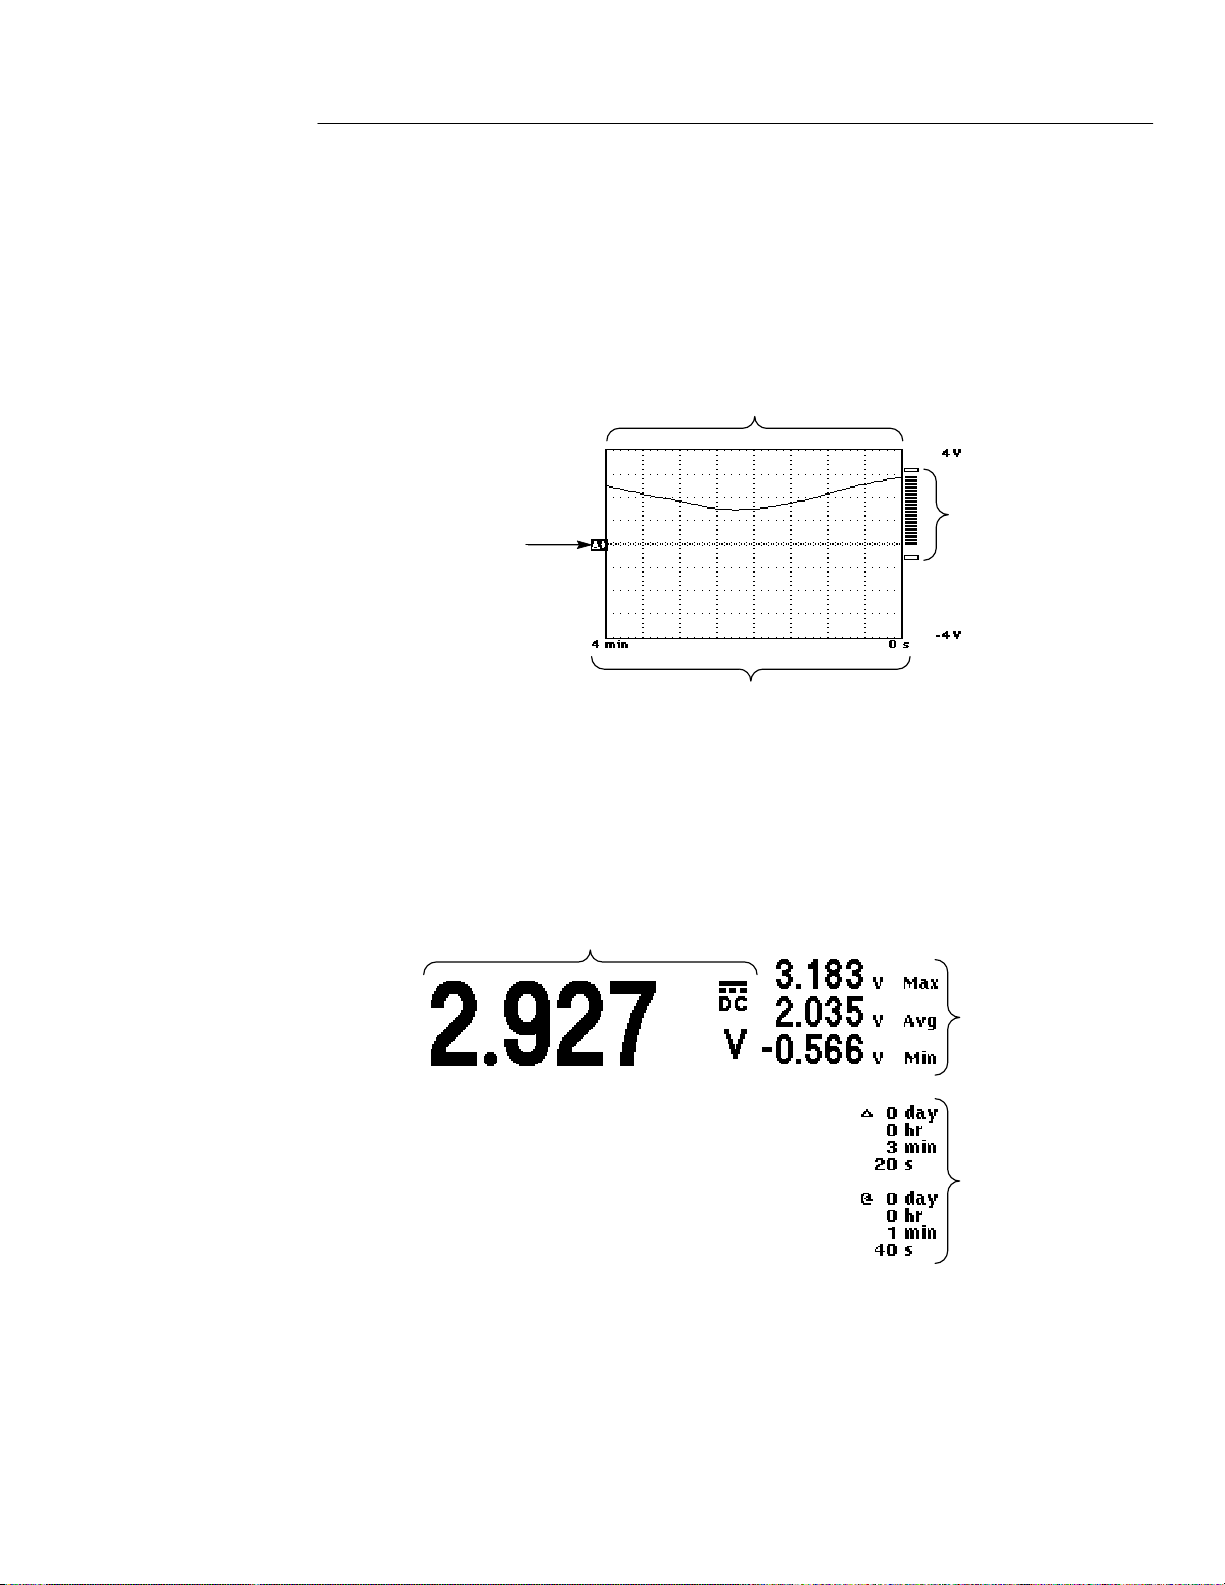
The meter-mode display, shown below, is divided into three sections.
The next two pages identify the content of each section in detail.
Status line
Measurement
readout areas
Graticule area
THS 710 & THS 720 User Manual
3–31
Page 99

METER Mode
Acquisition r
tor
ction o
O
isition is stoppe
Status Line
The status line across the top of the display contains acquisition
information. The overrange indicator warns when an overvoltage is
applied to the input.
The table below shows examples of the acquisition readout.
Acquisition
Readout
Acquisition readout Overrange indicator
Explanation
unning with au
RANGE) or off (Run), or acqu
Saved data is recalled for display (from location 7)
while acquisition runs in the background
Acquisition mode for data logger
ange fun
n (AUT
d (Hold)
3–32
THS 710 & THS 720 User Manual
Page 100
METER Mode
Graticule Area
The graticule area contains the data logger plot, the bar graph, and
their scale markers.
Data logger plot
Upper vertical
scale marker
Reference
level
Horizontal scale markers
Bar graph
Lower vertical
scale marker
Measurement Readout Area
The area above and to the right of the graticule contains the current
meter reading, statistic readouts, and cursor readouts.
Current meter reading
Statistic
readouts
THS 710 & THS 720 User Manual
Cursor
readouts
3–33
 Loading...