

Page 1

TekScope Anywhere™ Waveform Analysis
Application Help
*P077110900*
077-1109-00
Page 2

Page 3

TekScope Anywhere™ Waveform Analysis
Application Help
Supports TekScope Anywhere
www.tektronix.com
077-1109-00
™
Product Firmware V1.0 and above
Page 4

Copyright © Tektronix. All rights reserved. Licensed software products are owned by Tektronix or its subsidiaries
or suppliers, and are protected by national copyright laws and international treaty provisions. Tektronix products
are covered by U.S. and foreign patents, issued and pending. Information in this publication supersedes that in all
previously published material. Specifications and price change privileges reserved.
TEKTRONIX and TEK are registered trademarks of Tektronix, Inc.
TekScope Anywhere is a trademark of Tektronix, Inc.
Contacting Tektronix
Tektronix, Inc.
14150 SW Karl Braun Drive
P.O. Box 500
Beaverton, OR 97077
USA
For product information, sales, service, and technical support:
■
In North America, call 1-800-833-9200.
■
Worldwide, visit www.tektronix.com to find contacts in your area.
Page 5

Table of Contents
Welcome ............................................................................................................................................. ix
About TekScope Anywhere
Product description ......................................................................................................................... 1
Product software ............................................................................................................................. 2
About ......................................................................................................................................... 2
TekScope Anywhere options .................................................................................................... 3
How to purchase options (license) .................................................................................................. 4
How to Install options (license) ...................................................................................................... 4
How to move an option to a different host ..................................................................................... 7
Compatibility .................................................................................................................................. 9
Measurement differences between TekScope Anywhere and Oscilloscope ............................. 9
Session recall limitations from Oscilloscope to TekScope Anywhere .................................... 11
General notes ........................................................................................................................... 11
Minimum system configuration .................................................................................................... 12
How to Install/Uninstall Tekscope Anywhere .............................................................................. 13
Install Tekscope Anywhere ..................................................................................................... 13
Uninstall Tekscope Anywhere ................................................................................................ 14
Technical support ......................................................................................................................... 16
Customer feedback ....................................................................................................................... 16
Conventions .................................................................................................................................. 17
Related documentation ................................................................................................................. 17
Getting started with TekScope Anywhere
Waveform files ............................................................................................................................. 19
Opening files ................................................................................................................................. 20
Opening a reference waveform ............................................................................................... 20
Opening a setup ....................................................................................................................... 21
Opening a session .................................................................................................................... 21
Defining Math ............................................................................................................................... 22
Viewing waveforms ...................................................................................................................... 22
Stacked/Overlay mode ............................................................................................................ 24
Zoom view of the waveform ................................................................................................... 26
Placing cursors on a waveform ............................................................................................... 28
Making measurements .................................................................................................................. 29
Select a measurement .............................................................................................................. 29
TekScope Anywhere™ Help i
Page 6

Table of Contents
Configure the measurement ..................................................................................................... 31
View the results ....................................................................................................................... 31
Viewing plots ................................................................................................................................ 32
Plot window ............................................................................................................................. 34
Zoom view of plots .................................................................................................................. 37
Placing cursors on a plot ......................................................................................................... 38
Eye diagram ............................................................................................................................. 39
Operating basics
Overview of the application interface .......................................................................................... 41
Tabbed control bar ........................................................................................................................ 45
Main tab ................................................................................................................................... 45
File tab ..................................................................................................................................... 48
Measurement tab ..................................................................................................................... 49
Help tab ................................................................................................................................... 50
Minimize views ....................................................................................................................... 50
Display area (View window) ........................................................................................................ 51
Time domain view ................................................................................................................... 52
Plot view .................................................................................................................................. 54
Measurement library overview ..................................................................................................... 56
Global Settings Readout Bar (GSRB) .......................................................................................... 58
Add / Remove waveforms ....................................................................................................... 58
GSRB badges .......................................................................................................................... 59
Windows management - View window ........................................................................................ 60
Active and inactive views ........................................................................................................ 60
Arrange views .......................................................................................................................... 61
Grouped views ......................................................................................................................... 67
Undocking/Docking display screen ......................................................................................... 73
UI keypad ..................................................................................................................................... 76
Mouse scroll wheel ....................................................................................................................... 76
GSRB badge context menu
Add / Remove waveforms ............................................................................................................ 77
Ref badge context menu ............................................................................................................... 78
Math badge context menu ............................................................................................................. 80
Trend (Time trend) badge context menu ...................................................................................... 82
Date and Time Settings context menu .......................................................................................... 83
ii TekScope Anywhere™ Help
Page 7

Math
Table of Contents
Basic Math .................................................................................................................................... 85
SDLA ....................................................................................................................................... 85
ArbFlt ...................................................................................................................................... 87
Advanced Math ............................................................................................................................. 97
FFT Math .................................................................................................................................... 101
FFT process ........................................................................................................................... 103
FFT windows ......................................................................................................................... 103
Spectral analysis features ...................................................................................................... 105
Selecting a spectral window .................................................................................................. 105
Spectral analyzer window types ............................................................................................ 109
Scallop loss ............................................................................................................................ 112
Cursor setup
Turning Cursors On/Off ............................................................................................................. 113
Cursor types ................................................................................................................................ 114
Cursor lines and symbols ............................................................................................................ 115
Cursors context menu ................................................................................................................. 117
Measurements
Index of all measurements .......................................................................................................... 119
Amplitude category measurements ....................................................................................... 119
Time category measurements ................................................................................................ 121
Jitter category measurements ................................................................................................ 122
Eye category measurements .................................................................................................. 124
Source configuration ................................................................................................................... 125
Source configuration ............................................................................................................. 125
Ref Level ............................................................................................................................... 126
Preferences setup ........................................................................................................................ 131
Measurement configuration ........................................................................................................ 133
General .................................................................................................................................. 133
Global .................................................................................................................................... 134
Filters ..................................................................................................................................... 135
Bit config ............................................................................................................................... 141
Clock recovery ...................................................................................................................... 145
Edges ..................................................................................................................................... 161
RJDJ ...................................................................................................................................... 174
TekScope Anywhere™ Help iii
Page 8

Table of Contents
Bit error rate (BER) ............................................................................................................... 177
Spread spectrum clocking (SSC) ........................................................................................... 177
Configuration parameters for measurements ........................................................................ 178
View statistical results ................................................................................................................ 181
Save results ............................................................................................................................ 182
Plots
Plot usage .................................................................................................................................... 185
Configuring plots ........................................................................................................................ 188
Histogram plot configuration ................................................................................................ 188
Time trend plot configuration ................................................................................................ 189
Spectrum plot configuration .................................................................................................. 190
Eye diagram plot configuration ............................................................................................. 191
Bathtub plot configuration ..................................................................................................... 192
Saving plot data .......................................................................................................................... 193
Save plot data ........................................................................................................................ 193
Save plot images .................................................................................................................... 194
Plots available for each measurement ........................................................................................ 196
Save
Save a screen capture .................................................................................................................. 199
Save a waveform ........................................................................................................................ 200
Save the setup ............................................................................................................................. 202
Save the report ............................................................................................................................ 203
Save a session ............................................................................................................................. 205
File name extensions .................................................................................................................. 206
Report
Export a session from an oscilloscope
.................................................................................................................................................... 209
How to...
How to map the created filter file using SDLA signal input function to the TekScope Anywhere
.................................................................................................................................................... 213
iv TekScope Anywhere™ Help
Page 9

How to map the created filter file using SDLA Visualizer dual input function to the TekScope
Anywhere .............................................................................................................................. 215
Dual input differential - To look at differential signal .......................................................... 216
Dual input single ended - To look at A leg ........................................................................... 217
Dual input single ended - To look at B leg ............................................................................ 218
Dual input common - To look at common mode signal ........................................................ 220
How to validate the sample rate of a filter .................................................................................. 221
What if the sample rate of filter does not match the waveform ................................................. 221
How to create a filter using Math equation? ............................................................................... 221
Reference
Units of measurement ................................................................................................................. 225
Measurement algorithms
Table of Contents
About algorithms ........................................................................................................................ 227
Amplitude measurements ........................................................................................................... 227
Amplitude .............................................................................................................................. 227
Max ........................................................................................................................................ 227
Min ........................................................................................................................................ 227
High ....................................................................................................................................... 227
Low ........................................................................................................................................ 228
DC common mode ................................................................................................................. 228
AC common mode ................................................................................................................. 229
Positive Overshoot ................................................................................................................ 229
Negative overshoot ................................................................................................................ 229
Peak-to-peak .......................................................................................................................... 230
RMS ....................................................................................................................................... 230
AC RMS ................................................................................................................................ 232
Cycle RMS ............................................................................................................................ 232
Cycle overshoot ..................................................................................................................... 232
Cycle undershoot ................................................................................................................... 233
Mean ...................................................................................................................................... 233
Cycle mean ............................................................................................................................ 233
Cycle min .............................................................................................................................. 234
Cycle max .............................................................................................................................. 234
V-Diff-Xovr ........................................................................................................................... 234
Cycle Pk-Pk ........................................................................................................................... 235
T-nT ratio .............................................................................................................................. 235
TekScope Anywhere™ Help v
Page 10

Table of Contents
Bit high .................................................................................................................................. 237
Bit low ................................................................................................................................... 237
Bit amplitude ......................................................................................................................... 238
Timing measurements ................................................................................................................. 239
Period ..................................................................................................................................... 239
Frequency .............................................................................................................................. 240
Rise time ................................................................................................................................ 240
Fall time ................................................................................................................................. 241
Rise slew rate ......................................................................................................................... 241
Fall slew rate ......................................................................................................................... 242
High time ............................................................................................................................... 243
Low time ................................................................................................................................ 243
Positive and negative width ................................................................................................... 243
Setup ...................................................................................................................................... 244
Hold ....................................................................................................................................... 244
Skew ...................................................................................................................................... 245
N-Period ................................................................................................................................ 245
Positive and negative duty cycle ........................................................................................... 246
CC-Period .............................................................................................................................. 247
Positive and negative CC duty .............................................................................................. 247
SSC PROFILE ....................................................................................................................... 247
SSC FREQ DEV ................................................................................................................... 248
SSC FREQ DEV MIN ........................................................................................................... 248
SSC FREQ DEV MAX ......................................................................................................... 248
SSC MOD rate ....................................................................................................................... 249
Time outside level ................................................................................................................. 249
Jitter measurements .................................................................................................................... 250
TIE ......................................................................................................................................... 250
RJ ........................................................................................................................................... 251
Dual dirac random jitter ........................................................................................................ 251
Clock NPJ .............................................................................................................................. 251
TJ@BER ................................................................................................................................ 252
DJ ........................................................................................................................................... 252
Dual dirac deterministic jitter ................................................................................................ 253
PJ ........................................................................................................................................... 253
DDJ ........................................................................................................................................ 253
Jitter summary ....................................................................................................................... 253
DCD ....................................................................................................................................... 253
J2 ........................................................................................................................................... 254
vi TekScope Anywhere™ Help
Page 11

Table of Contents
J9 ........................................................................................................................................... 254
SRJ ......................................................................................................................................... 254
F-N ......................................................................................................................................... 254
Phase noise ............................................................................................................................ 256
Eye measurements ...................................................................................................................... 256
Eye width ............................................................................................................................... 256
Width@BER .......................................................................................................................... 256
Eye height .............................................................................................................................. 257
Height@BER ......................................................................................................................... 258
Eye high ................................................................................................................................. 258
Eye low .................................................................................................................................. 259
Q-factor ................................................................................................................................. 259
Jitter separation ........................................................................................................................... 260
Jitter analysis through RJ-DJ separation ............................................................................... 260
RJ-DJ separation via spectrum analysis ................................................................................ 261
RJ-DJ separation for arbitrary patterns ................................................................................. 261
Separation of Non-Periodic jitter (NPJ) ................................................................................ 262
Estimation of TJ@BER and eye Width@BER ..................................................................... 262
Jitter estimation using Dual-Dirac models ............................................................................ 263
Results ........................................................................................................................................ 264
TekScope Anywhere™ Help vii
Page 12

Table of Contents
viii TekScope Anywhere™ Help
Page 13
Welcome
TekScope Anywhere™ brings the power of the oscilloscope analysis environment
to the PC. Your workflow becomes more flexible because you can now perform
complex analysis tasks including timing, eye, and jitter analysis outside of the
lab. Waveform data and setups from Tektronix DPO/MSO5000B, DPO7000C, or
DPO/ MSO70000C/D/DX/SX Series oscilloscopes and waveform data from
DPO/MSO/MDO3000 and DPO/MSO/MDO4000 Series oscilloscopes can
quickly be shared among team members and remote sites, resulting in improved
efficiency.
TekScope Anywhere™ Help ix
Page 14

Welcome
x TekScope Anywhere™ Help
Page 15

About TekScope Anywhere
Product description
TekScope Anywhere™ brings the power of the oscilloscope analysis environment
to the PC. Your workflow becomes more flexible because you can now perform
complex analysis tasks including timing, eye, and jitter analysis outside of the
lab. Waveform data and setups from Tektronix DPO/MSO5000B, DPO7000C, or
DPO/ MSO70000C/D/DX/SX Series oscilloscopes and waveform data from
DPO/MSO/MDO3000 and DPO/MSO/MDO4000 Series oscilloscopes can
quickly be shared among team members and remote sites, resulting in improved
efficiency.
Key features
■
Collaborate
■
TekScope Anywhere™ runs on your PC - Better time and resource
utilization; view, measure, and analyze data captured in your lab,
independent of the oscilloscope hardware
■
Composite save/recall format - More accurate and repeatable results with
composite save/recall files with both instrument setup and waveform data
from your Tektronix DPO/MSO5000,DPO7000C, or DPO/MSO70000C/
D/DX/SX series oscilloscope
■
■
Compatible with most common save/recall waveform files - Common
analysis tools independent of the hardware acquisition, including;
Tektronix, LeCroy, or Keysight oscilloscope formats
(.wfm, .isf, .csv, .h5, .tr0, .trc, and .bin)
Analyze
■
50+ Parametric and cursors measurements - TekScope Anywhere test
results correlate with Tektronix oscilloscope
■
Jitter decomposition (option DJA required) - Conduct jitter analysis on
your PC while traveling, in the lab, or at your customer's site, and get
results that correlate with DPOJET
■
Plots with zoom support - Interactive plots with zoom functionality
enables isolation of DUT behavior spectral content and jitter
■
Plots with cursor support - Measure DUT performance including eye
height and eye width using cursors
■
Arbitrary filter support - De-embed and embed cables, fixtures, or
channel models using filters created with SDLA visualizer (SDLA
TekScope Anywhere™ Help 1
Page 16
About TekScope Anywhere
visualizer is available as Option SDLA64 on all 64 bit DPO/MSO70000
Series Oscilloscopes).
■
Document
■
Waveform annotations - Share detailed analysis results, measurements,
anomalies and points of interest for future reference, collaboration with
suppliers, or communicating with team members
■
Reports - Easily document measurement results and configuration details
with a detailed test report
■
Custom display configuration - Group plots in multiple configurations
with stacked or overlaid waveform view
Applications
■
Compliance and characterization - Parametric measurements and jitter
analysis for high speed serial interfaces
■
Debug - Share waveforms, measurements, and configuration details among
distributed team members or suppliers to root cause the source of failures
Product software
About
■
Simulation - Quickly compare the results of lab measurements and
simulations using common measurements and data visualization views
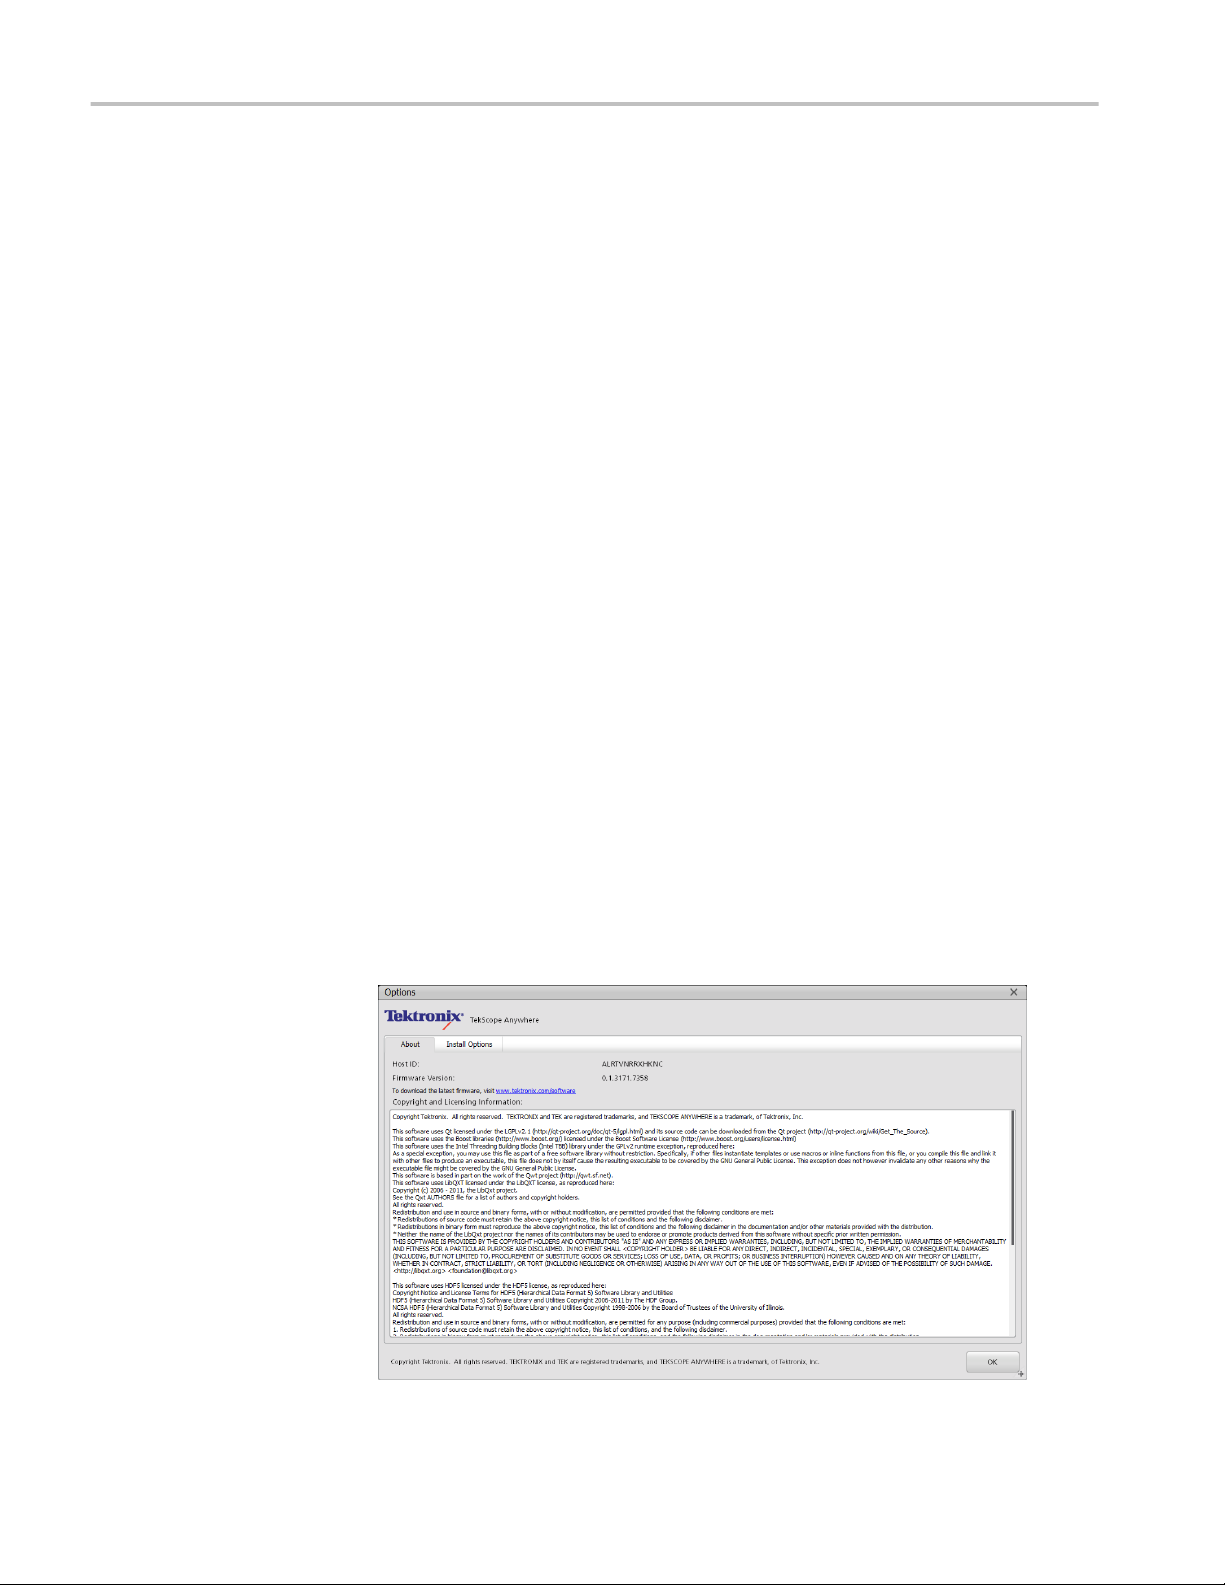
From the Help menu, click About to view application details such as the Host
ID, Firmware version, copyright and licensing information.
2 TekScope Anywhere™ Help
Page 17

About TekScope Anywhere
TekScope Anywhere
options
TekScope Anywhere can be downloaded from www.tektronix.com, and the
features of the application are enabled by purchasing different licensing options.
The following table lists the options offered on TekScope Anywhere.
Table 1: Software license types
License type Description
Node Locked item (NL) This license is permanently assigned to a specific Hostid or
product model/serial number.
Floating License item (FL) This license can be moved between different Hostid or product
model/serial number.
Free Trial item (FT) This has the same functionality as the floating license except that
it is time limited to 14 days.
Table 2: Tekscope Anywhere Waveform analysis licensing options
Product Description
TekScopeNL-BAS TekScope Anywhere Waveform Analysis and Visualization Node
Locked License.
TekScopeFL-BAS TekScope Anywhere Waveform Analysis and Visualization
Floating License.
TekScopeFT-BAS TekScope Anywhere Waveform Analysis and Visualization Free
Trial License.
Table 3: Tekscope Anywhere Jitter analysis licensing options
Product Description
TekScopeNL-DJA DPOJET Advanced Jitter Analysis for TekScope Anywhere Node
Locked License.
DPOFL-DJA DPOJET Jitter and Eye Analysis floating license for use with
TekScope Anywhere or DPO/DSA/MSO70000C/D/DX,
DPO7000C, or DPO/MSO5000 Oscilloscopes.
DPOFT-DJA DPOJET Jitter and Eye Analysis free trial license for use with
TekScope Anywhere or DPO/DSA/MSO70000C/D/DX,
DPO7000C, or DPO/MSO5000 Oscilloscopes.
TekScope Anywhere™ Help 3
Page 18

About TekScope Anywhere
How to purchase options (license)
Contact your local Tektronix Account Manager to purchase TekScope Anywhere
and options. After purchasing options, you will receive an email listing the
options purchased with the URL to the Tektronix Asset Management system that
will enable you to manage your licenses.
Tektronix Asset Management System (TekAMS)
You can manage your licenses using the Tektronix Asset Management System
found at http://www.tek.com/products/product-license.
The Tektronix Asset Management system provides an inventory of the license(s)
in your account. It enables you Check-out or Check-in a license and view the
history of licenses.
How to Install options (license)
To install the TekScope Anywhere option or options purchased from Tektronix,
click Help > Install Options to display the license manager.
Click the Install License button and browse to the location where the license file
is located. Select the license file and click open.
4 TekScope Anywhere™ Help
Page 19

About TekScope Anywhere
After the successful installation is finished, the option is listed in the table.
Selecting an option from the table shows the details of the license such as license
type, checkout time, installation time, expiration time and time remaining.
Clicking the OK button will prompt for an application restart. After restarting the
TekScope Anywhere application, the option you purchased is enabled.
TekScope Anywhere™ Help 5
Page 20

About TekScope Anywhere
View installed options
From the Help menu, click Install Options to view the options installed.
Selecting an option from the table shows the details of the license such as license
type, checkout time, installation time, expiration time and time remaining.
6 TekScope Anywhere™ Help
Page 21

About TekScope Anywhere
How to move an option to a different host
You can return the license purchased and assign it to a different host.
Node locked license: Can be returned two times and assigned to a different host.
Floating license: Can be returned unlimited number of times and assigned to a
different host.
Free trials: Has the same capability as floating license, but expires after 14 days.
When assigning a floating license, you need to specify the host id or instrument
and the duration the feature is to be enabled on the host. After the license expires,
the feature is automatically disabled on host and the license on the TekAMS is
free to be assigned to a different host.
TekScope Anywhere™ Help 7
Page 22

About TekScope Anywhere
In order to move the license to a different host, follow these steps:
1. Click Help > Install Options. Select the license to return and click Return
License.
2. Browse to the location where you would like to place the exit file (for
example, a network drive or a USB memory stick), and click Create Exit Key
to generate the exit file.
3. Login to your account on TekAMS (Tektronix Asset Management system)
and upload the exit file. Once the license is returned successfully, it can be
re-assigned to a different host or instrument.
8 TekScope Anywhere™ Help
Page 23

Compatibility
About TekScope Anywhere
Measurement differences
between TekScope
Anywhere and
Oscilloscope
This section provides details about differences in measurement results or
behavior between the TekScope Anywhere application and prior oscilloscope
measurement systems.
1. Populations per waveform for Cycle-based measurements Cycle Min and
Cycle Max may be lower by one or two in TekScope Anywhere.
■
DPOJET treats each half-cycle separately.
■
TekScope Anywhere makes a measurement only on each full cycle and
will ignore incomplete cycles at the start or end of a waveform.
2. Population per waveform for Cycle Pk-Pk will be half that of DPOJET
(possibly minus 1 or 2 due to boundary conditions).
■
DPOJET advances on a half-cycle after each measurement. So if positive
and negative half cycles are labeled {P1, N1, P2, N2, P3...}, DPOJET for
example would measure pk-pk across {P1, N1}, then across {N1, P2},
then {P2, N2}, then {N2, P3}, and so on.
■
TekScope Anywhere only makes one measurement per cycle, so {P1,
N1}, then {P2, N2}, and so on.
3. The High and Low measurements from DPOJET are named BitHigh and
BitLow in TekScope Anywhere. High-Low is named BitAmplitude for
consistency.
4. The CCPeriod measurement in TekScope Anywhere returns a different
measurement time value for each result than DPOJET's CCPeriod does.
■
This is to make the convention common with all the other CC
measurements in TekScope Anywhere.
5. In DPOJET, the Median and Fixed variants of Constant Clock Recovery
perform an internal classification of Clock versus Data. TekScope Anywhere
uses a single unified method everywhere.
6. The J2 and J9 measurements in DPOJET use a slight approximation of the
desired target BER level of 2.5e-3, whereas TekScope Anywhere uses the
exact value. This leads to a slight result variation.
7. Precision for gating measurements by time has been improved. Due to the
increase in precision, the waveform points selected as being inside the range
may now be different from other products, causing gated measurements to
return a more precise result than they did previously.
8. The reference level algorithms have been improved for consistency. In
DPOJET, different algorithms were used depending on the particular data
type behind the waveform. Now all waveforms use the same algorithm
regardless of data type. Consequently, some variance in calculated reference
levels may be seen compared to results returned by DPOJET and TekScope.
The differences are due primarily to an improvement in how the Automatic
method works. In TekScope, the MinMax method may have been chosen by
TekScope Anywhere™ Help 9
Page 24

About TekScope Anywhere
the Automatic method while now it will choose Histogram Mode. Check the
method readout to be sure you get the expected ref level method or manually
select the specific method you would like to use.
9. The reference level algorithms between DPOJET and the base TekScope
have been unified in one place. Each product used different names for the
same algorithm, so new names were selected:
TekScope Anywhere TekScope Name DPOJET Name
Absolute Absolute Absolute
Automatic Automatic Auto
Min-Max Min-Max Min-Max
Histogram Mode Histogram Mode Low-High (Full Wfm)
Histogram Mean Histogram Mean N/A
Histogram Eye Center N/A Low-High (Eye Center)
10. Histograms in DPOJET used a left-edge-of-bin convention when identifying
bin positions, but for convergence with scope base measurements this has
been changed to a center-of-bin convention. This may lead to small results
differences for measurements that use histograms internally.
11. Measurement metadata readouts for reference levels, bit rate, pattern length,
RjDj and other items will have been accurate at the time they were calculated
but may not match the current settings until they are refreshed. To get the
most recent results, go to the measurement result table and confirm the
measurement updated. Then go back to the portion of the UI with the readout
to get the latest value. If that particular item is not in use by any
measurement, the readout will not be calculated. For example, if no
measurements are using reference levels, the readout will just say "TBD".
12. For all type II PLLs (including Standard BW, Custom BW and ExplicitClock PLL), DPOJET has a defect that was preventing the velocity variable
inside the PLL loop from dynamically updating. This has been fixed in
TekScope Anywhere.
13. Results for measurements using Explicit Clock Edges and Explicit PLL clock
recovery types will vary compared to DPOJET due to several improvements
to the algorithm.
14. Clock recovery is only run when a specific measurement configuration
requires it to avoid extra calculation overhead. Because of this, display units
have become a requested setting. If clock recovery was run as part of a
measurement calculation, the result will be displayed using the Unit Interval
if requested. If clock recovery was not run, the measurement until will remain
the normal display unit (typically seconds) as if Unit Interval had not been
requested.
15. Units will not be shown across any of the panels when the Loop Bandwidth
is narrow because the width is insufficient to get enough points for the
measurement. Increasing the width of the filter will propagate units
everywhere.
10 TekScope Anywhere™ Help
Page 25

About TekScope Anywhere
Plots
Histogram plot horizontal axis scaling is wrong in some cases, typically when a
measurement result has an extremely small standard deviation. In this case, the
plot will have a few vertical bars in the center, with mostly blank space on either
side.
Save and recall
1. tr0 format - Only Synopsys and LyncxSpice formats are supported.
2. Add on plugins are required to view the MHT format of the report on Mozilla
Firefox and Google Chrome.
Session recall limitations
from Oscilloscope to
TekScope Anywhere
General notes
You can share data acquired on an oscilloscope for offline analysis with
TekScope Anywhere. There are features available on an oscilloscope that are not
supported by TekScope Anywhere. The following list provides details about the
behavior of TekScope Anywhere, when recalling a session file saved on a DPO/
DSA/MSO oscilloscope.
■
Digital Sources, Bus, Masks and Limit setting features are not supported by
TekScope Anywhere. If the session file has these features, they are ignored.
■
Hbar and Vbar cursors are not available for analysis on TekScope Anywhere.
If the session file has Hbar and Vbar cursors, they are mapped to Screen
cursors.
■
TekScope Anywhere does not support multiple zooms. If the session file has
multiple zooms, only the Zoom1 settings are recalled on TekScope
Anywhere.
■
Waveforms are recalled at zero position on TekScope Anywhere regardless
of the vertical position set on the oscilloscope.
■
Eye diagram autoscale settings are ignored on TekScope Anywhere.
■
Should the application crash on start up, removing this file may resolve the
issue:
C:\Users\<username>\AppData\Local\Tektronix\TekScope Anywhere
\PowerUpSettings.ini
■
Microsoft Remote Desktop does not support the graphics used by this
software. Alternatives like TightVNC and Team Viewer are known to work.
■
Multiple instances of TekScope Anywhere running on the same PC are not
currently supported.
■
Should the application crash when there are multiple views and if it is due to
display drivers, we recommend you to update the display driver with the
latest version provided by your PC vendor.
■
Saving an opened PDF report when append is checked shows a pop-up
prompting you to close the report. Click Save again after clicking OK.
TekScope Anywhere™ Help 11
Page 26

About TekScope Anywhere
■
The performance of the application may be slow in a PC with lower hardware
configuration. Reduce the number of measurements or use waveform files
with lower record lengths for improved application performance.
■
The File Open dialog can be slow and unresponsive when accessing Network
Attached Storage (NAS). Map the path to a local drive and access the files.
Minimum system configuration
System requirements
Minimum System
Requirements for
Windows 8.1
Intel® Pentium®4 or AMD Athlon®64 processor (2 GHz or faster)
Windows 7 SP1, Windows 8, or Windows 8.1
4 GB of RAM, 8 GB recommended
5 GB of available hard disk space, 10 GB recommended (exact space is
dependent on the number of waveforms and their size)
1366x768 display (1920x1080 recommended)
OpenGL®2.0, 32-bit color, and 1 GB of VRAM
Internet Explorer 11 and above is recommended for viewing reports in mht
format
Adobe Reader X and above is recommended for viewing pdf files
Physical Address Extension (PAE), NX processor bit (NX), and Streaming SIMD
Extensions 2 (SSE2)
PAE gives 32-bit processors the ability to use more than 4 GB of physical
memory on capable versions of Windows, and is a prerequisite for NX.
NX helps your processor guard the PC from attacks by malicious software.
SSE2 is a standard instruction set on processors that is increasingly used by thirdparty apps and drivers.
12 TekScope Anywhere™ Help
Page 27
About TekScope Anywhere
How to Install/Uninstall Tekscope Anywhere
Install Tekscope
Anywhere
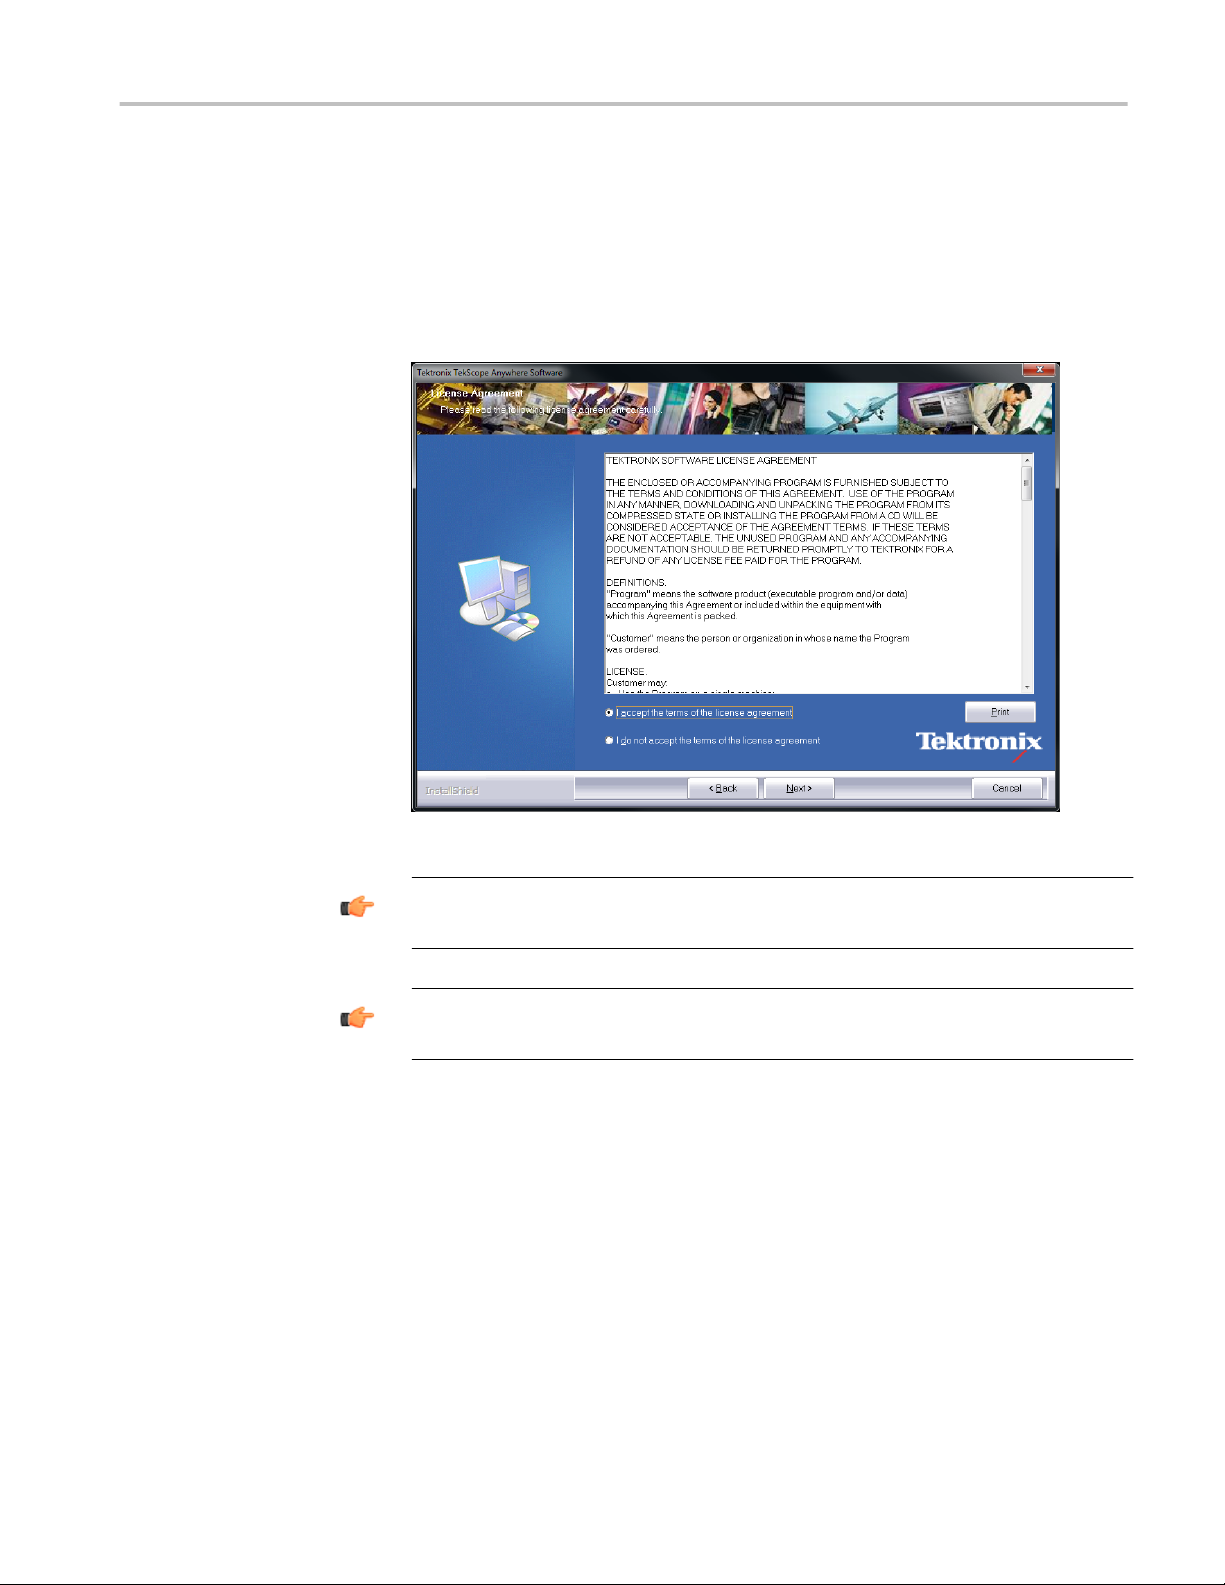
Download the Tekscope Anywhere installer from www.tektronix.com. Then,
double-click the .exe file, and follow the instructions on your screen.
TIP.
After installation, the TekScope Anywhere shortcut will be placed on the
desktop and in the Start Menu.
TIP. Sample waveforms, filter files, and pattern files are located at: C:\Users
\Public\Tektronix\TekScope Anywhere\UserData
TekScope Anywhere™ Help 13
Page 28
About TekScope Anywhere
Uninstall Tekscope
Anywhere
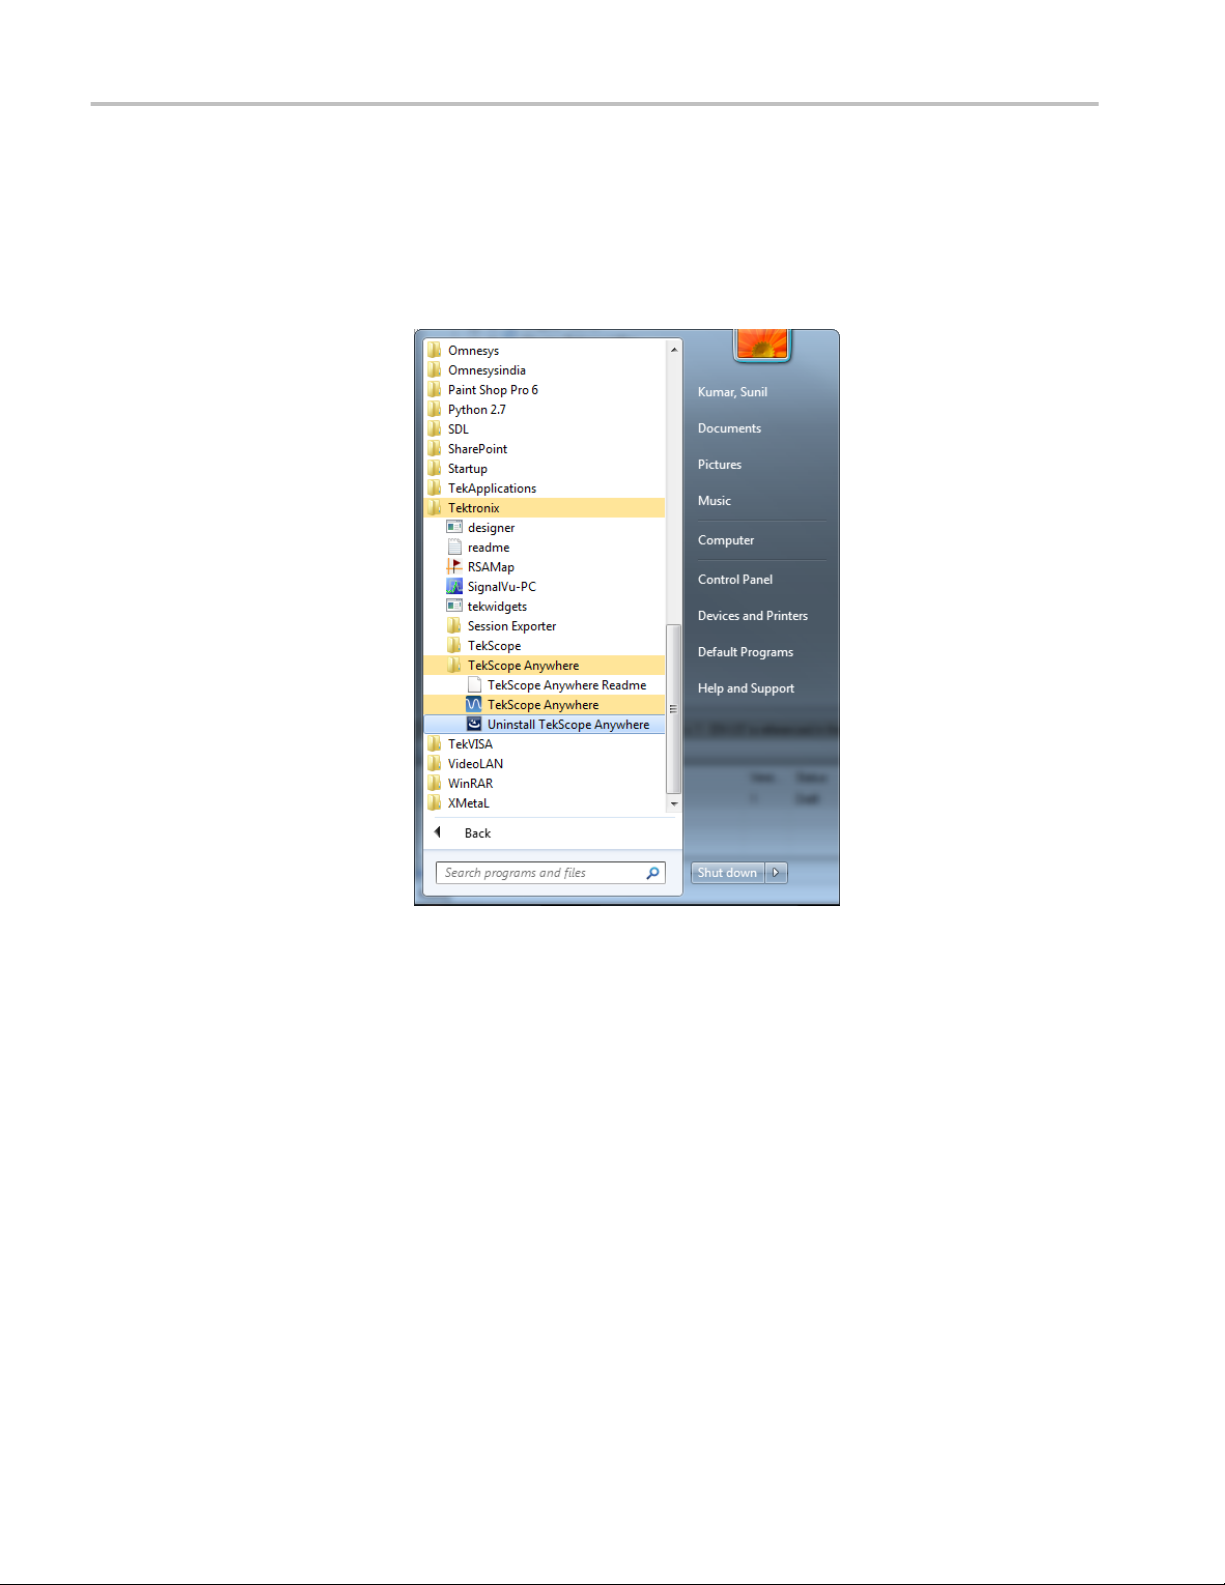
1. Click on the Start button to open your Start menu.
2. When the Start menu opens click All Programs > Tektronix > TekScope
Anywhere > Uninstall TekScope Anywhere.
14 TekScope Anywhere™ Help
Page 29

About TekScope Anywhere
3. Select Yes from the confirm box to uninstall the TekScope Anywhere
application.
TekScope Anywhere™ Help 15
Page 30

About TekScope Anywhere
Technical support
Customer feedback
Tektronix welcomes your comments about products and services. Contact
Tektronix through mail, telephone, or the Web site. See Contacting Tektronix for
more information.
Tektronix also welcomes your feedback. See Customer feedback for suggestions
for providing feedback to Tektronix.
Tektronix values your feedback on our products. To help us serve you better,
please send us your suggestions, ideas, or other comments regarding the
application or oscilloscope.
Direct your feedback via email to
techsupport@tektronix.com
Or FAX at (503) 627-5695, and include the following information:
■
Description of the problem such that technical support can duplicate it.
■
If possible, save the oscilloscope and application setup files as .set or
TekScope Anywhere as a .tss.
The following items are important, but optional:
■
Your name
■
Your company
■
Software version number
■
Your mailing address
■
Your phone number
■
Your FAX number
When contacting technical support through email, please use "TekScope
Anywhere Problem" in the subject field and attach the .set and .wfm files to your
email. If there is any query related to the actual measurement results, then you
can generate a .mht report and send it. For information about how to save a
screen shot of the TekScope Anywhere application, Click here.
In the body of the mail include your suggestion or a description of the issue.
Please be as specific as possible.
Please indicate whether you would like to be contacted by Tektronix regarding
your suggestion or comments.
16 TekScope Anywhere™ Help
Page 31

About TekScope Anywhere
Conventions
TekScope Anywhere Help uses the following conventions:
■
When steps require sequence of selections using the application interface, the
“>” delimiter marks each transition between a menu and an option. For
example, Measurement > Measurement Library.
■
The terms “TekScope Anywhere application” and “application” refer to
TekScope Anywhere.
■
The term “select” is a generic term that applies to the methods of choosing an
option: with a mouse or with the touch screen.
You can also find the PDF of the Help at Start >All Programs >Tektronix >
TekScope Anywhere.
Related documentation
You can also find the TekScope Anywhere help document in PDF format
available at: www.tektronix.com/manuals and www.tektronix.com/software.
TekScope Anywhere™ Help 17
Page 32

About TekScope Anywhere
18 TekScope Anywhere™ Help
Page 33

Getting started with TekScope Anywhere
This section shows you how to do the following tasks:
1. Opening waveform, setup, session files and defining Math
2. Viewing a opened waveform, zoom view a waveform and position the
cursors on a waveform
3. Selecting and configuring a measurement, viewing the statistical results
4. Creating two dimensional plots for a measurement, zoom view a plot and
position the cursors on a plot
Waveform files
The application provides the following sample waveforms:
■
8GPRBS7_70mV_10M_Ch1.wfm
■
8GPRBS7_70mV_10M_Ch3.wfm
■
8GPRBS7_70mV_10M_SSC_Ch1.wfm
■
8GPRBS7_70mV_10M_SSC_Ch3.wfm
See also
■
8GPRBS7_70mV_500K_Ch1.wfm
■
8GPRBS7_70mV_500K_Ch3.wfm
■
8GPRBS7_70mV_500K_SSC_Ch1.wfm
■
8GPRBS7_70mV_500K_SSC_Ch3.wfm
The waveform files are found at C:\Users\Public\Tektronix\TekScope Anywhere
\UserData.
Opening files
TekScope Anywhere™ Help 19
Page 34

Getting started with TekScope Anywhere
Opening files
This section describes the steps to open a reference waveform, setup or session
file.
Opening a reference
waveform
The waveform files acquired on an oscilloscope can be opened in the TekScope
Anywhere as reference waveform for offline analysis. This section describes how
to open a waveform file as a reference source in the TekScope Anywhere.
To Open a reference waveform, perform these steps:
1. Click the Open button, which can be found in Main/File tab.
2. Select the type of file as Waveform in the left pane of the Open dialog box,
navigate to the location of the tutorial waveforms.
3. Select the File Type from the files of type list.
4. Select the Destination as
■
New Ref (If the waveform is to be opened as new reference waveform).
The drop-down has an option to use Ch1-4 in order to make it look like
the colors that are used in an oscilloscope.
■
Ref <no> (If the waveform is to be opened by replacing an opened
reference waveform).
5. Select the waveform file and click Open. A Reference badge (Ref <no>) is
added in the GSRB field for the new reference waveform. (See Global
Settings Readout Bar (GSRB) on page 58.)
TIP.
Select multiple waveform files and click Open to open all waveforms in
sequential order.
A Reference badge (Ref <no>) is added in the GSRB field for the new reference
waveform and the waveform is opened in the application.
See also. Ref badge context menu
Opening a setup
Opening a session
Global Settings Readout Bar (GSRB) on page 58
20 TekScope Anywhere™ Help
Page 35

Getting started with TekScope Anywhere
Opening a setup
Opening a session
The Setup file includes all instrument settings and user configured analysis
enabling you to recreate the current setup on another compatible instrument with
newly acquired data. This section describes how to open a setup file in the
TekScope Anywhere.
To Open a setup file, perform these steps:
1. Click the Open button, which can be found in the Main/File tab.
2. Select the type of file as Setup in the left pane of the Open dialog box,
navigate to the desired directory.
3. Select the File Type from the files of type scroll down list.
4. Select the setup file and click Open.
See also. Save the setup
Opening a session
Opening a reference waveform
The session file contains all necessary data to restore the instrument state,
including the last acquired data. This section describes how to open a session file
in the TekScope Anywhere application.
To Open a session, perform these steps:
1. Click the Open button, which can be found in the Main/File tab.
2. Select the type of file as Session in the left pane of the Open dialog box,
navigate to the desired directory.
3. Select the File Type from the files of type scroll down list.
4. Select the session file and click Open.
See also. Save a session
Export session from oscilloscope
Opening a setup
Opening a reference waveform
Session recall limitations from Oscilloscope to TekScope Anywhere
TekScope Anywhere™ Help 21
Page 36

Getting started with TekScope Anywhere
Defining Math
Math waveforms are the vectors that are obtained by performing mathematical
operations between any two waveforms or on a single waveform. This section
shows you how to define a Math function (the See also links below show you
how to configure different types of Math functions).
To define a Math, perform these steps:
1. Click the Add Math button from the Main tab. A new Math badge is added in
the GSRB field. If two sources exist prior to selecting the Add Math button, a
default Math waveform (Source 1 - Source 2) is created.
2. The associated Math settings context menu is also displayed, allowing you to
configure the Math.
See also
Viewing waveforms
Math settings
Basic Math
Advanced Math
FFT Math
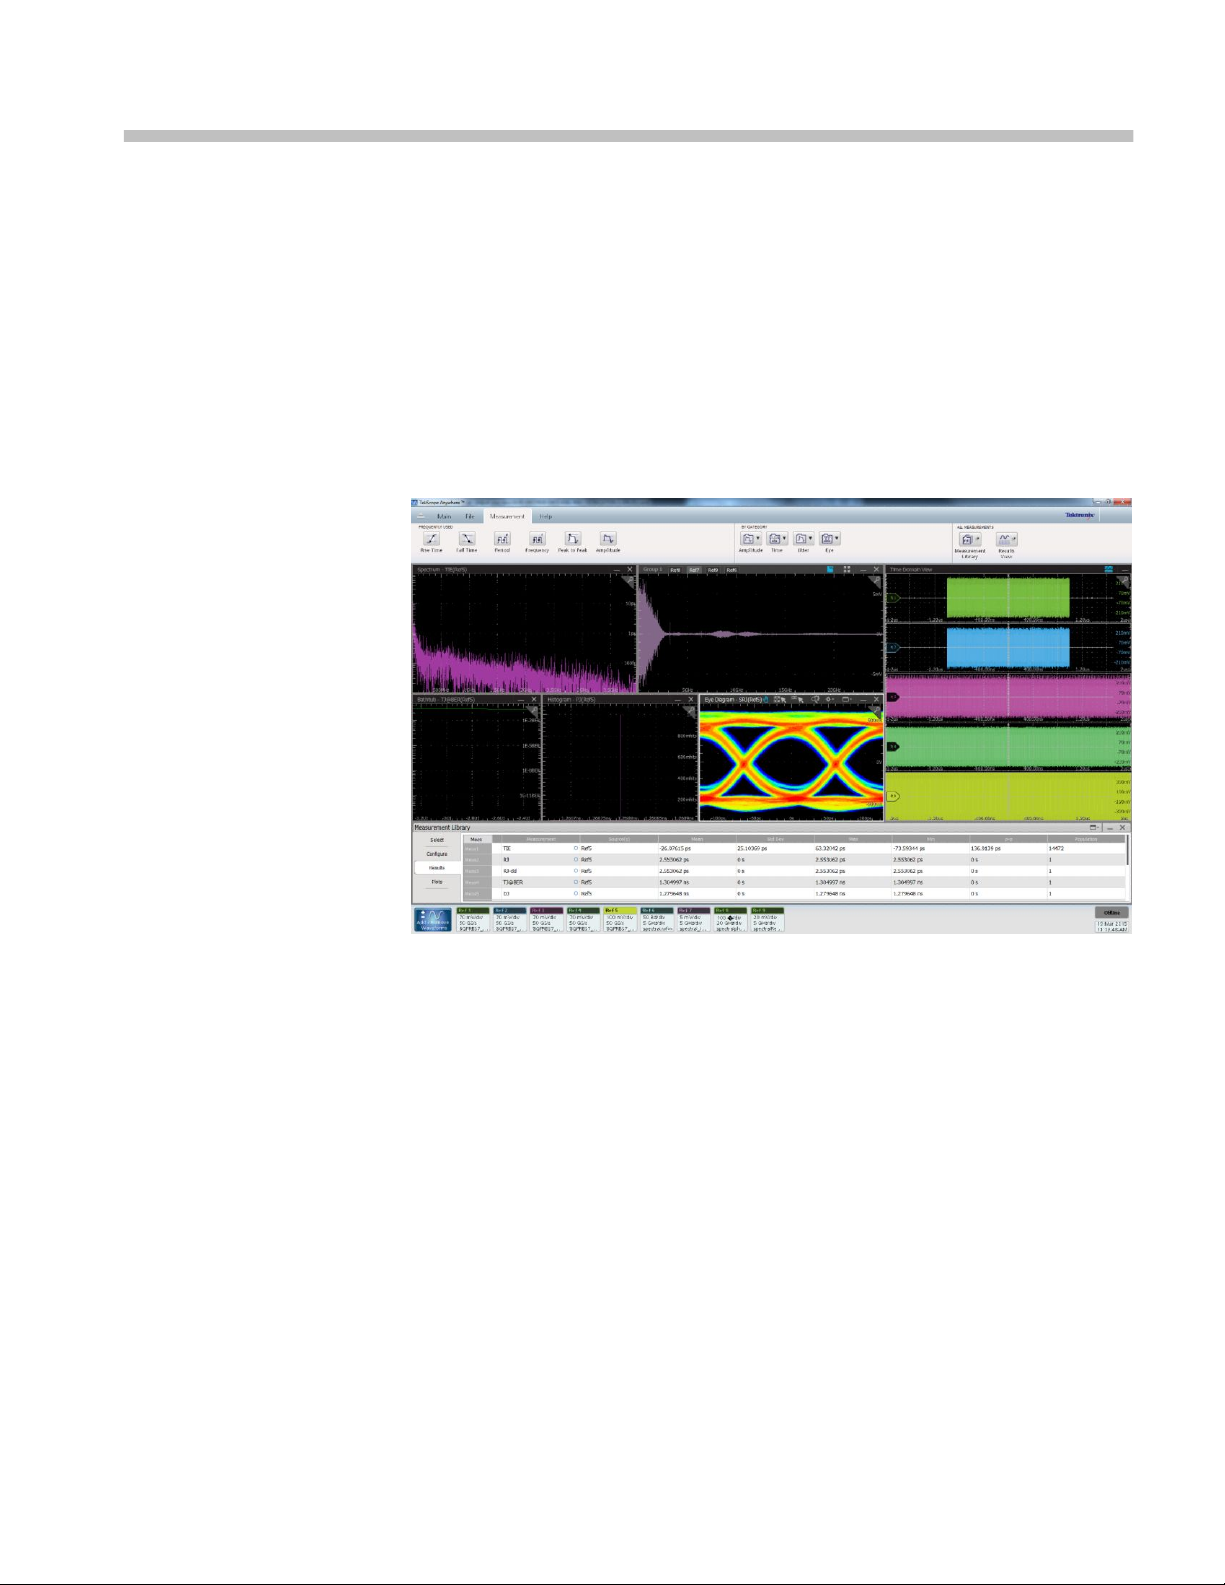
The Time Domain view displays all time domain waveforms (waveforms
showing the change in a signal over time). Each waveform has a waveform
handle that can be used to move the waveform vertically.
Right-clicking the handle also provides easy access for configuring the
waveform.
Figure 1: Time Domain View
22 TekScope Anywhere™ Help
Page 37

Getting started with TekScope Anywhere
Table 4: Title bar icons – Time Domain view
Icon Description
Waveform cursors on/
off
Screen Cursors on/off
Zoom Drag Mode When selected, you can drag the zoom box on
Zoom Dragbox Mode When turned on, you can perform vertical zoom
Zoom Horizontal
Dragbox Mode
Stacked Mode On/Off Switch the display to Stacked or Overlay mode.
When turned on, cursors are displayed on the
screen. You can set cursor positions and take
measurements using cursors.
waveform to a different area of the waveform. In
the normal (Time Domain) view, this is a macrolevel movement. You can also move the
waveform by clicking on the zoom plot and
dragging left or right. This is a micro-level
movement.
on the waveform. Left click and drag in the Time
Domain or zoom view to mark the region on the
waveform to zoom.
When turned on, you can perform horizontal
zoom on the waveform. Left click and drag to
mark the region on the waveform to zoom.
Window Options When clicked, the time domain view window
options context menu is displayed with the
following options:
■
Waveform Cursors
■
Screen Cursors
■
Zoom Drag Mode
■
Vertical Draw Box
■
Horizontal Draw Box
■
Stacked View
Minimize When clicked, minimizes the Time Domain View.
It can be maximized from Minimized containers
displayed at the top right of the application.
You can quickly access the time domain view settings by right-clicking on the
screen.
TekScope Anywhere™ Help 23
Page 38

Getting started with TekScope Anywhere
See also
Stacked/Overlay mode
Figure 2: Time domain view shortcuts
Opening files
Overlay mode and stacked mode are the two modes to view the waveform. You
can toggle between the two modes based on the required analysis by using the
mode icon in the title bar of the Time Domain view. When the icon is
highlighted, Stacked mode is selected.
Figure 3: Mode icon - Showing Stacked selected
24 TekScope Anywhere™ Help
Page 39

Getting started with TekScope Anywhere
When the icon is not highlighted, Overlay mode is selected. Overlay mode draws
the displayed waveforms one on top of the other. The selected waveform is
drawn on top and is called the active waveform.
Figure 4: Overlay mode
When looking at edge crossings between two data signals, overlay mode may be
preferred. As the number of waveforms grows, stacked mode is typically
preferred.
Stacked mode displays the displayed waveforms stacked above each other for
easy horizontal comparison.
Figure 5: Stacked mode
TekScope Anywhere™ Help 25
Page 40

Getting started with TekScope Anywhere
Zoom view of the
waveform
You can zoom in to get a close-up view of the waveform. For example, in the
process of placing cursors on a waveform, zoom view can help you find the
precise waveform location to set cursors.
When you select Main > Zoom view in TekScope Anywhere, the screen changes:
■
The upper part displays the normal view of the waveform with a zoom box
placed on it, indicating the zoomed region of the waveform.
■
The lower part displays the magnified area of the waveform.
Figure 6: Zoom view of waveform
When you turn zoom on with multiple time domain waveforms opened, the upper
part displays all waveforms. The selected waveform in drawn on top. Selecting a
source badge brings that waveform to the top. The lower part displays the
zoomed area of all the waveforms.
26 TekScope Anywhere™ Help
Page 41

Getting started with TekScope Anywhere
Zoom box
The Zoom box specifies the area of the waveform zoomed. Drag the window to
zoom view the region of the waveform. You can also increase/decrease the height
and width of the Zoom box. Decreasing the window size increases the zoom of
the waveform. Decreasing the window size horizontally, increases the horizontal
zoom of the waveform and vertically increases the vertical zoom of the
waveform. You can perform horizontal zoom from 1x to 20 kx and vertical zoom
from 1x to 1 kx.
You can use
button to increase or decrease the zoom box area.
Zoom by draw-a-box. Your can zoom into an area of the waveform by selecting
one of the draw-a-box modes (Zoom Drawbox Mode or Zoom Horizontal
Drawbox Mode) and click-and-drag an area to zoom. The box drawn by selecting
Zoom Drawbox Mode performs vertical zoom of the waveform. Selecting Zoom
Horizontal Drawbox Mode performs Horizontal zoom of the waveform. The
zoom draw-a box icons are accessible from the title bar.
Figure 7: Zoom by draw-a-box
See also. Measurement units
TekScope Anywhere™ Help 27
Page 42

Getting started with TekScope Anywhere
Placing cursors on a
waveform
Cursors are used to take amplitude and timing measurements between screen
locations (screen cursors) and locations on a waveform (waveform cursors).
Cursors in Time domain view
You can use cursors to read the coordinate where each cursor (line) touches the
waveform and also view the difference (Δ) between the two cursors. Use these
steps to use cursors in a window (for precise measurements, zoom the waveform
in on the area of interest):
1. Turn on the cursors using the icons on the Time Domain view title bar.
2. Select and drag cursor A to the desired part of the waveform. The cursor
readout changes to reflect the cursor position.
3. Move cursor B by dragging the readout.
4. Move the pair by dragging the delta readout.
TIP. You can quickly access cursors by right-clicking on the screen and selecting
cursors from the context menu.
When multiple time domain waveforms are opened, turning the cursor on places
the cursors on the selected waveform. Selecting a waveform badge moves cursors
to the selected waveform (the horizontal or vertical cursor position doesn't
change).
28 TekScope Anywhere™ Help
Page 43

Getting started with TekScope Anywhere
Making measurements
Select a measurement
NOTE. Multiple sets of cursors is not supported in TekScope Anywhere.
See also. Cursor setup
To select a measurement, click Measurement > All Measurements >
Measurement Library.
In the Measurement Library, the Select panel contains measurements grouped by
categories using Amplitude, Time, Jitter and Eye tabs. Selecting a tab displays
the licensed measurements in that category. Clicking a measurement button
creates the measurement and adds it to both the measurement table and the
measurement results table. The active waveform is selected as the measurement
source.
Measurement table
TekScope Anywhere™ Help 29
Page 44

Getting started with TekScope Anywhere
The measurement table is displayed at the right side of panel.
■
The table has three columns labeled Meas, Measurement and Source(s).
■
The Meas column displays the measurement identifier. Meas1, Meas2,
Measn will be the serial number for first, second and subsequent
measurements.
■
The Measurement column displays the measurement name. To change
the measurement name, double click the Measurement cell and enter a
new name. When a measurement name has been changed the hover text
will show the measurement type appended to the new name.
■
The Source(s) column displays the measurement source(s). To change
the Source, left click in the Source(s) cell of the applicable measurement
row.
■
Right-clicking on a measurement displays the menu list to Delete, Delete All,
Configure Measurement, Save Measurement Results and Measurement
Preferences.
■
Delete to delete the selected measurement.
■
Delete All to delete all measurements in the table.
■
Save Measurement Results to save the statistical results in CSV format.
■
Measurement Preferences opens the Preferences context menu.
NOTE. For convenience, the measurement table also appears in the Configure
and Plots panel.
See also. Jitter category measurements
Time category measurements
Amplitude category measurements
Eye category measurements
30 TekScope Anywhere™ Help
Page 45

Getting started with TekScope Anywhere
Configure the measurement
The Configure panel displays the available configurations for the measurement
that is currently selected in the measurement table. The number and type of
configuration tabs that are available depends on the selected measurement type.
The configuration options available for measurements are the following:
■
General
■
Global
■
Filters
■
Bit config
■
Clock recovery
■
Edges
■
RJDJ
■
Bit error rate (BER)
■
Spread spectrum clocking (SSC)
For information about configurations applicable for the measurements Click here.
View the results
Figure 8: Configure the measurement
The Results panel displays the statistical results for all measurement in tabular
format. You can drag both rows and columns of the table to customize data
display. Right clicking on a row in the results table displays a context menu with
choices to:
■
Delete to delete the selected measurement.
■
Delete All to delete all measurements in the table.
■
Save Measurement Results to save the statistical results in CSV format.
■
Measurement Preferences opens the Preferences context menu.
TekScope Anywhere™ Help 31
Page 46

Getting started with TekScope Anywhere
Table 5: Results table headers
Item Description
Meas Measurement number
Measurement Measurement name
Source(s) Measurement source
Mean Statistical mean value
Std Dev Statistical standard deviation value
Max Statistical maximum value
Min Statistical minimum value
p-p Statistical peak-to-peak value
Population Total number of measurement data points used for displaying the
statistics
The measurement update indicator (circle icon in the measurement column) is
displayed for a measurement when a result is updated after configuration change.
Hovering the pointer over the icon shows the last updated time.
Viewing plots
NOTE. The numerical values displayed in the table are rounded-off decimal
values. In order to see the full calculated value, hover over the value.
See also. Viewing plots
To display the Plots panel, select Measurement > All Measurements >
Measurement Library.
Plots are two dimensional displays of results, providing a deep level of
understanding of statistical displayed results. The Plots tab in the Measurement
library displays available plots for the measurement selected in the table.
Clicking a plot button selects the plot, adds it to the plots source table, and adds
the associated plot view to the display area.
The Plots panel displays the measurement table, a plot table and a selection of
buttons for creating the types of plots available for the selected measurement.
Selecting a plot button creates a new plot based on the selected measurement
view and adds that plot to the plot table. To delete one or more plots, right click
anywhere on a row. A context menu appears, allowing you to delete the selected
plot or to delete all plots.
32 TekScope Anywhere™ Help
Page 47

Getting started with TekScope Anywhere
Table 6: Plot type definitions
Item Description
Histogram Represents measurements sorted by value as a distribution of
measurement values versus the number of times the value occurred.
Time Trend Represents the measurement values versus the time location.
Spectrum Represents the frequency content computed using the FFT of the Time
Trend of the measurement data.
Bathtub Represents the Bit Error Rate versus the unit interval for measurements
that include RJ-DJ analysis.
Eye Diagram Represents data for the eye diagram based on the recovered clock as the
timing reference; used for mask testing.
The plot table is displayed at the right side of panel.
■
The table has four columns labeled Meas, Plot Type, Measurement, and
Source(s).
■
The Meas column is for the measurement serial number. Meas1, Meas2
will be the serial number for first and second measurement and so on.
■
The Plot Type column displays the plot name. To change the name of a
plot, Double-click in Plot Type and start typing.
■
The Measurement column displays the measurement name. To change
the measurement name, double click in the Measurement cell and simply
type in a new name.
■
The Source(s) column displays the measurement sources(s).
■
Right-clicking a plot in the Plots table displays a context menu:
■
Delete to delete the selected plot.
■
Delete All to delete all plots in the table.
You can quickly access the Plot display settings by right-clicking on the screen.
TekScope Anywhere™ Help 33
Page 48

Getting started with TekScope Anywhere
Plot window
Figure 9: Plots shortcuts
The plot view displays two dimensional plots for a measurement.
When you select a plot other than time trend, an associated plot is added to the
display area. In the image below, a Histogram plot has been added.
34 TekScope Anywhere™ Help
Page 49

Getting started with TekScope Anywhere
When you select a Time trend plot for a measurement calculated in time, then the
plot is added to Time Domain view. The Trend badge (Time Trend) will be
added to the GSRB field.
TekScope Anywhere™ Help 35
Page 50

Getting started with TekScope Anywhere
The plot view title bar has the following icons, allowing you to perform various
associated tasks:
Table 7: Title bar icons – Plot view
Icon Description
Waveform cursors on/
off
Screen Cursors on/off
Zoom Drag Mode When turned on, you can drag the zoom box on
Zoom Dragbox Mode When turned on, you can perform vertical zoom
Zoom Horizontal
Dragbox Mode
Plot Configuration
Options
Window Options When clicked, the plot window options context
When turned on, the cursor lines are displayed
on the screen. You can set the cursor points and
take measurements. The cursors available for
the plot depends on plot type.
waveform to a different part of the waveform. In
the normal (Time Domain) view, this is a macrolevel movement. In a Zoom window, you can
drag the waveform left and right, which is a
micro-level movement.
on the waveform. Left click and drag to mark the
region on the waveform to zoom.
When turned on, you can perform horizontal
zoom on the waveform. Left click and drag to
mark the region on the waveform to zoom.
Clicking this icon pops up the context menu
which allows plot configuration.
menu is displayed for the plot window. It has the
following window options to select and
configure:
■
Save Plot Image
■
Save Plot Data
■
Configure Plot
■
Screen Cursors
■
Waveform Cursors
■
Zoom Drag Mode
■
Vertical Draw Box
■
Horizontal Draw Box
■
Zoom Options
Display/Hide Zoom
When clicked, zoomed values are displayed.
Settings
Minimize When clicked, minimizes the Plot view. It can be
maximized from Minimized containers displayed
at the top right of the application.
Close Close the plot window.
36 TekScope Anywhere™ Help
Page 51

Getting started with TekScope Anywhere
Zoom view of plots
You can zoom in to get a close-up view of a plot. The Zoom feature is used to
examine data at various scales. When you select Main > Zoom view in the
TekScope Anywhere, the display will have two views, the main screen displays
the close-up view of the plot. The inner (smaller) screen displays the complete
plot graph and a blue marker indicating the area zoomed. You can drag the plot
area to analyze using drag mode.
Zoom settings bar. When zoom is turned off, the settings bar displays the readout
marker values of plot X and Y. When zoom is turned on, the plot X and Y values
are displayed in the text box on the title bar. Clicking in the text box opens a UI
keypad to enter the zoom-in value.
You can perform X axis zoom from -1000Y to 1000Y and Y axis zoom from
-1000Z to 1000Z. Zoom settings bar for plots can be turned on/off from the plot
view title bar.
Figure 10: Zoom settings bar
Zoom by draw-a-box. You can initiate zoom by selecting one of the draw-a-box
modes (Zoom Drawbox Mode or Zoom Horizontal Drawbox Mode) and clickand-drag to area within the Plot view to zoom. The box drawn by selecting Zoom
Drawbox Mode performs vertical zoom of the waveform and by selecting Zoom
Horizontal Drawbox Mode performs Horizontal zoom of the waveform. The
zoom draw-a box icons are accessible on the title bar.
Figure 11: Zoom by draw-a-box
TekScope Anywhere™ Help 37
Page 52

Getting started with TekScope Anywhere
See also. Measurement units
Placing cursors on a plot
Cursors allow you to view numerical values associated with a plot based on
cursor locations. There are two types of cursors:
■
Waveform cursors
■
Screen cursors
Cursors in plot view
You can use cursors to read the coordinate where each cursor (line) touches the
plot and also view the difference (Δ) between the two cursors. The steps to use
cursors in a plot details window are:
1. Turn on the cursor from the Plot view title bar.
2. Select and drag cursors to move it to the desired area of the plot. The cursor
readout changes to reflect the cursor position.
TIP. You can quickly access cursors by right-clicking the plot view and selecting
cursors from the context menu.
See also. Cursor setup
38 TekScope Anywhere™ Help
Page 53

Getting started with TekScope Anywhere
Eye diagram
Create an Eye diagram by clicking the Create Eye Diagram button in the Main
tab and selecting a source.
Use the following sample steps to create and configure a TIE measurement, Eye
diagram plot:
1. Click Main > Open.
2. Navigate to C:\Users\Public\Tektronix\TekScope Anywhere\UserData, select
these files and then click the Open button:
■
8GPRBS7_70mV_500K_SSC_Ch1.wfm
■
8GPRBS7_70mV_500K_SSC_Ch3.wfm
3. Click Main > Add Math. By default basic Math will be defined with the
equation Ref1 (8GPRBS7_70mV_500K_SSC_Ch1.wfm) - Ref2
(8GPRBS7_70mV_500K_SSC_Ch3.wfm).
4. Click Main > Create Eye Diagram. Select the Source Type as Waveforms
and select the Math1 waveform from the drop-down list.
5. Click Create Eye Diagram. By default the TIE measurement will be added
and an Eye Diagram plot will be displayed for the waveform.
6. Click Plot Configure Options from the title bar of the plot view.
a. Select Clock Recovery method as PLL - Custom BW and PLL Model as
Type II
b. Select Loop BW and set 10 MHz as bandwidth
TekScope Anywhere™ Help 39
Page 54

Getting started with TekScope Anywhere
7. Eye Diagram plot is displayed.
TIP. Selecting the Source Type as Measurement allows you to add Eye Diagram
analysis for the selected measurement. The drop-down list displays the
measurements that support the Eye diagram plot.
40 TekScope Anywhere™ Help
Page 55

Operating basics
Overview of the application interface
After you have installed the necessary options, the TekScope Anywhere
application will launch the initial view with a default setup.
Figure 12: TekScope Anywhere (initial view)
The TekScope Anywhere application interface can be grouped into four major
areas that are used to analyze the waveform and document the results.
TekScope Anywhere™ Help 41
Page 56

Operating basics
Figure 13: TekScope Anywhere
1. Tabbed control bar (TCB)
2. Display area (containing View windows)
3. Measurement library
4. Global settings readout bar (GSRB)
TekScope Anywhere works best when your monitor is set to TrueColor 32-bit
color depth. If the monitor is set to TrueColor 16 bit color depth, the images
might not appear correctly and the application may stop working. The available
colors depend on the monitor and the graphic card drivers installed on the PC.
If the application is displaying distorted colors, set the monitor Color Depth to
32 bit using these steps:
42 TekScope Anywhere™ Help
Page 57

1. Click Start > Control Panel. Click the Adjust screen resolution link in
Appearance and Personalization category.
Operating basics
2. If you have more than one monitor connected, select the monitor from the
Display drop-down list and click the Advanced Settings link.
TekScope Anywhere™ Help 43
Page 58

Operating basics
3. In the popup window select the Monitor tab and select True Color (32 bit)
from the Colors drop down list. The screen may blackout for few seconds
before your settings are applied. Confirm your actions to make the changes
permanent.
44 TekScope Anywhere™ Help
Page 59

Tabbed control bar
Operating basics
The tabbed control bar uses four tabs: Main, File, Measurement, and Help. You
can minimize or maximize the tabbed control bar by clicking a tab or by clicking
the button at the left side of the control bar.
Main tab
The Main tab provides access to the most commonly used functions in the
application.
Open
The Open button displays the Open dialog box from which you can open
Waveform, Setup, or Session files. Select the type of file you want to open in the
left pane of the Open dialog box, navigate to the desired directory, and then select
and open the desired file(s).
Figure 14: Open dialog box – Waveform panel
Save
Clicking the Save button allows you to save the TekScope Anywhere application
data such as a screen image, waveform, setup, report or a session.
Save: First click opens the Save As dialog box. Subsequent clicks on the Save
button saves the data based on the last saved configuration.
Save As: Displays the Save As dialog box for selecting and configuring the type
of data to save.
TekScope Anywhere™ Help 45
Page 60

Operating basics
Figure 15: Save context menu
Add / Remove Waveforms
The Add/Remove Waveforms button displays a context menu that allows you to
add Reference or Math waveforms:
Waveforms On / Off: Toggle switch to turn on and off the display of the
waveforms that are opened in the application.
Create New Waveform: You can add Math and Ref waveforms using the Add
Math and Reference buttons respectively.
Figure 16: Add / Remove Waveforms context menu
Add Math
This button allows you to create a Math configuration. Clicking this button
inserts a new Math badge in the GSRB field. If two sources exist prior to
selecting the button a default Math waveform (Source 1 - Source 2) is created.
The associated Math settings context menu is also launched to configure the
Math.
Measure
Clicking this button displays a context menu giving you quick access to
frequently used measurements and the Measurement Library.
46 TekScope Anywhere™ Help
Page 61

Figure 17: Measure context menu
Operating basics
Results View
Click this button to display the Results panel of the Measurement Library.
Create Eye Diagram
Click the Create Eye Diagram button to create an eye diagram from any available
sources. Sources include the defined waveforms and the selected measurements
that have an Eye Diagram plot configuration.
Zoom
The Zoom button toggles the zoom on and off in the selected view, whether that
view is the Time Domain view or a Plot view.
Annotate
The Annotate button inserts a Screen text annotation object in the selected view.
The screen text feature allows you to annotate the graticule area. These notes are
placed at a specified x and y location within the selected view. An annotation can
be moved freely within the view in which it was created, but cannot be moved to
a different view window.
Default Setup
This button resets the TekScope Anywhere application to the system defaults.
TekScope Anywhere™ Help 47
Page 62

Operating basics
File tab
The File tab contains the controls for opening files, saving files, and a list of
recently accessed files.
Save
Click Save to save the TekScope Anywhere application data. The first time you
click the Save button, you will see the Save As dialog box. Subsequent clicks of
the Save button saves the data based on the last saved configuration.
Save As
Click Save As to save the TekScope Anywhere application data as a named file.
Clicking this icon launches the Save As dialog box. Use this dialog box to define
the type of data file you're creating.
Figure 18: Save As dialog box
Open
Recent Files
This button allows you to open recently used Session, Setup files, or Waveform
files. Clicking the icon opens a context menu, where you can select and open
recently used session, setup, and waveform files from the drop down lists. The
drop down lists show recently used files of each type.
48 TekScope Anywhere™ Help
Page 63

Figure 19: Recent Files context menu
Default Setup
This button resets the TekScope Anywhere application to the system defaults.
Operating basics
Measurement tab
The Measurement Tab provides access to a large number of frequently used
measurements without having to browse through the Measurement Library.
Frequently Used
Frequently Used icons provide quick access to frequently used measurements.
You can also select measurements By Category.
By Category
By Category organizes commonly used measurements by measurement
categories using Amplitude, Time, Jitter, and Eye buttons. Selecting one of these
buttons opens a context menu with the top six measurements for the associated
measurement type. The context menus also contain a More button that opens the
Measurement library to the tab containing all measurements in that category.
Measurement Library
Click this button to open the Measurement Library to the Select tab.
Results View
TekScope Anywhere™ Help 49
Page 64

Operating basics
Click this button to display the Results panel of the Measurement Library.
Help tab
Help
Clicking this button launches the application help file.
About
Click Help > About to view application details such as the release software
version number, application name, and copyright.
Install Options
Minimize views
Options are installed using a license validation procedure required by the
TekScope Anywhere application to enable features such as measurements. When
you install the application, by default no features are available.
For details about TekScope Anywhere options Click here.
For steps to install options Click here.
The Minimize button is available whenever one or more views have been
minimized. Clicking the button displays thumbnails with the name of minimized
items, and selecting the item maximizes the view. If a group is minimized, then it
is displayed as a group in the Minimize Tray and is restored as a group.
50 TekScope Anywhere™ Help
Page 65

Figure 20: Minimized containers
Operating basics
Display area (View window)
The display area displays waveforms with a horizontal time scale in the time
domain view. Non time domain waveforms are displayed in individually named
plot views. When a plot is added, an associated plot view is added to the display
area.
You can arrange and group views.
Undock a view from the application for even more flexibility. TekScope
Anywhere supports multiple monitors. A view area can be dragged to a second
monitor or expanded across displays.
Figure 21: Time domain view
TekScope Anywhere™ Help 51
Page 66

Operating basics
Figure 22: Plot view
See also
Time domain view
Window management - View window
This view displays time domain waveforms. There are two display modes in this
view:
■
Overlay mode draws the displayed waveforms in on top of each other.
Selecting a waveform badge causes that waveform to be drawn on top in the
Overlay mode.
■
Stacked mode shows the open waveforms stacked above each other for easy
horizontal comparison. You can toggle between the two modes based on the
required analysis.
When looking at edge crossings between two data signals, overlay mode may
be preferred. As the number of waveforms grows, stacked mode is typically
preferred.
Each waveform has a waveform handle, that can be used to move the waveform
vertically. Right-clicking the handle also provides easy access for configuring the
waveform.
52 TekScope Anywhere™ Help
Page 67

Operating basics
Figure 23: Time domain view – Stacked mode
Number Description
1 Window name – Time Domain View
2 Time Domain View options
3 Zoom on/off switch
4 Vertical scale
5 Horizontal scale
6 Waveform handle – Use to move the waveform vertically; right click to
access waveform settings
TekScope Anywhere™ Help 53
Page 68

Operating basics
Figure 24: Overlay mode
Plot view
When a plot is created from a measurement, it is displayed in an appropriately
named plot view.
When you select a Time trend plot for any measurement that has a time domain
source, the plot is added to Time Domain View and a Trend badge (Time Trend)
is added to the GSRB field. If a Time Trend is used as a source in subsequent
operations the horizontal scale may be in units other than time. When the scale is
something other than time the Time Trend will be drawn in a new, appropriately
named plot view.
54 TekScope Anywhere™ Help
Page 69

Operating basics
Figure 25: Plot view
Number Description
1 Plot name
2 Plot view options
3 Zoom on/off botton
4 Vertical scale
5 Horizontal scale
TekScope Anywhere™ Help 55
Page 70

Operating basics
Measurement library overview
To view the measurement library, click Measurement > Measurement Library.
The measurement library has panels to select measurements, configure
measurements, view measurement results, and configure plots for measurements.
The title bar of the Measurement Library has an Options button on the upperright. The Option button opens a context menu where you can Save Results or
configure Measurement Preferences.
Select panel: This panel displays measurements grouped by categories using
Amplitude, Time, Jitter and Eye tabs. Selecting a tab displays the licensed
measurements in that category. Clicking the button for a given measurement
creates the measurement and adds it to both the measurement table and the
measurement results table.
For convenience, the measurement table also appears in the Configure and Plots
panel. Right clicking a row in the measurement table displays a context menu
with choices to:
■
Delete the selected measurement
■
Delete all the measurements
■
Save the measurements results
■
Configure the measurement preferences
When a measurement is created it is defined with default parameters using the
currently selected source. To change the source, left click in the Source(s) cell of
the applicable measurement row.
To change the measurement name, double click in the Measurement cell and
enter a new name. When a measurement name has been changed the hover text
will show the measurement type appended to the new name.
Figure 26:
See Index of all measurements on page 119
56 TekScope Anywhere™ Help
Page 71

Operating basics
Configure panel: This panel displays the available configuration parameters for
the measurement selected in the measurement table. The number and type of
configuration tabs that are available depends on the type of measurement you
have selected.
Figure 27:
See Measurement configuration on page 133
Results panel: This panel displays the statistical results for all measurements in a
tabular format. You can drag both rows and columns of the table to customize
data display. Right clicking a row in the results table raises a context menu with
choices to:
■
Delete the selected measurement
■
Delete all the measurements
■
Save the measurements results
■
Open the measurement preferences dialog
Figure 28:
See View statistical results on page 181
Plots panel: This panel displays the measurement table, a plot table and a
selection of buttons for creating the types of plots available for the selected
measurement. Selecting a plot button creates a new plot view based on the
selected measurement view and adds that plot to the plot table. To change the
name of a plot, double click in Plot Type and enter a custom name. To delete one
or more plots, right click anywhere on a row in the plot table.
Figure 29:
See Plot usage on page 185
TekScope Anywhere™ Help 57
Page 72

Operating basics
Global Settings Readout Bar (GSRB)
The GSRB, at the bottom of the TekScope Anywhere window, shows the
properties of individual waveforms, the application time stamp and the status of
the TekScope Anywhere application.
The Global Settings Readout Bar (GSRB) has the following items:
■
Add/Remove Waveforms
■
Waveform badges
■
Status and Timestamp fields
Figure 30: Global Settings Readout Bar (GSRB)
Add / Remove waveforms
The Add / Remove Waveforms button is used to create Reference (Ref), Math,
and Analog waveforms. Clicking the Add / Remove Waveforms button displays a
context menu.
Waveforms On/Off: Toggle switch to turn On or Off the display of the
waveforms that are opened in the application. A new switch is added to the menu
when a new waveform is created. In the following image, there are three Math
waveforms being displayed and one reference waveform. All the waveform
switches are on.
Create New Waveform: You can add Math and Ref waveforms using the Math
and Reference buttons respectively.
Figure 31: Add/Remove Waveforms context menu
58 TekScope Anywhere™ Help
Page 73

Operating basics
GSRB badges
A GSRB waveform badge is a rectangular image displayed in the GSRB field.
The badge displays the applicable properties of an open waveform. Double
clicking a source badge selects the waveform and displays the configuration
context menu. Right-clicking a badge pops up a context menu for configuring or
deleting the associated waveform. A single click selects the associated waveform.
Ref badge
When a new Reference waveform is opened, a Ref badge is added to the GSRB
field. The badge displays a default identifier (Ref <n>), sample rate, and File
name of the waveform.
Math badge
When a new Math operation is defined, a Math badge is added to the GSRB field.
The badge displays a default identifier (Math <n>), vertical scale, horizontal
scale and the definition of the math operation.
Trend badge
When a new Time trend plot is created, a Trend badge is added to the GSRB
field. The badge displays a default identifier (Trend <n>), vertical scale, the name
of the measurement being plotted and the source of the measurement.
TekScope Anywhere™ Help 59
Page 74

Operating basics
Status and Time stamp
The application Status and Time/Date fields are displayed in the GSRB.
TIP. Double-click on a source badge to select the waveform and open the
associated configuration context menu. Single-click on a badge to select the
waveform.
See also. Ref badge context menu
Math badge context menu
Trend (Time trend) badge context menu
Timestamp badge context menu
Windows management - View window
The display area always has one Time Domain View. While this view can be
minimized, it cannot be deleted. In addition each Plot View occupies a separate
window. Views have basic window management behavior. They can be
rearranged within the application, undocked, resized, etc. Views can be grouped
together for window management convenience.
Active and inactive views
When multiple views are opened, the currently selected view is referred to as the
active view and all other views are inactive.
The appearance of the active view differentiates it from the other views. The
active view is outlined in white and the title text changes to white. The options
buttons such as zoom, view options and configuration appear in the title bar.
The title bar of the inactive view will show only options to minimize or close
view. The text is gray and so is the view outline.
60 TekScope Anywhere™ Help
Page 75

Operating basics
Figure 32: Active and inactive windows
See also. Time Domain View
Arrange views
Plot View
You can easily rearrange the views using the views title bar. To rearrange the
views, follow the steps:
TekScope Anywhere™ Help 61
Page 76

Operating basics
1. Click and hold the title bar of the display screen (in the image below, Eye
Diagram - TIE(Ref2)) to move to a new position.
The frame of the Eye Diagram - TIE(Ref2) display is highlighted to clearly
identify the view that is being moved.
62 TekScope Anywhere™ Help
Page 77

Operating basics
2. As the moving view comes into significant areas (based on the mouse
location) a blue docking hint is displayed.
TekScope Anywhere™ Help 63
Page 78

Operating basics
3. Release the mouse when the blue docking hint correctly shows where you
want to move the Eye Diagram window to, and the view is docked at the new
position.
64 TekScope Anywhere™ Help
Page 79

Operating basics
Resize window. A view can be resized by selecting and dragging a border. To
select a border, hover the border until the cursor changes to the double arrow.
Click and hold while dragging horizontally when adjusting a vertical border or
vertically when adjusting a horizontal border.
1.
2.
TekScope Anywhere™ Help 65
Page 80

Operating basics
3.
4.
66 TekScope Anywhere™ Help
Page 81

5.
Operating basics
Grouped views
See also. Time domain view
Plot view
Multiple views can be placed into a group that essentially becomes a mini
workspace. For example, it could be used to group views based on your
measurement needs. The displays in a grouped view can be viewed in either
Tabbed mode or Grid mode. The default is tabbed mode.
1. To create a Group view, simply drag a view until the docking hint fills the
destination window.
TekScope Anywhere™ Help 67
Page 82

Operating basics
2. Release the moving view to the group. Each view in the group appears in its
own tab.
Follow the same steps to add additional windows to the group.
Grouped view title bar
The group view title bar has a default group identifier, Group <n>, the standard
view, title bar buttons as well as switch between Tabbed view and Grid view. If
the group is in Grid view, then the title bar for the active display shows options
for that window only, instead of the group options. Group view options are
shown in the Group title bar.
Table 8: Title bar options
Icon Description
Tabbed view Switch the display to tabbed view.
Grid view Switch the display to Grid view.
Waveform cursors on/
off
Screen Cursors on/off
Zoom Drag Mode When clicked, you can drag the waveform in the
Zoom Dragbox Mode When clicked, you can perform vertical zoom on
When turned on, the cursor lines are displayed
on the screen. You can set the cursor points and
take measurements. Both cursor icons may not
be available for every view.
display screen.
the waveform. Left click and drag to mark the
region on the waveform to zoom.
68 TekScope Anywhere™ Help
Page 83

Icon Description
Zoom Horizontal
Dragbox Mode
Display/Hide Zoom
Settings
Plot Configure Options When clicked, the context menu for plot
Window Options When clicked, the window options context menu
Minimize When clicked, minimizes the Group view. It can
Maximize The Maximize button will only be available if the
Close Closes the view and removes the plot from the
When clicked, you can perform horizontal zoom
on the waveform. Left click and drag to mark the
region on the waveform to zoom.
When clicked, zoomed values are displayed.
configuration gets opened. The configuration
options available in the plot configuration context
menu varies based on the type of plot.
is displayed. The context menu will have the
time domain view options or the plot view
options for the time domain view or the plot view
respectively in a Group view.
be maximized from Minimized containers
displayed at the top right of the application.
grouped view is undocked from the Display
Area.
plot table.
Operating basics
Tabbed view
Tabs are a way of setting up a group that uses tabs to switch between views. The
interaction also works in the inverse. The tabs can be reordered by dragging the
tabs. A view can be dragged onto another and tab them together.
Figure 33: Tabbed view
TekScope Anywhere™ Help 69
Page 84

Operating basics
Grid view
Selecting Grid view allows multiple views to be displayed in a single view but
they can all be seen at the same time in the container. They may be stacked
horizontally or vertically. By default the stack is vertical.
Figure 34: Grid view
70 TekScope Anywhere™ Help
Page 85

Operating basics
Arranging the windows in the grid view of a Group
1. Click and hold the title bar of the display screen to move to a new position.
TekScope Anywhere™ Help 71
Page 86

Operating basics
2. Drag the display screen inside the group to see the docking hint.
3. Release the display screen on the dock-hint to position the screen.
72 TekScope Anywhere™ Help
Page 87

Operating basics
Undocking/Docking
display screen
You can undock the active display to a secondary monitor. To undock a display,
follow the steps:
1. Click and hold the title bar of the display you want to move (in the following
images, the Eye Diagram - TIE(Ref2) window).
The frame of the display is highlighted to show that the view is being moved.
TekScope Anywhere™ Help 73
Page 88

Operating basics
2. Drag the window outside the application and release the mouse to undock it
from the TekScope Anywhere window.
You can dock the display screen back to the application using the following
steps:
1. Click and hold the title bar of the undocked view.
74 TekScope Anywhere™ Help
Page 89

Operating basics
2. As the undocked display moves onto the application area (based on the
mouse location), a blue docking hint is displayed.
3. Release the mouse and the view is docked at the new position that was
indicated by the blue docking hint.
TekScope Anywhere™ Help 75
Page 90

Operating basics
UI keypad
Double-click the input text box to use the virtual keypad to enter alphanumeric
values.
Mouse scroll wheel
The mouse scroll wheel can be used to roll values, to select the items from the
list, or to navigate between panels or tabs.
■
When a numerical input box is selected, rolling the scroll wheel increases or
decreases the numerical value.
■
When a drop-down list is selected, rolling the scroll wheel navigates the list
to select.
■
When a panel or tab is selected, rolling the scroll wheel switches between the
open panels or tabs.
76 TekScope Anywhere™ Help
Page 91

GSRB badge context menu
Add / Remove waveforms
The Add / Remove Waveforms button is used to create Reference (Ref), Math,
and Analog waveforms. Clicking the Add / Remove Waveforms button displays a
context menu.
Waveforms On/Off: Toggle switch to turn On or Off the display of the
waveforms that are opened in the application. A new switch is added to the menu
when a new waveform is created. In the following image, there are three Math
waveforms being displayed and one reference waveform. All the waveform
switches are on.
Create New Waveform: You can add Math and Ref waveforms using the Math
and Reference buttons respectively.
Figure 35: Add/Remove Waveforms context menu
TekScope Anywhere™ Help 77
Page 92

GSRB badge context menu
Ref badge context menu
The waveform files acquired on an oscilloscope can be opened in TekScope
Anywhere as reference waveform for offline analysis. The Ref waveform badge
is displayed in the GSRB field. Double clicking a badge selects the waveform
and opens the configuration context menu. Right-clicking a badge displays a
context menu for configuring or deleting the associated waveform.
If the reference waveform is a time domain waveform, the context menu has
these options.
Figure 36: Ref badge context menu - Time domain waveform
Table 9: Ref badge context menu - Time domain waveform
Item Description
Ref <no> On/Off toggle switch
Vertical Scale Text entry field to set vertical scale
Label Text entry field for the Ref waveform
Position Numeric entry field that only affects the display of data
Set to 0 Button to set the position to 0 for Ref waveform
Reference File Displays the path and filename of the waveform
Clicking the field displays the drop-down list of recently opened waveform
file names
Browse Clicking this opens the context menu to navigate to the directory, select
and open the waveform file
Sample Rate The sample rate of the waveform (display only)
Record Length The record length of the waveform (display only)
78 TekScope Anywhere™ Help
Page 93

GSRB badge context menu
Item Description
Deskew Text entry field to set the deskew
Set to 0 Button to set the deskew to 0
If the Ref <no> is a non-time domain waveform source, the context menu allows
you to select the waveform file.
See also
Figure 37: Ref badge context menu (not a time domain waveform)
Opening a reference waveform
Math settings
TekScope Anywhere™ Help 79
Page 94

GSRB badge context menu
Math badge context menu
Math waveforms are the vectors obtained by performing mathematical operations
between any two waveforms or on a single waveform. When the Add Math
button is clicked, the Math waveform badge is displayed in the GSRB field.
Double clicking a badge selects the waveform and opens the configuration
context menu. Right-clicking pops up a context menu for configuring or deleting
the associated waveform.
If the Math vector is a time domain waveform, the context menu has the
following configuration options.
Figure 38: Math badge context menu - Time domain waveform
Table 10: Math badge context menu
Item Description
Math <No> On/Off toggle switch.
Vertical Scale Numeric input field for vertical scale parameters. The vertical scale can
be changed directly in the field or with the up and down buttons.
Label Text entry field used to place a label on the Math waveform.
Position Numeric input field used to change the vertical position of the waveform.
Set to 0 Button to set the waveform position to 0.
Math Type: Basic
Function The Drop-down list that displays the predefined math functions. The
default is Subtraction.
80 TekScope Anywhere™ Help
Page 95

GSRB badge context menu
Item Description
Source 1 Select the waveform to be used as source 1 from the drop-down list. The
list has all the available waveform sources except the math waveform
being configured.
Source 2 Select the waveform to be used as source 2 from the drop-down list. The
list has all the available waveform sources except the math waveform
being configured.
Math Type: Advanced
Clear Clears the expression from the Math<n> combo box.
Math <n> Combo box for entering a math expression. It also displays a drop down
list showing the last 20 math expressions.
Cancel Discards and closes the context menu.
Apply Parses the expression. If the expression is valid, the expression is
evaluated and the waveform is updated.
If the expression is invalid, then:
■
The incorrect expression remains in the expression box.
■
An error message is shown that indicates the location of the error
(line#:char#) and provides detail about the error when known.
See also
OK Parses, evaluates, and closes the context menu. If the Math expression
is invalid, the math is not displayed.
Math Type: FFT
Source Select the source from the drop-down list. The list has all the waveform
sources except the current math.
If the resultant math waveform is not a Time domain waveform, then the Math
badge context menu does not have Vertical Scale and Position settings for
waveform.
Math settings - Advanced
Math settings - FFT
TekScope Anywhere™ Help 81
Page 96

GSRB badge context menu
Trend (Time trend) badge context menu
When you select Time Trend from the Plots panel of the Measurement Library,
the Trend badge is displayed in the GSRB field. Double clicking a badge selects
the plot and opens the configuration context menu. Right-clicking pops up a
context menu for configuring or deleting the plot.
Figure 39: Trend (Time trend) badge context menu
Table 11: Trend (Time trend) badge context menu
Configuration Description
Trend <no> On/Off toggle switch
Vertical Scale Numeric input field to set vertical scale
Label Text entry field for the Time trend plot
Position Numeric entry field that only affects the display of data
Set to 0 Button to set the position to 0 for reference waveform
Save Plot Data Opens Save Plot Data context menu
NOTE. If the Time trend plot measurement includes a time component, then it will
be displayed in Time domain view.
82 TekScope Anywhere™ Help
Page 97

GSRB badge context menu
Date and Time Settings context menu
Double-clicking the date and time in the lower right part of the GSRB field opens
the configuration context menu. If the timestamp badge is not visible, right-click
the lower-left corner of the application window and turn On the Display Date and
Time toggle switch.
Figure 40: Date and Time Settings context menu
See also
Table 12: Context menu options
Item Description
Display Date and Time When this toggle switch is turned on, Date and Time is displayed. If
turned off, the Date and Time field is removed from the GSRB field. To
turn it back on, right-click (or double-click) in the lower-left corner of the
application window and turn the date and time display on using the toggle
switch in the menu.
Time Format Select 12 hour or 24 hour time format.
Time Zone Select the time zone (region).
Waveform badges
TekScope Anywhere™ Help 83
Page 98

GSRB badge context menu
84 TekScope Anywhere™ Help
Page 99

Math
Basic Math
Math waveforms are the vectors obtained by performing mathematical operations
on waveforms. With TekScope Anywhere, you can perform three types of Math
operations:
1. Basic Math where you can select predefined math functions from the dropdown list.
2. Advanced Math where you can define math expressions by entering math
equations into the combo box.
3. Fast Fourier Transform (FFT) Math where you can create a FFT magnitude
waveform.
Basic Math allows you to perform basic mathematical operations on the source
waveform by selecting from among a list of predefined functions.
■
Addition (+)
■
Subtraction (-)
See also
SDLA
■
Multiplication (*)
■
Common Mode (Source 1 + Source 2) / 2
■
Integral
■
Derivative
■
SDLA
■
ArbFlt
Math settings - Advanced
Math settings - FFT
The Tektronix SDLA Visualizer software (opt. SDLA64) running on a Tektronix
oscilloscope can create filter files that can then be used in TekScope Anywhere.
These filters can be used to de-embed or embed channel effects or to apply CTLE
equalization.
Save these files in the same location that sample filters are installed: C:\Users
\Public\Tektronix\TekScope Anywhere\UserData\Math Arbitrary Filters, and
then apply them in TekScope Anywhere.
Choosing SDLA allows you to apply a filter for the waveform or waveforms for
the selected input mode.
See SDLA use cases.
TekScope Anywhere™ Help 85
Page 100

Math
Figure 41: SDLA settings
Item Description
Function - SDLA
Type
Source 1 Select the waveform to be used as the source 1 waveform from
Source 2 Select the waveform to be used as the source 2 waveform form
Filter File 1 Browse and select the filter file for source1
Filter File 2 Browse and select the filter file for source2
Clear Removes the selected filter file
■
Single Input
■
Dual Input Differential
■
Dual Input Common
■
Dual Input Single Ended
the drop-down list. The list has all the available waveform
sources except the Math waveform being configured.
the drop-down list. The list has all the available waveform
sources except the Math waveform being configured.
See also. SDLA use cases
86 TekScope Anywhere™ Help
 Loading...