

Page 1

Online Help
TDSVNM CAN and LIN Timing and Protocol
Decode Software
077-0017-00
www.tektronix.com
Page 2

Page 3

Copyright
Copyright © Tektronix, Inc. All rights reserved. Licensed software products
are owned by Tektronix or its suppliers and are protected by United States
copyright laws and international treaty provisions.
Tektronix products are covered by U.S. and foreign patents, issued and
pending. Information in this publication supercedes that in all previously
published material. Specifications and price change privileges reserved.
TEKTRONIX and TEK are registered trademarks of Tektronix, Inc.
TDSVNM CAN and LIN Timing and Protocol Decode Software Online Help
Version 3.0.0, 076-0048-00.
Contacting Tektronix
Tektronix, Inc.
14200 SW Karl Braun Drive or P.O. Box 500
Beaverton, OR 97077 USA
For product information, sales, service, and technical support:
In North America, call 1-800-833-9200.
Worldwide, visit www.tektronix.com to find contacts in your area.
Page 4

Page 5

Table of Contents
Copyright ......................................................................................................................................... 1
Contacting Tektronix ............................................................................................................... 1
Table of Contents.............................................................................................................................. i
General Safety Summary ................................................................................................................. v
Introduction...................................................................................................................................... 1
About TDSVNM CAN and LIN Timing and Protocol Decode Software ............................... 1
Using Online Help ................................................................................................................... 2
Application Description ........................................................................................................... 2
Applications................................................................................................................... 2
Features.......................................................................................................................... 3
Easy System Integration ................................................................................................ 3
Network Management ................................................................................................... 4
Monitoring Multiple Protocols ...................................................................................... 5
Protocol Decoding ......................................................................................................... 5
About the ATM-1 Automotive Trigger Module ...................................................................... 6
Application Environment .............................................................................................. 6
Trigger Module Connections......................................................................................... 6
Buses and Bus Connections........................................................................................... 7
Printing from the Online Help ................................................................................................. 8
Conventions ............................................................................................................................. 8
Updates from the Web Site ...................................................................................................... 8
Feedback ............................................................................................................................... 9
Getting Started ............................................................................................................................... 11
Compatibility ......................................................................................................................... 11
Recommended Accessories.................................................................................................... 11
Starting the Application ......................................................................................................... 11
Requirements and Restrictions............................................................................................... 12
Maximizing and Minimizing the Application........................................................................ 12
Returning to the Application.................................................................................................. 13
Exiting the Application .......................................................................................................... 13
Application Directories and Usage ........................................................................................ 13
Operating Basics ............................................................................................................................ 15
Protocol Decoding and Timing Analysis Tests...................................................................... 15
TDSVNM Application View ................................................................................................. 16
Menus ............................................................................................................................. 16
File Menu..................................................................................................................... 16
Tests Menu .................................................................................................................. 17
Results Menu ............................................................................................................... 17
TDSVNM Timing and Protocol Decode Software i
Page 6

Table of Contents
Utilities Menu.............................................................................................................. 18
Help Menu ................................................................................................................... 18
Selection Panel....................................................................................................................... 18
Control Panel ......................................................................................................................... 19
Status Bar ............................................................................................................................. 20
Setting Preferences................................................................................................................. 20
Virtual Keyboard.................................................................................................................... 21
How to ........................................................................................................................................... 25
Select ............................................................................................................................. 25
Protocol and Timing Analysis Tests............................................................................ 25
Configure ............................................................................................................................. 26
Configure Protocol ...................................................................................................... 26
Configure CAN Protocol ............................................................................................. 28
Configure LIN Protocol............................................................................................... 30
Configure CAN and LIN Protocol............................................................................... 32
Timing Analysis Tests................................................................................................. 34
Configure Oscillator Tolerance ................................................................................... 36
Configure Eye Diagram............................................................................................... 37
Configure Bus Traffic.................................................................................................. 39
Configure Data Rate .................................................................................................... 40
Configure Wakeup Time ............................................................................................. 41
Configure Propagation Delay ...................................................................................... 42
Set up Trigger ........................................................................................................................ 43
Set up Trigger .............................................................................................................. 43
Trigger CAN and CAN/LIN Protocol ......................................................................... 47
Trigger LIN Protocol ................................................................................................... 49
Trigger for Oscillator Tolerance, Eye Diagram, and Data Rate .................................. 49
Trigger Bus Traffic...................................................................................................... 51
Trigger Wakeup Time ................................................................................................. 53
Trigger Propagation Delay .......................................................................................... 54
Define Elementary Trigger Events .............................................................................. 54
Define Logical Trigger Events .................................................................................... 58
Define Advanced Trigger Events ................................................................................ 61
Connect ............................................................................................................................. 65
Connections for Protocol and Timing Tests ................................................................ 65
Connections for CAN Dual Wire ................................................................................ 66
Connections for CAN and LIN Protocols.................................................................... 75
View Results .......................................................................................................................... 76
Results Window........................................................................................................... 76
Protocol Analysis Window.......................................................................................... 77
Results for CAN Protocol............................................................................................ 85
Results for LIN Protocol.............................................................................................. 87
ii TDSVNM Timing and Protocol Decode Software
Page 7

Table of Contents
Results for CAN and LIN Protocols............................................................................ 88
Results for Eye Diagram.............................................................................................. 89
Eye Diagram Plot......................................................................................................... 91
Results for Oscillator Tolerance .................................................................................. 92
Results for Data Rate................................................................................................... 93
Results > Details.......................................................................................................... 93
Results for Bus Traffic ................................................................................................ 94
Results for Wakeup Time ............................................................................................ 95
Results for Propagation Delay..................................................................................... 96
Install ATM-1 License ...........................................................................................................97
ATM-1 License Installation......................................................................................... 97
References...................................................................................................................................... 99
Shortcut Keys......................................................................................................................... 99
Error Messages..................................................................................................................... 100
Default Settings Part I .......................................................................................................... 103
Default Settings Part II......................................................................................................... 106
Measurement Algorithms..................................................................................................... 108
CAN Protocol ............................................................................................................ 108
LIN Protocol.............................................................................................................. 109
Oscillator Tolerance .................................................................................................. 110
Eye Diagram.............................................................................................................. 111
Data Rate ................................................................................................................... 111
Bus Traffic................................................................................................................. 112
Wakeup Time ............................................................................................................ 113
Propagation Delay ..................................................................................................... 113
Index ........................................................................................................................................ 115
TDSVNM Timing and Protocol Decode Software iii
Page 8

Table of Contents
iv TDSVNM Timing and Protocol Decode Software
Page 9

General Safety Summary
Review the following safety precautions to avoid injury and prevent damage
to the measurement instrument or any products connected to it. To avoid
potential hazards, use the software and measurement instrument only as
specified.
While using this software, you may need to access other parts of the system.
Read the General Safety Summary and specification sections in other
equipment manuals for warnings, cautions, and ratings related to operating
the system with this software.
To avoid Fire and Personal Injury
Connect and Disconnect Properly. Connect the probe output to the
measurement instrument before connecting the probe to the circuit under test.
Disconnect the probe input and the probe ground from the circuit under test
before disconnecting the probe from the measurement instrument.
Observe All Terminal Ratings. To avoid fire or shock hazard, observe all
ratings and markings on the measurement instrument and other equipment
used with this software. Consult the individual product manuals for further
ratings information before making connections to the circuit under test.
Do Not Operate With Suspected Failures. If you suspect there is damage to
the measurement instrument or other equipment being used with this
software, have it inspected by qualified service personnel.
Terms in this Manual
These terms may appear in this manual:
WARNING. Warning statements identify conditions or practices that could
result in injury or loss of life.
CAUTION. Caution statements identify conditions or practices that could
result in damage to the measurement instrument or other property.
TDSVNM Timing and Protocol Decode Software v
Page 10

General Safety Summary
vi TDSVNM Timing and Protocol Decode Software
Page 11

Introduction
About TDSVNM CAN and LIN Timing and Protocol
Decode Software
The TDSVNM CAN and LIN Timing and Protocol Decode Software is a low
speed serial bus test software program for CAN and LIN buses that run on
Tektronix oscilloscopes. The software helps to decode CAN and LIN
protocol messages simultaneously, set trigger conditions based on the CAN
bus message, capture data for specific conditions of the in-vehicle network,
decode and display the captured CAN and LIN messages, and analyze the
displayed frames. TDSVNM offers timing analysis tests that help
characterize CAN node performance.
The TDSVNM CAN and LIN Timing and Protocol Decode Software offers
the following:
Protocol Decoding
CAN bus
LIN bus
CAN & LIN buses
CAN Timing Tests
Eye Diagram
Oscillator Tolerance
Data Rate
Bus Traffic
Wakeup Time
Propagation Delay
TDSVNM Timing and Protocol Decode Software 1
Page 12

Introduction
Using Online Help
The TDSVNM CAN and LIN Timing and Protocol Decode Software online
help serves as a reference for using the TDSVNM CAN and LIN Timing and
Protocol Decode Software.
Contents: The Contents tab displays books and pages that represent the
categories of information in the online Help system.
Index: The Index tab displays a multi-level list of keywords and keyword
phrases. These terms are associated with topics in the Help system and direct
you to specific topics.
Search: The Search tab enables you to search for keywords in the Help
system and to locate topics containing those words. When the search is
completed, a list of topics is displayed so you can select a specific topic to
view.
Back and Forward: The Back and Forward buttons allow you to browse
through topics.
To print a topic: Select the Print button from the Help Topics menu bar.
Application Description
Applications
Some typical applications while developing, integrating, operating, and
updating the CAN and LIN network are as follows:
Easy System Integration: Adding new features to existing in-vehicle
networks often results in adding new CAN nodes (devices). While integrating
a new CAN node, there is a need to ensure that the CAN node is
synchronized for seamless network operation. The oscillator tolerance and
propagation delay measurements help to locate any network synchronization
problems.
CAN/LIN network management: An in-vehicle network in a car enables
communication between auto body parts such as doors, seats, dashboard,
airbag, and engine parts such as the engine, steering, and gear box. A tool that
helps to monitor the communications between different segments of the
vehicle network is needed.
Protocol Decoding: The performance of an existing in-vehicle network is
improved by enhancing the software in upper layers of the OSI model. This
involves updating the existing vehicle firmware and testing its performance.
Monitor multiple protocols: An in-vehicle network is heterogeneous. Based
on the cost and performance of a node, automotive manufacturers use
different networks and integrate them using gateways.
2 TDSVNM Timing and Protocol Decode Software
Page 13

Introduction
Features
TDSVNM CAN and LIN Timing and Protocol Decode Software offers the
following features and benefits:
Oscillator Tolerance and Propagation Delay measurements help in
addressing network synchronization issues
Simultaneous protocol decoding of CAN and LIN messages helps in
ensuring communication accuracy and acceptable latency between the
two segments of the network
Ability to link decoded and time-stamped CAN messages to its timing
waveform to clearly visualize bus functions
Integrated search functions help to efficiently debug network problems
in the data link layer
CAN Eye diagram analysis quickly locates noise in the CAN message
caused by jitter, amplitude aberration, spikes and glitches
Bus Traffic measurement helps in optimizing network performance and
bus utilization for different CAN message frames
Support for various CAN configurations: CAN single wire, CAN Dual
wire, CAN fault tolerant makes TDSVNM useful for a wide range of
CAN signaling types
Speedy network debug by setting trigger conditions based on CAN
message content such as ID, DATA and DLC
Setting trigger conditions to detect overload, passive error, active error
and remote frames helps to quickly identify CAN network
communication errors
Powerful conditional triggers such as if-then-else enable users to
monitor the CAN network and efficiently capture intermittent or
occasional events
Characterize long duration network timing performance by triggering on
the nth occurrence of a specific CAN message or triggering only after a
user specified time has elapsed
Ability to generate ACK Bit removes the need for a receiving CAN node
while testing a single CAN node
Capability to use the DPO-CAN Bus Trigger feature
Easy System Integration
CAN and LIN nodes are connected to form an in-vehicle network. CAN is a
serial, asynchronous, and multi-master communication network. The data is
transmitted from one CAN node to another CAN node with overhead and
payload. The receiving node samples the incoming data using the internal
TDSVNM Timing and Protocol Decode Software 3
Page 14

Introduction
clock. The oscillator, which resides in each CAN node, generates the internal
clock. The sample point is programmed at an appropriate bit interval such
that data from a distant node is interpreted accurately. The sample point can
be programmed anywhere between 20% and 90% of the bit time. The sample
point position depends on the following:
Oscillator tolerance of the receiving CAN node
Propagation delay from the transmitting node to the receiving node
If the sample point is set at 50% of the bit time, you may be limited to using
short cables for the network. If the sample point is set at 80% of the bit time,
you may be able to use longer cables. This requires a very high tolerance
oscillator, which generates the sampling clock. A low tolerance oscillator
may cause sampling beyond the bit time and wrong interpretation of the data
by the CAN node.
It is apparent that a low tolerance oscillator is not compatible with long cable
length. Oscillator tolerance also varies with the operating temperature and
age of the CAN network.
New nodes are added to the existing network to add more features to the
vehicle. During system integration, you need a tool that allows you to
synchronize the new CAN node by setting an appropriate sample point
location in the bit time, based on the oscillator tolerance of the CAN nodes
and propagation delay of the network.
TDSVNM is a tool that helps in characterizing the oscillator tolerance and
propagation delay of the CAN network. TDSVNM helps to easily integrate
an in-vehicle network and add new CAN nodes to the existing network.
Network Management
CAN and LIN network enables the communication between doors, seats,
dashboard, airbag, and engine parts. The communication needs to be efficient
and timely between the CAN and LIN nodes. To measure the effectiveness of
the communication, you need to capture the physical layer activity using an
oscilloscope. This data will be in the YT format, which is difficult to
interpret. Analyzing a YT waveform is time consuming and prone to errors.
You might want to view the YT data in hexadecimal, binary, or decimal
format.
Each CAN node expects to communicate in a timely manner. This
requirement becomes critical for the safety bus, since it controls the airbag
and ABS. To characterize this part of the communication, you need a tool
that allows you to measure the time difference between the communication of
the node that provides input and the nodes that respond to the input.
An in-vehicle network manages combustion, emission, safety and comfort
needs of the vehicle by continuous communication. For reliable operation of
the CAN and LIN, network traffic needs to be monitored for a long time.
4 TDSVNM Timing and Protocol Decode Software
Page 15

Introduction
Monitoring Multiple Protocols
An in-vehicle network is heterogeneous. Based on performance requirements
and the cost of a node, automotive manufacturers use different networks and
integrate those using gateways. Two dominant networks are CAN and LIN.
In a CAN network, different data speeds are used based on the application of
that segment of the network. In many cases there could be communication
across the two-segment networks through a gateway. You need to ensure that
communication across the gateway is accurate and timely. To characterize
this, you need tools that would provide simultaneous decoding of the data for
each segment of the network.
A typical example for a CAN-LIN network is as shown in Figure 1-1:
Figure 1-1: Example of a CAN-LIN network
In this application, design engineers and system integration engineers would
need to monitor the LIN and CAN protocol across the gateway. In the
picture, the gateway is an ECU that converts LIN to CAN protocol and vice
versa. Engineers need to monitor the delays in the two-way communication
between the CAN and LIN network. This is because each of the segments of
the network operates at different speeds. The delay between the CAN and
LIN gateway would affect the movement of the gears that control the
headlight position.
Protocol Decoding
The performance of an automotive, medical electronics or industrial
automation network is improved by enhancing the software in upper layers of
the OSI model. This involves updating the existing vehicle firmware and
testing its performance. During firmware update, you need to monitor the
physical layer activity of the CAN in hexadecimal, binary or decimal format,
and then optimize the performance of the network.
TDSVNM Timing and Protocol Decode Software 5
Page 16

Introduction
About the ATM-1 Automotive Trigger Module
The ATM-1 Automotive Trigger Module monitors the CAN bus protocol and
provides an output signal to trigger a Tektronix oscilloscope when a userspecified bus condition occurs.
The ATM-1 automotive trigger module is manufactured by Crescent Heart
Software (CHS). Refer to www.c-h-s.com for contact information.
The ATM-1 monitors the behavior of the bus to which it is connected, and
can also send signals to the bus in specific situations (for example, to
optionally signal an acknowledge on the CAN bus).
The ATM-1 functions as an addition to an oscilloscope, enabling the
oscilloscope to be triggered when a complex signaling situation occurs on the
bus. The ATM-1 can track and produce a trigger signal as a result of
signaling conditions that are too complex for the oscilloscope to trigger on.
Such complex signaling conditions occur as a result of the multiple levels of
signaling protocol implemented on the CAN bus.
The ATM-1 is packaged in an aluminum metal case with front and rear-panel
signal input and output connectors.
Application Environment
An oscilloscope uses standard probes to monitor the electrical activity of the
bus signal(s). For single wire buses, the signal voltage is determined relative
to the system ground. For dual wire buses, which use differential signaling,
the differential voltage is determined using either a differential probe or two
conventional (non differential) probes with the algebraic voltage difference
mathematically computed by the oscilloscope.
The ATM-1 also connects to the bus signal(s), allowing the module to
monitor the logical behavior of the bus.
Trigger Module Connections
A D-SUB 25-pin male connector on the front panel of the ATM-1 accepts the
bus signals to be monitored. Connecting the bus signals to the ATM-1
requires wiring the 25-pin female mating connector provided with the unit, or
using the optional companion cable assembly.
The ATM-1 produces a TTL-compatible 50-Ω back-terminated trigger output
through a BNC connector on the rear panel of the unit; use the standard 50-Ω
BNC cable provided with the ATM-1 to connect the ATM-1 trigger output to
a trigger input on the oscilloscope. The trigger state machine of the ATM-1
creates an output signal on the trigger output according to user-specified
trigger events.
6 TDSVNM Timing and Protocol Decode Software
Page 17

Introduction
The ATM-1 can be connected to the oscilloscope using the USB port on the
rear panel of the unit. Through this connection, the application software
running on the oscilloscope can set up trigger conditions, control, and
monitor the trigger module.
The bicolor (yellow/green) LED on the ATM-1 front panel indicates the
presence of power, the status of the USB connection, and certain error
conditions.
Buses and Bus Connections
The current version of the ATM-1 firmware supports following versions of
CAN bus:
CANH, CANL: High- or medium-speed CAN bus differential signals,
In/Out
FTCANH, FTCANL: Fault-tolerant low-speed CAN bus differential
signals, In/Out
SWCAN: Single-wire CAN bus signal, In/Out
TDSVNM Timing and Protocol Decode Software 7
Page 18

Introduction
Printing from the Online Help
While using the online help, you can print topics and information from the
HTML Help viewer.
To print a single topic:
1. Find the topic in the Contents pane.
2. Click Print.
3. Click Print the selected topic and click OK.
To print all topics in a selected TOC book:
4. Find the TOC book in the Contents pane.
5. Click Print.
6. Click Print the selected heading and all subtopics and click OK.
Some online help topics have color in the examples of the displayed
application. If you want to print this type of topic on a monochrome printer,
some colors may not print. To avoid this problem, print the topic from the
PDF file that corresponds to the online help. You can find this file in the
Documents directory on the Optional Applications Software on WindowsBased Oscilloscopes CD-ROM. The application menus in the PDF file are
gray scale and all the information can be printed.
Conventions
Online help uses the following conventions:
When steps require a sequence of selections using the application
interface, the ">" delimiter marks each transition between a menu and an
option. For example, File > Minimize.
DUT refers to the transmitter of the signal to be tested.
Updates from the Web Site
You can find information about this and other applications at the Tektronix
Inc. Web site, www.tektronix.com. Check this site for firmware updates and
other information about our application.
8 TDSVNM Timing and Protocol Decode Software
Page 19

Feedback
Introduction
Tektronix values your feedback on our products. To help us serve you better,
please send us your suggestions, ideas, or comments on the application.
Direct your feedback using email to techsupport@tektronix.com or tdsvnmfeedback@tek.com. You can also send feedback by FAX to (503) 627-5695.
Please include the following information and be as specific as possible.
General information:
Instrument model number and hardware options if any, with serial
number
Probes used
Your name, company, mailing address, phone number, FAX number,
email address
Please indicate if you would like to be contacted by Tektronix about
your suggestion or comments
Application specific information:
Software version number
Description of the problem such that technical support can duplicate the
problem
The setup file of the oscilloscope and the application is also required to
identify the problem
If possible, save the waveform on which you are performing the
measurement as a .wfm file
Note: To find the Software version number, click Help > About in the
application.
Once you have gathered this information, you can contact technical support
by fax or through email. If using email, be sure to enter "TDSVNM Software
Problem" in the subject line, and attach the .wfm files.
You can then attach the file to your email (depending on the capabilities of
your email editor).
TDSVNM Timing and Protocol Decode Software 9
Page 20

Introduction
10 TDSVNM Timing and Protocol Decode Software
Page 21

Getting Started
Compatibility
For information on oscilloscope Compatibility, refer to the Optional
Applications Software on Windows-Based Oscilloscopes Installation Manual,
Tektronix part number 071-1888-00. The manual is also available as a PDF
file.
Recommended Accessories
The following probes are supported by the application:
P5205
P5200
P6246
P6247
P6248
ADA400A
TCA-1MEG, probe adapter for use with supported oscilloscopes
TPA-BNC, TEKPROBE™ BNC adapter for use with supported
oscilloscopes
Starting the Application
Depending on the type of oscilloscope that you have, you can start the
software in the following way:
1. To start the application, do one of the following:
• Select File > Run Application > in the oscilloscope menu bar. Then
select CAN and LIN Timing and Protocol Decode Software
• Select App > CAN and LIN Timing and Protocol Decode Software
• Select Analyze > CAN and LIN Timing and Protocol Decode
Software
2. A splash screen indicates that the software loading is in progress.
3. The oscilloscope display resizes to fit in the upper part of the screen.
The lower part of the oscilloscope screen displays the TDSVNM CAN
and LIN Timing and Protocol Decode Software.
TDSVNM Timing and Protocol Decode Software 11
Page 22

Getting Started
4. The software is automatically set to its default settings.
5. If you gain access to the oscilloscope functions, then the oscilloscope
display appears full screen and the TDSVNM CAN and LIN Timing and
Protocol Decode Software recedes to the background.
6. To return to the TDSVNM CAN and LIN Timing and Protocol Decode
Software, do one of the following:
• Select App on the top right of the oscilloscope display
• Select App > Restore Application
• Select Analyze > Restore Application
Requirements and Restrictions
Requirements
DPO-CAN Bus trigger is required:
To define Elementary Trigger
To carry out the Oscillator Tolerance, Eye Diagram, and Data Rate
tests
The ATM-1 Automotive Trigger Module is required:
To specify trigger conditions and perform elementary, logical or
advanced triggering during protocol decoding
To carry out the Oscillator Tolerance, Eye Diagram, and Data Rate
tests
The ATM-1 Automotive Trigger Module can be ordered from Crescent Heart
Software (www.c-h-s.com). Contact a Tektronix representative for more
details.
Restrictions
It is recommended that you do not connect more than one ATM-1 module to
an oscilloscope.
Maximizing and Minimizing the Application
The software appears even when you minimize the oscilloscope display.
To minimize the software, click File > Minimize. The TDSVNM CAN
and LIN Timing and Protocol Decode Software window minimizes to
the Windows taskbar. The upper part of the screen has the oscilloscope
display and the lower part of the screen has the desktop.
To restore the minimized window to its previous size, click its taskbar
button.
12 TDSVNM Timing and Protocol Decode Software
Page 23

To hide the window, click on the top-right of the software
window.
Returning to the Application
When you gain access to the oscilloscope functions, the oscilloscope fills the
display. You can access the oscilloscope functions in the following ways:
Choose either the menu bar or the toolbar mode on the oscilloscope, and
then gain access to the menus.
Click App > Restore Application or click APP on the top right of the
oscilloscope display to return to the software.
Exiting the Application
To exit the software:
Getting Started
1. On the menu bar, click File > Exit or click
2. The Exit dialog box appears.
3. Click either Yes, No, or Cancel. Yes is selected by default. When the
software runs, it automatically changes some oscilloscope settings.
When you quit the software, you can choose whether to retain these
settings or restore the previous settings.
Application Directories and Usage
The TDSVNM CAN and LIN Timing and Protocol Decode Software uses
directories to save and recall setup files and uses file name extensions to
identify the file type. Table 2-1 lists the default directory names.
Table 2-1: Directory names and their use
Default directory names* Directory use
C:\TekApplications\TDSVNM TDSVNM application home location
\Images Plot files
\Reports Results of protocol decoding
\Setup Setup files for TDSVNM
\Temp Temporary files
*All subdirectories are located in the C:\TekApplications\TDSVNM directory.
.
TDSVNM Timing and Protocol Decode Software 13
Page 24

Getting Started
14 TDSVNM Timing and Protocol Decode Software
Page 25

Operating Basics
Protocol Decoding and Timing Analysis Tests
The TDSVNM CAN and LIN Timing and Protocol Decode Software offers
the tests as shown in Table 3-1:
Table 3-1: Descriptions of protocols and tests
Protocol or Test Description
CAN bus (Controller Area
Network)
LIN Bus (Local Interconnect
Network)
CAN and LIN Decodes and displays the waveform acquired simultaneously on CAN and LIN buses.
Eye Diagram Represents the overlaying of the individual NRZ bits of a CAN message. This allows
Oscillator Tolerance Measures the deviation of the oscillator deduced from the transmitted data. This
Data Rate Extracts the data rate of the selected node based on the ID from the acquired CAN
Bus Traffic Determines the load of the CAN message on the CAN bus network expressed as
Wakeup Time Measures the time difference between time of the ignition signal to the first CAN
Propagation Delay Measures the time taken for a message to travel from one end of the network to the
Converts the waveform acquired by the oscilloscope from the Controller Area Network
into a bit stream and decodes it to display CAN protocol messages in the protocol
analysis window.
The application supports CAN Dual Wire, CAN Single Wire and CAN Fault Tolerant
buses.
Converts the waveform acquired on the Local Interconnect Network into a bit stream
and decodes it to display LIN protocol messages in the protocol analysis window.
you to find electrical noise in the CAN message such as amplitude aberration, jitter,
spikes and glitches. The ability to view Eye diagram with Ack and without Ack bit allows
you to realize the impact of propagation delay on the bit time and adjust the sample
point accordingly.
enables you to program the segments and to operate the node synchronously with
other nodes. Oscillator tolerance is measured in percentage.
frame signal. Data rate is measured in Kbps.
percentage of bus occupancy. Determines the details of the message that occupies the
bus of the selected node. It also gives the number of CAN messages and frame types
on the network. Bus traffic is measured in percentage.
message during network start up. Wakeup time is measured in seconds.
other end. This is measured for the signal transition on the start frame of the message.
Propagation delay is measured in seconds.
TDSVNM Timing and Protocol Decode Software 15
Page 26

Operating Basics
TDSVNM Application View
Figure 3-1 shows the default application view and its areas.
Figure 3-1: Application view and its areas
Menus
The menu bar of TDSVNM software consists of the following menus (as
shown in Figure 3-2):
Figure 3-2: Application Menu
File Menu
Figure 3-3: File Menu
16 TDSVNM Timing and Protocol Decode Software
Page 27

Table 3-2: File Menu selections and their descriptions
Menu selection Description
Recall Default Click File > Recall Default to recall the default settings for both the software and the
oscilloscope.
Recall Click File > Recall to recall the previously saved settings for the software from an .ini
file.
Save Click File > Save to save the software settings to an .ini file.
Recall Recent Click File > Recall Recent to select among the recently saved and recalled setups.
Preferences Click File > Preferences to set preferences.
Minimize Click File > Minimize to minimize the software window.
Exit Click File > Exit to quit the software.
Tests Menu
Operating Basics
Figure 3-4: Tests Menu
Table 3-3: Tests Menu selections and their descriptions
Menu selection Description
Select Click Tests > Select to display or modify the protocol or test selection.
Configure Click Tests > Configure to display or modify the configuration parameters for the
selected protocol or test.
Trigger Setup Click Tests > Trigger Setup to display or modify the trigger parameters and trigger
type for the selected protocol or timing test.
Connect Click Tests > Connect to display the connection instructions for the selected
protocol or test.
Results Menu
Figure 3-5: Results Menu
Click Results > Details to display the detailed results of the last test that was
conducted.
TDSVNM Timing and Protocol Decode Software 17
Page 28

Operating Basics
Utilities Menu
Figure 3-6: Utilities Menu
Click Utilities > ATM-1 License Installation to install or upgrade ATM-1
automotive trigger module license key information.
Help Menu
Figure 3-7: Help Menu
Table 3-4: Help Menu selection and their descriptions
Menu selection Description
Help Topics Click Help > Help Topics to display the help file for the TDSVNM CAN and LIN
Timing and Protocol Decode Software.
About TDSVNM Click Help > About TDSVNM to display a dialog box with information about the
current TDSVNM CAN and LIN Timing and Protocol Decode Software.
About ATM-1 Click Help > About ATM-1 to display a dialog box with information about the current
ATM-1 automotive trigger module.
Selection Panel
The selection panel appears at the far left of every screen. It allows you to
navigate through the TDSVNM application.
Figure 3-8: Select panel
18 TDSVNM Timing and Protocol Decode Software
Page 29

Operating Basics
Table 3-5 shows the buttons and their descriptions:
Table 3-5: Select panel buttons and their descriptions
Button Description
Select Click Select to display the protocols and timing tests to select from.
Configure Click Configure to display the configuration parameters for the selected protocol or
timing test.
Trigger Setup Click Trigger Setup to display the trigger parameters and trigger type for the selected
protocol or timing test.
Connect Click Connect to display the connection instructions for the selected protocol or timing
test.
After you select and configure a protocol or test, you can either set up the
trigger conditions or make equipment connections for the selected protocol or
test.
Control Panel
The control panel appears at the far right of every screen. It controls all of the
application’s operations.
Figure 3-9: Control panel
Table 3-6 shows the buttons and their descriptions:
Table 3-6: Control panel buttons and their descriptions
Button Description
Run Executes the protocol decoding or test selected. The Run button changes to Stop when the
test is running. You can stop the test by clicking the Stop button.
Results Displays the respective Result details panel for the protocol or the test that is configured.
Clear Clears the results displayed on the results screen.
Sequence Mode
Single Run
Free Run
No Acq
Same as the “Single” button on the oscilloscope front panel.
Runs continuously until you press Stop.
Conducts the test without acquiring the waveform.
TDSVNM Timing and Protocol Decode Software 19
Page 30

Operating Basics
Note: When Ref sources are selected in configuration panel, only the No Acq
sequencer mode is available.
Status Bar
The status bar at the bottom of the application screen dynamically updates
according to your selection. The status bar shows the selected Protocol or
Test, Configuration parameters, Hints, and Sequence state.
Figure 3-10: Status bar
Setting Preferences
File > Preferences
Figure 3-11 shows the preferences that you can set.
Figure 3-11: Setting preferences
Math Destination is applicable only when:
The probe type is single-ended
20 TDSVNM Timing and Protocol Decode Software
Page 31

Operating Basics
The bus type is CAN-DW-HL, CAN-DW-LH, CAN-Fault-T-HL, or
CAN-Fault-T-LH
However, Reference Level is used for all bus sources.
Table 3-7 shows the preferences and their descriptions.
Table 3-7: Preferences options and their descriptions
Options Description
Math Destination
Bus1 Source Select the Bus1 source from Math1, Math2, Math3, Math4.
Bus2 Source Select the Bus2 source from Math1, Math2, Math3, Math4.
CAN Node Sensor Source Select the CAN Node Sensor source from Math1, Math2, Math3, Math4.
Reference Level for Bus1 Source, Bus2 Source, and CAN Node Source
Slope* Set the slope to Rise or Fall.
Units Select the units from Percentage and Absolute.
Mid Set the Mid range value in the units specified.
Hysteresis Set the Hysteresis range value in the units specified.
Do Autoset Every Time Select this option to perform autoset every time you click Run whether any parameters in
the Config panel have changed or not.
When this selection is cleared, autoset is performed only when the Bus Type or Bus
Source changes in the Config panel.
* Slope is applicable only for CAN Node Sensor Source.
Note: For Timing Analysis tests, Bus2 preferences are disabled because the
tests are performed for the bus that is configured.
Virtual Keyboard
Virtual Keyboard - Numeric
1. Click any number box to display the icon for the numeric keyboard.
2. Click the icon to display the numeric keyboard.
TDSVNM Timing and Protocol Decode Software 21
Page 32

Operating Basics
Figure 3-12 shows the numeric keyboard.
Figure 3-12: Virtual keyboard - numeric
3. Click the number keys to enter the desired value.
4. Select a unit of measure.
5. Click Enter to confirm your entry. Selections are not effective until you
click Enter.
Virtual Keyboard - Binary
1. In the Trigger Settings window, set Format to Binary.
2. Click the number box next to the ID, DLC, or Data fields to display the
icon for the binary keyboard.
Figure 3-13 shows the binary keyboard.
Figure 3-13: Virtual keyboard - binary
22 TDSVNM Timing and Protocol Decode Software
Page 33

Operating Basics
3. Click the number keys (X, 1, 0) to enter the desired value. X represents a
'Don't Care' value.
Note: If a value has already been entered, click Clear to clear the entry
before entering a new value.
4. Click Apply to confirm your entry. Selections are not effective until you
click Apply.
Virtual Keyboard - Hexadecimal
1. In the Trigger Settings window, set Format to Hex.
2. Click the number box next to the ID, DLC, or Data fields to display the
icon for the hexadecimal keyboard.
Figure 3-14 shows the hexadecimal keyboard.
Figure 3-14: Virtual keyboard - hexadecimal
3. Click the number keys (0 through 9, A through F, and X) to enter the
desired value. X represents a 'Don't Care' value.
Note: If a value has already been entered, click Clear to clear the entry
before entering a new value.
4. Click Apply to confirm your entry. Selections are not effective until you
click Apply.
TDSVNM Timing and Protocol Decode Software 23
Page 34

Operating Basics
24 TDSVNM Timing and Protocol Decode Software
Page 35

How to ...
Select
Protocol and Timing Analysis Tests
Figure 4-1 shows the protocols and timing analysis tests.
Figure 4-1: Selecting a protocol or test
Table 4-1 shows how to select the protocol to decode:
Table 4-1: Selecting a protocol
Test Type How to select
Protocol Click Tests > Select from the menu to view the tests.
CAN In the CAN and LIN Protocol Decoding area, click CAN.
LIN In the CAN and LIN Protocol Decoding area, click LIN.
CAN & LIN In the CAN and LIN Protocol Decoding area, click CAN & LIN to select both the
protocols to decode.
TDSVNM Timing and Protocol Decode Software 25
Page 36

How to…
Table 4-2 shows how to select the timing analysis tests:
Table 4-2: Selecting a timing test
Test Type How to select
Timing Analysis Tests Click Tests > Select from the menu to view the tests.
Oscillator Tolerance In the Timing Analysis Tests area, click Oscillator Tolerance.
Eye Diagram In the Timing Analysis Tests area, click Eye Diagram.
Bus Traffic In the Timing Analysis Tests area, click Bus Traffic.
Data Rate In the Timing Analysis Tests area, click Data Rate.
Wakeup Time In the Timing Analysis Tests area, click Wakeup Time.
Propagation Delay In the Timing Analysis Tests area, click Propagation Delay.
Configure
Configure Protocol
On the menu bar, click Tests > Configure to configure the parameters for the
selected protocol. Figure 4-2 shows the configuration parameters for
protocols.
Figure 4-2: Configuring a protocol or test
In the configure pane, you will see the factory default configuration for the
test you selected. For most tests, you can use the factory default
configuration. However, you can change the values by using the virtual
keyboard or the general purpose knob on the oscilloscope front panel. Using
the File menu, you can also restore the factory defaults or save and recall
your own configuration settings.
26 TDSVNM Timing and Protocol Decode Software
Page 37

How to ...
The following table shows the parameters that you can configure for protocol
decoding.
Note: When Ref sources are selected in configuration panel, only the No Acq
sequencer mode is available.
For two-channel oscilloscopes, source selections Ref3, Ref4, Ch1-Ch3, and
Ch1-Ch4 are not available.
In the Configure Panel, an option input Trigger Using is available to use the
internal trigger feature of the instrument in the application. Trigger Using has
three selections: DPO-CAN, ATM-1, and Standard.
TDSVNM Timing and Protocol Decode Software 27
Page 38

How to…
DPO-CAN: This selection is available only on a DPO-series
oscilloscope when CB:CAN Bus Trigger option is installed. When
Trigger Using is set to DPO-CAN, the application supports the
following standard date rates:
10 Kbps, 20 Kbps, 33.3 Kbps, 50 Kbps, 62.5 Kbps, 83.3 Kbps, 100
Kbps, 125 Kbps, 250 Kbps, 500 Kbps, 800 Kbps, and 1 Mbps.
ATM-1: This selection is available to use ATM-1 trigger module
Standard: This selection is available only for CAN and LIN protocol
decoding and not applicable to CAN-Timing Analysis Tests. In this
selection, you need to configure the required trigger settings in the
Trigger panel of the oscilloscope to standard triggers such as Edge,
Width, Glitch.
Note: Trigger Using selection is not applicable to Wakeup time and
Propagation delay measurements.
After you select and configure a protocol or test, you can either set up the
trigger conditions or make equipment connections for the selected protocol or
test.
Configure CAN Protocol
Figure 4-3 shows the configuration parameters for the CAN protocol.
Figure 4-3: Configuring a CAN protocol
Follow these steps to configure the CAN bus.
1. On the menu bar, click Tests > Configure to configure the parameters for
the selected protocol.
28 TDSVNM Timing and Protocol Decode Software
Page 39

Table 4-3 shows the parameters that you can configure for CAN
protocol decoding. You can decode two CAN buses simultaneously.
Table 4-3: CAN protocol configuration parameters
Parameter Description
Trigger Using
DPO-CAN Sets the trigger to use to DPO-CAN
ATM-1 Sets the trigger to use to ATM-1
Standard Sets the trigger to use to Standard
Probe Type
Single-ended Sets the probe type to single-ended.
Differential Sets the probe type to differential.
Bus1 (Trigger Source)
Source Select the channel source for Bus1. The source selections for a single-ended
probe type are: Ch1-Ch2, Ch1-Ch3, Ch1-Ch4, Ref1, Ref2, Ref3, Ref4.*
The source selections for a differential probe type are: Ch1, Ch2, Ch3, Ch4,
Ref1, Ref2, Ref3, Ref4.*
Bus Type Select the bus type. The bus type selections are: CAN-DW-LH, CAN-DW-HL,
CAN-SW**, CAN-Fault-T-HL, CAN-Fault-T-LH.
If you use a differential probe, and the positive terminal is connected to a CAN
High signal and the negative terminal to CAN Low, use the CAN-H-L (High-Low)
configuration. If the polarity is reversed, use the CAN-L-H configuration.
If you use a single-ended probe and if Ch1 is connected to a CAN High signal
and Ch2 is connected to a CAN Low signal, use the CAN-H-L (High-Low)
configuration. If you connect Ch1 to a CAN Low signal and Ch2 to a CAN High
signal, use the CAN-L-H (High-Low) configuration.
Bit Rate Set the bit rate of the selected bus type.
Bus2
Source Select the channel source for Bus2. If you do not have a second bus, set this
option to None.
Bus Type Select the bus type, if applicable.
Bit Rate Set the bit rate for the selected bus type, if applicable.
CAN Node Sensor
Source Sets the CAN node sensor source. For a differential probe, the source
selections are: Ch1, Ch2, Ch3, Ch4, Ref1, Ref2, Ref3, Ref4, None.
For a single-ended probe, the source selections are: Ch1-Ch2, Ch3-Ch4, Ch1-
Ch3, Ch2-Ch4, Ref1, Ref2, Ref3, Ref4, None.
ID Enter or type the ID for which the messages are analyzed.
Analysis Select the type of analysis to perform on the data— Timing or Data. Use Data
for protocol decoding.
* For Ref sources, Timing/Data Analysis is not available.
** For the CAN-SW Bus Type and Single-ended Probe Type, the source channel selection is always Ch1, Ch2, Ch3,
Ch4, Ref1, Ref2, Ref3, Ref4.
How to ...
TDSVNM Timing and Protocol Decode Software 29
Page 40

How to…
2. Select the probe type.
3. Select the parameters for Bus1 (Source, Bus Type, and Bit Rate). The
selected Bus Type and Data Rate are used to set the Bus Type and Data
Rate of the ATM-1 automotive trigger module.
4. If you have a second bus, select the parameters for Bus2 (Source, Bus
Type, and Bit Rate). If you do not have a second bus, set the Source and
Bus Type to None.
5. Set the CAN Node Sensor Source and ID. If you set the sensor source to
None, the ID field is disabled.
6. Select the type of analysis to perform on the data—Timing or Data. Use
Data to decode a protocol.
Note: Usually, timing analysis is used to detect anomalies in the acquired
signal. Data analysis is used for protocol decoding.
7. Click Tests > Trigger Setup to configure the trigger parameters or click
Tests > Connect to make connections to the device under test.
Configure LIN Protocol
Figure 4-4 shows the configuration parameters for the LIN protocol.
Figure 4-4: Configuring a LIN protocol
Follow these steps to configure the LIN bus.
1. On the menu bar, click Tests > Configure to configure the parameters for
the selected protocol.
Note: Trigger Using is not applicable to LIN.
30 TDSVNM Timing and Protocol Decode Software
Page 41

How to ...
Table 4-4 shows the parameters that you can configure for LIN protocol
decoding. You can decode two LIN buses simultaneously.
Table 4-4: LIN protocol configuration parameters
Parameter Description
Probe Type
Single-ended Sets the probe type to single-ended.
Differential Sets the probe type to differential.
Bus1 (Trigger Source)
Source Select the channel source for Bus1. The source selections for single-ended and
differential probe types are: Ch1, Ch2, Ch3, Ch4, Ref1, Ref2, Ref3, Ref4.*
Bus Type Set the bus type to LIN.
Bit Rate Set the bit rate for the selected bus type.
Bus2
Source Select the channel source for Bus2. If you do not have a second bus, set this option to
None.
Bus Type Select the bus type to LIN, if applicable.
Bit Rate Set the bit rate of the selected bus type, if applicable.
Analysis Select the type of analysis to perform on the data— Timing or Data. Use Data for protocol
decoding.
* For Ref sources, Timing/Data Analysis is not available.
2. Select the probe type.
3. Select the parameters for Bus1 (Source, Bus Type, and Bit Rate).
4. If you have a second bus, select the parameters for Bus2 (Source, Bus
Type, and Bit Rate). If you do not have a second bus, set the Source and
Bus Type to None.
5. Select the type of analysis to perform on the data (Timing or Data). Use
Data to decode a protocol.
Note: Usually, timing analysis is used to detect anomalies in the acquired
signal. Data analysis is used for protocol decoding.
6. Click Tests > Connect to connect to the device under test.
TDSVNM Timing and Protocol Decode Software 31
Page 42

How to…
Configure CAN and LIN Protocol
Figure 4-5 shows the configuration parameters for the CAN & LIN protocols.
Figure 4-5: Configuring CAN and LIN protocols
Follow these steps to configure the CAN and LIN bus.
1. On the menu bar, click Tests > Configure to configure the parameters for
the selected protocols.
Table 4-5 shows the parameters that you can configure for CAN and
LIN protocol decoding. You can decode the two buses simultaneously.
Table 4-5: CAN and LIN protocol configuration parameters
Parameter Description
Trigger Using
DPO-CAN Sets the trigger to use to DPO-CAN
ATM-1 Sels the trigger to use to ATM-1
Standard Sets the trigger to use to Standard
Probe Type
Single-ended Sets the probe type to single-ended.
Differential Sets the probe type to differential.
Bus1 (Trigger Source)
Source Select the channel source for Bus1. The source selections for a single-ended
probe type are: Ch1-Ch2, Ch1-Ch3, Ch1-Ch4, Ref1, Ref2, Ref3, Ref4.*
The source selections for a differential probe type are: Ch1, Ch2, Ch3, Ch4,
Ref1, Ref2, Ref3, Ref4.*
32 TDSVNM Timing and Protocol Decode Software
Page 43

Table 4-5: CAN and LIN protocol configuration parameters (cont.)
Parameter Description
Bus Type Select the bus type. The bus type selections are: CAN-DW-LH, CAN-DW-
HL, CAN-SW**, CAN-Fault-T-HL, CAN-Fault-T-LH.
If you use a differential probe, and the positive terminal is connected to a
CAN High signal and the negative terminal to CAN Low, use the CAN-H-L
(High-Low) configuration. If the polarity is reversed, use the CAN-L-H
configuration.
If you use a single-ended probe and if Ch1 is connected to a CAN High
signal and Ch2 is connected to a CAN Low signal, use the CAN-H-L (HighLow) configuration. If you connect Ch1 to a CAN Low signal and Ch2 to a
CAN High signal, use the CAN-L-H (High-Low) configuration.
Bit Rate Set the bit rate of the selected bus type.
Bus2
Source Select the channel source for Bus2.
The source selections available for single-ended and differential probe types
are: Ch1, Ch2, Ch3, Ch4, Ref1, Ref2, Ref3, Ref4, None.
Bus Type Set the bus type to the default (LIN).
Bit Rate Set the bit rate for the selected bus type.
CAN Node Sensor
Source Sets the CAN node sensor source. For a differential probe, the source
selections are: Ch1, Ch2, Ch3, Ch4, Ref1, Ref2, Ref3, Ref4, None.
For a single-ended probe, the source selections are: Ch1-Ch2, Ch3-Ch4,
Ch1-Ch3, Ch2-Ch4, Ref1, Ref2, Ref3, Ref4, None.
ID Enter or type the ID for which the messages are analyzed.
Analysis Select the type of analysis to perform on the data— Timing or Data. Use
Data for protocol decoding.
Figure 4-ï For Ref sources, Timing/Data Analysis is not available.
**For the CAN-SW Bus Type and Single-ended Probe Type, the source channel selection is always Ch1, Ch2, Ch3,
Ch4, Ref1, Ref2, Ref3, Ref4.
2. Select the probe type.
How to ...
3. Select the parameters for Bus1 (Source, Bus Type, and Bit Rate). Bus1
is always the CAN bus. The selected Bus Type and Data Rate selected
are used to set the Bus Type and Data Rate of the ATM-1 automotive
trigger module.
4. Select the parameters for Bus2 (Source, Bus Type, and Bit Rate). Bus2
is always the LIN bus.
5. Set the CAN Node Sensor Source and ID. If you set the sensor source to
None, the ID field is disabled.
6. Select the type of analysis to perform on the data (Timing or Data). Use
Data to decode a protocol.
Note: Usually, timing analysis is used to detect anomalies in the acquired
signal. Data analysis is used for protocol decoding.
TDSVNM Timing and Protocol Decode Software 33
Page 44

How to…
7. Click Tests > Trigger Setup to configure the trigger parameters or click
Tests > Connect to make connections to the device under test.
Timing Analysis Tests
On the menu bar, click Tests > Configure to configure the parameters for the
selected timing analysis test. Figure 4-6 shows the configuration parameters
for the timing analysis tests.
Figure 4-6: Configuration parameters for timing analysis tests
In the configure pane, you will see the factory default configuration for the
test you selected. For most tests, you can use the factory default
configuration. However, you can change the values by using the virtual
keyboard or the general purpose knob on the oscilloscope front panel. Using
the File menu, you can also restore the factory defaults or save and recall
your own configuration settings.
The following table shows the parameters that you can configure for timing
analysis tests.
34 TDSVNM Timing and Protocol Decode Software
Page 45

How to ...
Note: When Ref sources are selected in configuration panel, only the No Acq
sequencer mode is available.
For the Wakeup Time test, only the Single and No Acq sequencer modes are
available.
Standard is not available for timing analysis tests
For two-channel oscilloscopes, source selections Ref3, Ref4, Ch1-Ch3, and
Ch1-Ch4 are not available.
TDSVNM Timing and Protocol Decode Software 35
Page 46

How to…
When Trigger Using is set to DPO-CAN, the application supports the
following standard date rates:
10 Kbps, 20 Kbps, 33.3 Kbps, 50 Kbps, 62.5 Kbps, 83.3 Kbps, 100 Kbps,
125 Kbps, 250 Kbps, 500 Kbps, 800 Kbps, and 1 Mbps.
After you select and configure a protocol or test, you can either set up the
trigger conditions or make equipment connections for the selected protocol or
test.
Configure Oscillator Tolerance
Figure 4-7 shows the configuration parameters for the Oscillator Tolerance
test.
Figure 4-7: Configuration parameters for oscillator tolerance test
Follow these steps to configure the Oscillator Tolerance test.
1. On the menu bar, click Tests > Configure to configure the parameters for
the Oscillator Tolerance test. Table 4-6 shows the parameters that you
can configure for the Oscillator Tolerance test.
2. Select the Trigger Using for the DPO oscilloscope.
Table 4-6: Oscillator tolerance configuration parameters
Parameter Description
Trigger Using
DPO-CAN Sets the trigger to use to DPO-CAN
ATM-1 Sets the trigger to use to ATM-1
Probe Type
Single-ended Sets the probe type to single-ended.
Differential Sets the probe type to differential.
36 TDSVNM Timing and Protocol Decode Software
Page 47
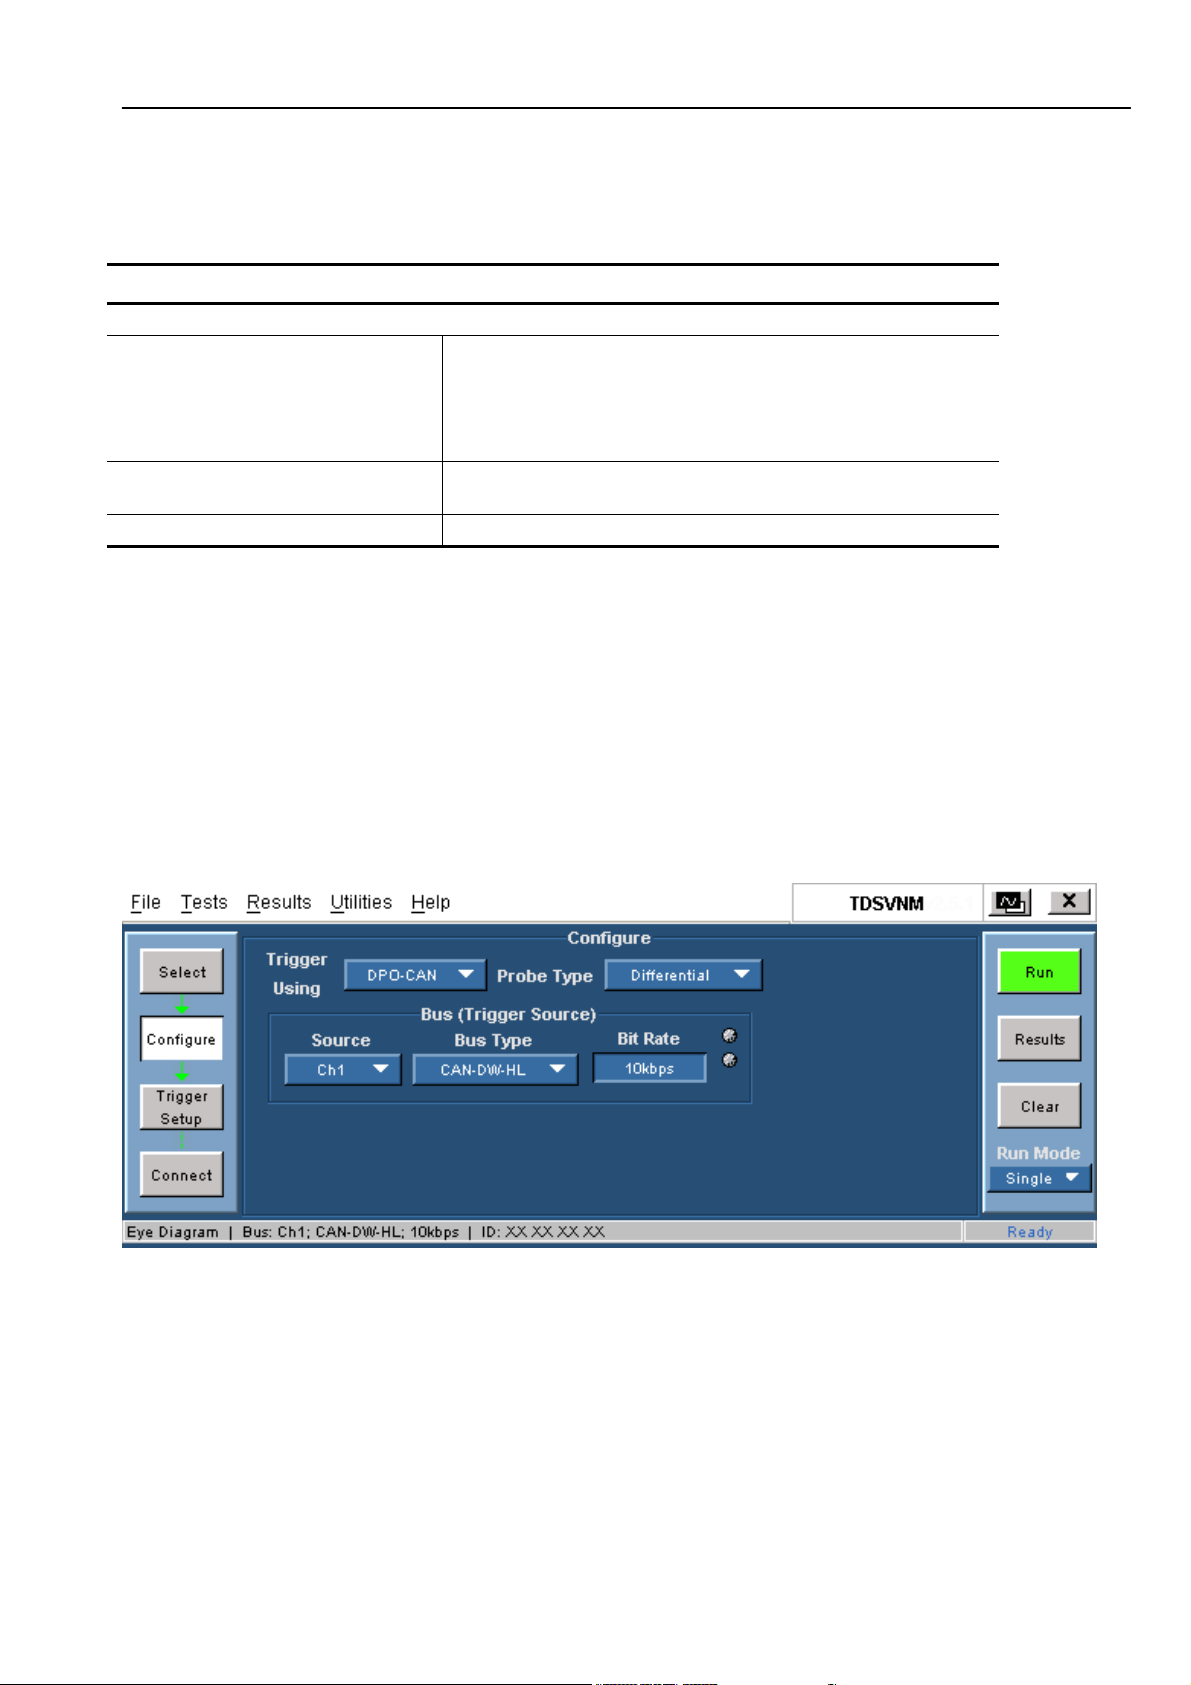
Table 4-6: Oscillator tolerance configuration parameters (cont.)
Parameter Description
Bus (Trigger Source)
Source Select the channel source for the bus. The source selections for a
single-ended probe type are: Ch1-Ch2, Ch1-Ch3, Ch1-Ch4, Ref1, Ref2,
Ref3, Ref4.
The source selections for a differential probe type are: Ch1, Ch2, Ch3,
Ch4, Ref1, Ref2, Ref3, Ref4.
Bus Type Select the bus type. The bus type selections are: CAN-DW-LH, CAN-
DW-HL, CAN-SW*, CAN-Fault-T-HL, CAN-Fault-T-LH.
Bit Rate Set the bit rate of the selected bus type.
* For the CAN-SW Bus Type the source channel selection is always Ch1, Ch2, Ch3, Ch4, Ref1, Ref2, Ref3, Ref4.
3. Select the probe type.
How to ...
4. Select the parameters–Source, Bus Type, and Bit Rate.
5. Click Tests > Trigger Setup to configure the trigger parameters or click
Tests > Connect to make connections to the device under test.
Configure Eye Diagram
Figure 4-8 shows the configuration parameters for the Eye Diagram test.
Figure 4-8: Configuration parameters for eye diagram test
Follow these steps to configure the Eye Diagram test.
1. On the menu bar, click Tests > Configure to configure the parameters for
the Eye Diagram test.
2. Select the Trigger Using for the DPO oscilloscope.
TDSVNM Timing and Protocol Decode Software 37
Page 48

How to…
Table 4-7 shows the parameters that you can configure for the Eye
Diagram test.
Table 4-7: Eye diagram configuration parameters
Parameter Description
Trigger Using
DPO-CAN Sets the trigger to use to DPO-CAN
ATM-1 Sets the trigger to use to ATM-1
Probe Type
Single-ended Sets the probe type to single-ended.
Differential Sets the probe type to differential.
Bus (Trigger Source)
Source Select the channel source for the bus. The source selections for a
single-ended probe type are: Ch1-Ch2, Ch1-Ch3, Ch1-Ch4, Ref1, Ref2,
Ref3, Ref4.
The source selections for a differential probe type are: Ch1, Ch2, Ch3,
Ch4, Ref1, Ref2, Ref3, Ref4.
Bus Type Select the bus type. The bus type selections are: CAN-DW-LH, CAN-
DW-HL, CAN-SW*, CAN-Fault-T-HL, CAN-Fault-T-LH.
Bit Rate Set the bit rate for the selected bus type.
* For the CAN-SW Bus Type the source channel selection is always Ch1, Ch2, Ch3, Ch4, Ref1, Ref2, Ref3, Ref4.
3. Select the probe type.
4. Select the parameters–Source, Bus Type, and Bit Rate.
5. Click Tests > Trigger Setup to configure the trigger parameters or click
Tests > Connect to make connections to the device under test.
38 TDSVNM Timing and Protocol Decode Software
Page 49

Configure Bus Traffic
Figure 4-9 shows the configuration parameters for the Bus Traffic test.
Figure 4-9: Configuration parameters for bus traffic test
How to ...
Follow these steps to configure the Bus Traffic Trigger Using selection.
1. On the menu bar, click Tests > Configure to configure the parameters for
the Bus Traffic test. Table 4-8 shows the parameters that you can
configure for the Bus Traffic test.
Table 4-8: Bus traffic configuration parameters
Parameter Description
Trigger Using
DPO-CAN Sets the trigger to use to DPO-CAN
ATM-1 Sets the trigger to use to ATM-1
Probe Type
Single-ended Sets the probe type to single-ended.
Differential Sets the probe type to differential.
Bus (Trigger Source)
Source Select the channel source for the bus. The source selections for a
single-ended probe type are: Ch1-Ch2, Ch1-Ch3, Ch1-Ch4, Ref1, Ref2,
Ref3, Ref4.
The source selections for a differential probe type are: Ch1, Ch2, Ch3,
Ch4, Ref1, Ref2, Ref3, Ref4.
Bus Type Select the bus type. The bus type selections are: CAN-DW-LH, CAN-
DW-HL, CAN-SW*, CAN-Fault-T-HL, CAN-Fault-T-LH.
Bit Rate Set the bit rate for the selected bus type.
* For the CAN-SW Bus Type the source channel selection is always Ch1, Ch2, Ch3, Ch4, Ref1, Ref2, Ref3, Ref4.
2. Select the probe type.
3. Select the parameters–Source, Bus Type, and Bit Rate.
TDSVNM Timing and Protocol Decode Software 39
Page 50

How to…
4. Click Tests > Trigger Setup to configure the trigger parameters or click
Tests > Connect to connect to the device under test.
Configure Data Rate
Figure 4-10 shows the configuration parameters for the Data Rate test.
Figure 4-10: Configuration parameters for data rate test
Follow these steps to configure the Data Rate test.
1. On the menu bar, click Tests > Configure to configure the parameters for
the Data Rate test.
2. Select the Trigger Using for the DPO oscilloscope. Table 4-9 shows the
parameters that you can configure for the Data Rate test.
Table 4-9: Data rate configuration parameters
Parameter Description
Trigger Using
DPO-CAN Sets the trigger to use to DPO-CAN
ATM-1 Sets the trigger to use to ATM-1
Probe Type
Single-ended Sets the probe type to single-ended.
Differential Sets the probe type to differential.
Bus (Trigger Source)
Source Select the channel source for the bus. The source selections for a
single-ended probe type are: Ch1-Ch2, Ch1-Ch3, Ch1-Ch4, Ref1, Ref2,
Ref3, Ref4.
The source selections for a differential probe type are: Ch1, Ch2, Ch3,
Ch4, Ref1, Ref2, Ref3, Ref4.
Bus Type Select the bus type. The bus type selections are: CAN-DW-LH, CAN-
DW-HL, CAN-SW*, CAN-Fault-T-HL, CAN-Fault-T-LH.
Bit Rate Set the bit rate for the selected bus type.
* For the CAN-SW Bus Type the source channel selection is always Ch1, Ch2, Ch3, Ch4, Ref1, Ref2, Ref3, Ref4.
40 TDSVNM Timing and Protocol Decode Software
Page 51

How to ...
3. Select the probe type.
4. Select the parameters–Source, Bus Type, and Bit Rate.
5. Click Tests > Trigger Setup to configure the trigger parameters or click
Tests > Connect to make connections to the device under test.
Configure Wakeup Time
Figure 4-11 shows the configuration parameters for the Wakeup Time test.
Figure 4-11: Configuration parameters for wakeup time test
Follow these steps to configure the Wakeup Time test.
1. On the menu bar, click Tests > Configure to configure the parameters for
the Wakeup Time test. Table 4-10 shows the parameters that you can
configure for the Wakeup Time test.
Table 4-10: Wakeup time configuration parameters
Parameter Description
Probe Type
Single-ended Sets the probe type to single-ended.
Differential Sets the probe type to differential.
Bus (Trigger Source)
Source Select the channel source for the bus. The source selections for a
single-ended probe type are: Ch1-Ch2, Ch1-Ch3, Ch1-Ch4, Ref1, Ref2,
Ref3, Ref4.
The source selections for a differential probe type are: Ch1, Ch2, Ch3,
Ch4, Ref1, Ref2, Ref3, Ref4.
Bus Type Select the bus type. The bus type selections are: CAN-DW-LH, CAN-
DW-HL, CAN-SW*, CAN-Fault-T-HL, CAN-Fault-T-LH.
Bit Rate Set the bit rate for the selected bus type.
* For the CAN-SW Bus Type the source channel selection is always Ch1, Ch2, Ch3, Ch4, Ref1, Ref2, Ref3, Ref4.
TDSVNM Timing and Protocol Decode Software 41
Page 52

How to…
2. Select the probe type.
3. Select the parameters–Source, Bus Type, and Bit Rate.
4. Click Tests > Trigger Setup to configure the trigger parameters or click
Tests > Connect to make connections to the device under test.
Note: Trigger Using is not available for the Wakeup Time measurement
Configure Propagation Delay
Figure 4-12 shows the configuration parameters for the Propagation Delay
test.
Figure 4-12: Configuration parameters for propagation delay test
Follow these steps to configure the Propagation Delay test.
1. On the menu bar, click Tests > Configure to configure the parameters for
the Propagation Delay test. Table 4-11 shows the parameters that you
can configure for the Propagation Delay test.
Table 4-11: Propagation delay configuration parameters
Parameter Description
Probe Type
Single-ended Sets the probe type to single-ended.
Differential Sets the probe type to differential.
Bus (Trigger Source)
From Source
To Source
Select the From and To channel sources for the bus. The source
selections for a single-ended probe type are: Ch1-Ch2, Ch3-Ch4, Ch1Ch3, Ch2-Ch4, Ref1, Ref2, Ref3, Ref4.
The source selections for a differential probe type are: Ch1, Ch2, Ch3,
Ch4, Ref1, Ref2, Ref3, Ref4.
42 TDSVNM Timing and Protocol Decode Software
Page 53

Table 4-11: Propagation delay configuration parameters (cont.)
Parameter Description
Bus Type Select the bus type. The bus type selections are: CAN-DW-LH, CAN-
DW-HL, CAN-SW*, CAN-Fault-T-HL, CAN-Fault-T-LH.
Bit Rate Set the bit rate for the selected bus type.
* For the CAN-SW Bus Type the source channel selection is always Ch1, Ch2, Ch3, Ch4, Ref1, Ref2, Ref3, Ref4.
2. Select the probe type.
3. Select the parameters–From Source, To Source, Bus Type, and Bit Rate.
4. Click Tests > Connect to connect to the device under test.
Note: Trigger Using is not available for Propagation Delay test
How to ...
Set up Trigger
Set up Trigger
On the menu bar, click Tests > Trigger Setup to set up the trigger parameters
and conditions for the selected test. You can configure the trigger setup for
the ATM-1 automotive trigger module in the trigger panel.
You can force a trigger by pressing the Single button on the front panel.
Forced trigger is used to observe the sequence of events manually. Click Run
to decode the acquired data in the Single No Acq mode.
Figure 4-13 shows the trigger setup parameters for protocol decoding when
Trigger Using is set to ATM-1.
Figure 4-13: Trigger setup parameters for protocol decoding (ATM-1)
TDSVNM Timing and Protocol Decode Software 43
Page 54

How to…
Figure 4-14 shows the trigger setup parameters when Trigger Using is set to
DPO-CAN.
Figure 4-14: Trigger setup parameters for protocol decoding (DPO-CAN)
Figure 4-15 shows the trigger setup parameters when Trigger Using is set to
Standard.
Figure 4-15: Trigger setup parameters for protocol decoding (Standard)
44 TDSVNM Timing and Protocol Decode Software
Page 55

How to ...
The following table shows the Trigger parameters that you can set for
protocol decoding.
Figure 4-16 shows the trigger setup parameters for timing tests when Trigger
Using is set to ATM-1.
Figure 4-16: Trigger setup parameters for timing tests
TDSVNM Timing and Protocol Decode Software 45
Page 56

How to…
Figure 4-17 shows the trigger setup parameters for timing tests when Trigger
Using is set to DPO-CAN:
Figure 4-17: Trigger setup parameters for timing tests when Trigger Using is set
to DPO-CAN
The following table shows the Trigger parameters that you can set for the
timing analysis tests.
Note: If you have set the Sample Point Location to a value such that the
TSEG2 value is less than the SJW (synchronization jump width), then the
following warning will appear: TSEG2 is less than SJW. Would you like to
change the Sample Point and run the measurement again?
Choose Yes to change the Sample Point Location in the Trigger panel.
Choose No to continue with the measurement without changing the value of
the Sample Point Location.
46 TDSVNM Timing and Protocol Decode Software
Page 57

How to ...
If Trigger Using is set to DPO-CAN, the Trigger-In Source, Sample Point
Location, and ACK trigger parameters are not available.
Trigger CAN and CAN/LIN Protocol
On the menu bar, click Tests > Trigger Setup to set up the trigger parameters
and conditions for the selected test. You can configure the trigger setup for
the ATM-1 automotive trigger module in the trigger panel. Figure 4-18 shows
the trigger setup parameters for the CAN and CAN/LIN protocols.
Figure 4-18: Trigger setup parameters for CAN and CAN/LIN protocols
Figure 4-19 shows the trigger setup parameters for the CAN and CAN/LIN
protocols when Trigger Using is set to DPO-CAN.
Figure 4-19: Trigger setup parameters for CAN and CAN/LIN protocols when Trigger
Using is set to DPO-CAN
To set up a trigger event for CAN or CAN & LIN protocols, follow these
steps:
1. From Tests > Select, select CAN or CAN & LIN.
2. From Tests > Configure, configure the CAN or CAN & LIN buses.
TDSVNM Timing and Protocol Decode Software 47
Page 58

How to…
3. From Tests > Trigger Setup, set the trigger parameters for the selected
protocol(s). Table 4-12 lists the parameters and their descriptions when
Trigger Using is set to ATM-1.
Table 4-12: CAN and CAN/LIN trigger parameters
Parameter Description
Trigger-In Source Used to trigger the oscilloscope. It is the trigger output of the ATM-1 automotive
trigger module that is connected to the trigger-in source.
Set the Trigger-In source to Aux In, Ch1, Ch2, Ch3, or Ch4.
Sample Point
Location
Trigger Event Select and define the Elementary, Logical, or Advanced trigger event to use.
ACK
Is the location of finding the bit state (0, 1) from the start of the synchronization
segment. Define the sample point location as a percentage of the bit interval.
Used to receive acknowledgement from the ATM-1 automotive trigger module
that behaves as a CAN node.
Set ACK to Yes to receive an acknowledgement from the ATM-1 automotive
trigger module.
Table 4-13 shows the CAN and CAN/LIN trigger parameters when Trigger
Using is set to DPO-CAN.
Table 4-13: Bus traffic trigger parameters for DPO-CAN
Parameter Description
Trigger On Select the frame on which to trigger. The selections are: CAN Message, Frame, ID,
Data, ID and Data, EOF, Missing Ack
CAN Type Select the CAN type to use: Standard, Extended
Type of Frame Select the Type of Frame to use: Data and Remote
Format Select binary or hexadecimal as the format you will use to enter ID and Data values
Data Direction Select the Data Direction to use: Either, Data Frame, and Remote Frame
4. From Tests > Connect, set up the connections for the bus or buses to
decode.
48 TDSVNM Timing and Protocol Decode Software
Page 59

How to ...
Trigger LIN Protocol
Trigger setup is not available (as shown in Figure 4-20) for decoding the LIN
bus. The TDSVNM application uses the edge trigger feature of the
oscilloscope.
Figure 4-20: Trigger setup screen for LIN protocol
Trigger for Oscillator Tolerance, Eye Diagram, and Data Rate
On the menu bar, click Tests > Trigger Setup to set up the trigger parameters
and conditions for the selected test. You can configure the trigger setup for
the ATM-1 automotive trigger module in the trigger panel.
Figure 4-21 shows the trigger setup parameters for the Oscillator Tolerance,
Eye Diagram, and Data Rate tests.
Figure 4-21: Trigger setup parameters for oscillator tolerance, eye diagram, and
data rate tests
TDSVNM Timing and Protocol Decode Software 49
Page 60

How to…
Figure 4-22 shows the trigger setup parameters for the Oscillator Tolerance,
Eye Diagram, and Data Rate tests when Trigger Using is set to DPO-CAN.
Figure 4-22: Trigger setup parameters for oscillator tolerance, eye diagram, and
data rate tests when Trigger Using is set to DPO-CAN
To set up a trigger event for Oscillator Tolerance, Eye Diagram, and Data
Rate timing tests follow these steps:
1. From Tests > Select, select Oscillator Tolerance, Eye Diagram, or Data
Rate timing test.
2. From Tests > Configure, configure the selected test.
3. From Tests > Trigger Setup, set the trigger parameters for the selected
test (as shown in Table 4-14). The trigger setup for Oscillator Tolerance,
Eye Diagram, and Data Rate timing tests are identical.
Table 4-14: Oscillator tolerance, eye diagram, and data rate
trigger parameters
Parameter Description
Trigger-In Source Trigger-In Source is used to trigger the oscilloscope. It is the trigger output of the ATM-1
automotive trigger module that is connected to the trigger-in source.
Set the Trigger- In source to Aux In, Ch1, Ch2, Ch3, or Ch4.
Sample Point
Location
Input
ID
ACK
Gives the location of the bit state (0, 1) from the start of the synchronization segment. Define
the sample point location as a percentage of the bit interval.
Type or select the Input ID in Hexadecimal or Binary format. The application generates the
results for this specified ID.
Set ACK to Yes to receive an acknowledgement from the ATM-1 automotive trigger module
that behaves as a CAN node.
50 TDSVNM Timing and Protocol Decode Software
Page 61

Table 4-15 shows Oscillator Tolerance, Eye Diagram, and Data Rate trigger
parameters when Trigger Using is set to DPO-CAN.
Table 4-15: Oscillator tolerance, eye diagram, and data rate
trigger parameters for DPO-CAN
Parameter Description
ID Type or select the Input ID
Data Direction Select the Data Direction to use: Either, Data Frame, and Remote Frame
4. Select the Trigger-In Source.
5. Type or select the Input ID. Data acquisition starts when the application
encounters an ID value that matches the one specified in this field.
6. From Tests > Connect, set up the connections for the bus.
How to ...
Trigger Bus Traffic
On the menu bar, click Tests > Trigger Setup to set up the trigger parameters
and conditions for the selected test. You can configure the trigger setup for
the ATM-1 automotive trigger module in the trigger panel.
Figure 4-23 shows the trigger setup parameters for the Bus Traffic test.
Figure 4-23: Trigger setup parameters for bus traffic test
TDSVNM Timing and Protocol Decode Software 51
Page 62
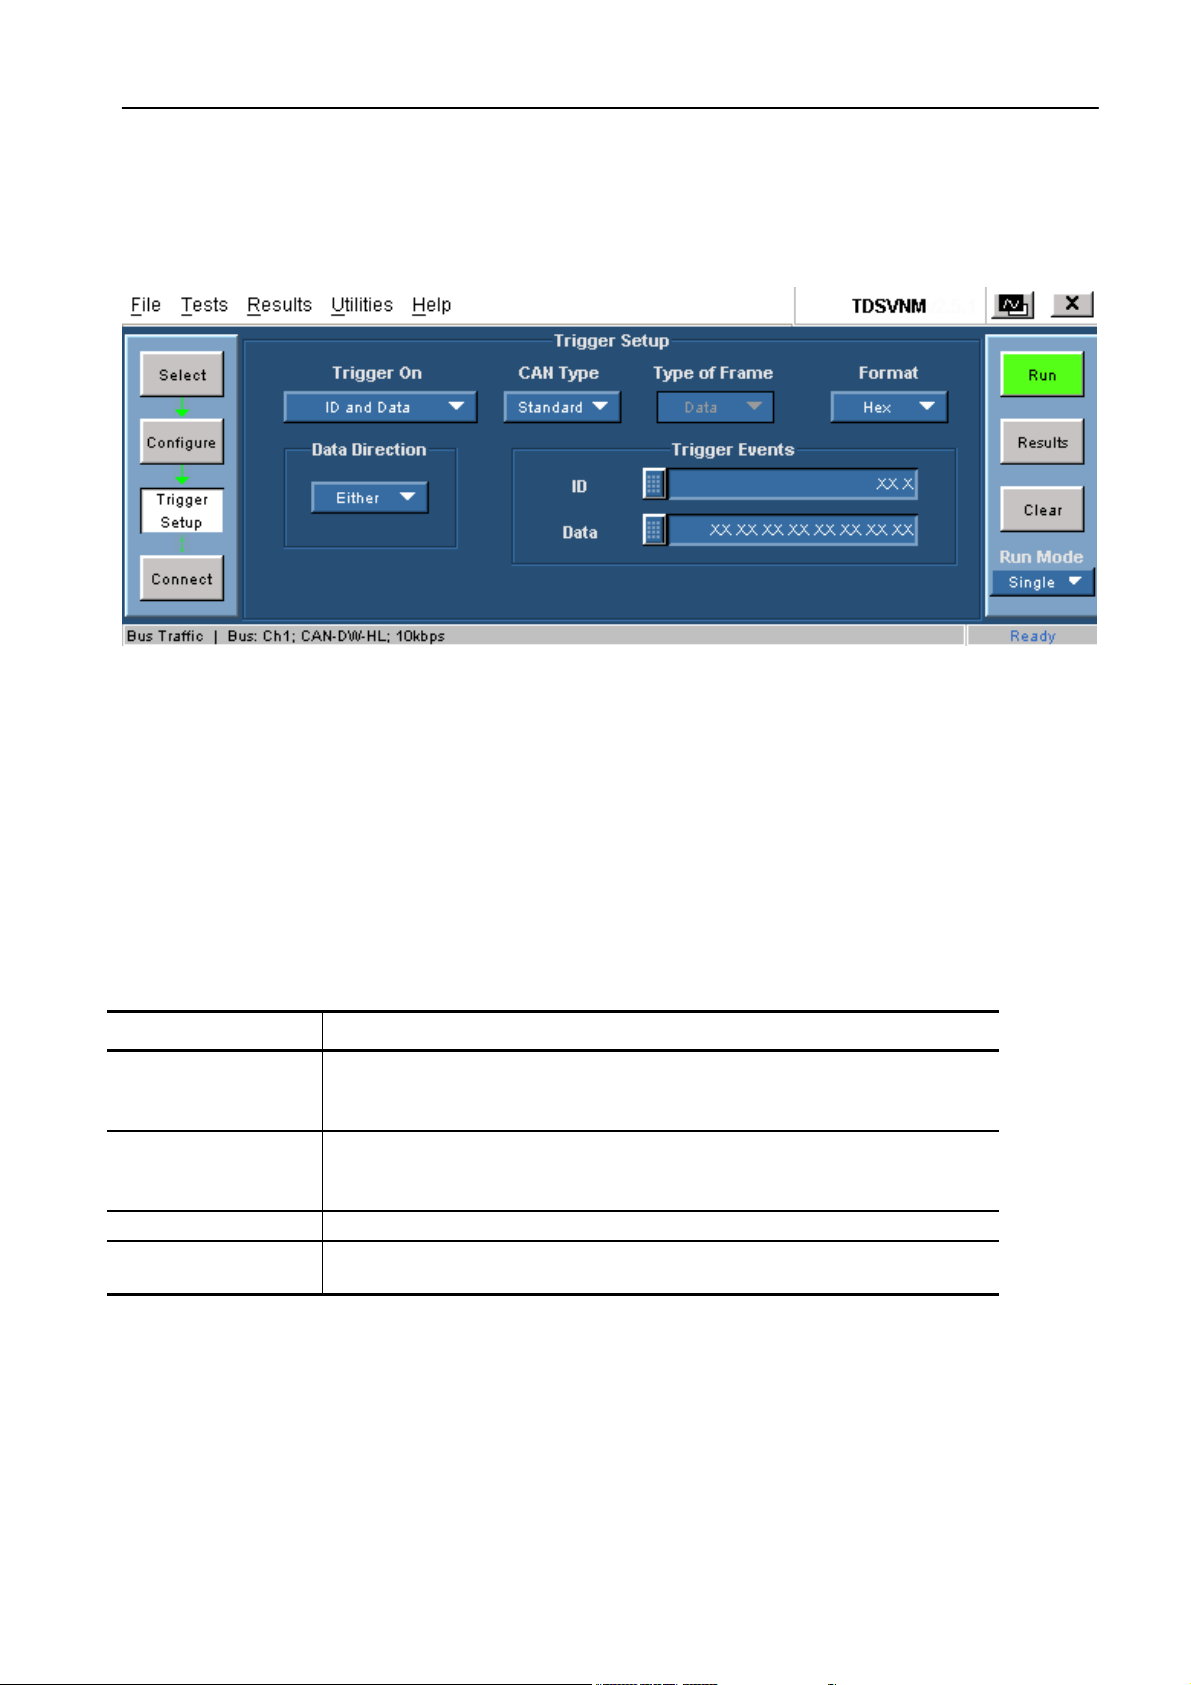
How to…
Figure 4-24 shows the trigger setup parameters for the Bus Traffic test when
Trigger Using is set to DPO-CAN.
Figure 4-24: Trigger setup parameters for bus traffic test when Trigger Using is
set to DPO-CAN
To set up a trigger event for Bus Traffic timing test, follow these steps:
1. From Tests > Select, select Bus Traffic timing test.
2. From Tests > Configure, configure the selected test.
3. From Tests > Trigger Setup, set the trigger parameters for the selected
test (as shown in Table 4-16).
Table 4-16: Bus traffic trigger parameters when Trigger Using is
set to ATM-1
Parameter Description
Trigger-In Source Trigger-In Source is used to trigger the oscilloscope. It is the trigger output of the ATM-1
automotive trigger module that is connected to the trigger-in source.
Set the Trigger-In source to Aux In, Ch1, Ch2, Ch3, or Ch4.
Sample Point
Location
Trigger Event Select and define the Elementary trigger event to use.
ACK Set ACK to Yes to receive an acknowledgement from the ATM-1 automotive trigger
Gives the location of the bit state (0, 1) from the start of the synchronization segment.
Define the sample point location as a percentage of the bit interval.
module that behaves as a CAN node.
52 TDSVNM Timing and Protocol Decode Software
Page 63

Table 4-17 shows the Bus traffic trigger parameters when Trigger Using is set
to DPO-CAN.
Table 4-17: Bus traffic trigger parameters for DPO-CAN
Parameter Description
Trigger On Select the frame on which to trigger. The selections are: CAN Message, Frame, ID,
Data, ID and Data, EOF, Missing Ack
CAN Type Select the CAN type to use: Standard, Extended
Type of Frame Select the Type of Frame to use: Data and Remote
Format Select binary or hexadecimal as the format you will use to enter ID and Data values
Data Direction Select the Data Direction to use: Either, Data Frame, and Remote Frame
4. Select the Trigger-In Source.
5. Define the Elementary trigger event to use.
How to ...
6. From Tests > Connect, set up the connections for the bus.
Trigger Wakeup Time
On the menu bar, click Tests > Trigger Setup to set up the trigger parameters
and conditions for the selected test. You can configure the trigger setup for
the ATM-1 automotive trigger module in the trigger panel.
Figure 4-25 shows the trigger setup parameters for the Wakeup Time test.
Figure 4-25: Trigger setup parameters for wakeup time test
To set up a trigger event for Wakeup Time test, follow these steps:
1. From Tests > Select, select Wakeup Time test.
2. From Tests > Configure, configure the selected test.
TDSVNM Timing and Protocol Decode Software 53
Page 64

How to…
3. From Tests > Trigger Setup, set the trigger parameters for the selected
test (as shown in Table 4-18).
Table 4-18: Wakeup time trigger parameters
Parameter Description
Trigger-In Source Trigger-In Source is used to trigger the oscilloscope. It is the trigger output of
the ATM-1 automotive trigger module that is connected to the trigger-in source.
Set the Trigger- In source to Aux In, Ch1, Ch2, Ch3, or Ch4.
Wakeup Time
Settling Latency Time
Trigger Slope
Trigger Level
Set the Settling Latency Time between 190 ns to 240 ns.
Set the Trigger Slope to Rise or Fall.
Set the Trigger Level between –40 V to +40 V.
4. From Tests > Connect, set up the connections for the bus.
Trigger Propagation Delay
Triggering is not available for the Propagation Delay test (as shown in
Figure 4-26).
Figure 4-26: Trigger setup screen for propagation delay
Define Elementary Trigger Events
You can set the Trigger Event to one of the three trigger setups for the ATM1 automotive trigger module in the trigger pane (Elementary, Logical, and
Advanced). You can set trigger events to define the trigger out when the
conditions that you have defined are met. Elementary, Logical, and Advanced
triggering are available only for protocol decoding.
54 TDSVNM Timing and Protocol Decode Software
Page 65

Figure 4-27 shows the settings for Elementary trigger.
Figure 4-27: Elementary trigger settings
To set up an Elementary trigger event, follow these steps:
How to ...
1. From Tests > Select, select the protocol to decode.
2. From Tests > Configure, configure the protocol.
3. From Tests > Trigger Setup, set the trigger parameters for the selected
protocol.
Table 4-19 lists the parameters and their descriptions.
Table 4-19: Trigger parameters
Parameter Description
Trigger-In Source Trigger-In Source is used to trigger the oscilloscope. It is the trigger output of the ATM-1
automotive trigger module that is connected to the trigger-in source.
Sample Point
Location
Trigger Event Select and define the Elementary, Logical, or Advanced trigger event to use. Trigger
ACK Set ACK to Yes to receive an acknowledgement from the ATM-1 automotive trigger
Gives the location of the bit state (0, 1) from the start of the synchronization segment.
Define the sample point location as a percentage of the bit interval.
events are available only for protocol decoding.
module that behaves as a CAN node.
4. Set the Trigger-In source to Aux In, Ch1, Ch2, Ch3, or Ch4.
5. Enter or select the Sample Point in percentage.
6. Set the Trigger Event to Elementary and click Define. The application
displays trigger settings for the elementary trigger event. The trigger
events have conditions or parameters and associated trigger actions.
TDSVNM Timing and Protocol Decode Software 55
Page 66

How to…
Table 4-20 lists the parameters that you can set for an elementary trigger
event.
Table 4-20: Elementary trigger parameters
Parameter Description
Trigger On Select the frame on which to trigger. The selections are: CAN Message, ID, Data,
ID and Data, Data Frame, Remote Frame, Error Frame, Overload Frame
CAN Type Select the CAN type to use: Standard, Extended
Error Type Select the Error Type: Active, Passive, CRC, All, Form, Ack. This option is
enabled only when Trigger On is set to Error Frame.
Format Select binary or hexadecimal as the format you will use to enter ID, DLC, and
Data values.
Trigger Events
ID Select the operator that defines whether the ID field in the CAN frame meets a
specified condition. The selections are: =, !=, <, <=, >, >=, Is in, Is not in.
DLC Enter the data length count (DLC) for that frame (maximum of eight bytes).
Data Select the operator that defines whether the Data field in the CAN frame meets a
specified condition. The selections are: =, !=, <, <=, >, >=, Is in, Is not in.
Setting some bits in ID and DLC to a Don't Care condition (represented
by Xs) is not allowed. If you do so, you will receive a warning after you
click Apply.
However, Data values can have 'Don't Care' bits.
7. Select the frame on which to trigger. Based on the trigger type selected,
other options are enabled or disabled. The following table shows the
types of frames that you can select as a trigger source. Based on the
trigger-on source, the other selections change.
56 TDSVNM Timing and Protocol Decode Software
Page 67

How to ...
The following table shows the type of frames that you can select as a
trigger source when Trigger Using is set to DPO-CAN:
Enter the ID, DLC, and Data values either by typing then in directly in
the field or by using the virtual keyboard. Depending on the selected
format, the virtual keyboard supports hexadecimal or binary input.
When the trigger condition that you have specified is met, the ATM-1
automotive trigger module sends a trigger out to the oscilloscope.
Click OK to confirm the settings and return to the trigger pane.
8. Set ACK to Yes if you want to receive an acknowledgement from the
ATM-1 automotive trigger module.
9. Click Tests > Connect to set up connections to decode the protocol.
Example:
An event can be defined as: “IF <Trigger Condition> THEN <Trigger Out>”.
For the bus type CAN-DW-LH with a bit rate of 1 Mbps and trigger set to
Elementary, set the following:
CAN Type: Standard
Trigger on: ID Is In 568 to 658
CAN Type: Standard
Trigger On: Data Frame
ID Is in 500 to 568
DLC = 6
Data = 46XXFF
TDSVNM Timing and Protocol Decode Software 57
Page 68

How to…
Define Logical Trigger Events
In Logical Triggering, you can define more than one condition (up to three
conditions) and set the application to trigger out when any one of the
conditions are met.
Figure 4-28 shows the settings for Logical trigger.
Figure 4-28: Logical trigger settings
To set up a logical trigger event, follow these steps:
1. From Tests > Select, select the protocol to decode.
2. From Tests > Configure, configure the protocol.
3. From Tests > Trigger Setup, set the trigger parameters for the selected
protocol.
58 TDSVNM Timing and Protocol Decode Software
Page 69

Table 4-21 lists the parameters and their descriptions.
Table 4-21: Trigger parameters
Parameter Description
Trigger-In Source Trigger-In Source is used to trigger the oscilloscope. It is the trigger output of the ATM-1
automotive trigger module that is connected to the trigger-in source.
Set the Trigger- In source to Aux In, Ch1, Ch2, Ch3, or Ch4.
Sample Point
Location
Trigger Event Select and define the Elementary, Logical, Advanced trigger event to use. Trigger events
ACK Set ACK to Yes to receive an acknowledgement from the ATM-1 automotive trigger
Gives the location of finding the bit state (0, 1) from the start of the synchronization
segment. Define the sample point location as a percentage of the bit interval.
are available only for protocol decoding.
module that behaves as a CAN node.
How to ...
4. Set the Trigger-In source to Aux In, Ch1, Ch2, Ch3, or Ch4.
5. Enter or select the Sample Point Location in percentage.
6. Set the Trigger event to Logical and click Define. The application
displays a screen to define the logical trigger event. The trigger events
have conditions or parameters and associated trigger actions.
Table 4-22 lists the parameters that you can set for a logical trigger
event.
Table 4-22: Logical trigger parameters
Parameter Description
Format Select binary or hexadecimal as the format you will use to enter ID, DLC, and
Data values.
Trigger On Select the frame on which to trigger. The selections are: ID, ID and Data, Data
Frame, Remote Frame, Overload Frame.
CAN Frame
ID
DLC Enter the data length count (DLC) for that frame (maximum of eight bytes).
Data Select the operator that defines whether the Data field in the CAN frame meets a
Select the operator that defines whether the ID field in the CAN frame meets a
specified condition. The selections are: =, !=, <, <=, >, >=, Is in, Is not in.
specified condition. The selections are: =, !=, <=, <, >, >=, Is in, Is not in.
Note: The ID can be either Standard or Extended. If the ID value is greater
than an 11-bit value, the ID is considered as an Extended CAN message.
If the Trigger On selection is ID, ID & Data, Data Frame, or Remote Frame,
and operator selected is Is In or Is Not In, and if you enter an ID value
ranging from Standard ID to Extended, then TDSVNM determines the Frame
Type based on the number of bits entered in the 'To' field.
TDSVNM Timing and Protocol Decode Software 59
Page 70

How to…
Setting some bits in ID and DLC to a "Don't care" condition
(represented by Xs) is not allowed. If you do so, you will receive a
warning message after you click Apply.
However, Data values can have 'Don't Care' bits.
Depending on the format selected, the virtual keyboard supports
hexadecimal or binary input.
7. Select the frame on which to trigger. Based on the trigger type selected,
other options are enabled or disabled. The following table shows the
types of frames that you can select as a trigger source. Based on the
trigger-on source, the other selections change.
When the trigger condition that you have specified is met, the ATM-1
automotive trigger module sends a trigger out to the oscilloscope.
Click OK to confirm the settings and return to the trigger pane.
8. Set ACK to Yes to receive an acknowledgement from the ATM-1
automotive trigger module.
9. Click Tests > Connect to set up connections to decode the protocol.
Example:
An event can be defined as: “IF <Trigger Condition> OR <Trigger
Condition> OR <Trigger Condition> THEN <Trigger Out>”.
A logical trigger condition can be set as:
Trigger On: Data Frame
ID=xxxx, Data: 46 39 EF CB 34
DLC=xxxx
OR
Trigger On: Overload Frame
OR
Trigger On: Remote
60 TDSVNM Timing and Protocol Decode Software
Page 71

How to ...
ID=xxxxx
Define Advanced Trigger Events
In Advanced triggering, you can define parameters for complex or advanced
trigger conditions and actions for a maximum of three sequences. In each
sequence, for a defined combination of trigger parameters, using the If Then
Else condition, you can set one or more events to occur. For example, “IF
<Trigger Condition> THEN <Trigger Actions> ELSE-IF <Trigger
Condition> THEN <Trigger Actions>”. You can loop back from one
sequence to the other, for instance, from Seq#2 the trigger action (“then”
part) can direct to Seq#1.
Figure 4-29 shows the settings for Advanced trigger.
Figure 4-29: Advanced trigger settings
To set up an advanced trigger event, follow these steps:
1. From Tests > Select, select the protocol to decode.
2. From Tests > Configure, configure the protocol.
3. From Tests > Trigger Setup, set the trigger parameters for the selected
protocol.
TDSVNM Timing and Protocol Decode Software 61
Page 72

How to…
Table 4-23 lists the parameters and their descriptions.
Table 4-23: Trigger parameters
Parameter Description
Trigger-In Source Trigger-In Source is used to trigger the oscilloscope. It is the trigger output of the ATM-1
automotive trigger module that is connected to the trigger-in source.
Sample Point
Location
Trigger Event Select and define the Elementary, Logical, or Advanced trigger event to use. Trigger
ACK Set ACK to Yes to receive an acknowledgement from the ATM-1 automotive trigger
Gives the location of finding the bit state (0, 1) from the start of the synchronization
segment. Define the sample point location as a percentage of the bit interval.
events are available only for protocol decoding.
module that behaves as a CAN node.
4. Set the Trigger-In source to Aux In, Ch1, Ch2, Ch3, or Ch4.
5. Enter or select the Sample Point Location in percentage.
6. Set the Trigger event to Advanced and click Define. The application
displays a screen to define the advanced trigger event. The trigger events
have conditions or parameters and associated trigger actions.
Table 4-24 lists the parameters that you can set for an advanced trigger
event.
Table 4-24: Advanced trigger parameters
Parameter Description
Format Select binary or hexadecimal as the format you will use to enter ID, DLC, and
Data values.
Trigger Sequence #
If/Else If
Trigger On Select the frame on which to trigger. The selections are: ID, ID and Data, Data
Frame, Remote Frame, Overload Frame.
ID
DLC Enter the data length count (DLC) for that frame (maximum of eight bytes).
Data Select the operator that defines whether the Data field in the CAN frame meets a
Then
Action #1 Set the action to any one: Trigger Out, Start Timer#1, Start Timer#2, Stop
Action #2 Set the action to any one: None, Trigger Out, Start Timer#1, Start Timer#2, Stop
Select the operator that defines whether the ID field in the CAN frame meets a
specified condition. The selections are: =, !=, <=, >, >=, Is in, Is not in.
specified condition. The selections are: =, !=, <=, >, >=, Is in, Is not in.
Timer#1, Stop Timer#2, Reset Counter#1, Reset Counter#2, Inc Counter#1, Inc
Counter#2, Dec Counter#1, Dec Counter#2, Go To Seq#1, Go To Seq#2, Go To
Seq#3.
Timer#1, Stop Timer#2, Reset Counter#1, Reset Counter#2, Inc Counter#1, Inc
Counter#2, Dec Counter#1, Dec Counter#2, Go To Seq#1, Go To Seq#2, Go To
Seq#3.
62 TDSVNM Timing and Protocol Decode Software
Page 73

Table 4-24: Advanced trigger parameters (cont.)
Parameter Description
Action #3 Set the action to any one: None, Trigger Out, Start Timer#1, Start Timer#2, Stop
Timer#1, Stop Timer#2, Reset Counter#1, Reset Counter#2, Inc Counter#1, Inc
Counter#2, Dec Counter#1, Dec Counter#2, Go To Seq#1, Go To Seq#2, Go To
Seq#3.
Note: The ID can be either Standard or Extended. If the ID value is greater
than an 11-bit value, the ID is considered as an Extended CAN message.
If the Trigger On selection is ID, ID & Data, Data Frame, or Remote Frame,
and operator selected is Is In or Is Not In, and if you enter an ID value
ranging from Standard ID to Extended, then TDSVNM takes the Frame Type
based on the number of bits entered in the 'To' field.
How to ...
Setting some bits in ID and DLC to a "Don't care" condition
(represented by Xs) is not allowed. If you do so, you will receive a
warning message after you click Apply.
However, Data values can have 'Don't care' bits.
Depending on the format selected, the virtual keyboard supports
hexadecimal or binary input.
7. Select the sequence using the Seq#1, Seq#2 or Seq#3 buttons. For each
sequence, you can set the CAN Type, Format, and define the Trigger
Sequence.
8. Select the frame on which to trigger. Based on the trigger type selected,
other options are enabled or disabled. The following table shows the
types of frames that you can select as a trigger source. Based on the
trigger-on source, the other selections change.
9. For each trigger sequence define the trigger events.
For a selected Trigger On source and trigger events, use the If-Then-Else
condition to set one or more actions. You can define Action#1,
Action#2, and Action #3 to any of the available selections. When the
TDSVNM Timing and Protocol Decode Software 63
Page 74

How to…
trigger condition that you have specified is met, the external trigger
module sends a trigger out to the oscilloscope.
Click OK to confirm the settings and return to the trigger pane.
10. Set ACK to Yes to receive an acknowledgement from the ATM-1
automotive trigger module. Otherwise, set ACK to No.
11. Click Tests > Connect to set up connections to decode the protocol.
Example:
An advanced trigger event can be defined as:
Seq 1:
If
Trigger on: ID = 568,
Action1: Go to Sequence 2 Action2: None Action3: None
Else If
Trigger on: None
Seq 2:
If
Trigger On: Remote Frame ID = 555
Action1: Start Timer1, Action2: Go to Sequence 3, Action3: None
Else if
Trigger On: None
Seq 3:
If
Trigger On: ID = 555,
Action1: Trigger Out, Action2: None, Action3 : None
Else If
Trigger On, Timer1 >= 5sec
Action1: Trigger Out, Action2: None, Action3: None
64 TDSVNM Timing and Protocol Decode Software
Page 75

Connect
How to ...
Connections for Protocol and Timing Tests
To carry out protocol and timing analysis tests, connect the oscilloscope,
CAN or LIN bus and ATM-1 automotive trigger module as given in the
following sections.
Connections for CAN Dual Wire
Connections for CAN Single Wire
Connections for CAN Fault Tolerant
Connections for LIN
Connections for CAN and LIN Protocols
Note: Propagation Delay and Wakeup Time tests do not require the ATM-1
automotive trigger module.
TDSVNM Timing and Protocol Decode Software 65
Page 76

How to…
Connections for CAN Dual Wire
On the menu bar, click Tests > Connect to make connections for protocol
decoding.
To carry out CAN Dual Wire Protocol and timing analysis tests, connect the
oscilloscope, CAN bus and ATM-1 automotive trigger module as shown in
Figure 4-30 and Figure 4-31.
Figure 4-30: Connections for CAN-DW-HL
66 TDSVNM Timing and Protocol Decode Software
Page 77

How to ...
Figure 4-31: Connections for CAN-DW-LH
To carry out CAN Dual Wire Protocol and Timing Analysis tests using DPOCAN bus trigger, connect the CAN bus to the oscilloscope as in Figure 4-32
and Figure 4-33.
TDSVNM Timing and Protocol Decode Software 67
Page 78

How to…
Figure 4-32: Connections for CAN-DW-LH when Trigger Using is set to DPO-CAN
Figure 4-33: Connections for CAN-DW-LH when Trigger Using is set to DPO-CAN
68 TDSVNM Timing and Protocol Decode Software
Page 79

Connections for CAN Single Wire
On the menu bar, click Tests > Connect to make connections for protocol
decoding.
To carry out CAN Single Wire Protocol and timing analysis tests, connect the
oscilloscope, CAN bus and ATM-1 automotive trigger module as shown in
Figure 4-34.
How to ...
Figure 4-34: Connections for CAN-SW
To carry out CAN Single Wire Protocol and Timing Analysis tests using
DPO-CAN bus trigger, connect the CAN bus to the oscilloscope as in
Figure 4-35.
TDSVNM Timing and Protocol Decode Software 69
Page 80

How to…
Figure 4-35: Connections for CAN-SW when Trigger Using is set to DPO-CAN
70 TDSVNM Timing and Protocol Decode Software
Page 81

How to ...
Connections for CAN Fault Tolerant
On the menu bar, click Tests > Connect to make connections for protocol
decoding.
To carry out CAN Fault Tolerant Protocol and timing analysis tests, connect
the oscilloscope, CAN bus and ATM-1 automotive trigger module as shown
in Figure 4-36 and Figure 4-37.
Figure 4-36: Connections for CAN-FT-HL
TDSVNM Timing and Protocol Decode Software 71
Page 82

How to…
Figure 4-37: Connections for CAN-FT-LH
To carry out CAN Fault Tolerant Protocol and Timing Analysis tests using
DPO-CAN bus trigger, connect the CAN bus to the oscilloscope as shown in
Figure 4-38 and Figure 4-39:
72 TDSVNM Timing and Protocol Decode Software
Page 83

How to ...
Figure 4-38: Connections for CAN-FT-LH when Trigger Using is set to DPO-CAN
Figure 4-39: Connections for CAN-FT-LH when Trigger Using is set to DPO-CAN
TDSVNM Timing and Protocol Decode Software 73
Page 84

How to…
Connections for LIN Protocol
On the menu bar, click Tests > Connect to make connections for protocol
decoding.
To decode the LIN protocol, connect the oscilloscope and the LIN bus as
shown in Figure 4-40.
Figure 4-40: Connections for LIN
74 TDSVNM Timing and Protocol Decode Software
Page 85

How to ...
Connections for CAN and LIN Protocols
On the menu bar, click Tests > Connect to make connections for protocol
decoding.
To decode the CAN and LIN protocols simultaneously, connect the
oscilloscope and the buses as shown in Figure 4-41.
Figure 4-41: Connections for CAN and LIN protocols
To decode the CAN and LIN protocol simultaneously using DPO-CAN bus
trigger, connect the CAN bus to the oscilloscope as shown in Figure 4-42.
Figure 4-42: Connections for CAN and LIN protocols when Trigger Using is set to
DPO-CAN
TDSVNM Timing and Protocol Decode Software 75
Page 86

How to…
View Results
Results Window
On the menu bar, click Results > Details to view the results of the selected
protocol or test.
If you chose protocol decoding in the selection panel, then the result
window shows the View Protocol Listing button. Click on this button to
display the results of protocol decoding in the Protocol Analysis
Window. If you chose the Advanced Trigger option, then the Timer1,
Timer2, Counter1, and Counter2 values are also displayed.
For the Oscillator Tolerance test, the window displays the Tolerance
range (minimum, maximum, and average) values. The results are shown
with and without the Ack bit.
For the Eye Diagram test, click the View Eye Diagram button to display
the Eye Diagram plot. The plot has an option to view the Eye Diagram
with or without the Ack bit used during clock recovery.
For the Bus Traffic test, the window displays two tabs: Load and Frame
Count. The Load tab displays the Load value (%) and the Bus
Occupancy pie chart. The Frame Count tab displays the individual frame
count and the total.
For the Data Rate test, the window displays the Data Rate range
(minimum, maximum, and average) values. The results are shown with
and without the Ack bit.
For the Wakeup Time test, the window displays the Wakeup Time value.
For the Propagation Delay test, the window displays the Propagation
Delay value.
76 TDSVNM Timing and Protocol Decode Software
Page 87

How to ...
Protocol Analysis Window
On the menu bar, click Results > Details to view the results of the selected
protocol.
When the external trigger module triggers the oscilloscope with a predefined
trigger condition, the waveform on the source channel is acquired. The signal
is decoded into CAN or LIN frames or messages. Each CAN or LIN frame
has a header, control bits, and the data bytes associated with it.
To analyze the signal conveniently, the CAN and LIN message frames are
listed in a tabular format. The table structure and its features are displayed on
a control window called the Protocol Analysis Window. The protocol
analysis window is not available for timing analysis tests.
The Protocol Analysis window provides the ability to analyze two bus signals
simultaneously.
Figure 4-43 shows the protocol analysis window and its areas.
Figure 4-43: Protocol analysis window
TDSVNM Timing and Protocol Decode Software 77
Page 88

How to…
Table 4-25 describes the areas of the protocol analysis window.
Table 4-25: Protocol analysis window areas
Area Description
Toolbar Displays the various controls to analyze the listed frames. You can expand or collapse the
toolbar using Hide/Show Controls button.
Readouts Displays the readouts of the Markers and the time difference between them.
Listing Displays the listing of the decoded frames in the table structure.
Markers Displays the markers associated with listing (M1 and M2).
Waveform Displays the waveform corresponding to the selected row in the listing.
Toolbar
The buttons that are available on the toolbar are described in Table 4-26.
Table 4-26: Protocol analysis window toolbar buttons and
descriptions
Toolbar buttons Action
Select a message on the protocol analysis window. Click Zoom1 or Zoom2.
This places the cursors and zooms the waveform on the oscilloscope to the
frame selected in the protocol analysis window.
Select a message on the protocol analysis window. Click M1. Select another
message and click M2. This places the markers, M1 and M2 on the selected
messages. For the second listing (in dual listing), use the M3 and M4 markers.
Click M1 to set the M1 message's timestamp to 0.0 sec. T0 now overlaps with
M1.
Click Trig Frame to set the T (default trigger frame) message's timestamp to
0.0 sec. T0 now overlaps with T.
Click this button to show or hide the toolbar controls.
Click Search to open a dialog box and define the search criteria. You can
search for message(s) based on ID, Data, IDE and Remote Frames (RTR bit
is used to search for Remote frame). For a LIN bus, the search fields are ID
and Data.
Click Filter to open a dialog box and define the filter criteria. You can filter and
view message(s) based on ID, Data, IDE and Remote Frames. For a LIN bus,
the search fields are limited to ID and Data.
Click CSV to save the decoded protocol frames as a CSV (comma separated
variable) file.
Links the decoded CAN message to YT display of the CAN frame and then to
the transducer output waveform. Link the analog waveform from the protocol
analysis window by pressing Link button (in Show Sensor Wfm). This places
the cursor on the waveform. The protocol analysis window is displayed in the
half-screen mode.
78 TDSVNM Timing and Protocol Decode Software
Page 89

Table 4-26: Protocol analysis window toolbar buttons and
descriptions (cont.)
Toolbar buttons Action
The Stuff Bit Wfm is applicable only to CAN messages.
Select a Ref waveform from the list. Click On to add stuff bits to the selected
destination reference waveform. Bit stuffing is active between SOF and CRC
fields (minus delimiter). The protocol analysis window is displayed in the halfscreen mode.
Click Configure to open a dialog box and configure the protocol analysis
window to show one or two buses (for dual listing), marker readouts, display
waveform, link timestamps (for dual listing), and the decoded data format.
Click Half Screen to display the Protocol Analysis window in the half-screen
display mode.
Note: Zoom2 is not available on the oscilloscope models TDS7054 and
TDS7104 with firmware version lower than 2.5.3.
How to ...
Readouts
The protocol analysis window displays the timestamps for the messages
associated with M1 and M2, and the time difference between the two cursors.
You can hide the readouts by using “X” button.
Listing
The protocol analysis window display is available only for protocol decoding.
If you decode only one bus, the protocol analysis window shows the decoded
listing of one bus. All the message fields are shown.
If you decode two buses, the protocol analysis window shows the individual
listing or combined listings of the buses. The individual listing shows all the
message fields.
The individual listing shows the following fields:
CAN message fields: ID, IDE, RTR, DLC, DATA, CRC, CRC DEL
ACK, ACK DEL, TIMESTAMP and FRAME INFO
LIN message fields: ID, ID FIELD, FRAME TYPE, DATA,
CHECKSUM, TIMESTAMP and ERROR
The combined listing shows the following selected fields:
CAN message fields: ID, DATA, ACK, TIMESTAMP and FRAME
INFO
LIN message fields: ID, DATA, TIMESTAMP and ERROR
TDSVNM Timing and Protocol Decode Software 79
Page 90

How to…
Markers
Use markers to mark a particular message frame on the listing and get the
time difference between the frames. The following markers are available for a
listing:
M1 (or M3; for simultaneous listings)
M2 (or M4; for simultaneous listings)
T0 (the zero timestamp reference): The T0 row is highlighted by default.
T (The immovable marker for the triggered frame on the oscilloscope)
You can place the markers in one of the following ways:
Hold and drag the marker (using the mouse) to the required message
frame on the protocol analysis window
Right-click and select from the shortcut menu
Waveform
The message frame for the selected message (row) is plotted at the bottom of
the listing window. The plot is reconstructed when the message selection
changes. The plot shows the message components with labels corresponding
to the protocol frame. The fields are divided as Header, Control, Data, and
Delimiter. Data and Remote frames can be displayed. If the selected frame is
an Error frame, then all fields except Data and CRC will not be displayed.
Half-Screen Window Display
Figure 4-44 shows the protocol analysis window in the half-screen mode.
Figure 4-44: Protocol analysis window in the half-screen mode
The protocol analysis window is shown in half-screen display when you want
to synchronize the selected message to the oscilloscope waveform in time
domain.
80 TDSVNM Timing and Protocol Decode Software
Page 91

How to ...
The half-screen mode is displayed when you:
Click the buttons (Zoom1 or Zoom2) grouped under Sync Scope to
Selected Row
Click the Link button in the Show Sensor Wfm group
Click the On button in Stuff Bit Wfm
The protocol analysis window is automatically displayed in the half-screen
mode overlaying the application's main window.
By default, in the half-screen mode, you can view the selected row. The table
height reduces and a scroll bar appears.
Click
window.
Shortcut Menu
The shortcut menu available on a right-click in the Protocol Analysis window
is as shown in Figure 4-45.
Figure 4-45: Shortcut menu
Table 4-27 lists the menu items and their descriptions.
or to restore the full screen display of the analysis
Table 4-27: Shortcut menu items and their descriptions
Menu Selection Description
Move M1 Here Moves Marker1 to the location of the mouse pointer in the Protocol Analysis window.
Move M2 Here Moves Marker2 to the location of the mouse pointer in the Protocol Analysis window.
Sync to Zoom1 Zooms the selected frame of waveform on the oscilloscope.
Sync to Zoom2 Zooms the selected frame of waveform on the oscilloscope.
Link Sensor Wfm Links the decoded CAN message to YT display of the CAN frame and then to the
transducer output waveform.
Search Opens a dialog box where you can define the search criteria.
Filter Opens a dialog box where you can define the filter criteria.
TDSVNM Timing and Protocol Decode Software 81
Page 92

How to…
Search
From the protocol analysis window toolbar, click the Search button (grouped
under Tools). A dialog box opens where you can define the search criteria.
Figure 4-46 shows the Search window.
Figure 4-46: Search window
Follow these steps to define a search.
1. From Search On, select the field to search on. The fields are: ID, Data,
IDE(0), IDE(1), RTR(0), and RTR(1). For a LIN bus, the search fields
are limited to ID and Data.
2. Select the operator. An operator is available only for ID and Data fields.
The operators are: =, !=, <, <=, >, >=, Is In, and Is Not In.
3. In the first field, enter a value. For range operators (Is-in and Is-not-in),
select the To value as well.
4. Click Search.
5. Click the Previous button to highlight and navigate through the previous
messages that satisfy the search definition. The Previous button is
disabled if the highlighted message is the first message.
Click the Next button to highlight and navigate through the next
messages that satisfy the search definition. The Next button is disabled if
the highlighted message is the last message. When no message meets the
search criteria, the following message appears: The Search/Filter
condition is not satisfied.
82 TDSVNM Timing and Protocol Decode Software
Page 93

Filter
From the protocol analysis window toolbar, click the Filter button (grouped
under Tools). A dialog box opens where you can define the filter criteria.
Figure 4-47 shows the Filter window.
Figure 4-47: Filter window
How to ...
Follow these steps to define a filter.
1. From Filter On, select the field to filter on. The fields are: ID, Data, IDE
and RTR. For a LIN bus, the fields available are ID and Data.
2. Select the operator. The operators are: =, !=, <, <=, >, >=, Is In, and Is
Not In.
3. In the first field, enter a value. For range operators (Is-in and Is-not-in),
select the To value as well.
4. Click the Apply button to apply the filter definition. Click the Clear
button to show all the messages without filtering. When no message
meets the filter criteria, the following message appears: The
Search/Filter condition is not satisfied.
TDSVNM Timing and Protocol Decode Software 83
Page 94

How to…
Configure View
From the protocol analysis window toolbar, click the View Configure button.
A dialog box opens where you can configure the view. Figure 4-48 shows the
Configure View window.
Figure 4-48: Configure View window
Select a bus (Bus1, Bus2, or Both) from the Listing Configuration
group. If you select Both, Link Timestamps is enabled. For a dual
listing, select Link Timestamps to link a row in one listing to the
corresponding row in the other listing.
Select Show Marker Readouts and Show Waveform from the Window
group to show/hide marker readouts and waveform.
Select the Format (Binary or Hex), to display the decoded values.
Note: When simultaneous listings are shown, the Format option is disabled
(displaying Hex).
84 TDSVNM Timing and Protocol Decode Software
Page 95

How to ...
Results for CAN Protocol
Results > Details
Once the protocol is decoded, the results are automatically displayed.
However, you can also select Results > Details and click Protocol Listing to
view the results.
Figure 4-49 shows the results of CAN protocol decoding.
Figure 4-49: Results of CAN protocol
TDSVNM Timing and Protocol Decode Software 85
Page 96

How to…
If you chose Advanced Trigger event in Trigger Setup, the results include the
Counter and Timer values as shown in the Figure 4-50.
Figure 4-50: Results of CAN protocol with advanced triggering
86 TDSVNM Timing and Protocol Decode Software
Page 97

How to ...
Results for LIN Protocol
Results > Details
Once the protocol is decoded, the results are automatically displayed.
However, you can also select Results > Details and click Protocol Listing to
view the results.
Figure 4-51 shows the results of LIN protocol decoding.
Figure 4-51: Results of LIN protocol
TDSVNM Timing and Protocol Decode Software 87
Page 98

How to…
Results for CAN and LIN Protocols
Results > Details
Once the protocol is decoded, the results are automatically displayed.
However, you can also select Results > Details and click Protocol Listing to
view the results.
Figure 4-52 shows the results of CAN and LIN protocol decoding.
Figure 4-52: Results of CAN and LIN protocols
88 TDSVNM Timing and Protocol Decode Software
Page 99

How to ...
Results for Eye Diagram
Results > Details
The result for the CAN Eye Diagram test is an Eye diagram plot. Click the
View Eye Diagram button to view a plot of the eye diagram.
Figure 4-53 shows the Eye Diagram with Ack bit information.
Figure 4-53: Eye diagram with Ack bit information
TDSVNM Timing and Protocol Decode Software 89
Page 100

How to…
Figure 4-54 shows the Eye Diagram without Ack bit information.
Figure 4-54: Eye diagram without Ack bit information
Use the toolbar to:
Save the Eye Diagram as a .jpg file
Zoom the Eye diagram
Reset the Eye diagram to its original display
View the cursor readouts
Click the Half Screen button to view the Eye Diagram display in half screen
mode.
90 TDSVNM Timing and Protocol Decode Software
 Loading...