

Page 1

xx
TDSUSB2
ZZZ
Universal Serial Bus Measurements Package
Online Help
*P077001507*
077-0015-07
Page 2

Page 3

TDSUSB2
Universal Serial Bus Measurements Package
ZZZ
Online Help
www.tektronix.com
077-0015-07
Page 4

Copyright © Tektronix. All rights reserved. Licensed software products are owned by Tektronix or its
subsidiaries or suppliers, and are protected by national copyright laws and international treaty provisions.
Tektronix products are covered by U.S. and foreign patents, issued and pending. Information in this
publication supersedes that in all previously published material. Specifications and price change privileges
reserved.
TEKTRONIX and TEK are registered trademarks of Tektronix, Inc.
Contacting Tektronix
Tektronix, Inc.
14150 SW Karl Braun Drive
P. O . B o x 5 0 0
Beaverton, OR 97077
USA
For p roduct information, sales, service, and technical support:
In North America, call 1-800-833-9200.
Worldwide, visit www.tektronix.com to find contacts in your area.
Page 5

Table of Contents
General Safety Summary
General Safety Summary .......................................................................................... 1
Introduction
Welcome to the TDSUSB2 Universal Serial Bus Measurements Package................................... 3
Online He
Printing from the Online Help..................................................................................... 5
Conventions.......... ................................ ................................ ............................... 5
Related Documentation ............................... ................................ ............................. 6
Feedback.................. ................................ .................................. ......................... 7
Getting Started
Introduction and Product Description ... ................................ ................................ ......... 9
Compatibility... . . .... ..... .... . .... ..... .... . .... ..... .... . .... ..... .... . .... ... . . .... . .... .... . .... . .... .... . .... . 10
Requirements and Restrictions................................................................................... 10
Accessories............................... .................................. ................................ ........ 10
Installation
Deskewing
lp and Related Documentation ......... ................................ ............................... 4
Setting up the Instrument to Take Measurements ... . .... ... . . .... . .... ..... .... . .... . .... .... . .... . .... .. 12
Installing the Application ... ..... .... . .... . .... .... . .... . .... ... . . .... . .... ..... .... . .... . .... ..... .... . .... . 12
Deskewing the Probes and Channels ............... ................................ ........................ 12
Deskewing Probes and Channels on the supported Instruments......................................... 13
Table of Contents
Operating Basics
About Basic Operations
About Basic Operations.............. .................................. ................................ ...... 19
Application Interface ......................................................................................... 19
Application Interface Menu Controls....................................................................... 20
Basic Instrument Functions
Using Basic Oscilloscope Functions.. . .... . .... . .... . .... ..... ..... .... . .... . .... . .... . .... ..... ..... .... . . 21
Minimizing and Maximizing the Application ................... .................................. ........ 21
Application Directories and File Names . ................................ .................................. 22
File Name Extensions ............ ................................ .................................. .......... 22
Returning to the Application ................................................................................ 23
Exiting the Application.... . .... .... . .... . .... ..... ... . . .... . .... . .... .... . .... . .... ..... .... . .... . .... . .... .. 23
Setting up the Software to take Measurements
Description of the Test Fixture .............................................................................. 23
Setting Up the Device Details .. . .... ... . . .... . .... .... . .... . .... .... . .... . .... .... . .... . .... .... . .... . .... .. 24
TDSUSB2 Universal Serial Bus Measurements Package i
Page 6

Table of Contents
Setting Up the Software ..... ... . . .... . .... . .... ..... ..... .... . .... . .... ..... ..... .... . .... . .... . .... . .... .... 25
Setting Preferences . .... . .... ..... .... . .... . .... ... . . .... . .... . .... ..... .... . .... . .... ... . . .... . .... . .... ..... 25
Table of Measurements and Options...................... .................................. ................ 28
Selecting a Measurement ...................... ................................ .............................. 30
Signal Quality Check... . .... . .... ..... ... . . .... . .... . .... ..... ..... .... . .... . .... ..... ..... .... . .... . .... . ... 32
Inrush Current Check....... ................................ ................................ .................. 33
Droop Measurement.......................................................................................... 34
Receiver Sensitivity Measurement.......................................................................... 35
Chirp Measurement........................................................................................... 36
Monotonic Property .......................................................................................... 37
Configuring a Measurement ................................................................................. 38
Configure Limits........ ................................ ................................ ...................... 38
Configuring Signal Quality Measurements .... . .... . .... ... . . .... . .... ..... .... . .... . .... ..... .... . .... . .. 39
Configuring Inrush Current Measurements ............ .................................. .................. 40
Configuring Droop Measurements.......................................................................... 40
Configuring Receiver Sensitivity Measurements.. ..... ... . . .... . .... . .... ... . . .... . .... . .... . .... .... . ... 41
Configuring Chirp Measurement.. ................................ ................................ .......... 42
Configuring Resume Measurement......................................................................... 44
Configuring Suspend Measurement ........................................................................ 45
Configuring Reset from Suspend Measurement ........................... ................................ 46
Configuring Packet Parameter Measurement .............................................................. 46
Packet Parameter Measurement............................................................................. 48
Suspend Measurement ....................................................................................... 4
Resume Measurement........ ................................ .................................. .............. 50
Reset from Suspend Measurement.......................................................................... 51
Reset from High Speed Measurement...................................................................... 52
Taking Measurements
Acquiring Data................................................................................................ 52
Control Menu Options ....................................................................................... 54
Viewing Results............................................................................................... 55
Report Generation
Generating Reports ........................................................................................... 59
Viewing Reports .. .................................. ................................ .......................... 61
TSV File Generator................... ................................ ................................ ........ 62
Saving and Recalling Setups
How to Save and Recall a Setup .. ................................ .................................. ........ 63
Saving a Setup ........ ................................ ................................ ........................ 64
Recalling a Saved Setup ... .... . .... . .... . .... . .... .... . .... . .... . .... . .... ..... ... . . .... . .... . .... ..... ... . . 65
Recalling the Default Setup. . .... ... . . .... . .... . .... ..... .... . .... . .... ... . . .... . .... . .... ..... .... . .... . .... 66
Recently Saved Setup .......... ................................ ................................ .............. 67
Recently Recalled Setup ..................................................................................... 67
9
ii TDSUSB2 Universal Serial Bus Measurements Package
Page 7

Tutorial
Introduction to the Tutorial....................................................................................... 69
Starting the Application. .................................. ................................ ........................ 69
Recalling a .tsv File .. .... . .... . .... ..... .... . .... . .... .... . .... . .... ... . . .... . .... ..... .... . .... . .... ..... .... . ... 69
Taking a Full Speed Signal Quality Measurement . .... . .... . .... ..... ... . . .... . .... . .... .... . .... . .... ..... ... 70
Taking a Low Speed Inrush Current Measurement .. ................................ .......................... 71
Taking a High Speed Signal Quality Measurement...... ................................ ...................... 72
Taking a Low Speed Signal Quality Measurement . . .... .... . .... . .... . . .... . ..... . .... . ..... . .... . ..... . .... . 73
Application Examples
About Application Examples....................... ................................ .............................. 75
Full Speed Signal Quality Tests for Downstream Testing
Specifying the Equipment-Full Speed Signal Quality Downstream Tests.............................. 75
Typical Equipment Setup-Full Speed Signal Quality Downstream Tests . .... ..... .... . .... . .... .... . . 75
Selecting
Viewing Results-Full Speed Signal Quality Tests. .... .... . .... . .... .... . .... . .... .... . .... . .... .... . .... . 78
Generating Reports-Full Speed Signal Quality Tests ..................................................... 79
Droop Test for Ports of Hub
Specifying the Equipment-Low Speed Droop Tests ...................................................... 79
Typical Equipment Setup-Low Speed Droop Tests ............. .................................. ........ 79
Selecting and Configuring Measurements-Droop Tests .................................................. 82
Viewing Results-Droop Tests................................................................................ 82
Generating Reports-Droop Tests ............................................................................ 83
Full Speed Signal Quality Tests for Upstream Testing
Specifying the Equipment-Full Speed Signal Quality Tests for Upstream Testing.................... 83
Typical Equipment Setup-Full Speed Signal Quality Tests for Upstream Testing... . .... .... . .... . ... 83
Selecting and Configuring Measurements-Full Speed Signal Quality Tests for Upstream Testing.. 84
Viewing Results-Full Speed Signal Quality Tests for Upstream Testing .... . .... ..... ..... .... . .... . .. 86
Generating Reports-Full Speed Signal Quality Tests for Upstream Testing ..................... ...... 86
Inrush Current Test for a device
Specifying the Equipment-Full Speed Inrush Current Test .......... ................................ .... 86
Typical Equipment Setup-Inrush Current Test............................................................. 87
Selecting and Configuring Measurements-Inrush Current Test.. ................................ ........ 89
Viewing Results-Inrush Current Test....................................................................... 89
Generating Reports-Inrush Current Test ................................................................... 90
View Inrush Measurements Report in CSV format ................... .................................. .. 91
High Speed Report in Tektronix Format ................................................................... 92
View Procedural Steps from the Application .............................................................. 92
View Waveform Plot for Signal Quality Check High Speed Devices. . .... . .... . .... . .... . .... . .... . ... 95
View Chirp Measurement Results .......................... ................................ ................ 96
Signal Quality Tests for High Speed Devices
Specifying the Equipment-Signal Quality Tests for High Speed Devices for Upstream Testing .... 96
and Configuring Measurements-Full Speed Signal Quality Tests .... . .... .... . .... . .... ... . 76
Table of Contents
TDSUSB2 Universal Serial Bus Measurements Packa ge iii
Page 8

Table of Contents
Typical Equipment Setup-Signal Quality Tests for High Speed Devices for Upstream Testing ... .. 97
Selecting and Configuring Measurements-Signal Quality Tests for High Speed Devices for Upstream
Viewing Results-Signal Quality Tests for High Speed Devices for Upstream Testing.. . . .... . .... . 101
Generating Reports-Signal Quality Tests for High Speed Devices for Upstream Testing... . .... . . 102
Packet Parameter Measurement
Specifying the Equipment-Packet Parameter Measurement ........................................... 102
Selecting and Configuring Measurement-Packet Parameter Measurement .................. ........ 102
Viewing Results-Packet Parameter Measurement............................. .......................... 104
Generating Reports-Packet Parameter Measurement................................................... 105
Resume Measurement
Specifying the Equipment-Resume Measurement ................ ................................ ...... 108
Typical Equipment Setup-Resume Measurement ......... ................................ .............. 109
Selecting and Configuring Measurement-Resume .................... .................................. 110
Viewing Results-Resume Measurement............................................ ...................... 111
Generating Reports-Resume Measurement.... ................................ .......................... 111
Reset from Suspend Measurement
Specifying the Equipment-Reset from Suspend Measurement ................ ........................ 113
Typical Equipment Setup-Reset from Suspend Measurement ........................... .............. 113
Selecting and Configuring Measurement-Reset from Suspend Measurement ....................... 115
Viewing Results-Reset from Suspend Measurement ................................................... 115
Generating Reports-Reset from Suspend Measurement.............. ................................ .. 117
Suspend Measurement
Specifying the Equipment-Suspend Measurement...................................................... 118
Typical Equipment Setup-Suspend Measurement....................................................... 119
Selecting and Configuring Measurement-Suspend Measurement ..................................... 120
Viewing Results-Suspend Measurement ................................................................. 120
Generating Reports-Suspend Measurement.............................................................. 122
Reset From High Speed Measurement
Specifying the Equipment-Reset from High Speed Measurement .................................... 123
Typical Equipment Setup-Reset from High Speed Measurement ........... .......................... 124
Selecting and Configuring Measurement-Reset from High Speed Measurement ................... 126
Viewing Res
Generating Reports-Reset from High Speed Measurement ............................................ 128
Chirp Measurement
Specifying the Equipment-Chirp.... ................................ .................................. .... 129
Typical Equipment Setup-Chirp................................. ................................ .......... 130
Selecting and Configuring Measurement-Chirp............. ................................ ............ 133
Viewing Results-Chirp ..................................................................................... 133
Generating Reports-Chirp ................................................................................. 135
View High Speed Measurement Plug-Fest Specific Format . ................................ .......... 138
View Full Speed Measurements Report in Plug-Fest Specific Format................................ 139
Testing....................................... .................................. ............................ 99
ults -Reset from High Speed Measurement............. ................................ .. 126
iv TDSUSB2 Universal Serial Bus Measurements Package
Page 9

View Signal Quality Check Eye Diagram.. . .... . .... .... . .... . .... ..... .... . .... . .... ..... .... . .... . .... 140
View Signal Quality Check Waveform Plot . . .... . .... ... . . .... . .... ..... .... . .... . .... ..... .... . .... . .. 141
View the Report for Full Speed Measurements .............................................................. 142
View Inrush Results Details .................................. ................................ .................. 142
View Waveform Plot for Full Speed Signal Quality Check Measurements ..... .... . .... . .... ..... ... . . .. 143
View Signal Quality Check Details.. . .... . .... ..... ..... .... . .... . .... . .... ..... .... . .... . .... . .... . .... .... . . 143
View Eye Diagram for F
View Eye Diagram For High Speed Measurements ......................................................... 144
View Waveform Plot For High Speed Measurements ... ................................ .................... 145
View Signal Quality Check Results Details . . .... .... . .... . .... . .... . .... .... . .... . .... . .... . .... .... . .... . .. 146
View Sample Report File for Inrush Current Check ........................... .............................. 147
R-GPIB Commands
About the R-GPIB Program.. ................................ ................................ .................. 149
R-GPIB Reference Materials ................................................................................... 149
Introduction to R-GPIB command
Guidelines to R-GPIB Programming.......................................................................... 150
Launching the Application using R-GPIB .......... ................................ .......................... 150
Variable: Value Command...................................................................................... 151
Variable: Value TDSUSB2 Command Arguments and Queries- Application ............................ 151
Variable: Value TDSUSB2 Command Arguments and Queries- Sequencer.............................. 151
Variable: Value TDSUSB2 Command Arguments and Queries-Confirm Waveform...... .............. 152
Variable: Value TDSUSB2 Command Arguments and Queries- Save/Recall ............................ 152
Variable: Value TDSUSB2 Command Arguments and Queries- Report Generation .................... 153
Variable: Value TDSUSB2 Command Argume
Sample Program ................................................................................................. 157
Table of Contents
ull Speed Signal Quality Check Measurements ................. ................ 144
s............................................................................ 149
nts and Queries- Results ................................. 153
Reference
Shortcut Keys .................. ................................ .................................. ................ 165
USB2.0 Specifications .. ................................ .................................. ...................... 165
Error Codes and Warnings........................................ ................................ .............. 168
Settings for the supported Instruments .. . . .... . .... . .... ... . . .... . .... . .... . .... .... . .... . .... . .... . .... .... . . 176
Parameters
About Application Parameters ............................................................................ 183
File Menus
File Menu Parameters ................................................................................. 184
Save and Recall Menu Parameters ............................. .................................. .... 184
Preferences Parameters................................................................................ 185
Measurement Menus
Measurement Menus................................................................................... 185
Measurement Parameters ..................... .................................. ...................... 185
Configure Menus
TDSUSB2 Universal Serial Bus Measurements Packa ge v
Page 10

Table of Contents
Results Menu
Utilities Menus
Help Menu
Control Menu
Measurement Algorithms
About Measurement Algorithms .................................. ................................ ........ 192
Cross-Over Voltage for Low Speed and Full Speed Signals ......................... .................. 193
Cross-Over Voltage for High-Spe
Signal Rate ............ ................................ ................................ ...................... 196
EOP Width Calculation .................................................................................... 197
Consecutive and Paired Jitter .... . .... . .... . .... . .... . .... . .... .... . .... . .... . .... . .... . .... . .... ... . . .... . 197
Eye Diagram .............. .................................. ................................ ................ 199
Eye Violation................................................................................................ 199
Inrush Current............................................................................................... 199
Droop Test ................................................................................................... 20
Receiver Sensitivity Test................................................................................... 202
Chirp Test for a Device..................................................................................... 203
Host Chirp Test.............................................................................................. 203
Monotonic Property Test......................... ................................ .......................... 204
Rising Edge Rate.......... ................................ .................................. ................ 204
Falling Edge Rate .... . .... . .... . .... .... . .... . .... . .... . .... .... . .... . .... . .... . .... .... . .... . .... . .... . .... 205
Packet Parameter............................................................................................ 205
Resume....................................................................................................... 206
Suspend ...................................................................................................... 207
Reset from Suspend ...................... ................................ ................................ .. 208
Reset from High Speed..................................................................................... 209
Equipment Setup for Tests
Configure Menu .............................. ................................ .......................... 187
Configure Signal Quality Measurements Parameters .... ..... ..... .... . .... . .... . .... . .... . .... . .. 187
Configure Inrush Current Measurement Parameters ............................................... 188
Configure Droop Test Parameters........................ .................................. .......... 189
Configure Receiver Sensitivity ... . .... ..... .... . .... . .... . .... ..... .... . .... . .... . .... ..... .... . .... . 189
Configure Suspend, Reset from High Speed, Resume, Reset from Suspend .................... 189
Configure Packet Parameter .......................................................................... 190
Configure Chirp ........................................................................................ 190
Results Menus.......................................................................................... 191
Utilities Menus .... . .... . .... . .... . .... . .... . .... . .... ..... ..... ..... ..... .... . .... . .... . .... . .... . .... . 191
Deskew.................. ................................ .................................. .............. 191
Report Generator Menu Parameters ............... ................................ .................. 191
TSV File Generator Menu Parameters................................... ............................ 192
Help Menu .......................... ................................ .................................. .. 192
Control Menu Parameters... ................................ ................................ .......... 192
ed Signals......................................... .................... 194
1
vi TDSUSB2 Universal Serial Bus Measurements Package
Page 11

Glossary
Glossary .................... ................................ ................................ ...................... 233
Table of Contents
Low Speed Downstream Signal Quality Host Equipment Setup ... . .... . .... ... . . .... . .... ... . . .... . . 209
Low Speed Signal Quality for HUB Downstream . . .... ..... ..... .... . .... . .... . .... . .... .... . .... . .... 210
Full Speed Sig
Full Speed Downstream Host Equipment Setup ........................ ................................ 212
Full Speed Upstream Signal Quality Setup . ..... .... . .... . .... . .... . .... ..... ..... .... . .... . .... . .... . .. 213
High Speed Device Signal Quality Setup .... . .... . .... .... . .... . .... .... . .... . .... ..... .... . .... . .... ... 215
Chirp Test Equipment Setup........................... ................................ .................... 215
Receiver Sensitivity Setup . .... . .... . .... ... . . .... . .... . .... . .... .... . .... . .... . .... . .... .... . .... . .... . ... 217
Inrush set
Resume Test Equipment Setup .......................... ................................ .................. 219
Reset from Suspend Test Equipment Setup.............................. ................................ 220
Suspend Test Equipment Setup............................................................................ 221
Reset from High Speed Test Equipment Setup ............................ .............................. 222
Packet Parameter Test Equipment Setup................................................................. 223
nal Quality HUB Downstream Setup. .... . .... .... . .... . .... ... . . .... . .... .... . .... . .... 211
up.................. ................................ ................................ ................ 217
Index
TDSUSB2 Universal Serial Bus Measurements Packa ge vii
Page 12

Table of Contents
viii TDSUSB2 Universal Serial Bus Measurements Package
Page 13

General Safety Summary General Safety Summary
General Safety Summary
Review the following safety precautions to avoid injury and prevent damage to this product or any
products connected to it. To avoid potential hazards, use this product only as specified.
Only qualified personnel should perform service procedures. While using this product, you may need to
access other parts of the system.
Read the General Safety Summary in other system manuals for warnings and cautions related to operating
the system .
To avoid Fire and Personal Injury
Use Proper Power Cord. Use only the power cord specified for this product and certified for the country
of use.
Connect
connecting the probe to the circuit under test. Disconnect the probe input and the probe ground from the
circuit under test before disconnecting the probe from the measurement oscilloscope.
Ground the Product. This product is indirectly grounded through the grounding conductor of the
mainframe power cord. To avoid electric shock, the grounding conductor must be connected to earth
groun
is properly grounded.
Observe All Terminal Ratings. To a void fire or shock hazard, observe all ratings and markings on the
product. Consult the product manual for further ratings information before making connections to the
product.
Use Proper AC Adapter. Use only the AC adapter specified for this product.
Use Proper Fuse. Use only the fuse type and rating specified for this product.
Do Not Operate With Suspected Failures. If you suspect there is damage to this product, have it inspected
yqualified service personnel.
b
Do Not Operate in Wet/Damp Conditions.
and Disconnect Properly. Connect the probe output to the measurement oscilloscope before
d. Before making connections to the input or output terminals of the product, ensure that the product
Do Not Operate in an Explosive Atmosphere.
Keep Product Surfaces Clean and Dry.
TDSUSB2 Universal Serial Bus Measurements Packa ge 1
Page 14
General Safety Summary General Safety Summary
Terms in this Manual
These terms may appear in this manual:
WARNING. Warning statements identify conditions or practices that could result in injury or loss of life.
CAUTION. Caution statements identify conditions or practices that could result in damage to t his product
or other property.
Terms on the Product
These terms may appear on the product:
DANGER indicates an injury hazard immediately accessible as you read the marking.
WARNING indicates an injury hazard not immediately accessible as you read the marking.
CAUTION
indicates a hazard to property including the product.
Symbols on the Product
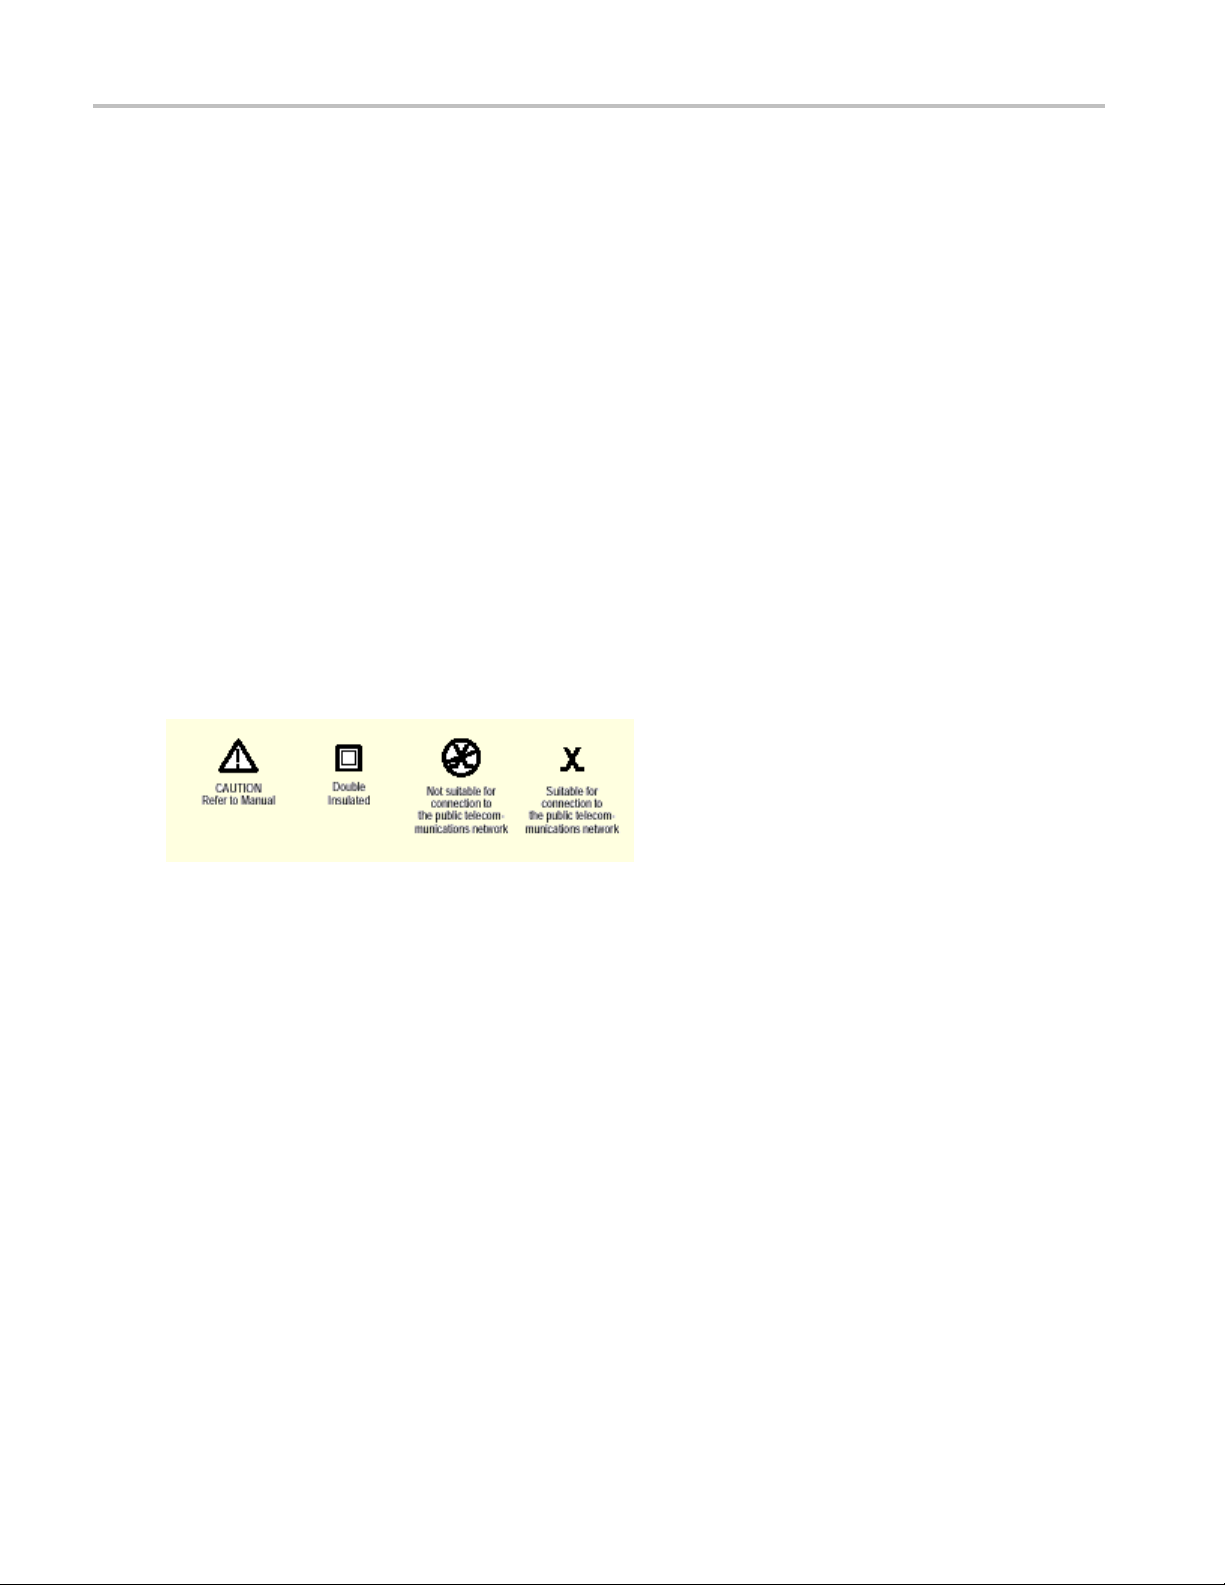
The following symbol(s) may appear on the product:
2 TDSUSB2 Universal Serial Bus Measurements Package
Page 15

Introduction Welcome to the TDSUSB2 Universal Serial Bus Measurements P ackage
Welcome to the TDSUSB2 Universal Serial Bus Measurements Package
TDSUSB2 Universal Serial Bus Measurements Package is a Sun Java-based application that runs on the
supported instruments connected to a PC. You can use the application software with the compliance
test fixture to take the following measurements:
Signal Quality
Inrush
Droop
supported by the test fixture only)
Drop (
Receiver Sensitivity
Impedance Measurement using Time Domain Reflectometry (TDR), supported by the application
only with the test fixture
Chirp measurements
Packet Parameter
Resume
Reset from Suspend
eset from High Speed
R
Suspend
The application runs on the oscilloscope and displays on the lower part of the screen. The oscilloscope
application runs on the upper part of the screen.
TDSUSB2 Universal Serial Bus Measurements Packa ge 3
Page 16

Introduction Online Help and Related Documentation
What do you want to do?
Online Help and Related Documentation (see page 4)
Introduction and Product Description (see page 9)
Installing the Application (see page 12)
TIP. To return to the Table of Contents, select Help Topics from the Help Topic Menu.
Online Help and Related Documentation
You can access the information on how to operate the application and the oscilloscope through the
following related documents and online help.
Click Start > Programs > TekApplications > TDSUSB2 > Help to access the Online Help.
Click St
version of the Online Help.
Click S
Test procedure.
Click
Test procedure.
Clic
Test procedure.
Clic
Reference Card.
art > Programs > TekApplications > TDSUSB2 > Help (PDF Version) to access the PDF
tart > Programs > TekApplications > TDSUSB2 > Host Test Procedure to access the Host
Start > Programs > TekApplications > TDSUSB2 > Hub Test Procedure to access the Hub
k Start > Programs > TekApplications > TDSUSB2 > Device Test Procedure to access the Device
k Start > Programs > TekApplications > TDSUSB2 > Quick Reference Card to access the Quick
See Also
Conventions (see page 5)
Related Documentation (see page 6)
ontacting Tektronix
C
Feedback (see page 7)
)
4 TDSUSB2 Universal Serial Bus Measurements Package
Page 17

Introduction Printing from the Online Help
Printing from the Online Help
Some online help topics have color in the examples of the displayed application. If you want to print
this type of topic on a monochrome printer, some information may not print because of certain colors.
Instead, you
Online Help. You can find the file in the Documents directory o n the Optional Applications Software on
Windows-Based Oscilloscopes DVD.Thefigures of application menus in the PDF file are gray scale and
all of the information prints.
should print the topic from the PDF (portable document format) file that corresponds to the
Conventions
Online help uses the following conventions:
Refers to the software p art of the TDSUSB2 Universal Serial Bus Measurements Package as the
TDSUSB2 application or as the application.
When steps require a sequence of selections using the application interface, the ">" delimiter marks
each transition between a menu and an option. For example, one of the steps to recall a setup file
would appear as File > Recall.
Unit under test (UUT) refers to the USB2.0 device under test, hub under test, host under test, and
port under test.
SOF refers to the Start of Frames exchanged between the host controller and the device when the
device is connected to the host and enumerated by the test mode software.
TDSUSB2 Universal Serial Bus Measurements Package 5
Page 18

Introduction Related Documentation
Related Documentation
In addition to the Online Help, you can access other information on how to operate the oscilloscope
through the following related documents:
Instrument Information: The user manual for your o scilloscope provides general information on how
to operate the oscilloscope.
Programmer Information: The online help for your oscilloscope provides details on how to use GPIB
commands to control the oscilloscope.
TIP. Yo u ca
from the Tektronix Web site.
Optional
TDSUSB2 Universal Serial Bus Measurements Package Reference
TDSUSBF USB2.0 Compliance Test Fixture Instructions
For more information on USB2.0 specifications, visit www.usb.org.
Refer to the Optional Applications Software on Windows-Based Oscilloscopes Installation Manual for the
following information:
Software warranty
List of all available applications, compatible instruments, and r elevant software and firmware version
numbers
Applying a new label
Ins
Enabling an application
Downloading updates from the Tektronix Web site
n also download the following fi les, which contain programmer information and examples,
Applications Software on Windows-Based Oscilloscopes Installation Manual
tallation an application
You ca n find a PDF (portable document format) file of this document in the Documents directory on the
Optional Applications Software on Windows-Based Oscilloscopes DVD. The DVD booklet only c ontains
information on installing the application from the DVD and on how to apply a new label.
6 TDSUSB2 Universal Serial Bus Measurements Package
Page 19

Introduction Feedback
Feedback
Tektronix values your feedback on our products. To help us serve you better, please send us your
suggestions, ideas, or comments about your oscilloscope.
Direct your feedback via email to
techsupport@tektronix.com or FAX at (503) 627-5695
and include the following information. Please be as specific as possible.
General information:
Instrumen
Probes used
Your name, company, mailing address, phone number, FAX number
Please indicate if you would like to be contacted by Tektronix about your suggestion or comments
Application specific information:
Software version number
Descri
If possible, save the oscilloscope and application setup files as .set files
If possible, save the waveform on which you are performing the measurement as a .wfm file
Once you have gathered this information, you can contact technical support by phone or through e-mail. If
using e-mail, be sure to enter in t he subject line "TDSUSB2 Problem," and attach the .set and .wfm files.
TIP. To include screen shots from the oscilloscope menu bar, select File> Export Setup> Image tab or File
ve > Screen Capture. Save the screen shot in the default directory or you can choose a directory of
>Sa
your choice. If you want the screen shots in color, select Edit> Copy setup> Images tab or select File
> Save > Screen Capture and select Options to get the Screen Capture Save Option dialog box. Select
the Color, Full Screen and the Normal option buttons. Select Copy. Copy the picture to any Paint editor
software. You can then attach the file to your email (depending on the capabilities of your email editor).
t model number and hardware options, if any
ption of the problem such that technical support can duplicate the problem
TDSUSB2 Universal Serial Bus Measurements Packa ge 7
Page 20

Introduction Feedback
8 TDSUSB2 Universal Serial Bus Measurements Package
Page 21

Getting Started Introduction and Product Description
Introduction and Product Description
The TDSUSB2 Universal Serial Bus Measurements package, consists of a Java-based application and a
comprehensive test fixture. You can use the application software with the compliance test fixture to take
the followin
Signal Quality
Inrush
Droop
Drop (supported by the test fixture only)
Receiver Sensitivity
g measurements:
Impedanc
only with the test fixture
Chirp me
Packet Parameter
Resume
Reset from Suspend
Reset from High Speed
Suspend
pplication performs tests that measure the test signals for USB2.0 compliance, displays eye diagrams
The a
and plots, displays the results as a summary or as details, and generates reports in different formats.
e Measurement using Time Domain Reflectometry (TDR), supported by the application
asurements
What do you want to do?
Accessories (see page 10)
Compatibility (see page 10)
equirements and Restrictions
R
Installing the Application (see page 12)
(see page 10)
TDSUSB2 Universal Serial Bus Measurements Packa ge 9
Page 22

Getting Started Compatibility
Compatibility
For information on oscilloscope compatibility1, refer to the Optional Applications Software on
Windows-Based Oscilloscopes Installation Manual, Tektronix part number 071-1888-XX. The manual is
also availab
should be at least ± 8 volts. For High Speed testing, the dynamic range should be ± 2 volts.
1
For a current
le as a PDF file. The dynamic range of the probes used for Low Speed and Full Speed testing
list of compatible instruments, see the Software and Drivers category on the Tektronix Web site.
Requirements and Restrictions
You must install Java Run-Time Environment V1.4.2_02 on the supported oscilloscope.
The application uses the Math1 channel for Low Speed, Full Speed, and Single-ended High Speed Signal
Quality modes of operation. You will lose any information that you have stored in the Math1 channel.
You cannot restore the oscilloscope settings if you select File > Exit from the application.
Accessories
The application include s the following standard accessories:
Optional Application Software on Windows-Based Instruments DVD
Optional Application Software on Windows-Based Instruments Installation Manual
TDSU
TDSUSBF USB2.0 Compliance Test Fixture Instructions
TDSUSBF USB2.0 Compliance Test Fixture (Revision B)
Optional Accessories:
Signal Source (for Receiver Sensitivity Tests):
DTG5334 or DTG5274 or DTG5078 with a DTGM 21 Output module-Data G enerator
AWG5 000 ser ies (AWG 500 2) or AWG7000 series
TDSUSBF USB2.0 Compliance Test Fixture (Revision B)
1
X5 attenuators required when using AWG models.
SB2 Universal Serial Bus Measurements Package Reference
1
10 TDSUSB2 Universal Serial Bus Measurements Package
Page 23

Getting Started Accessories
Voltage Probes:
HP62481, P6330- High Bandwidth Differential Probe
H P6245 or P6243- High Bandwidth Single-ended Active Probe
1
The P6248 probe is approved for compliance testing, higher performance differential probes may be used for design applications. It is recommended
to have an attenuation of divide by 1 for better results.
For DPO7000 series:
TDP1500 or TDP3500
TAP1500
P6248, P6330, or P6245 (these require TPA-BNC Adapter on DPO7000 series models)
2SMAcabl
es with SMA connectors for single-ended HS Signal Quality measurements
Current Probes:
TCP0030
TCP202
(requires TPA-BNC Adapter on DPO7000 series models)
TDR Measurements (for I mpedance Measurement test):
Tektronix DSA8000 Sampling Oscilloscope with Time Domain Reflectometer (TDR) Sampling
Module
Deskew Fixture: for supported instrument-Probe Calibration and Deskew Fixture, Tektronix part number
(067-0405-XX)
6-inch AB Cable with USB-IF compliance logo tag
NOTE. Any references to standard cable or standard length of cable in all TDSUSB manuals refers to
"6-inch AB Cable (standard USB cable with USB-IF compliance logo tag)", and references to USB
cablerefersto"1-metreUSBcable”.
TDSUSB2 Universal Serial Bus Measurements Packa ge 11
Page 24

Getting Started Setting up the Instrument to Take Measurements
Setting up the Instrument to Take Measurements
To set up the oscilloscope, follow these steps:
1. You must power on the oscilloscope for twenty minutes before you can start to take measurements.
2. You must run the compensation signal path on the oscilloscope.
3. You must make sure that the default factory setup is recalled before you start using the application in
the oscilloscope. To do so, push the recall default setup button on the front-panel of the oscilloscope
to recall the default factory settings.
4. You should always use calibrated probes and degauss the current probes.
Recommended Instruments and Probes
Forinformationonrecommendedinstrumentsandprobes,refertotheOptional Application Software on
Windows-Based Oscilloscopes Installation Manual.
Installing the Application
Refer to the Optional Applications Software on Windows-Based Instruments Installation Manual for the
following information:
Installing an application
Applying a new label
Enabling an application
nloading updates from the Tektronix Web site
Dow
You ca n find a PDF (portable document format) file of this document in the Documents directory on the
tional Applications Software on Windows-Based Instruments DVD. The DVD booklet only contains
Op
information on installing the application from the DVD and on how to apply a new label.
Deskewing the Probes and Channels
To ensure accurate measurements, you must des kew the probes before you take measurements from your
unit under test. The deskew process is where the oscilloscope adjusts the relative delay between the signals
to accurately time correlate the displayed waveforms.
The application includes an automated deskew utility that you can use to deskew any pair of oscilloscope
channels.
12 TDSUSB2 Universal Serial Bus Measurements Package
Page 25

Getting Started Deskewing Probes and Channels on the supported Instruments
NOTE. It is recommend that you use the deskew fixture specified in the accessories section to perform
deskew. The deskew source can be the built-in probe compensation signal in the oscilloscope or an
external sign
NOTE. The oscilloscope has a deskew range of 50 n s.
al source.
See Also
Deskewing P
robes and Channels on the supported Instruments
(see page 13)
Deskewing Probes and Channels on the supported Instruments
To deskew probes and channels on the supported instruments, follow these steps:
1. Connect the probes to Ch1 and Ch2 on the oscilloscope.
2. Connect the probe compensation signal to the deskew fixture. You can use the probe compensation
signal from the oscilloscope as the source for the deskew fixture.
3. Follow the on-screen prompts for the deskew operation with an external source.
The following figure shows signals before performing the deskew procedure with a single edge.
TDSUSB2 Universal Serial Bus Measurements Packa ge 13
Page 26

Getting Started Deskewing Probes and Channels on the supported Instruments
4. To start the application from a supported oscilloscope, select File > Run Application > USB2.0 Test
Package from the menu bar of the oscilloscope.
5. Select Utilities> Deskew.
6. Set the channel Source in the From area to Ch1. The Source waveform is the reference point to which
the remaining channels are deskewed.
7. Set the channel Source in the To area to Ch2, to deskew the channel.
8. Select the Reference Level for Ch1 and set the reference value. The reference level is the percentage
level of the waveform from which to take the edges to deskew.
9. Select the Reference Level in the To area for Ch2 and set the reference value.
10. Select the Hysteresis in the From area for Ch1. Hysteresis
level in the waveform.
11. Select the Hysteresis in the To area for Ch2 and set the hysteresis value.
elect the Slope, Rise or Fall, on which to perform the deskew operation.
12.S
13. Select the number of edges used for deskew.
(see page 18) helps to ignore the noise
14 TDSUSB2 Universal Serial Bus Measurements Package
Page 27

Getting Started Deskewing Probes and Channels on the supported Instruments
14. To start the deskew utility, select Utilities> Perform Deskew and confirm the operation.
15. Without changing the From: Ch1 channel, deskew the remaining channels.
The next figure shows the results after performing the deskew operation with a single edge. The reference
level is set to 50% for Ch1 and Ch2, the hysteresis is set to 5%, the number of edges is set to 1, and the
slope is set to the rising edge.
NOTE. The probe compensation signals varies from 0.8to1volt(forallsupportedTDSinstruments)
and from 0.3
traditional oscilloscope. Set the Reference level and the Hysteresis level appropriately so that the Ref
level is at the middle of the swing on the signal.
5 to 1 volt (for all supported DPO instruments) rather than swinging from 0 to 1 volt in a
To perform the deskew operation with an external source, follow these steps:
1. Co
2. Connect an external source to the deskew fixture.
3. Follow the instructions of the Probe Calibration and Deskew fixture (Tektronix part number:
TDSUSB2 Universal Serial Bus Measurements Packa ge 15
nnect the probes to Ch1 and Ch2 on the oscilloscope.
067-0405-xx) to make the connections.
Page 28

Getting Started Deskewing Probes and Channels on the supported Instruments
4. Set up the oscilloscope as follows:
Use the Horizontal Scale knob to set the oscilloscope to an acquisition rate so that there are two or
more samples on the deskew edge.
Use the Ve rtical Scale and Position knobs to adjust the signals to fill the display without missing
any part of the signals.
Set the Record Length so that there are more samples for the edges in the acquisition. It is
recommended that you set the record length to 25000 points.
5. To start the application from a supported oscilloscope, select File > Run Application > USB2.0 Test
Package from the menu bar of the oscilloscope.
6. Select Utilities > Deskew.
7. Set the channel Source in the From area to Ch1. The remaining channels are deskewed to the Source
waveform, which is the reference point.
8. Set the channel Source in the To area to Ch2, the channel to be deskewed.
9. Select the Reference Level for Ch1. The reference level is the percentage level of the waveform from
whichtotaketheedgestodeskew.
10. Select the Reference Level in the To a r ea for Ch2 and set the reference value.
11. Selec
12. Sele
13. Select the Slope, Rise or Fall, on which to perform the deskew operation.
14. Select the number of edges used for deskew.
15. To start the deskew utility, select Utilities> Perform Deskew and confirm the operation.
16. Without changing the From: Ch1 channel, deskew the remaining channels.
17. The setup is an acquisition of a square signal at 100 KHz, with the Record length set to 25000 points to
t the Hysteresis in the From area for Ch1. Hysteresis
level in the waveform.
ct the Hysteresis in the To area for Ch2 and set the hysteresis value.
achieve the sample resolution of 1.6 ns.
The next figure shows an example of a deskew setup.
(see page 18) helps to ignore the noise
16 TDSUSB2 Universal Serial Bus Measurements Package
Page 29

Getting Started Deskewing Probes and Channels on the supported Instruments
18. Set the Reference levels for Ch1 and Ch2 in the application to 50%, the hysteresis to 10%, the number
of edges to 4, and the type to rising edge.
The next figure shows the display after performing the deskew for the multiple edge.
TDSUSB2 Universal Serial Bus Measurements Packa ge 17
Page 30

Getting Started Deskewing Probes and Channels on the supported Instruments
19. The zoomed section of the waveform available on the lower part of the screen shows the results of
the deskew operation clearly. You will see that after performing the deskew operation, the skew is
automa
tically removed.
Hysteresis
Hysteresis indicates the noise level in the waveform.
18 TDSUSB2 Universal Serial Bus Measurements Package
Page 31

Operating Basics About Basic Operations
About Basic Operations
This section contains information on the following topics and tasks:
Application Interface (see page 19)
Using Basic O
Setting Up the Software (see page 25)
Selecting a Measurement (see page 30)
HowtoSaveandRecallaSetup(see page 63)
Exiting the Application (see page 23)
scilloscope Functions
Application Interface
The application uses a Windows interface. You should refer to your oscilloscope user manual for the
operating details of other controls, such as the front-panel buttons.
NOTE. The o scilloscope screen shrinks and appears in the top half of the display when the application is
running on the supported instruments.
Application Directories and File Names (see page 22)
Application Interface Menu Controls (see page 20)
(see page 21)
TDSUSB2 Universal Serial Bus Measurements Packa ge 19
Page 32

Operating Basics Application Interface Menu Controls
Application Interface Menu Controls
Item Description
Menu bar
Tab
Area
Option button Button that defines a particular command or task
List box
Box Box that yo
Check Boxes Square box that you can use to select or clear preferences
Scroll bar Vertical or horizontal bar at the side or bottom of a display area that can be used for
Browse
Command button
Keypad Keypad appears when you select the box; select and use it to enter a value
MP/GPknob A line that appears between the knob and the box when the MP or GP knob is selected;
xxx
Located at the top of the application display and contains application menus
Labeled group of options containing similar items
Visual frame that encloses a set of related options
Box that contains a list of items from which you can select one item
u can use to type in text, or to enter a value with the Keypad or a Multipurpose
knob
moving around in that area
Displays a window where you can look through a list of directories and files
Button that initiates an immediate action
turn the knob and select a value
20 TDSUSB2 Universal Serial Bus Measurements Package
Page 33

Operating Basics Using Basic Oscilloscope Functions
Using Basic Oscilloscope Functions
You can use the Help menu to access information about the oscilloscope. You can also use other
oscilloscope functions and easily return to the application.
The TDSUSB2 application includes Online Help about the application menus and controls.
To display the Online Help, follow these steps:
1. Choose Help from the TDSUSB2 menu.
2. Use the Contents, Table of contents, or Index tabs to navigate through the help.
Minim
3. The touch s
Screen OFF button on the oscilloscope front panel.
See Also
Minimizing and Maximizing the Application (see page 21)
Returning to the Application (see page 23)
creen mode of operation is enabled by default. You can disable this by using the Touch
izing and Maximizing the Application
To min
is continually displayed.
To ma
imize the application, select File > Minimize. When you minimize the oscilloscope, the application
ximize the application, select the TDSUSB2 icon in the Windows taskbar.
TDSUSB2 Universal Serial Bus Measurements Packa ge 21
Page 34

Operating Basics Application Directories and File Names
Application Directories and File Names
The application uses the directories for several functions, such as save and recall setup files, and uses the
extensions appended to the file names to identify the file type.
The following table lists default directory names for the supported instruments:
Directory
C:\TekApplications\tdsusb2
C:\TekApplications\tdsusb2\report Report files
C:\TekApplications\tdsusb2\setup Setup files
C:\TekApplications\tdsusb2\tsvfilegenerator Default directory for the tsv file generated by the file
pplications\tdsusb2\datagen
C:\TekA
C:\TekApplications\tdsusb2\images Images of the eye diagram and waveform plots
C:\TekApplications\tdsusb2\temp Temporary files used in the application
xxx
See Also
ame Extensions
File N
File Name Extensions
Extensions Description
.csv
.ini
.set
.tsv
xxx
See Also
Used for
Home location
generato
Digital
Sensitivity Test
r and for other csv files
signal generator pattern files for use in Receiver
(see page 22)
Input file is in the .csv (comma separated variable) format and is used to generate a .tsv
(tab separated variable) file. An exported waveform that may be used as a source to
generate a tsv format file
Application setup file
Instrument setup file with the same name, saved and recalled with .ini and .set file name
extension
Input file in a Tab Separated Variable format
CSV File Format
TSV File Generator (see page 62)
22 TDSUSB2 Universal Serial Bus Measurements Package
Page 35

Operating Basics Returning to the Application
ReturningtotheApplication
When you access oscilloscope functions, the oscilloscope fills the display. You can access oscilloscope
functions in the following ways:
1. Select the Hide button in the application display.
2. Select the Menu bar or the Toolbar mode on the oscilloscope and access the menus.
3. To return to the application, click the App button on the menu bar of the oscilloscope or click on
Analyze > Restore Application to restore the application.
Exiting the Application
To exit the application, select the Exit button or File > Exit or select the Exit button from the control panel.
When you exit the application, you can keep the oscilloscope s etup currently in use or restore the
oscilloscope setup that was present before you started the application.
Description of the Test Fixture
The TDSUSBF USB2.0 Compliance Test Fixture (Revision B) is a break-out board that enables you
to test live USB2.0 signals, exchanged between the device and the host. For more information on the
compliance test fixture, refer to the TDSUSBF USB2.0 Compliance Test Fixture Instructions shipped
with the test fixture.
The compliance test fixture consists of the following sections:
SQ Test Section
Receiver Sensitivity Test
Impedance Measurement Test (TDR)
TDSUSB2 Universal Serial Bus Measurements Packa ge 23
Page 36

Operating Basics Setting Up the Device Details
Disconnect Detect Test
Adjacent Trigger and Droop Test
Host SQ
Inrush Test
Downstream Sig Qual
Setting Up the Device Details
You can enter a unique identifier (ID ) and description for the unit under test (device). The identifier and the
description appear in the generated reports for the tests performed on the unit under test. You can either
type in the text directly in the boxe
to generate automatic IDs for the unit or enter a prefix using the keypad.
NOTE. If you check the Generate Automatic ID, the Device ID field is disabled and the Prefix field
is enabled. The report for Inrush Measurement displays details of the Signal Setup with the device
description.
sforthesefields, or u se the keypad or a keyboard. You can also choose
24 TDSUSB2 Universal Serial Bus Measurements Package
Page 37

Operating Basics Setting Up the Software
Setting Up the Software
You can set up the application to take one or more measurements a t the same time. In addition, you can
view the results as a summary, details, an eye diagram, and a waveform plot for Signal Quality checks. You
can also gene
The application runs on the oscilloscope. It is recommended that you connect the keyboard and the
mouse to use
See Also
View the Default Setup
rate the reports in one of the three formats: Tektronix Specific, Plug-Fest and CSV formats.
the application effectively.
Selectin
Configuring a Measurement (see page 38)
g a Measurement
Setting Preferences
The Preferences menu consists of two tabs: General and Advanced. To access the Preferences menu,
select File > Preferences.
(see page 30)
TDSUSB2 Universal Serial Bus Measurements Packa ge 25
Page 38

Operating Basics Setting Preferences
In the General tab, you can select the following options:
Set a warning to indicate that the configuration options were not changed since the last time you ran
the application. If you set this option, the application prompts you to configure the measurements
before acquiring data.
Automatically display the Eye Diagram without having to select the Eye Diagram button in the
Results screen.
Automatically display the Waveform Plot without having to select the Waveform Plot in the Results
screen.
Prompt for a File name or Device ID before automatically generating reports or data files.
Automatically generate .tsv files.
play the generated report.
Dis
Always display the waiver mask for High-Speed Near End and Low Speed eye diagrams.
Do Autoset Every Time.
NOTE. Autoset will happen only for Full-Speed/High Speed SQC measurements.
26 TDSUSB2 Universal Serial Bus Measurements Package
Page 39

Operating Basics Setting Preferences
In the Advanced tab, you can select the following options:
Enable user defined scope BW. When you enable this option, you can set the oscilloscope BW for the
application in DPO series oscilloscopes using the Horiz/Acq menu.
Prompt during report generation for the Droop test readout. When you enable this option, the
application disables report generation in the Automatic mode.
Configure the test limits. The result: PASS or FAIL is determined by the limits you have defined.
Place the vertical cursors between the start and end of the single USB2.0 packet. This is used when
more than one USB2.0 packet is displayed on the oscilloscope for Signal Quality measurements.
Set the trigger holdoff value to capture the USB2.0 high-speed test packet.
NOTE. If you enable the Configure Test Limits options, the Results Summary and Report Generation in
Plug-Fest format is disabled.
TDSUSB2 Universal Serial Bus Measurements Packa ge 27
Page 40

Operating Basics Table of Measurements and Options
Table of Measurements and Options
Low Speed and F
Area
Signal Qual
Signal Quality Check Signal Rate Measures the inverse of the average bit-time that
Signal Quality Check
Signal Qu
Signal Quality Check Consecutive Jitter
Signal Quality Check EOP Width Measures the width of the end-of-packet of a USB
Signal Quality Check Cross-Over voltage
Signal Quality Check
Signal Quality Check
Inrush Current Check Inrush Current Measures the amount of electrical charge drawn
roop Test
D
xxx
ity Check
ality Check
ull Speed Measurements
Option
Eye Diagram
Paired JK Jitter
Paired KJ Jitter
Rising Edge Rate
Falling Edge Rate
roop Test
D
Description
Checks whet
corresponding eye diagram
gives the transmission rate of the USB signal
Measures the jitter time for paired (JK next to KJ)
different
Measures
differential data transition
Measure
calculated using the signal rate
signal
Measures the voltage at which the D+ voltage
crosses the D– voltage
Measures the Rising Edge/Slew rate in V/ μs and
is cal
Rising Edge Rate = Amplitude / Rise Time
Where Amplitude is the peak-to-peak amplitude for
the c
is calculated based on the high level of the inner
vertical eye height reference levels
Measures the Falling Edge/Slew rate in V/ μs and
alculated using the Fall time as
is c
Falling Edge Rate = Amplitude / Fall Time
Where Amplitude is the peak-to-peak amplitude for
corresponding signaling rate and the Fall time
the
is calculated based on the lower level of the inner
vertical eye height reference levels
a device as soon as it is connected to a USB
by
network
Measures the difference in the VBUS voltage when
the load switch is open to the lowest value of the
oltage and the load switch
v
her the USB signal is aligned with its
ial data transition
the jitter time for paired (KJ next to JK)
s the jitter at every consecutive data bit
culated using the Rise time as
orresponding signaling rate and the Rise time
28 TDSUSB2 Universal Serial Bus Measurements Package
Page 41

Operating Basics Table of Measurements and Options
High Speed Measurements
Area
Signal Quality Check
Signal Quali
Signal Quality Check
Signal Qu
Signal Quality Check
Signal Quality Check
Inrush Current Check Inrush Current Measures the amount of electrical charge drawn
Droop Test Droop Test
Receiver Sensitivity Test Receiver Sensitivity Is an indicator of Receiver Sensitivity. A High
Chirp Test Chirp Checks a part of handshake that occurs during
ty Check
ality Check
Option
Eye Diagram
Signal Rate Measures the
Monotonic P
EOP Width Measures
Rising Ed
Fallin
roperty
ge Rate
g Edge Rate
Description
Checks whether the USB signal is aligned with its
correspondin
gives the transmission rate of the Test_Packet
Detects when the Signal is Monotonic if and only
if data [i+1] ≥ data [i] in case of consistently
increasing
[i+1] ≤ data [i] when consistently decreasing
(falling slope) and never increasing in value where
i ranges fr
a Test_Packet
Measures the Rising Edge/Slew rate in V/ μs and
is calculated using the Rise time as
Rising E
Where Amplitude is the peak-to-peak amplitude for
the corresponding signaling rate and the Rise time
is calc
vertical eye height reference levels
Measures the Falling Edge/Slew rate in V/ μs and
is calculated using the Fall time as
ng Edge Rate = Amplitude / Fall Time
Falli
Where Amplitude is the peak-to-peak amplitude for
the corresponding signaling rate and the Fall time
is cal
vertical eye height reference levels
by a device as soon as it is connected to a USB
work
net
sures the difference in the VBUS voltage when
Mea
the load switch is open to the lowest value of the
voltage and the load switch
eed capable device must indicate 'packet(Data)
Sp
not received' (squelch) when the input of the
receiver falls below 100 mV differential amplitude.
imilarly the device must not indicate squelch if the
S
differential amplitude is greater than 150 mV
Reset Protocol for high speed capable hubs and
devices. In this handshake, the hub/host and the
device are required to detect chirp J and K of a
specified minimum duration and amplitude
g eye diagram
inverse of the average bit-time that
(rising slope), never decreasing data
om0ton
the width of the end-of-packet pattern of
dge Rate = Amplitude / Rise Time
ulated based on the high level of the inner
culated based on the lower level of the inner
TDSUSB2 Universal Serial Bus Measurements Packa ge 29
Page 42

Operating Basics Selecting a Measurement
Area
Suspend Test Suspend Measures the t
Resume Test Resume Resumes the High-speed operation in a device
Rest from High-Speed Test
Reset from Suspend Reset from Suspend Measures the time between the falling edge of
Packet Parameter Packet Parameter
xxx
Option
Reset
Description
ime between the end of the last
Start of Frame (SOF) and the rising edge transition
to the Full Speed J state. The acceptable range
should be betw
applicable if you have selected a Host, Device, or
a Hub-Upstream device
or a hub, which is indicated by the presence of
High-speed
amplitude) following the K state driven by the host
controller. For the Host this is the time between
the falling
not exceed 3.0mS
Measures the time between the beginning of the
last SOF and before the reset and the beginning
of ChirpThis test will be applicable for Device and HUB
upstream
D+ signa
between 2.5 us and 3 ms. This test is applicable
for Device and HUB upstream
Measures the parameter of the packet such as
Sync Bi
on the selected measurement
een 3 m s to 3.125 ms. This is
SOF packets (with 400mV nominal
edge of D+ to the First SOF. This should
K. This is between 3.1 ms and 6 ms.
l and the start of Device chirp-K. This is
ts, EOP, and Inter-Packet Gap depending
Selecting a Measurement
To take a measurement, select Measurement from the Measurements menu, which is also the default
opening screen in the application. To access the Select option in the Measurement menu, select
surements> Select.
Mea
Therearethreecategoriesofmeasurements:LowSpeed, Full Speed, and High Speed measurements. The
surements for Low, Full and High Speed signals are S ignal Quality Checks, Inrush Current Check,
mea
and Droop Test. The additional measurements for High Speed tests are Receiver Sensitivity, Monotonic
Property, and Chirp Test, Packet Parameter, Suspend, Resume, Reset from Suspend, and Reset from
High Speed.
You need to select the measurements for a particular signal speed of the unit under test. After selecting the
tests, you must configure the application based on Signal Source, Tier, Test Point, and Signal Direction.
You can test the units for the following:
Devices for Upstream Signal Quality Check
Hubs and Hosts for Downstream Signal Quality Check
30 TDSUSB2 Universal Serial Bus Measurements Package
Page 43

Operating Basics Selecting a Measurement
Ports of a Hub for Droop Test
Devices for Inrush Current
See Also
Selecting a Measurement (see page 30)
Measurement Menu (see page 30)
Signal Quality Check (see page 32)
Inrush Current Check (see page 33)
t
Droop Tes
Receiver Sensitivity Measurement (see page 35)
Chirp Measurement (see page 36)
Packet Parameter Measurement (see page 48)
Suspend Measurement (see page 49)
(see page 201)
Resume Measurement (see page 50)
from Suspend Measurement
Reset
Reset from High Speed Measurement (see page 52)
What do youwant to do?. Table of Measurements and Options (see page 28)
guring a Measurement
Confi
Saving a Setup (see page 64)
Recalling a Saved Setup (see page 65)
(see page 51)
(see page 38)
TDSUSB2 Universal Serial Bus Measurements Packa ge 31
Page 44

Operating Basics Signal Quality Check
Signal Quality Check
The application performs Signal Quality tests that include the following tests:
Area
Signal Quality Check
Signal Qual
Signal Quality Check
Signal Qu
Signal Quality Check Consecutive Jitter
Signal Quality Check EOP Width Measures the width of the end-of-packet of
Signal Quality Check Cross-Over voltage
Signal Quality Check
nal Quality Check
Sig
Signal Quality Check Monotonic Property (For High
xxx
ity Check
ality Check
Option
Eye Diagram
Signal Rate Measures th
PairedJKJitter
Paired KJ Jitter
Rising Edge Rate
Falling Edge Rate
Speed only)
Description
Checks whether the USB signal is aligned
with its corr
that gives the transmission rate of the USB
signal
Measures the jitter time for paired (JK next to
KJ) differ
Measures
JK) differential data transition
Measures
bit calculated using the signal rate
a USB signal
Measures the voltage at which the D+ voltage
crosses the D– voltage
The Rising Edge/Slew rate in (V/μs) is
calcu
Rising Edge Rate = Amplitude / Rise Time
Where Amplitude is the peak-to-peak
ampli
rate and the Rise time is calculated based on
the high level of the inner vertical eye height
refe
The
calculated using the Fall time as
Falling Edge Rate = Amplitude / Fall Time
Whe
amplitude for the corresponding signaling
rate and the Fall time is calculated based on
e lower level of the inner vertical eye height
th
reference levels
Measures the Monotonic Signal if the data
[i] < data [i-1] where data[l] is the record
oint in the acquired waveform. This is in
p
the case of consistently increasing (rising
Slope) only. If the data [i] > data [i-1] in case
f consistently decreasing )falling Slope) and
o
never increasing in value where i ranges from
0 to n, the signal I is said to be monotonic
esponding eye diagram
e inverse of the average bit-time
ential data transition
the jitter time for paired (KJ next to
the jitter at every consecutive data
latedusingtheRisetimeas
tude for the corresponding signaling
rence levels
Falling Edge/Slew rate in (V/μs) is
re Amplitude is the peak-to-peak
32 TDSUSB2 Universal Serial Bus Measurements Package
Page 45

Operating Basics Inrush Current Check
NOTE. The USB2.0 specifications recommend that you should test the signal quality for upstream and
downstream traffic. In upstream testing, the application captures the signals transmitted from the device to
the host. In do
Downstream testing is performed on ports of a hub. When testing a hub, you need to connect the USB2.0
unit to Tier 6
connected to the Tier 5, so that you can test the hub on the Tier 6.
wnstream testing, the application captures the signals transmitted from the host to the device.
to ensure the worst case. Each hub level is referred to as a Tier. The hub under test is
Inrush Cur
The applic
current higher than that specified in the USB2.0 specifications when connected to a USB2.0 system. If the
measured current drawn is higher than a specified value, the other USB2.0 devices connected to the bus
may not be able to function properly.
When a unit is connected, there is a sharp intake of current followed by a comparatively less steep decay.
Small humps or perturbations are noticed in the current trace, depending on when the unit resets.
The TDSUSB2 application automatically sets up the oscilloscope. The application gives a direct readout
of Charge (µC) and Capacitance (µF) values. The application displays the details of the results after
comparing the test results with the USB2.0 specifications.
rent Check
ation can perform an Inrush current check to v erify that the unit under test does not draw
Probe Degaussing
It is mandatory to perform degauss for the current probe before carrying out inrush measurement. You can
refer to the probe manual for the degaussing procedure.
TDSUSB2 Universal Serial Bus Measurements Packa ge 33
Page 46

Operating Basics Droop Measurement
Droop Measurement
The Droop voltage is the difference in the V
voltage when you apply a no load condition and a 100 mA
BUS
load to the port under test (all other ports are fully loaded).
The Droop test evaluates the worst case droop by alternately applying a droop load and no load to the port
under test while all other ports are supplying the maximum load possible. All the V
are relativ
e to local ground.
measurements
BUS
The TDSUSB2 application automatically sets up the oscilloscope for the specified test configuration.
When you st
art the application, it acquires the signal, and provides the V
measurement, and displays
DROOP
PASS or FA I L.
NOTE. The TDSUSB2 application helps to report the Drop test. You can do this by enabling an option in
le> Preferences> Advanced menu. You can enter the multimeter reading for the Drop test in the
the Fi
TDSUSB2 application during report generation for a consolidated report.
34 TDSUSB2 Universal Serial Bus Measurements Package
Page 47

Operating Basics Receiver Sensitivity Measurement
Receiver Sensitivity Measurement
To improve the performance of the application in a noisy environment, the USB2.0 high speed device
should respond to IN tokens with NAKs when the signaling level is at or above the specified level.
The Receiver Sensitivity test requires a high-speed data simulator, such as the Tektronix DTG5334,
DTG5274, or DTG5078; or the AWG5000 series (AWG5002) or AWG7000 series generators, to transmit
IN tokens of
mode. The host is then replaced by the data simulator to continue to transmit IN tokens. The signaling
amplitude is presented to the device under test at a level at or above 150 mV. At these levels, the unit
under test must not be in the squelched mode, responding to IN packets with NAKs. The amplitude of
the signals from data senerator varies less than 100 mV. The unit under test must be squelched and not
respond to IN tokens with NAKs.
This tests the receiver capability of high speed units (device) to respond to the particular data pattern
generated by the USB2.0 data simulator. The unit under test responds to the data pattern level above the
squelch
(<100 mV).
varying amplitude. The test requires the unit under test to be placed in the Test_SE0_NAK
level (>150 mV) and should not respond when the data pattern level is below the squelch level
The TDS
Digital signal generator pattern files (AWG5k-HS-USB.zip and DTG_setup.zip are available for
download from www.tektronix.com). Pattern files for other Tektronix data simulators are available from
www.tektronix.com.
USB2 application provides the procedural steps to perform this measurement. It also provides
TDSUSB2 Universal Serial Bus Measurements Packa ge 35
Page 48

Operating Basics Chirp Measurement
Chirp Measurement
To perform a Chirp test, connect the unit under test and the single-ended probes to acquire data. You can
measure the Data for Chirp K amplitude, Chirp K duration, and Reset duration. You need to manually
verify that t
here are three K–J pairs in less than 500 µs.
The TDSUSB2 application automates this process and automatically generates the results (see page 96)
and reports for the results of Chirp-K duration, Chirp-K amplitude, and Reset duration.
36 TDSUSB2 Universal Serial Bus Measurements Package
Page 49

Operating Basics Monotonic Property
Monotonic Property
While performing a USB2.0 High Speed compliance test, you need to verify that the signal to be tested is
monotonic.
The following graph shows the monotonic behavior of a USB2.0 high speed signal with a rise time
of 500 ps.
To verify the monotonic behavior of a signal, the oscilloscope must have a sample rate high enough to
capture as many sample points as possible on a rising or falling edge. In addition, the oscilloscope should
have en
The application coupled with a high performance Tektronix oscilloscope automates the process and
ensur
ough bandwidth to ensure that the high frequency non-monotonic transition is not attenuated.
es repeatability of test results.
TDSUSB2 Universal Serial Bus Measurements Packa ge 37
Page 50

Operating Basics Configuring a Measurement
Configuring a M easurement
To access the Configure: Measurement, go to Measurements> Configure. The application also provides a
Configure option with each measurement area to allow you to configure the selected measurements.
NOTE. If you s
‘The selected measurements have not been configured. Do you want to continue?.’ In this case, the
application runs with the default settings. If you select the Run button before configuring the measurement
and have enabled the File> Preferences> General option, the application displays the warning message
‘Warn if configuration was not changed since last run, when the run button is pressed.’
See Also
Config
The a
on the keypad to configure limits for these options.
elect the Run button before configuring a measurement, the application displays the message
Configuring Signal Quality Measurements (see page 39)
Configuring Inrush Current Measurements (see page 40)
Configuring Droop Measurements (see page 40)
Configuring Receiver Sensitivity Measurements (see page 41)
Configuring Chirp Measurement (see page 42)
ure Limits
pplication displays the maximum and minimum values for the selected tests. You can use the ‘>’ sign
Option
Set Sets the values you enter
Default Restore the default values
Cancel Cancels all the changes you enter
xxx
NOTE. The application enables the Configure Limits values when you select the option File> Preferences>
Advanced menu.
38 TDSUSB2 Universal Serial Bus Measurements Package
Description
Page 51

Operating Basics Configuring Signal Quality Measurements
Configuring Signal Quality Measurements
To access the Measurement: Configure, go to Measurements> Configure. Be sure to select the relevant
measurements before you configure them. There are two tabs for the Signal Quality Measurements:
Configure and
The Configure tab allows you to select and set the Tier, Signal Direction and the Test Point options. You
must select
Point (Near End or Far End) at which the unit will be tested.
Source.
the Tier (Tier 1 through 6), the direction of signal (Upstream or Downstream) and the Test
For Low Spe
signals, you can set the Test Point to Far End only.
For Monot
The Source tab allows you to select the Source of the signal: a live signal or the signal from a file. For a
live sig
you can test only single-ended signals (D+ and D–). For High Speed devices, it is recommended that
you use a differential probe.
ed and High Speed signals, you can se t Test Point to Near End or Far End. For Full Speed
onic Property measurement, you can configure the measurement levels.
nal there are two options: Differential and Single-Ended. For Low Speed and Full Speed devices,
See Also
Configure Signal Quality Measurements Parameters (see page 187)
Signal Quality Configuration Options
Signal Quality Checks (see page 32)
TDSUSB2 Universal Serial Bus Measurements Packa ge 39
Page 52

Operating Basics Configuring Inrush Current Measurements
Configuring Inrush Current Measurements
To access the Measurements: Configure menu, go to the Measurements > Configure.
The Configure tab allows you to set the voltage value on V
be entered manually or probed from a channel that is captured f
and the unit under test. The V
bus
rom the test fixture. Select this option
bus
can
from the Source tab of Inrush Configuration menu.
The Tier 1 is always used for testing. The unit under test can be any one of the following types:
Hot Plug Attach
Low Powered Configure
Low Powered Resume
High Powered Configure
High Powered Unconfigure
High Powered Resume
The Hot Plug Attach is the most common unit under test. The Source tab allows you to select the source
of the signal: a live signal or the signal taken from a tsv file. If you choose to manually enter the V
voltage, you cannot select the V
voltage source.
BUS
BUS
See Also
Configure Inrush Current Measurement Parameters (see page 188)
Inrush Current Configuration Options
Inrush Current Check (see page 33)
Configuring Droop Measurements
Select the Droop measurement and configure it. To access the Configure: Measurements menu, go to
Measurements > Configure.
The Configure tab allows you to select the Port (Port 1 through 7), Hub and Source of the sig nal. The
source of the signal can be live or from a .tsv file. The hubs can either be Self powered or Bus powered.
See Also
View Droop Test Configure Menu
Droop Test Configuration Options
Droop Test (see page 201)
40 TDSUSB2 Universal Serial Bus Measurements Package
Page 53

Operating Basics Configuring Receiver Sensitivity Measurements
Configuring Receiver Sensitivity Measurements
To c onfigure receiver sensitivity measurements, follow these steps:
NOTE. Receiver Sensitivity Tests setup files for AWG and DTG models (AWG5k-HS-USB.zip or
DTG_setup.z
1. Select the High Speed measurement tab > More button > Receiver Sensitivity measurement.
2. To access the Configure Measurements menu, select Measurements> Configure.
ip) are available for download from www.tektronix.com
3. Select the Source from Ch1 to Ch4.
4. Select the Run button.
5. Select OK and follow the on-screen prompts to perform the tests.
6. To generate reports, select Utilities > Report Generator.
See Also
Generating Reports (see page 59)
Viewing Reports (see page 61)
iew Configure Receiver Sensitivity
V
Selecting a Measurement (see page 30)
Receiver Sensitivity Measurement (see page 35)
TDSUSB2 Universal Serial Bus Measurements Packa ge 41
Page 54

Operating Basics Configuring Chirp Measurement
Configuring Chirp Measurement
To configure chirp measurements, follow these steps:
1. Select the High Speed measurement tab>Morebutton>Chirpmeasurement.
2. To access the Configure Measurements menu, go to Measurements> Configure.
3. In the Configure tab, you ca n select the DUT (Host or Device) and perform selected tests associated
with it.
4. Select the Host option to display the different tests for the DUT. The available tests are:
EL_33, EL_34: You can perform two separate measurements o n an acquired waveform.
EL_35: You can perform a single measurement on an acquired waveform.
42 TDSUSB2 Universal Serial Bus Measurements Package
Page 55

Operating Basics Configuring Chirp Measurement
5. Select the Device option to display the different tests for the DUT. The available tests are:
EL_28, EL_29: You can perform two separate measurements on an acquired waveform.
6. Select the channel source in the D+ and D– fields. Use the drop down arrow in the D+, D- field to set
the source. The available options are:Ch1- Ch4 and Ref1-Ref4.
7. Select the Run button.
8. To generate reports, select Utilities > Report Generator.
See Also
Generating Reports (see page 59)
Viewing Reports (see page 61)
View Confi
Chirp Measurement (see page 36)
gure Chirp Test
TDSUSB2 Universal Serial Bus Measurements Packa ge 43
Page 56

Operating Basics Configuring Resume Measurement
Configuring Resume Measurement
To configure Resume measureme nt, follow these steps:
1. Select the High Speed measurement tab > More button > Resume measurement. The device/HUB
resumes the High-Speed operation, which is indicated by the presence of High-speed SOF packets
(with 400 mV nominal amplitude) following the K state driven by the host controller. For the Host,
this is the t
2. To access the Configure Measurements menu, go to Measurements > Configure.
ime between the falling edge of D+ to the First SOF. This should not exceed 3.0 ms.
3. Set the input Signal Direction to either Upstream or Downstream.
4. Select the channel source in the D+ and D– fields. Use the drop down arrow in the D+, D– fieldtoset
the source. The available options are: Ch1- Ch4 and Ref1-Ref4.
5. Select the Run button.
6. To g
enerate reports, s elect Utilities > Report Generator.
See Also
Generating Reports (see page 59)
44 TDSUSB2 Universal Serial Bus Measurements Package
Page 57

Operating Basics Configuring Suspend Measurement
Configuring Suspend Measurement
To c onfigure Suspend measurement, follow these steps:
1. Select the High Speed measurement tab > More button > Suspend measurement. This measures the
time between the end of the last SOF and the rising edge transition to the Full Speed J state. The
acceptable range is between 3 ms to 3.125 ms.
2. To access the Configure Measurements menu, go to Measurements > Configure.
3. Set the input Signal Direction to either Upstream or Downstream.
4. Selec
5. Sele
6. To generate reports, select Utilities > Report Generator.
t the channel source in the D+ and D– fields.UsethedropdownarrowintheD+,D–fieldtoset
the source. The available options are: Ch1- Ch4 and Ref1-Ref4.
ct the Run button.
See Also
nerating Reports
Ge
(see page 59)
TDSUSB2 Universal Serial Bus Measurements Packa ge 45
Page 58

Operating Basics Configuring Reset from Suspend Measurement
Configuring Reset from Suspend Measurement
To c onfigure Reset from Suspend measurement, follow these steps:
1. Select the High Speed measurement tab > More button > Reset from Suspend measurement. This
measures the time b etween the falling edge of D+ signal and the start of Device chirp-K. This is
between 2.5 us and 3 ms. This test is applicable for Device and HUB upstream.
2. To access the Configure Measurements menu, go to Measurements > Configure.
3. In the Configure tab, you can set the channel Source.
4. The signal direction is always set to Upstream. This is because you can measure Reset from Suspend
only on an upstream signal. The Downstream option is disabled.
5. Select the channel source in the D+ and D– fields. Use the drop down arrow in the D+, D– fieldtoset
the source. The available options are: Ch1- Ch4 and Ref1-Ref4.
6. Select the Run button.
7. To generate reports, select Utilities > Report Generator.
See Also
Generating Reports (see page 59)
Configuring Packet Parameter Measurement
To configure Packet Parameter measurement, follow these steps:
46 TDSUSB2 Universal Serial Bus Measurements Package
Page 59

Operating Basics Configuring Packet Parameter Mea surement
1. Select the High Speed measure ment tab > More button > Packet Parameter measurement.
2. To access the Configure Measurements menu, go to Measurements > Configure.
3. In the Configure tab, you can select the DUT (Host or Device) and perform selected tests associated
with it.
4. Select the Host o ption to display the different tests for the DUT. The available tests are:
EL_21,
waveform.
EL_22:
EL_55: You can perform a single measurement on an acquired waveform.
EL_23, EL_25: You can perform three separate measurements on a single acquired
You can perform a single measurement on an acquired waveform.
TDSUSB2 Universal Serial Bus Measurements Packa ge 47
Page 60

Operating Basics Packet Parameter Measurement
5. Select the Device option to display the different tests for the DUT. The available tests are:
EL_21, EL_22, EL_25: You can perform three separate measurements on an acquired waveform.
EL_22: You can perform a single measurement on an acquired waveform.
6. Use the drop down arrow in the Differential field to set the channel source. The available options
are: Ch1-Ch4, Ref1-Ref4.
7. Select the Run button.
8. To generate
See Also
Generating Reports (see page 59)
Packet P
Packet
packet characteristics for upstream and downstream signaling. The measurement calculates the SYNC
field length, EOP length and inter packet gap. The acceptable range of EOP for all transmitted p ackets
(except SOFs) must be between 7.5 and 8.5 bits. The packet parameter algorithm calculates the EOP
depending on this range.
The acceptable range of inter packet gap is between 88 bits to 192 bits. The SYNC field for all transmitted
packets is calculated by counting the bits to check for 32-bit SYNC field. The inter packet delay and
SYNC status is calculated between the EOP indexes. The EOP width in time is calculated by dividing
EOP width by 480 Mbps.
the
reports, select Utilities > Report Generator.
arameter Measurement
parameter measurement is for high speed Host controller and Device. There are several important
48 TDSUSB2 Universal Serial Bus Measurements Package
Page 61

Operating Basics Suspend Measurement
Suspend Measurement
This test calculates the time between the end of last SOF and the rising edge transition to Full-speed J state
for Host / Device / Hub- upstream. This time must be between 3mS and 3.125mS. To get the Suspend
signal, hotlines. The application analyzes data for the Suspend Time.
plug the unit under test (device) and measure the signalling with single-ended probes on both
TDSUSB2 Universal Serial Bus Measurements Packa ge 49
Page 62

Operating Basics Resume Measurement
Resume Measurement
This test calculates the device/HUB resume High-speed operation, indicated by High-speed SOF packets
(with 400 mV nominal amplitude) following the K state driven by the host controller. For the Host, this is
the time betw
Suspend signal, hot-plug the unit under test (device) and measure the s ignaling with single-ended probes
on both lines. The application analyzes data for the following:
Resume Time
Amplitude
een the falling edge of D+ and the First SOF. This should not exceed 3.0 ms. To get the
50 TDSUSB2 Universal Serial Bus Measurements Package
Page 63

Operating Basics Reset from Suspend Measurement
Reset from Suspend Measurement
This test calculates the time between the falling edge of D+ signal and the start of Device chirp-K for
the Device/HUB upstream. This must be between 2.5 us and 3 ms. To get the Reset from Suspend
Measurement
probes on both lines. The application analyzes data for the Reset From Suspend Time.
signal, hot-plug the unit under test (device), and measure the signaling with single-ended
TDSUSB2 Universal Serial Bus Measurements Packa ge 51
Page 64

Operating Basics Reset from High Speed Measurement
Reset from High Speed Measurement
This test calculates the time between the beginning of the last SOF and before the reset and the beginning
of Chirp-K for Device and HUB upstream. This must be between 3.1 ms and 6 ms. To get the Reset from
High-Speed M
single-ended probes on both lines. The application analyzes data for Reset From High Speed Time.
easurement signal, hot-plug the unit under test (device) and measure the signaling with
Acquiring Data
The application automatically sets the oscilloscope settings for the selected measurements. To acquire data
from the oscilloscope, follow these steps:
1. Select the
2. The
52 TDSUSB2 Universal Serial Bus Measurements Package
application displays the message ‘Please press OK when correct waveform is acquired’ for
live signals.
command button to run the application.
Page 65

Operating Basics Acquiring Data
3. If you select the Cursor Mode, the application displays the message ‘Place the Cursors at the start and
end position of t he USB packet. Press OK when done.’
4. If you select the Inrush measurement, the application displays the message in the next figure.
5. If you select the Droop measurement, the application displays the message in the next figure.
TDSUSB2 Universal Serial Bus Measurements Packa ge 53
Page 66

Operating Basics Control Menu Options
6. If you select the Packet Parameter measurement, the application displays the message in the next figure.
7. The application automatically displays the result after acquiring the data.
8. The application automatically displays the eye diagram and the waveform plot for the acquired signals.
This is possible only if you enable this option in the Preferences > General.
NOTE. You can modify the automatic oscilloscope settings if there is no valid waveform on the oscilloscope
screen. To do so, select the
complete the process.
TIP. You may need to adjust the inrush setups, as inrush currents have a wide variety of durations and peak
currents. Use the vertical division settings between 100 mA/division to 5 A/division. Adjust the timebase
appropriately to have a minimum acquisition duration of 100 ms.
Control Menu Options
Option/button
Run icon Runs the application
e button
Hid
Exit button Exits the application
xxx
See Also
Control Menu
Control Menu Parameters (see page 192)
command button to run the application and select OK to
Description
es the application and displays the oscilloscope application on the entire screen
Hid
54 TDSUSB2 Universal Serial Bus Measurements Package
Page 67

Operating Basics Viewing Results
Viewing Results
You can view the results in a summary form or in a detailed form. To access the Results: Summary, select
Results > Summary. The application displays one of the following results.
APASSindica
AFAILindica
and d o not comply with the USB2.0 specifications.
A Conditional PASS indicates that the limits of the tests are within the USB2.0 waiver
limits. A conditional pass is a true pass with allowable waiver limits. These limits are not published to
developers or equipment vendors. However, usb.org encourages developers to design to meet within the
USB2.0 specifications.
NOTE. The application displays PASS or FAIL based on the limits you set.
To access the De t ails: select Results > Details. Use the scroll bar to view the results that are not visible
within the display window. The report contains statistical values for the following:
Standard deviation (StdDev)
Mean
Peak-to-peak (Pk–Pk)
Root mean square (RMS)
tes that the results of the measurements comply with the USB2.0 specifications.
tes that the measured values of the measurements are beyond the waiver limits
mum (Max) and minimum (Min) values
Maxi
Population (the number of cycles used to calculate the statistics). The population used for signal
es is number of bits.
rat
Status (PASS/FAIL/Conditional PASS) for the selected tests
You can also view the eye diagram and the waveform plot for signal quality check.
Eye Diagram
You can select the Eye Diagram option to view the eye diagram for the unit under test. The eye diagram
has the Zoom and Cursor features that you can use to v iew the results. You can also use the Reset button to
reset the default eye pattern.
The Eye Diagram menu contains the following options:
Zoom: You can select the zoom from the menu. Select the
Define the area of interest using the mouse and selecting the zoom in area. The selected area is dis played
TDSUSB2 Universal Serial Bus Measurements Packa ge 55
icon to zoom into the area of interest.
Page 68

Operating Basics Viewing Results
in the entire upper half of the oscilloscope. Select the icon to zoom out. You can use the Zoom In and
Zoom Out icons until the application reaches the maximum and the minimum zoom limits.
Cursors: Yo u can select the Cursors and the vertical cursors appear.
You can drag the cursors to change the positions, and read the time values on the X-axis.
56 TDSUSB2 Universal Serial Bus Measurements Package
Page 69

Operating Basics Viewing Results
Use the mouse to select the Horizontal cursor .Youcandragthe
cursors to change the positions, and read the voltage values on the Y-axis.
Waveform Plot
You can select the Waveform Plot option to view the Waveform Plot for the unit under test. The Waveform
Plot has a Zoom and the Cursor feature that you can use to view the results.
The Waveform Plot has features that enable you to zoom in and out on the waveform, use Vertical and
Horizontal Cursors, Save the Plot, Reset the original plot, and select to display the signals.
To display any or all the signals for the waveform plots menu, you can use the following options:
Zoom: You can select the Zoom from the menu. Select the
Define the area of interest using the mouse and selecting the zoom in area. The entire upper half of the
oscilloscope displays the selected area. Select the
Zoom Out icons until the application reaches the maximum and the minimum zoom limit.
icon to zoom out. You can use the Zoom In and
icon to zoom into the area of interest.
Cursor: You can select the Cursors and the vertical cursors appear.
Drag the cursors to change the positions of the cursors, and read the time values on the X-axis.
TDSUSB2 Universal Serial Bus Measurements Packa ge 57
Page 70

Operating Basics Viewing Results
Select the Horizontal cursors . You can drag the horizontal cursors
to change the positions, and read the voltage values on the Y-axis.
NOTE. The Zoom and Cursor options are mutually exclusive.
Save: You can use the Save button to save the zoomed in or zoomed out diagram as a .jpg file.
Reset: You can use the Reset button to restore the waveform plot to its original display.
For waveform plots, any or all the signals can be displayed using the following buttons:
D+: Use this button to turn on or turn off the display of the D+ signal.
D–: Use this button to turn on or turn off the display of the D– signal.
CMD: Use this button to turn on or turn off the display of the Common Mode voltage.
Diff: Use this button to turn on or turn off the display of the Differential signal.
You can use any combination of the Zoom or Cursors, D+, D–, CMD (Common Mode Voltage) and
Diff buttons to view and save the waveform plot.
The annotations at the lower edge of the Wave
J, K , E (EOP), I (IDLE) and Sync ( C ).
There are two Results menu options.
58 TDSUSB2 Universal Serial Bus Measurements Package
form Plot classify the signal pulse into different bus states:
Page 71

Operating Basics Generating Reports
Summary: The application summarizes the results of the measurements. The results are classified as
PASS, FAIL and Conditional PASS. Click on PASS, FAIL and Conditional PASS. The dialog box shows
the Measured M
ean, USB2.0 Specifications.
Details: The applicatio
NOTE. The application displays the user c
are selected in File > Preferences > Advanced tab.
The application disables the Results >
when you enable Configure Test Limits.
View Result Summary
View Result Details
n displays the results of the completed tests in a tabular form.
olumn in the Results Details only if the User Configurable Limits
Summary and Report generation in Plug-Fest Specificformat
Generating Reports
To access the Report Generator menu, select Utilities > Report Generator. You can generate the USB IF
report in any one of the three formats:
Tektronix Specific is the default format used by the TDSUSB2 application.
Plug-Fest format is the format used by the USB-IF.
CSVformatreportisauser-defined report generated in a comma separated variable format.
TDSUSB2 Universal Serial Bus Measurements Packa ge 59
Page 72

Operating Basics Generating Reports
You can generate reports in one of the following modes:
Manual: Select the report format, the directory name, and the file to which the report is saved. Select
the Generate option to generate the report. Specify the file name for the report.
Automatic: The application generates reports automatically without user intervention as soon as
the results are calculated. Select Generate Automatic Ids to enable this option while selecting
measurements. T he application uses the prefix that you enter to generate the file. If you select the Ask
for the File
name/Device ID before automatically generating Reports/Data files check box in the File >
Preferences > General tab, you can enter the Device ID/File Name before generating the report. If the
File already exists, the application displays a message box to confirm whether to overwrite the existing
report. If you select Yes, the application overwrites the report; if you select NO, you can enter a new
Device ID/File Name or cancel the report generation. The reports are generated in the following path:
C:\TekApplications\tdsusb2\report.Thefile name is prefix_001_reportformat.csv or
prefix_001_reportformat.htm.
The report contains the device ID, device description, date and result of the test. The report also contains
the following statistical values:
Maximum (Max) and Minimum (Min) values
Mean
Peak-to-peak (Pk–Pk)
ard deviation (StdDev)
Stand
Root mean square (RMS)
Population
Status (PASS/FAIL/Conditional PASS) for the selected tests
User- The application displays this value if you select the "Allow user configuration of test limits" in
the Preferences menu and set the test limits before running the measurement.
The report includes the eye diagram and the waveform plots for the Signal Quality Check. The display on
the oscilloscope screen is embedded in the Droop report.
NOTE. Automatic Report generation is not available if you select the Drop Test readout option in File >
Preferences > Advanced tab.
See Also
Report Generator Menu Parameters (see page 191)
Report Generation Options
View Signal Quality Check Report in Tektronix SpecificFormat
60 TDSUSB2 Universal Serial Bus Measurements Package
Page 73

Operating Basics Viewing Reports
Viewing Reports (see page 61)
Generating Reports (see page 59)
Viewing Reports
You can use an HTML viewer or a browser to view the Tektronix specific and Plug-Fest format reports.
You can view the .csv (Comma Separated Variable) report in a text editor, spreadsheet, database, or a data
analysis program for further analysis. You can edit the .csv file to suit your needs.
NOTE. All the reports contain the eye diagram and the waveform plot except for the reports generated
in the .cs
See Also
v file format.
Report Generator Menu Parameters (see page 191)
Report G
View Signal Quality Check Report in Tektronix SpecificFormat
Viewing Reports (see page 61)
Generating Reports (see page 59)
eneration Options
TDSUSB2 Universal Serial Bus Measurements Packa ge 61
Page 74

Operating Basics TSV File Generator
TSV File Generator
You can use the TSV File Generator Utility to convert a .csv (Comma Separated Variable) file to a .tsv
(Tab Separated Variable) file. To access TSV File Generator, go to the main menu and select Utilities
> TSV File Gen
If the Input is a .csv file, then the application enables the CSV Waveform Source area. You can select the
sources bas
You can specify the directory C:\TekApplications\tdsusb2\tsvfilegenerator for the differential signal from
where the .
IftheInputisaLivesignal,youcannotaccesstheCSVWaveformSourcearea. SelecttheLive
or Ref as t
if you take the measurements and display the results. T he default directory for the .tsv files is
C:\TekApplications\tdsusb2\tsvfiles. You can also specify the location where the tsv file is to be generated.
TSV file format description
erator.
ed on the Signal type. For a single-ended signal, specify the D+ and D– inputs.
csv file is taken.
he source file to enable the Live Input option. You can enable the Convert option only
For Low Speed and Full Speed Signal Quality Check, the input TSV fileisanmx3matrixwithm
rows and three columns. The file has Time values and Voltage values for D+ and D– in the first, second
and third columns respectively.
The input TSV file for High Speed Signal Quality Check is a m x 2 matrix with m rows and two columns.
The file has Time and Voltage values for Differential signals in the first and second columns.
The input TSV files for Inrush and Droop tests are an m x 2 matrix with m rows and 2 columns. For Inrush
tests, the file has Time and Current values in the first and second columns. For Droop test, the file has
e and Voltage values in the first and second columns.
Tim
CSV file format description
Low Speed and Full Speed single-ended signals for Signal Quality Check require two .csv files to generate
the corresponding TSV file. The .csv files have two columns. One .csv file has time and voltage values
for D+ signals, while the second column has the time and the current values for D– signals. Both files
must have the same time values.
Differential signals require one .csv file with two columns, one column for time and another for voltage
values.
If you select Differential for Inrush and Droop signals, the .csv file has two columns: one column for time
values, and another for current and voltage values. You require only one .csv file for Inrush and Droop
tests. This .csv file has two columns: one column for the Time Values and the other for Current (Inrush)
and Voltage (Droop) values. You must use the Differential option for conversion.
View the TSV file generator
62 TDSUSB2 Universal Serial Bus Measurements Package
Page 75

Operating Basics How to Save and Recall a Setup
How to Save and Recall a Setup
You can use the Save and Recall menus to save and recall the various configuration setups. To access the
Save and Recall menus, go to the File menu in the menu bar and choose Save or Recall.
NOTE. Do not e
cause instability to the application. If you try to edit the.ini of the .set files, you get an error message ‘The
saved file has been corrupted and cannot be recalled.’
dit the .ini or the .set files, or the recall setup files generated by the application. This can
See Also
Saving a Setup (see page 64)
Recalling a Saved Setup (see page 65)
TDSUSB2 Universal Serial Bus Measurements Packa ge 63
Page 76

Operating Basics Saving a Setup
Recalling the Default Setup (see page 66)
HowtoSaveandRecallaSetup(see page 63)
Saving a Setup
You can save various configuration setups and recall them when needed. To save the application settings to
asetupfile, follow these steps:
1. Select File > Save.
2. Select the Save button.
3. Browse or
4. Choose Save to save the setup or Cancel to cancel the action.
NOTE. Th
oscilloscope .set files have the same file name.
enter a file name. The application appends a .ini extension to the name of setup files.
e application saves the oscilloscope setup to a .set file. The application .ini files and the
See Also
Recalling Recently Recalled Setups (see page 64)
Recalling a Saved Setup (see page 65)
lling the Default Setup
Reca
Recalling Recently Saved Setups (see page 64)
(see page 66)
64 TDSUSB2 Universal Serial Bus Measurements Package
Page 77

Operating Basics Recalling a Saved Setup
Recalling a Saved Setup
To recall the application settings from a saved setup file, follow these steps:
1. Select File > Recall.
2. Browse the directory C:\TekApplications\tdsusb2\setup to recall the .ini files or select the directory
where you have saved the setup file.
3. Select or enter a .ini file name.
4. Choose Open to recall the setup or Cancel to cancel the operation.
NOTE. The application recalls the oscilloscope setup from a .set file.
See Also
Recalling Recently Recalled Setups (see page 64)
Recalling a Saved Setup (see page 65)
Recalling the Default Setup (see page 66)
ing Recently Saved Setups
Recall
HowtoSaveandRecallaSetup(see page 63)
(see page 64)
TDSUSB2 Universal Serial Bus Measurements Packa ge 65
Page 78

Operating Basics Recalling the Default Setup
Recalling the Default Setup
To recall the application settings from the Default setup file, select File > Recall Default. The application
recalls the default setup and displays the message ‘Default setup recalled successfully.’
See Also
Recalling Recently Recalled Setups (see page 64)
Recalling a Saved Setup (see page 65)
Recalling the Default Setup (see page 66)
ing Recently Saved Setups
Recall
HowtoSaveandRecallaSetup(see page 63)
(see page 64)
66 TDSUSB2 Universal Serial Bus Measurements Package
Page 79

Operating Basics Recently Saved Setup
Recently Saved Setup
The application stores the last four saved setups. If you need to modify any of them, follow these steps:
1. Select File > Recently Saved.
2. Select the setup from the list of recently saved setups that are displayed.
NOTE. When you select a file from the list of recently saved files menu, the file becomes the first element
in the list of selections.
See Also
Recalling Recently Recalled Setups (see page 64)
Recalling a Saved Setup (see page 65)
Recalling the Default Setup (see page 66)
Recen
The ap
1. Select File > Recently Recalled.
2. Select the setup from the list of setups displayed.
NOTE. When you select a file from the list of recently saved files popup menu, the file becomes the first
ele
See Also
Recalling Recently Saved Setups (see page 64)
HowtoSaveandRecallaSetup(see page 63)
tly Recalled Setup
plication stores the last four recalled setups. If you need to recall any of them, follow these steps:
ment in the list of selections.
Recalling Recently Recalled Setups (see page 64)
ecalling a Saved Setup
R
(see page 65)
Recalling the Default Setup (see page 66)
Recalling Recently Saved Setups (see page 64)
HowtoSaveandRecallaSetup(see page 63)
TDSUSB2 Universal Serial Bus Measurements Packa ge 67
Page 80

Operating Basics Recently Recalled Setup
68 TDSUSB2 Universal Serial Bus Measurements Package
Page 81

Tutorial Introduction to the Tutorial
Introduction to the Tutorial
The tutorial teaches you how to set up the application by recalling a .tsv file, take measurements, and
view the results. More operating information is available in the Operating Basics section. Before you
begin the tut
orial, you must do the following tasks:
Starting the Application (see page 69)
Recalling a tsv File (see page 69)
Starting the Application
To start the application, select File > Run Application > USB2.0 Test Package or App > USB2.0 Test
Package or Analyze > USB2.0 Test Package.
Recalling a .tsv File
The application distribution includes the .tsv files used with this tutorial. The table below shows the
types of signals that represent these waveforms.
Tsv File name
C:\TekApplications\tdsusb2\tsvfiles\LS_SQC.tsv
C:\TekApplications\tdsusb2\tsvfiles\FS_SQC.tsv
C:\TekApplications\tdsusb2\tsvfiles\HS_sqc.tsv
C:\TekApplications\tdsusb2\tsvfiles\inrush.tsv
xxx
Signal type
Low Speed
Full Speed
High speed
Low/Full/High Speed
TDSUSB2 Universal Serial Bus Measurements Packa ge 69
Page 82

Tutorial Taking a Full Speed Signal Quality Measurement
Taking a Full Speed Signal Quality Measurement
This section discusses how to take a Full Speed Signal Quality measurement, view the results, and generate
a report. To perform these tasks, the application must be installed and enabled on a supported oscilloscope.
View Install
To take a Full Speed Signal Quality measurement, follow these steps:
1. To set the application to default values, select File > Recall Default. The application displays the
message ‘Default setup recalled successfully.’ Select OK to view a screen image showing the default
settings.
2. Select all the Signal Quality measurements in the Signal Q uality Check area using Select All button.
3. Select the Configure tab or select Measurements > Configure. The Measurements: Configure default
settings display.
ing the application
(see page 12) to install the application.
4. Select the Measurements: Source
D+, D– and Qualifier. You have to always select D+ first. If you select any one of the Live channels
CH1-CH
channel source. If you select any one of the Ref channels Ref1-Ref4 for D+ source, the remaining Ref
channels are selected from the D– . There is no Qualifier channel source for the Ref signals.
If the source is from a file, use the browse button to look for the file.
1. Selec
2. Select the
(see page 199) and the Waveform Plot.
3. Minimize the eye diagram a nd waveform plot to view the summary results.
4. The application displays the Results Summary as PASS
view the details of the selected test.
5. To view the Results Details
command button in the Overall Result area to view the details of each measurement.
6. Select Utilities > Report Generator in the application menu bar to generate the Report.
7. You ca n view the default screen
appears with a default file name. You can change the file name if you want. Click on the Generate
button.
4 for D+ source, the remaining Live channels are selected from the D– and the Qualifier
tthefile
C:\TekApplications\tdsusb2\tsvfiles\FS_SQC.tsv.
command button to run the application. The application displays the Eye Diagram
. If the source is Live or Ref, configure the appropriate channels for
. You can also select the result to
(see page 55), select Results > Details in the application menu bar or PASS
with the Tektronix Specific Format enabled. The report directory
8. Click the Generate button. The application generates an HTML file in
susb2\report
70 TDSUSB2 Universal Serial Bus Measurements Package
. To view this report, open it in an HTML vie wer or a browser.
C:\TekApplications\td-
Page 83

Tutorial Taking a Low Speed Inrush Current Measurement
Taking a Low Speed Inrush Current Measurement
This section discusses how to take a Low Speed Inrush Current Measurement, view the results, and
generate a report. To perform these tasks, the application must be installed and enabled on a supported
oscilloscop
1. To set the application to default values, select File > Recall default. The application displays the
message ‘De
2. Select Measurements > Low Speed tab.
e.
fault setup recalled successfully.’
3. Select Inrush Current measurement
4. Select Measurements > Configure tab and use the default settings set by the application.
5. Select the Source tab. Select From File.
6. Select file
7. Select the
8. The application displays the Results Summary as Conditional PASS.
9. You can also select the result to view the details of the selected tests
10. Select Results > Details from the application menu bar to view Results Details
11. Select Utilities > Report Generator in the application menu bar to generate a report.
12. Select the CSV Specific Report and use the default file name. Select the Generate button.
13. The application displays the sample report file
C:\TekApplications\tdsusb2\tsvfiles\LS_inrush.tsv.
command button to run the application.
.
.
(see page 142).
(see page 147) in a browser.
TDSUSB2 Universal Serial Bus Measurements Packa ge 71
Page 84

Tutorial Taking a High Speed Signal Quality Measurement
Taking a High Speed Signal Quality Measurement
This section discusses how to take a High Speed Signal Quality measurement, view the results, and
generate the report. To perform these tasks, the application must be installed and enabled on a supported
oscilloscop
To take a High Speed Signal Quality measurement, follow these steps:
1. To set the application to default values, select File > Recall Default. The application displays the
message ‘Default setup recalled successfully.’
e.
2. Select Measurements > High Speed
Quality Check area using Select All button.
3. Select the Configure option or go to Measurements > Configure.
4. Select the Source tab > From File > Browse
5. Select the file
6. Select the
Eye Diagram
7. Minimize the eye diagram and the waveform plot button to view the summary results.
8. Select Results > Details in the application menu bar to view the Results Details.
Information b utton to display the additional information.
9. Select Utilities > Generate Report to generate the report.
10. Select the Report format as Plug-Fest Specific and use the default file name. Select Generate.
11. The application displays the sample report file
C:\TekApplications\tdsusb2\tsvfiles\HS_sqc.tsv.
command button to run the application. The application automatically displays the
(see page 144) and the Waveform Plot.
and select all the Signal Quality measurements in the Signal
and locate the file.
Click the Additional
(see page 138) in a browser.
72 TDSUSB2 Universal Serial Bus Measurements Package
Page 85

Tutorial Taking a Low Speed Signal Quality Measurement
Taking a Low Speed Signal Quality Measurement
This section discusses how to take a Low Speed Signal Quality measurement, view the results, and
generate a report. To perform these tasks, the application must be installed and enabled on a supported
oscilloscop
To take a Low Speed Signal Quality measurement, follow these steps:
1. To set the application to default values, select File > Recall Default. The application displays the
message ‘Default setup recalled successfully.’ Select OK to view a screen image showing the default
settings.
2. Select the Low Speed tab and s elect the Signal Quality measurements in the Signal Quality Check
area usin
e. View Installing the application
g Select All button.
(see page 12) to install the application.
3. Select the Configure tab or select Measurements > Configure. The Measurements: Configure
sdisplay.
setting
4. Select the Measurements: Source. If the source is Live or Ref, configure the appropriate channels for
D+, D– a
CH1-CH4 for D+ source, the remaining Live channels are selected from the D– and the Qualifier
channel source. If you select any one of the Ref channels Ref1-Ref4 for D+ source, the remaining Ref
channels are selected from the D– . There is no Qualifier channel source for the Ref signals.
If the source is from the file, use the browse button to browse the file.
1. Select the file
2. Select the
(see page 144) and the Waveform Plot (see page 143).
3. Minimize the eye diagram and waveform plot to view the summary results.
4. The application displays the Results Summary as PASS
view the details of the selected test.
5. To view the Results Details
PASS command button in the Overall Result area to view the details of each measurements.
6. Select Utilities > Report Generator in the application menu bar to generate the Report.
nd Qualifier. You have to always select D+ first. If you select any one of the Live channels
C:\TekApplications\tdsusb2\tsvfiles\LS_SQC.tsv.
command button to run the application. The application displays the Eye Diagram
. You can also s elect the result to
(see page 143), select Results > Details in the application menu bar or
default
7. You ca n view the default screen
appears with a default file name. You can change the file name if you want. Click the Generate button.
8. Click the generate button. The application generates an HTML file in
susb2\report
TDSUSB2 Universal Serial Bus Measurements Packa ge 73
.Toview this report (see page 142),openitinanHTMLviewerorabrowser.
with the Tektronix Specific Format enabled. The report directory
C:\TekApplications\td-
Page 86

Tutorial Taking a Low Speed Signal Quality Measurement
74 TDSUSB2 Universal Serial Bus Measurements Package
Page 87

Application Examples About Application Examples
About Application Examples
This section presents the application examples. The simplified examples highlight the application
measurements and show how to use the application to solve your test problems.
To use these examples, you must have the TDSUSB2 application installed and enabled on the oscilloscope.
Connect the probes to your unit under test (UUT), and perform the configuration tasks.
See Also
Starting the Application (see page 69)
Installing the Application (see page 12)
Specifying the Equipment-Full Speed Signal Quality Tests for Upstream Testing (see page 83)
Selecting and Configuring Measurements-Droop Tests (see page 82)
Selecting and Configuring Measurements-Full Spee
page 84)
Selecting and Configuring Measurements-Inrush Current Test (see page 89)
Selecting and Configuring Measurements-Inrush Current Test (see page 89)
Selecting and Configuring Measurements-Signal Quality Tests for Hi
Testing (see page 99)
d Signal Quality Tests for Upstream Testing
gh Speed Devices for Upstream
(see
Specifying the Equipment-Full Speed Signal Quality Downstream Tests
The following equipment is needed for downstream signal quality check on a Full Speed device testing:
Tektronix digital oscilloscope
TDSUSB2 application
TDSUSBF compliance test fixture (Revision B)
Three of the following single-ended voltage probes: P6245, P6243, TDP1500, TDP3500, or TAP1500.
Typical Equipment Setup-Full Speed Signal Quality Downstream Tests
To set up the equipment for Full Speed Signal Quality Downstream test, follow these steps:
1. Set the S6 switch to the Init position.
2. Use the adapters to connect the A receptacle from Device SQ test section (marked DUT) of the
test fixture to the USB2.0 Low Speed device.
TDSUSB2 Universal Serial Bus Measurements Packa ge 75
Page 88

Application Examples Selecting and Configuring Measurements-Full Speed Signal Quality Tests
3. Connect Ch1 of the D+ probe to the D+ pins on the Device SQ section of the test fixture.
4. Connect Ch2 of the D– probe to the D– pins on the Device SQ section of the test fixture.
5. Connect the Init port of the Device SQ section of the test fixture to any port of the unit under test
(hub) using USB cable.
6. Select the measurement and select the
7. Select OK after acquiring a waveform. Verify that it is a correct waveform.
NOTE. Make sure the acquired signal is a valid waveform.
command button to run the application.
Selecting and Configuring Measurements-Full Speed Signal Quality
Tests
Follow the steps to select measurements for Full Speed Signal Quality check:
76 TDSUSB2 Universal Serial Bus Measurements Package
Page 89

Application Examples Selecting and Configuring Measurements-Full Speed Signal Quality Tests
1. From the application menu, select Measurement > Select > Full Speed tab.
2. Select the following signal quality checks:
Eye Diagram Test
Signal Rate
Paired JK Ji
tter
Paired KJ Jitter
Consecutive Jitter
EOP Width
Cross-Over Voltage
Rising Edge Rate
Falling
Edge Rate
3. Select the Select All toggle button to select all the measurements simultaneously. Click on any
measur
ement button to deselect it.
Configuring the Measurement
Follow the steps to configure the selected measurements :
1. From
2. Configure the following options:
Option Set to
Tier Tier6
Direction Downstream
Test Po int
xxx
3. Select the Source tab.
the application menu, select Measurement > Configure > Configure.
Set the test point to Far End
4. Configure the following options:
Option Set to
Live/Ref Single-ended
xxx
5. If you select Single-ended, you must select two channels for D+ and D–.
6. Select
to acquire the data.
7. The application automatically displays the eye diagram and waveform plot of the signal acquired
from the unit under test.
TDSUSB2 Universal Serial Bus Measurements Packa ge 77
Page 90

Application Examples Viewing Results-Full Speed Signal Quality Tests
Viewing Results-Full Speed Signal Quality Tests
To view the results of the tests, follow these steps:
1. From the application menu, select Results > Summary.
2. Click on any of the test result buttons to get the details of that test.
3. From the application menu, select Results > Details.
4. Click the Eye Diagram (see page 144) option in Results Summary or the Details to view the Eye
Diagram.
5. Click the Waveform Plot
78 TDSUSB2 Universal Serial Bus Measurements Package
(see page 143) option to view the annotated waveform plot.
Page 91

Application Examples Generating Reports-Full Speed Signal Quality Tests
Generating Reports-Full Speed Signal Quality Tests
To generate reports of the test results, follow these steps:
1. From the application menu, select Utilities > Report Generator.
2. Select any one of the Report Formats: Tektronix Specific, Plug-Fest Specific or CSV format.
3. Select the manual generation mode.
4. Select the Generate button to display and view the selected report format.
NOTE. You can view the Plug-Fest specific report format as HTML pages and the .csv format in Microsoft
Excel.
Specifying the Equipment-Low Speed Droop Tests
The following equipment is needed to perform a Droop Test for Low Speed device:
Tektronix digital oscilloscope
TDSUSB2 application
TDSUSBF compliance test fixture (Revision B)
Two of the following single-ended voltage probes: P6245, P6243, TDP1500, TDP3500, or TAP1500.
Typical Equipment Setup-Low Speed Droop Tests
To set up the equipment for Droop test, follow these steps:
1. Use the Droop and Adjacent Trigger section for the Droop test. Use standard USB cable to connect the
loads on the test fixture to the ports of the unit under test as shown in the next fi gure.
2. The setup requires two channels of the oscilloscope: one for the Droop Load Trigger Timer that is
on the Droop test load section, and the other for V
section of the test fixture. Use the load switch to select appropriate loads for Droop Test.
3. In the Droop and Adjacent Trigger section on the test fixture, probe Ch1 from the VBUS and ground
the pins.
4. In the Droop Test Load section on the test fixture, probe Ch2 from the oscillator (marked OSC)
and ground the pins.
that is on the Adjacent Trigger and Droop Test
BUS
5. Connect the Droop Trigger Test Load to the Port1 of the unit under test (hub).
6. Connect the Load1 to Port2 of the hub under test.
TDSUSB2 Universal Serial Bus Measurements Packa ge 79
Page 92

Application Examples Typical Equipment Setup-Low Speed Droop Tests
7. Connect the Load2 to the A receptacle of the Droop and Adjacent Trigger section on the test fixture.
Connect the A pin dongle from the Droop and Adjacent Trigger section to the Port4 of the unit under
test (hub). Po
8. Connect the Load3 to Port3 of the unit under test (hub). Now all the ports of the unit under test
are connecte
rt4 is the port under test of the hub.
d (hub).
9. Select the measurement and select the
10. Select OK when the valid waveform is acquired.
11. Observe the droop in the VBUS when Droop test load is applied.
NOTE. The application automatically sets up the oscilloscope to acquire the Droop signal. If you do not
get a valid signal, set up the oscilloscope accordingly.
NOTE. Use the Load Switch to select 500 mA test loads for Droop testing of a self powered hub and
system. Use the Load Switch to select 100 mA test loads for Droop testing of bus powered hub and system.
command button to run the application.
80 TDSUSB2 Universal Serial Bus Measurements Package
Page 93

Application Examples Typical Equipment Setup-Low Speed D roop Tests
TDSUSB2 Universal Serial Bus Measurements Packa ge 81
Page 94

Application Examples Selecting and Configuring Measurements-Droop Tests
Selecting and Configuring Measurements-Droop Tests
From the application menu, select Measurement > Select > Droop Test.
Configuring t
he Measurement
Follow the steps to configure the selected measurement:
1. From the application menu, select Measurement > Configure.
2. Configure the following options:
Option Set to
Port Port under test
Source
VBUS
Trigger
Device type
xxx
Downstream
Ch1
Ch2
Self-powered
3. Select to acquire the data.
4. After acquiring the data, the application displays the eye diagram and the waveform plot automatically.
Viewing Results-Droop Tests
To view the results of the tests, follow these steps:
1. Run
the application and from the application menu, select Results > Summary
(see page 201).
2. Click on any of the test result buttons to get the details of that test.
3. From the application menu, select Results > Details.
(see page 201)
4. Click the Eye Diagram option in Results Summary or Results Details to view the Eye Diagram.
5. Click the Waveform Plot to view the annotated waveform plot.
82 TDSUSB2 Universal Serial Bus Measurements Package
Page 95

Application Examples Generating Reports-Droop Tests
Generating Reports-Droop Tests
To generate reports of the test results, follow these steps:
1. From the application menu, select Utilities > Report Generator.
2. Select any one of the Report Formats: Tektronix Specific, Plug-Fest Specific or CSV format.
3. Select Manual option to generate the report.
4. Select the G
NOTE. You can view the Plug-Fest specific report format as HTML pages and the .csv format in Microsoft
Excel.
enerate button to display and view the selected report format.
Specifying the Equipment-Full Speed Signal Quality Tests for Upstream Testing
The following equipment is needed for u pstream signal quality check on a low or full speed device:
Tektron
TDSUSB2 application
TDSUSBF compliance test fixture (Revision B)
Three of the following single-ended voltage probes: P6245, P6243, TDP1500, TDP3500, or TAP1500.
ix digital oscilloscope
Typical Equipment Setup-Full Speed Signal Quality Tests for Upstream Testing
To set up the e quipment for Full Speed Signal Quality test for Upstream, follow these steps:
1. Use the A receptacle to connect the USB unit under test (device) to the Inrush Droop section of
the test fixture.
2. Connect the Qualifier device to the Adjacent Trigger and Droop section of the test fixtureasshownin
the next figure.
3. Connect Ch1 of the D+ probe to the D+ pins on the Inrush Droop section of the test fixture.
4. Connect Ch2 of the D– probe to the D– pins on the Inrush Droop section of the test fixture.
5. Connect the D+ (D- for Low speed) pin of the Adjacent Trigger and Droop Section of the test fixture
to Ch3 as shown in the next figure.
TDSUSB2 Universal Serial Bus Measurements Packa ge 83
Page 96

Application Examples Selecting and
Configuring Mea
6. Use the connectors to connect the A pin dongle from the Adjacent Trigger and Droop section of the
test fixture to one port of the Hub 5. Use the A pin dongle from the Inrush Droop section of the test
fixture to anot
her port of the Hub 5.
surements-Full Speed Signal Quality Tests for Upstream Testing
7. Select the measurement and select the
8. Select OK after acquiring a waveform. Verify that it is a correct waveform.
NOTE. Use the standard USB cables to connect between the hubs. Keep the Discharge switch in the
Inrush Droop section in the ON position.
command button to run the application.
lecting and Configuring Measurements-Full Speed Signal Quality
Se
sts for Upstream Testing
Te
llow the steps to select measurements for Full Speed Signal Quality check:
Fo
84 TDSUSB2 Universal Serial Bus Measurements Package
Page 97

Application Examples Selecting and
Configuring Mea
surements-Full Speed Signal Quality Tests for Upstream Testing
1. Select Measurements > Select > Full Speed tab.
2. Select Signal Quality tests:
Eye Diagram Test
Signal Rate
Paired JK Ji
tter
Paired KJ Jitter
Consecutive Jitter
EOP Width
Cross-Over Voltage
Rising Edge Rate
Falling
Edge Rate
3. Select the Select All toggle button to select all the measurements simultaneously. Click any
measur
ement button to deselect it.
Configuring the Measurement
Follow the steps to configure the selected measurement:
1. From
2. Configure the following options:
Option Set to
Tier Tier6
Direction Upstream
Test Point Far End
xxx
3. Select the Source tab.
the application menu, select Measurement > Configure > Configure tab.
4. Configure the following options:
Option Set to
Live/Ref Single-ended Ch1, Ch2
Qualify Channel Ch3
xxx
5. Select to acquire the d
6. The application automatically displays the Eye Diagram
page 141) of the signal ac
ata.
(see page 140) and the Waveform Plot (see
quired from the unit under test.
TDSUSB2 Universal Serial Bus Measurements Packa ge 85
Page 98

Application Examples Viewing Results-Full Speed Signal Quality Tests for Upstream Testing
Viewing Results-Full Speed Signal Quality Tests for Upstream Testing
To view the results of the tests, follow these steps:
1. Run the application and from the application menu, select Results > Summary.
2. Click any of the test result buttons to get the details of that test.
3. From the application menu, select Results > Details.
4. Click the Ey
Diagram.
5. Click the W
eDiagram
aveform Plot to view the annotated waveform plot.
(see page 144) option in Results Summary or Results Details to view the Eye
Generating Reports-Full Speed Signal Quality Tests for Upstream Testing
To generate reports of the test results, follow these steps:
1. From the application menu, select Utilities > Report Generator.
2. Select any one of the Report Formats: Tektronix, Plug-Fest SpecificorCSVformat.
3. Select the M anual option to generate the report.
4. Select the Generate button to display and view the selected report format.
NOTE. You can view the Plug-Fest specific report format as HTML pages and the .csv format in Microsoft
Excel.
Specifying the Equipment-Full Speed Inrush Current Test
The following equipment is needed for Inrush Current Check on a Full Speed Device:
Tektronix digital oscilloscope
SUSB2 application
TD
86 TDSUSB2 Universal Serial Bus Measurements Package
Page 99

Application Examples Typical Equipment Setup-Inrush Current Test
TDSUSBF compliance test fixture (Revision B)
One TCP202 or TCP0030 current probe
Typical Equipment Setup-Inrush Current Test
To set up the equipment for Inrush test, follow these steps:
1. Use the dongle on the Inrush section of the test fixture to connect it to the host system.
2. Connect th
and Ch1 of the oscilloscope.
3. Configure the measurement and select the
4. Connect the unit under test to the A Receptacle of the Inrush section of the test fixture and observe the
Inrush current signal.
5. Select OK after acquiring a waveform. Verify that it is a correct waveform.
NOTE. To avoid the triggering of Inrush signals and false inrush current by the discharge switch, place
ush discharge switch in the ON position and hot-plug the unit under test (device). In case a valid
the inr
Inrush signal is not acquired, use the cursor mode in File > Preferences or set up the oscilloscope to
get a valid waveform.
e current probe between the V
loop wire on the Inrush section on the Test fixture
BUS
command button to run the application.
TDSUSB2 Universal Serial Bus Measurements Packa ge 87
Page 100

Application Examples Typical Equipment Setup-Inrush Current Test
88 TDSUSB2 Universal Serial Bus Measurements Package
 Loading...