

Page 1

User Manual
TDSPSM1
Processor Specifications Measurements Application
071-0581-00
This document supports software version 1.0.0
and above.
Warning
The servicing instructions are for use by
qualified personnel only. To avoid personal
injury, do not perform any servicing unless you
are qualified to do so. Refer to all safety
summaries prior to performing service.
Page 2

Copyright © T ektronix, Inc. All rights reserved. Licensed software products are owned by Tektronix or its suppliers and
are protected by United States copyright laws and international treaty provisions.
Use, duplication, or disclosure by the Government is subject to restrictions as set forth in subparagraph (c)(1)(ii) of the
Rights in T echnical Data and Computer Software clause at DFARS 252.227-7013, or subparagraphs (c)(1) and (2) of the
Commercial Computer Software – Restricted Rights clause at F AR 52.227-19, as applicable.
T ektronix products are covered by U.S. and foreign patents, issued and pending. Information in this publication supercedes
that in all previously published material. Specifications and price change privileges reserved.
Printed in the U.S.A.
T ektronix, Inc., P.O. Box 1000, Wilsonville, OR 97070–1000
TEKTRONIX and TEK are registered trademarks of T ektronix, Inc.
Page 3

WARRANTY
T ektronix warrants that the media on which this software product is furnished and the encoding of the programs on the media
will be free from defects in materials and workmanship for a period of three (3) months from the date of shipment. If a
medium or encoding proves defective during the warranty period, T ektronix will provide a replacement in exchange for the
defective medium. Except as to the media on which this software product is furnished, this software product is provided “as
is” without warranty of any kind, either express or implied. T ektronix does not warrant that the functions contained in this
software product will meet Customer’s requirements or that the operation of the programs will be uninterrupted or error-free.
In order to obtain service under this warranty, Customer must notify Tektronix of the defect before the expiration of the
warranty period. If T ektronix is unable to provide a replacement that is free from defects in materials and workmanship
within a reasonable time thereafter, Customer may terminate the license for this software product and return this software
product and any associated materials for credit or refund.
THIS WARRANTY IS GIVEN BY TEKTRONIX IN LIEU OF ANY OTHER WARRANTIES, EXPRESS OR
IMPLIED. TEKTRONIX AND ITS VENDORS DISCLAIM ANY IMPLIED WARRANTIES OF
MERCHANTABILITY OR FITNESS FOR A PAR TICULAR PURPOSE. TEKTRONIX’ RESPONSIBILITY TO
REPLACE DEFECTIVE MEDIA OR REFUND CUSTOMER’S PAYMENT IS THE SOLE AND EXCLUSIVE
REMEDY PROVIDED TO THE CUSTOMER FOR BREACH OF THIS WARRANTY. TEKTRONIX AND ITS
VENDORS WILL NOT BE LIABLE FOR ANY INDIRECT , SPECIAL, INCIDENTAL, OR CONSEQUENTIAL
DAMAGES IRRESPECTIVE OF WHETHER TEKTRONIX OR THE VENDOR HAS ADVANCE NOTICE OF
THE POSSIBILITY OF SUCH DAMAGES.
Page 4

Page 5

Table of Contents
Getting Started
Operating Basics
Related Documentation vii. . . . . . . . . . . . . . . . . . . . . . . . . . . . . . . . . . . . . . . . . . . .
Conventions vii. . . . . . . . . . . . . . . . . . . . . . . . . . . . . . . . . . . . . . . . . . . . . . . . . . . . .
Contacting T ektronix viii. . . . . . . . . . . . . . . . . . . . . . . . . . . . . . . . . . . . . . . . . . . . . .
Product Description 1. . . . . . . . . . . . . . . . . . . . . . . . . . . . . . . . . . . . . . . . .
Compatibility 1. . . . . . . . . . . . . . . . . . . . . . . . . . . . . . . . . . . . . . . . . . . . . . . . . . . .
Requirements and Restrictions 2. . . . . . . . . . . . . . . . . . . . . . . . . . . . . . . . . . . . . . .
Updates Through a Web Browser 2. . . . . . . . . . . . . . . . . . . . . . . . . . . . . . . . . . . .
Accessories 2. . . . . . . . . . . . . . . . . . . . . . . . . . . . . . . . . . . . . . . . . . . . . . . . . . . . . .
Installation 3. . . . . . . . . . . . . . . . . . . . . . . . . . . . . . . . . . . . . . . . . . . . . . . .
Installing the Application 3. . . . . . . . . . . . . . . . . . . . . . . . . . . . . . . . . . . . . . . . . . .
Connecting to a System Under T est 4. . . . . . . . . . . . . . . . . . . . . . . . . . . . . . . . . . .
Operating Basics 5. . . . . . . . . . . . . . . . . . . . . . . . . . . . . . . . . . . . . . . . . . .
Application Menu Structure 5. . . . . . . . . . . . . . . . . . . . . . . . . . . . . . . . . . . . . . . . .
Main and Side Menus 5. . . . . . . . . . . . . . . . . . . . . . . . . . . . . . . . . . . . . . . . . .
Common Menu Items 6. . . . . . . . . . . . . . . . . . . . . . . . . . . . . . . . . . . . . . . . . .
Utility Menus 6. . . . . . . . . . . . . . . . . . . . . . . . . . . . . . . . . . . . . . . . . . . . . . . .
Using Basic Oscilloscope Functions 6. . . . . . . . . . . . . . . . . . . . . . . . . . . . . . . . . .
Using Local Help 6. . . . . . . . . . . . . . . . . . . . . . . . . . . . . . . . . . . . . . . . . . . . .
Returning to the Application 6. . . . . . . . . . . . . . . . . . . . . . . . . . . . . . . . . . . . .
W arning Messages 7. . . . . . . . . . . . . . . . . . . . . . . . . . . . . . . . . . . . . . . . . . . . . . . .
Configuring the Display 7. . . . . . . . . . . . . . . . . . . . . . . . . . . . . . . . . . . . . . . . . . . .
Setting Up the Application 8. . . . . . . . . . . . . . . . . . . . . . . . . . . . . . . . . . . . . . . . . .
Measurement Setup 8. . . . . . . . . . . . . . . . . . . . . . . . . . . . . . . . . . . . . . . . . . . .
Display Results Setup 16. . . . . . . . . . . . . . . . . . . . . . . . . . . . . . . . . . . . . . . . . .
T aking Measurements 18. . . . . . . . . . . . . . . . . . . . . . . . . . . . . . . . . . . . . . . . . . . . .
Acquiring Waveforms 18. . . . . . . . . . . . . . . . . . . . . . . . . . . . . . . . . . . . . . . . . .
Localizing Measurements 19. . . . . . . . . . . . . . . . . . . . . . . . . . . . . . . . . . . . . . .
Viewing the Results 19. . . . . . . . . . . . . . . . . . . . . . . . . . . . . . . . . . . . . . . . . . . . . . .
Statistics 20. . . . . . . . . . . . . . . . . . . . . . . . . . . . . . . . . . . . . . . . . . . . . . . . . . . .
Graphical Formats 21. . . . . . . . . . . . . . . . . . . . . . . . . . . . . . . . . . . . . . . . . . . . .
Clearing Results 21. . . . . . . . . . . . . . . . . . . . . . . . . . . . . . . . . . . . . . . . . . . . . .
Saving and Recalling Setups 21. . . . . . . . . . . . . . . . . . . . . . . . . . . . . . . . . . . . . . . .
Save Setup 22. . . . . . . . . . . . . . . . . . . . . . . . . . . . . . . . . . . . . . . . . . . . . . . . . . .
Recall Setup 22. . . . . . . . . . . . . . . . . . . . . . . . . . . . . . . . . . . . . . . . . . . . . . . . .
Default Setup 22. . . . . . . . . . . . . . . . . . . . . . . . . . . . . . . . . . . . . . . . . . . . . . . .
Exiting the Application 23. . . . . . . . . . . . . . . . . . . . . . . . . . . . . . . . . . . . . . . . . . . .
Tutorial 25. . . . . . . . . . . . . . . . . . . . . . . . . . . . . . . . . . . . . . . . . . . . . . . . . . .
Setting Up the Oscilloscope 25. . . . . . . . . . . . . . . . . . . . . . . . . . . . . . . . . . . . . . . . .
Starting the Application 25. . . . . . . . . . . . . . . . . . . . . . . . . . . . . . . . . . . . . . . . . . . .
Loading the Reference Waveform Files 27. . . . . . . . . . . . . . . . . . . . . . . . . . . . . . . .
TDSPSM1 Processor Specifications Measurements Application User Manual
i
Page 6

Table of Contents
Reference
Appendix
T aking Measurements from Two Waveforms 27. . . . . . . . . . . . . . . . . . . . . . . . . . .
T aking AC Timing Measurements 33. . . . . . . . . . . . . . . . . . . . . . . . . . . . . . . . . . . .
Stopping the Tutorial 37. . . . . . . . . . . . . . . . . . . . . . . . . . . . . . . . . . . . . . . . . . . . . .
Returning to the Tutorial 37. . . . . . . . . . . . . . . . . . . . . . . . . . . . . . . . . . . . . . . . . . .
Menu Structure 39. . . . . . . . . . . . . . . . . . . . . . . . . . . . . . . . . . . . . . . . . . . .
Parameters Reference 41. . . . . . . . . . . . . . . . . . . . . . . . . . . . . . . . . . . . . . .
Measurement Setup Menus 41. . . . . . . . . . . . . . . . . . . . . . . . . . . . . . . . . . . . . . . . .
Waveform Sources 42. . . . . . . . . . . . . . . . . . . . . . . . . . . . . . . . . . . . . . . . . . . . . . . .
Histogram Graphical Format 42. . . . . . . . . . . . . . . . . . . . . . . . . . . . . . . . . . . . . . . .
Profile Graphical Format 43. . . . . . . . . . . . . . . . . . . . . . . . . . . . . . . . . . . . . . . . . . .
Control Menu 44. . . . . . . . . . . . . . . . . . . . . . . . . . . . . . . . . . . . . . . . . . . . . . . . . . . .
Utility Menu 44. . . . . . . . . . . . . . . . . . . . . . . . . . . . . . . . . . . . . . . . . . . . . . . . . . . . .
Appendix A: Measurement Algorithms A–1. . . . . . . . . . . . . . . . . . . . . . . .
Oscilloscope Setup Guidelines A–1. . . . . . . . . . . . . . . . . . . . . . . . . . . . . . . . . . . . . . .
T est Methodology A–1. . . . . . . . . . . . . . . . . . . . . . . . . . . . . . . . . . . . . . . . . . . . . . . . .
Edge-Timing Measurements A–2. . . . . . . . . . . . . . . . . . . . . . . . . . . . . . . . . . . . . . . .
Dual Waveform Measurements A–2. . . . . . . . . . . . . . . . . . . . . . . . . . . . . . . . . . . . . .
Channel-to-Channel Delay Measurement A–2. . . . . . . . . . . . . . . . . . . . . . . . . . .
Setup Time Measurement A–2. . . . . . . . . . . . . . . . . . . . . . . . . . . . . . . . . . . . . . .
Hold Time Measurement A–3. . . . . . . . . . . . . . . . . . . . . . . . . . . . . . . . . . . . . . .
Clock-to-Output Time Measurement A–3. . . . . . . . . . . . . . . . . . . . . . . . . . . . . .
Single Waveform Measurements A–4. . . . . . . . . . . . . . . . . . . . . . . . . . . . . . . . . . . . .
High Time Measurement A–4. . . . . . . . . . . . . . . . . . . . . . . . . . . . . . . . . . . . . . .
Low Time Measurement A–4. . . . . . . . . . . . . . . . . . . . . . . . . . . . . . . . . . . . . . . .
Rise Time Measurement A–4. . . . . . . . . . . . . . . . . . . . . . . . . . . . . . . . . . . . . . . .
Fall Time Measurement A–5. . . . . . . . . . . . . . . . . . . . . . . . . . . . . . . . . . . . . . . .
Period Measurement A–5. . . . . . . . . . . . . . . . . . . . . . . . . . . . . . . . . . . . . . . . . . .
Index
ii
TDSPSM1 Processor Specifications Measurements Application User Manual
Page 7

List of Figures
Table of Contents
Figure 1: TDSPSM1 Processor Specifications Measurements
Application 1. . . . . . . . . . . . . . . . . . . . . . . . . . . . . . . . . . . . . . . . . . . . .
Figure 2: Returning to the application 7. . . . . . . . . . . . . . . . . . . . . . . . .
Figure 3: Display Options side menu 8. . . . . . . . . . . . . . . . . . . . . . . . . . .
Figure 4: Simple timing diagram and positive range values 11. . . . . . . .
Figure 5: Positive range values for a Setup Time measurement 11. . . . .
Figure 6: Complex setup time and hold time with a negative
range value 12. . . . . . . . . . . . . . . . . . . . . . . . . . . . . . . . . . . . . . . . . . . . .
Figure 7: Negative Hold Time measurement and negative
range value 12. . . . . . . . . . . . . . . . . . . . . . . . . . . . . . . . . . . . . . . . . . . . .
Figure 8: Setup Time measurement with a data transition excluded
by range values 13. . . . . . . . . . . . . . . . . . . . . . . . . . . . . . . . . . . . . . . . .
Figure 9: Complex hold time and setup time with a negative
range value 13. . . . . . . . . . . . . . . . . . . . . . . . . . . . . . . . . . . . . . . . . . . . .
Figure 10: Negative Setup Time measurement and negative
range value 14. . . . . . . . . . . . . . . . . . . . . . . . . . . . . . . . . . . . . . . . . . . . .
Figure 11: Hold Time measurement with a data transition excluded
by range values 14. . . . . . . . . . . . . . . . . . . . . . . . . . . . . . . . . . . . . . . . .
Figure 12: How to set voltage reference levels 15. . . . . . . . . . . . . . . . . . .
Figure 13: Control menu 19. . . . . . . . . . . . . . . . . . . . . . . . . . . . . . . . . . . . .
Figure 14: Example of the results display formats 20. . . . . . . . . . . . . . . .
Figure 15: Save/Recall menu 22. . . . . . . . . . . . . . . . . . . . . . . . . . . . . . . . .
Figure 16: Exit menu 23. . . . . . . . . . . . . . . . . . . . . . . . . . . . . . . . . . . . . . . .
Figure 17: Starting the application 26. . . . . . . . . . . . . . . . . . . . . . . . . . . .
Figure 18: TDSPSM1 application initial display 26. . . . . . . . . . . . . . . . .
Figure 19: From Edge menu, source 28. . . . . . . . . . . . . . . . . . . . . . . . . . .
Figure 20: To Edge menu, source 28. . . . . . . . . . . . . . . . . . . . . . . . . . . . . .
Figure 21: Ch-Ch Delay setup complete 29. . . . . . . . . . . . . . . . . . . . . . . .
Figure 22: Ch-Ch Delay lesson: Statistics readout 29. . . . . . . . . . . . . . . .
Figure 23: Histogram format menu 30. . . . . . . . . . . . . . . . . . . . . . . . . . . .
Figure 24: Ch-Ch Delay lesson: Histogram format 31. . . . . . . . . . . . . . .
Figure 25: Profile format menu 32. . . . . . . . . . . . . . . . . . . . . . . . . . . . . . .
Figure 26: Ch-Ch Delay lesson: Profile format 33. . . . . . . . . . . . . . . . . .
TDSPSM1 Processor Specifications Measurements Application User Manual
iii
Page 8

Table of Contents
List of Tables
Figure 27: Input menu voltage reference levels 34. . . . . . . . . . . . . . . . . .
Figure 28: AC Timing setup complete 34. . . . . . . . . . . . . . . . . . . . . . . . . .
Figure 29: AC Timing lesson, Period measurement: Statistics
readout 35. . . . . . . . . . . . . . . . . . . . . . . . . . . . . . . . . . . . . . . . . . . . . . . .
Figure 30: All AC Timing measurements selected 36. . . . . . . . . . . . . . . .
Figure 31: All AC Timing measurements lesson: Statistics readout 36. .
Figure 32: Application-specific menu structure 39. . . . . . . . . . . . . . . . . .
Figure 33: Control and Utility menu structures 40. . . . . . . . . . . . . . . . . .
Table 1: Channel assignments 4. . . . . . . . . . . . . . . . . . . . . . . . . . . . . . . .
Table 2: Common menu items 6. . . . . . . . . . . . . . . . . . . . . . . . . . . . . . . .
Table 3: Utility menus 6. . . . . . . . . . . . . . . . . . . . . . . . . . . . . . . . . . . . . .
Table 4: Display options 7. . . . . . . . . . . . . . . . . . . . . . . . . . . . . . . . . . . . .
Table 5: Measurements 8. . . . . . . . . . . . . . . . . . . . . . . . . . . . . . . . . . . . .
Table 6: AC Timing measurements 9. . . . . . . . . . . . . . . . . . . . . . . . . . . .
Table 7: Setup menus and waveform source side menus 10. . . . . . . . . .
Table 8: Waveform definition side menu items 16. . . . . . . . . . . . . . . . . .
Table 9: Results display formats 16. . . . . . . . . . . . . . . . . . . . . . . . . . . . . .
Table 10: Histogram format side menu items 17. . . . . . . . . . . . . . . . . . .
Table 11: Profile format side menu items 17. . . . . . . . . . . . . . . . . . . . . . .
Table 12: Control menu items 18. . . . . . . . . . . . . . . . . . . . . . . . . . . . . . . .
Table 13: Setup menus and parameters 41. . . . . . . . . . . . . . . . . . . . . . . .
Table 14: Waveform source parameters 42. . . . . . . . . . . . . . . . . . . . . . . .
Table 15: Histogram format parameters 42. . . . . . . . . . . . . . . . . . . . . . .
Table 16: Profile format parameters 43. . . . . . . . . . . . . . . . . . . . . . . . . .
Table 17: Control menu parameters 44. . . . . . . . . . . . . . . . . . . . . . . . . . .
Table 18: Utility menus and parameters 44. . . . . . . . . . . . . . . . . . . . . . .
iv
TDSPSM1 Processor Specifications Measurements Application User Manual
Page 9
General Safety Summary
Review the following safety precautions to avoid injury and prevent damage to
this product or any products connected to it. To avoid potential hazards, use this
product only as specified.
Only qualified personnel should perform service procedures.
While using this product, you may need to access other parts of the system. Read
the General Safety Summary in other system manuals for warnings and cautions
related to operating the system.
Connect and Disconnect Properly . Connect the probe output to the measurement
instrument before connecting the probe to the circuit under test. Disconnect the
probe input and the probe ground from the circuit under test before disconnecting
the probe from the measurement instrument.
Do not apply a potential to any terminal, including the common terminal, that
exceeds the maximum rating of that terminal.
Symbols and Terms
T erms in this Manual. This term may appear in this manual:
WARNING. Warning statements identify conditions or practices that could result
in injury or loss of life.
TDSPSM1 Processor Specifications Measurements Application User Manual
v
Page 10

General Safety Summary
vi
TDSPSM1 Processor Specifications Measurements Application User Manual
Page 11

Preface
Related Documentation
This manual contains operating information for the TDSPSM1 Processor
Specifications Measurements Application. The manual consists of the following
chapters:
H The chapter Getting Started briefly describes the TDSPSM1 Processor
Specifications Measurements Application, lists oscilloscope compatibility,
and provides installation instructions.
H The chapter Operating Basics covers basic operating principles of the
application and includes a tutorial that teaches you how to set up the
application to acquire a waveform, take measurements, and view the results.
H The chapter Reference includes a diagram of the menu structure and
descriptions of parameters.
H The appendix Measurement Algorithms contains information on measure-
ment guidelines and on how the application takes the measurements.
Conventions
The user manual for your oscilloscope provides general information on how to
operate the oscilloscope.
This manual uses the following conventions:
H This manual refers to the TDSPSM1 Processor Specifications Measurements
Application as the TDSPSM1 application or as the application.
H When steps require that you make a sequence of selections using front-panel
controls and menu buttons, an arrow ( ➞
front panel button and a menu, or between menus. Names that are for a main
menu or side menu item are clearly indicated: Press VERTICAL MENU ➞
Coupling (main) ➞ DC (side) ➞ Bandwidth (main) ➞ 250 MHz (side).
) marks each transition between a
TDSPSM1 Processor Specifications Measurements Application User Manual
vii
Page 12

Preface
Contacting Tektronix
Product
Support
Service
Support
For other
information
To write us Tektronix, Inc.
For application-oriented questions about a Tektronix measurement product, call toll free in North America:
1-800-TEK-WIDE (1-800-835-9433 ext. 2400)
6:00 a.m. – 5:00 p.m. Pacific time
Or contact us by e-mail:
tm_app_supp@tek.com
For product support outside of North America, contact your
local Tektronix distributor or sales office.
Contact your local Tektronix distributor or sales office. Or visit
our web site for a listing of worldwide service locations.
http://www.tektronix.com
In North America:
1-800-TEK-WIDE (1-800-835-9433)
An operator will direct your call.
P.O. Box 1000
Wilsonville, OR 97070-1000
viii
TDSPSM1 Processor Specifications Measurements Application User Manual
Page 13

Getting Started
Page 14

Page 15
Product Description
The TDSPSM1 Processor Specifications Measurements Application is a
Java-based application that enhances basic capabilities of TDS oscilloscopes.
The application offers many of the same timing measurements, but does not
require any external equipment or lengthy procedures that may be prone to error.
Oscilloscopes can take only one measurement in an acquisition waveform. The
TDSPSM1 application can take and accumulate measurements throughout an
entire waveform effectively taking cycle-to-cycle timing measurements.
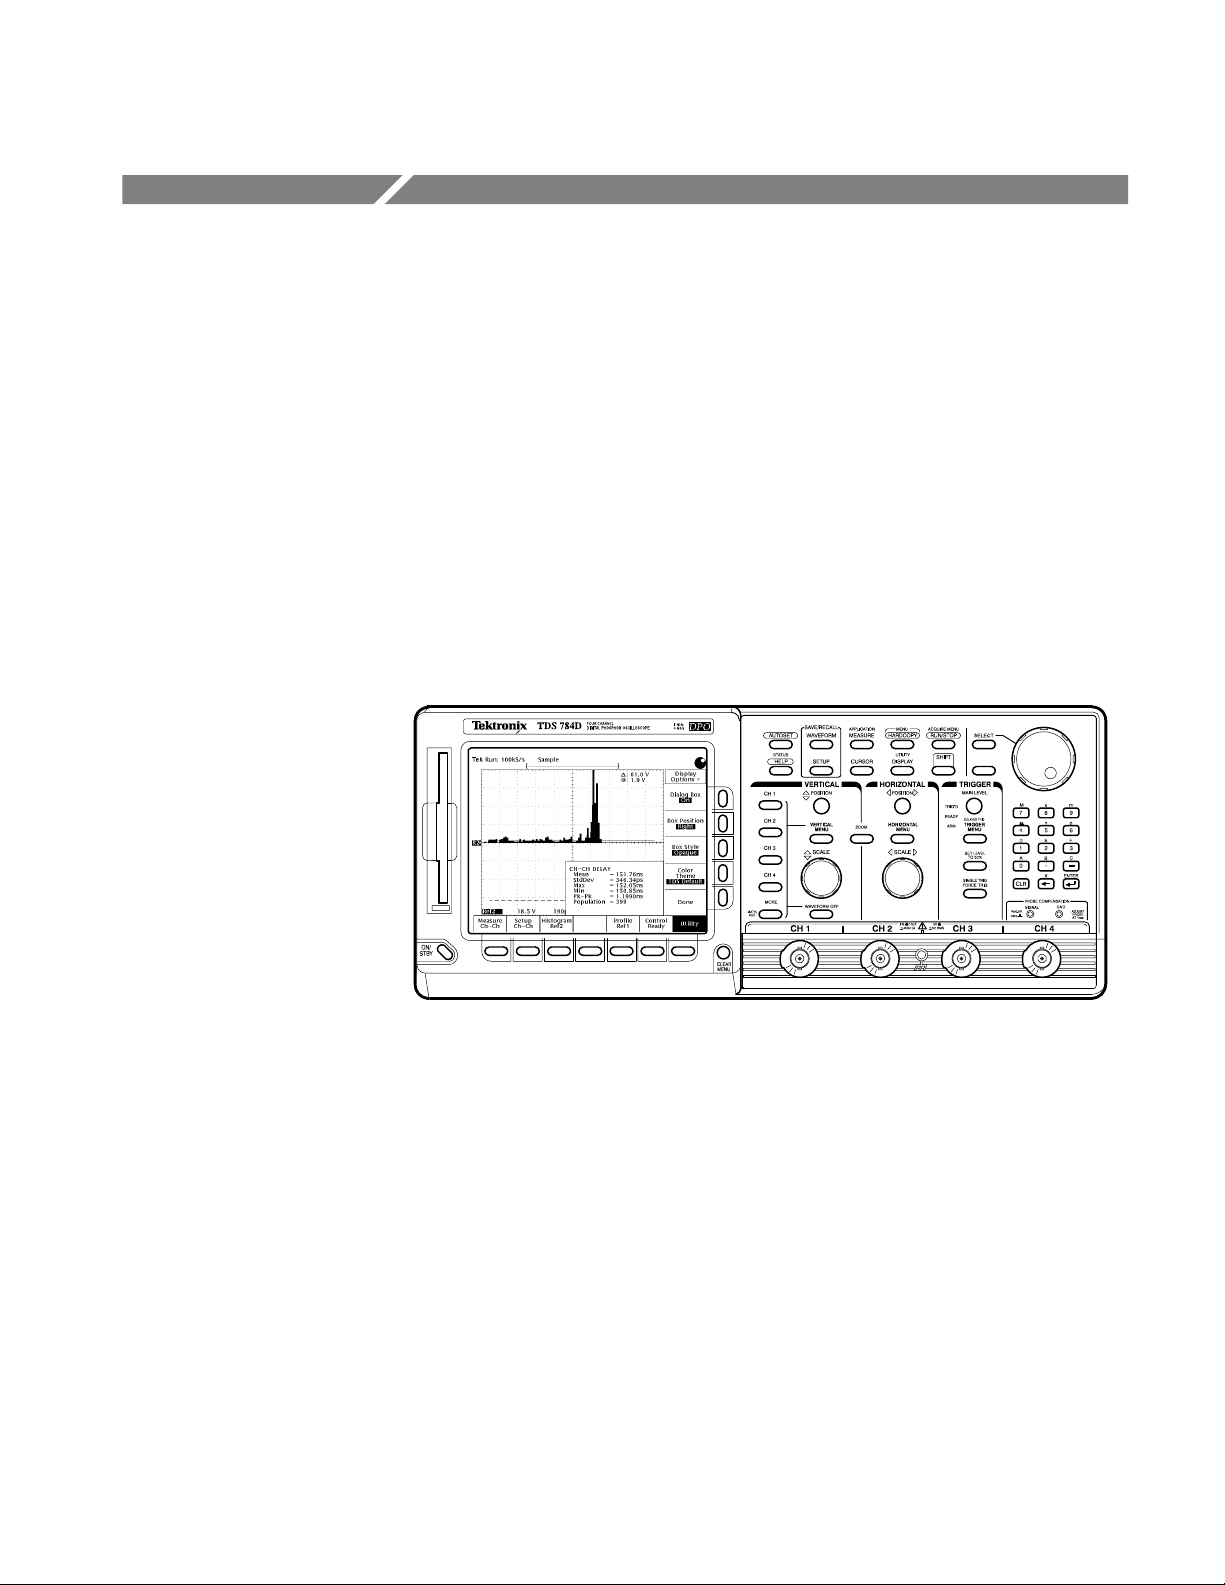
The application can display the measurement results in a numeric format as
statistics and in two graphical formats as a histogram or profile plot.
Figure 1 shows an example of the results of a Channel-to-Channel Delay
measurement.
Figure 1: TDSPSM1 Processor Specifications Measurements Application
Compatibility
The Processor Specifications Measurements Application is compatible with the
following Tektronix oscilloscopes:
H All TDS 500D and 700D Digital Phosphor Oscilloscopes with Option HD
(hard disk drive) or Option 2M (hard disk drive plus 8 MB record length)
H TDS 600C Digitizing Oscilloscopes with an Option HD (hard disk drive)
H TDS 700C Color Digitizing Oscilloscopes serial number B020100 and up,
with Option HD (hard disk drive) or Option 2M (hard disk drive plus 8 MB
record length), and with firmware version 5.2e and up
TDSPSM1 Processor Specifications Measurements Application User Manual
1
Page 16

Product Description
For a current list of compatible oscilloscopes, check the Tektronix, Inc. web site,
http://www.tektronix.com/Measurement/scopes/index.html in the Software and
Drivers category.
Requirements and Restrictions
The TDS Run-Time Environment V1.1 and above must be installed on the
oscilloscope to operate the Processor Specifications Measurements Application.
The application does not support control by external GPIB commands.
Updates Through a Web Browser
You can find information about this and other applications at the Tektronix, Inc.
web site, http://www.tektronix.com/Measurement/scopes/index.html in the
Software and Drivers category. Check this site for application updates that you
can download and for free applications.
Accessories
To install an application update, you will need to download it from the Tektronix
ftp site to a hard disk, copy it to a blank DOS-formatted floppy disk, and then
install it on your oscilloscope.
NOTE. More information about changes to the application or installation is in a
Readme.txt file on the ftp site. You should read it before you continue.
To copy the application from a web browser, follow these steps:
1. Access the ftp site at ftp://ftp.tek.com/mbd/support/00–index.html#1.
2. Scroll through the files to the TDSPSM1 application, select the file, and
download it to your hard disk drive. If necessary, unzip the file.
3. Copy the application from the hard disk to a blank, DOS-formatted floppy
disk.
4. Follow the Installing the Application procedure on page 3.
There are no standard accessories for this product.
2
TDSPSM1 Processor Specifications Measurements Application User Manual
Page 17

Installation
The TDSPSM1 floppy disk contains the Processor Specifications Measurements
Application. You can download updates, if any, from the Tektronix ftp site
through a web browser.
NOTE. To operate the Processor Specifications Measurements Application, the
TDS Run-Time Environment V1.1 or above must be installed on your oscilloscope.
Installing the Application
To install the application from the floppy disk to your oscilloscope, follow these
steps:
1. Power off the oscilloscope.
NOTE. Additional information about the application or installation is located in a
Readme.txt file on the floppy disk. You should insert the floppy disk into a
DOS-based personal computer and read the Readme.txt file before you continue.
If you are updating the application, the Readme.txt file on the Tektronix ftp site
supercedes the Readme.txt file on the TDSPSM1 floppy disk.
2. Insert the disk in the floppy disk drive and power on the oscilloscope.
NOTE. To verify that the TDS Run-Time Environment V1.1 or above is installed,
watch for the name to appear at the top of the display when you power on the
oscilloscope. If it does not appear, contact your local Tektronix sales office.
After performing the power-up selftest, the oscilloscope automatically begins
the installation procedure.
As the application loads from the disk, the oscilloscope displays a clock icon
to indicate that it is busy. Also, the floppy disk drive LED is on, indicating
activity. If the clock icon continues to display after the floppy disk LED has
gone out, a problem has occurred with the installation. Repeat the above
procedure. If the problem persists, contact your Tektronix representative.
When the installation is complete, an Installation Complete message
displays.
TDSPSM1 Processor Specifications Measurements Application User Manual
3
Page 18
Installation
3. Remove the floppy disk and cycle the power to the oscilloscope.
Connecting to a System Under Test
You can use any compatible probe to connect between your System Under Test
(SUT) and the oscilloscope. The connection is usually to a clock signal.
Most measurements require two waveforms. The AC Timing measurements only
require one waveform.
WARNING. To avoid electric shock, you must ensure that power is removed from
the SUT before attaching a probe to it. Do not touch exposed conductors except
with the properly rated probe tips. Refer to the probe manual for proper use.
Power down the SUT before connecting the probe to it.
Table 1 shows the default channel-to-waveform assignments.
T able 1: Channel assignments
Channel or reference Waveform assignment
Ch 1 Principal waveform, such as the Clock signal
Ch 2 Relative waveform, usually data
Ref1 Profile graphical format
Ref2 Histogram graphical format
4
TDSPSM1 Processor Specifications Measurements Application User Manual
Page 19

Operating Basics
Page 20

Page 21

Operating Basics
This section contains information on the following topics and tasks:
H Application menu structure
H Using basic oscilloscope functions
H Configuring the display
H Setting up the application
H Taking measurements
H Viewing the results
H Saving and recalling setups
H Exiting the application
Application Menu Structure
There are two types of menus in the application menu structure: main menus and
side menus. Some side menus contain common menu items as shown in Table 2.
Main and Side Menus
The main menu names appear in the bottom of the display and the side menu
names appear on the right side of the display. To see the complete application
menu structure, refer to Figure 32 on page 39.
When you press the front-panel button associated with a main menu, the side
menu changes. In many cases, when you press a side menu, new side menu items
appear. As an example, the next figure shows you how to access the Help
selections through the main Utility menu and the Help side menu.
Main menu Side menu Side menu item
Utility
Help
First Page
Next page
Previous page
Last Page
Quit Help
TDSPSM1 Processor Specifications Measurements Application User Manual
5
Page 22

Operating Basics
Common Menu Items
Utility Menus
Table 2 lists common side menu items.
T able 2: Common menu items
Menu item Description
Cancel Cancels the message being displayed.
Done Indicates that you are through making changes to that set of side menus. The
application returns to the previous menu.
OK Confirms the action.
Table 3 lists the Utility menus.
T able 3: Utility menus
Utility name Description
Help Accesses the online help information and view various pages.
Exit Exits the application.
Save/Recall Setup Accesses the save and the recall menus for application setups.
Display Options Accesses other menus where you can change display settings, such as
the message box location on the display.
Using Basic Oscilloscope Functions
You can use the Utility menu to access help information about the application.
You can also use other oscilloscope functions and easily return to the application.
Using Local Help
Returning to the
Application
The application includes local help information about the measurements modes,
with some explanation of the individual controls.
To display the local help, follow these steps:
1. Press Utility (main) ➞ Help (side).
2. Use the side menu buttons to navigate through the help.
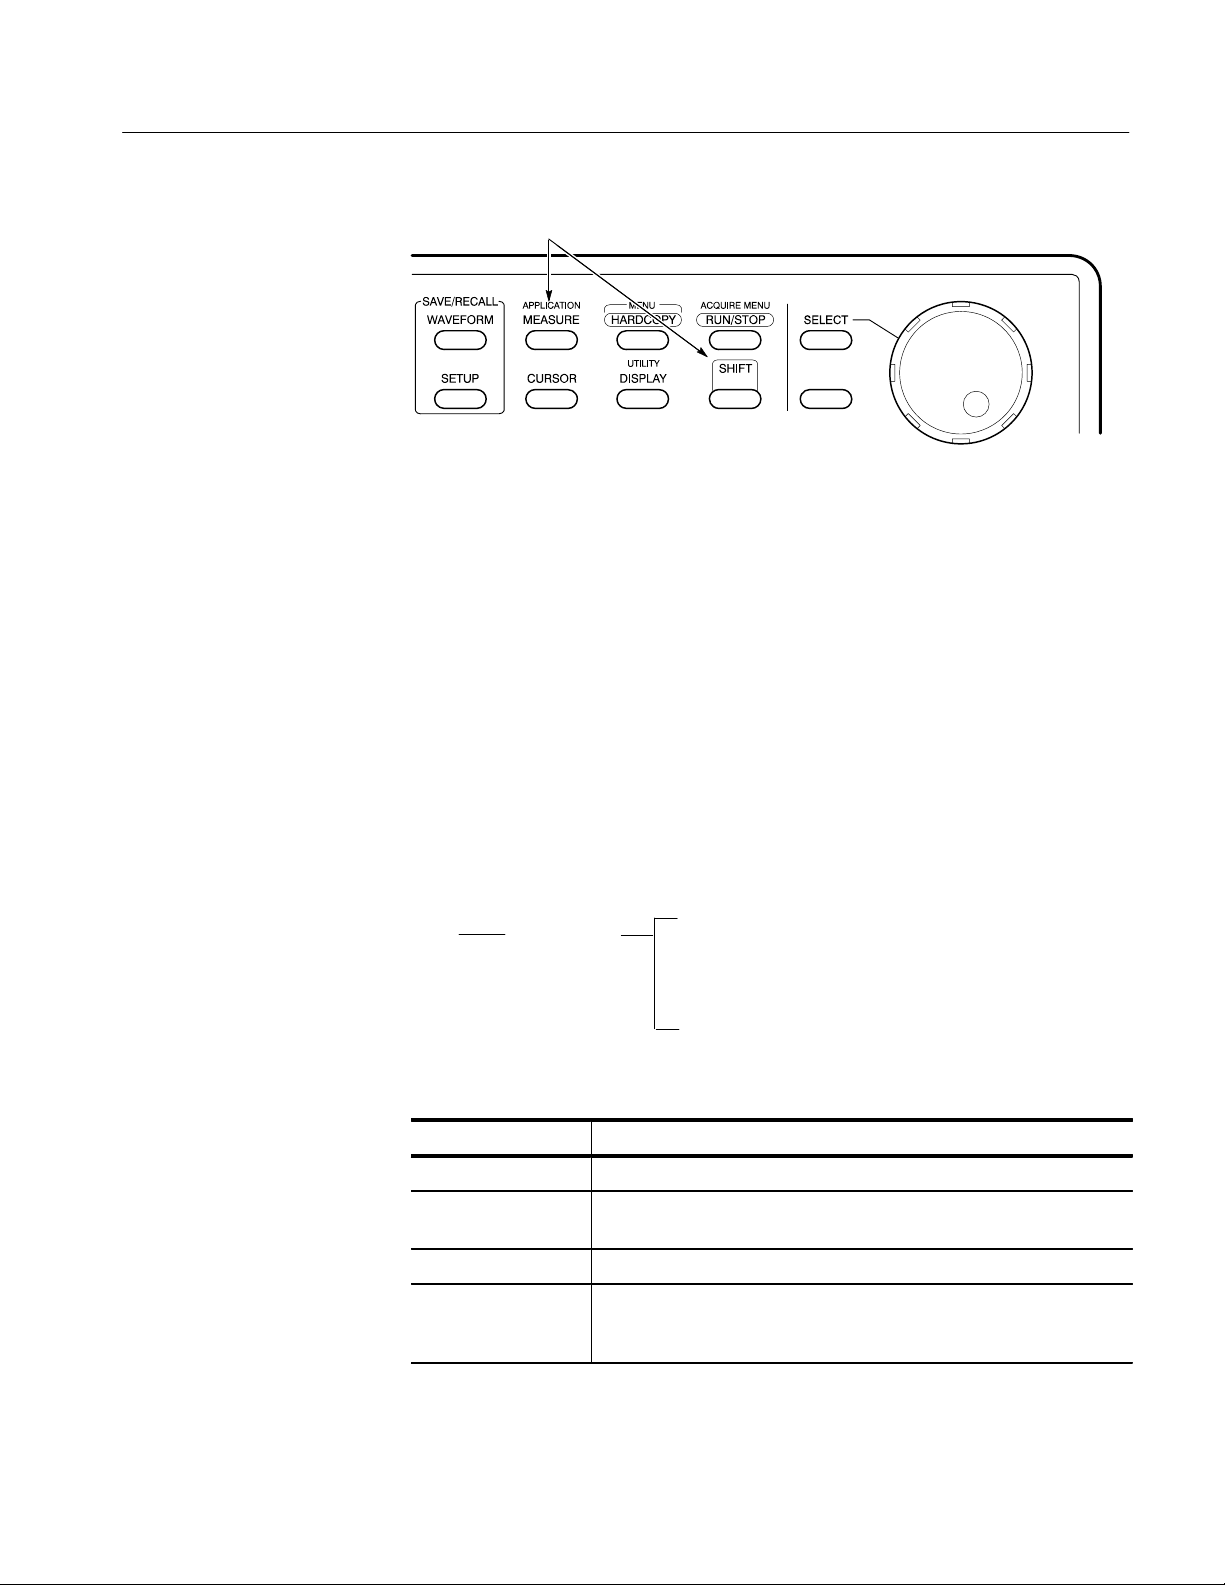
You can easily switch between the TDSPSM1 application and other oscilloscope
functions.
To access other oscilloscope functions, press the desired front panel control. To
return to the application, push the SHIFT and then the APPLICATION frontpanel menu buttons as shown in Figure 2.
6
TDSPSM1 Processor Specifications Measurements Application User Manual
Page 23
Warning Messages
Operating Basics
Push the SHIFT and then the APPLICATION button to return to the application.
Figure 2: Returning to the application
All timing measurements provide a warning if the input conditions do not
support accurate measurements. For example, the Period measurement warns you
if you do not have at least two cycle-start edges in the acquired waveform.
Configuring the Display
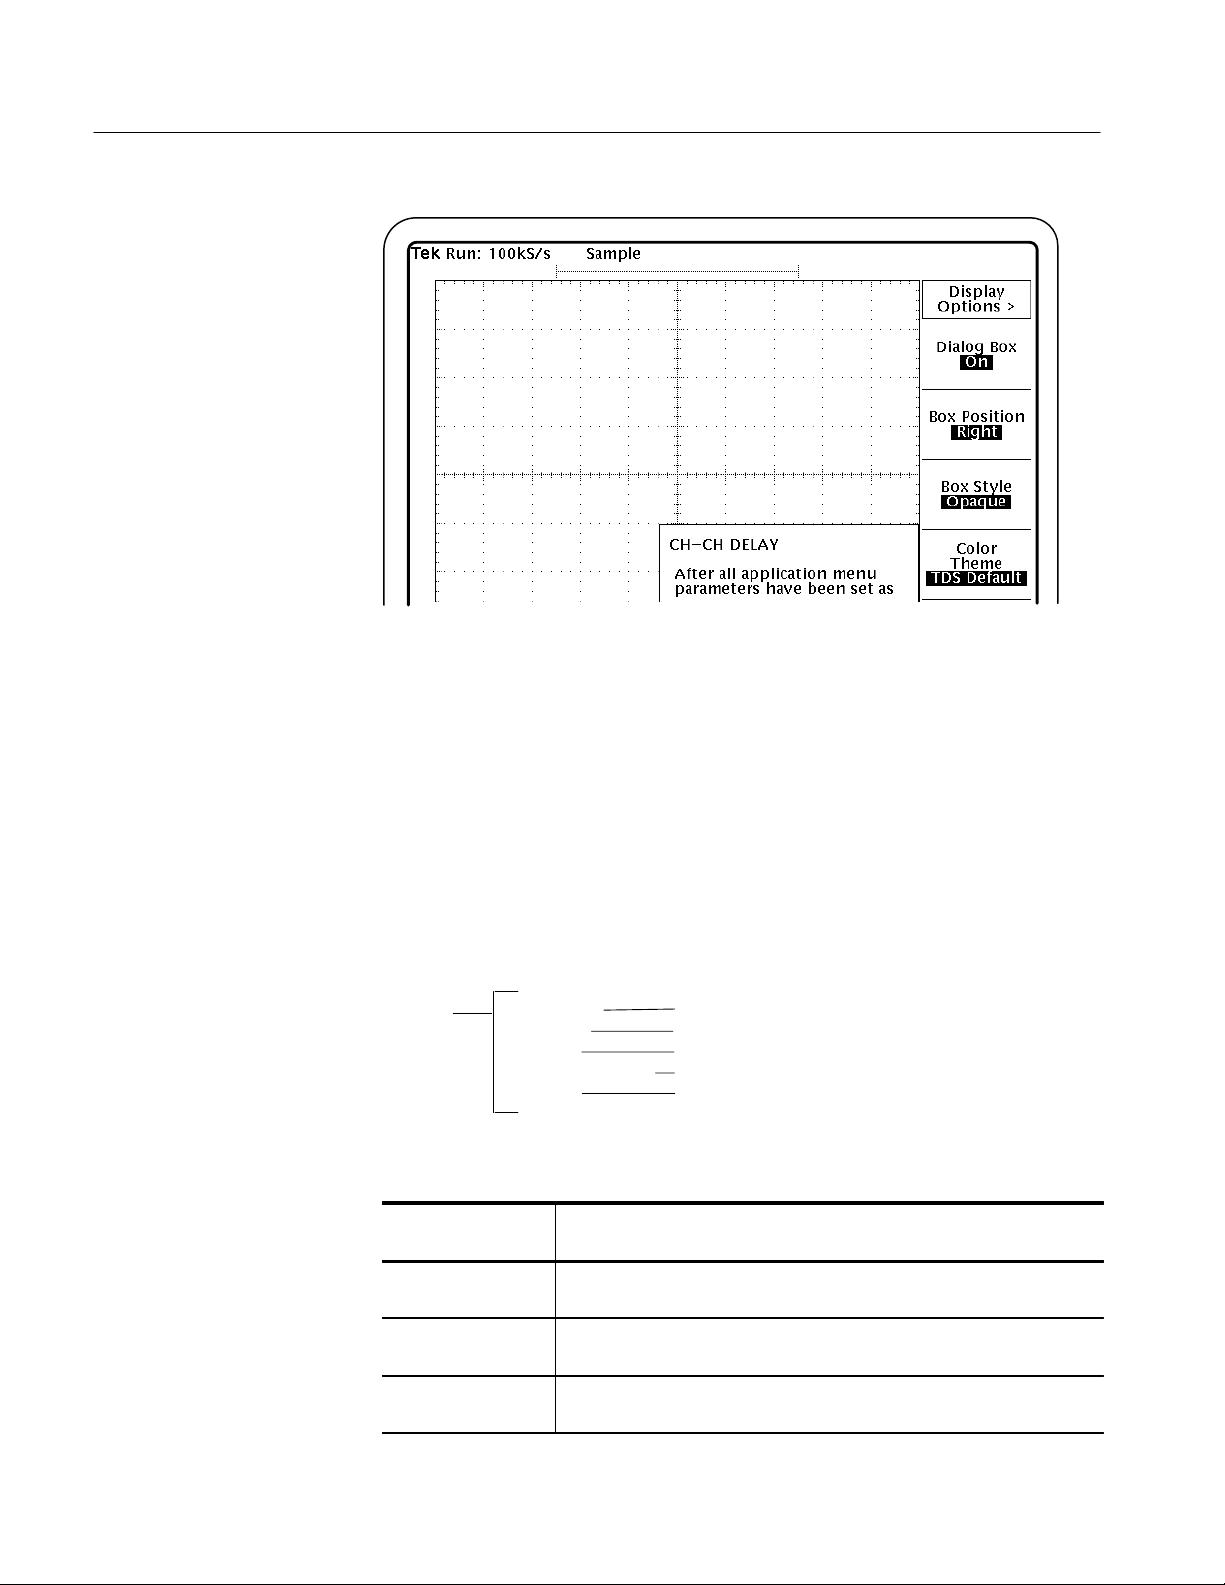
You can change how dialog boxes appear on your oscilloscope, as well as the
color of waveforms. The next figure shows how to access the display options and
Table 4 lists the options with a brief description of each.
Main menu Side menu Side menu item
Utility Display Options
Dialog Box
Box Position
Box Style
Color Theme
Done
T able 4: Display options
Display option Description
Dialog box (visibility)
Box position* Select where on the display to position dialog boxes: Left, Middle, or
Box style Select the style of dialog boxes to be Opaque or Transparent.
Color Theme Select a set of colors for waveforms and dialog boxes. The various
* Box position is fixed when taking AC Timing measurements.
Select Show or Hide to make dialog boxes visible or invisible.
Right.
TDS oscilloscopes offer 14 useable colors. Your choices are based on
the color combinations available for the TDS oscilloscope in use.
TDSPSM1 Processor Specifications Measurements Application User Manual
7
Page 24
Operating Basics
Figure 3: Display Options side menu
Setting Up the Application
You can set up the application to take nine measurements and to display the
results in up to three ways.
Measurement Setup
The next figure shows how to access the measurement setup menus and Table 5
lists the TDSPSM1 measurements with a brief description of each.
Main menu Side menu
Measure
T able 5: Measurements
Measurement
name
Channel-to-Channel
Delay
Side menu items
Ch–Ch Delay
Setup Time
Hold Time
Clock to Output Time
AC Timing
Description
Difference in time between individual specific points on two waveforms.
The points are defined by an edge and a voltage reference level.
Setup Ch–Ch
Setup Setup Time
Setup Hold Time
Setup Tco
Setup AC Timing
Setup Time Elapsed time between when an input signal crosses a voltage reference
level followed by the clock signal crossing its own voltage level.
Hold Time Elapsed time between when the clock signal crosses a voltage
reference level followed by an input signal crossing its own voltage level.
8
TDSPSM1 Processor Specifications Measurements Application User Manual
Page 25

Operating Basics
T able 5: Measurements (Cont.)
Measurement
name
Clock to Output Time
(Tco)
Description
Elapsed time between when the clock signal crosses a voltage
reference level followed by an output signal crossing its own voltage
level.
AC Timing Timing characteristics of a waveform based on voltage reference levels.
The next figure shows how to access the AC Timing measurement selections,
and Table 6 lists these selections with a brief description of each.
Main menu
Setup AC Timing
Side menu
Select Measurements
Side menu item
High Time
Low Time
Rise Time
Fall Time
Period
Done
Table 6: AC Timing measurements
Measurement Description
High Time Amount of time a waveform remains above the high reference voltage level.
Low Time Amount of time a waveform remains below the low reference voltage level.
Rise Time Elapsed time from when a rising edge crosses the low reference voltage
level and then the high reference voltage level.
Fall Time Elapsed time from when a falling edge crosses the high reference voltage
level and then the low reference voltage level.
Period Elapsed time between when a waveform crosses a specific reference
voltage level twice.
Table 7 lists the setup menus with their corresponding waveform source side
menus.
TDSPSM1 Processor Specifications Measurements Application User Manual
9
Page 26

Operating Basics
T able 7: Setup menus and waveform source side menus
Setup menu Source side menu Description
Ch-Ch Delay
From Edge
Principal waveform used to calculate the difference in
time between two edges.
To Edge
Range minimum
Range maximum
Setup Time
Hold Time
Tco Clock Input
AC Timing Input Waveform used to calculate timing characteristics.
Clock Input
Data Edge Input
Range minimum
Range maximum
Output Edge Input
Range minimum
Range maximum
Second waveform.
Lower time interval boundary used to limit the search.
Upper time interval boundary used to limit the search.
The principal waveform, clock, used to calculate the
elapsed time between when this waveform and a data
waveform crosses a specified voltage reference level.
Second waveform, data.
Lower time interval boundary used to limit the search.
Upper time interval boundary used to limit the search.
The principal waveform, clock, used to calculate
elapsed time between when this waveform and an
output waveform crosses a specified voltage reference
level.
Second waveform, output.
Lower time interval boundary used to limit the search.
Upper time interval boundary used to limit the search.
10
There are several clock-to-data and data-to-clock timing variations that you must
consider to properly specify the Range Minimum and Range Maximum values.
When the application takes a Channel-to-Channel Delay Time measurement,
every edge specified in the To Edge menu item generates a measurement as long
as an edge specified in the From Edge menu item occurs within the Range
Minimum and Range Maximum values.
When the application takes a Setup Time, Hold Time, or Clock-to-Output Time
measurement, every data edge or edge specified in the To Edge menu item
generates a measurement as long as a clock edge occurs within the Range
Minimum and Range Maximum values.
You can use the default range values for most simple timing measurements. For
the Channel-to-Channel Delay measurement, the default values are –1,000 ns
and 1,000 ns . For the Setup Time, Hold Time, and Clock-to-Output Time
measurements, the default values are 0 ns and 1,000 ns.
TDSPSM1 Processor Specifications Measurements Application User Manual
Page 27

Operating Basics
NOTE. Press CURSOR ➞ V Bars (side), return to the application, and use the
vertical cursors to estimate the Range Minimum and Range Maximum values.
Figure 4 shows a simple timing diagram of a Setup Time (T
(T
) measurement. Small numbers are shown for the range values, even
HOLD
) and a Hold Time
SU
though the default values will work in most cases.
Reference for T
Clock
Data
Min = 0 ns
Reference for T
SU
T
SU
TSU Range
Min = 0 ns Max = 10 ns
HOLD
T
HOLD
Max = 10 ns
T
Range
HOLD
Figure 4: Simple timing diagram and positive range values
Figure 5 shows positive range values for a simple Setup Time measurement. You
can also use positive range values for simple Hold Time measurements.
Figure 5: Positive range values for a Setup Time measurement
TDSPSM1 Processor Specifications Measurements Application User Manual
11
Page 28

Operating Basics
NOTE. You can use these same techniques to determine the range values for the
Channel-to-Channel Delay Time and Clock-to-Output Time measurements.
Figure 6 shows a negative range value used for the Hold Time measurement. It
also shows a Setup Time measurement where the range values are used to
exclude a transition between the data transition and clock edge to be measured.
Clock
Data
Reference for T
SU
T
SU
Min = 10 ns
Min = –10 ns Max = 0 ns
Reference for T
TSU Range
T
Range
HOLD
HOLD
T
HOLD
Max = 20 ns
Figure 6: Complex setup time and hold time with a negative range value
Figure 7 shows a negative range value used for a Hold Time measurement.
12
Figure 7: Negative Hold Time measurement and negative range value
TDSPSM1 Processor Specifications Measurements Application User Manual
Page 29

Operating Basics
Figure 8 shows a Setup Time measurement where the range values are used to
exclude a data transition.
Figure 8: Setup Time measurement with a data transition excluded by range values
Figure 9 shows a negative range value used for the Setup Time measurement. It
also shows a Hold Time measurement where the range values are used to exclude
a transition between the clock edge and data transition to be measured.
Clock
Data
Reference for T
Min = –10 ns
TSU Range
HOLD
T
SU
Reference for T
T
HOLD
Max = 0 ns
SU
T
HOLD
Range
Max = 25 nsMin = 15 ns
Figure 9: Complex hold time and setup time with a negative range value
Figure 10 shows a negative range value used for a Setup Time measurement.
TDSPSM1 Processor Specifications Measurements Application User Manual
13
Page 30

Operating Basics
Figure 10: Negative Setup Time measurement and negative range value
Figure 11 shows a Hold Time measurement where the range values are used to
exclude a data transition.
14
Figure 11: Hold Time measurement with a data transition excluded by range values
TDSPSM1 Processor Specifications Measurements Application User Manual
Page 31

Operating Basics
You can use the source side menu to select and define the waveform from which
to take measurements, and where to start (and end) measurements.
The Channel-to-Channel Delay Time, Setup Time, Hold Time, and Clock-toOutput Time measurements require one voltage reference level to calculate the
activity on the defined waveforms. The AC Timing measurements require three
voltage reference levels. Figure 12 shows how to set the voltage reference levels.
VRefHi
VRef
VRef
VRefLo
Ch-Ch Delay Time, Setup Time, Hold Time,
and Clock-to-Output Time measurements
AC Timing measurements
Figure 12: How to set voltage reference levels
The next figure shows how to access the source side menus and the waveform
definition side menu items.
Setup menus
Setup Ch-Ch
Setup Setup Time
Setup Hold Time
Setup Tco
Setup AC Timing
Source side menus
From Edge
To Edge
Range Minimum
Range Maximum
Clock Input
Data Edge Input
Range Minimum
Range Maximum
Clock Input
Data Edge Input
Range Minimum
Range Maximum
Clock Input
Output Edge Input
Range Minimum
Range Maximum
Input
Waveform definition side menus
Source
Edge
Slope
Hysteresis
VRef
Done
Source
Slope
Hysteresis
VRefHi
VRef
VRefLo
Done
Table 8 lists the signal definition side menus with a brief description of each.
TDSPSM1 Processor Specifications Measurements Application User Manual
15
Page 32

Operating Basics
T able 8: Waveform definition side menu items
Display Results Setup
Menu item
Source Y ou can select an active waveform, a reference waveform, or a math
Slope Y ou can select the edge on which to start the measurement: Rise, Fall, or
Hysteresis You can select the threshold margin, in graticule divisions, relative to the
VRefHi* You can specify where on the slope, in V olts, to set the high threshold.
VRef You can specify where on the slope, in V olts, to set the middle threshold.
VRefLo* You can specify where on the slope, in Volts, to set the low threshold.
* Only required for AC Timing measurements.
Description
waveform as the signal or clock source.
Transitional.
reference level which the voltage must cross to be recognized as changing.
The margin is the voltage reference level plus or minus half the hysteresis.
NOTE. The application detects the minimum and maximum voltage levels of the
waveform. If the reference voltage level plus or minus the hysteresis falls outside
of 2.5% to 97.5% of the waveform peak-to-peak range, no measurement is taken.
Table 9 lists the display formats of the results with a brief description of each.
You can use a graphical format to customize the display of the results for easier
analysis.
16
T able 9: Results display formats
Displayed as Descriptions
Statistics The results display as numeric values for the mean, the standard deviation,
the peak-to-peak, the maximum and minimum voltage levels, and the
population of the measurements. This is the default display of the results.
Histogram format A bar graph that represents the distribution of timing measurements.
Profile format A dot graph that represents consecutive values for each measurement.
The next figure shows how to save the results in a graphical formats and how to
access the graphical format definitions side menu items.
TDSPSM1 Processor Specifications Measurements Application User Manual
Page 33

Operating Basics
Main menu Side menu
Histogram
On/Off
Autoscale
Center
Span
Display Resolution
Vertical Display
Store Histogram In:
Value at V Bar: ?
Main menu Side menu
Profile
On/Off
Profile Height
Value at ?
Reset Profile
Store Profile In:
Profile Length
Table 10 lists menu items used to customize the Histogram graphical format with
a brief description of each.
T able 10: Histogram format side menu items
Menu item Description
On/Off Enables the results to be stored in a reference waveform.
Autoscale After taking measurements, uses the results to determine logical values
for the Center and Span menu items.
Center Uses the GP knob or keypad to specify a numeric value for the horizontal
center position of the histogram.
Span Uses the GP knob or keypad to specify a numeric value for the total
horizontal range of the histogram.
Display resolution Selects the resolution as defined by bins to be Low (20 bins), Medium
(50 bins), or High (500 bins).
Vertical Display Selects the vertical axis to be linear or logarithmic.
Store Histogram In Selects a reference waveform in which to store the results.
Value at V Bar: ? Uses vertical cursors to view vertical values.
Table 11 lists menu items used to customize the Profile graphical format with a
brief description of each.
T able 11: Profile format side menu items
Menu item Description
On/Off Enables the results to be stored in a reference waveform.
Profile Height Selects the height of the profile in number of divisions.
Value at _ ? Uses to view vertical values by index number.
Reset Profile Resets profile waveform results to zero.
Store Profile In: Selects a reference waveform in which to store the results.
Profile Length Selects the record length of the profile in number of divisions.
TDSPSM1 Processor Specifications Measurements Application User Manual
17
Page 34

Operating Basics
Taking Measurements
Once you have set up the application, you can take measurements.
If you want to change trigger settings or localize the measurement, you should
do so before you take any measurements. The application defaults to the
reference voltage level as defined for the waveform source (refer to Table 8 on
page 16).
NOTE. If you select a reference or math waveform as the source, you will need to
display the waveform before a measurement can be taken. To display the
waveform, press the MORE button and the appropriate main menu item.
NOTE. Remember to reset the result values (Control (main) ➞ Reset All) if you
change the Vertical or the Horizontal time settings after starting to take
measurements.
Acquiring Waveforms
When the measurement parameters are set up, you can acquire waveforms. To do
so, follow these steps:
1. Press Control (main). Table 12 lists menu items in the Control menu, and
Figure 13 shows the Control menu..
T able 12: Control menu items
Menu item Description
Mode
Single
Free Run
Start/Continue The application starts to take measurements from one or two waveforms
Pause The application stops taking measurements and continues when you
Stop The application stops taking measurements.
Reset All Resets all result values (numeric and graphical) to zero. You do not have
Performs measurements on a single acquisition and stops.
Repeatedly acquires a waveform, takes timing measurements, and arms
the trigger.
press Start again.
to wait for a measurement to complete to reset the results.
18
TDSPSM1 Processor Specifications Measurements Application User Manual
Page 35

Figure 13: Control menu
Operating Basics
Localizing Measurements
2. Press Mode (side) to select Single or Free Run acquisition mode.
3. Press Start (side).
NOTE. Do not change oscilloscope settings while a measurement is being taken.
Doing so can invalidate the measurement.
Do not attempt to execute external GPIB commands to control the oscilloscope
while running the application. Doing so may interrupt the process.
You can control the amount of data to measure by adjusting the Record Length
or Horizontal Scale in the oscilloscope horizontal menu, or the Trigger Position.
By specifying the Trigger Position, the starting point, and the total length of the
measurement, you can effectively size the area of interest.
NOTE. If an error message displays because there are not enough cycles from
which to take a measurement, you should increase the Record Length.
Viewing the Results
The application provides information on the variation of timing measurements as
values in a Statistics readout, or graphically in a Histogram or a Profile format.
TDSPSM1 Processor Specifications Measurements Application User Manual
19
Page 36

Operating Basics
NOTE. Stop the acquisition before viewing the results in a graphical format if
you are operating the oscilloscope in the Free Run acquisition mode.
Figure 14 shows an example of the results display formats.
Statistics readout
Histogram format
Profile format
Figure 14: Example of the results display formats
NOTE. If the application results show a Population with a value of zero, increase
the Expected Range value in the Source Definition side menu items.
20
Statistics
By default, the measurement results appear in the Statistics readout. The
Statistics readout contains values for the mean, the standard deviation (StdDev),
the peak-to-peak (Pk-Pk), the maximum (Max) and minimum (Min) values, and
the population (the number of cycles used to calculate the values).
To view parts of the waveform that are obscured by the Statistics readout, push
the CLEAR MENU button. To return to the application, push the SHIFT then the
APPLICATION front-panel menu buttons
NOTE. To view the waveform and the results, you can adjust the placement of the
Statistics readout in the display through the Display Options side menu.
The next figure shows how to make the Statistics readout visible or invisible.
TDSPSM1 Processor Specifications Measurements Application User Manual
Page 37

Main menu Side menu Side menu item
Utility
Display Options
Dialog Box: On/Off
Operating Basics
Graphical Formats
There are two graphical formats available: Histogram or Profile.
NOTE. The application can display the results in a graphical format from only
one AC Timing measurement. (There are five.) The last AC Timing measurement
for which you select “On” is the one saved in a graphical format.
Histogram To view the results in the Histogram format, press MORE ➞
Ref# (main). Ref# is the reference waveform that you selected in the Store
Histogram In menu item.
The horizontal axis (center and span) represents the measurement values and the
vertical axis represents the number of times that the value occurred.
NOTE. Use the Horizontal SCALE knob to adjust the horizontal scale of the
waveform to fit the screen for proper viewing.
Profile. To view the results in the Profile format, press MORE ➞ Ref# (main).
Ref# is the reference waveform that you selected in the Target menu item.
The vertical axis represents the measurement value and the horizontal axis
represents the index number of the measurement. This can be useful for
observing the variation of a measurement.
Clearing Results
To reset the results to zero, press Control (main) ➞ Reset All (side). You do not
have to wait for a measurement to complete to clear the results.
Saving and Recalling Setups
You can use the Save/Recall Setup menu to save and recall application setups.
Figure 15 shows the Save/Recall Setup menu.
TDSPSM1 Processor Specifications Measurements Application User Manual
21
Page 38

Operating Basics
Figure 15: Save/Recall menu
The TDSPSM1 application Save/Recall function is totally independent of the
primary oscilloscope Save/Recall function stored in nonvolatile RAM.
Save Setup
Recall Setup
Default Setup
To save an application setup, press Utility (main) ➞ Save/Recall Setup (side) ➞
Save Setup (side).
The file contains stored settings.
Once you have saved a setup, you must recall it to use it again. The application
always starts with the default settings.
NOTE. If you want to save the existing configuration, you must use Save Setup to
store the present application settings.
To recall a saved application setup, press Utility (main) ➞ Save/Recall Setup
(side) ➞ Recall Setup (side).
The application recalls the settings saved in the
file.
To recall the default application setup, press Utility (main) ➞ Save/Recall Setup
(side) ➞ Default Setup (side).
The application recalls the default settings.
22
TDSPSM1 Processor Specifications Measurements Application User Manual
Page 39

Exiting the Application
Operating Basics
To exit the application, press Utility (main) ➞ Exit (side). To confirm, press OK
(side).
Figure 16: Exit menu
TDSPSM1 Processor Specifications Measurements Application User Manual
23
Page 40

Operating Basics
24
TDSPSM1 Processor Specifications Measurements Application User Manual
Page 41

Tutorial
This tutorial teaches you how to set up, and take two types of measurements, and
view the results in the various formats. In addition, it teaches you how to exit the
application and how to save and recall setups. Further operating information is
located in the Operating Basics section.
Before you begin the tutorial, you must do the following tasks:
H Set up the oscilloscope
H Start the application
H Load the reference waveforms
Setting Up the Oscilloscope
To set up the oscilloscope, follow these steps:
1. Press SETUP ➞ Recall Factory Setup (main) ➞ OK Confirm Factory Init
(side) to set the oscilloscope to the default factory settings.
Starting the Application
2. Press the WAVEFORM OFF button as often as necessary to remove active
waveforms.
To perform these lessons, the TDSPSM1 application must be installed on the
oscilloscope. See Installation on page 3.
To start the application, refer to Figure 17, and follow these steps:
1. Press SETUP ➞ Select Application (main).
2. Use the general purpose (GP) knob to select hd0: and press SELECT.
3. Use the GP knob to select the TDSPSM1.APP file and press Activate
Application (side).
The application starts up and displays as shown in Figure 18.
TDSPSM1 Processor Specifications Measurements Application User Manual
25
Page 42

Tutorial
Figure 17: Starting the application
26
Figure 18: TDSPSM1 application initial display
TDSPSM1 Processor Specifications Measurements Application User Manual
Page 43

Loading the Reference Waveform Files
The application includes two reference waveform files for use with this tutorial.
To load the reference waveform files, follow these steps:
1. Press WAVEFORM ➞ Recall Wfm to Ref (main) ➞ Recall from file (side).
2. Use the general purpose (GP) knob to select hd0: and press SELECT.
3. Use the GP knob to select WFMS and press SELECT.
4. Use the GP knob to select PRIMARY.WFM; press Ref 3 active/empty (side).
5. Press Recall from file (side).
6. Use the GP knob to select RELATIVE.WFM; press Ref 4 active/empty
(side).
7. Press MORE ➞ Ref 3 (main) to display the Primary waveform.
8. Press MORE ➞ Ref 4 (main) to display the Relative waveform.
Tutorial
9. Press the SHIFT, and then the APPLICATION front-panel menu button to
return to the application.
Taking Measurements from Two Waveforms
In this example, you will learn how to use the application to calculate the delay
between two sources as defined by two individual reference voltage levels.
To become familiar with the Ch-Ch Delay measurement, follow these steps:
1. Press Measure (main) ➞ Ch–Ch Delay (side).
2. Press Setup Ch–Ch (main) ➞ From Edge (side).
a. Press Source (side) and select Ref3. See Figure 19.
b. Press VRef (side) and use the keypad to enter 2.0 V. See Figure 19.
c. Press Done (side).
TDSPSM1 Processor Specifications Measurements Application User Manual
27
Page 44

Tutorial
Figure 19: From Edge menu, source
3. Press To Edge (side).
a. Press Source (side) and select Ref4. See Figure 20.
b. Press VRef (side), and use the keypad to enter 2.0 V.
c. Press Done (side).
Figure 20: To Edge menu, source
28
Figure 21 shows the completed setup for the Ch-Ch measurement.
TDSPSM1 Processor Specifications Measurements Application User Manual
Page 45

Tutorial
Figure 21: Ch-Ch Delay setup complete
4. To take the measurement, press Control (main) ➞ Start (side).
NOTE. When the input is a reference waveform, the measurement performs a
single measurement cycle regardless of the acquisition mode.
The Control menu (main) displays Control Sequencing while the application
is executing. When the Control menu displays Control Ready, the application has completed the calculations.
5. Wait for the calculations to complete. Figure 22 shows the Statistics readout.
Figure 22: Ch-Ch Delay lesson: Statistics readout
TDSPSM1 Processor Specifications Measurements Application User Manual
29
Page 46

Tutorial
6. Press Histogram (main) ➞ On/Off (side) to select On. Ref2 appears under
Histogram to indicate that the results will be stored in Ref2. See Figure 23.
Press Autoscale (side). The value for Center (side) becomes the Mean value
of the signal and the value for Span (side) is 2.1 times the Max-minus-Mean
or Mean-minus-Min value, whichever is larger.
30
Figure 23: Histogram format menu
NOTE. When you press Autoscale or when you press Control (main) ➞ Reset All
(side), previous measurement results stored in the histogram reference are
cleared.
7. Press Control Ready (main) ➞ Start (side) to retake the measurements.
8. To display the Histogram graphical format, follow these steps:
a. Press the MORE button.
b. Press Ref2 to display the Histogram format.
c. Use the Horizontal SCALE knob to adjust the horizontal scale of the
waveform to fit the screen.
9. Press the SHIFT, and then the APPLICATION button.
TDSPSM1 Processor Specifications Measurements Application User Manual
Page 47

Figure 24 shows the results in the Histogram format.
Tutorial
Figure 24: Ch-Ch Delay lesson: Histogram format
10. Press the CURSOR front panel button, and then select V Bars (side) to
display the vertical cursors.
11. Press the SHIFT, and then the APPLICATION button.
12. Press Histogram Ref2(main) ➞ –more– 1 of 2 ➞ Value at V Bar:? (side) to
view the measurement values at the vertical cursor. Use the GP knob to
scroll through the values.
13. Press CURSOR ➞ Off (side) to remove the vertical cursors from the display.
14. Press the MORE, and then the WAVEFORM OFF button.
15. Press the SHIFT, and then the APPLICATION button.
16. To clear the previous results, press Control (main) ➞ Reset All (side).
17. Press Profile (main) ➞ On/Off (side) to select On. Ref1 appears under
Profile to indicate that the results will be stored in Ref1. See Figure 25.
TDSPSM1 Processor Specifications Measurements Application User Manual
31
Page 48

Tutorial
Figure 25: Profile format menu
18. Press Control (main) ➞ Start (side) to retake the measurements.
19. To display the Profile graphical format, follow these steps:
a. Press the MORE button.
b. Press Ref1 to display the Profile format.
20. Press the SHIFT, and then the APPLICATION button.
Figure 26 shows the results in the Profile format.
32
TDSPSM1 Processor Specifications Measurements Application User Manual
Page 49

Tutorial
Figure 26: Ch-Ch Delay lesson: Profile format
21. Press Profile (main) ➞ Value at ? (side) to view the measurement values by
index number. Use the GP knob to scroll through the values.
You can approximate the index number based on 50 per horizontal division.
22. Press the MORE, and then the WAVEFORM OFF button.
23. Press the SHIFT, and then the APPLICATION button.
Taking AC Timing Measurements
In this lesson, you will learn how to use the application to calculate AC timing
measurements as defined by reference voltage levels. You will view the results of
a single measurement and of multiple measurements in the Statistics readout.
To become familiar with an AC Timing measurement, follow these steps:
1. Press the MORE ➞ Ref 4 (main) and the WAVEFORM OFF button to
remove the secondary waveform from the display.
2. Press the SHIFT, and then the APPLICATION front-panel menu button to
return to the application.
TDSPSM1 Processor Specifications Measurements Application User Manual
33
Page 50

Tutorial
3. Press Measure (main) ➞ AC Timing (side).
4. Press Setup AC Timing (main) ➞ Input (side). See Figure 27.
a. Press –more– 1 of 2 (side) ➞ VRefHi (side) and use the GP knob to
enter 3.0V.
b. Press VRefLo (side) and use the GP knob to enter 1.0 V.
c. Press Done (side). See Figure 28.
Figure 27: Input menu voltage reference levels
Figure 28: AC Timing setup complete
5. To clear the previous results, press Control (main) ➞ Reset All (side).
6. To see the waveforms and the Statistics readout, press Utility (main) ➞
Display Options (side) ➞ Box Style and select transparent.
7. To take the measurement, press Control (main) ➞ Start (side).
34
TDSPSM1 Processor Specifications Measurements Application User Manual
Page 51

Tutorial
NOTE. When the input is a reference waveform, the measurement performs a
single measurement cycle regardless of the acquisition mode.
8. Wait for the calculations to complete. Figure 29 shows the Statistics readout
for the Period measurement only.
Figure 29: AC Timing lesson, Period measurement: Statistics readout
9. Press Setup AC Timing (main) ➞ Select Measurements (side), and select
“ON” for each measurement. See Figure 30.
10. Press – more – 1 of 2 (main) ➞ Done (side).
TDSPSM1 Processor Specifications Measurements Application User Manual
35
Page 52

Tutorial
Figure 30: All AC Timing measurements selected
11. To clear the previous results, press Control (main) ➞ Reset All (side).
12. To take the measurement, press Start (side). Figure 31 shows the results.
36
Figure 31: All AC Timing measurements lesson: Statistics readout
TDSPSM1 Processor Specifications Measurements Application User Manual
Page 53

Stopping the Tutorial
Tutorial
NOTE. The message in the bottom of the display also changed to remind you of
which measurement results are currently stored in the histogram and profile
reference waveforms.
13. To display the results in the other formats, follow steps 6 through 23 starting
on page 30. These steps include how to view individual measurement values
and remove the formats from the display.
NOTE. To view vertical values in a Histogram or Profile format, press Util-
ity (main) ➞ Display Options (side) ➞ Dialog Box and select Off.
If you need more than one session to complete the tutorial lessons, you can stop
the tutorial and return to it another time. To do so, you will need to save the
oscilloscope setup and then the application setup.
Returning to the Tutorial
To save the oscilloscope setup, refer to the user manual for your oscilloscope.
The procedure varies between models. The setup is always saved in the
APPS/TDSPSM1/TEMP directory on the oscilloscope.
To save the application setup and stop your session, refer to Saving a Setup on
page 22 and to Exiting the Application on page 23.
To return to the tutorial setup, you can recall the saved oscilloscope setup from
the hard disk, and then restart the application.
To recall the oscilloscope setup, refer to the user manual for your oscilloscope.
The procedure varies between models.
To recall the application setup, refer to Recalling a Setup on page 22.
TDSPSM1 Processor Specifications Measurements Application User Manual
37
Page 54

Tutorial
38
TDSPSM1 Processor Specifications Measurements Application User Manual
Page 55

Reference
Page 56

Page 57

Menu Structure
Figure 32 shows the relationship of the application-specific menus.
Measure
Measure menus Side menus, level 1
Ch-Ch
Setup Time
Hold Time
Clock Output Time
AC Timing
Setup menus
Ch-Ch
Setup Time
Hold Time
Tco
AC Timing
From Edge
To Edge
Range Minimum
Range Maximum
Clock Input
Data Edge Input
Range Minimum
Range Maximum
Clock Input
Data Edge Input
Range Minimum
Range Maximum
Clock Input
Output Edge Input
Range Minimum
Range Maximum
Input
Select Measurement
Side menus, level 2
Source
Edge
Slope
Hysteresis
VRef
Done
Source
Slope
Hysteresis
VRefHi
VRef
VRefLo
Done
High Time
Low Time
Rise Time
Fall Time
Period
Done
Graphical results display menus
Histogram
On/Off
Autoscale
Center
Span
Display Resolution
Vertical Display
Store Histogram In:
Value at V Bar: ?
Profile
On/Off
Profile Height
Value at ?
Reset Profile
Store Profile In:
Profile Length
Figure 32: Application-specific menu structure
TDSPSM1 Processor Specifications Measurements Application User Manual
39
Page 58

Menu Structure
Figure 33 shows the structure of the Control and Utility menus.
Main menus Side menus, level 1
Mode Single/Free Run
Control
Utility
Start & Continue
Pause
Stop
Reset All
Help
Exit
Save/Recall Setup
Display Options
Figure 33: Control and Utility menu structures
Side menus, level 2
First Page
Next page
Previous page
Last Page
Quit Help
OK
Cancel
Save Setup
Recall Setup
Default Setup
Done
Dialog Box
Box Position
Box Style
Color Theme
Done
40
TDSPSM1 Processor Specifications Measurements Application User Manual
Page 59

Parameters Reference
This section describes the TDSPSM1 application parameters. You should refer to
the user manual for your oscilloscope for operating details associated with each
front-panel menu button.
Measurement Setup Menus
Table 13 lists the setup menu for each measurement, the parameters, and the
selections or range of values available for each.
T able 13: Setup menus and parameters
Measurement Parameters Selections
Ch-Ch Delay From Edge*
To Edge*
Range Minimum
Range Maximum
Setup Time
Hold Time
Clock Output Time Clock/Trigger Input*
AC Timing Input*
* Refer to Table 14.
Clock/Trigger Input*
Data Edge Input*
Range Minimum
Range Maximum
Output Edge Input*
Range Minimum
Range Maximum
Select Measurement Rise Time, Fall T ime, High Time,
–1,000 ns to 999.9 ns in 0.1 ns units
–999.9 ns to 1000 ns in 0.1 ns units
–1,000 ns to 999.9 ns in 0.1 ns units
–999.9 ns to 1000 ns in 0.1 ns units
–1,000 ns to 999.9 ns in 0.1 ns units
–999.9 ns to 1000 ns in 0.1 ns units
Low Time and/or Period
The application can display the results from one to five AC Timing measurements in the Statistics readout.
TDSPSM1 Processor Specifications Measurements Application User Manual
41
Page 60

Parameters Reference
Waveform Sources
Table 14 lists the parameters for each waveform source used in the setup menus,
and the selections or range of values available for each.
T able 14: Waveform source parameters
Parameter Selections Comments
Source Ch1, Ch2, Ch3, Ch4, Ref1, Ref2,
Ref3, Ref4, Math1, Math2, Math3
Slope Rise, Fall, Transitional Transitional is when the voltage
VRefHi* –5.0 V to 5.0 V in 1 mV units
VRef –5.0 V to 5.0 V in 1 mV units
VRefLo* –5.0 V to 5.0 V in 1 mV units
Hysteresis 0 divisions to 1 division in 0.1 units
One source is allowed for each input
of a measurement.
crosses the reference level on both
rising and falling edges of a waveform.
If the reference voltage level(s) plus or
minus the hysteresis falls outside of
2.5% to 97.5% of the waveform
2.5% to 97.5% of the waveform
peak-to-peak range, the application
does not take any measurements.
*Only required for AC TIming measurements.
Histogram Graphical Format
Table 15 lists the parameters for the Histogram format and the selections or
range of values available for each.
T able 15: Histogram format parameters
Parameter Selections Comments
On/Off On, Off Stores the results, but does not
Autoscale None After taking measurements, uses
Center –500 to 500 ms in 5 ps units Use Autoscale to determine a
Span 10 ps to 1 s in 5 ps units Use Autoscale to determine a
Display resolution High, Medium, Low The default selection is medium.
automatically display them.
the results to determine logical
values for Center and Span.
logical value.
logical value.
42
Vertical Display Linear, Log (logarithmic) The default selection is Linear.
TDSPSM1 Processor Specifications Measurements Application User Manual
Page 61

NOTE. The application can display the results in a graphical format from only
one AC Timing measurement. (There are five.) The last AC Timing measurement
for which you select “On” is the one saved in a graphical format.
Profile Graphical Format
Parameters Reference
T able 15: Histogram format parameters (Cont.)
Parameter CommentsSelections
Store Histogram In Ref1, Ref2, Ref3, Ref4 To display the results, you must
press the MORE front panel button
and select the reference waveform.
Value at V Bar: ? None Press the Cursor front panel button
and select V Bars to display values.
Table 16 lists the parameters for the Profile format and the selections or range of
values available for each.
T able 16: Profile format parameters
Parameter Selections Comments
On/Off On, Off Stores the results, but does not
automatically display them.
Profile Height 0.5 divs to 8.0 divs in 0.5 divisions The default value is 4 divisions.
Value at _ ? None Use the GP knob to scroll through
the values by index number. You can
approximate the index number based
on 50 per horizontal division.
Reset Profile None Resets profile waveform results to
zero.
Store Profile In: Ref1, Ref2, Ref3, Ref4 To display the results, you must
press the MORE front panel button
and select the reference waveform.
Profile Length 500, 1000, 2500, 5000, 15000 The default value is 500.
TDSPSM1 Processor Specifications Measurements Application User Manual
43
Page 62

Parameters Reference
Control Menu
Table 17 lists the parameters for the Control menu and the selections or range of
values available for each.
T able 17: Control menu parameters
Parameter Selections Comments
Mode Single, Freerun Use Single for one acquisition; use Freerun for continuous
acquisitions.
Utility Menu
Start/
Continue
Pause None Pauses the acquisition
Stop None Stops the acquisition
Reset All None Resets all results (numeric and graphic) to zero. Use this
None Starts the acquisition.
Continues if the acquisition was paused.
function when you change any acquisition settings.
Table 18 lists each utility menu, the parameters and the selections or range of
values available for each.
T able 18: Utility menus and parameters
Utility Parameters Selections Comments
Help Refer to Figure 33
on page 40.
Exit Refer to Figure 33
on page 40.
Save/Recall
Setup
Save Setup
Recall Setup
None Help returns to the last page
viewed.
None Stops the application and
returns to the oscilloscope
functions
None
None
Saves the current setup.
Recalls the last saved setup
44
Default Setup
Display Options Dialog Box
Box Position*
Box Style
Color Theme
* Box position is fixed when taking AC Timing measurements.
None
On, Off
Left, Middle, Right
Opaque, Transparent
Based on the TDS
oscilloscope choices.
Recalls the default factory
setup.
Makes dialog boxes visible or
invisible
The default selection is Right.
The default is Opaque.
Colors affect dialog boxes and
waveforms.
TDSPSM1 Processor Specifications Measurements Application User Manual
Page 63

Appendix
Page 64

Page 65

Appendix A: Measurement Algorithms
The TDSPSM1 application can take timing measurements from one or two
waveforms. Dual waveform measurements are: Channel-to-Channel Delay, Setup
Time, Hold Time, and Clock Output Time. Single waveform (AC Timing)
measurements are: High Time, Low Time, Rise Time, Fall Time, and Period.
Oscilloscope Setup Guidelines
For all measurements, use the following guidelines to set up the oscilloscope:
1. The signal is any channel, reference waveform, or math waveform.
2. The vertical scale for the waveform must be set so that the waveform does
not exceed the vertical range of the TDS oscilloscope.
3. The time per division must be set small enough to capture sufficient
waveform detail and avoid aliasing.
4. Longer record lengths increase measurement accuracy.
Test Methodology
The application performs the measurement according to the following algorithm:
1. Imports the current waveform.
2. Checks that the reference voltage level plus or minus half the hysteresis are
within the 2.5% to 97.5% range of the peak-to-peak waveform values.
3. Checks that there are a minimum of two edges in the waveform to calculate
the measurement.
4. Performs the measurement within the time constraints specified in the Range
Minimum and Range Maximum menu items.
5. Uses the results in the Statistics readout, or saves the results formatted
graphically in a reference waveform.
NOTE. To take measurements from two waveforms, the application limits the
search area to the value in the Expected Range menu item (through the setup
menu). Be sure to carefully calculate the Expected Range value.
TDSPSM1 Processor Specifications Measurements Application User Manual
A–1
Page 66

Appendix A: Measurement Algorithms
Edge-Timing Measurements
All timing measurements are based on the time locations of edges within each
acquisition. Edge conditions are defined in the setup menu of each timing
measurement. T
between 1 and the number of edges in the acquisition.
The “i” and “j” represent dissimilar acquisition indices.Dissimilar acquisition
indices occur when the correlation between clock edges and a data transitions are
not one-to-one.
Dual Waveform Measurements
Edge conditions are defined for two waveforms. These algorithms use the VRef
values as the reference voltage level. Each edge is defined by the slope, voltage
reference level (threshold), and hysteresis.
represents the acquisition edge times where n is an index
n
Channel-to-Channel Delay
Measurement
Setup Time Measurement
The Channel-to-Channel Delay measurement is the difference in time between
the designated edge of a principal waveform and the designated edge of a relative
waveform.
The application calculates this measurement using the following equation:
Dn+ Ti–T
S
j
Where: D is the delay between the designated edges.
T is the edge position of the principal waveform.
s
is the edge position of the relative waveform nearest the
T
designated edge of the principal waveform.
The value of D
is only measured if Ti and T
n
s
are within the time constraints
j
specified in the Range Minimum and Range Maximum menu items.
The Setup Time measurement is the elapsed time between the designated edge of
a data waveform and when the clock waveform crosses its own voltage reference
level.
The application calculates this measurement using the following equation:
A–2
Sn+ Ti–T
d
j
TDSPSM1 Processor Specifications Measurements Application User Manual
Page 67

Where: S is the setup time.
T is the edge position of the clock waveform.
d
is the edge position of the data waveform.
T
Appendix A: Measurement Algorithms
Hold Time Measurement
Clock-to-Output Time
Measurement
The value of S
is only measured if Ti and T
n
d
are within the time constraints
j
specified in the Range Minimum and Range Maximum menu items.
The Hold Time measurement is the elapsed time between when the clock
waveform crosses its own voltage reference level and the designated edge of a
data waveform.
The application calculates this measurement using the following equation:
Hn+ T
d
–T
j
k
Where: H is the hold time.
T is the edge position of the clock waveform.
d
is the edge position of the data waveform.
T
The value of H
is only measured if T
n
d
and Tk are within the time constraints
j
specified in the Range Minimum and Range Maximum menu items.
The Clock-to-Output Time measurement is the elapsed time between when the
clock waveform crosses its own voltage reference level and the designated edge
of a data waveform.
The application calculates this measurement using the following equation:
n
+ T
o
–T
j
i
T
CO
Where: Tco is the clock-to-output time.
T is the edge position of the clock waveform.
o
is the edge position of the resultant output waveform.
T
The value of T
is only measured if T
COn
o
and Tj are within the time constraints
i
specified in the Range Minimum and Range Maximum menu items.
TDSPSM1 Processor Specifications Measurements Application User Manual
A–3
Page 68

Appendix A: Measurement Algorithms
Single Waveform Measurements
AC Timing is the single waveform measurement supported by the TDSPSM1
application. In the AC Timing measurements, edge conditions are defined for
one waveform by the slope, voltage reference levels (threshold), and hysteresis.
Most of the AC Timing algorithms use both the VRefHi and VRefLo reference
voltage levels. The Period measurement uses only the VRef value as the
reference voltage level and ignores the values of VRefHi and VRefLo.
High Time Measurement
Low Time Measurement
The High Time measurement is the amount of time that a waveform cycle is
above the VRefHi voltage reference level.
The application calculates this measurement using the following equation:
H
F
T
+ T
n
R
–T
n
n
Where: TH is the high time.
F
is the VRefHi crossing on the falling edge.
T
R
is the VRefHi crossing on the rising edge.
T
The Low Time measurement is the amount of time that a waveform cycle is
below the VRefLo voltage reference level.
The application calculates this measurement using the following equation:
L
R
T
+ T
n
F
–T
n
n
Where: TL is the low time.
Rise Time Measurement
A–4
R
is the VRefLo crossing on the rising edge.
T
F
T
is the VRefLo crossing on the falling edge.
The Rise Time measurement is the time difference between when the VRefHi
reference level is crossed and the VRefLo reference level is crossed on the rising
edge of the waveform.
The application calculates this measurement using the following equation:
R
RefHi
T
+ T
n
RefLo
–T
n
n
TDSPSM1 Processor Specifications Measurements Application User Manual
Page 69

Appendix A: Measurement Algorithms
Fall Time Measurement
Period Measurement
Where: T
R
is the rise time.
RefHi
is the VRefHi crossing on the rising edge.
T
RefLo
is the VRefLo crossing on the rising edge.
T
The Fall Time measurement is the time difference between when the VRefLo
reference level is crossed and the VRefHi reference level is crossed on the falling
edge of the waveform.
The application calculates this measurement using the following equation:
F
RefLo
T
+ T
n
RefHi
–T
n
n
Where: TF is the fall time.
RefLo
is the VRefLo crossing on the falling edge.
T
RefHi
is the VRefHi crossing on the falling edge.
T
The Period measurement calculates the duration of a cycle as defined by a
waveform crossing a specific voltage reference level twice.
The application calculates this measurement using the following equation:
Pn+ T
n)1
–T
n
Where: P is the period.
T is the VRef crossing on the designated edge.
TDSPSM1 Processor Specifications Measurements Application User Manual
A–5
Page 70

Appendix A: Measurement Algorithms
A–6
TDSPSM1 Processor Specifications Measurements Application User Manual
Page 71

Index
Page 72

Page 73

Index
A
AC Timing, tutorial lesson, 33
accessories, 2
application
basic functions with an oscilloscope, 6
description, 1
exiting, 23
tutorial lesson, 37
menu structure, 5, 39
returning, 6
setting up
to display results, 16
to take measurements, 8
starting, 25
test methodology, A–1
updates, 2
C
Cancel, 6
changing settings during a measurement, 19
channel assignments, 4
Channel-to-Channel Delay Time measurement
application equations, A–2
Range Minimum and Range Maximum values, 12
CLEAR MENU button, 20
Clock-to-Output Time measurement
application equations, A–3
Range Minimum and Range Maximum values, 12
common menu items, 6
configuring the display, 7
connections, 4
contacting T ektronix, viii
Continue side menu, 19
Control menu, 18
parameters, 44
conventions, vii
E
edge-time measurements, A–2
exiting the application, 23
F
Fall Time measurement, application equations, A–5
Free Run acquisition mode, 19
G
GPIB commands, 19
graphical formats, 21
Histogram setup menu parameters, 42
Profile setup menu parameters, 43
H
Help, online, 6
High Time measurement, application equations, A–4
Histogram format
definition, 21
scaling, 21
setup menu items, 17
setup menu parameters, 42
tutorial lesson, 30
Hold Time measurement
application equations, A–3
data transition excluded by range values, 14
negative value, 12
I
installation
application, 3
downloading updates, 2
D
Default Setup, 22
dialog box, changing the appearance, 7
Display Options, 7
Display Options side menu, 8
Done, 6
L
leaving the application, 23
lessons. See tutorial lessons
loading, reference waveforms, 27
localizing measurements, 19
TDSPSM1 Processor Specifications Measurements Application User Manual
Index–1
Page 74

Index
Low Time measurement, application equations, A–4
M
main menus, 5
Measure menu, 18
measurement
application equations
Channel-to-Channel Delay, A–2
Clock-to-Output Time, A–3
Fall Time, A–5
High Time, A–4
Hold Time, A–3
Low Time, A–4
Period, A–5
Rise Time, A–4
Setup Time, A–2
application test method, A–1
Continue, 19
oscilloscope changes, 19
Pause, 19
setup menu parameters, 41
starting, 18
turning off display, 20
tutorial lessons, 25
measurements
algorithms, A–1
descriptions, 8, 9
display results, 16
localizing, 19
setting up, 8
menu
Control, 18
overview , 39
menu structure
description, 5
detailed illustration, 39
messages, W arning, 7
O
Okay , 6
online help, 6
oscilloscope
basic functions with the application, 6
compatibility, 1
setup guidelines, A–1
P
parameters, reference section, 41
Pause side menu, 19
Period measurement, application equations, A–5
product
compatibility, 1
description, 1
requirements and restrictions, 2
updates, 2
Profile format
definition, 21
setup menu items, 17, 18
setup menu parameters, 43
tutorial lesson, 31
Q
quitting the application, 23
R
Range Maximum menu item
default values, 10
definition, 10
exclude a transition example, 13
simple example, positive values, 11
vertical cursors to estimate, 11
Range Minimum menu item
default values, 10
definition, 10
exclude a transition example, 13
negative value example, 12
simple example, positive values, 11
vertical cursors to estimate, 11
readout, turning off, 20
Recall Setup, 22
recalling a setup, 21
tutorial lesson, 37
reference waveforms, loading, 27
requirements and restrictions, 2
Reset All, 21
results
display format descriptions, 16
reset and clear, 21
Rise Time measurement, application equations, A–4
S
Save Setup, 22
saving a setup, 21
tutorial lesson, 37
setup
default, 22
Index–2
TDSPSM1 Processor Specifications Measurements Application User Manual
Page 75

Index
recalling, 22
saving, 22
setup menus, descriptions, 10
Setup Time, tutorial lesson, 27
Setup Time measurement
application equations, A–2
data transition excluded by range values, 13
negative value, 14
setups
recalling, 21
saving, 21
side menus, 5
signal, defining the waveform, 16
Single acquisition mode, 19
source
defining the waveform, 15
menu item description, 10
setup menu parameters, 42
starting
application, 25
measurement, 18
Statistics readout, 20
turning off, 20
T
tdspsm1.ini file, 22
technical support, viii
T ektronix, contacting, viii
T ektronix, contacting, viii
terms, vii
tutorial lessons, 25
dual waveform, 27
exiting the application, 37
Histogram format, 31
Profile format, 33
recalling a setup, 37
saving a setup, 37
single waveform, 33
Statistics readout, 29, 35, 36
U
Utility menu, parameters, 44
Utility menus, 6
V
viewing
obscured parts of waveforms, 20
results, 19
results in graphical formats, 21
Statistics readout, 20
W
Warning messages, 7
warning messages, 7
waveform
setup menu parameters, 42
source menu item description, 10
waveforms
display color, 7
viewing obscured parts, 20
web site, 2
TDSPSM1 Processor Specifications Measurements Application User Manual
Index–3
Page 76

Index
Index–4
TDSPSM1 Processor Specifications Measurements Application User Manual
Page 77

 Loading...