


Printed Help Document
TDSDVI
DVI Compliance Test Solution Software
PHP0231
Adapted from the TDSDVI Online Help
This document supports software
version 1.3.0 and above
www.tektronix.com

Copyright Notice
Copyright © Tektronix 2005, Inc. All rights reserved. Licensed software products are owned by Tektronix or its
suppliers and are protected by United States copyright laws and international treaty provisions.
Use, duplication or disclosure by the Government is subject to restrictions as set forth in subparagraph (c)(1)(ii) of
the Rights in Technical Data and Computer Software clause at DFARS 252.227-7013, or subparagraphs (c)(1)
and (2) of the Commercial Computer Software-Restricted Rights clause at FAR 52.227-19, as applicable.
Tektronix products are covered by U.S. and foreign patents, issued and pending. Information in this
documentation supercedes that in all previously published material. Specifications and price change privileges
reserved.
Tektronix, Inc. P.O. Box 500, Beaverton, OR 97077
Tektronix, Tek, and TEKPROBE are registered trademarks of Tektronix, Inc.
TDSDVI Compliance Test Solution User Manual PHP231 version 1.3.0

Table Of Contents
General Safety Summary....................................................................................................... vii
To avoid Fire and Personal Injury .................................................................vii
Terms in this Manual .....................................................................................vii
Introduction ........................................................................................................................... 1
About TDSDVI Application...................................................................................... 1
Online Help and Related Documentation ......................................................2
Conventions ................................................................................................... 2
Contact Tektronix ...................................................................................................... 3
Feedback ........................................................................................................ 3
Using Online Help ......................................................................................... 4
Printing from the Online Help ....................................................................... 5
Getting Started.......................................................................................................................7
Compatibility ................................................................................................. 7
Requirements and Restrictions ......................................................................7
Accessories ....................................................................................................8
Updates from the web site ............................................................................. 8
Installing and Uninstalling the Application............................................................... 9
Installing the Application............................................................................... 9
Uninstalling the Application.......................................................................... 9
Basic Application Functions......................................................................................9
Starting the Application ................................................................................. 9
Minimizing and Maximizing the Application Window................................. 10
Returning to the Application.......................................................................... 11
Exiting the Application.................................................................................. 11
Application Directories and File Names........................................................ 11
File Name Extensions ....................................................................................12
Operating Basics.................................................................................................................... 13
TDSDVI Application Window ......................................................................13
Application Interface Controls....................................................................... 13
Measurement Selection Pane ......................................................................... 13
Cable Tab....................................................................................................... 14
Receiver Tab .................................................................................................. 15
Device Selection Tab ..................................................................................... 16
Define Tbit Selection Area ............................................................................ 16
Control Panel .................................................................................................17
Status Bar....................................................................................................... 18
Menus ........................................................................................................................18
Menu Bar .......................................................................................................18
File Menu....................................................................................................... 18
Measurements Menu......................................................................................19
Results Menu .................................................................................................19
Utilities Menu ................................................................................................ 20
TDSDVI Compliance Test Solution Printed Help Document i

Table Of Contents
Help Menu ..................................................................................................... 20
Dialog Boxes ............................................................................................................. 20
Dialog Boxes, Panels and Windows.............................................................. 20
Preferences..................................................................................................... 21
Recall Default ................................................................................................ 23
Calculator Keypad ......................................................................................... 24
Virtual Keyboard ........................................................................................... 25
Exit................................................................................................................. 25
Result Detail .................................................................................................. 27
Report Generator ........................................................................................... 28
Eye Zoom ...................................................................................................... 31
Compare Results............................................................................................ 32
Eye Trends in TDS6604, TDS6404, TDS6604B, and TDS6804B
Oscilloscopes ................................................................................................. 36
Transmitter, Cable, Receiver Screen Interface ....................................................... 40
About Transmitter, Cable, and Receiver ....................................................... 40
Transmitter Eye Diagram Screen Interface ............................................................... 40
Transmitter Eye Diagram Pane...................................................................... 40
Select Source ................................................................................................. 41
Select Pair ...................................................................................................... 41
Number of Eyes ............................................................................................. 42
Calculate Vswing........................................................................................... 43
Transmitter Rise and Fall Time Screen Interface...................................................... 43
Transmitter Rise and Fall Time Pane ............................................................ 43
Select Source ................................................................................................. 45
Select Pair ...................................................................................................... 45
Hysteresis....................................................................................................... 46
Calculate Vswing........................................................................................... 46
Transmitter Pk-Pk Jitter Screen Interface.................................................................. 47
Transmitter Pk-Pk Jitter Pane........................................................................ 47
Select Source ................................................................................................. 48
Transmitter Intra-Pair Skew Screen Interface ........................................................... 48
Transmitter Intra-Pair Skew Pane.................................................................. 48
Select Source ................................................................................................. 49
Select Pair ...................................................................................................... 50
Hysteresis....................................................................................................... 50
Transmitter Inter- Pair Skew Screen Interface .......................................................... 50
Transmitter Inter-Pair Skew Pane.................................................................. 50
Select Source ................................................................................................. 52
Select Pair ...................................................................................................... 52
Hysteresis....................................................................................................... 53
Cable High-Amplitude/Low Amplitude Eye Diagram Screen Interface .................. 53
Cable High-Amplitude Eye Diagram Pane.................................................... 53
Cable Low-Amplitude Eye Diagram Pane .................................................... 54
Select Source ................................................................................................. 56
Select Pair ...................................................................................................... 56
Number of Eyes ............................................................................................. 57
ii TDSDVI Compliance Test Solution Printed Help Document

Table Of Contents
Cable Pk-Pk Jitter Screen Interface ...........................................................................57
Cable Pk-Pk Jitter Setup Pane ....................................................................... 57
Select Source.................................................................................................. 58
Cable Intra-Pair Skew Screen Interface..................................................................... 59
Cable Intra-Pair Skew Setup Pane ................................................................. 59
Select Source.................................................................................................. 60
Select Pair ...................................................................................................... 60
Hysteresis.......................................................................................................61
Cable Inter-Pair Skew Screen Interface..................................................................... 61
Cable Inter-Pair Skew Setup Pane ................................................................. 61
Select Source.................................................................................................. 62
Select Pair ...................................................................................................... 63
Hysteresis.......................................................................................................63
Receiver High-Amplitude/Low Amplitude Eye Diagram Screen Interface.............. 63
Receiver High-Amplitude Eye Diagram Pane...............................................64
Receiver Low-Amplitude Eye Diagram Pane ...............................................65
Select Source.................................................................................................. 66
Select Pair ...................................................................................................... 66
Number of Eyes ............................................................................................. 67
How to Calculate Tbit................................................................................................ 67
Enter a User Defined Tbit Value ...................................................................69
Troubleshooting Tbit Calculation Error Messages........................................ 69
How to Test Transmitter For Eye Diagram ............................................................... 70
Selecting and Configuring Measurement: Eye Diagram ...............................70
Viewing Results: Eye Diagram...................................................................... 74
Generating Reports ........................................................................................ 75
How to Test Transmitter for Rise Time and Fall Time ............................................. 78
Selecting and Configuring Measurements: Rise and Fall Time .................... 78
Viewing Results: Rise and Fall Time ............................................................ 80
Generating Reports ........................................................................................ 82
How to Test Transmitter for Pk-Pk Jitter ..................................................................84
Selecting and Configuring Measurements:Pk-Pk Jitter ................................. 84
Viewing Results: Pk-Pk Jitter ........................................................................ 87
Generating Reports ........................................................................................ 88
How to Test Transmitter for Intra-Pair Skew............................................................ 90
Selecting and Configuring Measurements: Intra-Pair Skew.......................... 90
Viewing Results: Intra-Pair Skew.................................................................. 92
Generating Reports ........................................................................................ 93
How to Test Transmitter for Inter-Pair Skew............................................................ 95
Selecting and Configuring Measurements: Inter Pair Skew.......................... 95
Viewing Results: Inter-Pair Skew.................................................................. 96
Generating Reports ........................................................................................ 98
How to Test Cable for Hi-Amplitude/Low-Amplitude Eye Measurement ...............99
Select and Configure Measurements:High-Amplitude/Low-Amplitude Eye
Diagram .........................................................................................................99
Viewing Results: High-Amplitude/Low-Amplitude Eye Diagram ............... 104
Generating Reports ........................................................................................ 106
TDSDVI Compliance Test Solution Printed Help Document iii

Table Of Contents
How to Test Cable for Pk-Pk Jitter............................................................................ 107
Selecting and Configuring Measurements:Pk-Pk Jitter................................. 107
Viewing Results-Pk-Pk Jitter......................................................................... 110
Generating Reports ........................................................................................ 111
How to Test Cable for Intra-Pair Skew ..................................................................... 113
Selecting and Configuring Measurements: Intra-Pair Skew ......................... 113
Viewing Results: Intra-Pair Skew ................................................................. 115
Generating Reports ........................................................................................ 117
How to Test Cable for Inter-Pair Skew ..................................................................... 118
Selecting and Configuring Measurements: Inter-Pair Skew ......................... 118
Viewing Results-Inter-Pair Skew .................................................................. 120
Generating Reports ........................................................................................ 121
How to Test Receiver For High-Amplitude/Low-Amplitude Eye Diagram............. 122
Selecting and Configuring Measurements: High-Amplitude/
Low-Amplitude Eye Diagram ....................................................................... 122
Viewing Results: High-Amplitude/Low-Amplitude Eye Diagram ............... 125
Generating Reports ........................................................................................ 127
Save and Recall Setups.............................................................................................. 128
Recall Default Setup...................................................................................... 129
Save a Setup................................................................................................... 129
Recall a Setup ................................................................................................ 129
Recall a Recently Recalled Setup.................................................................. 130
Recall a Recently Saved Setup ...................................................................... 130
Application Examples ........................................................................................................... 131
About Application Examples .................................................................................... 131
Tbit ............................................................................................................................ 131
Specifying the Equipment: Define Tbit......................................................... 131
Equipment Setup: Define Tbit....................................................................... 131
Transmitter-Eye Diagram.......................................................................................... 133
Specifying the Equipment: Transmitter Eye Diagram................................... 133
Equipment Setup-Transmitter: Eye Diagram ................................................ 134
Transmitter-Rise and Fall Time................................................................................. 136
Specifying the Equipment: Transmitter Rise and Fall Time ......................... 136
Equipment Setup: Transmitter- Rise and Fall Time...................................... 137
Transmitter-Pk-Pk Jitter ............................................................................................ 139
Specifying the Equipment: Transmitter PK-Pk Jitter .................................... 139
Equipment Setup: Transmitter-Pk-Pk Jitter................................................... 140
Transmitter- Intra-Pair Skew..................................................................................... 142
Specifying the Equipment: Transmitter-Intra-Pair Skew .............................. 142
Equipment Setup: Transmitter-Intra-Pair Skew ............................................ 143
Transmitter- Inter-Pair Skew..................................................................................... 145
Specifying the Equipment: Transmitter-Inter-Pair Skew .............................. 145
Equipment Setup: Transmitter-Inter-Pair Skew ............................................ 146
Cable-Pk-Pk Jitter...................................................................................................... 148
Specifying the Equipment: Cable-Pk-Pk Jitter.............................................. 148
Equipment Setup: Cable Pk-Pk Jitter ............................................................ 149
Cable-Intra-Pair Skew ............................................................................................... 150
iv TDSDVI Compliance Test Solution Printed Help Document

Table Of Contents
Specifying the Equipment: Cable Intra-Pair Skew ........................................ 150
Equipment Setup: Cable Intra-Pair Skew Tbit ..............................................150
Cable Inter-Pair Skew................................................................................................ 152
Specifying the Equipment: Cable Inter-Pair Skew ........................................ 152
Equipment Setup: Cable Inter-Pair Skew ......................................................153
Cable-Hi-Amplitude/Low-Amplitude Eye Diagram ................................................. 154
Specifying the Equipment: Cable High-Amplitude/Low-Amplitude
Eye Diagram .................................................................................................. 154
Equipment Setup: Cable-High-Amplitude/Low-Amplitude Eye Diagram ...155
Receiver-Hi-Amplitude/Low-Amplitude Eye Diagram ............................................ 160
Specifying the Equipment: Receiver High-Amplitude/ Low-Amplitude
Eye Diagram .................................................................................................. 160
Equipment Setup Receiver: High-Amplitude/Low-Amplitude Eye
Diagram .........................................................................................................160
Measurement Algorithms ......................................................................................................163
Eye .............................................................................................................................163
Eye Openings.............................................................................................................164
Inter-Pair Skew .......................................................................................................... 166
Intra-Pair Skew .......................................................................................................... 167
Pk-Pk Jitter................................................................................................................. 168
Rise and Fall Time..................................................................................................... 168
Generation of Cable High Amplitude Eye Mask....................................................... 169
Generation of Cable Limit Eye Mask........................................................................ 170
Generation of Cable Low Amplitude Eye Mask ....................................................... 170
Generation of Receiver High Amplitude Eye Mask..................................................171
Generation of Receiver Low Amplitude Eye Mask ..................................................171
Generation of Transmitter Eye Mask ........................................................................172
Reference............................................................................................................................... 173
Equivalent Source Board ...........................................................................................173
Shortcut Keys............................................................................................................. 175
Default Settings .........................................................................................................176
Error Codes................................................................................................................ 177
Error Codes Contd.… ................................................................................................ 178
Standard Resolutions ................................................................................................. 180
Resolutions On TDS/CSA7404/7404B, TDS7704B and TDS6604, TDS6404,
TDS6604B, and TDS6804B Oscilloscopes............................................................... 181
Resolutions On TDS7254/TDS7254B Oscilloscopes ...............................................181
How do you generate Patterns (in infinite loops) to Conduct a Test? ....................... 182
Set Cursors for Eye, RT & FT Testing...................................................................... 182
Cable Setup at TP2 ....................................................................................................184
How do you increase or decrease the Vswing? ......................................................... 184
Cable Setup at TP3 ....................................................................................................185
TPA-P Test Points ..................................................................................................... 185
TPA-R Test Points..................................................................................................... 187
Glossary................................................................................................................................. 189
TDSDVI Compliance Test Solution Printed Help Document v


General Safety Summary
Review the following safety precautions to avoid injury and prevent damage to
the measurement instrument or any products connected to it. To avoid potential
hazards, use the software and measurement instrument only as specified.
While using this software, you may need to access other parts of the system.
Read the General Safety Summary and specification sections in other equipment
manuals for warnings, cautions, and ratings related to operating the system with
this software.
To avoid Fire and Personal
Injury
Terms in this Manual
Connect and Disconnect Properly. Connect the probe output to the
measurement instrument before connecting the probe to the circuit under
test. Disconnect the probe input and the probe ground from the circuit
under test before disconnecting the probe from the measurement
instrument.
Observe All Terminal Ratings. To avoid fire or shock hazard, observe all
ratings and markings on the measurement instrument and other equipment used
with this software. Consult the individual product manuals for further ratings
information before making connections to the circuit under test.
Do Not Operate With Suspected Failures. If you suspect there is damage to the
measurement instrument or other equipment being used with this software, have
it inspected by qualified service personnel.
These terms may appear in this manual
WARNING. Warning statements identify conditions or practices that could
result in injury or loss of life.
CAUTION. Caution statements identify conditions or practices that could result
in damage to the measurement instrument or other property.
TDSDVI Compliance Test Solution Printed Help Document vii

General Safety Summary
viii TDSDVI Compliance Test Solution Printed Help Document

Introduction
About TDSDVI Application
Figure 1-1
The TDSDVI is a Digital Visual Interface Compliance Test Solution that helps
test, validation and design engineers perform DVI physical layer validation and
compliance testing. TDSDVI Test Solution is the first test solution to provide
credible test results in conformance with the DVI specifications and the DVI Test
and Measurement Guide.
TDSDVI provides fully automatic testing by providing automatic oscilloscope
set-ups, eye mask generation and parametric testing for DVI compliance.
The TDSDVI complies with the DVI specifications and:
Enables the DVI developers to test designs according to the test procedures
in the DVI Test and Measurement Guide.
Offers automated tests for:
Transmitter: Eye Diagram, Pk-Pk Jitter, Intra-Pair Skew, Inter-Pair Skew,
Rise and Fall Time
Cable: High-Amplitude Eye Diagram, Low-Amplitude Eye Diagram, Pk-Pk
Jitter, Intra-Pair Skew, Inter-Pair Skew
Receiver: High-Amplitude Eye Diagram, Low-Amplitude Eye Diagram
Automatic "one-button" testing ensures faster validation with higher
reliability.
Supports all resolutions till UXGA.
Half Clock and Pseudo Random Patterns for various resolutions allow testing
as per DDWG procedures.
TDSDVI Compliance Test Solution Printed Help Document 1

Introduction
Online Help and Related
Documentation
You can access the information on how to operate the application, along with the
oscilloscope, through the following related documents and online help.
Oscilloscope Information: The user manual and user online help for your
oscilloscope provides general information on how to operate the
oscilloscope.
You can download PDF versions of many user manuals from the Tektronix
Website.
Programmer Information: The online programmer guide for your
oscilloscope provides details on how to use GPIB commands to control the
oscilloscope.
You can download programmer information and examples from the Tektronix
Website.
Refer to the Optional Applications Software on Windows-Based Oscilloscopes
Installation Manual for the following information:
Software warranty
Software license agreement
List of all available applications, compatible oscilloscopes, and relevant
software and firmware version numbers
Conventions
How to apply a new label
Installation procedures
How to enable an application
How to download updates from the Tektronix Website
You can find a PDF (portable document format) file for this document in the
Documents directory on the Optional Applications Software on Windows-Based
Oscilloscopes CD-ROM. The CD booklet only contains information on installing
the application from the CD and on how to apply a new label.
This online help uses the following conventions:
Refers to the TDSDVI Compliance Test Solution as the TDSDVI or as the
application or the software.
ESB refers to the Equivalent Source Board, HCP to Half Clock Pattern and
PRP to Pseudo Random Pattern.
When steps require a sequence of selections using the application interface,
the ">" symbol marks each transition between a menu and an option. For
example, File > Minimize.
GP knob refers to the General Purpose Knob.
2 TDSDVI Compliance Test Solution Printed Help Document

Contact Tektronix
Feedback
Introduction
DUT refers to the device under test. This can be a Transmitter, Cable or a
Receiver device.
CRU is the Clock Recovery Unit.
In the application fields, you can use either the calculator keypad or the GP
knob to enter the values.
PLL Clk or PLL Clock refers to the Phase Locked Loop Clock.
Phone 1-800-833-9200*
Tektronix, Inc.
Department or name (if known)
Address
Website www.tektronix.com
Sales support 1-800-833-9200, select option 1*
Service Support 1-800-833-9200, select option 2*
Technical Support
* This Telephone number is toll free in North America. After office hours,
please leave a voice mail message. Outside North America, contact a
Tektronix sales office or distributor; See the Tektronix web site for a list of
offices.
Tektronix values your feedback on our products. To help us serve you better,
please send us your suggestions, ideas or comments on your oscilloscope.
Direct your feedback via email to
14200 SW Karl Braun Drive
P.O. Box 500
Beaverton, OR 97077
USA
Email: techsupport@tektronix.com
1-800-833-9200, select option 3*
6:00 a.m. - 5:00 p.m. Pacific time
dvifeedback@tek.com
and include the following information. Please be as specific as possible.
General information:
Oscilloscope model number and hardware options, if any.
Probes used.
Your name, company, mailing address, phone number, FAX number.
Please indicate if you would like to be contacted by Tektronix about your
suggestion or comments.
TDSDVI Compliance Test Solution Printed Help Document 3

Introduction
Application specific information:
Software version number.
Firmware version of the oscilloscope.
Description of the problem such that technical support can duplicate the
problem.
If possible, save the oscilloscope and application setup files as .set or .ini
files.
If possible, save the waveform on which you are performing the
measurement as a .wfm file.
Once you have gathered this information, you can contact technical support by
phone or through e-mail. If using e-mail, be sure to enter in the subject line
"TDSDVI Problem," and attach the .set, .ini and .wfm files.
Using Online Help
Select Help on the right side of the application menu bar to bring up the online
help.
Tables of Contents (TOC) tab — organizes the Help into book-like sections.
Select a book icon to open a section; select any of the topics listed under the
book.
Index tab — enables you to scroll through alphabetical list of keywords. Select
the topic of interest to bring up the appropriate help page.
Search tab — allows a text-based search. Follow these steps:
Type the word or phrase you want to find in the search box.
Select some matching words in the next box to narrow your search.
Choose a topic in the lower box, and then select the Display button.
To print a topic, select the Print button from the Help Topics menu bar.
Select Options from the menu bar for other commands, such as annotating a
topic, keep the help window on top, or to use system colors.
Select the Back button to return to the previous help window. Use the
hyperlink to jump from one topic to another. If the Back button is grayed out
or a jump is not available, choose the Help Topics button to return to the
originating help folder.
Browse buttons (Next >> and Previous <<) allow you to move forward and
backward through topics in the order of the Table of Contents (TOC).
Sometimes you will see the word Note in the topic text. This indicates important
information.
4 TDSDVI Compliance Test Solution Printed Help Document

Introduction
Note: Certain aspects of the online help are unique to application that run on the
oscilloscope.
Blue-underlined text indicates a jump (hyperlink) to another topic. Select the blue
text to jump to the related topic. For example, select the blue text to jump to the
topic on Online Help and Related Documentation and the Back button to return
to the previous page.
You can tell when the cursor is over an active hyperlink (button, jump, or popup), because the cursor arrow changes to a small hand.
Printing from the Online
Help
You can access the information on how to operate the application, along with the
oscilloscope, through the following related documents and online help.
While using the TDSDVI online help, you can print topics and information from
the Help viewer. Some online help topics have color in the examples of the
displayed application. If you want to print this type of topic on a monochrome
printer, some information may not print because of certain colors. Instead, you
should print the topic from the PDF (portable document format) file that
corresponds to the Online Help. You can find the file in the Documents directory
on the Optional applications Software on Windows-Based Oscilloscopes
CD–ROM. The figures of application menus in the PDF file are gray scale so the
relevant information will appear on the printed page.
To print a single topic:
1. Find the topic in the Contents pane.
2. Click Print.
3. Click Print the selected topic and click OK.
To print all topics in a selected TOC book:
1. Find the TOC book in the Contents pane.
2. Click Print.
3. Click Print the selected heading and all subtopics and click OK.
TDSDVI Compliance Test Solution Printed Help Document 5

Introduction
6 TDSDVI Compliance Test Solution Printed Help Document

Getting Started
Compatibility
The TDSDVI application is compatible with the following oscilloscopes:
CSA7404, CSA7404B, TDS7404, TDS7404B, TDS7254, TDS7524B,
TDS7704B (supports DVI resolutions up to SVGA), TDS6604, TDS6404,
TDS6604B, and TDS6804B oscilloscopes
TDS6124C and TDS6154C oscilloscopes
Requirements and Restrictions
Do not change the oscilloscope settings when a test is running. If you change the
settings, the application may give incorrect test results.
Prerequisites
Please read the Readme.txt file before you install the application.
TekVisa must be installed on the oscilloscope. If you do not have TekVisa,
you can download it from www.tektronix.com.
The Sun Java Run-Time Environment V1.3.1 must be installed on the
oscilloscope to operate the application. If Java Run-Time Environment is not
installed, it will be automatically installed when you install the application. If
you remove JRE v1.3, you can reinstall it by reinstalling the application.
Only CSA7404, CSA7404B, TDS7404, TDS7404B, TDS7254, TDS7524B,
TDS7704B, TDS6604, TDS6404, TDS6604B, and TDS6804B oscilloscopes
TDS6124C and TDS6154C oscilloscopes
If the signal is not connected and the noise level is below 50 mV, the
application detects and displays a message as "Improper Waveform".
To get appropriate results in Pk-Pk Jitter measurements, from the
oscilloscope menu bar, select Measure>Waveform Histograms>Adjust
Histogram Box Limits.
TDSDVI Compliance Test Solution Printed Help Document 7

Getting Started
Accessories
For better and reliable results
To calibrate an oscilloscope, select Utilities > Instrument Calibration in the
oscilloscope menu bar and select the Calibrate button.
Oscilloscope should be calibrated (Signal Path Compensation). To calibrate
an oscilloscope, select Utilities > Instrument Calibration in the oscilloscope
menu bar and select the Calibrate button.
The application supports the following differential probes:
P7350
P7330
P6330
The application supports the following single-ended probes for skew testing:
P7240
P6249
Other accessories
SMA Cable to connect recovered (PLL) clock from the TPA-R and TPA-P
TCA-BNC adapter to use a P6330 probe
TCA-SMA adapter to use the SMA cables
Updates from the web site
You can find information about this and other applications at the Tektronix web
site, www.tektronix.com. Check this site for application updates and other free
applications.
To install an application update, you will need to download it from the Tektronix
web site to the oscilloscope hard disk.
fixture
Note: More information about changes to the application or installation is in a
Readme.txt file on the web site. You should read it before you continue.
8 TDSDVI Compliance Test Solution Printed Help Document

Installing and Uninstalling the Application
Getting Started
Installing the Application
Uninstalling the
Application
Refer to the Optional Applications Software on Windows-Based Oscilloscopes
Installation Manual for the following information:
Installation procedures
How to apply a new label
How to enable an application
How to download updates from the Tektronix web site
You can find a PDF (portable document format) file for this document in the
Documents directory on the Optional Applications Software on Windows-Based
Oscilloscopes CD–ROM. The CD booklet contains information on how to install
the application from the CD and on how to apply a new label.
To uninstall the application:
1. On the Windows task bar, Select Start> Settings.
2. Select Control Panel> Add/Remove Programs.
3. Select DVI Compliance Test Solution from the programs list. Select
Add/Remove and the Installshield will take you through the uninstallation
procedures.
Basic Application Functions
Starting the Application
TDSDVI Compliance Test Solution Printed Help Document 9
To start the TDSDVI application,
1. From the oscilloscope menu, select File> Run Application> DVI
Compliance Test Solution to run the application.

Getting Started
Minimizing and Maximizing
the Application Window
Figure 2-1: Starting the application
2. The oscilloscope display resizes to fit the upper half of the screen and the
lower half of the oscilloscope screen displays the TDSDVI application user
interface. If you access the oscilloscope functions, the oscilloscope display
appears in full screen and the TDSDVI application interface recedes.
3. To return to the TDSDVI application interface, select the App button
The application appears even when you minimize the oscilloscope display.
1. To minimize the application, select File> Minimize.
2. To maximize the application, select TDSDVI application in the Windows
toolbar.
3. To hide the application, select the Hide button
Note: If you select Hide button, the TDSDVI application window minimizes to the
Windows taskbar and the oscilloscope display resizes to the full screen.
If you select File> Minimize, the application window minimizes to the Windows
taskbar. The upper half of the screen shows the oscilloscope display and the
lower half of the screen shows the Windows desktop.
10 TDSDVI Compliance Test Solution Printed Help Document

Getting Started
Returning to the
Application
Exiting the Application
Application Directories and
File Names
When you access oscilloscope functions, the oscilloscope fills the display. You
can access oscilloscope functions in the following ways:
Choose the Menu bar or the Toolbar mode on the oscilloscope and access the
menus.
Press front-panel buttons.
To return to the application, choose the App button
hand side of the oscilloscope.
If you select File> Minimize to minimize the application, double-click on
TDSDVI in the taskbar to bring back the application.
To exit the application:
Select File> Exit or select
The application uses specific directories to save and recall files. Table 2-1 lists the
default directory names.
from the right-hand corner of the application.
on the top right
Table 2-1: Application directories
Directory Function
C:\TekApplications\TDSDVI\Setup Stores the application setup files
C:\TekApplications\TDSDVI\Reports Stores the report generated
C:\TekApplications\TDSDVI\Images Stores the zoomed eye images with the statistics
C:\TekApplications\TDSDVI\Patterns Stores the Pseudo Random and the Half Clock
Patterns
TDSDVI Compliance Test Solution Printed Help Document 11

Getting Started
File Name Extensions
The application uses these file name extensions to identify the file type. Table 2-2
lists the file name extensions.
Table 2-2: File name extensions
File name extensions Description
.ini Application setup file
.set Oscilloscope setup file saved and recalled with a .ini file; both
the files will have the same file name
.html Report file or a compared result file
.bmp Format of the HCPand PRP pattern files
.jpg Eye mask image file
.gif Tektronix logo image
12 TDSDVI Compliance Test Solution Printed Help Document

Operating Basics
Application View
TDSDVI Application Window
Application Interface
Controls
The TDSDVI application is a Windows-based application. The application
window contains a Menu Bar, Device Selection Tab, Measurement Selection
Pane and the Status Bar.
You can select Transmitter, Cable or Receiver from the Device Selection Tab.
Select any of the device to display its measurement selection pane. For more
information on a control, click one of the highlighted areas on the graphic below.
The application uses a Windows interface.
Note: The oscilloscope application shrinks to half size and appears in the top
half of the display when the application is running.
Table 3-1 lists the application interface controls:
Table 3-1: Application interface controls
Control Description
Menu bar Located at the top of the application window and provide
access to the application menus
Area/Tab Enclosed visual frame with a set of related options
Option button Selects a command or task
Drop-down List box Lists items from which you can select one item
Field Box that you can use to type in text or to enter a value with the
keypad or a multipurpose knob
Check Boxes Box that you use to select or clear preferences
Scroll bar Vertical or horizontal bar at the side or bottom of a display area
used to move around that area
Browse Displays a window where you can look through a list of
directories and files
Command button Initiates an immediate action
Keypad Used to enter numeric values
MP/GP knob Displays a line between the knob and the box. You can turn the
knob on the oscilloscope to select a value
Measurement Selection
The measurement area, displayed in the center of the application window,
TDSDVI Compliance Test Solution Printed Help Document 13

Operating Basics
Pane
Transmitter Tab
displays the measurements you can select. These measurements vary depending
on the selected tab.
Click on each of the tabs to see the different measurements and their
parameters
The application has three tabs: Transmitter, Cable and Receiver, based on the
device to be tested
Figure 3-1: Transmitter Tab
.
as shown in Figure 3-1.
Configuration parameters
If you select any measurement in the Transmitter Tab and click Configure, the
configuration parameters for the selected measurement appears. Figure 3-2 shows
the parameters you can configure for Transmitter
Figure 3-2: Transmitter Measurements Matrix
Cable Tab
The application has three tabs: Transmitter, Cable, and Receiver, based on the
device to be tested
as shown in Figure 3-3.
14 TDSDVI Compliance Test Solution Printed Help Document

Operating Basics
Figure 3-3: Cable Tab
Configuration parameters
If you select any measurement in the Cable Tab and click Configure, the
configuration parameters for the selected measurement appears. Figure 3-4 shows
the parameters you can configure for Cable.
Figure 3-4: Cable measurements matrix
Receiver Tab
The application has three tabs: Transmitter, Cable and Receiver, based on the
device to be tested
as shown in Figure 3-5.
TDSDVI Compliance Test Solution Printed Help Document 15

Operating Basics
Figure 3-5: Receiver tab
Configuration parameters
If you select any measurement in the Receiver Tab and click Configure, the
configuration parameters for the selected measurement appears. Figure 3-6 shows
the parameters you can configure for Receiver.
Figure 3-6: Receiver measurements matrix
Device Selection Tab
The device selection area is displayed above the measurement selection area of
the application. You select the device based on your test
Click on any of the tabs to display the measurements associated with it.
as shown in Figure 3-7.
Figure 3-7: Transmitter, Cable and Receiver tabs
Define Tbit Selection Area
The Define Tbit Selection Area, displayed next to the Measurement Selection
Area, helps you to define the Tbit parameters for all the measurements. You can
select the Calculated option to assign a channel for the Tx Clock and calculate
Tbit or select the User option to set a custom value. The application displays the
calculated value in the Tbit Value field
as shown in Figure 3-8.
16 TDSDVI Compliance Test Solution Printed Help Document

Figure 3-8: Define Tbit selection area
Operating Basics
Control Panel
The control panel on the right of the application displays the dual-purpose
Run/Stop button. The Run is a toggle that changes to Stop
when you run
any measurement. Table 3-2 lists the control panel options.
Figure 3-9: Control panel
Table 3-2: Control panel
Button Button Name Description
Run/Stop
Executes the selected measurement or stops
the application when the application is running.
TDSDVI Compliance Test Solution Printed Help Document 17

Operating Basics
Menus
Status Bar
The status bar is displayed at the bottom of the application window. It displays the
selected menu, related hint, and the status of the application.
Menu Bar
File Menu
The menu bar of the TDSDVI application provides access to the menus.
Figure 3-10: Application menus
Figure 3-11: File menu
Table 3-3 lists the file menu items and their descriptions.
Table 3-3: File menu items and their descriptions
Menu Selection Description
Recall Default Recalls the default settings of the application.
Save
Recall
Recently Saved Displays the recently saved setup.
Recently Recalled Displays the recently recalled setup.
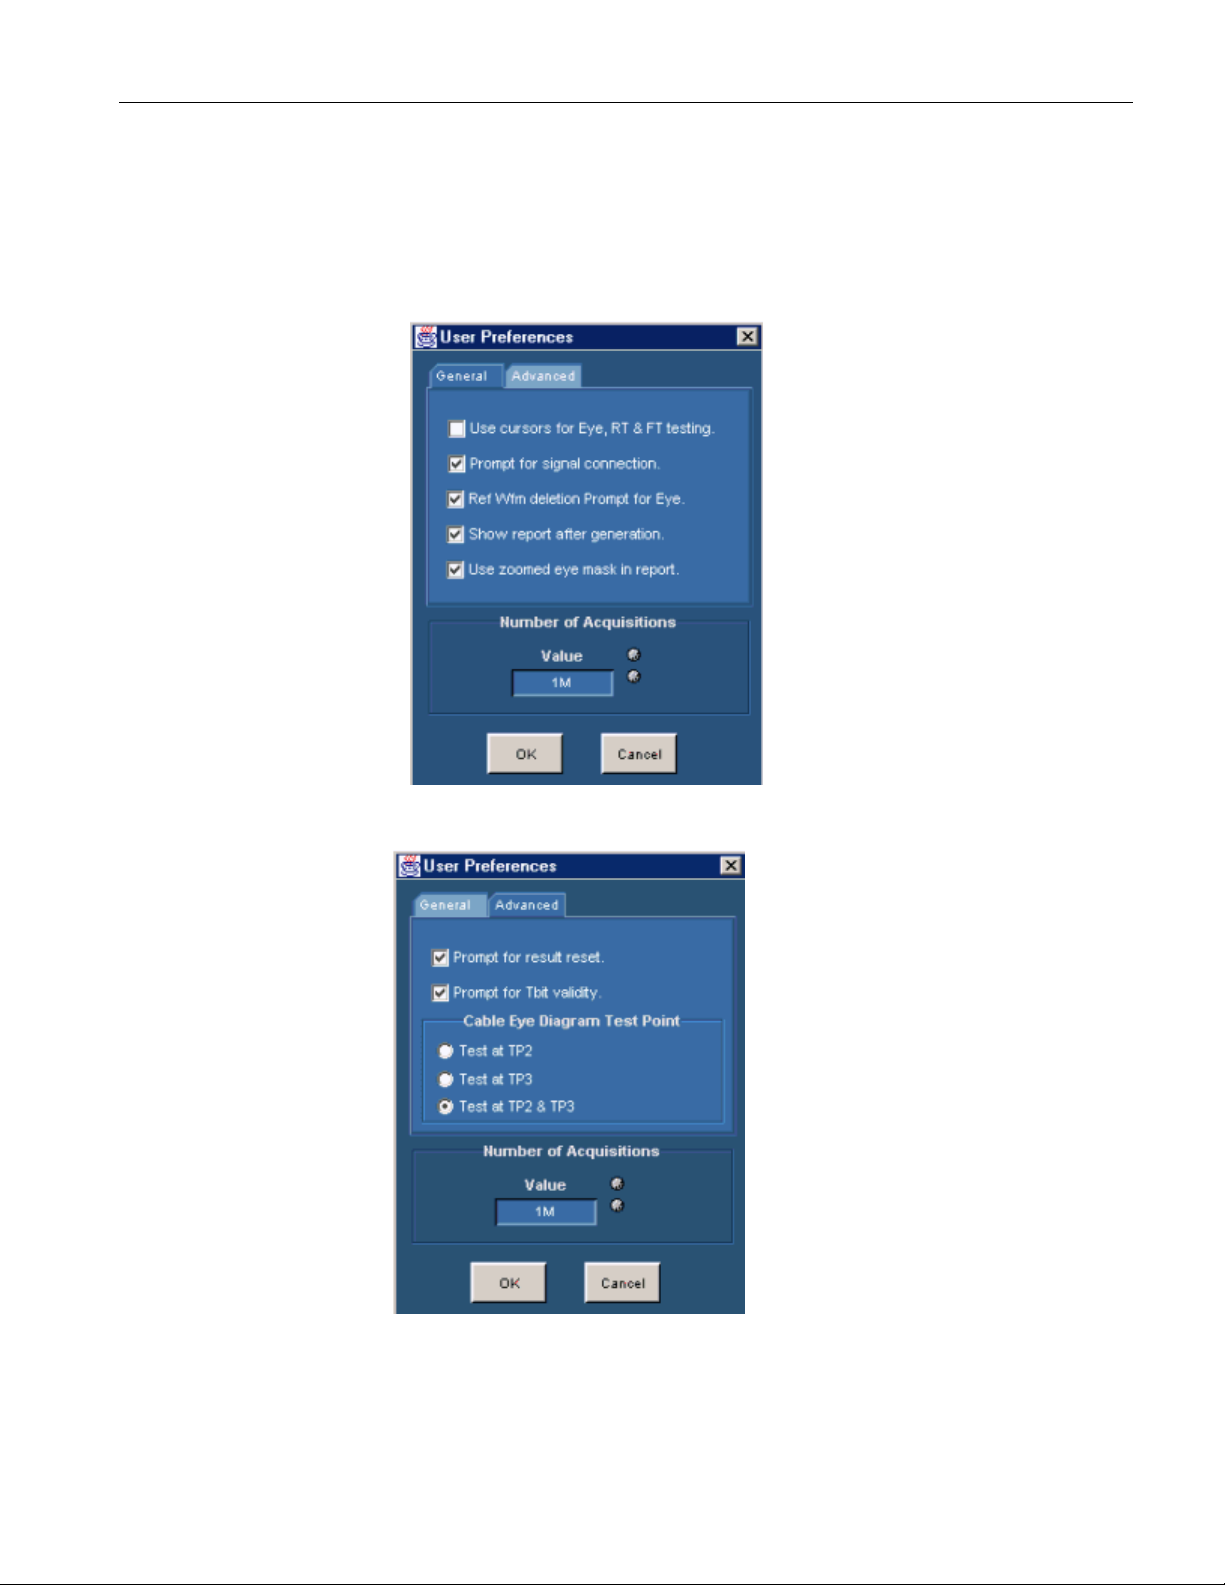
Preferences
Saves the application settings to a .ini file and the
oscilloscope settings in a .set file.
Recalls the previously saved settings of the
application from a .ini file and the oscilloscope
settings from a .set file.
Displays user preferences in two tabs.
In the General tab:
Use Cursors for Eye, RT & FT Testing
Prompt for signal connection
Ref Wfm deletion prompt for Eye Diagram
18 TDSDVI Compliance Test Solution Printed Help Document

Test
Show report after generation
Use zoomed eye mask in report
In the Advanced tab:
Prompt for result reset
Prompt for Tbit validity
Select the test points for Cable Eye Diagram
Specifies the number of acquisitions to create
Eye Diagram in the Value field. This input is
common for the General and Advanced tab
Minimize Minimizes the application window
Exit Exits the application window
Operating Basics
Measurements Menu
Figure 3-12: Measurements menu
Table 3-4 lists the measurement menu items and their descriptions.
Table 3-4: Measurement menu items and their descriptions
Menu Selection Description
Select Allows you to select the measurements to be performed.
Configure Allows you to configure the parameters for the selected
measurement.
Results Menu
Figure 3-13: Results menu
Table 3-5 lists the result menu items and their descriptions.
Table 3-5: Results menu items and their descriptions
TDSDVI Compliance Test Solution Printed Help Document 19

Operating Basics
Utilities Menu
Menu Selection Description
Result Details Displays the detailed results of the selected measurement.
Figure 3-14: Utilities menu
Table 3-6 lists the utilities menu items and their descriptions.
Table 3-6: Utilities menu items and their descriptions
Menu Selection Description
Report Generator Displays the tabs— Report Setup and Report Name— to
set the parameters for generating the reports.
Compare Results Allows you to compare the current displayed result with a
previous result from a file or two previous results from two
files.
Help Menu
Figure 3-15: Help menu
Table 3-7 lists the help menu items and their descriptions.
Table 3-7: Help menu items and their descriptions
Menu Selection Description
Topics Displays the help for TDSDVI application.
About TDSDVI
Contact Tektronix Displays a dialog box with the contact email information.
Displays a dialog box with the version number and the copyright
information about the current version of the application.
Dialog Boxes
Dialog Boxes, Panels and
20 TDSDVI Compliance Test Solution Printed Help Document
For help on specific dialog boxes, panels and windows, display the Table of
Operating Basics
Windows
Contents for this help file, and then click the following book icons to display links
to specific dialog boxes: Operating Basics>Dialog Boxes, Panels and Windows.
Preferences
File> Preferences
Figure 3-16: General tab
Figure 3-17: Advanced tab
Use this dialog box to set the user preferences in two tabs: General and
Advanced.
TDSDVI Compliance Test Solution Printed Help Document 21

Operating Basics
y
In the General tab as shown in Figure 3-16, you can:
Use cursors for Eye, RT & FT testing
Prompt for signal connection
Ref Wfm deletion prompt for Eye
Show report after generation
Use zoomed eye mask in report
In the Advanced tab as shown in Figure 3-17, you can:
Prompt for result reset
Prompt for Tbit validity
Select Cable Eye Diagram Test Point
Number of Acquisitions field is common to the General and the Advanced tab.
Table 3-8 lists the options in the General and Advanced tab.
Table 3-8: Preferences options and their descriptions
Option Action
Use Cursors for Eye, RT & FT
testing
Prompt for signal connection Displays a message box prompting you to setup the connections
Automatically enables the oscilloscope cursors to calculate the
Vswing and the worst eye opening.
The application enables the horizontal cursors to find the Vswing
value. To calculate the Vswing value:
For the E
place the cursors on the Vswing high and Vswing low of the
eye diagram
The application enables the vertical cursors to select the worst
eye opening. To select the worst eye opening:
Place the cursors at the crossover points of the worst eye
opening for the Eye Diagram measurement.
By default, the cursor option is not selected in the application.
and signal patterns when you run any measurement.
e Diagram and Rise and Fall Time measurements,
Ref Wfm deletion prompt for
Eye
Show report after generation Automatically displays the report after the report is generated.
Displays a message box prompting you to save the Ref1
waveform with previous settings in another location because
TDSDVI uses Ref1 for eye mask test and erases all the previous
contents of Ref1. This happens when you run the Eye Diagram
measurement.
22 TDSDVI Compliance Test Solution Printed Help Document

Operating Basics
p
Use zoomed eye mask in
report
Prompt for result reset Displays a message box informing you that the previous results
Prompt for Tbit validity Displays a message box informing you to check the validity of Tbit
Select Cable Eye Diagram
test point
In the generated report, the application uses the zoomed eye
diagram with the mask. This is created using the Eye Zoom
feature in Results> Result Detail> Eye zoom.
If this checkbox is not selected, the application uses the
oscilloscope screen shot of the eye diagram in the generated
report.
will be reset when you select the next measurement. This
happens when you select successive measurements.
calculation when you select any measurement and press the Run
button.
Specifies the different test points you can select like TP2, TP3 or
TP2 and TP3 to measure Cable Eye Diagram.
Note: If you have a standard signal that passes low or
high amplitude mask, advanced users do not have to
test cable at TP2 with low or high amplitude mask
every time they run the cable measurement. For this
urpose, we recommend you to select the options in
File> Preferences> Advanced> Cable Eye Diagram
Test Point.
Number of Acquisitions—
Value
Specifies the number of acquisitions to create an Eye mask. You
can use the calculator keypad
field, to enter the number of acquisitions.
DVI Test and Measurement Guide recommends one million
acquisitions to perform an Eye Diagram measurement.
For the CSA/TDS7404/B, TDS7254/TDS7254B, and TDS7704B
oscilloscopes, you can set a maximum of five million acquisitions
and a minimum of five hundred thousand.
For theTDS6604, TDS6604B, TDS6404, and TDS6804
oscilloscopes, you can set a maximum of one million and a
minimum of ten thousand.
or the GP knob next to the value
Note: Refer the topic Default Settings for more
information.
Recall Default
File> Recall Default
Figure 3-18: Recall Default message box
Use this dialog box to replace the existing settings with the default settings as
shown in Figure 3-18. Select Yes to confirm the action and No to cancel the
TDSDVI Compliance Test Solution Printed Help Document 23

Operating Basics
action. If you select Yes, the application displays the next message box as shown
in Figure 3-19.
Figure 3-19: Recall message box
If you select No, the Recall Default dialog box disappears, and the application
does not recall the default settings.
Calculator Keypad
File> Preferences> Value
Measurements> Select> Define Tbit> User> Value
Measurements> Select> Transmitter-Eye Diagram> Configure>User
Measurements> Select> Transmitter- Eye Diagram, Cable-HighAmplitude/Low-Amp Eye Diagram, Receiver-High-Amplitude/Low-Amp
Eye Diagram> Configure> Number of Eyes
Figure 3-20: Calculator keypad
Table 3-9 lists the calculator keypad options and their descriptions.
Table 3-9: Calculator keypad keys and their descriptions
Button Description
Min Automatically displays the minimum value of the selected field
Max Automatically displays the maximum value of the selected field
CLR Clears the value for the field selected and returns to zero value
BKSP Defines a backspace for the selected value
Enter Enters the value for the selected field
Esc Exits the calculator screen
pHz-MHz Defines the frequency magnitude of the selected value
24 TDSDVI Compliance Test Solution Printed Help Document

Operating Basics
To enter the values,
1. Select the Min button to display the minimum value for the selected option.
2. Select the Max button to display the maximum value for the selected option.
3. Select the CLR button to erase the previous values.
4. Select the numeric buttons to define the numeric values.
5. Select the Unit buttons to define the unit of the selected value.
6. Select the Enter button to enter the numeric values.
Virtual Keyboard
Utilities> Report Generator> Report Setup> ID, Description, Prefix
Utilities> Report Generator> Report Name> File Name
Utilities> Compare Results> Select Files to Compare, Select Destination File
Figure 3-21: virtual keyboard
Use this dialog box to enter:
Device ID
Prefix
Description
File Name
To enter values for the Device ID, Prefix, Description and File Name,
Use the keyboard to enter the data in the fields. Select the Enter button to
complete your entry as shown in Figure 3-21.
Exit
File> Exit
TDSDVI Compliance Test Solution Printed Help Document 25

Operating Basics
Figure 3-22: Exit dialog box
This dialog box appears when you exit the TDSDVI application. When you exit
the application, you can:
Restore the oscilloscope settings to their state prior to starting the application
as shown in Figure 3-22
Exit without changing the present oscilloscope settings as shown in
Figure 3-22
Table 3-10 lists the exit dialog box options and their descriptions.
Table 3-10: Exit options and their descriptions
Option Action
Yes Restores the oscilloscope settings to their original state values prior to
starting the application and exits.
No Exits the application without changing the present oscilloscope
settings.
Cancel Cancels exiting the application.
26 TDSDVI Compliance Test Solution Printed Help Document

Operating Basics
Result Detail
Results> Result Detail
Figure 3-23: Result Details for Transmitter Eye Diagram
Use this dialog box to display the result Details and Statistics for the selected
measurement as shown in Figure 3-23. The Statistics information is available
only for the following measurements:
Transmitter Rise and Fall Time
Transmitter/Cable Intra-Pair Skew
Transmitter/Cable Inter-Pair Skew
Table 3-11 lists the sample result details for Transmitter Eye Diagram their
descriptions.
Table 3-11: Result details options and their descriptions
Option Description
Details tab
Status The status of the measurement: Pass or Fail.
Parameter The calculated parameters for the measurement.
Value The result parameters with the values.
Compare Result The option to compare results from two different results.
Eye Zoom The option to view a zoomed eye mask only for Eye diagram
measurement.
TDSDVI Compliance Test Solution Printed Help Document 27

Operating Basics
Report Generator
Generate Report The option to generate a report.
Utilities> Report Generator
Figure 3-24: Report Setup tab
Figure 3-25: Report Name tab
Use this dialog box to specify— the Report Setup as shown in Figure 3-24 and
the Report Name information and generate reports as shown in Figure 3-25.
28 TDSDVI Compliance Test Solution Printed Help Document

Operating Basics
A
Table 3-12 lists the report generator options their descriptions.
Table 3-12: Report generator options and their descriptions
Option Description
Report Setup Tab
ID
Description
Automatic IDs and Report
Names
Prefix
Mode
Defined
Specifies the device ID. You can use the virtual keyboard and
enter the device ID or type the data in the field and press Enter.
Specifies the test device description for which the report is to be
generated. You can use the virtual keyboard next to the
description field to enter the device description.
Generates and specifies the device ID and the report names
automatically, if the check box is selected. The ID field is disabled
if you select this option. Select the check box before you run the
measurement.
Displays the specified prefix of the device. This field is enabled,
only if you select the Automatic mode of report generation. You
can use the virtual keyboard to enter the device prefix or key in
the data in the field and press Enter.
Displays the Manual or the Automatic mode of report generation.
If you select the Manual mode, the Prefix field is disabled and you
have to enter the device ID and description. If you select the
utomatic mode, the Device ID field is disabled and the Automatic
ID's and Report Names check box is selected. The application
then generates a report with its naming conventions without user
intervention.
You can also check or uncheck the Automatic Device ID's and
Report Names for the Manual and the Automatic modes.
Specifies the clock frequency values automatically when you
define and calculate Tbit.
Displays the selected resolution and refresh rate in the generated
Select for Report
Resolution
Refresh Rate
Generate
report.
Displays the Resolution and Refresh Rate values as per the
VESA standard. Use the drop-down arrow in the Resolution and
Refresh Rate fields to set the values. Refer the topic, Reference>
Resolutions for more information on the available resolutions.
Generates an .html report for the selected measurement. If you
select the Automatic mode, this button is disabled.
Report Name Tab
TDSDVI Compliance Test Solution Printed Help Document 29

Operating Basics
Directory
Browse
File Name
Generate
Displays the directory location of the generated report.
Browses to the directory location.
Displays the file name of the report generated. Use the virtual
keyboard to enter the file name or type the data in the field. If you
select the Automatic mode, this field is disabled.
Generates an .html report for the selected measurement. If you
select the Automatic mode, this button is disabled.
To generate a report:
1. Select Utilities> Report Generator.
2. In the ID field, use the virtual keypad to enter the device ID.
3. In the Description field, use the virtual keypad to enter the device
description.
4. Select Automatic IDs and Report Names check box, if you want the
application to generate a device ID and report names automatically.
Note: Select the Automatic IDs and Report Names check box before you run the
measurement.
5. In the Prefix field, use the virtual keypad to enter the device prefix.
6. Select the Manual mode to generate report manually and the Automatic
mode if you want the application to generate the report automatically.
7. The Defined field automatically displays the predefined clock frequency
values when you define and calculate Tbit.
8. Select the Select for Report checkbox, if you want the resolution and refresh
rate values to generate the report.
9. Use the drop-down arrow in the Resolution and Refresh Rate field to set the
values according to the VESA standard.
10. In the Report Name tab, select the Browse button to browse the directory
location.
11. In the File Name field, use the virtual keypad to enter the file name. Select
the Generate button display an .html report.
Note: From this screen, you can use the Results button to view the results and the
Compare Results option to compare results of two different devices.
30 TDSDVI Compliance Test Solution Printed Help Document

Operating Basics
Eye Zoom
Results> Result Detail> Eye zoom
Figure 3-26: Zoomed eye
Use this dialog box shown in Figure 3-26 to:
Display the zoomed worst eye opening with the mask
Use the cross haired cursors to find specific failed points and display their
respective voltage and time values
Mark the failed data points in the eye mask to find specific failed points with
markers. Markers are small red boxes that surround the failed points
Identify the failed points in red and the pass points in yellow
Save the eye mask for future reference to the default directory
C:\TekApplications\TDSDVI\Images or any other directory of your choice
Identify the Hit Counts, Test Status and Statistical information of the eye
diagram
To enable the Cursor or the Marker option:
1. Select the ON button next to the cursor or marker option to enable cursors or
markers. The X axis of the cursor represents Time and the Y axis represents
Voltage. You can drag the cursor and position them anywhere on the eye
mask.
2. Select the OFF button next to the cursor or the marker option to disable the
cursors or the markers.
TDSDVI Compliance Test Solution Printed Help Document 31

Operating Basics
To save the zoomed eye mask:
Select the Save button to save the mask in .jpg format to the default directory
C:\TekApplications\TDSDVI\Images or any other directory of your choice.
You cannot save the image when the measurement is running.
Table 3-13 lists the eye zoom options and their descriptions.
Table 3-13: Eye zoom options and their descriptions
Option Description
Cursor Values Displays the cursor positions with reference to Voltage in volts and Time
in seconds.
Hit Counts Displays the number of data points in the fail zone. With reference to the
previous figure, they are:
Upper: upper eye mask
Middle: middle eye mask
Lower: lower eye mask
Status Displays the status of the test: Pass or Fail
Details Displays the result details for the zoomed eye mask
Compare Results
Results> Compare Results
Figure 3-27: Compare results pane
Use this dialog box as shown in Figure 3-27 to compare either:
The current results with results that are stored in a html file
Results that are stored in two different html files
The Current Vs File option displays two fields where you can enter:
The file name to be compared with the currently displayed results
The file name in which the compared results will be stored
32 TDSDVI Compliance Test Solution Printed Help Document

Operating Basics
The File Vs File option displays three fields where you can enter:
The names of the html files to be compared
The name of the html file where the compared results will be stored
Figure 3-28 lists the result combinations you can compare:
Figure 3-28: Result comparison matrix
To compare the current result with a stored result:
1. In the Select File(s) to compare Result field, select the Current Vs File
option, and use the popup keyboard to enter the file name or use the browse
button to browse for the file. You can also enter the file name directly in the
field and press Enter.
TDSDVI Compliance Test Solution Printed Help Document 33

Operating Basics
2. In the Select Destination File field, use the popup keyboard to enter the
compared result file name or use the browse button to browse the file.
3. Select the Compare button to complete the process.
To compare results stored in two different files:
1. In the Select File(s) to compare Result fields, select File Vs File option,
and use the popup keyboard to enter the file names or use the browse button
to browse the file. You can also enter the file name directly in the field and
press Enter.
2. In the Select Destination File field, use the popup keyboard to enter the
name of the destination where you want to store the compared results or use
the browse button to browse the file. You can also enter the file name
directly in the field and press Enter.
3. Select the Compare button to complete the process and display the
compared report as shown in Figure 3-29.
34 TDSDVI Compliance Test Solution Printed Help Document

Operating Basics
:
Figure 3-29: Compared results
TDSDVI Compliance Test Solution Printed Help Document 35

Operating Basics
Eye Trends in TDS6604,
TDS6404, TDS6604B, and
TDS6804B Oscilloscopes
Table 3-14 lists the compare result options and their descriptions.
Table 3-14: Compare results options and their descriptions
Option Description
Current Vs File Compares the current results with the results already stored in a file.
File Vs File Compares the results stored in two different files.
Results Displays the results panel for the selected measurement.
Generate Report Displays the generate report panel for the selected measurement.
Compare Compares the results based on the type selected.
Results> Result Detail> Eye Trend
Use this dialog box to:
Display the eye progression as shown in Figure 3-30
Display the Vertical and Horizontal trends of the eye diagram parameters such as
Mask, Vswing, Overshoot, Undershoot, Tbit, Worst Tbit, Hopen and Vopen as
shown in Figure 3-30
36 TDSDVI Compliance Test Solution Printed Help Document

Operating Basics
Figure 3-30: Eye trends in TDS6000 series oscilloscopes
To view the Eye Diagram Trends,
1. Select the Eye Zoom button to display the zoomed eye mask or press the
Eye Trend button in the results panel.
2. Select the Go to Trend button to display the Vertical and Horizontal trends
as shown in the next screen.
The TDS6604, TDS6404, TDS6604B, and TDS6804B oscilloscopes do not
support FastAcq mode for gathering one million acquisitions, which is
recommended for DVI compliance. The Eye-Trends feature on the TDS6604,
TDS6404, TDS6604B, and TDS6804B oscilloscopes helps you to monitor eye
formation and also look at the trends for important parameters, such as, Tbit,
Hopen, Vopen, Worst Tbit, Overshoot and Undershoot. You can effectively test
for DVI compliance by selecting a lower number of acquisitions. The Eye Trend
begins with a minimum of 10K acquisitions to display the progression of the eye
mask test in two trends, Vertical and Horizontal, in intervals of 30 seconds.
In Vertical Trend, the X axis represents the Number of Acquisitions and the Y
axis represents Vopen in Volts. The Vertical Trend also displays Vopen,
Overshoot, Undershoot and Vswing statistical results.
In Horizontal Trend, the X axis represents the Number of Acquisitions and the
Y axis represents Hopen in seconds. The Horizontal Trend also displays the
Horizontal Opening, Crossover points, Worst Tbit and Tbit.
Select the Zoom button to view the zoomed eye mask. Figure 3-31 is a pictorial
representation of the eye diagram parameters.
TDSDVI Compliance Test Solution Printed Help Document 37

Operating Basics
g
Figure 3-31: Eye definitions
Table 3-15 lists the eye trend options and their descriptions.
Table 3-15: Eye trend options and their descriptions
Option Description
Mask Is a set of polygons called mask segments that appears on the
oscilloscope screen. If the waveform violates any one of the mask
segment, the measurement fails the test; if the waveform does not violate
any one of the mask segment, the measurement passes the test.
Overshoot The voltage difference between the peak (positive or negative) and the
normalized level (Vswing Low or Vswing High) in the eye mask.
Undershoot The voltage difference between the minimum high level voltage or the
maximum low level volta
level (Vswing Low or Vswing High) in the eye mask.
Vswing The voltage difference between the normalized high and low levels of the
eye diagram.
e after the transition and the normalized voltage
38 TDSDVI Compliance Test Solution Printed Help Document

Operating Basics
Tbit The time taken to transmit one bit of data.
Worst Tbit The minimum distance between two consecutive crossover points in the
eye diagram.
Crossover The intersection or the overlapping of the rising and falling edges in a eye
diagram.
To display the trend statistics table:
Select the View button to display the Statistics table as shown in Figure 3-32.
Figure 3-32: Eye trends statistical table
Table 3-16 lists the statistical table and their descriptions.
Table 3-16: Eye Trend-Statistics options and their descriptions
Option Description
Acqs No The number of acquisitions.
Worst Tbit The minimum distance between two consecutive crossover points.
Hopen The maximum horizontal opening between the closest hit points.
Vopen The maximum vertical opening between the closest hit points.
Overshoot
(Top and Bottom)
Undershoot
(Top and Bottom)
The voltage difference between the peak (positive or negative) and the
normalized level (Vswing Low or Vswing High) in the eye mask.
The voltage difference between the minimum high level voltage or the
maximum low level voltage after the transition and the normalized voltage
level (Vswing Low or Vswing High) in the eye mask.
TDSDVI Compliance Test Solution Printed Help Document 39

Operating Basics
Status The results of the selected measurement as Pass or Fail.
Transmitter, Cable, Receiver Screen Interface
About Transmitter, Cable,
and Receiver
The application tests the signals for three types of devices: Transmitter, Cable and
Receiver.
Transmitter: Is a device that transmits DVI signals.
Cable: Is a medium that transmits DVI signals from a transmitter to a
receiver.
Receiver: Is a device that receives DVI signals.
These devices are grouped into three tabs and have different measurements
associated with them.
Transmitter Eye Diagram Screen Interface
Transmitter Eye Diagram
Pane
Before using the application, set up the DUT as given in Application Examples>
Transmitter-Eye Diagram> Equipment
Select the Transmitter tab and click on the Eye Diagram measurement to display
the following screen.
setup on page 134.
Figure 3-33: Eye Diagram pane
Configuration parameters for Eye Diagram
40 TDSDVI Compliance Test Solution Printed Help Document

Operating Basics
Select the Eye Diagram measurement and click the Configure button to display
the configuration parameters for the Transmitter Eye Diagram measurement.
Figure 3-34: Eye Diagram Configuration
Select Source
Figure 3-35: Select source
Use the drop-down arrow in the Data combo box to select the data source
channel. The available selections are: Ch1 to Ch4. The application requires a
recovered clock as an external trigger source to the oscilloscope. Use the dropdown arrow in the Trigger combo box to set the trigger source channel. The
Data and Trigger sources are mutually exclusive. The Data and Trigger fields
identify the data source and the external clock source.
Note: You cannot select the same channel for Data and Trigger.
Select Pair
TDSDVI Compliance Test Solution Printed Help Document 41

Operating Basics
Figure 3-36: Select pair
Use the drop-down arrow in the Select Pair combo box to set the data pair. The
available data pairs are:
RX0
RX1
RX2
Select the data pair from which you have probed the TPA-P fixture.
Number of Eyes
Figure 3-37: Number of eyes
Use the GP knob or the calculator keypad
minimum number of eyes considered to find the worst eye opening in
Transmitter, Cable or Receiver Eye measurements. The application then
positions the eye mask on the worst opening eye.
You can set a minimum of two eyes to place the mask on the worst eye opening
because the DVI specifications recommends at least two eyes to conduct the eye
diagram test.
To analyze the pixels, you can set a maximum of ten eyes because each data
pixel has 10 bits. The application analyzes these eyes and places the mask at the
worst eye opening.
next to the Value field, to set the
42 TDSDVI Compliance Test Solution Printed Help Document

Operating Basics
Calculate Vswing
Figure 3-38: Calculate Vswing
Select the Pattern button to indicate the pattern you are using to calculate
Vswing. The available patterns are: Pseudo Random Pattern (PRP) or Half
Clock Pattern (HCP). If you select the User option, use the pop-up keypad in
the Value field to enter the Vswing values. The range of the Vswing value is
200 millivolts to 2 volts. The application uses the Vswing value to calculate the
eye mask coordinates in Eye diagram measurement and the reference level in
Rise Time and Fall Time measurement.
To calculate Vswing:
Select Pseudo Random Pattern or Half Clock from the drop-down list. To
calculate Vswing accurately, we recommend you to use only the Half Clock
Pattern because the HCP signal has less ringing compared to the PRP signal.
If you select the Half Clock option, the application prompts you to connect the
HCP and calculate the Vswing using the HCP signal.
Select User option. In the Value field, use the calculator keypad to enter the
Vswing values. The minimum value is 200 millivolts and the maximum is 2
volts. The default value is 400 mV.If you are using this option, the application
will not use a signal to calculate the Vswing.
Transmitter Rise and Fall Time Screen Interface
Transmitter Rise and Fall
Time Pane
Before using the application, set up the DUT as given in Application Examples>
Transmitter-Rise and Fall Time> Equipment
According to the DVI specifications, Rise and Fall Time is defined as the time
interval between the normalized 20% and 80% amplitude level of the TMDS
(Transition Minimized Differential Signal) signal.
Set up on page 137
TDSDVI Compliance Test Solution Printed Help Document 43
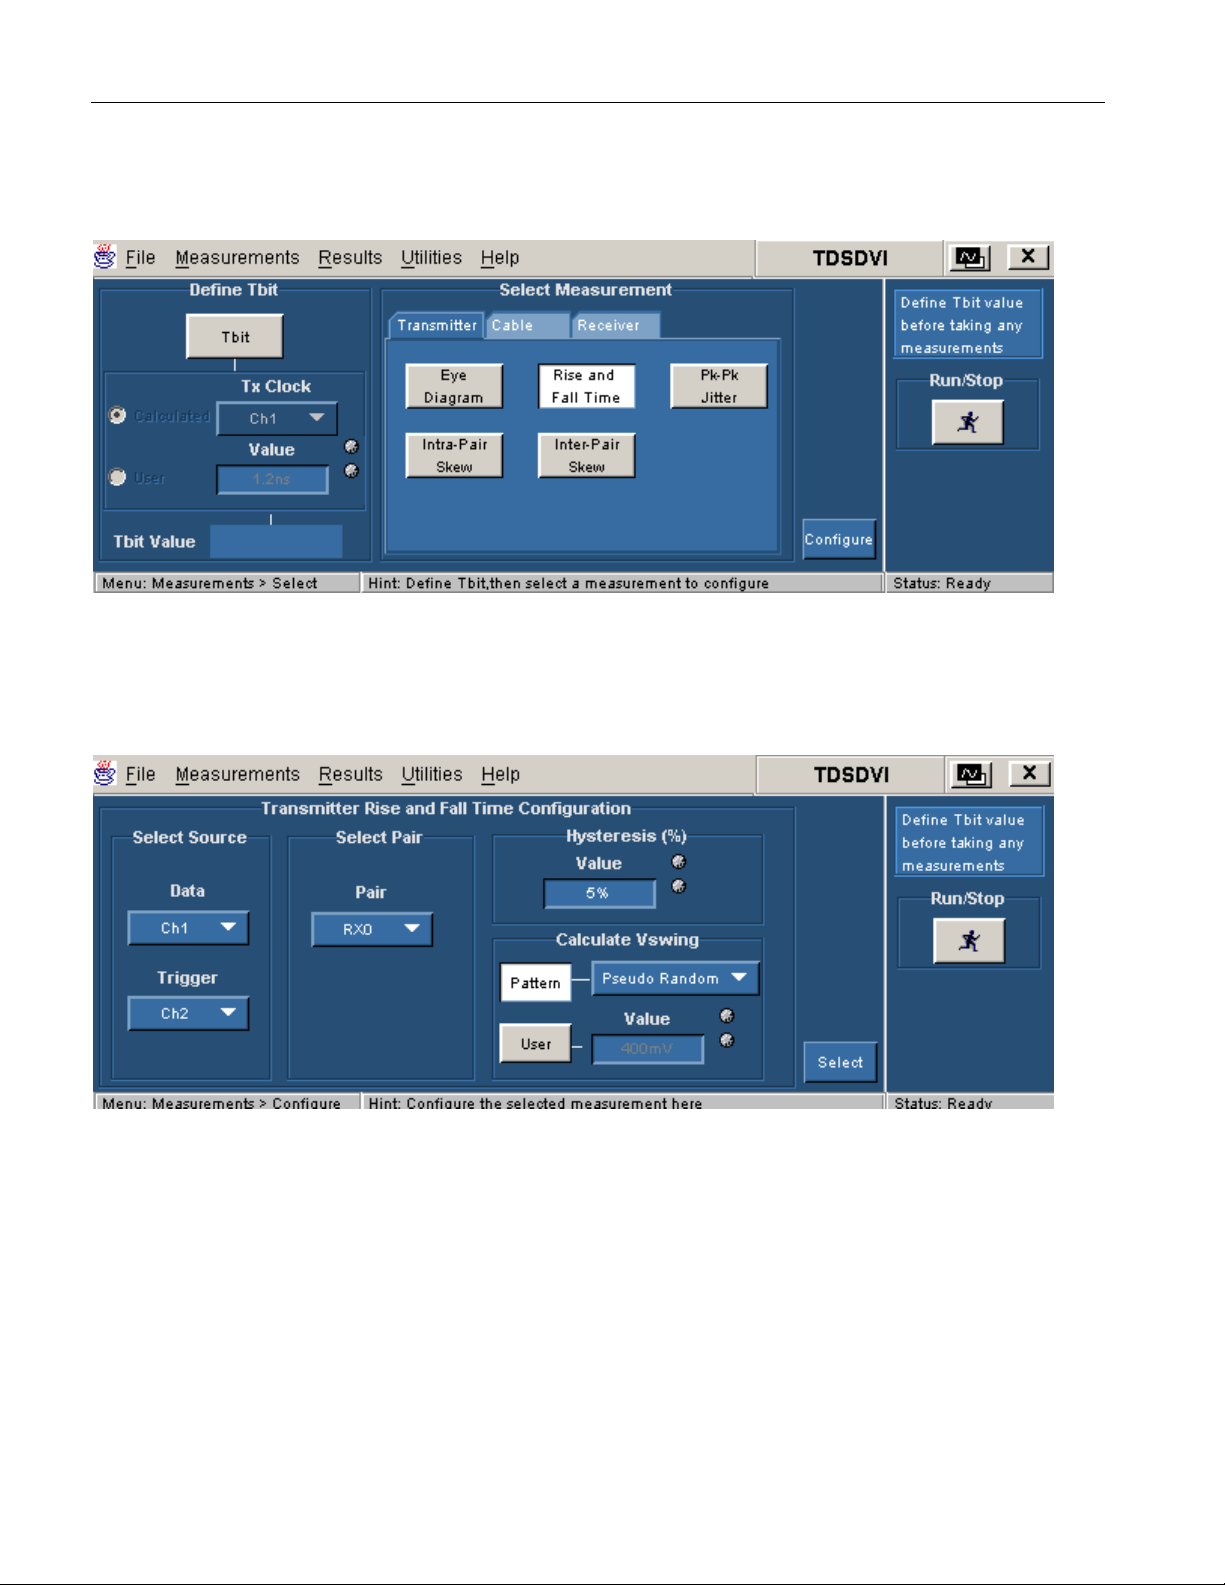
Operating Basics
Select the Transmitter tab and click on the Rise and Fall Time measurement to
display the following screen.
Figure 3-39: Rise and Fall Time pane
Configuration parameters for Rise and Fall Time
Select Rise and Fall Time measurement and select the Configure button to
display the configuration parameters for Rise and Fall Time measurement.
Figure 3-40: Rise and Fall Time configuration
44 TDSDVI Compliance Test Solution Printed Help Document

Operating Basics
Select Source
Figure 3-41: Select Source
Use the drop-down arrow in the Data combo box to select the data source
channel. The available selections are: Ch1 to Ch4.The application requires a
recovered clock as an external trigger source to the oscilloscope. Use the dropdown arrow in the Trigger combo box to set the trigger source channel. The
Data and Trigger sources are mutually exclusive.
The Data and Trigger fields identify the data source and the external clock
source.
Note:You cannot select the same channel for Data and Trigger.
Select Pair
Figure 3-42: Select Pair
Use the drop-down arrow in the Select Pair combo box to set the data pair. The
available data pairs are:
RX0
RX1
RX2
Select the data pair from which you have probed the TPA-P fixture.
TDSDVI Compliance Test Solution Printed Help Document 45

Operating Basics
Hysteresis
Use the GP knob or the calculator keypad
hysteresis percentage value. The hysteresis range is 2% to 10%.
Figure 3-43: Hysteresis
next to the Value field to enter the
Calculate Vswing
Figure 3-44: Calculate Vswing
Select the Pattern button to indicate the pattern you are using to calculate
Vswing. The available patterns are: Pseudo Random Pattern (PRP) or Half
Clock Pattern (HCP). If you select the User option, use the pop-up keypad in
the Value field to enter the Vswing values. The range of the Vswing value is
200 millivolts to 2 volts. The application uses the Vswing value to calculate the
eye mask coordinates in Eye diagram measurement and the reference level in
Rise Time and Fall Time measurement.
To calculate Vswing:
Select Pseudo Random Pattern or Half Clock from the drop-down list. To
calculate Vswing accurately, we recommend you to use only the Half Clock
Pattern because the HCP signal has less ringing compared to the PRP signal.
If you select the Half Clock option, the application prompts you to connect the
HCP and calculate the Vswing using the HCP signal.
Select User option. In the Value field, use the calculator keypad to enter the
Vswing values. The minimum value is 200 millivolts and the maximum is 2
volts. The default value is 400 mV. If you are using this option, the application
will not use a signal to calculate the Vswing.
46 TDSDVI Compliance Test Solution Printed Help Document

Transmitter Pk-Pk Jitter Screen Interface
Operating Basics
Transmitter Pk-Pk Jitter
Pane
Before using the application, set up the DUT as given in Application Examples>
Transmitter-Pk-Pk Jitter> Equipment
Select the Transmitter tab and click on the Pk-Pk Jitter measurement to display
the following screen.
Setup on page 140.
Figure 3-45: Pk-Pk Jitter pane
Configuration parameters for Pk-Pk Jitter
Select the Pk-Pk Jitter measurement and press the Configure button to display
the configuration parameters for the Pk-Pk Jitter measurement.
Figure 3-46: Pk-Pk Jitter configuration
TDSDVI Compliance Test Solution Printed Help Document 47

Operating Basics
Select Source
Figure 3-47: Select Source
Use the drop-down arrow in the Tx Clock combo box to select the transmitted
differential clock source channel. The available selections are: Ch1 to Ch4. The
application requires a CRU (Clock Recovery Unit) to trigger the oscilloscope.
Use the drop-down arrow in the Trigger combo box to set the trigger source
channel. Data and Trigger source are mutually exclusive.
The Tx Clock and Trigger fields identify the Tx clock source and the Clock
Recovery Unit source.
Note: You cannot select the same channel for Tx clock and Trigger.
Transmitter Intra-Pair Skew Screen Interface
Transmitter Intra-Pair Skew
Pane
Before using the application, set up the DUT as given in Application Examples>
Transmitter-Intra-Pair Skew> Equipment
Intra-Pair skew is the Skew between the signal that constitutes from the same
pair (Example Rx0+ and Rx0-) at TP2.
Select the Transmitter tab and click on Intra-Pair Skew measurement to display
the following screen.
Configuration parameters for Intra-Pair Skew
Select the Intra-Pair Skew measurement and press the Configure button to
display the configuration parameters for the Intra-Pair Skew measurement.
Setup on page 150.
48 TDSDVI Compliance Test Solution Printed Help Document

Figure 3-48:Intra-Pair Skew configuration
Operating Basics
Select Source
Figure 3-49: Select Source
Use the drop-down arrow in the Source1 combo box to set the data line (+) of the
data pair. The available selections are: Ch1 to Ch4. Use the drop-down arrow in
the Source2 combo box to set the data line (-) of the data pair. The Source
channels are mutually exclusive. Use two single-ended probes to connect the data
pair (for example: Rx0+ or Rx0-) to Source1 and Source2.
The Source field identifies a data line.
Note: You cannot select the same channel for Source1 and Source2.
TDSDVI Compliance Test Solution Printed Help Document 49
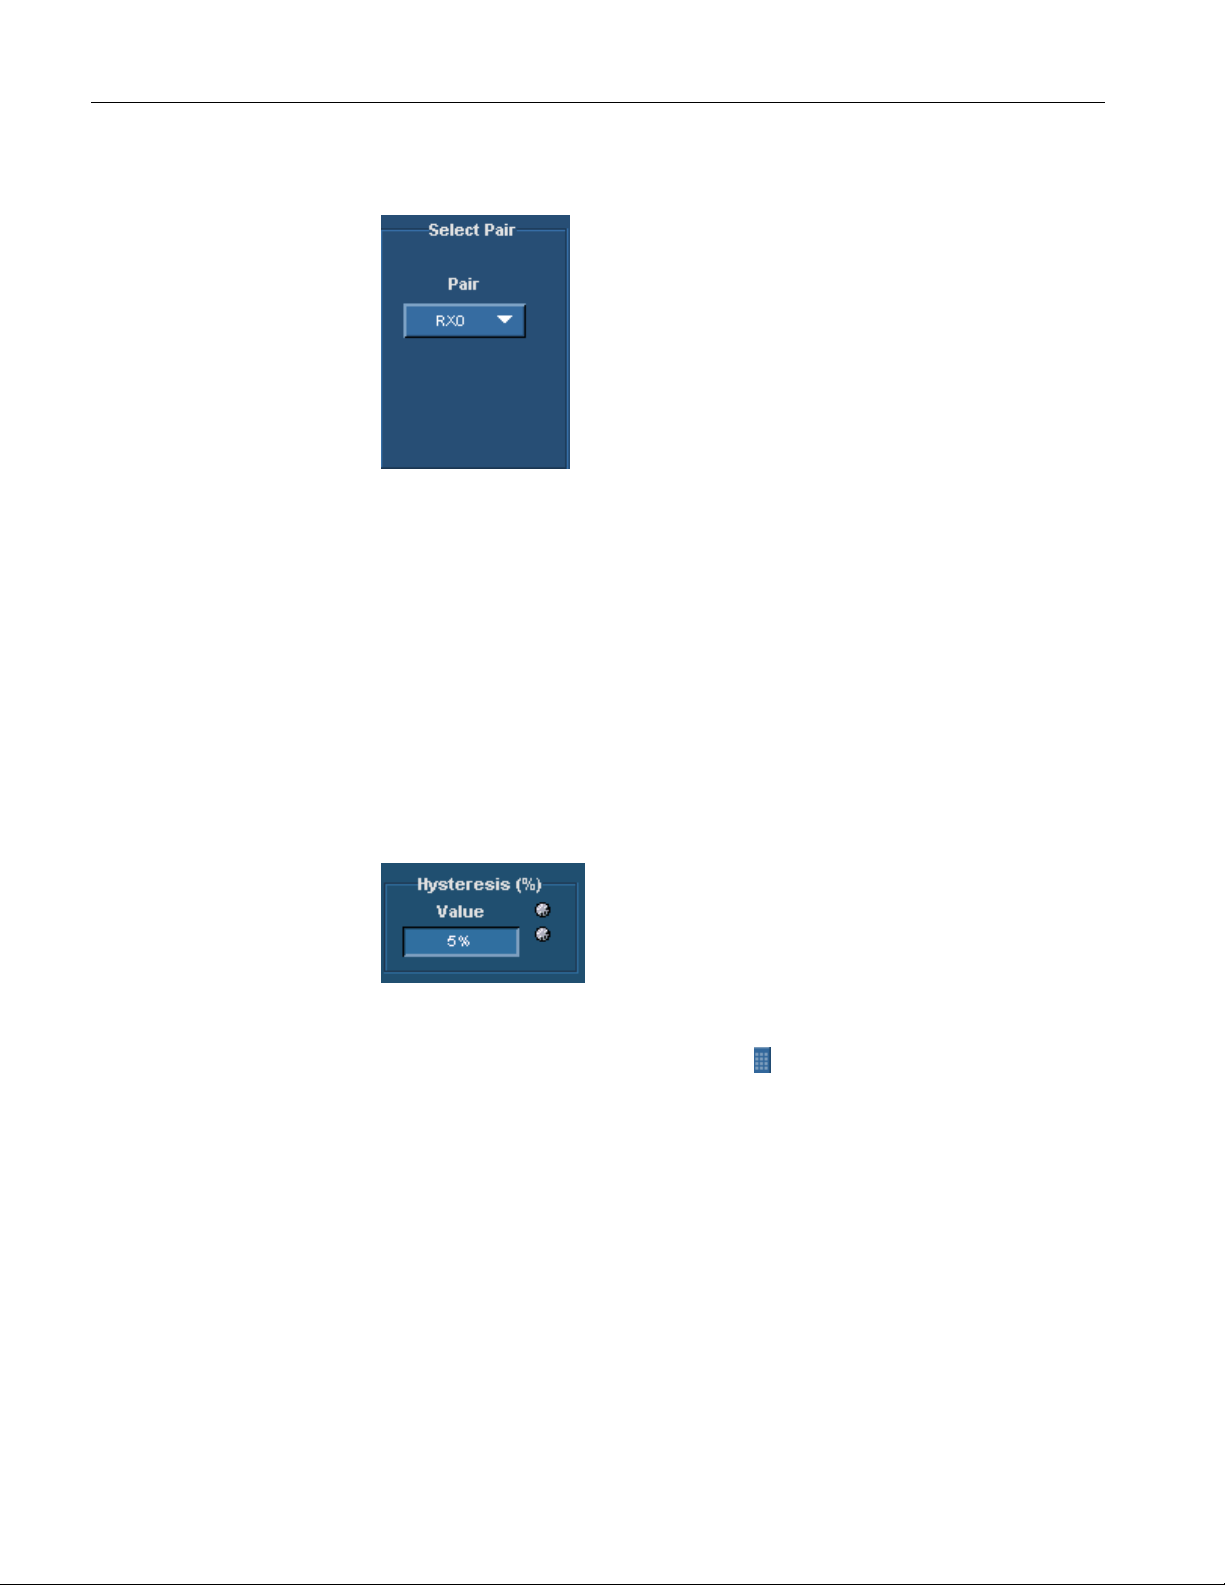
Operating Basics
Select Pair
Figure 3-50: Select Pair
Use the drop-down arrow in the Select Pair combo box to set the data pair. The
available data pairs are:
RX0
RX1
RX2
Select the data pair to which you have probed the TPA-P fixture for Transmitter
device and TPA-R fixture for a Cable and Receiver device.
Hysteresis
Figure 3-51: Hysteresis
Use the GP knob or the calculator keypad
hysteresis percentage value.
The hysteresis range is 2% to 10%.
Transmitter Inter-Pair Skew Screen Interface
Transmitter Inter-Pair Skew
Pane
Before using the application, set up the DUT as given in Application Examples>
Transmitter-Inter-Pair Skew> Equipment Setup on page 146.
Inter-pair skew is the time delay between the different data pairs (Example Rx0+
of one pair and Rx1- of the other pair).
next to the Value field to enter the
50 TDSDVI Compliance Test Solution Printed Help Document

Operating Basics
Select the Transmitter tab and click on the Inter-Pair Skew measurement to
display the following screen.
Figure 3-52: Inter-Pair Skew pane
Configuration parameters for Inter-Pair Skew
Select the Inter-Pair Skew measurement and press the Configure button to
display the configuration parameters for the Inter-Pair Skew measurement.
Figure 3-53: Inter-Pair Skew configuration
TDSDVI Compliance Test Solution Printed Help Document 51

Operating Basics
Select Source
Figure 3-54: Select Source
Use the drop-down arrow in the Source1 combo box to set the data line (+) of the
data pair. The available selections are: Ch1 to Ch4. Use the drop-down arrow in
the Source2 combo box to set the data line (-) of the data pair. The Source
channels are mutually exclusive. Use two single-ended probes to connect the data
pair (for example: Rx0+ or Rx0-) to Source1 and Source2.
Select Pair
The Source field identifies a data line.
Note: You cannot select the same channel for Source1 and Source2.
Figure 3-55: Select Pair
Use the drop-down arrow in the Pair1 and Pair2 combo box to set the
differential data pair. The available data pairs are:
RX0
RX1
RX2
52 TDSDVI Compliance Test Solution Printed Help Document

Operating Basics
If the data line is positive, select the check box next to the Pair fields. If you
select the Differential Probe check box, the positive check boxes next to the pair
fields are disabled and the application calculates the time delay between the two
data pairs. If you used a single-ended probe, the application calculates the skew
between the data lines.
Select the data pair from which you have probed the TPA-P fixture. You cannot
select the same data pair in the Pair1 and Pair2 combo boxes irrespective of the
polarity (+ or -).
Hysteresis
Figure 3-56: Hysteresis
Use the GP knob or the calculator keypad
hysteresis percentage value.
The hysteresis range is 2% to 10%.
next to the Value field to enter the
Cable High-Amplitude/Low Amplitude Eye Diagram Screen Interface
Cable High-Amplitude Eye
Diagram Pane
Before using the application, set up the DUT as given in Application Examples>
Cable-High-Amplitude/Low Amplitude Eye Diagram > Equipment
page 155
.
Setup on
Select the Cable tab and click on the High-Amp Eye Diagram measurement to
display the following screen.
TDSDVI Compliance Test Solution Printed Help Document 53

Operating Basics
Figure 3-57: High-Amplitude Eye Diagram pane
Configuration parameters for Eye
Select the High-Amplitude Eye Diagram measurement and press the Configure
button to display the configuration parameters for High-Amplitude Eye
Diagram measurement.
Figure 3-58: High-Amplitude Eye Diagram configuration
Cable Low-Amplitude Eye
Diagram Pane
Before using the application, set up the DUT as given in Application Examples>
Transmitter-Eye Diagram> Equipment
Select the Cable tab and click on the Low-Amp Eye Diagram measurement to
display the following screen.
Setup on page 155.
54 TDSDVI Compliance Test Solution Printed Help Document

Operating Basics
Figure 3-59: Low-Amplitude Eye Diagram pane
Configuration parameters for Low-Amplitude Eye Diagram
Select the Low-Amplitude Eye Diagram measurement and press the Configure
button to display the configuration parameters for Low-Amplitude Eye
Diagram measurement.
Figure 3-60: Low-Amplitude Eye Diagram configuration
TDSDVI Compliance Test Solution Printed Help Document 55

Operating Basics
Select Source
Figure 3-61: Select Source
Use the drop-down arrow in the Data combo box to select the data source
channel. The available selections are: Ch1 to Ch4.The application requires a
recovered clock as an external trigger source to the oscilloscope. Use the dropdown arrow in the Trigger combo box to set the trigger source channel. The
Data and Trigger sources are mutually exclusive.
The Data and Trigger fields identify the data source and the external clock
source.
Note: You cannot select the same channel for Data and Trigger.
Select Pair
Figure 3-62: Select Pair
Use the drop-down arrow in the Select Pair combo box to set the data pair. The
available data pairs are:
RX0
RX1
RX2
Select the data pair to which you have probed the TPA-P fixture for Transmitter
device and TPA-R fixture for a Cable and Receiver device.
56 TDSDVI Compliance Test Solution Printed Help Document

Operating Basics
Number of Eyes
Figure 3-63: Number of Eyes
Use the GP knob or the calculator keypad
minimum number of eyes considered to find the worst eye opening in
Transmitter, Cable or Receiver Eye measurements. The application then
positions the eye mask on the worst opening eye.
You can set a minimum of two eyes to place the mask on the worst eye opening
because the DVI specifications recommends at least two eyes to conduct the eye
diagram test.
To analyze the pixels, you can set a maximum of ten eyes because each data
pixel has 10 bits. The application analyzes these eyes and places the mask at the
worst eye opening.
next to the Value field, to set the
Cable Pk-Pk Jitter Screen Interface
Cable Pk-Pk Jitter Setup
Pane
Before using the application, set up the DUT as given in Application Examples>
Cable-Pk-Pk Jitter> Equipment
Select the Cable tab and click on the Pk-Pk Jitter measurement to display the
following screen.
Figure 3-64: Pk-Pk Jitter pane
Setup on page 149.
Configuration parameters for Pk-Pk Jitter
TDSDVI Compliance Test Solution Printed Help Document 57

Operating Basics
Select Source
Select the Pk-Pk Jitter measurement and press the Configure button to display
the configuration parameters for the Pk-Pk Jitter measurement.
Figure 3-65: Pk-Pk Jitter configuration
Figure 3-66: Select Source
Use the drop-down arrow in the Tx Clock combo box to select the transmitted
differential clock source channel. The available selections are: Ch1 to Ch4. The
application requires a CRU (Clock Recovery Unit) to trigger the oscilloscope.
Use the drop-down arrow in the Trigger combo box to set the trigger source
channel. Data and Trigger source are mutually exclusive.
The Tx Clock and Trigger fields identify the Tx clock source and the Clock
Recovery Unit source.
Note: You cannot select the same channel for Tx clock and Trigger.
58 TDSDVI Compliance Test Solution Printed Help Document

Cable Intra-Pair Skew Screen Interface
Operating Basics
Cable Intra-Pair Skew
Setup Pane
Before using the application, set up the DUT as given in Application Examples>
Cable-Intra-Pair Skew> Equipment
Cable Intra-Pair skew is the skew between the signal that constitutes from the
same pair (Example Rx0+ and Rx0-) at TP3.
Select the Cable tab and click on the Intra-Pair Skew measurement to display the
following screen measurement.
Setup on page 150.
Figure 3-67: Intra-Pair Skew pane
Configuration parameters for Intra-Pair Skew
Select the Intra-Pair Skew measurement and press the Configure button to
display the configuration parameters for the Intra-Pair Skew measurement.
Figure 3-68: Intra-Pair Skew Configuration
TDSDVI Compliance Test Solution Printed Help Document 59

Operating Basics
Select Source
Figure 3-69: Select Source
Use the drop-down arrow in the Source1 combo box to set the data line (+) of the
data pair. The available selections are: Ch1 to Ch4. Use the drop-down arrow in
the Source2 combo box to set the data line (-) of the data pair. The Source
channels are mutually exclusive. Use two single-ended probes to connect the data
pair (for example: Rx0+ or Rx0-) to Source1 and Source2.
Select Pair
The Source field identifies a data line.
Note: You cannot select the same channel for Source1 and Source2.
Figure 3-70: Select Pair
Use the drop-down arrow in the Select Pair combo box to set the data pair. The
available data pairs are:
RX0
RX1
RX2
60 TDSDVI Compliance Test Solution Printed Help Document

Operating Basics
Select the data pair to which you have probed the TPA-P fixture for Transmitter
device and TPA-R fixture for a Cable and Receiver device.
Hysteresis
Figure 3-71: Hysteresis
Use the GP knob or the calculator keypad
hysteresis percentage value.
The hysteresis range is 2% to 10%.
Cable Inter-Pair Skew Screen Interface
Cable Inter-Pair Skew
Setup Pane
Before using the application, set up the DUT as given in Application Examples>
Cable-Inter-Pair Skew> Equipment
Inter-Pair skew is the skew between the signal that constitutes from the different
pair (Example Rx0+ of one pair and Rx0- of the other pair).
next to the Value field to enter the
Setup on page 153.
Select the Cable tab and click on the Inter-Pair Skew measurement to display the
following screen.
Figure 3-72: Inter-Pair Skew pane
Configuration parameters for Inter-Pair Skew
Select the Inter-Pair Skew measurement and press the Configure button to
display the configuration parameters for the Inter-Pair Skew measurement.
TDSDVI Compliance Test Solution Printed Help Document 61

Operating Basics
Select Source
Figure 3-73: Inter-Pair Skew configuration
Figure 3-74: Select Source
Use the drop-down arrow in the Source1 combo box to set the data line (+) of the
data pair. The available selections are: Ch1 to Ch4. Use the drop-down arrow in
the Source2 combo box to set the data line (-) of the data pair. The Source
channels are mutually exclusive. Use two single-ended probes to connect the data
pair (for example: Rx0+ or Rx0-) to Source1 and Source2.
The Source field identifies a data line.
Note: You cannot select the same channel for Source1 and Source2.
62 TDSDVI Compliance Test Solution Printed Help Document

Operating Basics
Select Pair
Figure 3-75: Select Pair
Use the drop-down arrow in the Pair1 and Pair2 combo box to set the
differential data pair. The available data pairs are:
RX0
Hysteresis
RX1
RX2
If the data line is positive, select the check box next to the Pair fields. If you
select the Differential Probe check box, the positive check boxes next to the pair
fields are disabled and the application calculates the time delay between the two
data pairs. If you used a single-ended probe, the application calculates the skew
between the data lines.
Select the data pair from which you have probed the TPA-P fixture. You cannot
select the same data pair in the Pair1 and Pair2 combo boxes irrespective of the
polarity (+ or -).
Figure 3-76: Hysteresis
Use the GP knob or the calculator keypad
hysteresis percentage value.
next to the Value field to enter the
The hysteresis range is 2% to 10%.
Receiver High-Amplitude/Low Amplitude Eye Diagram Screen Interface
TDSDVI Compliance Test Solution Printed Help Document 63

Operating Basics
Receiver High-Amplitude
Eye Diagram Pane
Before using the application, set up the DUT as given in Application Examples>
Receiver-High Amplitude/Low Amplitude Eye Diagram> Equipment
on page 160.
Select the Receiver tab and click on the High-Amp Eye Diagram measurement to
display the following screen.
Setup
Figure 3-77: High-Amplitude Eye Diagram pane
Configuration parameters for High-Amplitude Eye Diagram
Select the High-Amplitude Eye Diagram and press the Configure button to
display the configuration parameters for the High-Amplitude Eye Diagram
measurement.
Figure 3-78: High-Amplitude Eye Diagram configuration
64 TDSDVI Compliance Test Solution Printed Help Document

Receiver Low-Amplitude
Eye Diagram Pane
Operating Basics
Before using the application, set up the DUT as given in Receiver-High
Amplitude/Low Amplitude Eye Diagram> Equipment
Select the Receiver tab and click on the Low-Amp Eye Diagram measurement to
display the following screen.
Configuration parameters for Low-Amplitude Eye Diagram
Select the Low-Amplitude Eye Diagram and press the Configure button to
display the configuration parameters for the Low-Amplitude Eye Diagram
measurement.
Setup on page 160.
Figure 3-79: Low-Amplitude pane
Figure 3-80: Low-Amplitude configuration
TDSDVI Compliance Test Solution Printed Help Document 65

Operating Basics
Select Source
Figure 3-81: Select Source
Use the drop-down arrow in the Data combo box to select the data source
channel. The available selections are: Ch1 to Ch4.The application requires a
recovered clock as an external trigger source to the oscilloscope. Use the dropdown arrow in the Trigger combo box to set the trigger source channel. The
Data and Trigger sources are mutually exclusive.
The Data and Trigger fields identify the data source and the external clock
source.
Note: You cannot select the same channel for Data and Trigger.
Select Pair
Figure 3-82: Select Pair
Use the drop-down arrow in the Select Pair combo box to set the data pair. The
available data pairs are:
RX0
RX1
RX2
66 TDSDVI Compliance Test Solution Printed Help Document

Operating Basics
Select the data pair to which you have probed the TPA-P fixture for Transmitter
device and TPA-R fixture for a Cable and Receiver device.
Number of Eyes
Figure 3-83: Number of Eyes
Use the GP knob or the calculator keypad
minimum number of eyes considered to find the worst eye opening in
Transmitter, Cable or Receiver Eye measurements. The application then
positions the eye mask on the worst opening eye.
You can set a minimum of two eyes to place the mask on the worst eye opening
because the DVI specifications recommends at least two eyes to conduct the eye
diagram test.
To analyze the pixels, you can set a maximum of ten eyes because each data
pixel has 10 bits. The application analyzes these eyes and places the mask at the
worst eye opening.
next to the Value field, to set the
How to Calculate Tbit
Figure 3-84: Define Tbit pane
Tbit is the time required to transmit one bit of data. The Define Tbit pane is
independent of all the measurements. A valid Tbit value is required for all
measurements. If the device, resolution, blanking rate, or the refresh rate
changes, you have to recalculate Tbit. The Tx Clock field identifies the external
clock source.
TDSDVI Compliance Test Solution Printed Help Document 67

Operating Basics
Note: We recommend that you calculate the Tbit with the differential transmitted
clock rather than defining Tbit values yourself. You need to calculate Tbit only
once for a device working at a particular resolution, refresh rate or the blanking
rate. This value will be retained for further measurements. If the device,
resolution, refresh rate or the blanking rate changes, you have to recalculate
Tbit.
To calculate Tbit,
1. Select the Tbit button to enable the Define Tbit pane.
2. Select the Calculated radio button to use the differential transmitted clock
and calculate Tbit.
3. Select the Tx Clock channel from the Tx Clock drop-down list. The
available selections are: Ch1 to Ch4.
4. Click the Run button to calculate Tbit. The application displays the
following message box. (This message box is not displayed if you have not
selected the File> Preferences> Prompt for signal connection check box.)
Figure 3-85: Connect differential clock message box
5. Select OK to confirm the connection and display the previous screen. You
can select the Cancel button to cancel the process.
6. After calculating Tbit, the application displays the following message box
and the value in the Tbit Value field.
Figure 3-86: Successful Tbit calculation message box
68 TDSDVI Compliance Test Solution Printed Help Document

Operating Basics
Enter a User Defined Tbit
Value
Troubleshooting Tbit
Calculation Error
Messages
1. Select the Tbit button to enable the Define Tbit pane.
2. Select the User radio button if you want to define the Tbit values yourself.
3. Use the calculator keypad or the GP knob next to the Value field to set the
Tbit value.
The acceptable ranges for Tbit Values are:
TDS66604, TDS6404, TDS6604B, TDS6804B, TDS7404, TDS7404B,
TDS7704B, CSA7404, CSA7404B oscilloscopes—200 ps to 20 ns.
TDS7254 and TDS7254B oscilloscopes—1ns to 20 ns.
The application displays the next message box if the Tbit value is not within the
specified range. The acceptable ranges for Tbit Values are:
TDS66604, TDS6404, TDS6604B, TDS6804B, TDS7404, TDS7404B,
TDS7704B, CSA7404, CSA7404B oscilloscopes—200 ps to 20 ns.
TDS7254 and TDS7254B oscilloscopes—1ns to 20 ns.
Figure 3-87: Invalid Tbit value message box
The application displays the following message box if the Tbit calculation
has failed. This happens if you have not used a clock signal.
Figure 3-88: Tbit calculation failure message box
If you select the Tbit option and press the Configure button, the application
displays the following message box. To avoid this, configure the Tbit value
in the Define Tbit pane and press the Run button.
TDSDVI Compliance Test Solution Printed Help Document 69

Operating Basics
Figure 3-89: Select measurement message box
If you select the User option and press the Configure button, the application
displays the following message box.
Figure 3-90: Tbit defined message box
See Also
Equipment for Tbit on page 131
Equipment setup for Tbit on page 131
How to Test Transmitter For Eye Diagram
Selecting and Configuring
Measurement: Eye Diagram
Follow these steps to select and configure the Eye Diagram:
Note: Refer page 134 to set up the DUT before using the application.
1. Select Measurements> Select> Transmitter>Eye Diagram to display the
Eye Diagram screen.
70 TDSDVI Compliance Test Solution Printed Help Document

Operating Basics
Figure 3-91: Eye Diagram pane
2. You have to define Tbit:
If you have not calculated the Tbit value
If you have changed the device, resolution, refresh rate or the blanking rate
after calculating the Tbit
3. Select the Configure button to display the following screen.
Figure 3-92: Eye Diagram configuration
4. In the Select Source pane, select the data source channel from the Data
drop-down list. This indicates which channel is connected in the TPA-P
fixture with a differential probe. The available selections are: Ch1 to Ch4.
The application requires a recovered clock as an external trigger source to the
oscilloscope. Use the drop-down arrow in the Trigger field to set the trigger
source channel. The available selections are: Ch1 to Ch4. You cannot set the
same channel for Data and Trigger source.
5. Use the drop-down arrow in the Pair field to set the data pair. The
available data pairs are:
RX0
RX1
RX2
Note: The data pair values appear only in the generated report. They are not
used for any calculations.
6. In the Number of Eyes field, use the GP knob or the calculator keypad
next to the Value field, to enter the minimum number of eyes to be
considered to perform the test.
,
7. From the Calculate Vswing pane, you can calculate Vswing in two ways:
Select the Pattern button. Use the drop-down arrow to select the Pseudo
Random or Half Clock to specify the pattern you want to use to calculate
Vswing.
TDSDVI Compliance Test Solution Printed Help Document 71

Operating Basics
If you know the Vswing value, select the User button. In the Value field,
use the popup keyboard to enter your user-defined Vswing values. The
default pattern is PRP
8. Press the Run button
Confirm Tbit Value message box.
9. If you have defined the Tbit value, the application displays the Eye Mask
message box.
10. If you have selected Half Clock Pattern, the application displays the next
message box. Transmit the HCP from the DUT, connect the signals to the
oscilloscope, and select OK in the message box below.
Figure 3-93: Half clock pattern message box
11. If you have selected PRP to calculate Vswing, the application displays the
next message box. Transmit the PRP in the DUT, connect the signals to the
oscilloscope and select OK in the message box below.
to perform the test. The application displays the
72 TDSDVI Compliance Test Solution Printed Help Document

Operating Basics
Figure 3-94: PRP message box
12. If you are using a TDS6000 series oscilloscopes, click here for information .
If you have selected Half Clock Pattern in TDS6000 series
Oscilloscopes, the application displays the next message box. (You can
select the Stop button to stop the process and the Skip button to measure
the Vswing with the current number of available acquisitions.)
Figure 3-95: Wait message box
If you have selected File> Preferences> Use Cursors for Eye, RT & FT
Testing, the application enables the cursors on the oscilloscope to
calculate the Vswing.
After calculating Vswing using the Half Clock Pattern, the application
displays the message box, "Connect the PRP pattern". Remove the TPAP fixture from the DUT and connect the DVI monitor. Change the PRP
pattern and remove the DVI monitor from the DUT. Connect the TPA-P
fixture to the DUT and probe the selected data pair from the TPA-P and
press OK to display the next message box.
Figure 3-96: Monitor eye progress message box
Select Yes to display the Eye Zoom screen. If you select No, the
application continues to run the measurement.
TDSDVI Compliance Test Solution Printed Help Document 73

Operating Basics
(If you have selected File> Preferences> Use Cursors for Eye, RT & FT
Testing, the application displays only the Wait message box.)
13. If you have selected File> Preferences> General> Use cursors for Eye,
RT & FT Testing, Click here for information on what the application does
to calculate Vswing and the Worst eye opening. The application tests the
signal with the transmitter eye mask and displays the results.
Viewing Results: Eye
Diagram
Follow these steps to view Eye Diagram results:
1. Select Results> Result Detail to display the detailed results for the
Transmitter Eye Measurement.
You can also use the:
Compare Result button to compare results
Eye Zoom button to view the zoomed eye
Generate Report button to generate reports
Figure 3-97: Eye Diagram results
74 TDSDVI Compliance Test Solution Printed Help Document

Operating Basics
Table 3-17 lists the eye diagram result options and their descriptions.
Table 3-17: Results: Eye diagram options and their descriptions
Results Description
Parameter Displays the calculated parameters for the measurement such as,
Tbit, Acquisition Number, Vswing, Worst Tbit, Overshoot,
Undershoot, Vopen, Hopen and the Hit Counts
Value Displays the values of:
Tbit used for calculating the coordinates of the eye mask
Calculated Worst Tbit
The number of acquisitions to create the eye diagram
Calculated Vswing in volts
Calculated Overshoot, Undershoot of the eye diagram
Vopen in volts and Hopen in seconds
The number of Hit counts on the eye mask
Status Displays the result status: Pass or Fail.
Generating Reports
Note: Select File> Export Setup> Images> Data Format from the oscilloscope
menu. Set the data format option to .jpg before generating a report. The report
format does not support any other image file. Before you run the measurement,
select Automatic IDs & Report Names to automatically generate a report.
Follow these steps to generate a report for all the measurements:
1. Select Reports> Report Generation to display the following screen.
Figure 3-98: Generate report, report setup tab
2. In the Report Setup tab, use the virtual keypad to enter the device ID.
3. In the Description field, use the virtual keypad to enter the device
description.
4. If you have not yet run the measurement, and if you want the application to
display the device ID and specify the report names automatically, select the
Automatic IDs & Report Names checkbox. The ID field is disabled if you
TDSDVI Compliance Test Solution Printed Help Document 75

Operating Basics
select this option. The ID, File Name fields, and Generate button are
disabled if this option is selected.
5. In the Prefix field, use the virtual keypad to enter the device prefix.
6. Select the Mode of generating the report: Manual or Automatic. If you
select the Manual mode, the Prefix field is disabled. If you select the
Automatic mode, Device ID field is disabled.
7. The Defined field displays the predefined clock frequency values
automatically when you define and calculate Tbit.
8. Use the drop-down arrow in the Resolution and Refresh Rate field to set
the values and calculate the clock frequency. The drop-down list provides
the Resolution and Refresh Rate values according to the VESA standard. If
you select the Select for Report check box, the application displays the
resolution and refresh rate in the generated report.
9. If you do not want to specify the report details, select the Generate button.
You can do this only if you have selected the Manual mode of generating a
report. If you want to specify the report details, perform the following steps:
Figure 3-99: Generate Report, report name tab
1. In the Report Name tab, select the Browse button in the Directory field to
browse to the directory location.
2. In the File Name field, use the virtual keypad to enter the file name.
3. You can use the Results option to view the results and the Compare Results
option to compare results of two different devices.
4. Select the Generate button to generate report an HTML report. Given below
is a sample Eye Diagram report.
76 TDSDVI Compliance Test Solution Printed Help Document

Operating Basics
Figure 3-100: Eye Diagram report
TDSDVI Compliance Test Solution Printed Help Document 77

Operating Basics
How to Test Transmitter for Rise Time and Fall Time
Selecting and Configuring
Measurements: Rise and
Fall Time
Follow these steps to select and configure Rise and Fall Time:
Note: Refer page 137 to set up the DUT before using the application.
1. Select Measurements> Select> Transmitter> Rise and Fall Time to
display the following screen.
Figure 3-101: Rise and Fall Time pane
2. You have to define Tbit:
If you have not calculated the Tbit value
If you have changed the device, resolution, refresh rate or the blanking
rate after calculating the Tbit
3. Select the Configure button to display the following screen.
Figure 3-102: Rise and Fall Time configuration
4. Use the drop-down arrow in the Data field to select the data source channel.
The available selections are: Ch1 to Ch4.The application requires a recovered
clock as an external trigger source to the oscilloscope. Use the drop-down
arrow in the Trigger field to set the trigger source channel.
78 TDSDVI Compliance Test Solution Printed Help Document

Operating Basics
5. Use the drop-down arrow in the Select Pair field to set the data pair. The
available data pairs are:
RX0
RX1
RX2
6. In the Hysteresis field, use the GP knob or the calculator keypad
the hysteresis percentage value. The hysteresis range is 2% to 10%.
7. From the Calculate Vswing pane, you can calculate Vswing in two ways:
Select the Pattern button. Use the drop-down arrow to select the Pseudo
Random or Half Clock to specify the pattern you want to use to calculate
Vswing.
If you know the Vswing value, select the User button. In the Value field,
use the calculator keypad
default pattern is PRP.
8. Press the Run button to perform the test. The application displays the
Confirm Tbit Value message box.
9. If you have selected Half Clock Pattern, the application displays the next
message box. Generate the HCP in the DUT and select OK in the message
box below. Refer page 182 on how to generate the HCP in the DUT.
to enter the user defined Vswing values. The
to enter
Figure 3-103: HCP message box
10. If you have selected PRP to calculate the Vswing, the application displays
the next message box. Generate the PRP in the DUT and select OK in the
message box below. Refer page 182 on how to generate the PRP in the DUT.
TDSDVI Compliance Test Solution Printed Help Document 79

Operating Basics
Figure 3-104: PRP message box
11. If you are using a TDS6604, TDS6404, TDS6604B, or TDS6804B
oscilloscope, click here for information.
Select the Stop button to stop the process. If you select the Skip button,
the application measures the Vswing with the current number of
acquisitions.
Viewing Results: Rise and
Fall Time
Figure 3-105: Wait message box
12. If you have selected File> Preferences> General> Use cursors for Eye,
RT & FT Testing, refer page 182 for information on what the application
does to calculate Vswing. The application calculates the Rise and Fall time
and displays the results.
Follow these steps to view Rise and Fall Time results:
1. Select Results> Result Detail to display the detailed and statistical results
for the Transmitter Rise and Fall Time Measurement.
You can also use:
Compare Result button to compare results
Generate Report button to generate reports
80 TDSDVI Compliance Test Solution Printed Help Document

Operating Basics
Figure 3-106: Rise and Fall Time results-Details
Figure 3-107: Rise and Fall Time results-Statistics
TDSDVI Compliance Test Solution Printed Help Document 81

Operating Basics
Table 3-18 lists the rise and fall time result options and their descriptions.
Table 3-18: Results: Rise and Fall time options and their descriptions
Results Description
Details tab
Parameter Displays the calculated parameters for the measurement such as, Tbit, Vswing, Worst
Tbit, Lower Limit and Upper Limits for Rise Time and Fall Time.
Value Displays the values of:
Tbit used for calculating the limits of Rise and Fall Time
Calculated Vswing in volts
Calculated Overshoot, Undershoot of the eye diagram
Vopen in millivolts and Hopen in seconds
The measured Rise time and Fall time value in seconds
The lower limit for Rise time and Fall time. Values below this limit indicate a Fail
The upper limit for Rise time and Fall time. Values above this limit indicate a Fail
Statistics tab
Measurement Displays the selected measurement.
Population The number of edges calculated in the acquired waveform.
Min The minimum Rise and Fall Time value in the acquired waveform.
Max The maximum Rise and Fall Time value in the acquired waveform.
Mean The average of all the calculated Rise Time values.
Std Dev The standard deviation of all the calculated Rise and Fall time values.
Status Displays the result status:Pass or Fail. This is common to both the Details and
Statistics tab.
Generating Reports
Follow these steps to generate a report for all the measurements:
Note: Select File> Export Setup> Images> Data Format from the oscilloscope
menu. Set the data format option to .jpg before generating a report. The report
format does not support any other image file. Before you run the measurement,
select Automatic IDs & Report Names to automatically generate a report.
1. Select Reports> Report Generation to display the following screen.
82 TDSDVI Compliance Test Solution Printed Help Document

Operating Basics
Figure 3-108: Generate Report, report setup
2. In the Report Setup tab, use the virtual keypad to enter the device ID.
3. In the Description field, use the virtual keypad to enter the device
description.
4. If you have not yet run the measurement, and if you want the application to
display the device ID and specify the report names automatically, select the
Automatic IDs & Report Names checkbox. The ID field is disabled if you
select this option. The ID, File Name fields, and Generate button are
disabled if this option is selected.
5. In the Prefix field, use the virtual keypad to enter the device prefix.
6. Select the Mode of generating the report: Manual or Automatic. If you
select the Manual mode, the Prefix field is disabled. If you select the
Automatic mode, Device ID field is disabled.
7. The Defined field displays the predefined clock frequency values
automatically when you define and calculate Tbit.
8. Use the drop-down arrow in the Resolution and Refresh Rate field to set
the values and calculate the clock frequency. The drop-down list provides
the Resolution and Refresh Rate values according to the VESA standard. If
you select the Select for Report check box, the application displays the
resolution and refresh rate in the generated report.
9. If you do not want to specify the report details, select the Generate button.
You can do this only if you have selected the Manual mode of generating a
report. If you want to specify the report details, perform the following steps:
TDSDVI Compliance Test Solution Printed Help Document 83

Operating Basics
Figure 3-109: Generate Report, report name
1. In the Report Name tab, select the Browse button in the Directory field to
browse to the directory location.
2. In the File Name field, use the virtual keypad to enter the file name.
3. You can use the Results option to view the results and the Compare Results
option to compare results of two different devices.
4. Select the Generate button to generate report an HTML report.
How to Test Transmitter for Pk-Pk Jitter
Selecting and Configuring
Measurements:Pk-Pk Jitter
Measurement> Select> Transmitter> Pk-Pk Jitter
Measurement> Select> Cable> Pk-Pk Jitter
Note: Refer page 140 to setup the DUT before using the application for
Transmitter Pk-Pk Jitter.
Note: Refer page149 to set up the DUT before using the application for Cable
Pk-Pk Jitter
Note: To get appropriate results in Pk-Pk Jitter measurements, from the
oscilloscope menu bar, select Measure->Waveform Histograms->Adjust
Histogram Box Limits.
Follow these steps to select and configure Pk-Pk Jitter:
1. Select Measurements> Select> Transmitter/Cable> Pk-Pk Jitter to
display the screen.
84 TDSDVI Compliance Test Solution Printed Help Document

Figure 3-110: Transmitter Pk-Pk Jitter pane
Operating Basics
Figure 3-111: Cable Pk-Pk Jitter pane
2. You have to define Tbit:
If you have not calculated the Tbit value
If you have changed the device, resolution, refresh rate or the blanking rate
after calculating the Tbit
3. Select the Configure button to display the following screen:
Figure 3-112: Transmitter Pk-Pk Jitter configuration
TDSDVI Compliance Test Solution Printed Help Document 85

Operating Basics
Figure 3-113: Cable Pk-Pk Jitter configuration
4. Select the transmitted differential clock source from the Tx Clock dropdown list. The available selections are: Ch1 to Ch4. The application requires
a CRU (Clock Recovery Unit) to trigger the oscilloscope. Set the trigger
source channel from the Trigger drop-down list. Data and Trigger source
are mutually exclusive.
5. Press the Run button
the Confirm Tbit Value message box.
6. Confirm the Tbit value to display the next message box. Connect the clock
signals and press Ok.
Figure 3-114: Clock signals message box
The application calculates the Pk-PK Jitter and displays the result: Pass or Fail.
Note: For more in-depth analysis on Jitter, use the TDSJIT3 Package.
If the signal is unstable, the application cannot place the histogram at the second
rising edge of the clock signal, then the application displays the following
message box.
to perform the test. The application displays
Figure 3-115: Holdoff message box
86 TDSDVI Compliance Test Solution Printed Help Document

Operating Basics
To adjust the Trigger Holdoff time,
1. Select Trig >Holdoff from the oscilloscope interface as shown in
Figure: 3-115.
2. Use the GP knob on the oscilloscope panel to adjust the trigger hold off
time.
3. After stabilising the signal, press the APP button in the oscilloscope
interface to display the application.
4. Press OK in the Figure 3-115 Holdoff message box to continue the peak to
peak jitter measurement and Cancel to stop running the measurement.
Figure 3-116: Oscilloscope interface
Viewing Results: Pk-Pk
Follow these steps to view Pk-Pk Jitter results:
Jitter
5. Select Results> Result Detail to display the detailed results for the
Transmitter or Cable Pk-Pk Jitter Measurement.
You can also use:
Compare Result button to compare results
Generate Report button to generate reports
TDSDVI Compliance Test Solution Printed Help Document 87

Operating Basics
Figure 3-117: Pk-Pk Jitter results
Table 3-19 lists the pk-pk jitter result options and their descriptions.
Table 3-19: Results: Pk-Pk Jitter options and their descriptions
Results Description
Parameter Displays the calculated parameters for the measurement such as,
Tbit, Acquisition Number, Pk to Pk jitter and its Upper Limit.
Value Displays the values of:
Tbit used for calculating the peak to peak jitter limits in seconds
The number of acquisitions to create the histogram
The measured peak to peak jitter values in seconds
The maximum limit values for Jitter. The peak to peak jitter
values above this limit indicate a Fail
Status Displays the result status:Pass or Fail.
Generating Reports
Follow these steps to generate a report for all the measurements:
Note: Select File> Export Setup> Images> Data Format from the oscilloscope
menu. Set the data format option to .jpg before generating a report. The report
format does not support any other image file. Before you run the measurement,
select Automatic IDs & Report Names to automatically generate a report.
1. Select Reports> Report Generation to display the following screen.
88 TDSDVI Compliance Test Solution Printed Help Document

Operating Basics
Figure 3-118: Generate report, report setup
2. In the Report Setup tab, use the virtual keypad to enter the device ID.
3. In the Description field, use the virtual keypad to enter the device
description.
4. If you have not yet run the measurement, and if you want the application to
display the device ID and specify the report names automatically, select the
Automatic IDs & Report Names checkbox. The ID field is disabled if you
select this option. The ID, File Name fields, and Generate button are
disabled if this option is selected.
5. In the Prefix field, use the virtual keypad to enter the device prefix.
6. Select the Mode of generating the report: Manual or Automatic. If you
select the Manual mode, the Prefix field is disabled. If you select the
Automatic mode, Device ID field is disabled.
7. The Defined field displays the predefined clock frequency values
automatically when you define and calculate Tbit.
8. Use the drop-down arrow in the Resolution and Refresh Rate field to set
the values and calculate the clock frequency. The drop-down list provides
the Resolution and Refresh Rate values according to the VESA standard. If
you select the Select for Report check box, the application displays the
resolution and refresh rate in the generated report.
9. If you do not want to specify the report details, select the Generate button.
You can do this only if you have selected the Manual mode of generating a
report. If you want to specify the report details, perform the following steps:
Figure 3-119: Generate report, report name
TDSDVI Compliance Test Solution Printed Help Document 89
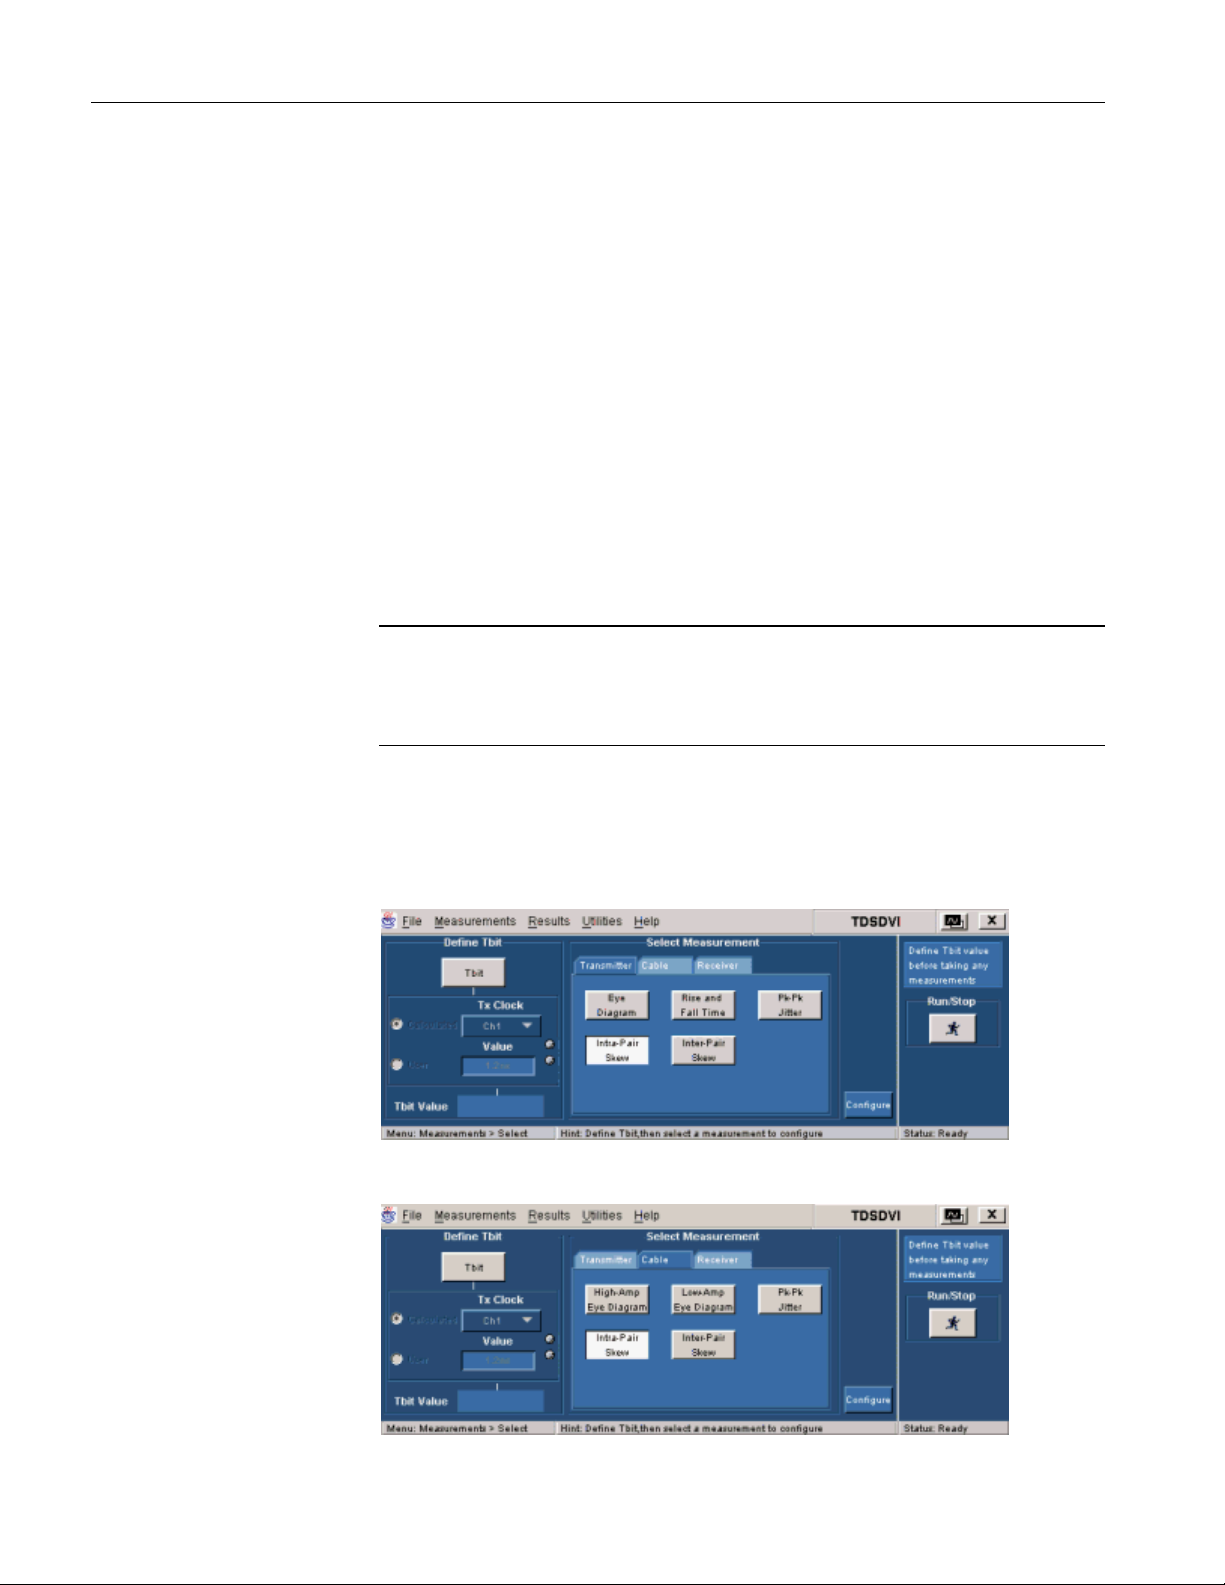
Operating Basics
1. In the Report Name tab, select the Browse button in the Directory field to
browse to the directory location.
2. In the File Name field, use the virtual keypad to enter the file name.
3. You can use the Results option to view the results and the Compare Results
option to compare results of two different devices.
4. Select the Generate button to generate report an HTML report
How to Test Transmitter for Intra-Pair Skew
Selecting and Configuring
Measurements: Intra-Pair
Skew
Measurement> Select> Transmitter>Intra-Pair Skew
Measurement> Select> Cable> Intra-Pair Skew
Note: Refer page 143 to set up the DUT before using the application for
Transmitter Intra-Pair Skew.
Note: Refer page150 to setup the DUT before using the application for Cable
Intra-Pair Skew.
Follow these steps to select and configure Intra-Pair Skew:
1. Select Measurements> Select> Transmitter/Cable> Intra-Pair Skew to
display the following screen.
Figure 3-120: Transmitter Intra-Pair Skew pane
90 TDSDVI Compliance Test Solution Printed Help Document
 Loading...