

Page 1

TDSDVD
Optical Storage
Analysis Application
TDSDVD Optical Storage Analysis Application
1
Page 2

2 TDSDVD Optical Storage Analysis Application
Page 3

Copyright and Version
Copyright © Tektronix, Inc. All rights reserved. Licensed software products are
owned by Tektronix or its suppliers and are protected by United States copyright
laws and international treaty provisions.
Use, duplication or disclosure by the Government is subject to restrictions as set
forth in subparagraph (c)(1)(ii) of the Rights in Technical Data and Computer
Software clause at DFARS 252.227-7013, or subparagraphs (c)(1) and (2) of the
Commercial Computer Software-Restricted Rights clause at FAR 52.227-19, as
applicable.
Tektronix products are covered by U.S. and foreign patents, issued and pending.
Information in this documentation supercedes that in all previously published
material. Specifications and price change privileges reserved.
Tektronix, Inc. P.O. Box 500, Beaverton, OR 97077
TEKTRONIX, TEK, and TEKPROBE are registered trademarks of Tektronix,
Inc.
TDSDVD Optical Storage Analysis Online Help, OLH0200, Version 01.00
TDSDVD Optical Storage Analysis Application
3
Page 4
General Safety
WARNING: To avoid injury to eyes, wear eye protection if the
possibility of exposure to high-intensity rays or laser radiation exists.
WARNING: To avoid electric shock, remove power from the system
under test (SUT) before attaching a probe to it. Do not touch exposed conductors
except with the properly rated probe tips. Refer to the probe manual for proper
use.
4 TDSDVD Optical Storage Analysis Application
Page 5

Table of Contents
Copyright and Version 3
General Safety 4
Introduction 7
Welcome tothe TDSDVD Optical Storage Analysis Application ............... 7
Using Online Help......................................................................................7
Related Documentation.............................................................................. 8
Accessing Online Documents....................................................................9
Contacting Tektronix..................................................................................9
Product Feedback......................................................................................9
Color Printing ........................................................................................... 10
Getting Started 11
Product Description..................................................................................11
Accessories.............................................................................................. 11
Compatibility.............................................................................................12
Requirements and Restrictions................................................................12
Installation................................................................................................13
Connecting to a System Under Test........................................................16
Operating Basics 19
Running the Application........................................................................... 19
The Application Interface.........................................................................20
Command Buttons ................................................................................... 22
Application Menu Bar...............................................................................24
Minimizing and Maximizing the Application.............................................. 24
Accessing Oscillo scope Functions...........................................................24
Exiting the Application.............................................................................. 25
Application Directories ............................................................................. 25
File Name Extensions.............................................................................. 25
Taking Measurements 27
About Taking Measurements................................................................... 27
Taking Measurements Guidelines............................................................27
Acquiring the Data Signal......................................................................... 30
Displaying an Eye Waveform................................................................... 30
Selecting a Standard................................................................................ 31
Setting Up the Input Options....................................................................32
Selecting and Configuring Measurements...............................................39
Taking Measurements.............................................................................. 40
Viewing Results........................................................................................ 40
Saving and Recalling Setups...................................................................42
Saving Results to a File...........................................................................43
Using Custom Plug-In Processes ............................................................ 46
Tutorial 49
Introduction to the Tutorial ....................................................................... 49
Setting up the Oscilloscope...................................................................... 49
TDSDVD Optical Storage Analysis Application
5
Page 6

Recalling a Waveform..............................................................................49
Starting the Application............................................................................ 50
Setting Up the Signal Source...................................................................50
Selecting the Measurement.....................................................................51
Configuring the Measurement.................................................................. 51
Taking the Measurement.........................................................................52
Viewing the Results..................................................................................53
Displaying a Measurement Histogram.....................................................54
Displaying a Time Interval Analysis (TIA) plot.......................................... 55
Saving the Measurement Data................................................................. 55
Stopping the Tutorial................................................................................55
Returning to the Tutorial........................................................................... 56
Reference 57
Menus......................................................................................................57
Parameters...............................................................................................87
Algorithms................................................................................................ 91
GPIB Programming................................................................................ 101
6 TDSDVD Optical Storage Analysis Application
Page 7

Introduction
Introduction
Welcome to the TDSDVD Optical Storage Analysis Application
The TDSDVD Optical Storage Analysis & Measurement Application is a Java–
based application that lets you quickly and easily measure and analyze
CD/DVD/MO optical storage device signals.
What do you want to do?
Read the Product Description on page 11
Learn About Online Help on page 7
Go to Installation on page 13
Using Online Help
Select Help on the right side of the application's Menu bar to open the Help
window. The main (opening) Help window has three tabs:
• Table of Contents (TOC) tab: Displays the help information organized
into book-like sections. Click a book icon to open a section; select any
of the topics listed under the book.
• Index tab: Displays a list of alphabetical keywords. Click the topic of
interest to bring up the appropriate help page.
• Find tab: Displays a box in which you can enter a word or words for
which to search. a text-based search.
To print a topic, select the Print button from the help topics menu bar. If you are
printing to a monochrome printer, see Color Printing on page 10.
Select the Back button to return to the previous help window. Sometimes you
can jump from one topic to another through a hyperlink. If the Back button is
"grayed out" or a jump is not available, choose the "Help Topics" button to select
the originating help topic.
Browse buttons (Next >> and Previous <<) allow you to move forward and
backward through topics in the order of the Table of Contents.
A Green text (with dotted underline) indicates a Popup window. Click the green
text to display a brief help message. Click to return to the topic.
Green-underlined text indicates a Jump (link) to another topic. Select the green
text to jump to the related topic.
TDSDVD Optical Storage Analysis Application
7
Page 8

Introduction
To return to the Online Help Table of Contents, select Help Topics from the Help
Top Menu.
Related Documentation
In addition to the Online Help, you can access other information on how to
operate the application or oscilloscope through the following related documents:
• Installation Instructions; the installation instructions provide information
on how to install software.
• Oscilloscope Information; the oscilloscope user manual provides
information on how to operate the oscilloscope.
• Programmer Information; the online help for your oscilloscope provides
details on how to use GPIB commands to control the oscilloscope.
You can also download files with programmer information and examples from
the Tektronix web site. Refer to the installation manual for information on how to
download the file. Refer to the Optional Applications Software on a WindowsBased Oscilloscope Installation Manual for the following information:
• Software warranty
• Software license agreement
• List of all available applications, compatible oscilloscopes, and relevant
software and firmware version numbers
• How to apply a new label
• Installation procedures
• How to enable an application
• How to download updates from the Tektronix web site
You can find a PDF (portable document format) file for this document in the
Documents directory on the Optional Applications Software on a Windows-
Based Oscilloscope CD. The CD booklet only contains information on installing
the application from the CD and on how to apply a new label.
See Also
Using Online Help on page 7
8 TDSDVD Optical Storage Analysis Application
Page 9

Introduction
Accessing Online Documents
To view a PDF file of the TDSDVD online help from a PC with the application
installed, select Start > Programs > TekApplications > TDSDVD, and select the
PDF file from the list. The corresponding PDF file displays.
To run the TDSDVD online help without starting the application, select Start >
Programs > TekApplications > Help. The TDSDVD help program displays.
Contacting Tektronix
Phone 1-800-833-9200*
Address Tektronix, Inc.
Web site www.tektronix.com
Sales support 1–800–833–9200, select option 1*
Service support 1–800–833–9200, select option 2*
Technical support Email: techsupport@tektronix.com
Department or name (if known)
14200 SW Karl Braun Drive
P.O. Box 500
Beaverton, OR 97077
USA
1–800–833–9200, select option 3*
1–503–627–2400
* This Telephone number is toll free in North America.
After office hours, please leave a voice mail message.
Outside North America, contact a Tektronix sales office
or distributor; See the Tektronix web site for a list of
offices.
Product Feedback
Tektronix values your feedback on our products. To help us serve you better,
please send us any suggestions, ideas, or other comments you may have
regarding your oscilloscope or application.
Send your feedback to us by email to techsupport@tektronix.com or FAX us at
(503) 627-5695. Please provide as much of the following information as
possible:
• Your name, company, mailing address, phone number, and FAX number
• Oscilloscope model number and hardware options, if any
• Probes used
• Software version number
• Description of the problem such that technical support can duplicate the
problem
TDSDVD Optical Storage Analysis Application
9
Page 10

Introduction
• If possible, save the oscilloscope and application setup and information
.set and .ini files
• If possible, save the waveform on which you are performing the
measurement as a .wfm file
Once you have gathered this information, you can contact technical support by
phone or through e-mail. If using e-mail, be sure to enter in the subject line
"TDSDVD Problem," and attach the .set, .ini, and .wfm files. Please indicate if
you would like to be contacted by Tektronix regarding your suggestion or
comments.
To create oscilloscope screen shots to include with your email or FAX, follow
these steps:
1. In the oscilloscope menu bar, select File > Export to display the Export
dialog box.
2. Enter a file name. The default file type is bitmap (.bmp).
3. Select Save. The file is saved in the C:\TekScope\Images directory. You
can then attach the file to your email (depending on the capabilities of
your email editor).
Color Printing
Many of the online help topics include color examples of application screens.
Printing these color topics on a monochrome printer can result in loss of image
information due to how different monochrome printers interpret and print color
information.
If you do not have access to a color printer, you should print the topic from the
application Online Help PDF (portable document format) file. You can find the
file in the Documents directory on the Optional Applications Software on a
Windows-Based Oscilloscope CD.
10 TDSDVD Optical Storage Analysis Application
Page 11

Getting Started
Getting Started
Product Description
The TDSDVD Optical Storage Analysis and Measurement Application is a Javabased application for measuring and analyzing the amplitude, modulation, and
timing characteristics of CD/DVD/MO optical storage device encoded signals.
The application features include:
• Supports, but is not restricted to, common CD/DVD/MO optical storage
standards
• Displays measurement results as numeric values, linear plots, or
histogram plots
• Supports adding external MATLAB (version 6.1 or later) and .DLL
signal analysis/processing software.
Accessories
• Supports Time Interval Analysis (TIA) display
• Displays a count of Track Error pulses
• Ability to install and run TDSDVD on a PC to take advantage of greater
processing power; the PC must be connected to the oscilloscope on
which the TDSDVD applicationis installed and enabled
• Saves measurement setups and results to a file
What do you want to do?
Check Compatibility, see page 12
Look Over Requirements and Restrictions, see page 12
Go to Installation, see page 13
Connecting to a System Under Test, see page 16
Start Running the Application, see page 19
There are no standard accessories for this product.
TDSDVD Optical Storage Analysis Application
11
Page 12
Getting Started
Compatibility
This table lists the oscilloscopes that support the TDSDVD application.
Application
TDSDVD*
Optical Storage
Analysis and
Measurements
V 1.0.0* and
above
* For a current list of supported models, see the Software and
Drivers category on www.tektronix.com.
Oscilloscope Model
TDS7054, TDS7104 V 2.1.0 and above
TDS7154, TDS7254,
TDS7404
CSA7154, CSA7404 V 2.0.0 and above
TDS5052, TDS5054,
TDS5104
Requirements and Restrictions
To operate the TDSDVD application, the Sun Microsystems Java Run-Time
Environment (JRE) version 1.4 (or greater) must be installed on the oscilloscope.
The TDSDVD installation program automatically installs the proper version of
JRE. If you accidentally delete the JRE on your oscilloscope, you will need to
reinstall the TDSDVD application.
This application assumes that the following conditions are met to obtain
measurements:
• The data source signal is a continuous physical data disk recording of nT
pulses with no gaps or non-nT type data.
Oscilloscope
Software Version
V 2.0.0 and above
V 1.0.7 and above
• The clock period (T) of the data source signal is constant.
The following table lists memory requirements for taking six measurements at
one time on long record length data samples.
Record Length Windows RAM
Up to 4 M
samples
4 M samples and
above*
* Taking measurements on 4 M (or greater) data records can take
significant time to process. Running the application on a PC with a
1 GHz or greater processor can reduce processing time.
Required Recommended
256 MB 256 MB
256 MB 512 MB
12 TDSDVD Optical Storage Analysis Application
Page 13

Getting Started
Installation
To install the TDSDVD application software on an oscilloscope, refer to the
Optional Applications Software on a Windows-Based Oscilloscope Installation
Manual, which is part of the optional applications CD and documentation kit.
The installation manual contains the following information:
• A list of applications, compatible oscilloscopes, and relevant software
and firmware version numbers
• How to apply the option label
• Installation procedures
• How to enable an application
• How to install the application on a PC
• How to configure the PC-installed application to communicate with an
oscilloscope using a GPIB or LAN connection
You can find the corresponding Portable Document Format (PDF) file for the
installation manual in the Documents directory of the Optional Applications
Software on a Windows-Based Oscilloscope CD at C\Program Files\Tek
Applications\tdsdvd.
Note.
The CD booklet in the CD case only contains information on installing the
application from the CD and on how to apply a new label.
PC Installation
You can install the TDSDVD application on a PC with Windows 98 or Windows
2000 operating systems. Operating the application from a PC allows the
application to use the additional processing power of the PC.
Note.
Ensure that the PC has access to the oscilloscope with the enabled application,
either over a local area network (LAN) or through a GPIB cable.
To set up a PC to control the application over a LAN or GPIB cable, you need to
do the following tasks:
• How to download updates from the Tektronix web site
• Setting Up the Oscilloscope for Remote Access, located on page 14
• Installing the Application Software on the PC, located on page 14
• Installing TekVISA Communications Software on the PC, located on
page 14
• Configuring TekVISA , located on page 15
TDSDVD Optical Storage Analysis Application
13
Page 14

Getting Started
Setting Up the Oscilloscope for Remote Access
To set up the oscilloscope for remote LAN access, follow these steps:
1. From the menu bar of the oscilloscope, select Utilities > LAN Server
Status. The VXI-11 Server Control menu appears.
2. Select the Start command button to start the server. A VXI-11 Server
Control icon appears on the Windows status bar.
To set up the oscilloscope for remote GPIB access, follow these steps:
1. Install a GPIB card in your PC. For information on GPIB cards, you can
access the National Instrument web site.
2. Follow the instructions from the manufacturer and connect a GPIB cable
between your PC and oscilloscope.
3. From the oscilloscope menu bar, select Utilities> GPIB Configuration.
4. Select the Talk/Listen button and the On option.
5. Select address 1.
Installing Application Software on the PC
To install the TDSDVD application on a PC, follow these steps:
1. Insert the Optional Applications Software for Windows-Based
Oscilloscopes CD-ROM in the CD drive on your PC. The PC may
automatically start the Installation Browser program. If the PC does not
start the Installation Browser program, follow these steps:
2. Select the My Computer icon.
3. In the Exploring - My Computer window, select the D: (CD-ROM) drive
and select the Launch.exe file.
4. Follow the on-screen instructions given by the InstallShield Wizard.
Select the OK button if prompted to install the JRE (Java Run-time
Environment).
5. Reboot the PC to complete the application software installation process.
Installing TekVISA Communications Software on the PC
This application requires TekVISA API drivers to communicate with an
oscilloscope over a network. The TekVISA software is the Tektronix version of
the PC VISA API drivers.
To install TekVISA software on your PC, follow these steps:
1. Insert the oscilloscope product software CD-ROM disc into your PC CDROM drive.
2. Navigate to the TekVISA directory on the CD-ROM.
14 TDSDVD Optical Storage Analysis Application
Page 15

Getting Started
3. In the TekVISA directory, double-click Setup.exe to open the TekVISA
Install Wizard.
4. Follow the instructions in the Install Wizard. Select Complete when
prompted for the installation type.
You can also download the latest TekVISA software from the Tektronix web
site: To do so, follow these steps:
1. Access the www.tektronix.com web site.
2. Select Software & Drivers (in the Resources column) to display the
Software and Firmware Finder page.
3. Enter tekvisa in the Find by model number or keyword field.
4. Select Go. The search returns a list of the available TekVISA software to
download.
5. Select the TekVISA software appropriate for your oscilloscope. View the
web page for instructions on how to download TekVISA to your
oscilloscope or PC.
Configuring TekVISA
To configure TekVISA software, you must first determine the hostname of the
oscilloscope with the TDSDVD application enabled. To do so, follow these
steps:
1. Minimize the oscilloscope (select File> Minimize from the menu bar).
2. Right click the Network Neighborhood icon.
3. Select Properties.
4. Select the Identification tab.
5. Write down (take mental note) the oscilloscope name, also referred to as
To configure TekVISA software to communicate with an oscilloscope, follow
these steps:
1. On the PC, select Start > Programs > TekVISA > TekVISA
2. Verify that the host name of the oscilloscope matches the name of the
the host name.
Configuration to display the TekVISA configuration menu.
instrument with the GPIB8 designator in the list of TekVISA Remote
Hosts.
If the names do not match, you must remove the incorrect instrument name from
the list of remote hosts. To remove a name from the list and add a correct name,
follow these steps:
1. In the list of Remote Hosts, select the host name with the GPIB8 VISA
designator.
TDSDVD Optical Storage Analysis Application
15
Page 16
Getting Started
2. Select Remove.
3. Select OK. The PC removes the item.
4. In the Remote Hosts menu, select the Add button to display the Add
Remote Host menu.
5. Enter the host name of the oscilloscope with the TDSDVD application
enabled in the Host Name field.
6. Enter GPIB8 in the Visa Name field. The application communicates with
the oscilloscope only on GPIB8.
7. Select OK.
8. Select the Find button in the TekVISA Resources window. The PC adds
the GPIB8::1::INSTR to the list; it may take a few moments for the list to
update.
If GPIB8::1::INSTR does not appear in the list, check that your network
cable is properly connected and that you have the correct host name. You
might also need to work with your system administrator to resolve
connectivity problems.
9. Select Quit to exit the TekVISA Configuration window.
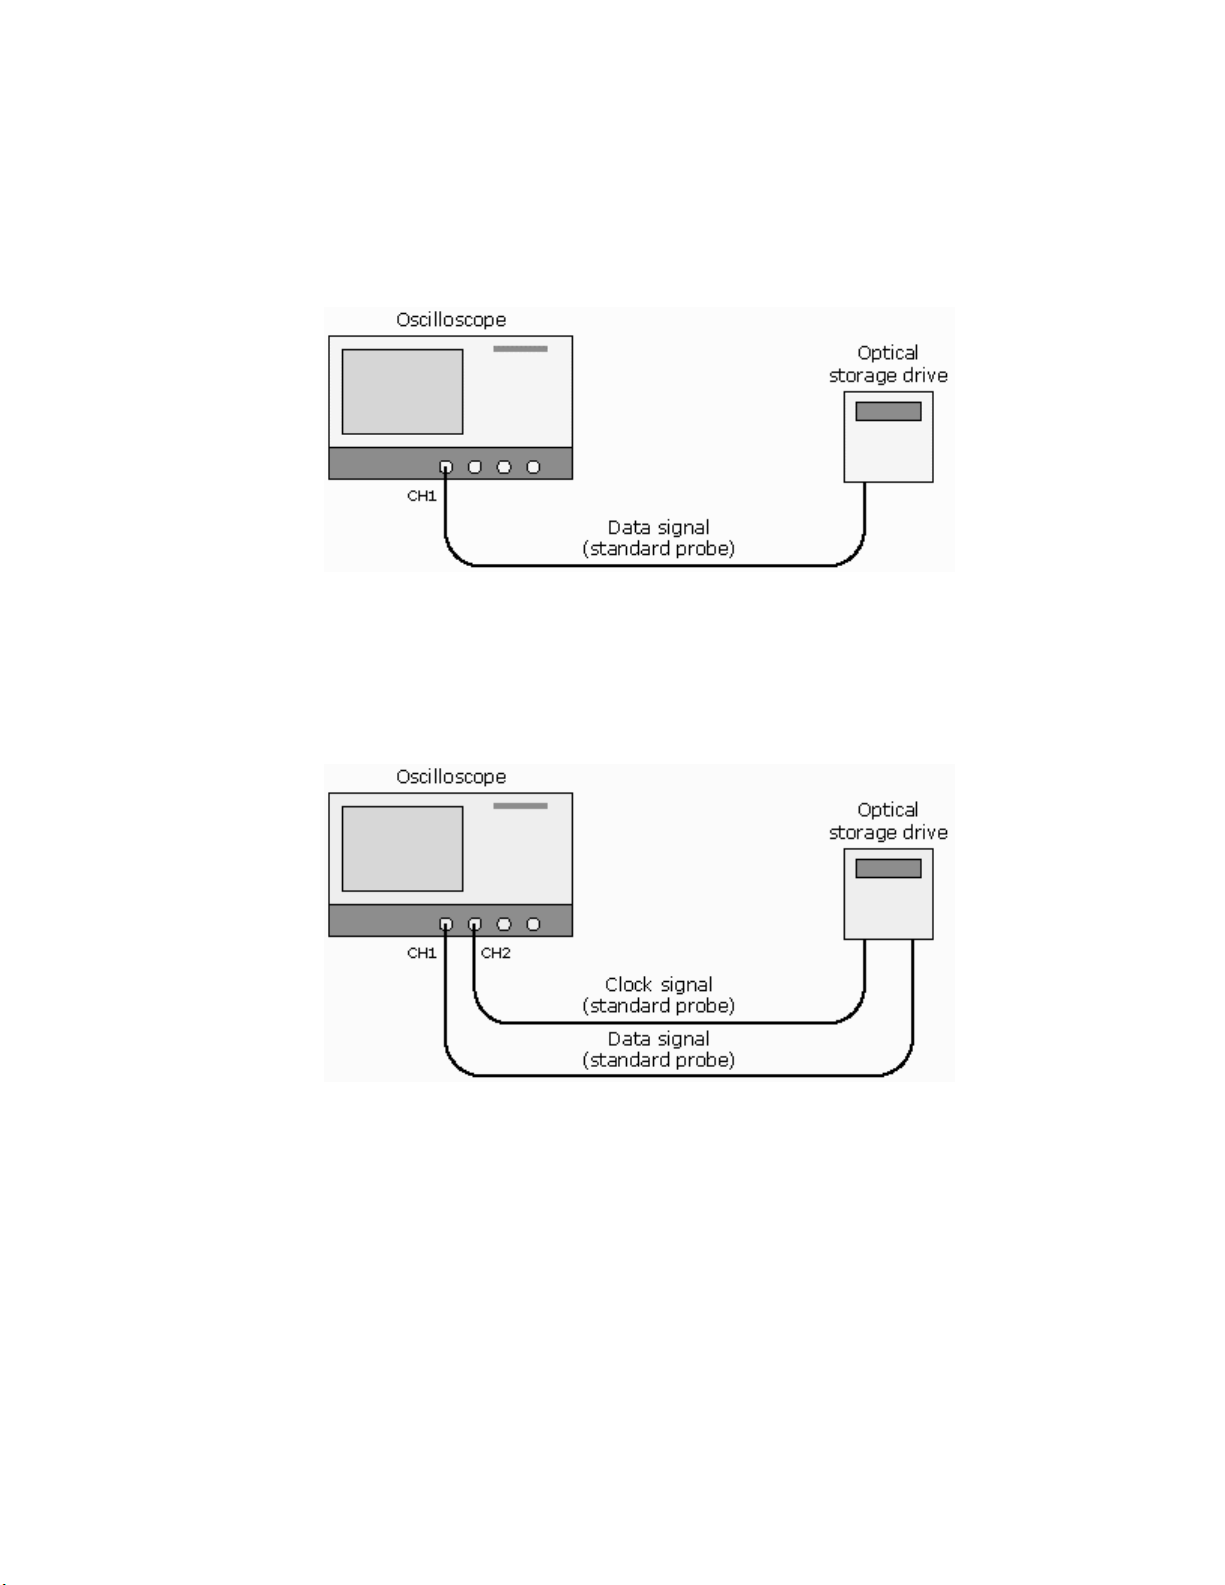
Connecting to a System Under Test
Connecting to a System Under Test (SUT)
WARNING: To avoid injury to eyes, wear eye protection if the
possibility of exposure to high-intensity rays or laser radiation exists.
WARNING: To avoid electric shock, remove power from the SUT
before attaching a probe to it. Do not touch exposed conductors except with the
properly rated probe tips. Refer to the probe manual for proper use.
See Also
Primary Setup: Measuring Data Using Extracted Clock on page 17
Secondary Setup: Measuring Data Using Actual Clock on page 17
16 TDSDVD Optical Storage Analysis Application
Page 17
Getting Started
Primary Setup: MeasuringData Using an Extracted Clock
Use the primary setup to measure the optical drive data signal using an extracted
or ideal (synthesized) clock signal. Connect the optical storage drive to the
oscilloscope as shown below.
Secondary Setup: Measuring Data Using the Actual Clock
Use the secondary setup to measure optical data signal using the actual acquired
clock signal. Connect the optical storage drive to the oscilloscope as shown
below.
TDSDVD Optical Storage Analysis Application
17
Page 18

Getting Started
18 TDSDVD Optical Storage Analysis Application
Page 19

Operating Basics
Operating Basics
Running the Application
To run the application on an oscilloscope, select File > Run Application >
Optical Storage Analysis from the oscilloscope menu bar.
The application uses a Windows interface. When you run the application, the
oscilloscope display shrinks to half size and appears in the top half of the screen,
and then Windows loads the application.
Note.
If you get the error message “Exit the currently running application before
starting another, it may mean that the application is already running on the PC.
You cannot run the application on the PC and an oscilloscope connected to that
PC at the same time. Exit the application on the PC, and then start the
application again on the oscilloscope.
To run the application on a PC, select Start > Programs > TekApplications >
TDSDVD > Optical Storage Analysis.
Note.
If you get the error message “Attempting to run too many applications
concurrently., it may mean that the application is already running on the
oscilloscope. You cannot run the application on the PC and the oscilloscope at
the same time. Exit the application on the oscilloscope, and then start the
application again on the PC.
This message can also mean that you have not enabled the LAN or GPIB servers
on the oscilloscope, which the TekVISA software is not correctly configured, or
the PC has lost communication with the oscilloscope. Refer to Setting Up the
Oscilloscope for Remote Access on page 14 for more information.
It takes a few moments to display the TDSDVD application, which is shown
next.
TDSDVD Optical Storage Analysis Application
19
Page 20
Operating Basics
See Also
The Application Interface on page 20
Exiting the Application on page 25
Taking Measurements Guidelines on page 27
The Application Interface
The following figure shows the TDSDVD application interface, with labels for
the key features, and a table listing the UI functions.
20 TDSDVD Optical Storage Analysis Application
Page 21

Operating Basics
Application User Interface Controls
Item Description
Menu bar Located at the top of the application display and
Area Visual frame that encloses a set of related
Command
buttons
Menu tabs Menu functions grouped by category. The tabs
Option button Button that defines a particular command or
List box Box that contains a list of items from which you
Box Box in which you can enter text or numeric
Scroll bar Vertical or horizontal bar at the side or bottom of
Browse Button that displays a window where you can
Keyboard
button
contains application menus. Selecting a menu
item updates the menu area to show applicable
menu tabs, parameters, or information
options
Buttons in the Control area that initiate an
immediate action
displayed depend on which Menu Bar item is
selected. Select a tab to display the associated
functions
task
can select one item
values, using the keypad or a Multipurpose
knob
a display area used to move the display area for
better viewing of information
look through a list of directories and files
Icon that displays a virtual keyboard that you
can use to enter data into a box
See Also
Command Buttons on page 22
Application Menu Bar on page 24
TDSDVD Optical Storage Analysis Application
21
Page 22
Operating Basics
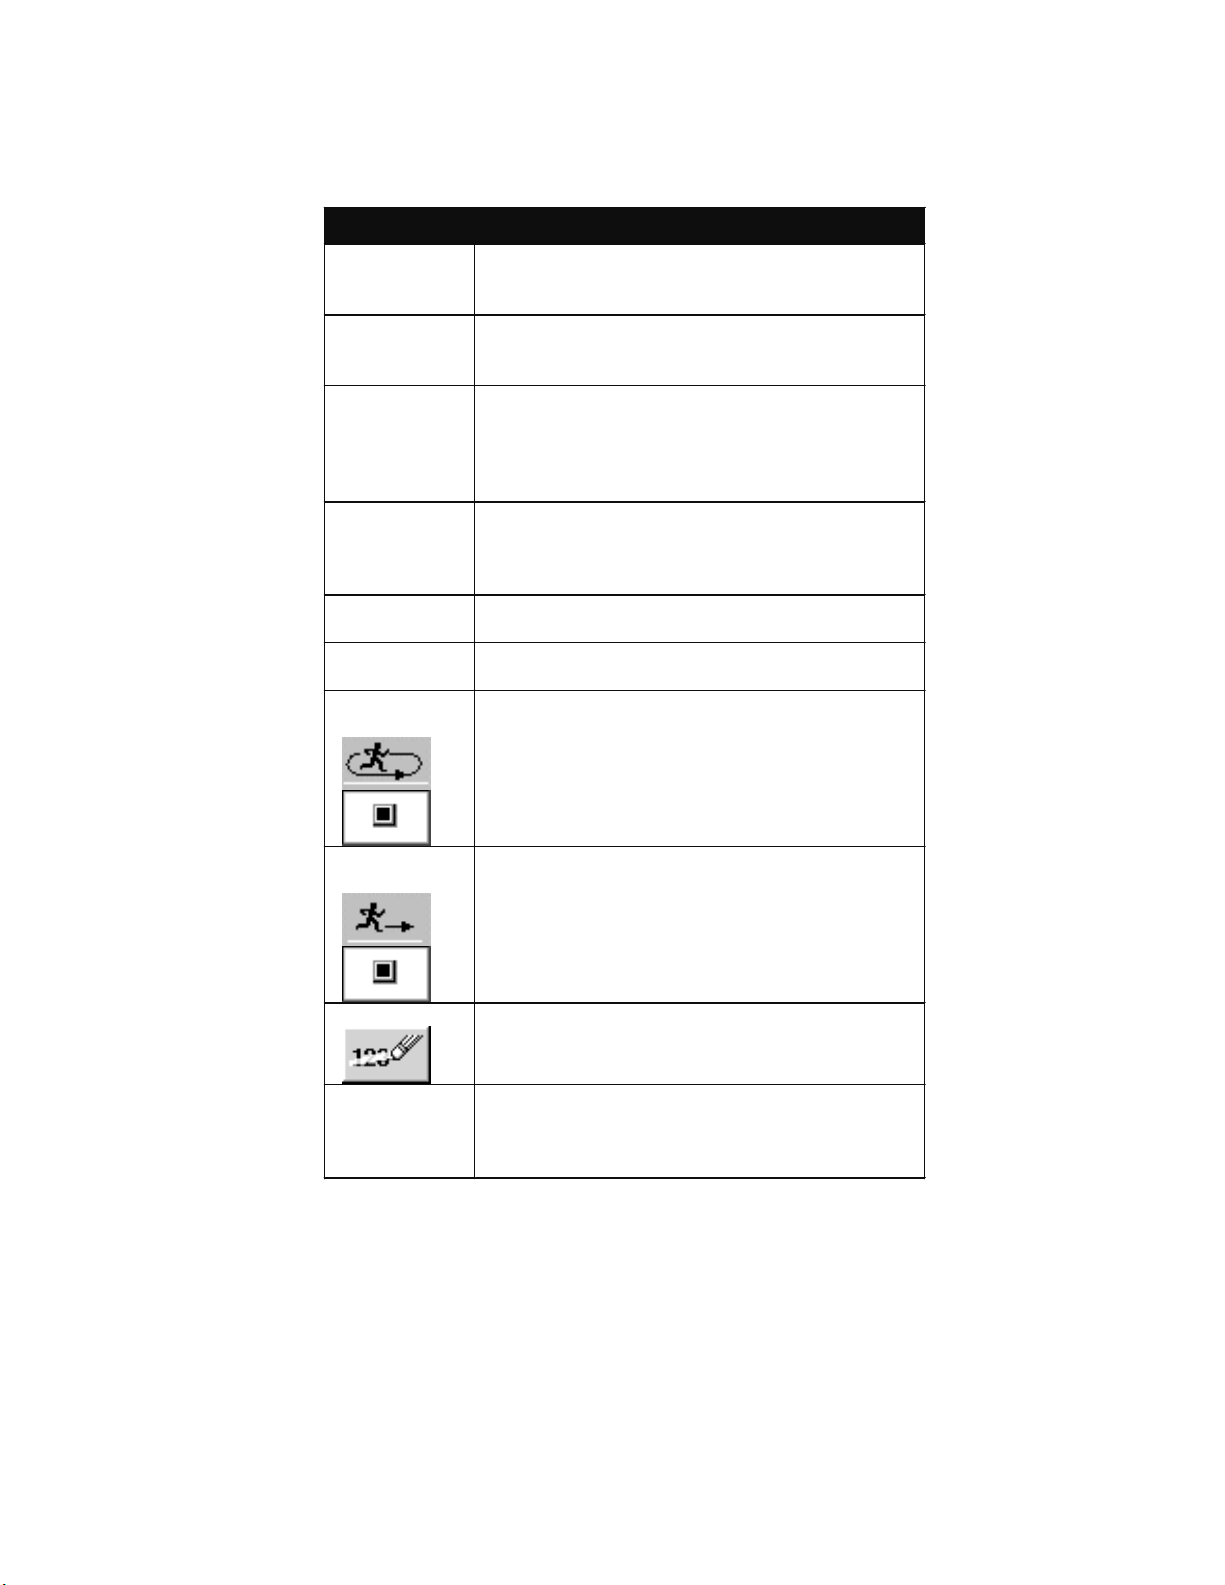
Command Buttons
The Command buttons execute key application tasks, including exiting the
application, acquiring data for measurements, and displaying key graphical
information. The Command buttons are always available.
22 TDSDVD Optical Storage Analysis Application
Page 23
Operating Basics
The Command Button Options
Button Description
Hide Returns the oscilloscope to full screen display.
Exit Exits (quits) the TDSDVD application. You have
Eye Activates or deactivates the Eye display of the
TIA Activates or deactivates the Time Interval
TEC Activates the Track Error Count panel which
Scan Activates the AutoScroll panel to zoom and
Start/Stop
(Free Run)
Start Single
Sequence
Reset All
The application is still running but is behind the
oscilloscope display
the option to restore the oscilloscope settings to
those present prior to starting the application
live HF signal. This mode requires an active
signal. Deselecting returns the oscilloscope to
the settings present prior to starting the Eye
command
Analysis (TIA) display. You must take a Data
Pulse Width measurement prior to selecting the
TIA button
displays the tracking error count
scroll through the waveform data
Starts or stops the measurement in Free Run
mode to make continuous acquisitions
Stops measurement acquisition
Starts a single measurement acquisition
Stops measurement acquisition
Clears all measurement results, including plot
and histogram statistics
Acq/No Acq Starts or stops any further acquistion of data.
When No Acq is displayed, Start/Stop is
disabled and measurements are taken on the
last data acquisition
TDSDVD Optical Storage Analysis Application
23
Page 24
Operating Basics
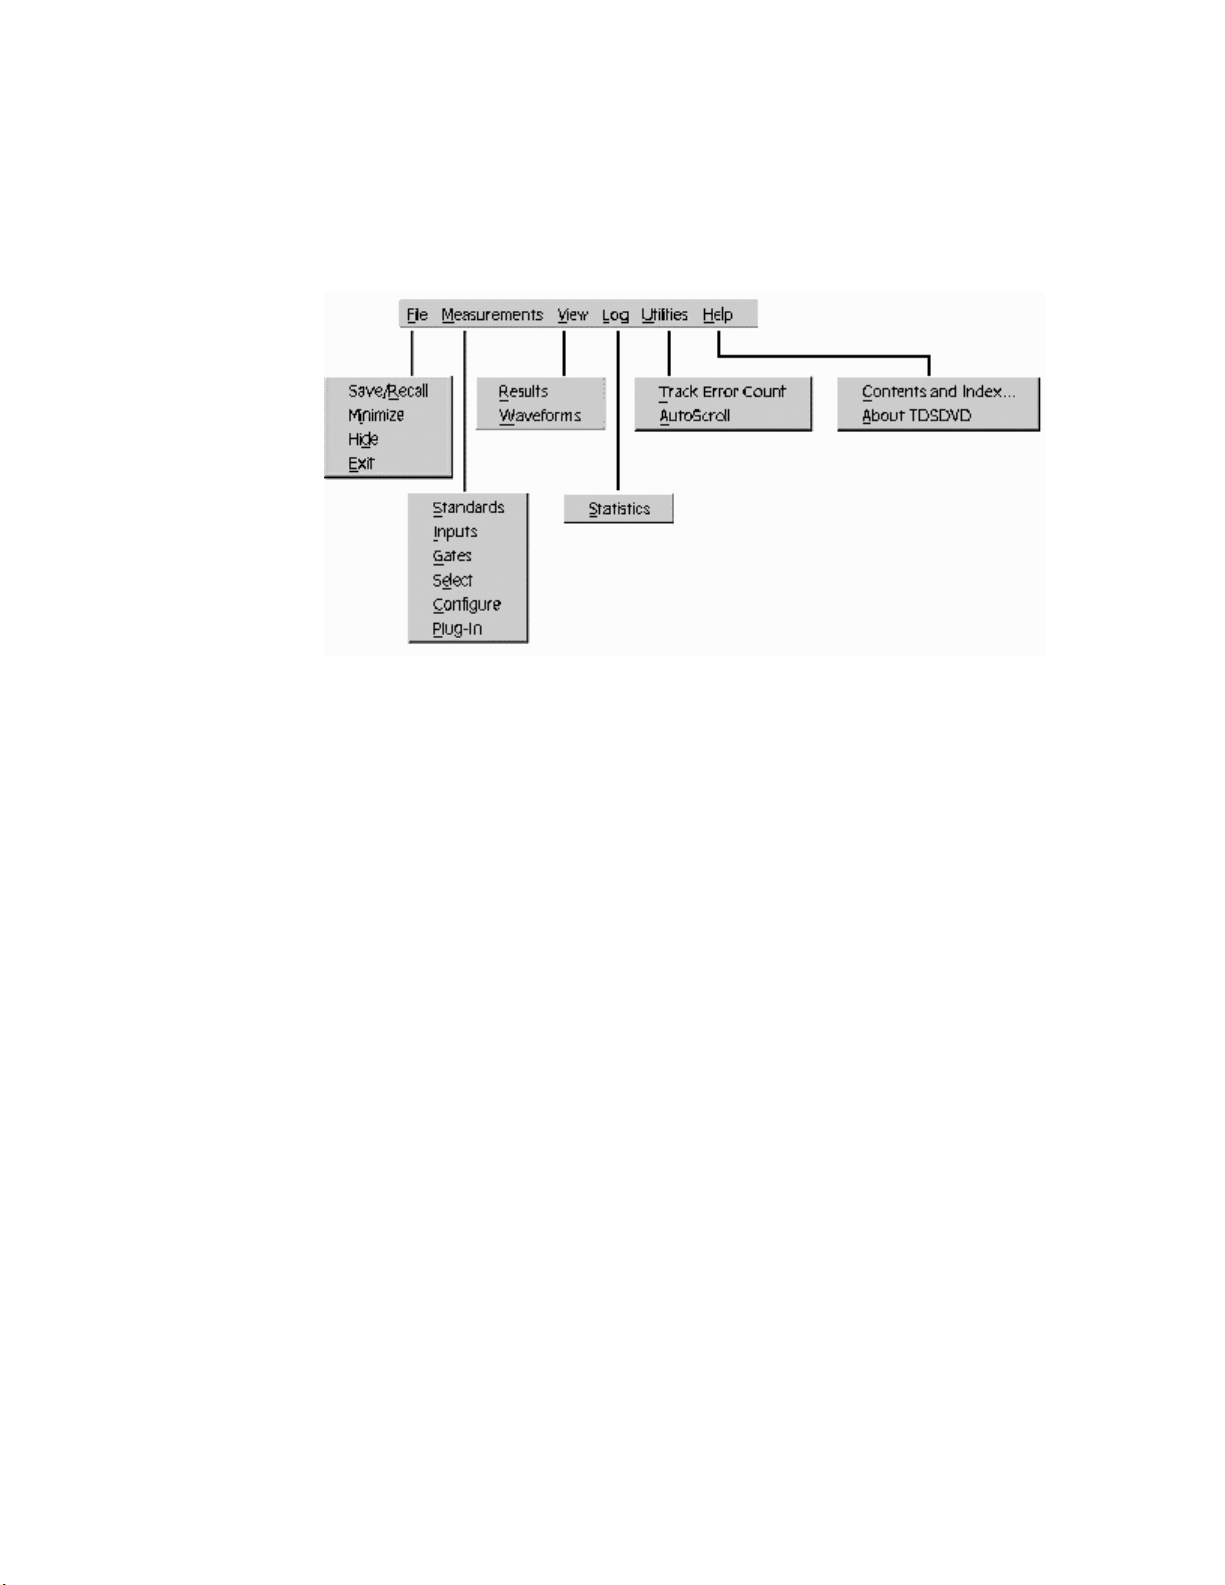
Application Menu Bar
The Menu bar contains the application functions, grouped by category. Selecting
a menu item displays a drop-down menu list of functions.
You can also select menu items from the keyboard by pressing and holding the
Alt key in combination with the letter underlined in the menu or submenu item.
For example, to use the keyboard to display the Measurements > Configure
panel, press and hold the Alt key, press the M key, and then press the C key.
See Also
The Application Menus on page 57
Minimizing and Maximizingthe Application
To minimize the application, select Measurements > Minimize. This maximizes
the oscilloscope and places the application behind the oscilloscope display. The
application remains displayed when you minimize the oscilloscope.
To maximize the application from the Windows task bar, select TDSDVD in the
Windows task bar.
To maximize the application from the oscilloscope, select the App button on the
oscilloscope screen.
Accessing Oscilloscope Functions
When you access oscilloscope functions, the oscilloscope fills the display. You
can access oscilloscope functions in the following ways:
• Select the Hide button in the application display to place the application
window behind the oscilloscope display.
24 TDSDVD Optical Storage Analysis Application
Page 25
Operating Basics
• Choose the Menu-bar or Toolbar mode on the oscilloscope and access
menus.
• Press front-panel buttons.
To return to the application, select the App button on the oscilloscope screen.
Exiting the Application
To exit the application, select the Exit button. When you exit the application,
you can select to keep the oscilloscope setup currently in use with the application
or to restore the oscilloscope setup that was present before you started the
application.
Application Directories
The application uses specific directories to save and recall setup files and uses
specific file name extensions to identify the file type.
The following table lists default directory names.
Directory Used for
C:\Program Files\
TekApplications\tdsdvd
C:\TekApplications\tdsdvd\data Saved measurement results
C:\TekApplications\tdsdvd\log Data log files
C:\TekApplications\tdsdvd\setup Setup files
C:\TekApplications\tdsdvd\waveforms Waveform files
C:\TekApplications\tdsdvd\example
programs
File Name Extensions
File name
extension Description
.csv Comma-separated value file, used to store
.ini Application setup initialization file. The .ini file is saved
.set Oscilloscope setup file that is saved and recalled at the
.wfm Waveform file that can be recalled into reference
Application executable files
list files
Application plug-in example
files
measurement data (individual measurement data or
logged measurement data)
on the instrument (oscilloscope or PC workstation) that
is running the application
same time as an .ini file; both files will have the same
name. The .set file is always saved on the oscilloscope
memory
TDSDVD Optical Storage Analysis Application
25
Page 26

Operating Basics
26 TDSDVD Optical Storage Analysis Application
Page 27

Taking Measurements
Taking Measurements
About Taking Measurements
This section describes the steps to set up and take a measurement, how to replace
the default signal process block functions with MATLAB or DLL user-developed
software, and other common application tasks. You can also do the application
Tutorial, located on page 49, which demonstrates most of the application
functions.
These examples assume the following conventions:
• The TDSDVD application is installed and enabled on the oscilloscope.
• The oscilloscope is connected to the system under test (SUT) using the
appropriate probes.
See Also
Installation on page 13
Taking Measurements Guidelines on page 27
Selecting a Measurement Standard on page 31
Taking Measurements Guidelines
Use the following guidelines when setting up and taking measurements with this
application:
• The data source signal must be a continuous physical data disk recording
of nT pulses with no gaps or non-nT type data.
• The clock period (T) of the data source signal must be constant, but not
necessarily known.
• The application does not change the oscilloscope, acquisition record
length, or sample rate settings in any of the operation modes, including
data and clock Autoset. You must set the desired record length and
sample rate for the application to correctly acquire, process, and measure
the signal. In general, the sample rate should be at least 10 times the
signal clock frequency, and the record length set to display at least 10 to
20 pulses.
• The DVD application measurement accuracy depends on the input
parameter settings. The application is a collection of tools designed for
general measurement and analysis of optical storage-specific signals
without being restricted to a specific standard or signal. As a result, using
the application to measure specific signals generally requires iterations
between configuring the application parameters and analysis and
validation of the measurement results (by viewing the resultant
waveforms).
TDSDVD Optical Storage Analysis Application
27
Page 28

Taking Measurements
• The Extracted Clock and data/clock Autoset functions are meant to be a
convenient way to obtain approximate values for the corresponding
parameters, and produce roughly correct measurement results based on
minimal user interaction. For more accurate results, use the Ideal
(synthesized) clock mode and enter the known clock period. If the clock
period is not known, a good starting point is to use the estimated clock
period value calculated by the application using the Extracted clock.
You can also enter data/clock threshold and hysteresis values to further
refine measurement results. The hysteresis band should be set to a value
that allows the application to discriminate between noise and the actual
pulses in the signal. The Autoset function will select a sufficient value
most of the time. However, the hysteresis of a signal will vary depending
on conditions such as probes and test points. Therefore, the hysteresis
may need slight adjustments based on these conditions. The threshold
value selected by the Autoset function will also vary depending on the
conditions described above, so the threshold value may also require
minor changes.
• Using a synthesized clock speeds up the application considerably, as
calculating the clock period is computationally time-consuming.
• The sampled input signal (live or stored) is not necessarily the signal
being measured. If you route the input signal through the Equalizer or
Low Pass Filter pre-processing blocks, the application measures the
resultant signal from these blocks.
• The Data Source threshold and hysteresis settings apply to the data signal
after signal pre-processing, and not to the sampled input source signal.
The exception to this is when the signal processing path bypasses all
signal process blocks and sends the input signal directly to the
application.
• The data threshold and hysteresis parameters directly affect how
accurately the application categorizes the nT data pulses (pits and
spaces). If the clock is Extracted, then the accuracy of the clock period
(T) estimation is another factor directly affecting the nT pulse
categorization, and depends on its turn on the same data threshold and
hysteresis.
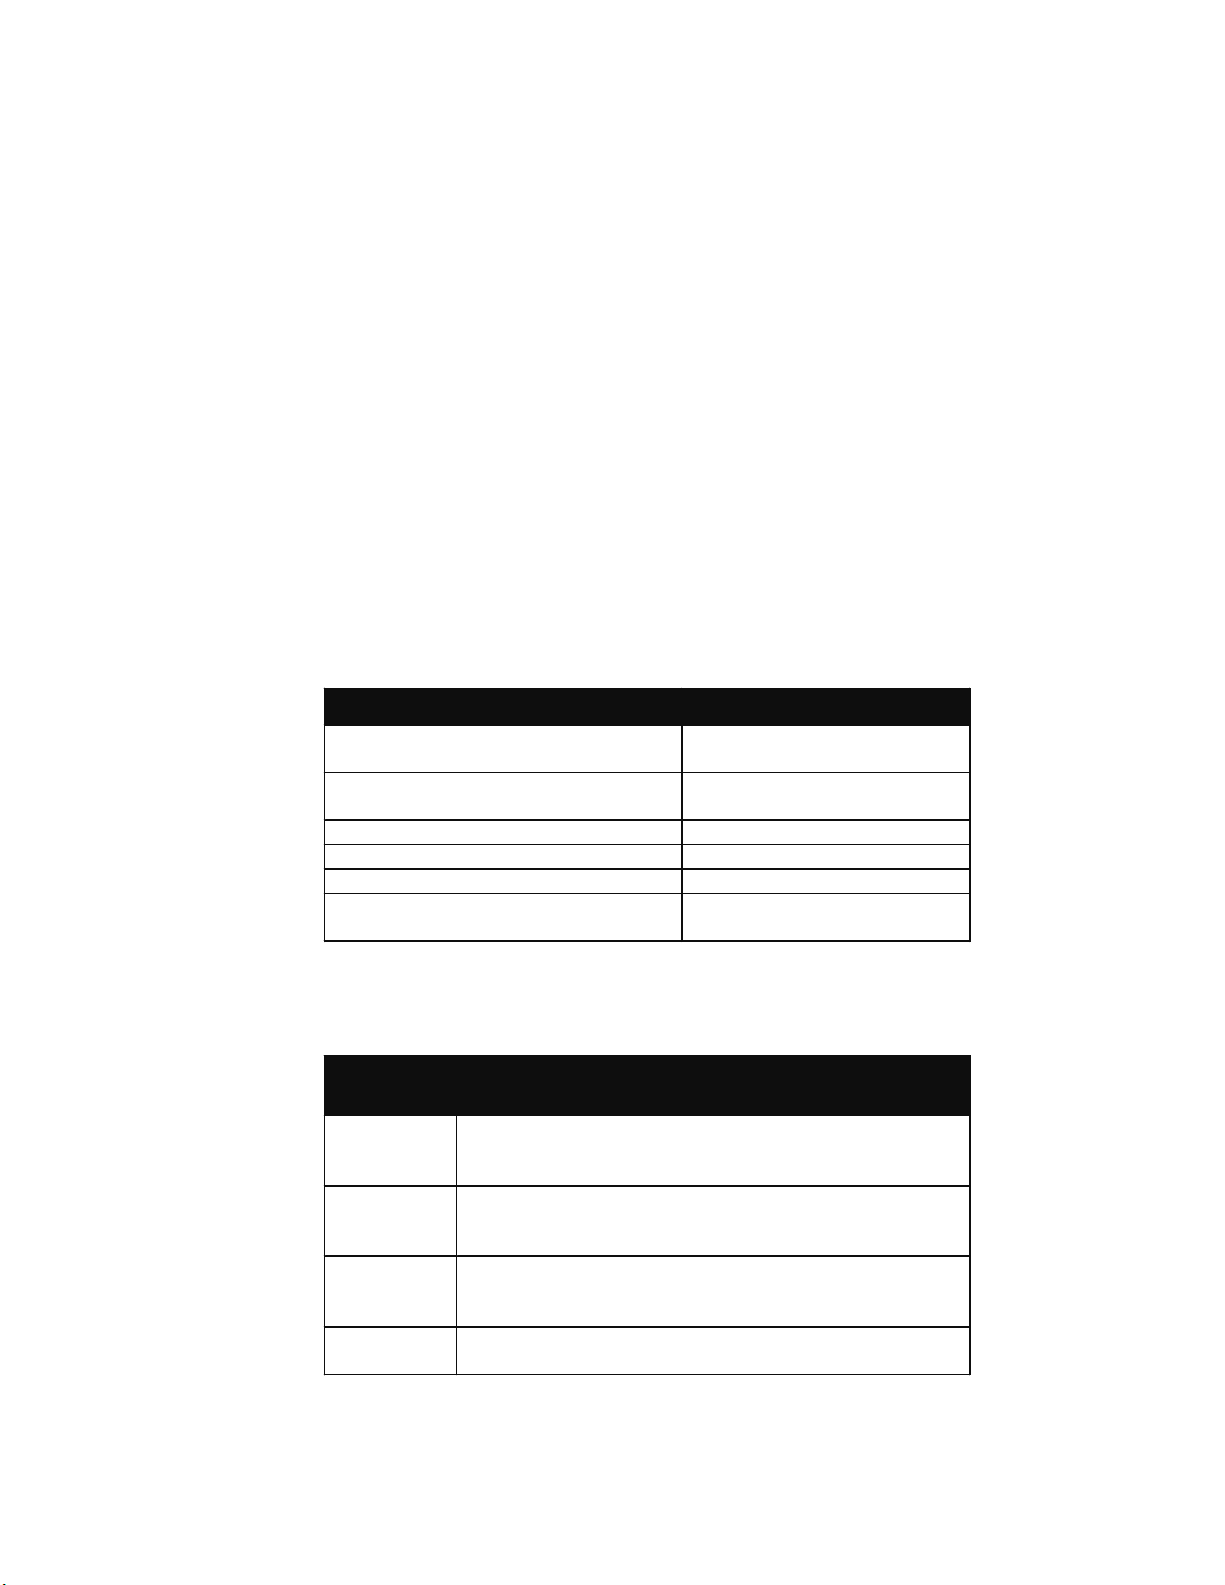
• The Slicer Initial Threshold parameter is important. Because the Slicer
bandwidth is usually small, an incorrect initial threshold setting can
generate very long pulses categorized as having a very large nT (as they
are offset heavily from the threshold). View the Leveled waveform
signal (View > Waveforms > Leveled) and verify that the signal is
centered on the zero volt line, as shown in the following figure.
28 TDSDVD Optical Storage Analysis Application
Page 29
Taking Measurements
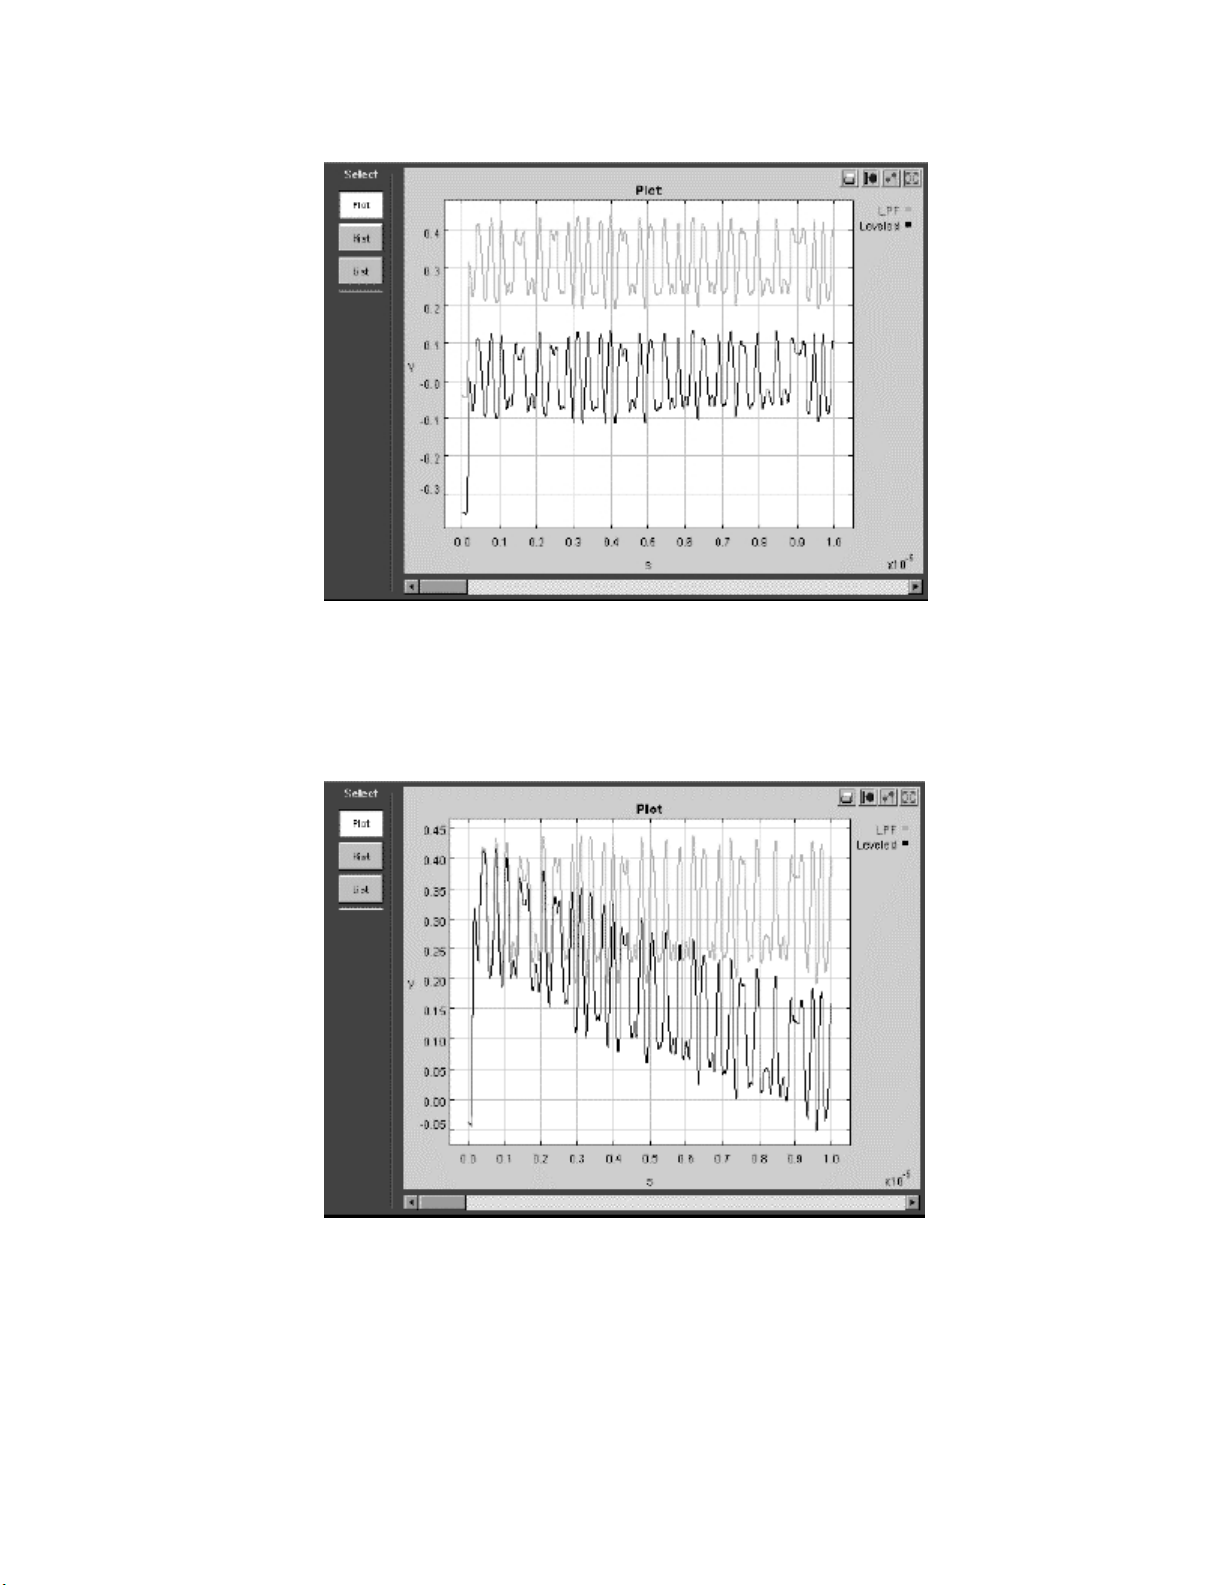
If the Slicer Initial Threshold parameter is incorrect, the Leveled signal is not
centered on zero volts, but slowly adjusts to the zero volt level depending on the
Slicer bandwidth value, as shown in the below figure.
If you are measuring from the LPF output then a good initial value for the Slicer
Initial Threshold parameter is the Autoset calculated data Threshold parameter
value. Viewing the LPF signal (which is the Slicer input) also gives good basis
for estimating an Initial Threshold value for the slicer.
TDSDVD Optical Storage Analysis Application
29
Page 30
Taking Measurements
Amplitude-related measurements depend on peak-to-peak and decision level
measurements on specific nT pulse pairs (and adjacent pit and space with the
same nT). A lack of results for these measurements can be because specified nT
pairs were not found in the input signal. The fact that both pulses and spaces for a
specified nT were found (for example, as indicated by getting results for High
and Low measurements) does not mean that any pit or space with the specified
nT was adjacent to another specified nT pit or space. If no results are returned for
a measurement such as Asymmetry, the Divisor nT value in the Configure panel
may need to be adjusted. In the Results panel, select the detailed results for a
measurement that does have results and search for a row that has the same nT
value for both the Subject and Adjacent columns. Enter this value in the Divisor
nT field of the Configure panel.
Acquiring the Data Signal
To acquire the optical storage drive signal, follow these steps:
1. Connect the oscilloscope to the SUT. The default application signal
source input is Ch 1, and the default clock signal source input is Ch 2.
2. Push the oscilloscope AUTOSET button to acquire and display a signal.
3. Change the oscilloscope horizontal settings to adjust the sample rate. In
general, the sample rate should be at least 10 times the signal clock
frequency, and the record length set to display at least 10 to 20 pulses.
Displaying an Eye Waveform
The Eye button displays an eye waveform of the active data signal. You can use
this to validate the input data source signal.
30 TDSDVD Optical Storage Analysis Application
Page 31

Taking Measurements
To view the eye display, follow these steps:
1. Set up the oscilloscope to acquire an active data signal. You cannot
2. Select the Eye command button.
To display a cleaner eye waveform, set the oscilloscope bandwidth to 20 MHz.
display an eye waveform on a stored reference or math waveform.
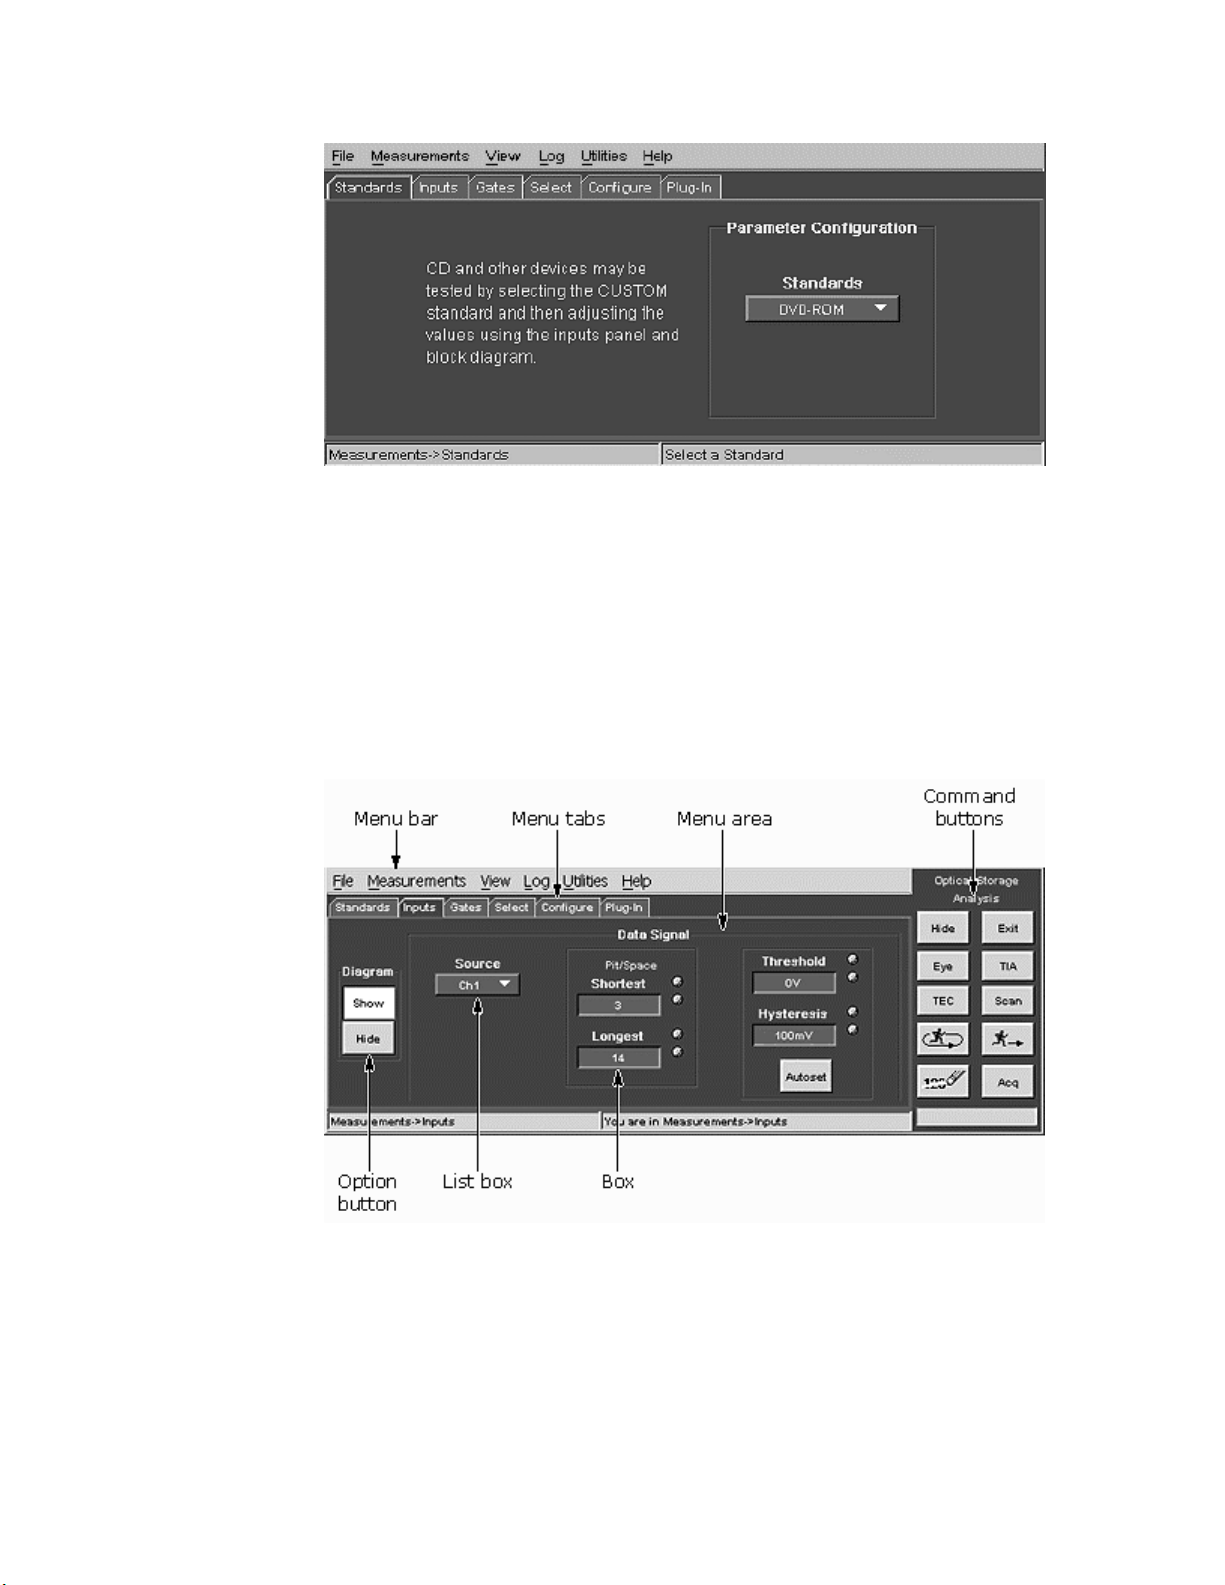
Selecting a Standard
Selecting a MeasurementStandard
To select a measurement standard, follow these steps:
1. Select Measurements > Standards to display the Measurements Standards
menu.
2. Select the Standards button to display a list of available standards.
3. Select a standard from the list. Choosing a standard presets most
measurement parameters.
You can also select Custom and then configure the signal process path and
measurement parameters to create your own custom measurement setups, and
then use the File > Save/Recall menu functions to save and recall custom
measurement setup files.
TDSDVD Optical Storage Analysis Application
31
Page 32

Taking Measurements
Setting Up the Input Options
Data Signal Input Options
To set the Data Signal options, follow these steps:
1. Select Measurements > Inputs to display the Inputs menu. The menu may
be blank except for the Diagram Show/Hide buttons.
2. Select the Diagram Show button to display the Inputs Block Diagram
(IBD).
3. Select the Data Signal button on the IBD diagram. The Inputs menu
updates to show the data signal input parameter fields.
4. Select the Source button to display the source list.
5. Select the data signal source (Ch1-Ch4, Ref1-Ref4, Math1-Math4). The
default value is Ch1.
6. If necessary for your measurement, change the Pit/Space Shortest and
Longest parameter values.
7. Select the Autoset button to automatically set the data signal threshold
and hysteresis parameter values based on the actual data waveform
characteristics. You can also enter your own values for these parameters.
See Also
Using Cursors to Measure Part of a Waveform on page 38
32 TDSDVD Optical Storage Analysis Application
Page 33

Taking Measurements
Clock Signal Input Options
The Clock Signal menu sets the clock signal source, threshold, and hysteresis
parameters. The actual clock signal is used for analyzing measurements when
you select Clock Signal and Clock Source on the IBD.
To set the Clock Signal parameters, follow these steps:
1. Select Measurements > Inputs to display the Inputs menu. The menu may
be blank except for the Diagram Show/Hide buttons.
2. Select the Diagram Show button to display the Inputs Block Diagram
(IBD) menu.
3. Select the Clock Signal button to display the Clock Signal parameter
fields.
4. Select the Source button to display the source list.
5. Select the clock signal source (Ch1-Ch4, Ref1-Ref4, Math1-Math4). The
default value is Ch2.
6. Select the Autoset button to automatically set the threshold and
hysteresis values based on the clock waveform characteristics. You can
also enter your own values for these parameters. Refer to Input Signal
Parameters on page 87 for information on the Clock Signal input
parameters.
TDSDVD Optical Storage Analysis Application
33
Page 34

Taking Measurements
Ideal Clock Period Option
The Ideal Clock menu sets the synthesized clock signal period. The synthesized
clock signal is used for analyzing measurements when you select Ideal Clock and
Synth Clock on the IBD.
To set the Ideal Clock Period, follow these steps:
1. Select Measurements > Inputs to display the Inputs menu.
2. Select the Diagram Show button to display the Inputs Block Diagram
3. Select the Ideal Clock button to display the Period option.
4. Use the general purpose knob or keyboard to change the value. Refer to
Equalizer Options
The Equalizer Coefficients menu lets you view and set the equalizer coefficient
options.
Note.
The default values are based on the selected standard. Changing any equalizer
option causes the application to change the standard type to Custom.
To set equalizer options, follow these steps:
1. Select Measurements > Inputs to display the Inputs menu.
(IBD) menu.
Input Signal Parameters on page 89 for information on the Ideal Clock
values.
2. Select the Diagram Show button to display the Inputs Block Diagram
(IBD) menu.
3. Select the Equalizer button to display the Equalizer Coefficients options
menu.
34 TDSDVD Optical Storage Analysis Application
Page 35

Taking Measurements
4. Use the general purpose knob or keyboard to change a value. Refer to
See Also
Equalizer Coefficient Parameters on page 90 for information on the
equalizer parameter values and ranges.
Default Standards Parameters Table 1 on page 87
Low Pass Filter Options on page 35
Slicer Options on page 36
Phase-Locked Loop Options on page 37
Low Pass Filter Options
The Low Pass Filter menu lets you view and set the low pass filter bandwidth
corner frequency.
Note.
Default parameter values are based on the selected standard. Changing the Low
Pass Filter option causes the application to change the standard type to Custom.
To set low pass filter options, follow these steps:
1. Select Measurements > Inputs to display the Inputs menu.
2. Select the Diagram Show button to display the Inputs Block Diagram
(IBD) menu.
3. Select the Low Pass Filter button to display the Low Pass Filter menu.
TDSDVD Optical Storage Analysis Application
35
Page 36

Taking Measurements
4. Use the general purpose knob or keyboard to change the value. Refer to
Low Pass Filter Parameters on page 90 for information on the Bandwidth
parameter values and ranges.
See Also
Default Standards Parameters Table 1 on page 87
Equalizer Options on page 34
Slicer Options on page 36
Phase-Locked Loop Options on page 37
Slicer Options
The Slicer menu lets you view and set the Slicer bandwidth corner frequency and
feedback loop initial threshold voltage.
Note.
Default parameter values are based on the selected standard. Changing the
Slicer options causes the application to change the standard type to Custom.
To set Slicer options, follow these steps:
1. Select Measurements > Inputs to display the Inputs menu.
2. Select the Diagram Show button to display the Inputs Block Diagram
(IBD) menu.
3. Select the Slicer button to display the Slicer menu.
36 TDSDVD Optical Storage Analysis Application
Page 37

Taking Measurements
4. Use the general purpose knob or keyboard to change a value. Refer to
See Also
Slicer Parameters on page 90 for information on the Bandwidth and
Initial Threshold parameter values and ranges.
Default Standards Parameters Table 1 on page 87
Equalizer Options on page 34
Low Pass Filter Options on page 35
Phase-Locked Loop Options on page 37
Phase-Locked Loop Options
The Phase-Locked Loop (PLL) menu lets you view and set the open loop
bandwidth (BW) and PLL type based on the measurement standard. The filter
transfer function characteristics chart changes depending on which PLL type you
select.
Note.
Default parameter values are based on the selected standard. Changing the PLL
parameters causes the application to change the standard type to Custom.
To set PLL options, follow these steps:
1. Select Measurements > Inputs to display the Inputs menu.
2. Select the Diagram Show button to display the Inputs Block Diagram
(IBD) menu.
3. Select the PLL button to display the Phase-Locked Loop menu.
TDSDVD Optical Storage Analysis Application
37
Page 38

Taking Measurements
Use the general purpose knob or keyboard to change a value. Refer to PhaseLocked Loop Parameters on page 91 for information on the Bandwidth and PLL
Type parameter values and ranges.
See Also
Default Standards Parameters Table 1 on page 87
Equalizer Options on page 34
Low Pass Filter Options on page 35
Slicer Options on page 36
Using Cursors to Measure Part of a Waveform
To use cursor gating to mark your measurements, follow these steps:
1. Select Measurements > Gates to display the Gated By menu.
2. Select the Cursors button. Vertical cursors appear on the oscilloscope
screen.
3. Use the general purpose knobs, mouse, or touch screen to move the cursors
to select the portion of the waveform to analyze.
4. Select and configure your measurements.
5. Select the Start/Stop Free Run or Start a Single Sequence Control button to
start the signal acquisition. The application displays the Results Summary
area with a table listing a summary of the statistical measurement values for
all selected measurements, for the area within the cursors.
6. If you selected the Start/Stop Free Run command button, select that button
again to stop signal acquisition.
7. To turn off cursor gating, select Measurements > Gates and select the None
button. Selecting None sets the application to evaluate the entire signal.
See Also
Measurements Gates Menu on page 69
38 TDSDVD Optical Storage Analysis Application
Page 39

Taking Measurements
Selecting and Configuring Measurements
Selecting Measurements
To select one or more measurements, follow these steps:
1. Select Measurements > Select to display the Measurement Select menu.
There are three measurement type groups: Amplitude, Modulation, and
Time.
2. Select the measurements you want to take. You can select up to six
measurements, in any combination, from any of the measurement type
groups.
Note.
To display a Time Interval Analysis (TIA) plot, you must select Data Pulse Width
as one of your measurements.
Configuring Measurements
To configure one or more measurements, follow these steps:
1. Select Measurements > Configure to display the Configure menu. Available
measurements (that were selected in the Measurement Select menu) are
listed on the button icons at the top of the menu, in the order they were
selected.
2. Select a measurement button. The menu highlights the available parameter
fields for that measurement, and grays-out any fields that do not apply to
the selected measurement.
3. Enter any changes to these fields as necessary for your measurement.
TDSDVD Optical Storage Analysis Application
39
Page 40

Taking Measurements
Note.
All measurements use the same set of parameters: you cannot set different
parameter values for each measurement. For example, you cannot set the Adj
Pos value to Leading for one measurement and then set it to Trailing for a
different measurement.
See Also
Saving a Setup on page 42
Taking Measurements
Taking Measurements
To take a measurement, follow these steps:
1. Select the Start/Stop Free Run or Start a Single Sequence Control button to
start the signal acquisition. The application displays the Results Summary
area with a table listing a summary of the statistical measurement values for
all selected measurements.
2. If you selected the Start/Stop Free Run command button, select that button
again to stop signal acquisition.
Note.
Do not change oscilloscope settings while taking a measurement. Doing so stops
the measurement acquisition.
Viewing Results
Viewing Measurement Results
To view measurement results, follow these steps:
1. If not already displayed, select View > Results to display the Results
Summary area with a table listing a summary of the statistical measurement
values for all selected measurements.
2. Select a measurement tab in Results Summary to display the Results
Measurement area that contains more information for that measurement,
listed in order of nT subject/adjacent pairs.
3. In the Results Measurement area, select a button in the Details column to
display the Measurement Details area and plot or save the selected nT
subject/adjacent pair measurement values.
Using Track Error Count
Track Error Count (TEC) counts the number of pulses (pit and/or spaces) in the
track error signal. To use the Track Error Count, follow these steps:
1. Only configure the settings for Data Source, Threshold and Hysteresis in
the Measurement Inputs menu. The input threshold and hysteresis values, as
40 TDSDVD Optical Storage Analysis Application
Page 41

Taking Measurements
well as the outputs of the various signal-processing blocks, can affect the
TEC value.
2. Select the TEC button on the Control panel, or select Utilities > Track Error
Count, to display the Track Error Count panel.
3. Select the Single or Start/Stop Free Run button from the Control Panel. The
track error count appears in the Track Error Count field.
Note.
No other measurements are executed, even if they are selected on the
Measurement Select panel.
Displaying a Time Interval Analysis (TIA) Plot
The TIA (Time Interval Analysis) command button displays time interval data
from the Data Pulse Width measurement.
To display the TIA data, follow these steps:
1. Select Measurement > Select.
2. Select the Data Pulse Width measurement.
3. Select the Start/Stop Run Free or the Run One command button.
4. If you selected the Start/Stop button, select it again to stop data acquisition.
5. Select the TIA command button to display the Time Interval Analysis plot.
6. Select Ctrl on the TIA plot to display the Bin Resolution menu and change
the Bin Resolution if needed.
If you do not take a Data Pulse width measurement prior to selecting the TIA
button, or there is no Pulse Width measurement data, the application displays a
TIA Instructions message (below). The message lists the process steps to do to
display a TIA plot.
TDSDVD Optical Storage Analysis Application
41
Page 42

Taking Measurements
Using AutoScroll
To use AutoScroll, follow these steps:
1. Go to Utilities> Autoscroll. You can also select the Scan button on the
Control Panel to go directly to the AutoScroll panel.
2. Select the Off (default) button to toggle AutoScroll to On.
3. Select Position to enter a percentage of position of the oscilloscope screen.
4. Select Step Size to enter the size of the step.
5. Select Scale to set the scaling.
6. Select the Start/Stop Free Run button on the Control Panel.
7. AutoScroll automatically scrolls the zoom window through the record.
See Also
AutoScroll Menu on page 85
Saving and Recalling Setups
Saving a Setup
To save a measurement configuration to a file, follow these steps:
1. Select File > Save/Recall to display the Save/Recall menu.
2. Select Save to display the Enter/Select File Name to Save dialog.
3. Select or enter a file name. The menu sets the folder location, which is
C:\TekApplications\tdsdvd\setup.
4. Select the Save button. The application saves the oscilloscope setup
information to a .set file, and the application setup information to a .ini file.
42 TDSDVD Optical Storage Analysis Application
Page 43

Taking Measurements
Note.
Setup and initialization files must both be located in the directory
C:\TekApplications\tdsdvd\setup, for both oscilloscope and PC application
operation.
Recalling a SavedSetup
To recall a measurement configuration from a saved setup file, follow these
steps:
1. Select File > Save/Recall.
2. Select the Recall… button to display the Select File to Recall window.
3. Select the .ini setup file name to recall. The menu uses the folder location
C:\TekApplications\tdsdvd\setup.
4. Select Open. The application loads the application initialization and
oscilloscope setup files and reconfigures the application and oscilloscope.
Note.
Setup and initialization files must both be located in the directory
C:\TekApplications\tdsdvd\setup, for both oscilloscope and PC application
operation.
Restoring Default Settings
To restore the application default settings, follow these steps:
1. Select File > Save/Recall.
2. Select the Default button.
Saving Results to a File
Logging a Measurement to a File
To save a series of measurement results for one measurement to a data log file,
follow these steps:
1. Select Log > Statistics to display the Data Logging menu.
TDSDVD Optical Storage Analysis Application
43
Page 44

Taking Measurements
2. Select the measurement button in the Selected Measurements area to select
the measurement to log. You can log up to six measurements at a time, but
you must select and enable each measurement for logging.
3. To save the log file to a file name or directory other than the default name
and directory, select the Browse button to display the Open file dialog.
Specify a new file name and/or directory. The default directory is
C:\TekApplications\tdsdvd\log. The default file name is an abbreviation of
the measurement name with a .csv extension.
4. Select the Logging button to On.
5. Repeat steps 2-4 for each measurement you want to log.
6. Select the Start/Stop command button to start acquiring multiple
measurements.
7. Select the Start/Stop command button to stop acquiring measurements after
a period of time.
8. Select Log > Statistics to display the Data Logging menu.
9. Select the Logging button to Off to close the data log file. You can now
open and view the log file.
See Also
Viewing a Data Log File on page 44
Data Log File Format on page 45
Data Log File Example on page 45
Viewing a Data Log File
You can open the .csv data log file in a spreadsheet, database, text editor or data
analysis program for further analysis.
You can use Notepad or Wordpad to quickly view the results in the data log file.
See Also
44 TDSDVD Optical Storage Analysis Application
Page 45

Taking Measurements
Data Log File Format on page 45
Data Log File Example on page 45
Data Log File Format
The data log file consists of one header row and rows of logged information. The
header row contains the application name, the version number of the application,
and the date and time on which the file was created. The remaining rows contain
information for the measurements. The information will vary with the
measurements being logged.
Note.
If you are using a GPIB program to execute the application, you can add your
own annotation to the data log file by using the logAnnotate GPIB command.
You can add information consisting of up to 20 characters; the custom
information will appear after the date and time in the rows of logged data.
See Also
Logging a Measurement to a File on page 43
Viewing a Data Log File on page 44
Data Log File Example
The following is an example of a Decision Level measurement log file, as viewed
with Notepad:
TDSDVD,1.0 (7/20/02),Wed Jul 24 15:28:54 PDT 2002,
Measurement,Dec Level
Data Source,Ch1
Clock Source,Ch2
Gated By,None
Standard,CUSTOM
Input Signal Type,HF
Output Signal Type,LPF
Output Clock Type,Extracted
Data Hysteresis,0.3
Clock Hysteresis,0.1
Data Threshold,-0.053
Clock Threshold,0.0
Acq#, Mean, Min, Max, Std Dev, Population
0, -0.0366, -0.0750, 0.02622, 0.01906, 811.0
1, -0.0369, -0.0739, 0.02548, 0.01897, 816.0
TDSDVD Optical Storage Analysis Application
45
Page 46

Taking Measurements
2, -0.0363, -0.0750, 0.02574, 0.01918, 824.0
3, -0.0371, -0.0750, 0.02503, 0.01894, 820.0
4, -0.0366, -0.0755, 0.02535, 0.01899, 816.0
5, -0.0361, -0.0749, 0.02590, 0.01938, 808.0
6, -0.0364, -0.0743, 0.02572, 0.01903, 806.0
7, -0.0370, -0.0748, 0.02518, 0.01905, 812.0
8, -0.0368, -0.0748, 0.02500, 0.01904, 810.0
9, -0.0370, -0.0746, 0.02514, 0.01909, 814.0
10, -0.0363, -0.0750, 0.02577, 0.01902, 816.0
11, -0.0363, -0.0830, 0.02550, 0.01907, 811.0
12, -0.0361, -0.0741, 0.02591, 0.01896, 816.0
13, -0.0364, -0.0747, 0.02545, 0.01891, 818.0
14, -0.0366, -0.0745, 0.02532, 0.01905, 811.0
Using Custom Plug-In Processes
Using the Plug-In Feature
To select a user-defined plug-in process, follow these steps:
1. Select Measurements > Plug-In to display the Plug-in Setup menu.
2. Select the Custom button.
3. Select the Plug-in Type drop-down list button for the block type you are
replacing.
4. Select your own custom .dll or MATLAB file. If you selected MATLAB,
use the Browse button to select a filename of the plug-in.
During the next measurement acquisition, the application passes waveform data
to the specified plug-in file, which processes the data and returns the results to
the application.
See Also
MATLAB Plug-in Usage Conventions on page 74
DLL Plug-in Usage Conventions on page 74
Replacing the Built-In Low Pass Filter with a MATLAB Process on page 46
Replacing the Built-in Equalizer with a DLL process on page 47
Replacing the Built-In Low Pass Filter with a MATLAB Process
The following steps describe how to substitute a MATLAB-based (.M file) 4thorder Butterworth Low Pass Filter for the built-in 6
Filter.
th
-order Bessel Low Pass
Note.
MATLAB version 6.1 (or later) must be installed on the oscilloscope or PC that
is running the application.
46 TDSDVD Optical Storage Analysis Application
Page 47

Taking Measurements
1. Make sure you can run the Tektronix-provided file tekLPF.m in MATLAB.
2. Copy the file tekLPF.m (located at C:\TekApplications\tdsdvd\Example
Programs) under another file name in the same directory. Make sure to
include the .m extension.
3. Edit the newly created file and replace the line
runExampleJavaorMATLAB = 1; with
runExampleJavaorMATLAB = 0;
4. Save the file.
5. In the application, select the Measurements > Plug-in to display the Plug-in
menu.
6. Select the Custom button.
7. Select the LPF list box and select MATLAB from the list.
8. Select the Browse button associated with the LPF field to display a file
open menu.
9. Select the file name of the .m file you just created.
10. Select Open. The application closes the file menu and sets the Low Pass
Filter process block to use the Plug-in MATLAB file instead of the built-in
process.
Replacing the Built-in Equalizer with a DLL process
The following steps describe how to substitute a custom .dll equalizer process for
the built-in equalizer process.
1. Create a new .dll file for your custom equalizer process.
2. Save the file. You must use a specific name for the file, and save the file to
a particular directory. Refer to DLL Plug-in Usage Conventions on page 74
for information on custom .dll file naming and location conventions.
TDSDVD Optical Storage Analysis Application
47
Page 48

Taking Measurements
3. In the application, select the Measurements > Plug-in tab to display the
Plug-in menu.
4. Select the Custom button.
5. Select the EQ button and select DLL from the list. The application sets the
Equalizer process block to use the custom .dll process file instead of the
built-in process.
See Also
Replacing the Built-In Low Pass Filter with a MATLAB Process on page 46
48 TDSDVD Optical Storage Analysis Application
Page 49

Tutorial
Tutorial
Introduction to the Tutorial
This tutorial teaches you how to set up the application, take a measurement, view
the results, and save the results.
Tutorial Conventions
• This tutorial assumes that you have correctly installed the application
onto an oscilloscope. If you have not done so, go to Installation on page
13 for information on installing the application.
• Run this tutorial from an application that is running on an oscilloscope.
• Perform the tutorial steps in the order listed in order to obtain the results
shown in the tutorial.
See Also
Stopping the Tutorial on page 55
Returning to the Tutorial on page 56
Setting up the Oscilloscope
To set up the oscilloscope, follow these steps:
1. In the oscilloscope menu bar, select File > Recall Default Setup to set the
oscilloscope to the default factory settings.
2. Push the individual CH 1, CH 2, CH 3, and CH 4 buttons as needed to
remove active waveforms from the display.
Recalling a Waveform
The application includes a waveform file that you can use with this tutorial.
To recall the tutorial waveform file to Ref1 on to the oscilloscope, follow these
steps:
1. In the oscilloscope menu bar, select File > Reference Waveforms >
Reference Setup.
2. Select the Ref 1 tab.
3. Select the Recall button. Navigate to the
C:\TekApplications\tdsdvd\waveforms directory.
TDSDVD Optical Storage Analysis Application
49
Page 50

Tutorial
4. Select the 50k-DVD-ROM.wfm file.
5. Select the Recall button.
Starting the Application
Note.
The application must be installed and enabled on the oscilloscope.
To start the application, go to the oscilloscope menu bar and select File > Run
Application > Optical Storage Analysis. The application takes a few moments to
start up.
For this tutorial you will use the DVD-ROM standard, which is the default
standard.
Setting Up the Signal Source
Before you can take a measurement, you must select the signal standard, source
type, and then define the signal options.
To set up the signal standard and source, follow these steps:
1. In the application menu bar, select Measurements > Inputs.
2. Select the Diagram Show button to display the Inputs Block Diagram
window.
3. Select the Data Signal button in the diagram. The Inputs menu updates to
show the data signal input parameter fields.
4. Select Ref1 from the Source drop-down list.
5. Select the Autoset button to set the signal threshold and hysteresis values
based on the actual waveform.
50 TDSDVD Optical Storage Analysis Application
Page 51

Tutorial
Selecting the Measurement
For this tutorial you will take a Data Pulse Width measurement. To take a Data
Pulse Width measurement, follow these steps:
1. Select Measurements > Select to display the Select Measurement menu.
2. Select the Data Pulse Width button.
Configuring the Me asurement
Each measurement has a number of options you can adjust. Selecting a standard
pre-defines many of these options. For this tutorial, you will change the Subject
From n and the Adjacent Position parameters for the Data Pulse Width
measurement.
To change the measurement configuration parameters, follow these steps:
1. Select Measurements > Configure to display the Measurement Configure
menu.
2. Select the Data PW button. The menu highlights the options associated with
the Data Pulse Width measurement.
3. In the Subject nT area, change the From n = value to one (1)
4. In the Adj Pos area, select Leading OR Trailing from the list box.
5. Leave all other options at their default values.
TDSDVD Optical Storage Analysis Application
51
Page 52

Tutorial
Taking the Measurement
You are now ready to take the Data Pulse Width measurement.
To take the measurement, select the Start Single Sequence command button. The
application analyzes the signal and then displays the View Results menu to
display the measurement results summary data, as shown below. The View
Summary menu shows overall statistical information for the measurement.
Note also that the summary results include the clock period value (T) in the lower
left corner. This is the clock period that was extracted (recovered) from the data
signal.
52 TDSDVD Optical Storage Analysis Application
Page 53

Tutorial
Viewing the Results
You can view more detailed information about the Data Pulse Width
measurement, including measurements listed by nT, and graphical plots of listed
nT values.
To view more detailed information, select the Data PW tab. The application
displays the View Results Measurement panel, as shown below. The
measurement panel lists the statistics for each subject and adjacent nT
measurement, listed in ascending order, subtotals for each group of subject
measurements, and a measurement total (at the bottom of the list).
The Details column lets you select a particular subject/adjacent nT measurement
and display the measurement values as a linear plot, a histogram, or as a list of
values.
TDSDVD Optical Storage Analysis Application
53
Page 54

Tutorial
Displaying a Measurement Histogram
To display a histogram plot of the total Data Pulse Width measurement value,
follow these steps:
1. Scroll to the bottom of the measurement list
2. Select the button in the Details column adjacent to the Total label in the
Subj column. This displays the Measurement Details area and plots the
selected measurement data as a linear graph.
3. In the Measurement Details area, select the Hist button. The area redraws
the data as a histogram, as shown below.
54 TDSDVD Optical Storage Analysis Application
Page 55

Tutorial
Displaying a Time Interval Analysis (TIA) plot
To display a Time Interval Analysis plot (which uses the Data Pulse Width
measurement values), select the TIA command button. The application displays
the TIA plot, as shown below.
Saving the Measurement Data
To save the measurement results to a data log file, follow these steps:
1. From the application menu bar, select Log > Statistics. The application
displays the Data Logging menu.
2. Select the measurement to log. For this tutorial, only the Data Pulse Width
measurement is available, so select the Data PW button.
3. Select the Save Current button to save the Data Pulse Width measurement.
The application saves each measurement in a different file, with the
measurement type as the default name. For this tutorial, the application
saved the data in file Data PW.csv, in the C:\TekApplications\TDSDVD\log
directory.
Note.
The format of the log file contents depends on the measurement.
You have completed the TDSDVD application tutorial.
Stopping the Tutorial
If you need more than one session to complete the tutorial lessons, you can stop
the tutorial and return to it another time.
To save the application setup and stop your session, refer to Saving a Setup on
page 42.
TDSDVD Optical Storage Analysis Application
55
Page 56

Tutorial
Returning to the Tutorial
To return to the tutorial setup, you can start the application and then recall the
saved setup. To recall the application setup, refer to Recalling a Saved Setup on
page 43.
56 TDSDVD Optical Storage Analysis Application
Page 57

Reference
Reference
Menus
The following sections provide information on specific application menu
functions.
The File Menu
The File menu provides the following functions:
The File Menu
The Measurements Menu
The View Menu
The Log Menu
The Utilities Menu
The Help Menu
• Save/Recall saves and recalls application setup information. Use this to
save and restore standard and custom measurement configurations.
• Minimize minimizes the application window onto the Windows task bar.
• Hide hides the application window.
• Exit closes (quits) the application. You have the option to restore the
oscilloscope settings that were present prior to starting the application.
Save/Recall Menu
The Save/Recall menu lets you save and recall application measurement
configuration settings to a file. You also use this menu to recall the default
application settings.
TDSDVD Optical Storage Analysis Application
57
Page 58

Reference
Save/Recall Menu Options
Option Description
Save… Specify a file in which to save the
application setup
Recall… Select a file from which to recall the
application setup
Default Restores the default application setup
values
File name for
Save/Recall
Displays the name of the last file used to
save or recall a setup
See Also
Saving a Setup on page 42
Recalling a Saved Setup on page 43
Restoring Default Settings on page 43
The Measurements Menu
The Measurements menu contains measurement-related menus. Use the
Measurements menu for the following operations:
• Measurements > Standards selects the standard for which you are taking
measurements, or selects Custom to let you define your own
measurement setups and save them using the File > Save/Recall function.
• Measurements >Inputs sets the signal input and processing path
parameters.
• Measurements >Gates enables using cursors to do measurements on a
specified portion of the input waveform.
• Measurements >Select selects the measurement to take on the input
signal. You can select up to six measurements at one time, in any
combination of measurement type.
• Measurements >Configure sets the subject and adjacent nT ranges, as
well as adjacent position, data/clock edge, data polarity, and other
parameters for the measurements. The selected measurement enables the
applicable parameters for that measurement.
• Measurements >Plug-In enables using of MATLAB or .dll plug-in
extensions to replace the built-in Equalizer, Low Pass Filter, Slicer, and
Phase-Locked Loop signal processing functions.
58 TDSDVD Optical Storage Analysis Application
Page 59

Reference
The Standards Menu
The Standards menu consists of a drop-down list containing supported
measurement standards. Select the Standards button to display the Standards
drop-down list, and then select a standard. Selecting a standard sets many of the
default measurement options.
If you are testing for a standard that is not in the list, select Custom from the list.
Then use the Inputs, Gates, Select, and Configure menus to set your custom
measurement parameters. You can then save the custom measurement settings by
selecting File > Save/Recall and specifying a file name and directory in which to
store the settings.
See Also
Default Standards Parameters, Table 1 on page 87
TDSDVD Optical Storage Analysis Application
59
Page 60

Reference
The Inputs Menu
The Measurement Inputs menu provides controls for setting input signal type and
processing path parameters. Some parameters are automatically filled in with
values based on the selected standard. The default screen does not list any
parameter fields.
To display input parameter fields, select the Diagram Show button to display the
Inputs Block Diagram (IBD) and then select a button. The Measurements Input
menu then updates to display the parameter fields associated with the selected
IBD button. For example, the following figure shows the Data Signal input
parameters, which are displayed after selecting Data Signal on the IBD.
60 TDSDVD Optical Storage Analysis Application
Page 61

Reference
The Inputs Block Diagram (IBD)
You can define, the signal input sources, the signal processing to apply to the
input data, and the signal output to measure with the application from the Inputs
Block Diagram, which is opened from the Measurements > Inputs menu.
The default IBD input and output signal type is HF Data (data that is from the
optical drive mechanism and has not been preprocessed). The default value for
the clock signal source is Extracted (recovered from the data signal).
You configure the signal path by selecting the buttons. Selecting a button either
changes the signal path route or displays fields in which to enter signal input and
processor parameters. To close the IBD, select Hide.
There are three groups of Inputs Block Diagram options:
• Signal Input Options
• Signal Process Options
• Signal Output Options
TDSDVD Optical Storage Analysis Application
61
Page 62

Reference
Signal Input Options
Selecting Signal Input menu options updates the Inputs menu to show the data
and clock signal parameters, as well as select the data signal input type
(Equalized, HF Data, or Filtered).
Option/button Description
Data Signal Displays data signal fields for setting the data
input source, threshold, and hysteresis
parameters
Input Signal Type
Equalized *
HF Data *
Filtered *
Clock Signal Displays clock signal fields for setting the clock
Ideal Clock Displays a clock period field for setting the clock
* Selecting a button can change the current process flow path. For
example, if the selected Input type is Filtered, and you select the
Output Signal Type as Equalized, the application changes the Input
Signal Type to Equalized
Sets the input signal type applied to the signal
processing block. Selecting an input type routes
the signal as appropriate for that type of signal.
For example, selecting HF Data routes the input
signal to the Equalizer process, whereas
selecting Filtered routes the input signal to the
Slicer process. Only one input type is active at a
time.
input source, threshold, and hysteresis
parameters
period of the ideal (synthesized) clock signal
generated by the application.
See Also
Data Signal Menu on page 62
Clock Signal Menu on page 63
Ideal Clock Menu on page 64
Data Signal Menu
The Data Signal menu sets the data signal source, threshold, and hysteresis
parameters.
62 TDSDVD Optical Storage Analysis Application
Page 63

Reference
Data Signal Menu Options
Option/button Description
Diagram
Hide/Show
Source Sets the input source for the data signal. Available
Pit/Space
Shortest
Longest
Treshold * Sets the data threshold voltage used to calculate
Hysteresis * Sets the hysteresis voltage, centered on the
Autoset ** Analyzes the post-processing signals and
* The threshold and hysteresis settings apply to the signal (data or
clock) at the output of the signal processing blocks that are then
measured by the application
** Autoset adjusts threshold and hysteresis to the best values it can
determine. You may need to manually adjust these values to obtain
optimum measurement results
Displays or hides (closes) the Inputs Block
Diagram (IBD), which you use to set data and
clock signal input and processing path parameters
sources are CH1 to Ch4, Math1 to Math4, and
Ref1 to Ref4
Sets the range (Shortest to Longest) of nT pulses
(pit or space) to analyze in the application. The
value range is 0 to 24
the signal pulse width
threshold voltage, used to determine a false
(glitch) data pulse from a valid pulse
automatically sets the threshold and hysteresis
values based on the signal characteristics
Refer to Input Signal Parameters on page 89 for information on the Clock Signal
input parameters.
Clock Signal Menu
The Clock Signal menu sets the clock signal source threshold, and hysteresis
parameters. Use this menu if you are using an actual clock signal from the SUT.
The actual clock signal is used for analyzing measurements when you select the
Clock Signal and Clock Source buttons on the IBD.
TDSDVD Optical Storage Analysis Application
63
Page 64

Reference
Clock Signal Menu Options
Option/button Description
Diagram
Hide/Show
Source Sets the input source for the clock signal.
Threshold* Sets the clock threshold voltage
Hysteresis * Sets the hysteresis voltage, centered on the
Autoset ** Analyzes the post-processing signals and
* The threshold and hysteresis settings apply to the signal (data
or clock) at the output of the signal processing blocks that are
then measured by the application
** Autoset adjusts threshold and hysteresis to the best values it
can determine. You may need to manually adjust these values to
obtain optimum measurement results
Displays or hides (closes) the Inputs Block
Diagram (IBD), which you use to set data and
clock signal input and processing path
parameters
Available sources are CH1 to Ch4, Math1 to
Math4, and Ref1 to Ref4
threshold voltage, used to determine a false
(glitch) clock pulse from a valid pulse
automatically sets the clock threshold and
hysteresis values based on the clock signal
characteristics
Refer to Input Signal Parameters on page 89 for information on the Clock Signal
input parameters.
Ideal Clock Configuration Menu
The Ideal Clock menu sets the synthesized clock signal period. The synthesized
clock signal is used for analyzing measurements when you select the Ideal Clock
and Synth Clock buttons on the IBD panel.
64 TDSDVD Optical Storage Analysis Application
Page 65

Reference
Option/button Description
Diagram
Hide/Show
Period Sets the ideal (synthesized) clock period value
Displays or hides (closes) the Inputs Block
Diagram (IBD), which you use to set data and
clock signal input and processing path
parameters
used by the application for measurements
Refer to Input Signal Parameters on page 89 for information on the Ideal Clock
parameters.
Signal Process Options
Selecting the Signal Process menu options updates the Inputs menu to show the
Equalizer, Low Pass Filter, Slicer, and Phase-Locked Loop signal processing
parameter fields.
Option/button Description
Equalizer * Displays the Equalizer Coefficients menu where
you can set the equalizer coefficient equation
parameters
Low Pass Filter * Displays the Low Pass Filter menu where you
can set the low pass filter bandwidth parameter
Slicer * Displays the Slicer menu where you can set the
slicer bandwidth and initial threshold voltage
parameters
PLL * Displays the Phase-Locked Loop menu where
you can set the phase-locked loop corner
bandwidth and PLL data type
* The default process block parameters are set by the selected
measurement standard. Changing any of these values resets the
measurement standard to Custom
See Also
Equalizer Coefficients Menu on page 66
Low Pass Filter Menu on page 66
Slicer Menu on page 67
Phase-Locked Loop Menu on page 68
Signal Output Options on page 68
Equalizer Coefficient Parameters on page 90
Low Pass Filter Parameters on page 90
Slicer Parameters on page 90
Phase-Locked Loop Parameters on page 91
TDSDVD Optical Storage Analysis Application
65
Page 66

Reference
Equalizer Coefficients Menu
The Equalizer Coefficients menu lets you view and set the equalizer coefficient
parameters. To set equalizer coefficients, select the Equalizer block in the Inputs
Block Diagram (IBD). Use the general purpose knob or keyboard to change the
default value of a coefficient. Refer to Equalizer Coefficient Parameters on
page 90 for information on the equalizer parameter values and ranges.
Note.
Default parameter values are based on the selected standard. Changing any of
the Equalizer parameters changes the input standard type to Custom.
Low Pass Filter Menu
The Low Pass Filter menu lets you view and set the low pass filter bandwidth
corner frequency.
Note.
Default parameter values are based on the selected standard. Changing the Low
Pass Filter parameter causes the application to change the standard type to
Custom.
66 TDSDVD Optical Storage Analysis Application
Page 67

Reference
Refer to Low Pass Filter Parameters on page 90 for information on the
Bandwidth parameter.
Slicer Configuration Menu
The Slicer menu lets you view and set the Slicer bandwidth corner frequency and
feedback loop initial threshold voltage.
Note.
Default parameter values are based on the selected standard. Changing the
Slicer bandwidth parameter changes the input standard type to Custom.
Changing the initial threshold value does not change the input standard to
Custom.
Refer to Slicer Parameters on page 90 for information on the Bandwidth and
Initial Threshold parameters.
TDSDVD Optical Storage Analysis Application
67
Page 68

Reference
Phase-Locked Loop Configuration Menu
The Phase-Locked Loop (PLL) menu lets you view and set the open loop
bandwidth (fBW) and PLL type based on the measurement standard. The filter
transfer function characteristics chart changes depending on which PLL type you
select.
Note.
Default parameter values are based on the selected standard. Changing the PLL
parameters causes the application to change the standard type to Custom.
Refer to Phase-Locked Loop Parameters on page 91 for information on the
Bandwidth and PLL Type parameters.
Signal Output Options
Selecting the Signal Output menu options sets which data and clock signals to
route into the application for measurement.
Option/button Description
Output Signal Type
Equalized *
HF Data *
Filtered *
Output Clock Type
Extracted
Clock Source
Synth Clock
* Selecting a button can change the current process flow path. For
example, if the selected Input type is Filtered, and you select the
Output Signal Type as Equalized, the application changes the Input
Signal Type to Equalized
Sets the signal type to be measured by the
application. Only one output (measured) signal
type can be active at a time.
Sets the clock signal type used by the
application for taking measurements. Only one
measured clock type can be active at a time.
68 TDSDVD Optical Storage Analysis Application
Page 69

Reference
The Measurements Gates Menu
The Measurements Gates menu lets you use the oscilloscope vertical cursors to
select portions of the signal on which to take measurements. Only the signal data
between the cursors is evaluated.
Measurements Gates Options
Option Description
None button *
Cursors button Turns on measurement gating
* Selecting None means that the oscilloscope evaluates the
entire signal instead of the section between the cursors. None is
the default setting.
Turns off measurement gating
See Also
Using Cursors to Measure Part of a Waveform on page 38
TDSDVD Optical Storage Analysis Application
69
Page 70

Reference
The Measurements Select Menu
The Measurements Select menu lets you select which measurements to take on
the optical signal. You can take up to six measurements at the same time.
To select a measurement, click the button below the measurement label. You can
select any combination of measurements, in any order.
Use the Clear button to deselect all selected measurements.
To configure selected measurement parameters, use the Measurement
Configuration menu.
70 TDSDVD Optical Storage Analysis Application
Page 71

Reference
The Measurements Configuration Menu
You use the Measurements Configuration menu to configure measurement
parameters for measurements selected in the Measurement Select menu.
To configure a selected measurement, select the button corresponding to a
selected Measurement, and adjust the parameter values. Note that you cannot set
different parameter values for each measurement. For example, you cannot set
the Adj Pos value to Leading for one measurement and then set it to Trailing for
a different measurement. All measurements will use the last values entered in the
parameter fields.
TDSDVD Optical Storage Analysis Application
71
Page 72

Reference
Measurement Configuration Options
Option Description
Selected Measurements
buttons
Subject nT
From n=
To n=
Adjacent nT
From n=
To n=
Adj Pos Sets the application to report results for
For Asym, Sym and
Ratio
Divisor nT
Data Edge Set the data signal edge for
Clock Edge Set the clock signal edge for
Data Polarity Set the data signal polarity type for
Note: All measurements use the same set of parameters: you
cannot set different parameter values for each measurement. For
example, you cannot set the Adj Pos value to Leading for one
measurement and then set it to Trailing for a different measurement
Select a button to configure the
associated measurement
Sets the range of subject nT pulses to
measure
Sets the application to report results for
only those subject nT that have adjacent
nT pulse widths within the specified
range
only those subject nT that have adjacent
nT pulses in the specified position. The
adjacent position can be Leading,
Trailing, Leading AND Trailing, or
Leading OR Trailing
Sets the nT pulse value to use in the
denominator of symmetry, asymmetry,
modulation amplitude ratio, and
modulation amplitude resolution
measurements
measurements. Values are All,Rising,
and Falling
measurements. Values are All/Near,
Rising, and Falling
measurements. Values are Positive,
Negative, and Both
See Also
Measurement Configure Parameters on page 89
72 TDSDVD Optical Storage Analysis Application
Page 73

Reference
The Measurements Plug-In Menu
The Plug-in menu lets you replace the built-in (default) Equalizer, Low Pass
Filter, Slicer, and Phase-Locked Loop signal processes with your own custom .dll
or MATLAB-based .m files.
Plug-In Options
Option Description
Built-In Default Tektronix signal processing
implementation
MATLAB™ User-created MATLAB .m file
DLL User-created .dll file
See Also
Using the Plug-In Feature on page 46
DLL Plug-in Usage Conventions on page 74
TDSDVD Optical Storage Analysis Application
73
Page 74

Reference
MATLAB Plug-in Usage Conventions
Observe the following conventions when creating and using MATLAB .m plugin files:
• To use MATLAB .m file plug-in processes, install MATLAB version 6.1
(or later) on the oscilloscope, or optionally on a PC if you are running the
application on a PC, prior to using the plug-in with the application,
• To use MATLAB .m file plug-in processes, add the path to the
matlab.exe file to the oscilloscope operating system path.
• The application comes with example .m files, one for each signal process
block. These files are located at C:\TekApplications\tdsdvd\Example
Programs\MATLAB. The file names are tekEqualizer.m, tekLPF.m,
tekSlicer.m, and tekPLL.m.
• User-created MATLAB files must adhere to the interface requirements
defined for each signal process type. You can view the example .m files
to see the content and organization for each signal process type.
• You should copy the existing .m files, rename them, and then edit the
copies to create new .M files with your process definitions.
• You should make a backup copy of the example .m files and place them
in a different directory for safekeeping.
DLL Plug-in Usage Conventions
Observe the following conventions when creating and using .dll plug-in files:
• User-created .dll files must use the following file names for each
signal process block type:
Signal processor block .DLL file name
Equalizer CustomEqualizerLibrary.dll
Low Pass Filter (LPF) CustomLPFLibrary.dll
Slicer CustomSlicerLibrary.dll
Phase-Locked Loop (PLL) CustomPllLibrary.dll
• Place user-created .dll files in the C:\Program
files\TekApplications\tdsdvd directory prior to starting the application. If
you are running the application on a PC, you must place the .dll files in
the same directory on both the PC and the oscilloscope.
• User-created .dll files must adhere to the interface requirements defined
for each signal process type.
See Also
MATLAB Plug-in Usage Conventions on page 74
74 TDSDVD Optical Storage Analysis Application
Page 75

Reference
The View Menu
The View menu provides the following functions:
• Results displays measurement results. The View Results Summary Tab
shows a table containing a summary of Mean, Min, Max, Standard
Deviation, and Population values for each measurement. There are also
tabs for displaying the results of each individual measurement.
• Waveforms opens a menu containing buttons for displaying selected
waveforms at specific stages in the signal processing chain. Select one
or more of the buttons to display the waveform data in the Plot window.
Buttons available are HF, Clock, LPF, EQ, Levl’d, and Sliced. These
buttons correspond to the signal processing stages as shown in the
Measurements > Inputs Block Diagram window.
There are two areas of the View menu, the Results Summary menu and the
Results Measurement menu.
See Also
The View Results Measurement Menu on page 76
The View Waveforms Menu on page 81
The Log Menu on page 82
The View Results Summary Menu
The Results Summary menu displays a table listing a summary of the
measurement results, with each row listing the Mean, Min, Max, Standard
Deviation, Units, and Population for a measurement.
Selecting any of the measurement tabs in this menu displays the View Results
Measurement Menu, which displays statistical results for each subject/adjacent
nT for the selected measurement.
TDSDVD Optical Storage Analysis Application
75
Page 76

Reference
The View Results Measurement Menu
The View Results Measurement menu displays statistical results for the selected
subject/adjacent nT.
The Details column lets you display a specific subject/adjacent nT measurement
as a linear graph, a histogram, or as a list of values. Selecting a button under the
Details column displays the Measurement Details menu.
The Measurement Details Menu
The Measurement Details menu displays measurement values either graphically
or as a list of values. To activate the Measurement Details menu, select the button
in the Details column of the Results menu adjacent to the measurement for which
you want more detail. The default display is a linear plot of the selected
measurement, as shown.
The available measurement display formats are Plot, Hist (histogram), and List
Other functions within this frame let you save measurements to a file, set the
histogram bin value, autofit or format the plot X and Y values, and print the
measurement information.
76 TDSDVD Optical Storage Analysis Application
Page 77

Reference
You can resize the menu by selecting an edge or corner and dragging it to a new
position. You can also use the mouse or touch screen to select a region of the plot
and zoom in on that region.
Measurement Details Menu Options
This table describes the functions of the Measurement Details menu buttons and
icons.
Option Description
Plot button Analyzes the variations of measured
parameter values along time (or
measurements) and displays the results as
a linear plot
Hist button Analyzes the statistical distribution (or
density) of measurements and displays the
results as a bar graph of accumulated hits
(or cycles) vs. the measurement value
Ctrl button Sets the histogram bin resolution value.
This button is only available when
displaying a histogram
List button Displays the data points from which the
statistics were derived as a list of numerical
values
Save button Displays the Save window which lets you
write the measurement list values to a
specified file name and directory. This
button is only available when listing
measurements
Control icons Located in the upper right of the
Measurement Details Frame
Prints the displayed plot or histogram to the
oscilloscope default printer
Print icon
Resets X and Y axis ranges to their original
values
Reset icon
Displays the Set Plot Format menu to set
the plot parameters such as X and Y axis
Format icon
range and plot labels
Rescales the plot to fit the data
Rescale icon
See Also
Histogram Display Example on page 78
List Display Example on page 79
Set Plot Format Menu on page 80
TDSDVD Optical Storage Analysis Application
77
Page 78

Reference
Plot Display Example
This is an example of a Data Pulse Width measurement graph plot.
See Also
List Display Example on page 79
Histogram Display Example
This is an example of a Data Pulse Width measurement histogram plot.
See Also
Histogram Ctrl button on page 79
Plot Display Example on page 78
List Display Example on page 79
78 TDSDVD Optical Storage Analysis Application
Page 79

Reference
Histogram Ctrl button
The Histogram Ctrl button displays a menu that lets you set the histogram bin
resolution value. The bin values range from 5 to 500 in pre-defined increments.
List Display Example
This is an example of a measurement listing. You can use the Save button to save
the results list to a file.
See Also
List Save Button on page 80
Plot Display Example on page 78
Histogram Display Example on page 78
TDSDVD Optical Storage Analysis Application
79
Page 80

Reference
List Save button
The Measurement Details Save button displays a standard Windows dialog box
that lets you save the measurement list values to a file in .csv format. Enter the
file name and select the folder where you want to store the file.
Set Plot Format Menu
The Set Plot Format menu lets you change or add plot parameters such as the plot
title, X and Y axis labels and data range, and plot tick marks.
80 TDSDVD Optical Storage Analysis Application
Page 81

Reference
Set Plot Format Options
Item Description
Title Sets the plot title text displayed above the plot
X Label,
Y Label
X Range,
Y Range
Marks: Sets how the data points are drawn
X Ticks,
Y Ticks
Grid Enables or disables displaying a grid on the plot
Stems Draws a vertical line to each data point
Connect Connects each data point with a line
Use Color: Enables or disables using colors on the plot
Sets the X and Y-axis label text
Sets and displays the range of the displayed plot
for the X-axis and Y-axis. The first value is the
lower end of the range, followed by a comma, a
space, and then the second value, which is the
upper end of the range. You can use these fields to
magnify areas of the plot by specifying a range of
values that is less than the default axis range
Specifies the number of tick marks to display on
the X-axis and Y-axis
You can resize the Measurement Details menu by selecting an edge or corner and
dragging it to a new position. You can also use the mouse or touch screen to
select a region of the plot and zoom in on that region.
The View Waveforms Menu
The View Waveforms menu lets you display waveform data at various stages of
the signal processing path, in plot, histogram, or list format. You can select from
one to six waveforms to plot at one time. Selecting a button opens the
Measurement Details frame and displays the selected waveform as a linear plot.
Each plot is shown in a different color.
TDSDVD Optical Storage Analysis Application
81
Page 82

Reference
View Waveforms Options
Option/button Description
HF The high frequency (HF) waveform
Clock The clock waveform at the Clock Meas point
selected in the Inputs Block Diagram (IBD)
LPF The waveform at the output of the Low Pass
Filter signal process block
EQ The waveform at the output of the Equalizer
signal process block
Levl’d The leveled waveform data (the input to the
Slicer comparator block)
Sliced The waveform at the output of the Slicer
signal process block
Note.
You can only view waveforms from active process blocks. For example, if you
select Filtered as an input signal type and as a measurement output type, the
Equalizer and Low Pass Filter waveforms cannot be viewed, as those process
blocks are not active.
See Also
The Measurement Details Menu on page 76
The Log Menu
The Log menu lets you save measurement values for either a single measurement
acquisition or a number of acquisitions into a .csv file. You can log up to six
measurements at a time, but you must select and enable each measurement for
logging. Each measurement is saved to a unique file name.
82 TDSDVD Optical Storage Analysis Application
Page 83

Reference
Data Logging Options
Option/button Description
Selected Measurements
Buttons
Logging On/Off Enables or disables logging. You must select
Log File Name
Browse
Clear Deletes the on-disk file (.csv) of the selected
Save Current Saves the current selected measurement
Select measurement for logging
a measurement before using this button
Displays an Open dialog box where you can
specify a file name and directory path where
you want to save the selected measurement
log file
measurement. The path and file name are
displayed in the Log file name field
results in the .csv file displayed in the Log
File Name field. You do not need to have
Logging On to save the current measurement
Note.
When the number of acquisitions in a log file reaches 10,000, that log file is
renamed to <measurement_filename>old.csv, and a new log file named
<measurement_filename>.csv is started.
See Also
Logging a Measurement to a File on page 43
Viewing a Data Log File on page 44
Data Log File Example on page 45
The Utilities Menu on page 84
TDSDVD Optical Storage Analysis Application
83
Page 84

Reference
Open File Menu (Browse Button)
You use the Open File menu to specify a new file name and/or directory for
saving a measurement log file.
The Utilities Menu
The Utilities menu provides the following functions:
• Track Error Count displays the number of tracking errors.
• AutoScroll displays a zoomed image of the waveform and scroll back
and forth through the waveform.
See Also
The Track Error Count Menu on page 85
The AutoScroll Menu on page 85
84 TDSDVD Optical Storage Analysis Application
Page 85

Reference
The Track Error Count Menu
The Track Error Count menu displays the number of tracking errors in the data
signal, or the number of tracking errors between two cursors if gating is on.
The AutoScroll Menu
The AutoScroll menu (Utilities > AutoScroll) provides dynamic control of the
zoom feature of the oscilloscope and duplicates the zoom controls.
TDSDVD Optical Storage Analysis Application
85
Page 86

Reference
AutoScroll Options
Option Description
Off Turns the instrument zoom window on or off
Position Sets the horizontal position of the instrument zoom
window, as a percentage of the total record length
Step Size Sets the rate the instrument zoom window will
automatically scroll horizontally, as a percentage of
the total record length
Scale Sets the horizontal magnification scale of the zoom
window
Direction Sets AutoScroll to scroll Forward (default) or
Reverse (back) through the zoom window
See Also
Using AutoScroll on page 42
The Help Menu
The Help menu provides the following functions:
• Contents and Index displays the TDSDVD online help window.
• About TDSDVD displays the application version information.
See Also
Using Online Help on page 7
86 TDSDVD Optical Storage Analysis Application
Page 87

Reference
Parameters
Default Standards Parameters Table 1
The following table lists the first half of each standard’s default parameter
settings. Refer to Default Standards Parameters, Table 2 on page 88 for the rest
of the default standards parameters.
Parameter
Data Signal
Type HF-Data HF-Data HF-Data HF-Data HF-Data
Source Ch1 Ch1 Ch1 Ch1 Ch1
Threshold 0.0 V 0.0 V 0.0 V 0.0 V 0.0 V
Hysteresis 0.1 V 0.1 V 0.1 V 0.1 V 0.1 V
Clock Signal *
Source Ch2 Ch2 Ch2 Ch2 Ch2
Threshold 0.0 V 0.0 V 0.0 V 0.0 V 0.0 V
Hysteresis 0.1 V 0.1 V 0.1 V 0.1 V 0.1 V
Ideal Clock **
Period 40 ns 40 ns 40 ns 40 ns 40 ns
Equalizer
b 1 1 1 1 1
c1 1.35 1.35 1.3 1.3 1.35
c2 -0.175 -0.175 -0.15 -0.16 -0.175
c3 -0.175 -0.175 -0.15 -0.16 -0.175
d1 2.093 2.093 2 2 2.093
d2 4.186 4.186 4 4 4.186
* Values only applied if measurement clock type is set to
Clock Source
** Values only applied if measurement clock type is set to
Synth Clock
DVDROM
DVD-R DVD-RAM DVD+RW Custom
TDSDVD Optical Storage Analysis Application
87
Page 88

Reference
Default Standards Parameters Table 2
The following table lists the second half of each standard’s default parameter
settings. Refer to Default Standards Parameters, Table 1 for the first half of the
default standards parameters.
Parameter
Low Pass Filter
Bandwidth 8.2 MHz 8.2 MHz 10 MHz 15 MHz 8.2 MHz
Slicer
Bandwidth
(-3dB
closedloop)
Init.
Threshold
PLL
Bandwidth
(open loop
bandwidth)
PLL Type DVD-
Measurement Configuration
Subject nT
From n= 3 3 3 3 3
To n= 11 11 11 11 11
Adjacent
nT
From n= 3 3 3 3 3
To n= 11 11 11 11 11
Adj.
Position
Divisor nT 11 11 11 11 11
Data Edge All All All All All
Clock Edge All/Near All/Near All/Near All/Near All/Near
Data
Polarity
DVDROM
5 kHz 5 kHz 10 kHz 5 kHz 5 kHz
0 V 0 V 0 V 0 V 0 V
9 kHz 9 kHz 4.7746 kHz 12 kHz 9 kHz
ROM
Leading Leading Leading Leading Leading
Both Both Both Both Both
DVD-R
DVD-R DVD-RAM DVD+RW DVD-
DVD-RAM DVD+RW Custom
ROM
88 TDSDVD Optical Storage Analysis Application
Page 89

Reference
Measurement Configure Parameters
The following parameters are for the Measurements > Configure menu. Selecting
a measurement button in this menu enables the appropriate parameter fields for
that measurement.
Parameters
Subject nT
From n = 1 to 25 in units of T 3
To n = 1 to 25 in units of T 11
Adjacent nT
From nT = 1 to 25 in units of T 3
To nT = 1 to 25 in units of T 11
Adj Pos (Adjacent
Position)
For Asym, Sym & Ratio
Divisor
Data Edge
(Data-to-Clock Edge Shift
measurement only)
Clock Edge Rising
Data Polarity Positive
Value range
Leading
Trailing
Leading AND Trailing
Leading OR Trailing
1 to 25 in units of T 11
Rising
Falling
All
Falling
All/Near
Negative
Both
Default
Settings
Leading
All
All/Near
Both
Input Signal Parameters
The following parameters are for the Measurements > Inputs menu. The fields
depend on which input source button was last selected in the Inputs Block
Diagram panel.
Parameters
Source Ch1-Ch4
Pit/Space
Shortest
Longest
Threshold *
Hysteresis *
Ideal Clock
Period
* Autoset affects the these settings
Selections
Ref1-Ref4
Math1-Math4
0 to 24 in units of T
0 to 24 in units of T
-10 to 10 in Volts 0
0 to 1 in Volts 0
0 to 1 s in units of 1 ps 200 ps
Default
Settings
Ch1
3
14
TDSDVD Optical Storage Analysis Application
89
Page 90

Reference
Equalizer CoefficientParameters
The following parameters are for the Equalizer process block.
Parameters
b -10 to 10 The 3-tap analog equalizer boost
c1 -10 to 10 The coefficient for the first tap of the
c2 -10 to 10 The coefficient for the second tap of
c3 -10 to 10 The coefficient for the third tap of the
d1 0 to 10 The first delay coefficient for the 3-
d2 0 to 10 The second delay coefficient for the
Low Pass Filter Parameters
The following parameters are for the Low Pass Filter process block.
Parameter
Bandwidth 1 MHz to
Value
Range
Value
Range
500 MHz
Description
value
3-tap analog equalizer
the 3-tap analog equalizer
3-tap analog equalizer
tap analog equalizer
3-tap analog equalizer
Description
The low pass filter corner
frequency
Slicer Parameters
The following parameters are for the Slicer process block.
Parameter
Bandwidth 1 kHz to
Threshold -3 to 3, in Volts 0 V The low pass
90 TDSDVD Optical Storage Analysis Application
Value
Range
500 kHz
Default Setting Description
Depends on
selected standard
The Slicer
corner
frequency
filter corner
frequency
Page 91

Reference
Phase-Locked Loop Parameters
The following parameters are for the Phase-Locked Loop process block.
Algorithms
About Measurements
Measurement Background
Measurement background provides information on signal terminology and
characterization. Algorithm Equation Notation on page 96 describes the
algorithms of the key application measurements.
This application assumes that the following conditions are met in order to obtain
measurements:
Parameter
Bandwidth 1 kHz to
PLL Type DVD-ROM
Value
Range
500 kHz
DVD-R
DVD-RAM
DVD-RW
Description
The Phase-Locked Loop first
corner frequency
The source data type
• The data source signal is a continuous physical data disk recording of nT
pulses with no gaps or non-nT type data.
• The clock period (T) of the data source signal is constant.
See Also
Taking Measurements Guidelines on page 27
The Data Signal
TDSDVD Optical Storage Analysis Application
91
Page 92

Reference
()(
The data signal waveform is first processed to identify the pits and spaces, the
parts of the processed read-back waveform corresponding to the physical pits and
spaces embossed on the media. Each waveform segment, delimited by threshold
crossings, is a data pulse. The waveform segments are categorized as pits or
spaces, depending on the polarity of the voltage corresponding to this data pulses
(with respect to the threshold level).
Hysteresis
To prevent false reading of pits and spaces a hysteresis is used, as shown in the
figure. To qualify as a valid pulse (pit or space) the voltage of the pulse must
cross outside the hysteresis band to be recognized as a change to a second pulse
(pit or space). Full crosses of the hysteresis band are necessary at each end of a
pulse for that pulse to be identified as such.
Data Pulse Categorization
Each pulse is the data-to-measure waveform is categorized as an nT pulse, where
n is an integer, T is the clock period (average clock period if the clock is
extracted or measured), and the following relation is true for the pulse width:
)
TnwTn 5.05.0 +<≤−
92 TDSDVD Optical Storage Analysis Application
Page 93

Reference
High and Low Amplitude
Where
V is the high amplitude (of the pit).
+
V is the low amplitude (of the space).
−
V and −V are referenced from zero volts.
+
k is an index that measures the number of pulses from the
beginning of the analyzed waveform.
A pulse width W that satisfies the equation in Data Pulse
Categorization is an nT pulse.
The individual pulse that is being measured algorithm is called the
subject pulse. The neighboring pulses, the first to the left and to the
right, are called adjacent pulses.
See Also
Peak-to-Peak and Decision Level on page 94
Data Pulse Categorization on page 92
TDSDVD Optical Storage Analysis Application
93
Page 94

Reference
Peak-to-Peak and Decision Level
If two adjacent pulses have the same nT categorization then two additional
parameters of the pulse pair are defined.
Where
is the peak-to-peak amplitude of the waveform
PkPkV−
V is the Decision Level, and is calculated by
DL
+ V-)/2, where V is measured with reference to zero volts
(V
+
94 TDSDVD Optical Storage Analysis Application
Page 95

Reference
Data and Clock Time Parameters
The following are some basic data and clock waveform time parameters.
TDSDVD Optical Storage Analysis Application
95
Page 96

Reference
Measurement Algorithms
Algorithm Equation Notation
The algorithms in this document use the following notation:
Notation Description
n
V
+
n
V
−
n
V
n
V
DL
n
V
n
w
PkPk
−
The high amplitude of a nT pit.
The low amplitude of a nT space.
The peak-to-peak amplitude of a nT pulse pair.
The decision level of a nT pulse pair.
The average of the corresponding measurement for all
the nT pulses or nT pulse pairs.
The pulse width of a nT pulse pit or space.
n
w
l
t
+
t
t
+
l
t
−
t
t
−
The average of the corresponding measurement for all
the nT pulses.
The time difference between the leading edge of a data
pulse and the following clock edge
The time difference between the trailing edge of a data
pulse and the following clock edge
The time difference between the leading edge of a data
pulse and the preceding clock edge.
The time difference between the trailing edge of a data
pulse and the preceding clock edge.
High Amplitude
The High Amplitude measurement calculates the high amplitude,
n
V
, for each nT pit/pulse in the specified nT subject range.
+
Low Amplitude
The Low Amplitude measurement calculates the low amplitude,
n
V
, for each nT space/pulse in the specified nT subject range.
−
Decision Level Measurement
The Decision Level measurement calculates the decision level,
n
V , for each nT pit/space pulse pair in the specified nT subject
DL
range.
96 TDSDVD Optical Storage Analysis Application
Page 97

Reference
Peak-to-Peak Amplitude Measurement
The Peak-to-Peak Amplitude measurement calculates the peak-to-
peak,
n
V
, for each nT pit/space pulse pair in the specified nT
−
PkPk
subject range.
Modulation Amplitude Ratio
The Modulation Amplitude Ratio measurement calculates the ratio,
21 nn
VV
PkPk
and for a specified divisor n
, for each n1T pit/space pulse pair in the subject range,
+−
T
2
Modulation Amplitude Resolution
The Modulation Amplitude Resolution measurement calculates the
ratio,
n
subject range and for a specified n
21 n
VV
PkPk
, for each n1T pit/space pulse pair in the n1T
PkPk
−−
T.
2
Symmetry Measurement
21
n
Symmetry calculates the ratio,
pit/space pulse pair in the subject range, and for a specified n
n
5.0
DL
VV
, for each n1T
PkPk
−
2
T.
Asymmetry Measurement
Asymmetry calculates the ratio
DL
n
)(
VVV−− , for each n
DL
PkPk
T
1
212
n
n
pit/space pulse pair in the subject range and for a specified divisor
T.
n
2
Clock Jitter Measurement
The Clock Jitter measurement calculates a vector of time skews between the real
and the ideal clock signals.
The clock signal can be measured from the system under test (SUT), extracted
from the data, or synthesized by the application. The Clock Jitter measurement
yields zero jitter when using an ideal (synthesized) clock.
Data Pulse Width Measurement
The Data Pulse Width measurement calculates the width of the
data pulse,
n
w , for each nT pulse in the nT subject range.
TDSDVD Optical Storage Analysis Application
97
Page 98

Reference
Timing Jitter Measurement
Timing Jitter calculates the difference between data pulse width
and the average data pulse width,
of an nT pulse in the subject range. The result is displayed
normalized to the clock period (T) as a percentage based on the
nn
formula
Active data edges occur when an edge traverses the data
threshold point in the specified direction.
.
Tww
/)(*100 −
nn
ww − , for each active edge
Data-to-Clock Edge Shift Measurement
The Data-to-Clock Edge Shift measurement calculates the time
difference between active data edges and active clock edges,
l
t
and/or
+
pulse in the nT subject range. Select the edge type (clock or data)
in the Measurements > Configuration menu.
l
t
and/or
−
t
t
and/or
+
t
t
, for each active edge of a nT
−
Mean
The Mean measurement calculates an unbiased estimate of the expected value of
a finite set (n) of numerical data elements (grouped in a vector x). The
measurement returns a scalar value.
n
∑
x
i
==1
i
)(µ
x
n
Where i is the i-th element of vector x.
Standard Deviation Measurement
The Standard Deviation measurement calculates an unbiased
estimate of the standard deviation of a finite set (n) of numerical
data elements (grouped in a vector x), and returns a scalar
The standard deviation is computed as the square root of the
variance, as defined in the following formula:
n
−
x
µ
i
n
2
σ
where i is the i-th element of the vector x.
∑
==1
i
)(
x
2
()()
x
)(xσ .
Equalizer
The Equalizer is a three-tap analogue equalizer specified by the three numerical
values of the coefficients of its discrete transfer function, and two numerical
98 TDSDVD Optical Storage Analysis Application
Page 99

Reference
values for the corresponding tap delays. It provides an equalized signal based on
a sampled input signal.
Low Pass Filter
The Low Pass Filter (LPF) is a 6th-order Bessel filter specified by the corner
frequency. It provides a low-pass filtered signal based on a sampled input signal.
Slicer
The Slicer is a feed-back auto-slicer, 1st order of integration, and is specified by
the frequency of the –3 dB closed-loop bandwidth. The Slicer produces two
waveforms available for display: the Leveled waveform and the Slicer output
waveform.
Phase-Locked Loop Type
The Phase-Locked Loop (PLL) uses a PLL process to provide a
recovered clock signal based on a NRZ data signal. The PLL openloop bandwidth (f
There are three types of PLL available in the application, with the
following filter transfer function characteristics, which cover various
ECMA standard PLL requirements.
TDSDVD Optical Storage Analysis Application
) is a user-adjustable parameter.
BW
99
Page 100

Reference
DVD-ROM and DVD-R
DVD-RAM
DVD-RW
100 TDSDVD Optical Storage Analysis Application
 Loading...