

Page 1

User Manual
TDSDDM1
Disk Drive Measurement Application
071-0174-02
This document supports software version 1.0.26
and above.
Page 2

Copyright © T ektronix, Inc. All rights reserved. Licensed software products are owned by Tektronix or its suppliers and
are protected by United States copyright laws and international treaty provisions.
Use, duplication, or disclosure by the Government is subject to restrictions as set forth in subparagraph (c)(1)(ii) of the
Rights in T echnical Data and Computer Software clause at DFARS 252.227-7013, or subparagraphs (c)(1) and (2) of the
Commercial Computer Software – Restricted Rights clause at F AR 52.227-19, as applicable.
T ektronix products are covered by U.S. and foreign patents, issued and pending. Information in this publication supercedes
that in all previously published material. Specifications and price change privileges reserved.
Printed in the U.S.A.
T ektronix, Inc., P.O. Box 1000, Wilsonville, OR 97070–1000
TEKTRONIX and TEK are registered trademarks of T ektronix, Inc.
Page 3

WARRANTY
T ektronix warrants that the media on which this software product is furnished and the encoding of the programs on the
media will be free from defects in materials and workmanship for a period of three (3) months from the date of shipment.
If a medium or encoding proves defective during the warranty period, T ektronix will provide a replacement in exchange
for the defective medium. Except as to the media on which this software product is furnished, this software product is
provided “as is” without warranty of any kind, either express or implied. T ektronix does not warrant that the functions
contained in this software product will meet Customer’s requirements or that the operation of the programs will be
uninterrupted or error-free.
In order to obtain service under this warranty, Customer must notify Tektronix of the defect before the expiration of the
warranty period. If T ektronix is unable to provide a replacement that is free from defects in materials and workmanship
within a reasonable time thereafter, Customer may terminate the license for this software product and return this software
product and any associated materials for credit or refund.
THIS WARRANTY IS GIVEN BY TEKTRONIX IN LIEU OF ANY OTHER WARRANTIES, EXPRESS OR
IMPLIED. TEKTRONIX AND ITS VENDORS DISCLAIM ANY IMPLIED WARRANTIES OF
MERCHANTABILITY OR FITNESS FOR A PAR TICULAR PURPOSE. TEKTRONIX’ RESPONSIBILITY TO
REPLACE DEFECTIVE MEDIA OR REFUND CUSTOMER’S PAYMENT IS THE SOLE AND EXCLUSIVE
REMEDY PROVIDED TO THE CUSTOMER FOR BREACH OF THIS WARRANTY. TEKTRONIX AND ITS
VENDORS WILL NOT BE LIABLE FOR ANY INDIRECT , SPECIAL, INCIDENTAL, OR CONSEQUENTIAL
DAMAGES IRRESPECTIVE OF WHETHER TEKTRONIX OR THE VENDOR HAS ADVANCE NOTICE OF
THE POSSIBILITY OF SUCH DAMAGES.
Page 4

Page 5

Table of Contents
Getting Started
Preface vii. . . . . . . . . . . . . . . . . . . . . . . . . . . . . . . . . . . . . . . . . . . . . . . . . . .
Related Documentation vii. . . . . . . . . . . . . . . . . . . . . . . . . . . . . . . . . . . . . . . . . . . .
Conventions vii. . . . . . . . . . . . . . . . . . . . . . . . . . . . . . . . . . . . . . . . . . . . . . . . . . . . .
Contacting T ektronix viii. . . . . . . . . . . . . . . . . . . . . . . . . . . . . . . . . . . . . . . . . . . . . .
Product Description 1–1. . . . . . . . . . . . . . . . . . . . . . . . . . . . . . . . . . . . . . . . .
Compatibility 1–1. . . . . . . . . . . . . . . . . . . . . . . . . . . . . . . . . . . . . . . . . . . . . . . . . . . .
Requirements and Restrictions 1–2. . . . . . . . . . . . . . . . . . . . . . . . . . . . . . . . . . . . . . .
Updates 1–2. . . . . . . . . . . . . . . . . . . . . . . . . . . . . . . . . . . . . . . . . . . . . . . . . . . . . . . . .
Accessories 1–2. . . . . . . . . . . . . . . . . . . . . . . . . . . . . . . . . . . . . . . . . . . . . . . . . . . . . .
Installation 1–3. . . . . . . . . . . . . . . . . . . . . . . . . . . . . . . . . . . . . . . . . . . . . . . .
Installing the Application 1–3. . . . . . . . . . . . . . . . . . . . . . . . . . . . . . . . . . . . . . . . . . .
Updates Through a Web Browser 1–4. . . . . . . . . . . . . . . . . . . . . . . . . . . . . . . . . . . .
Disk Drive Connection 1–4. . . . . . . . . . . . . . . . . . . . . . . . . . . . . . . . . . . . . . . . . . . . .
Configuration 1–7. . . . . . . . . . . . . . . . . . . . . . . . . . . . . . . . . . . . . . . . . . . . . .
Setting Up the Oscilloscope Trigger 1–7. . . . . . . . . . . . . . . . . . . . . . . . . . . . . . . . . .
Setting Up the Application Trigger 1–8. . . . . . . . . . . . . . . . . . . . . . . . . . . . . . . . . . .
Hysteresis 1–9. . . . . . . . . . . . . . . . . . . . . . . . . . . . . . . . . . . . . . . . . . . . . . . . . . . . . . .
Configuring the Input Channels 1–11. . . . . . . . . . . . . . . . . . . . . . . . . . . . . . . . . . . . . .
Operating Basics
Reference
Functional Overview 2–1. . . . . . . . . . . . . . . . . . . . . . . . . . . . . . . . . . . . . . . .
Starting the Application 2–1. . . . . . . . . . . . . . . . . . . . . . . . . . . . . . . . . . . . . . . . . . . .
Leaving the Application 2–3. . . . . . . . . . . . . . . . . . . . . . . . . . . . . . . . . . . . . . . . . . . .
Starting the Measurement 2–4. . . . . . . . . . . . . . . . . . . . . . . . . . . . . . . . . . . . . . . . . .
Viewing the Waveform 2–6. . . . . . . . . . . . . . . . . . . . . . . . . . . . . . . . . . . . . . . . . . . . .
Using the Local Help 2–6. . . . . . . . . . . . . . . . . . . . . . . . . . . . . . . . . . . . . . . . . . . . . .
Tutorial 2–7. . . . . . . . . . . . . . . . . . . . . . . . . . . . . . . . . . . . . . . . . . . . . . . . . . .
Preparation 2–7. . . . . . . . . . . . . . . . . . . . . . . . . . . . . . . . . . . . . . . . . . . . . . . . . . . . . .
Example 1: Measuring the Track Average Amplitude 2–7. . . . . . . . . . . . . . . . . . . . .
Example 2: Measuring the Pulse Width at 50% 2–8. . . . . . . . . . . . . . . . . . . . . . . . . .
Example 3: Creating and Viewing Track Profiles 2–10. . . . . . . . . . . . . . . . . . . . . . . .
Example 4: Saving a Setup and Exiting the Application 2–11. . . . . . . . . . . . . . . . . . .
Example 5: Recalling a Setup 2–12. . . . . . . . . . . . . . . . . . . . . . . . . . . . . . . . . . . . . . .
Menu Structure 3–1. . . . . . . . . . . . . . . . . . . . . . . . . . . . . . . . . . . . . . . . . . . .
Menu Summary 3–1. . . . . . . . . . . . . . . . . . . . . . . . . . . . . . . . . . . . . . . . . . . . . . . . . .
Menu Structure 3–3. . . . . . . . . . . . . . . . . . . . . . . . . . . . . . . . . . . . . . . . . . . . . . . . . . .
TDSDDM1 Disk Drive Measurement Application User Manual
i
Page 6

Table of Contents
Setup Parameters 3–5. . . . . . . . . . . . . . . . . . . . . . . . . . . . . . . . . . . . . . . . . . .
Saving and Recalling Setups 3–5. . . . . . . . . . . . . . . . . . . . . . . . . . . . . . . . . . . . . . . .
Measuring Over a Range of Sectors 3–6. . . . . . . . . . . . . . . . . . . . . . . . . . . . . . . . . . .
Cursor Gating 3–7. . . . . . . . . . . . . . . . . . . . . . . . . . . . . . . . . . . . . . . . . . . . . . . . . . . .
Localizing Measurements: an Alternate Method 3–9. . . . . . . . . . . . . . . . . . . . . . . . .
Adding Pass/Fail Results to Measurement Data 3–9. . . . . . . . . . . . . . . . . . . . . . . . .
Measurement Descriptions 3–11. . . . . . . . . . . . . . . . . . . . . . . . . . . . . . . . . . .
Measurement Features 3–11. . . . . . . . . . . . . . . . . . . . . . . . . . . . . . . . . . . . . . . . . . . . .
W arning Messages 3–12. . . . . . . . . . . . . . . . . . . . . . . . . . . . . . . . . . . . . . . . . . . . . . . .
Track Average Amplitude, TAA 3–13. . . . . . . . . . . . . . . . . . . . . . . . . . . . . . . . . . . . .
Track Average Amplitude (Plus), TAA+
Track Average Amplitude (Minus), TAA– 3–16. . . . . . . . . . . . . . . . . . . . . . . . .
Pulse Width at 50%, PW50 3–18. . . . . . . . . . . . . . . . . . . . . . . . . . . . . . . . . . . . . . . . .
50% Pulse Width (Positive), PW50+
50% Pulse Width (Negative), PW50– 3–21. . . . . . . . . . . . . . . . . . . . . . . . . . . . . .
Nonlinear Transition Shift, NLTS 3–23. . . . . . . . . . . . . . . . . . . . . . . . . . . . . . . . . . . .
Signal-to-Noise Ratio, SNR 3–30. . . . . . . . . . . . . . . . . . . . . . . . . . . . . . . . . . . . . . . . .
Overwrite 3–34. . . . . . . . . . . . . . . . . . . . . . . . . . . . . . . . . . . . . . . . . . . . . . . . . . . . . . .
Resolution 3–36. . . . . . . . . . . . . . . . . . . . . . . . . . . . . . . . . . . . . . . . . . . . . . . . . . . . . .
Asperity 3–39. . . . . . . . . . . . . . . . . . . . . . . . . . . . . . . . . . . . . . . . . . . . . . . . . . . . . . . .
Snapshot Measurements 3–41. . . . . . . . . . . . . . . . . . . . . . . . . . . . . . . . . . . . . . . . . . . .
Snapshot Measurement Definitions 3–41. . . . . . . . . . . . . . . . . . . . . . . . . . . . . . . . . . .
Track Profiles 3–45. . . . . . . . . . . . . . . . . . . . . . . . . . . . . . . . . . . . . . . . . . . . . .
Using Track Profiles 3–46. . . . . . . . . . . . . . . . . . . . . . . . . . . . . . . . . . . . . . . . . . . . . . .
About the Track Profile Reference Memory 3–48. . . . . . . . . . . . . . . . . . . . . . . . . . . .
Appendices
Index
Appendix A: Specifications A–1. . . . . . . . . . . . . . . . . . . . . . . . . . . . . . . . . . .
ii
TDSDDM1 Disk Drive Measurement Application User Manual
Page 7

List of Figures
Table of Contents
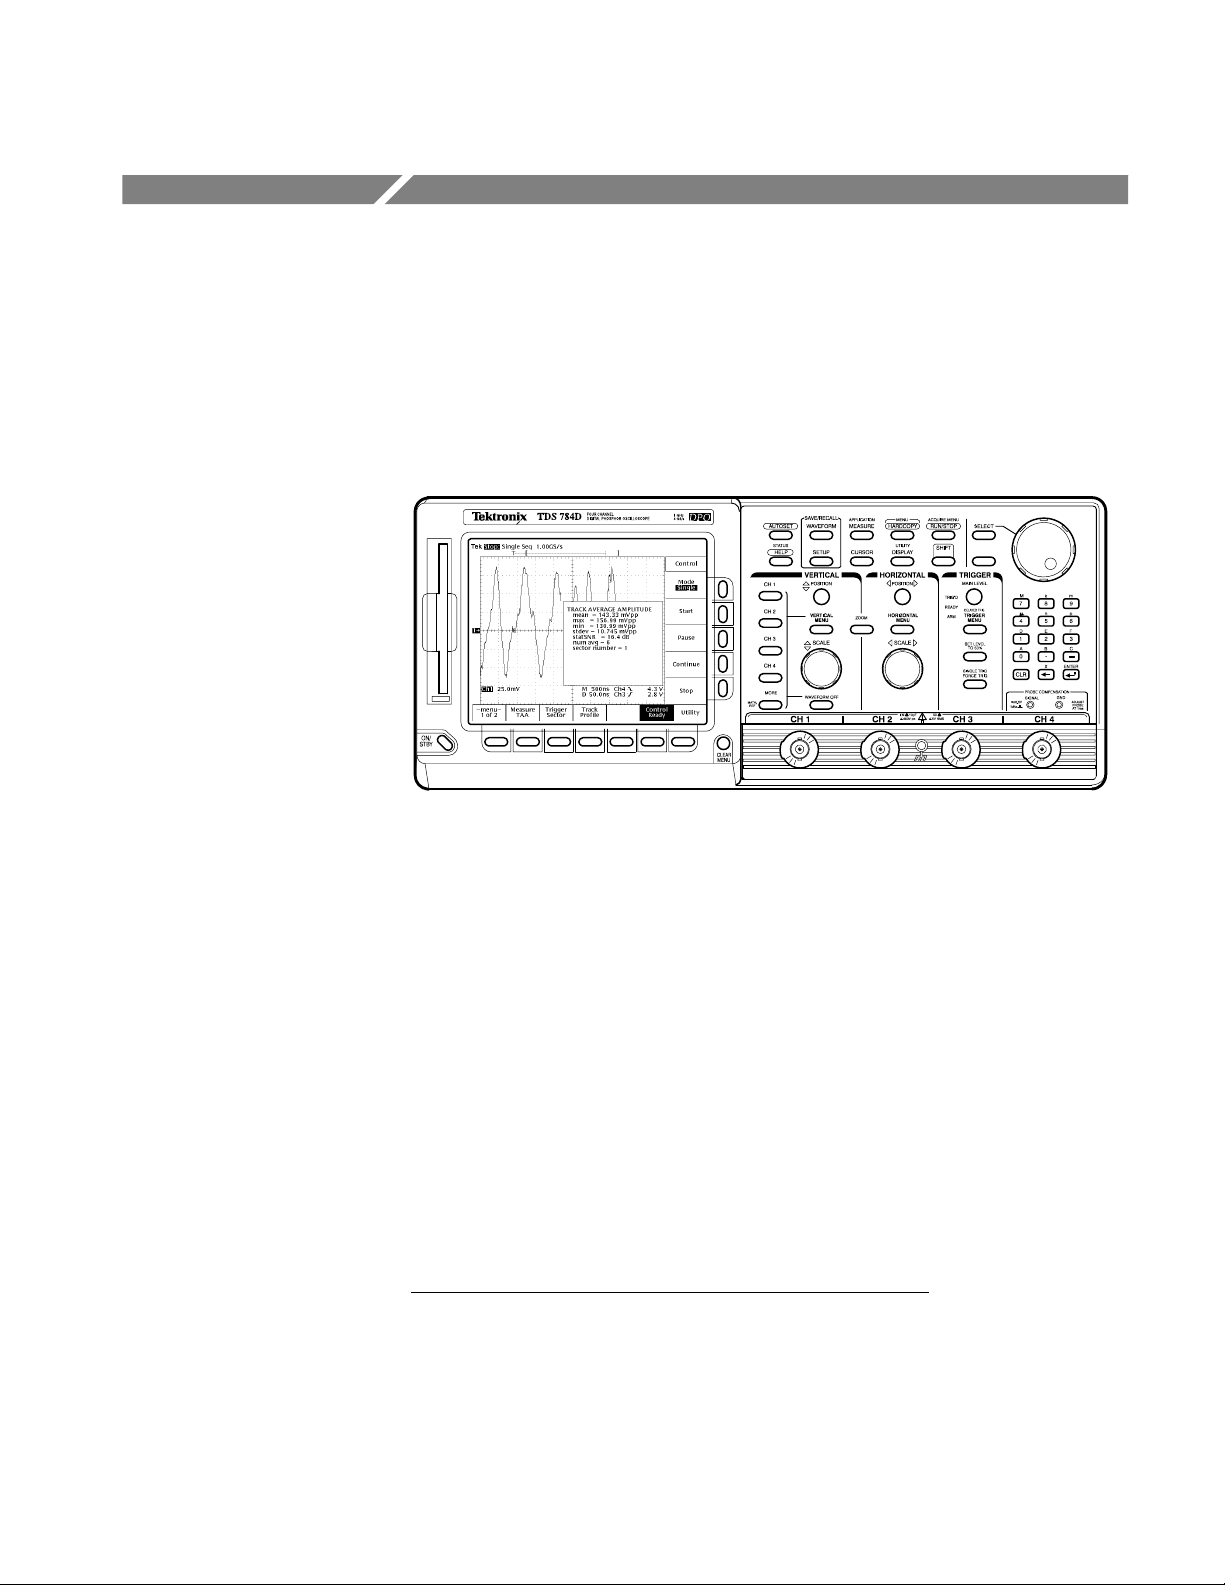
Figure 1–1: TDSDDM1 Disk Drive Measurement Application 1–1. . . . .
Figure 1–2: Primary setup connections 1–5. . . . . . . . . . . . . . . . . . . . . . . . .
Figure 1–3: Secondary setup connections 1–6. . . . . . . . . . . . . . . . . . . . . . .
Figure 1–4: Selecting the sectors to measure 1–9. . . . . . . . . . . . . . . . . . . .
Figure 1–5: Using hysteresis to avoid false identification of peaks 1–10. . .
Figure 1–6: Hysteresis menu 1–11. . . . . . . . . . . . . . . . . . . . . . . . . . . . . . . . .
Figure 1–7: The Input Channels menu 1–12. . . . . . . . . . . . . . . . . . . . . . . . .
Figure 2–1: Starting the application 2–2. . . . . . . . . . . . . . . . . . . . . . . . . . .
Figure 2–2: Disk Drive Measurement Application initial display 2–3. . .
Figure 2–3: Returning to the application 2–3. . . . . . . . . . . . . . . . . . . . . . .
Figure 2–4: Selecting a measurement from the Measure menu 2–4. . . . .
Figure 2–5: The Control menu 2–5. . . . . . . . . . . . . . . . . . . . . . . . . . . . . . . .
Figure 2–6: Track average amplitude (TAA) measurement 2–8. . . . . . . .
Figure 2–7: Pulse width at 50% (PW50) measurement with cursor
gating 2–9. . . . . . . . . . . . . . . . . . . . . . . . . . . . . . . . . . . . . . . . . . . . . . . . .
Figure 2–8: Track profile measurement 2–11. . . . . . . . . . . . . . . . . . . . . . . .
Figure 3–1: Selecting menus 3–1. . . . . . . . . . . . . . . . . . . . . . . . . . . . . . . . . .
Figure 3–2: Save Setup and Recall Setup selections in the Utility
menu 3–6. . . . . . . . . . . . . . . . . . . . . . . . . . . . . . . . . . . . . . . . . . . . . . . . . .
Figure 3–3: Selecting the sectors to measure 3–7. . . . . . . . . . . . . . . . . . . .
Figure 3–4: Localizing a measurement using cursor gating 3–8. . . . . . . .
Figure 3–5: Limit Test results 3–9. . . . . . . . . . . . . . . . . . . . . . . . . . . . . . . . .
Figure 3–6: Setting pass/fail limits 3–10. . . . . . . . . . . . . . . . . . . . . . . . . . . . .
Figure 3–7: Standard measurement, snapshot measurement, and
track profile 3–11. . . . . . . . . . . . . . . . . . . . . . . . . . . . . . . . . . . . . . . . . . . .
Figure 3–8: Track average amplitude measurement 3–13. . . . . . . . . . . . . .
Figure 3–9: TAA measurement 3–15. . . . . . . . . . . . . . . . . . . . . . . . . . . . . . .
Figure 3–10: TAA– measurement 3–16. . . . . . . . . . . . . . . . . . . . . . . . . . . . .
Figure 3–11: TAA+ and TAA– measurements 3–17. . . . . . . . . . . . . . . . . . .
Figure 3–12: PW50 measurement 3–18. . . . . . . . . . . . . . . . . . . . . . . . . . . . .
Figure 3–13: Parameters for PW50 disk drive measurements 3–20. . . . . .
Figure 3–14: PW50+ measurement 3–21. . . . . . . . . . . . . . . . . . . . . . . . . . . .
Figure 3–15: Parameters for PW50+ and PW50– disk drive
measurements 3–22. . . . . . . . . . . . . . . . . . . . . . . . . . . . . . . . . . . . . . . . . .
TDSDDM1 Disk Drive Measurement Application User Manual
iii
Page 8

Table of Contents
Figure 3–16: NLTS measurement 3–24. . . . . . . . . . . . . . . . . . . . . . . . . . . . .
Figure 3–17: Selecting an NLTS measurement 3–26. . . . . . . . . . . . . . . . . . .
Figure 3–18: Specifying the NLTS polynomial 3–28. . . . . . . . . . . . . . . . . . .
Figure 3–19: SNR measurement 3–30. . . . . . . . . . . . . . . . . . . . . . . . . . . . . .
Figure 3–20: Specifying the SNR parameters 3–31. . . . . . . . . . . . . . . . . . . .
Figure 3–21: Overwrite measurement 3–34. . . . . . . . . . . . . . . . . . . . . . . . . .
Figure 3–22: Resolution measurement 3–36. . . . . . . . . . . . . . . . . . . . . . . . .
Figure 3–23: Asperity measurement 3–39. . . . . . . . . . . . . . . . . . . . . . . . . . .
Figure 3–24: Snapshot measurement data 3–41. . . . . . . . . . . . . . . . . . . . . .
Figure 3–25: Time PT and Time TP measurements 3–43. . . . . . . . . . . . . .
Figure 3–26: Track profile waveform 3–45. . . . . . . . . . . . . . . . . . . . . . . . . .
Figure 3–27: Specifying the track profile parameters 3–47. . . . . . . . . . . . .
Figure 3–28: Track profile reference memory 3–48. . . . . . . . . . . . . . . . . . .
iv
TDSDDM1 Disk Drive Measurement Application User Manual
Page 9

List of Tables
Table of Contents
Table 1–1: Primary setup channel assignments 1–5. . . . . . . . . . . . . . . . . .
Table 1–2: Default input channel assignments 1–11. . . . . . . . . . . . . . . . . .
Table A–1: TDSDDM1 Disk Drive Measurement Application
measurements A–1. . . . . . . . . . . . . . . . . . . . . . . . . . . . . . . . . . . . . . . . . .
TDSDDM1 Disk Drive Measurement Application User Manual
v
Page 10

Table of Contents
vi
TDSDDM1 Disk Drive Measurement Application User Manual
Page 11

Preface
Related Documentation
This manual contains operating information for the TDSDDM1 Disk Drive
Measurement Application. The manual consists of the following chapters:
H The chapter Getting Started briefly describes the TDSDDM1 Disk Drive
Measurement Application and provides installation instructions.
H The chapter Operating Basics covers basic operating principles of the
application.
H The chapter Reference describes how to perform specific tasks.
H The Appendices provide a list of specifications.
The following documents are related to the use of this product:
H The TDS 500D, TDS 600B, & TDS 700D Digitizing Oscilloscope User
Manual (Tektronix part number 071-0130-XX) provides operating instruc-
tions for general oscilloscope features.
Conventions
H The International Disk Drive Equipment and Materials Association
(IDEMA) 1995 Standards Binder, section T for Test Methods, is the source
document for test criteria used by the TDSDDM1 Disk Drive Measurement
Application.
This manual uses the following conventions:
H For brevity, this manual generally refers to the TDSDDM1 Disk Drive
Measurement Application as the Disk Drive Measurement Application or
simply as the application.
H When steps require that you make a sequence of selections using front panel
controls and menu buttons, an arrow ( ➞
front panel button and a menu, or between menus. Also, whether a name is a
main menu or side menu item is clearly indicated: Press VERTICAL
MENU ➞ Coupling (main) ➞ DC (side) ➞ Bandwidth (main) ➞ 250 MHz
(side).
) marks each transition between a
TDSDDM1 Disk Drive Measurement Application User Manual
vii
Page 12

Preface
Contacting Tektronix
Product
Support
Service
Support
For other
information
To write us Tektronix, Inc.
For application-oriented questions about a Tektronix measurement product, call toll free in North America:
1-800-TEK-WIDE (1-800-835-9433 ext. 2400)
6:00 a.m. – 5:00 p.m. Pacific time
Or contact us by e-mail:
tm_app_supp@tek.com
For product support outside of North America, contact your
local Tektronix distributor or sales office.
Contact your local Tektronix distributor or sales office. Or visit
our web site for a listing of worldwide service locations.
http://www.tek.com
In North America:
1-800-TEK-WIDE (1-800-835-9433)
An operator will direct your call.
P.O. Box 1000
Wilsonville, OR 97070-1000
viii
TDSDDM1 Disk Drive Measurement Application User Manual
Page 13

Getting Started
Page 14

Page 15
Product Description
The TDSDDM1 Disk Drive Measurement Application is a software package that
adds disk drive measurement and analysis capability to a Tektronix oscilloscope.
With this application you can quickly and easily set up, acquire, and analyze
signals from your disk drives, in accordance with IDEMA (International Disk
Drive Equipment and Materials Association) standards.
Compatibility
Figure 1–1: TDSDDM1 Disk Drive Measurement Application
The Disk Drive Measurement Application is compatible with the following
Tektronix oscilloscopes:
H All TDS 500D and 700D Digital Phosphor Oscilloscopes with Option HD
(hard disk drive) or Option 2M (hard disk drive plus 8 MB record length)
H TDS 600C Digitizing Oscilloscopes with an Option HD (hard disk drive)
H TDS 700C Color Digitizing Oscilloscopes serial number B020100 and up,
with Option HD (hard disk drive) or Option 2M (hard disk drive plus 8 MB
record length), and with firmware version 5.2e and up
For a current list of compatible oscilloscopes, check the Tektronix, Inc. web site,
http://www.tektronix.com/Measurement/scopes/index.html
Drivers category.
in the Software and
TDSDDM1 Disk Drive Measurement Application User Manual
1–1
Page 16

Product Description
Requirements and Restrictions
The TDS Run-Time Environment V1.1 software or above must be installed on
the oscilloscope to operate the Disk Drive Measurement Application.
The application does not support control by external GPIB commands.
Updates
You can find information about this and other applications at the Tektronix, Inc.
web site, http://www.tektronix.com/Measurement/scopes/index.html
Software and Drivers category. Check this site for application updates that you
can download and for free applications.
For instructions, see Updates Through a Web Browser on page 1–4.
Accessories
in the
There are no standard accessories for this product.
The P6246 and P6247 Differential Probes are recommended for connecting to
Read channel signals.
1–2
TDSDDM1 Disk Drive Measurement Application User Manual
Page 17

Installation
This application resides on a floppy disk. You can download updates, if any,
from the Tektronix ftp site through a web browser.
NOTE. To operate the Disk Drive Measurement Application, the TDS Run-Time
Environment V1.1 or above must be installed on your oscilloscope.
Installing the Application
To install the application from the floppy disk to your oscilloscope, follow these
steps:
1. Create a backup copy of the floppy disks. You can now store the original
NOTE. Additional information about the product or installation, if any, is located
in a Readme.txt file on the floppy disk. You should insert the floppy disk into a
DOS-based personal computer and read the file before you continue.
disks and work from the backup copies.
If you are updating the application, the Readme.txt file on the Tektronix ftp site
supercedes the Readme.txt file on the floppy disk.
2. Power off the oscilloscope.
3. Insert the floppy disk in the floppy disk drive and power on the oscilloscope.
NOTE. To verify that the TDS Run-Time Environment V1.1 or above is installed,
watch for the name to appear at the top of the display when you power on the
oscilloscope. If it does not appear, contact your local Tektronix sales office.
After performing the power-up self-test, the oscilloscope automatically
begins the installation procedure.
As the application loads from the disk, the oscilloscope displays a clock icon
to indicate that it is busy. Also, the floppy disk drive LED is on, indicating
activity. If the clock icon continues to display after the floppy disk LED has
gone out, a problem has occurred with the installation. Repeat this proce-
dure. If the problem persists, contact your Tektronix representative.
TDSDDM1 Disk Drive Measurement Application User Manual
1–3
Page 18

Installation
When the installation is complete, an Installation Complete message
displays.
4. Remove the floppy disk and cycle power to the oscilloscope.
Updates Through a Web Browser
If there is an update for this application, it will be available from the Tektronix
ftp site. To install an application update, you will need to download it from the
ftp site to a hard disk, copy it to a blank DOS-formatted floppy disk, and then
install it on your oscilloscope.
NOTE. More information about changes to the application or installation is in a
Readme.txt file on the ftp site. You should read it before you continue.
To copy the application from a web browser, follow these steps:
Disk Drive Connection
1. Access the ftp site at ftp://ftp.tek.com/mbd/support/00–index.html#1
2. Scroll through the files to the TDSJIT1 application, select the file, and
download it to your hard disk drive. If necessary, unzip the file.
3. Copy the application from the hard disk to a blank DOS-formatted floppy
disk.
4. Follow the Installing the Application procedure on page 1–3.
For best signal fidelity, we recommend you use a differential probe and two
standard probes. For connection to the Read channel signal, use a differential
probe, such as the Tektronix P6247 probe. For connection to the Index and
Sector signals, use standard oscilloscope probes, such as the Tektronix P6139A
passive probe or P6243 active probe.
There are two connection configurations, primary and secondary.
.
1–4
TDSDDM1 Disk Drive Measurement Application User Manual
Page 19
Installation
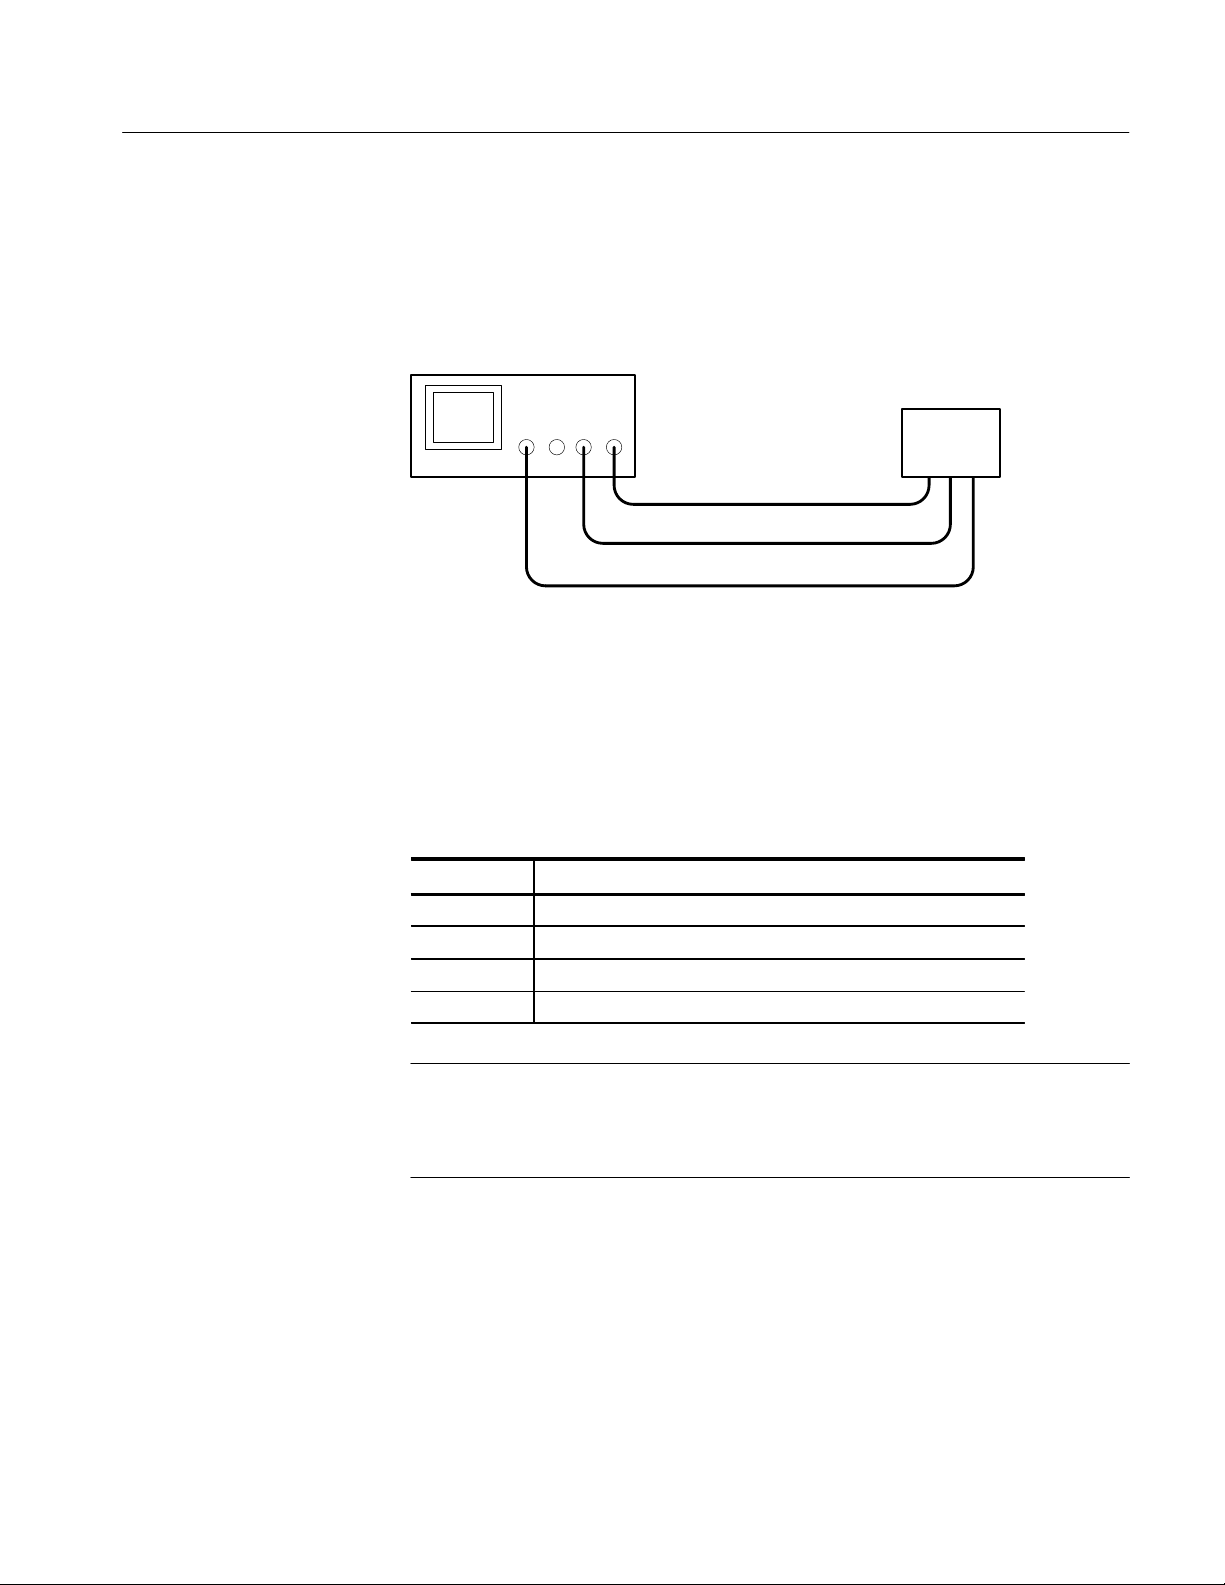
Primary Setup
Use the primary setup if you want the oscilloscope to control the disk measurements. The primary setup is used for most configurations.
Connect the disk drive to the oscilloscope as shown in Figure 1–2.
Test oscilloscope
Disk drive
CH 1 CH 4
CH 3
Index signal (standard probe)
Sector signal (standard probe)
Read signal (differential probe)
Figure 1–2: Primary setup connections
Table 1–1 shows the default channel-to-signal assignments. You can change the
channel assignments to match your configuration. See Configuring the Input
Channels on page 1–11 for more information.
T able 1–1: Primary setup channel assignments
Channel Description
Ch 1 Read signal from the preamp channel
Ch 2 Read Gate signal (optional)
Ch 3 Sector pulse, marking the beginning of the sector on the track
Ch 4 Index pulse, marking the beginning of the track
NOTE. Some disk drives mark the beginning of a track by the absence of a sector
pulse. For this case, a timeout trigger setup is needed to identify the beginning
of the track. The Disk Drive Measurement Application does not support this
configuration.
TDSDDM1 Disk Drive Measurement Application User Manual
1–5
Page 20
Installation
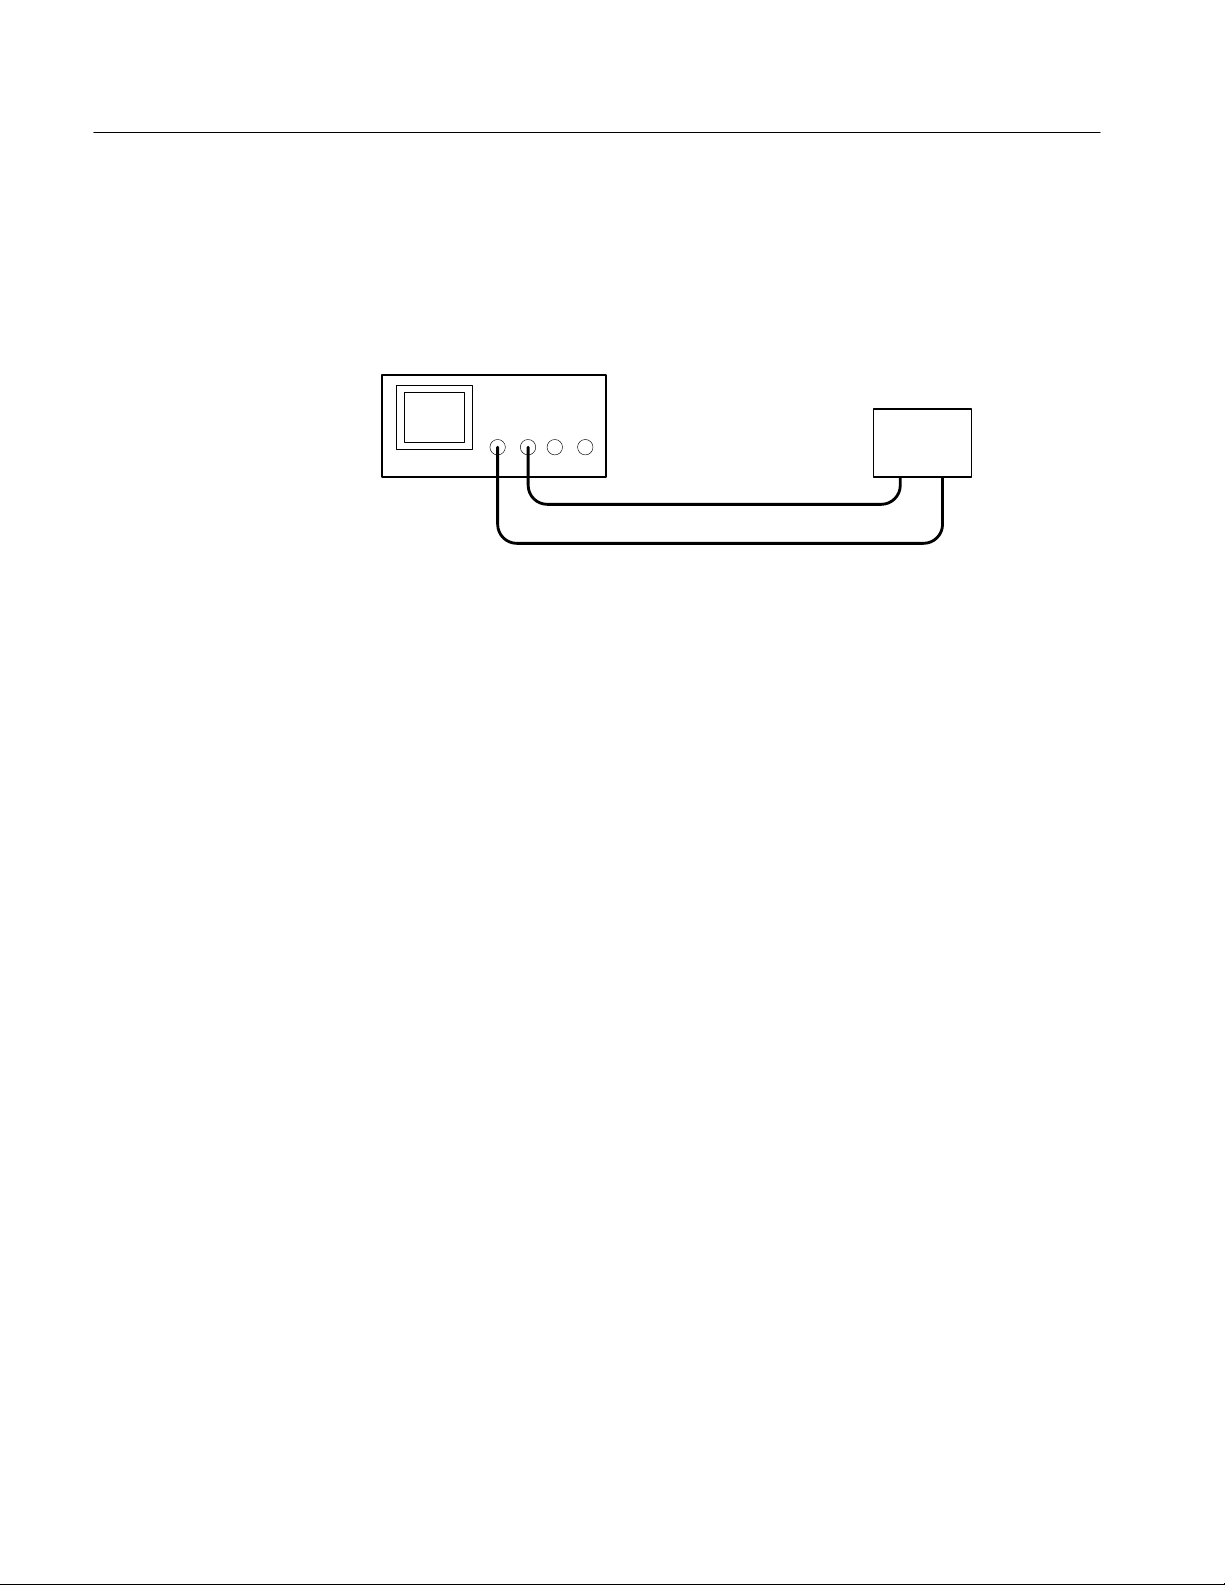
Secondary Setup
When using the secondary setup, you must specifically program the test
measurement control sequences.
Connect the disk drive to the oscilloscope as shown in Figure 1–3.
Test oscilloscope
Disk drive
CH 1 CH 2
Read Gate signal (standard probe)
Read signal (differential probe)
Figure 1–3: Secondary setup connections
1–6
TDSDDM1 Disk Drive Measurement Application User Manual
Page 21

Configuration
This section describes configuration tasks that you should perform before you
start taking measurements. For the most part, these tasks configure the oscilloscope and Disk Drive Measurement Application to correctly acquire the signals
from the disk drive under test. Additional setup parameters, concerned more with
configuring specific measurements, are located in the Setup Parameters section
beginning on page 3–5.
Setting Up the Oscilloscope Trigger
Before starting measurements, you must manually set up the trigger, as described
in the following procedure:
1. Connect the Index, Sector, and Read signals to channels 4, 3, and 1
respectively.
2. Set the oscilloscope to the desired sample rate using the horizontal SCALE
knob. (The sample rate is usually 500 MS/s, or 1, 2, or 4 GS/s.)
3. Set the time interval:
a. Fit the waveform to the screen by pressing HORIZONTAL MENU ➞
Record Length (main) ➞ Fit to Screen (side). Select ON.
b. In the same menu, select a record length appropriate to the signal under
test.
4. Set up the trigger:
a. Set the trigger coupling to DC by pressing Coupling (main) ➞ DC
(side).
b. Set the slope by pressing Slope (main) and then selecting positive or
negative slope (side). (Select the slope appropriate to your disk drive
signal.)
c. Set the mode to Normal by pressing Mode & Holdoff (main) ➞ Normal
(side).
d. Set the level by pressing Level (main) and then selecting a level
appropriate to your signal.
TDSDDM1 Disk Drive Measurement Application User Manual
1–7
Page 22

Configuration
Setting Up the Application Trigger
Before you begin taking measurements, you should specify the following trigger
parameters:
H Trigger Mode, which selects the input trigger signal
H Start/Stop Sector (used with the Sector Trigger Mode only), which specifies
the range of sectors to be measured
H Preamble Duration (used with the Sector Trigger Mode only), which the
application uses to automatically remove the preamble from the measurement calculations
Set up the trigger parameters as follows:
1. If you have not already done so, start the application as follows:
a. Press SETUP ➞ Select Application (main).
b. Using the general purpose knob, select hd0, and then press SELECT.
(Depending on previous actions, you might not need to do this step.)
c. Using the general purpose knob, select TDSDDM1.APP.
d. Press Activate Application (side).
2. Press Trigger (main) ➞ Mode (side). See Figure 1–4. Select one of the
following:
Sector Select Sector if you want to perform a measurement over a
range of sectors rather than over the entire track. The oscilloscope uses the main trigger to trigger on the Index pulse.
The delayed trigger is used to monitor sectors as follows:
Delayed trigger—triggerable after Events/Time
Delay Edge Source—Sector signal
Delay Count—sequences through sector numbers
Delay Time—preamble duration
Sector is the default Trigger Mode selection.
Read Gate Select Read Gate if you want to trigger on the Read Gate
signal. The delay trigger is not used with this selection.
User Select User if you want to use your own custom trigger set-
up. When you select User, the application does not alter the
trigger settings.
Index Select Index if you want to trigger on the Index signal. The
delay trigger is not used with this selection.
1–8
3. If you selected the Sector mode, set the Start and Stop Sectors now using the
side menu selections.
TDSDDM1 Disk Drive Measurement Application User Manual
Page 23

Configuration
4. Set the Preamble Duration. Using the general-purpose knob, select a value
that is greater than the actual signal preamble duration. This ensures that
none of the preamble is acquired and that the preamble is not included in the
measurement.
Figure 1–4: Selecting the sectors to measure
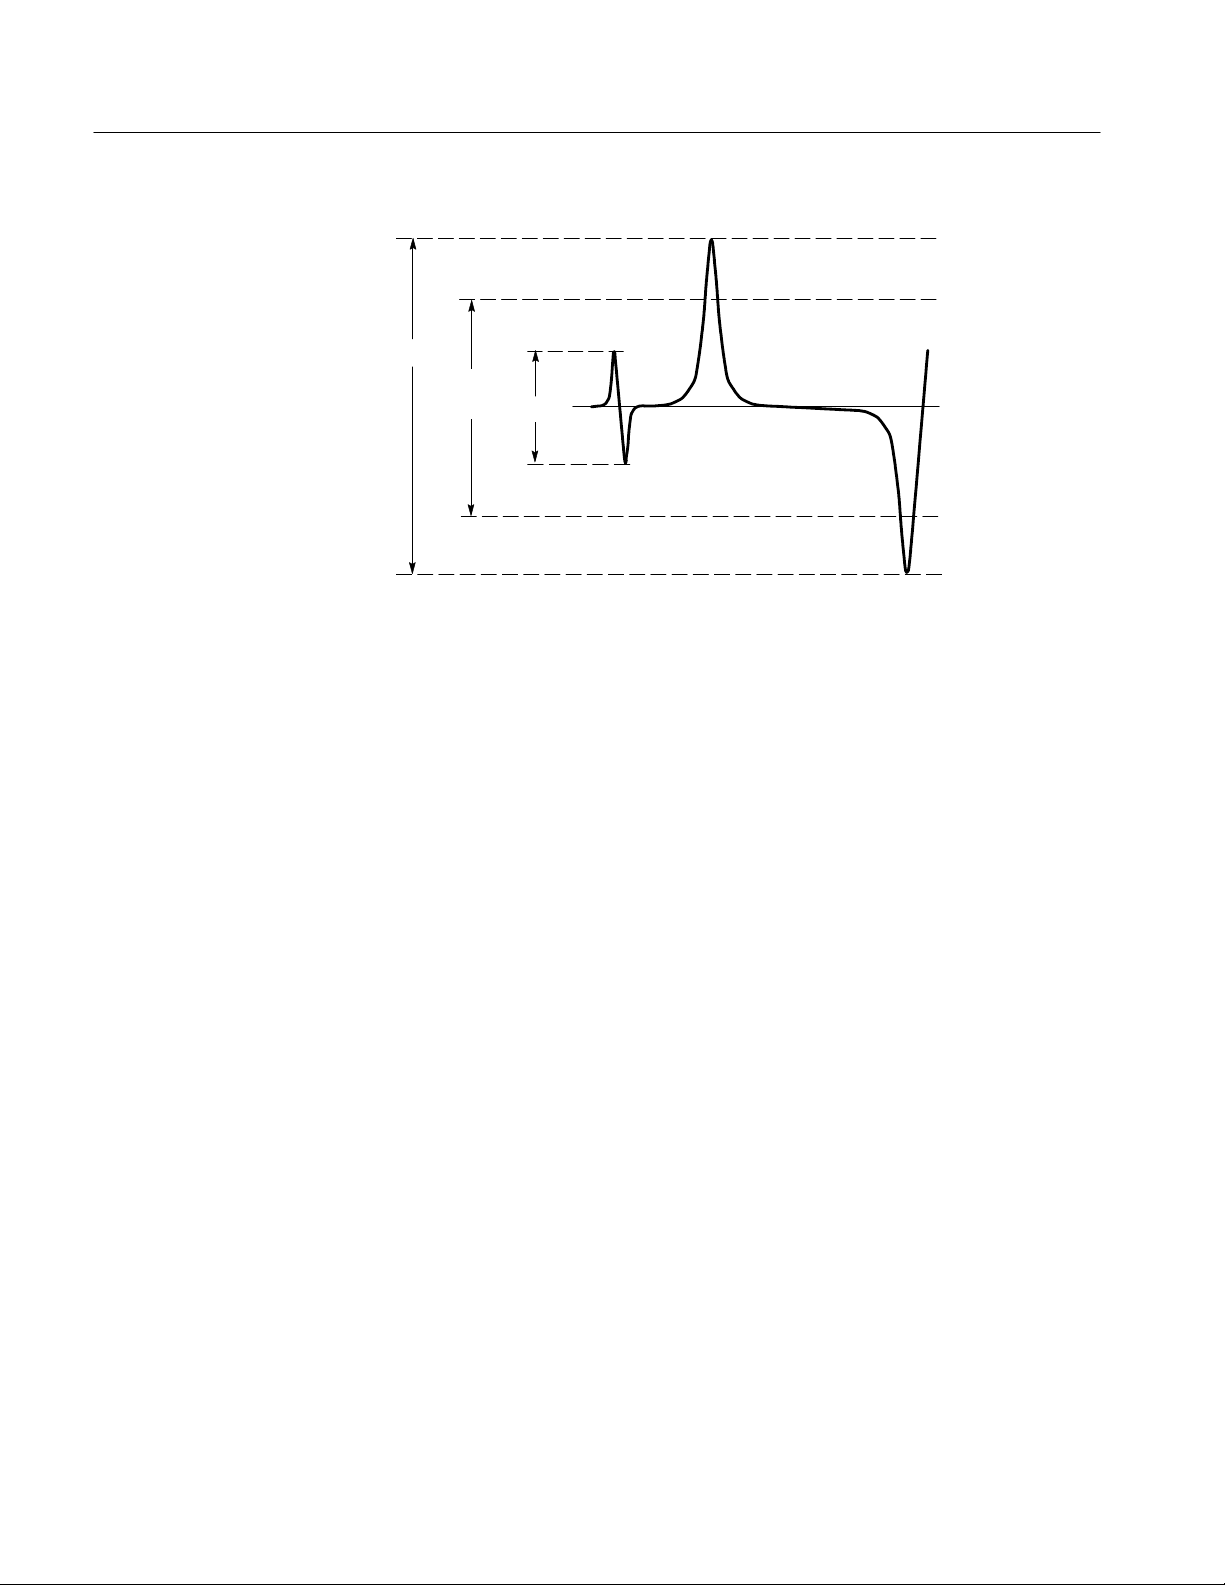
Hysteresis
Many of the measurements require a search for a local event called a peak and
trough pair. Set the hysteresis level so that noise will not cause false identification of peaks in the Read channel waveform. For a peak or trough to be found,
the signal must be greater than the hysteresis level.
Hysteresis is a global setting that is used by measurements such as TAA, PW50,
time asymmetry, and time between peaks.
TDSDDM1 Disk Drive Measurement Application User Manual
1–9
Page 24
Configuration
Peak
Signal
Hysteresis
setting
Noise
Trough
Figure 1–5: Using hysteresis to avoid false identification of peaks
Set the hysteresis levels as follows:
1. Press –menu– (main) to display the second page of menu selections.
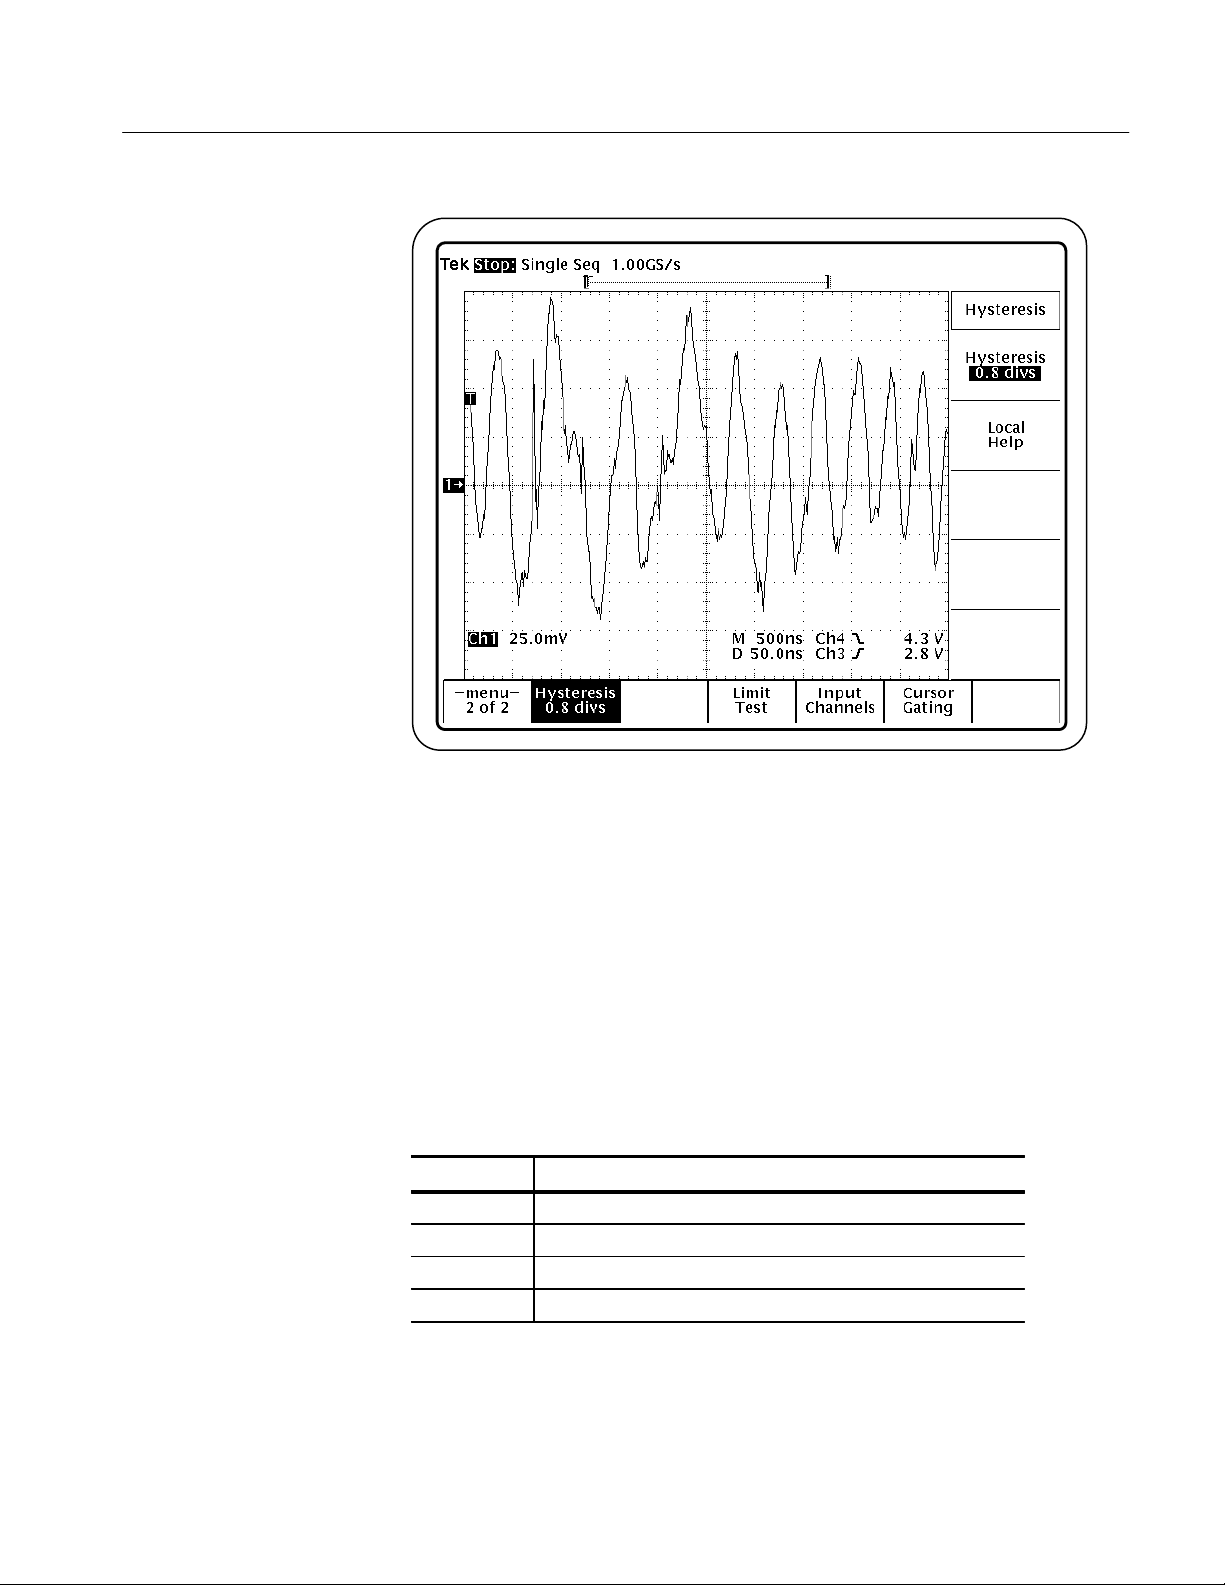
2. Press Hysteresis (main) ➞ Hysteresis (side). See Figure 1–6.
3. Specify the hysteresis value.
The units for hysteresis are in divisions. The value you enter is used for the
positive hysteresis level and its negative is used for the negative level. For
example, if you enter a value of 2 divisions, the hysteresis levels are at +2
divisions and –2 divisions.
1–10
TDSDDM1 Disk Drive Measurement Application User Manual
Page 25
Configuration
Figure 1–6: Hysteresis menu
Configuring the Input Channels
If you are using the default channel configuration, this topic does not apply to
you.
In some cases, your configuration might not match the channel assignments used
by this Disk Drive Measurement Application. Table 1–2 lists the default input
channel assignments.
T able 1–2: Default input channel assignments
Channel Description
Ch 1 Read signal from the preamp channel
Ch 2 Read Gate signal (optional)
Ch 3 Sector pulse, marking the beginning of the sector on the track
Ch 4 Index pulse, marking the beginning of the track
1
This signal is used for triggering only when the Trigger/Mode/Read
Gate menu item has been selected.
2
This signal is used for triggering only when the Trigger/Mode/Sector
menu item has been selected.
1
2
2
TDSDDM1 Disk Drive Measurement Application User Manual
1–11
Page 26
Configuration
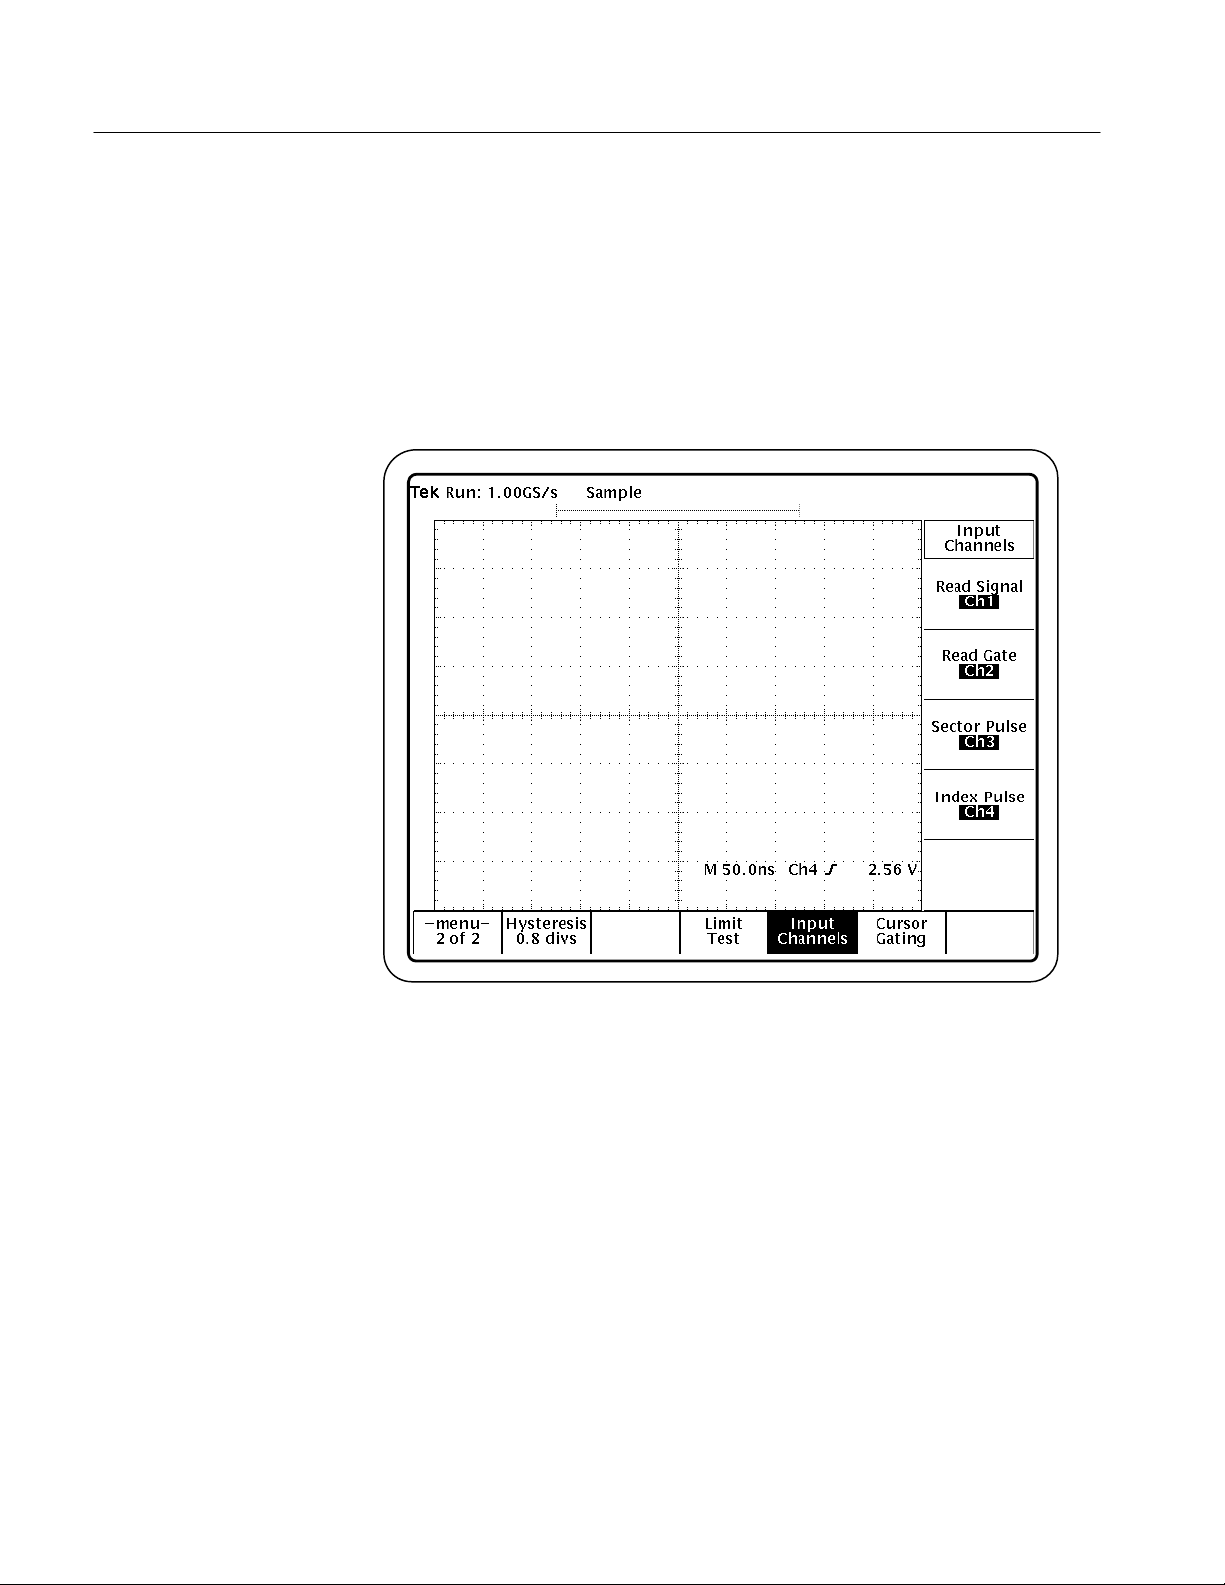
If necessary, you can reconfigure the input channels to match your configuration
using the Input Channels menu, as follows:
1. From the application display, go to the Input Channels menu by pressing
–menu– (main) ➞ Input Channels (side). See Figure 1–7.
2. Using the side menu buttons, assign the disk drive signals to the appropriate
channels.
1–12
Figure 1–7: The Input Channels menu
TDSDDM1 Disk Drive Measurement Application User Manual
Page 27

Operating Basics
Page 28

Page 29

Functional Overview
This section describes how to use the basic functions of the Disk Drive
Measurement Application. Further details about the basic functions and
descriptions of more advanced features are included in the Reference section.
Starting the Application
After the Disk Drive Measurement Application has been installed in the
oscilloscope, start the application as follows:
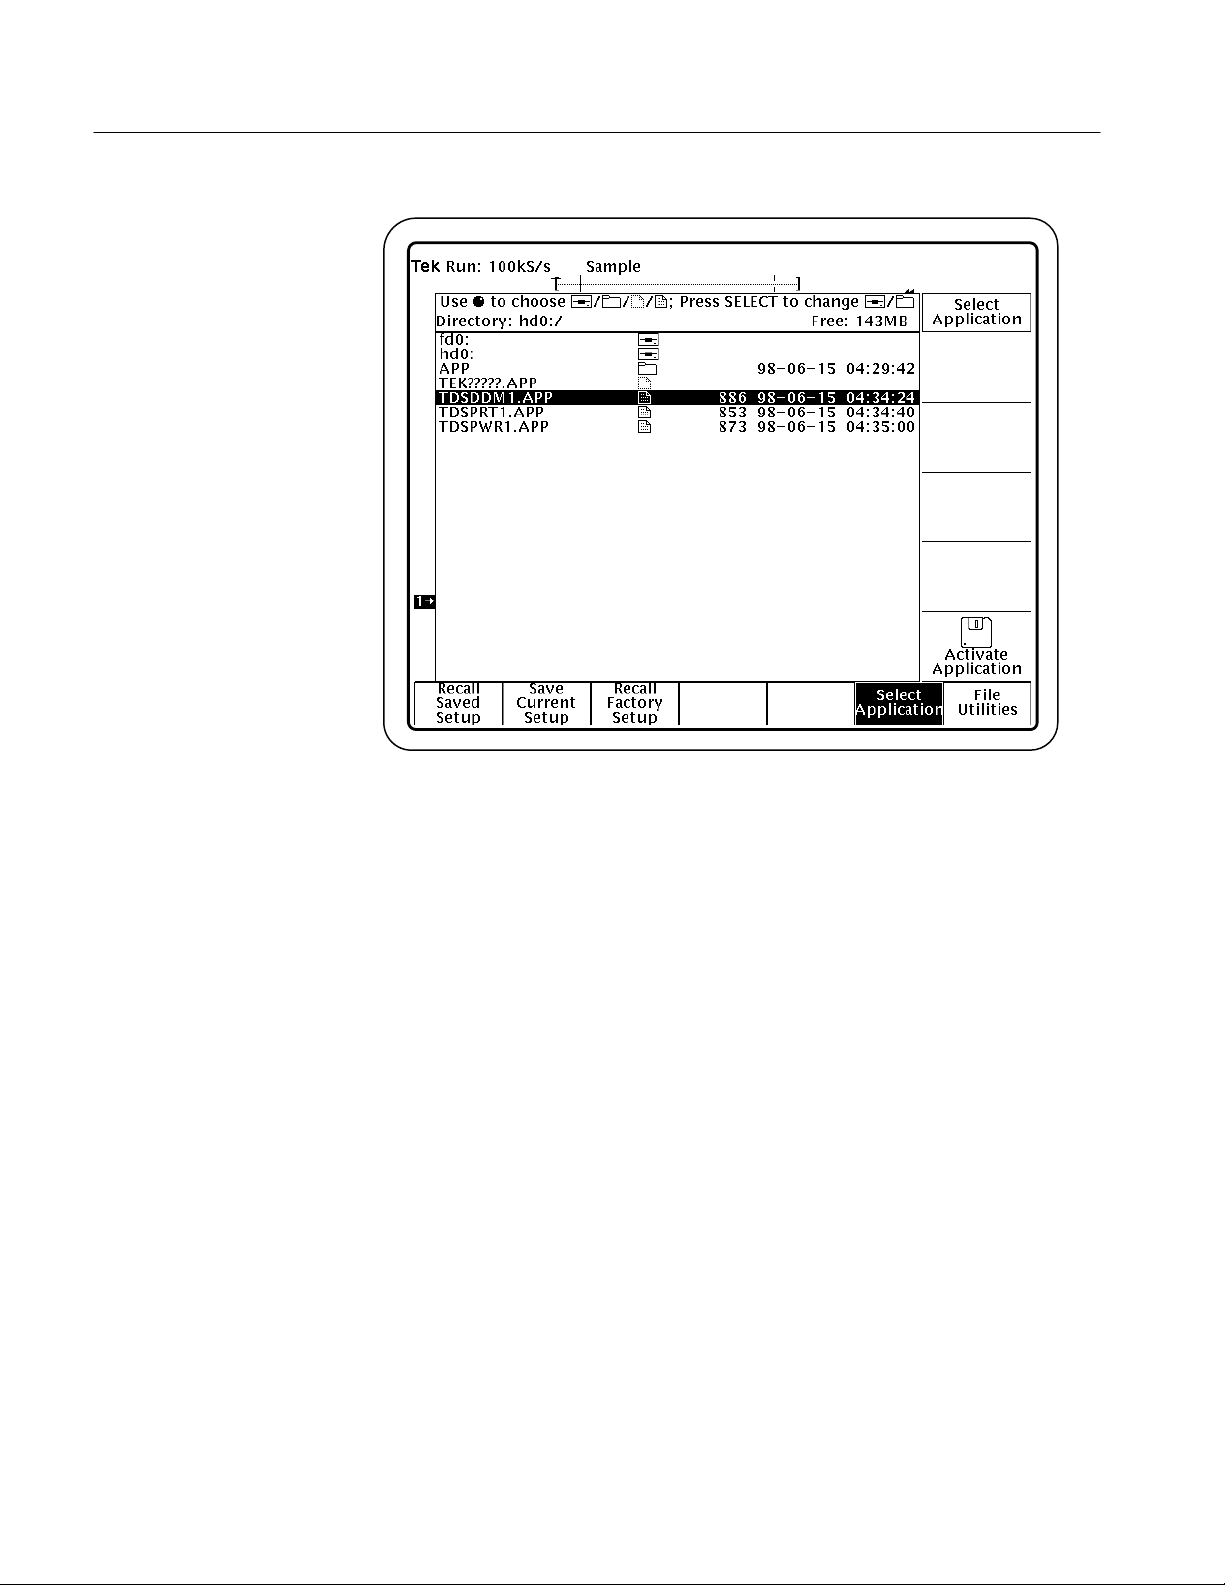
1. Press SETUP ➞ Select Application (main). See Figure 2–1.
2. Using the general purpose knob, select hd0, and then press SELECT.
(Depending on previous actions, you might not need to do this step.)
3. Using the general purpose knob, select TDSDDM1.APP.
4. Press Activate Application (side).
The application starts up and displays as shown in Figure 2–2.
TDSDDM1 Disk Drive Measurement Application User Manual
2–1
Page 30
Functional Overview
Figure 2–1: Starting the application
2–2
TDSDDM1 Disk Drive Measurement Application User Manual
Page 31
Functional Overview
Leaving the Application
Figure 2–2: Disk Drive Measurement Application initial display
You can switch between the Disk Drive Measurement Application and other
oscilloscope functions. To access primary oscilloscope functions, press the
desired front panel control. To return to the application, push the SHIFT and
APPLICATION front-panel menu buttons as shown in Figure 2–3.
To exit the application, press Utility (main) ➞ Exit (side).
Push the SHIFT and APPLICATION buttons to return to the application.
Figure 2–3: Returning to the application
TDSDDM1 Disk Drive Measurement Application User Manual
2–3
Page 32

Functional Overview
Starting the Measurement
Start the measurement as follows:
1. Select the type of measurement to execute, as follows:
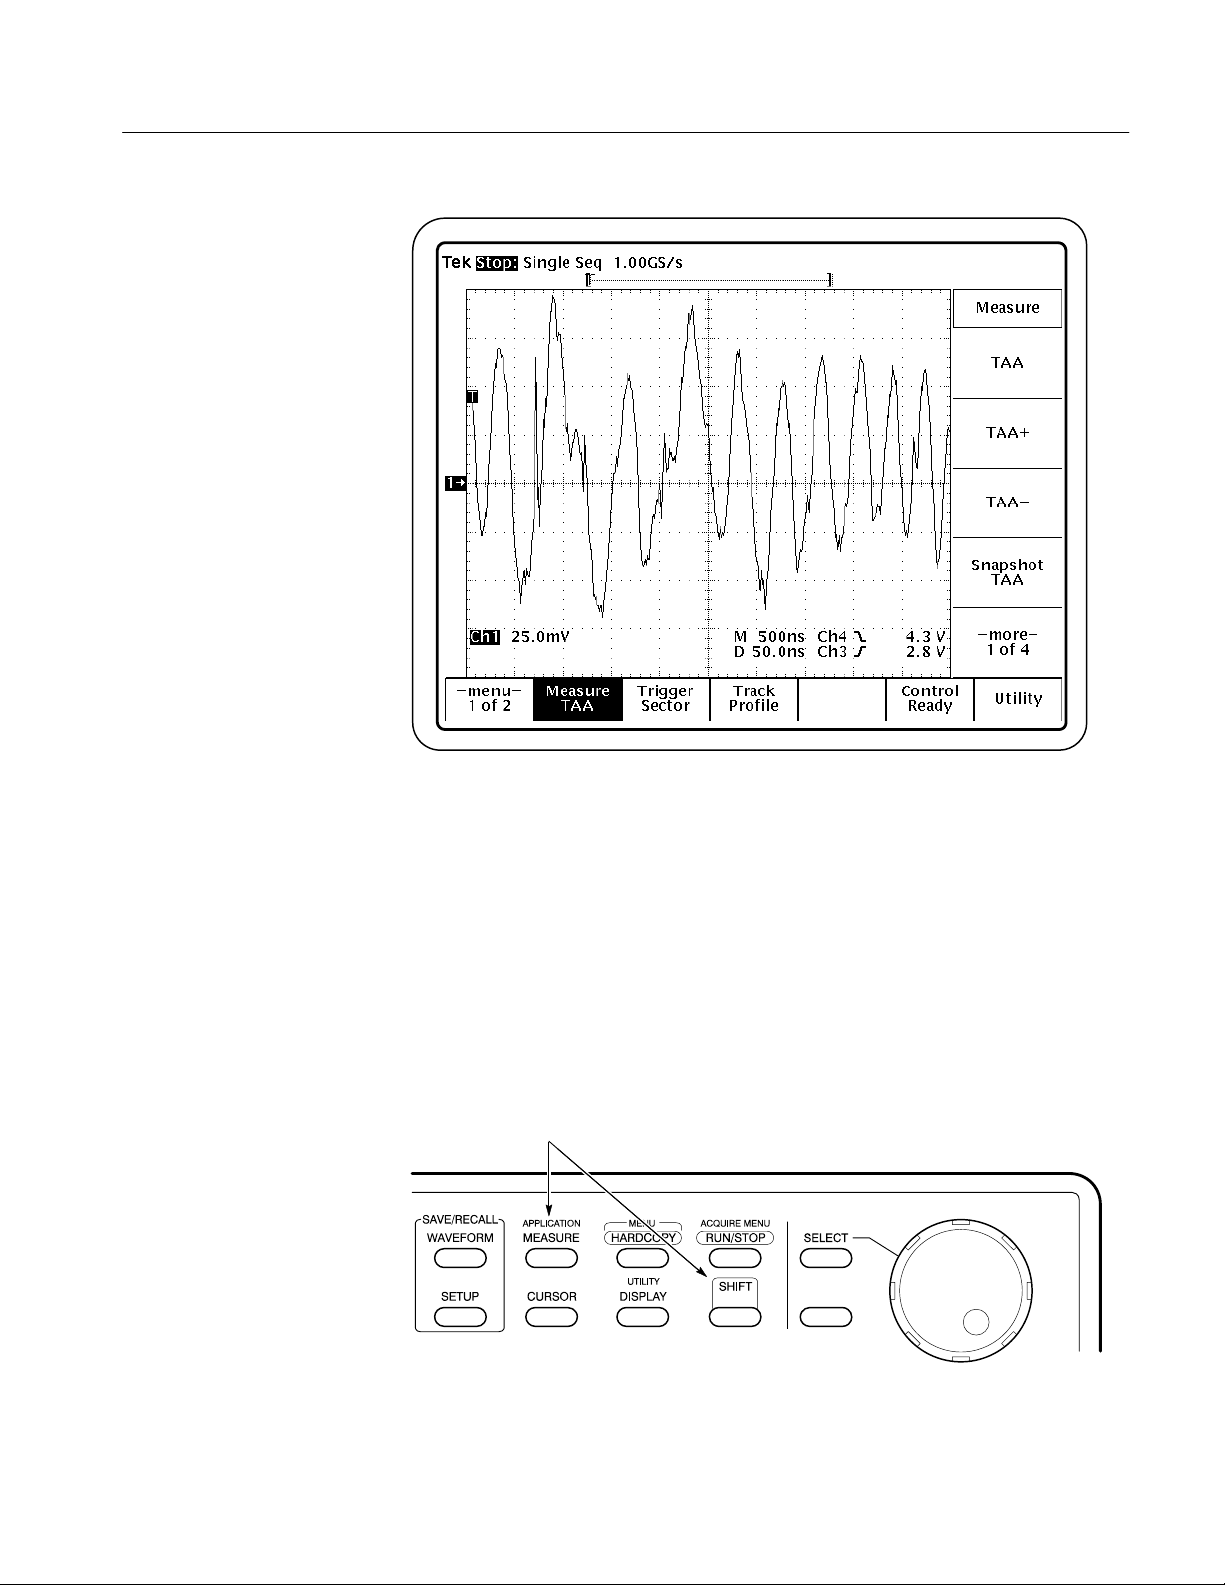
a. Display the Measure menu by pressing Measure (main). See Figure 2–4.
If the measurement you want is not shown, press –more– (side).
b. Select a measurement.
c. Make any further selections required by the measurement. (See
Measurement Descriptions on page 3–11 for information about
individual measurements.)
2–4
Press –menu– for next
menu page
Figure 2–4: Selecting a measurement from the Measure menu
TDSDDM1 Disk Drive Measurement Application User Manual
Page 33
Functional Overview
2. If you want to change trigger settings or localize the measurement, do so
now. The application defaults to the settings specified in the Trigger menu.
For further information, see Setting Up the Application Trigger on page 1–8,
Measuring Over a Range of Sectors on page 3–6, and Cursor Gating on
page 3–7.
3. Press Control (main).
4. Press Mode (side) to select Single or Free Run acquisition mode.
The Single option performs the measurement and then stops. The Free Run
option performs the measurement continually.
In the event that the measurement requires an external operation to occur
before it may continue, the readout changes to Pause. After fulfilling the
requirements specified in the message box, you must press Continue (side)
to finish the measurement.
Figure 2–5: The Control menu
TDSDDM1 Disk Drive Measurement Application User Manual
2–5
Page 34

Functional Overview
Viewing the W aveform
5. Press Start (side).
6. Wait for the measurement to complete (Single), or push the Stop side menu
button to manually stop the measurement.
In single mode, when the measurement has successfully completed, the screen
displays the updated measurement data. All measurement processing halts, but
the waveform acquisitions continue to update on the screen.
NOTE. Do not change oscilloscope settings while a measurement is being taken.
Doing so can invalidate the measurement.
Do not attempt to execute external GPIB commands to control the oscilloscope
while running the application. Doing so may interrupt the process.
Using the Local Help
To view parts of the waveform that are obscured by the measurement display
readout, push the CLEAR MENU button, located near the lower right of the
display.
To return to the application display, push the SHIFT and APPLICATION
front-panel menu buttons.
The application includes help information, available from within the application
menus. The help included with the application is independent of the main
oscilloscope help, and it operates somewhat differently. The application help
does not identify and explain individual controls; instead, it provides information
about the measurements themselves.
Display the local help as follows:
1. Display the help by pressing Utility (main) ➞ Help (side).
2. Use the side menu buttons to navigate within the help.
2–6
TDSDDM1 Disk Drive Measurement Application User Manual
Page 35

Tutorial
Preparation
This tutorial shows you how to use some basic features of the Disk Drive
Measurement Application. In addition, it teaches you how to exit the application
and how to save and recall setups. Further operating information is located in the
Reference chapter.
To perform the tutorial examples, you must have already installed the Disk Drive
Measurement Application in the oscilloscope, connected the probes to a disk
drive, and performed the configuration tasks appropriate to your disk drive under
test. For information, see Installation on page 1–3 and Configuration on
page 1–7.
If you have not already done so, start the application as follows:
1. Press SETUP ➞ Select Application. See Figure 2–1.
2. Using the general purpose knob, select hd0, and then press SELECT.
3. Using the general purpose knob, select TDSDDM1.APP.
4. Press Activate Application (side).
The application starts up and displays its initial screen.
Example 1: Measuring the Track Average Amplitude
In this example, you will measure the track average amplitude (TAA) over a
range of sectors and display the results.
1. Select the TAA measurement by pressing Measure (main) ➞ TAA (side).
2. Specify a range of sectors to measure as follows:
a. Press Trigger (main) ➞ Mode (side). Select Sector.
b. Press Start Sector (side), and set the value to 1.
c. Press Stop Sector (side), and set the value to 10.
3. Set the Preamble Duration. Using the general-purpose knob, select a value
that is greater than the actual signal preamble duration. This ensures that
none of the preamble is acquired and that the preamble is not included in the
measurement.
TDSDDM1 Disk Drive Measurement Application User Manual
2–7
Page 36

Tutorial
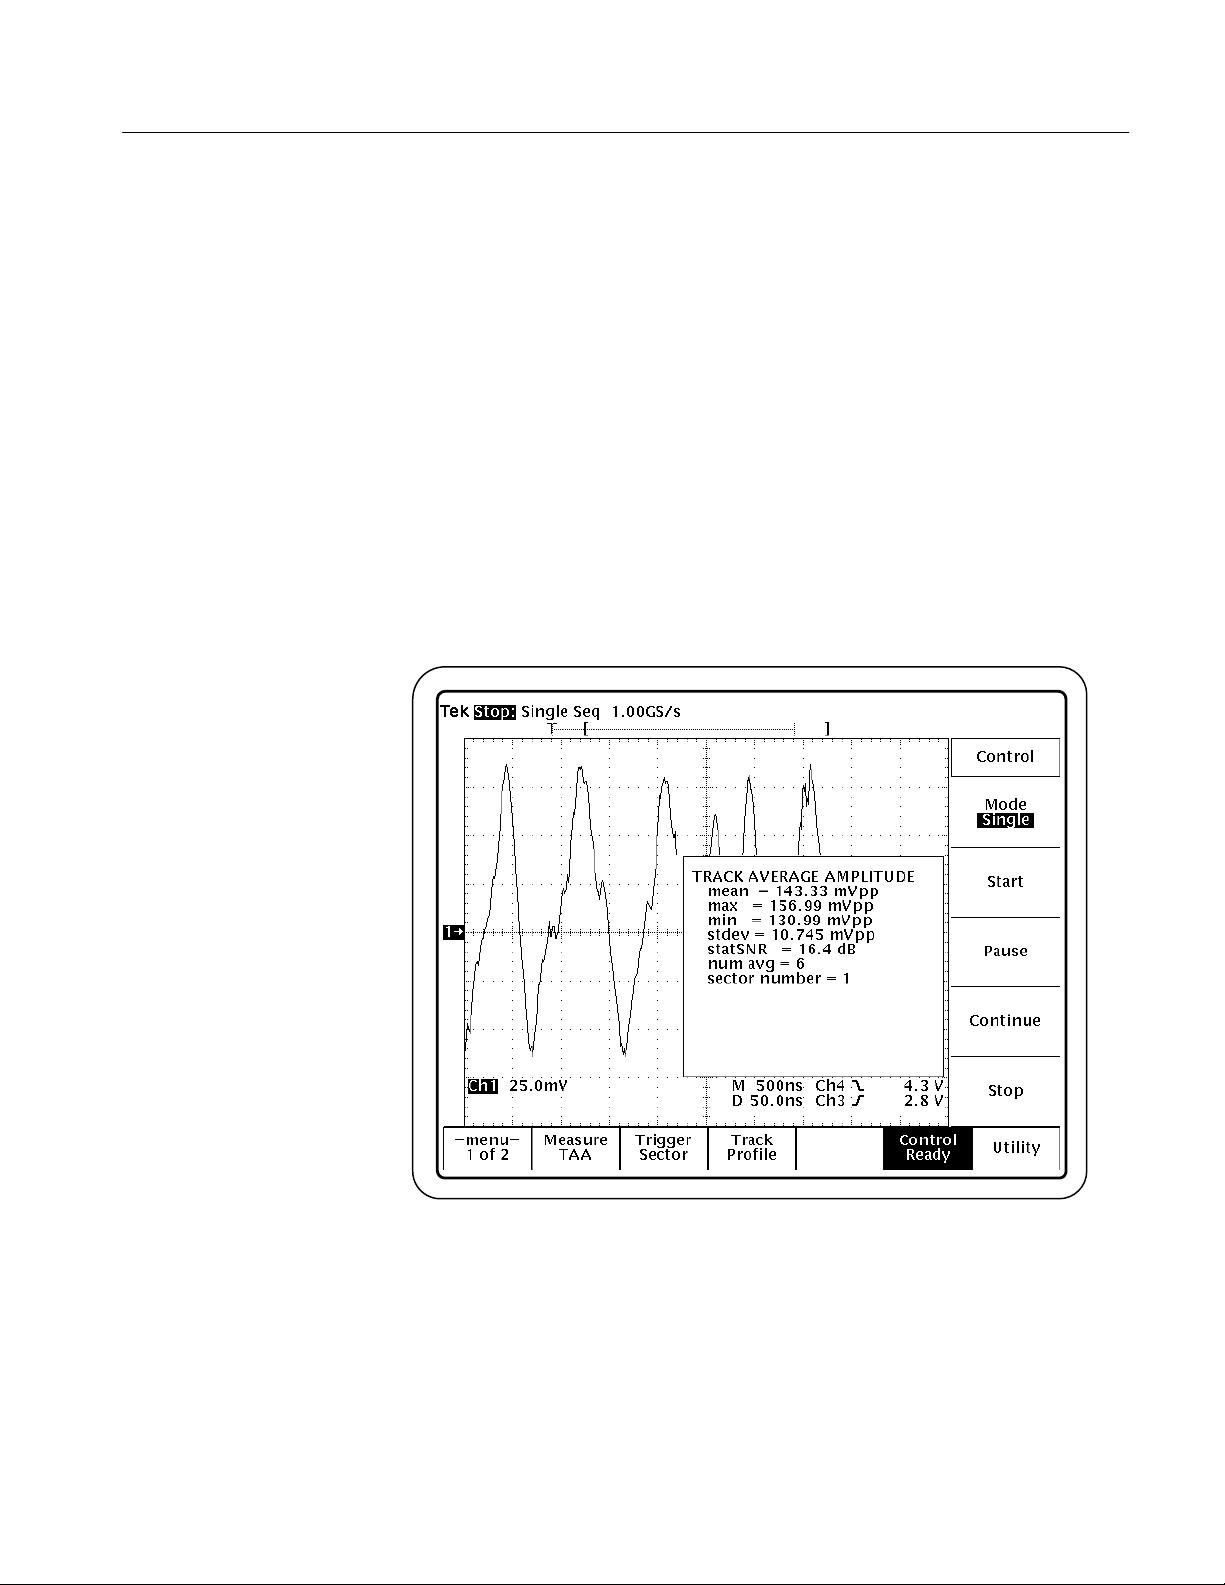
4. Start the measurement by pressing Control (main) ➞ Start (side).
5. Wait for the measurement to complete, then view the results as shown in
Figure 2–6.
Figure 2–6: Track average amplitude (TAA) measurement
Example 2: Measuring the Pulse Width at 50%
In this example, you will measure the pulse width at 50% (PW50) and use limit
testing to include a pass/fail measurement result. Instead of measuring around
the entire track, you will use cursor gating to localize the measurement. In
addition, you will use the hysteresis feature, to avoid identifying noise as actual
signals.
1. Select the PW50 measurement by pressing Measure (main) ➞ PW50 (side).
2. Select cursor gating by pressing –menu– (main) ➞ Cursor Gating (main) ➞
On/Off (side). Select ON.
3. Place the cursors over the desired segment of the waveform.
2–8
TDSDDM1 Disk Drive Measurement Application User Manual
Page 37

Tutorial
4. Enable hysteresis by pressing Hysteresis (main) ➞ Hysteresis (side). Using
the general purpose knob, set a hysteresis value that is appropriate for your
disk drive signal, such as 1.5 divs.
The hysteresis value, in divisions, is reflected above and below the waveform baseline. For example, if you choose a value of 2.0 divs, the hysteresis
level ranges from –2.0 divs to +2.0 divs.
5. Enable limit testing by pressing Limit Test (main) ➞ On/Off (side). Select
ON.
6. Press Upper Limit (side), and use the general purpose knob to select an
upper limit for this test, such as 100 ms.
7. Press Lower Limit (side), and use the general purpose knob to select a lower
limit for this test, such as 1 ns.
8. Press –menu– (main) ➞ Control (main) ➞ Start (side) to start the test.
9. Wait for the measurement to complete, then view the results as shown in
Figure 2–7.
Figure 2–7: Pulse width at 50% (PW50) measurement with cursor gating
TDSDDM1 Disk Drive Measurement Application User Manual
2–9
Page 38

Tutorial
Example 3: Creating and Viewing Track Profiles
Track profiles are reference memory waveforms that contain a history of
measurement results. You can use track profiles to observe sector-to-sector
variations in measurements and to identify the location of flaws within a track.
In this example, you will take a TAA measurement and view the track profile.
1. Turn the cursor gating feature off by pressing –menu– (main) ➞ Cursor
Gating (main) ➞ On/Off (side). Select OFF. (This feature was set in
Example 2.)
2. Select the track profile feature by pressing Track Profile (main) ➞ On/Off
(side). Select ON.
3. Press Track Profile To (side). Select Ref1.
4. If you did not already specify a range of sectors (in Example 1), do so now.
See step 2 on page 2–7 for information.
5. Select the TAA measurement by pressing Measure (main) ➞ TAA (side).
6. Press Control (main) ➞ Start (side) to start the measurement. The measure-
ment data is displayed. (The data is also stored in the reference memory
Ref1.)
7. Start the measurement by pressing Control (main) ➞ Start (side).Wait for the
results to display.
8. Display the track profile waveform by pressing MORE ➞ Ref1 (main). See
Figure 2–8.
Now you can view the results of each execution of the measurement algorithm
by moving the cursor along the track profile waveform:
9. Return to the Track Profile menu by pressing Track Profile (main).
10. Press CURSOR ➞ Function V Bars (main) ➞ V Bars (side) to display the
vertical bar cursors.
11. Move the cursor to a point of interest on the track profile waveform.
12. Press Value At Cursor (side) or Sector At Cursor (side) to view the measure-
ment results at the current cursor position.
2–10
TDSDDM1 Disk Drive Measurement Application User Manual
Page 39
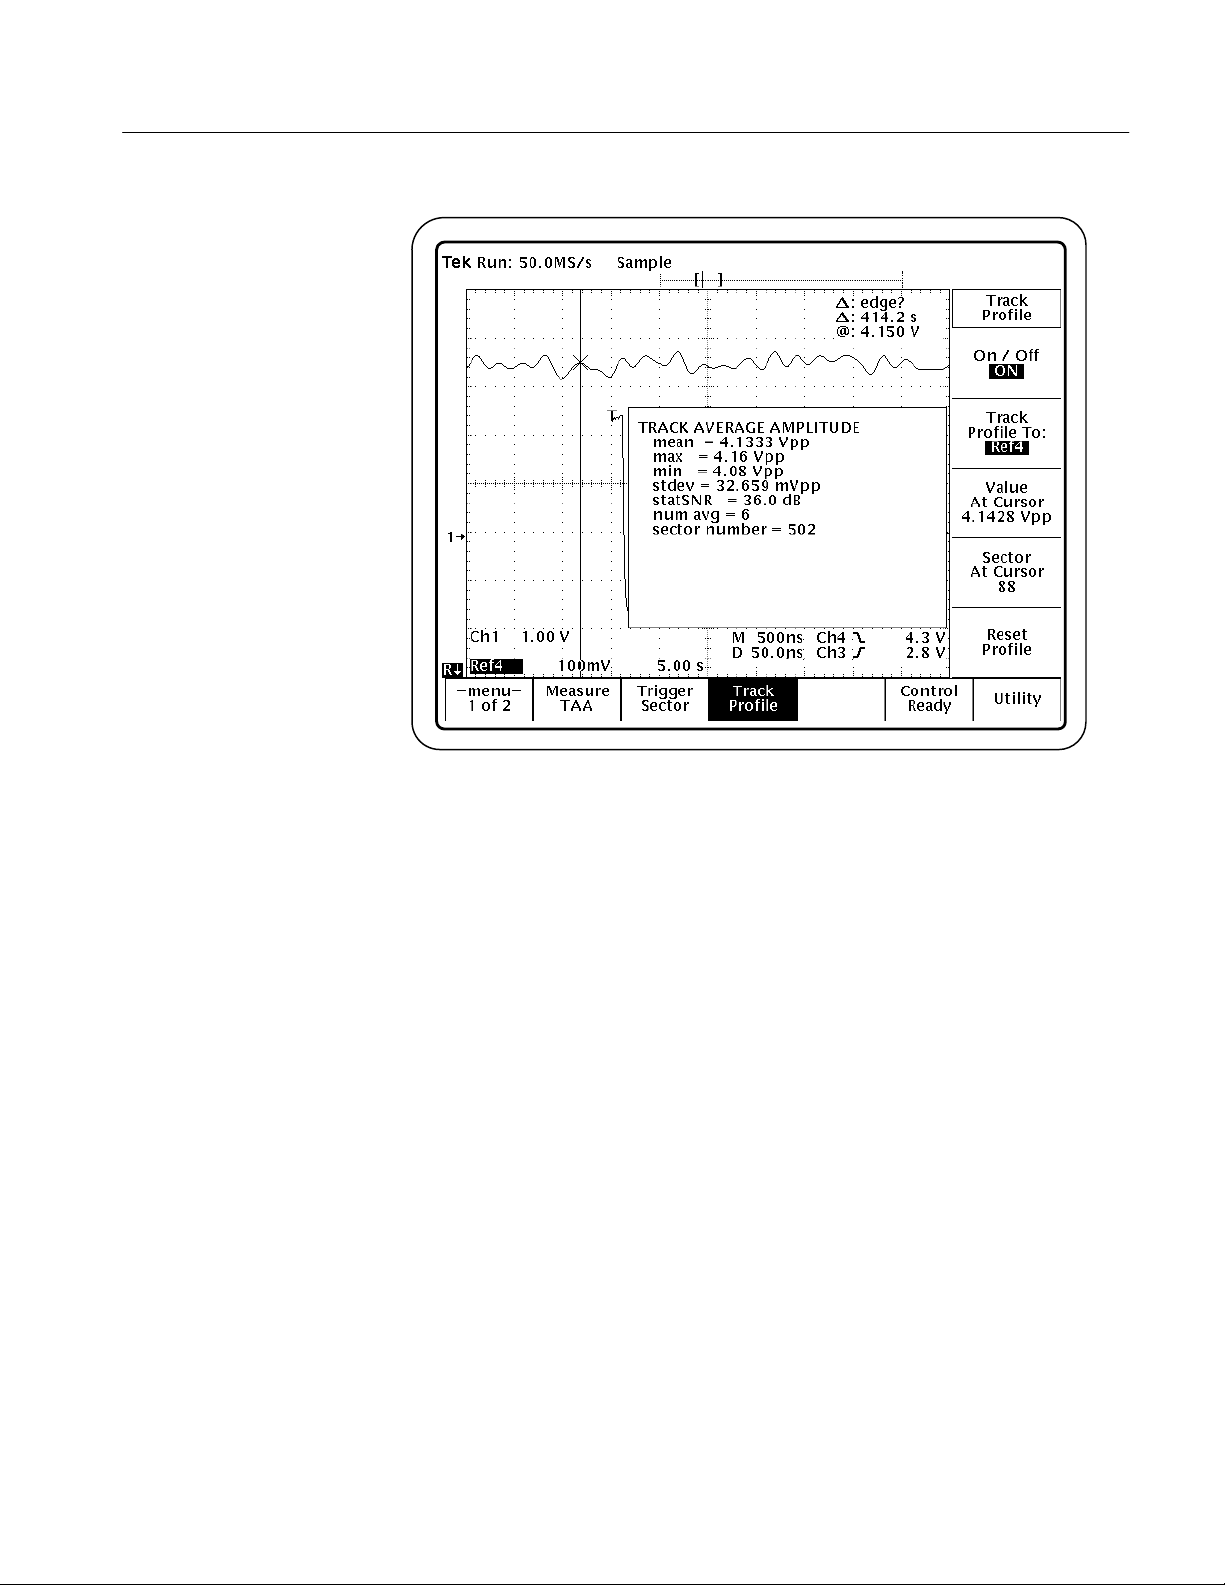
Tutorial
Figure 2–8: Track profile measurement
Example 4: Saving a Setup and Exiting the Application
You might need to save the oscilloscope setup and the application setup.
To save the oscilloscope setup, refer to the user manual for your oscilloscope.
The procedure varies between models. The setup is always saved in the
APPS/TDSJIT1/TEMP directory on the oscilloscope.
To save the application setup, follow these steps:
1. Press the SHIFT and then the APPLICATION button to return to the
application.
2. Press Utility (main) ➞ Save Setup (side).
3. Press Save to Selected File (side).
4. To exit the application, press Utility (main) ➞ Exit (side). To confirm, press
OK (side).
TDSDDM1 Disk Drive Measurement Application User Manual
2–11
Page 40

Tutorial
Example 5: Recalling a Setup
To return to the tutorial setup, you can recall the saved oscilloscope setup from
the hard disk. You will also need to restart the application.
To recall the oscilloscope setup, refer to the user manual for your oscilloscope.
The procedure varies between models.
To recall the application setup, follow these steps:
1. Start the application as described on page 2–7.
2. Press Utility (main) ➞ Recall Setup (side).
2–12
TDSDDM1 Disk Drive Measurement Application User Manual
Page 41

Reference
Page 42

Page 43

Menu Structure
Menu Summary
This section discusses the menus used in the TDSDDM1 Disk Drive Measurement Application. Included are brief descriptions of the menus and a menu
structure map which shows the relationship between menus.
There are two pages of menu selections in the Disk Drive Measurement
Application. (Press –menu– (main) to access the second page of menus.)
Press –menu– for next
menu page
Figure 3–1: Selecting menus
The following topics briefly summarize the menus.
Measure Menu
TDSDDM1 Disk Drive Measurement Application User Manual
Use the Measure menu to select a disk drive measurement. Measurement
descriptions start on page 3–11.
3–1
Page 44

Menu Structure
Trigger Menu
Track Profile Menu
Control Menu
Utility Menu
Hysteresis Menu
Use the Trigger menu to select the input trigger signal. This menu is important in
specifying setup parameters for the disk drive signals. Using one of the Trigger
menu selections, Sector, you can limit the measurement to a range of sectors. See
Specifying the Trigger on page 1–8 and Measuring Over a Range of Sectors on
page 3–6 for more information.
Use the Track Profile menu if you want to save the measurement data in a track
profile. You can use the track profile to graphically characterize the measurement
data. See Track Profiles on page 3–45 for more information.
Use the Control menu to start and stop measurements. Additional acquisition
control selections are also available, such as pause and acquisition mode control.
See Starting the Measurement on page 2–4 for more information.
Use the Utility menu to save and recall instrument setups. See Saving and
Recalling Setups on page 3–5 for more information.
Use the Hysteresis menu to reduce the effects of noise on measurements. Set
thresholds such that only real peaks and troughs are measured, rather than
measuring noise. See Hysteresis on page 1–9 for more information.
Limit Test Menu
Input Channels Menu
Cursor Gating Menu
Use the Limit Test menu if you want to add a pass/fail result to the measurement.
See Adding Pass/Fail Results to Measurement Data on page 3–9 for more
information.
Use the Input Channels menu if your channel assignment configuration does not
match the default configuration, as described in Configuring Input Channels on
page 1–11.
Use the Cursor Gating menu if you want to localize measurements to a specific
area of the waveform. See Cursor Gating on page 3–7 for more information.
3–2
TDSDDM1 Disk Drive Measurement Application User Manual
Page 45

Menu Structure
The following figure shows the relationship of the application menus.
Menu Structure
Menu 1
Measure
Trigger
TAA
TAA+
TAA–
Snapshot TAA
PW50
PW50+
PW50–
Snapshot PW50
NLTS Initial Mag
NLTS 1st Adjacent
NLTS 2nd Adjacent
NLTS Snapshot
SNR Pattern Duration
Overwrite
Resolution
Asperity
Mode
Start Sector
Stop Sector
Preamble Duration
Pattern Duration
Duration Tolerance
Polynomial Index
Duration Tolerance
Bits per Pattern
Threshold
Reset
Sector
Read Gate
User
Index
Menu 2
Hysteresis Hysteresis
On/Off
Limit Test
Input Channels
Cursor Gating On/Off
Upper LImit
Lower Limit
Read Signal
Read Gate
Sector Pulse
Index Pulse
On/Off
Track Profile To
Track Profile
Control
Utility
Value At Cursor
Sector At Cursor
Reset Profile
Mode
Start
Pause
Continue
Stop
Help
Exit
Save Setup
Recall Setup
Default Setup
Single
Free Run
TDSDDM1 Disk Drive Measurement Application User Manual
3–3
Page 46

Menu Structure
3–4
TDSDDM1 Disk Drive Measurement Application User Manual
Page 47

Setup Parameters
This section describes procedures that change how measurements are taken. For
example, you can localize the area of measurement by specifying a range of
sectors or a segment of the waveform. Additional configuration parameters,
concerned more with hardware and signal setup, are located in the Configuration
section beginning on page 1–7.
Saving and Recalling Setups
To speed up the configuration process, you can save and recall application menu
settings. The save/recall function is controlled from the application Utility menu.
As shown in Figure 3–2, you have the following selections:
H To store the current application settings, press Utility (main) ➞ Save Setup
(side). The settings are stored in the file tdsddm1.ini on the hard disk. Once
you have saved a setup, that setup will be recalled upon starting the Disk
Drive Measurement Application. The tdsddm1.ini file is not updated
automatically; you must use Save Setup to update the file.
NOTE. If you want to save your current configuration, be sure to use the Save
Setup feature to store the current application settings. The settings are not saved
automatically.
You can also manually return to the settings in the file tdsddm1.ini at any
time. To recall the setup, press Utility (main) ➞ Recall Setup (side).
H To recall the factory default menu settings, press Utility (main) ➞ Default
Setup (side).
The Disk Drive Measurement Application Save/Recall function is totally
independent of the primary oscilloscope Save/Recall function, which is stored in
nonvolatile RAM.
TDSDDM1 Disk Drive Measurement Application User Manual
3–5
Page 48

Setup Parameters
Figure 3–2: Save Setup and Recall Setup selections in the Utility menu
Measuring Over a Range of Sectors
To reduce measurement time, or to focus on a specific area of the disk, you can
specify that the measurement take place over a limited range of sectors.
Before starting the measurement, specify the range of sectors to be measured as
follows:
1. Press Trigger (main) ➞ Mode (side). Select Sector. See Figure 3–3.
2. Specify the sector range:
a. Press Start Sector (side).
b. Use the general purpose knob to specify the sector.
c. Repeat for the Stop Sector.
3. If you have not already done so, set the Preamble Duration as described in
step 4 of Setting Up the Application Trigger, on page 1–8.
See also Cursor Gating on page 3–7 for another method of localizing measurements.
3–6
TDSDDM1 Disk Drive Measurement Application User Manual
Page 49

Setup Parameters
NOTE. The Sector Number field displays a ? if the Trigger Mode setting is not
Sector.
Figure 3–3: Selecting the sectors to measure
Cursor Gating
To localize a measurement to a specific area of interest, you can use cursor
gating. With cursor gating, you use the oscilloscope cursors to indicate the area
of interest on the waveform record. See Figure 3–4.
Localizing measurement can speed up processing and eliminate unwanted data
from your analysis.
TDSDDM1 Disk Drive Measurement Application User Manual
3–7
Page 50

Setup Parameters
Figure 3–4: Localizing a measurement using cursor gating
Before starting the measurement, specify the portion of the waveform to be
measured as follows:
1. Press Cursor Gating (main) ➞ On/Off (side). Select ON. See Figure 3–4.
When cursor gating is On, the cursors are turned on and the read channel is
selected.
2. Place the cursors at the beginning and end of the waveform segment of
interest.
When you perform the measurement, only the data between the cursors will be
measured.
When cursor gating is Off, the application measures the full record length.
NOTE. The cursor gating function in this menu applies to the measurements in
the Disk Drive Measurement Application only. It does not apply to measurements in the main Measure menu of the oscilloscope.
3–8
TDSDDM1 Disk Drive Measurement Application User Manual
Page 51
Localizing Measurements: an Alternate Method
There is another way to control the amount of data to measure without using
gated cursors or specifying a range of sectors. You can do this by adjusting the
Preamble Duration in the application Sector menu and the Record Length or
Horizontal Scale in the oscilloscope horizontal menu. By specifying both the
starting point and the total length of the measurement in this way, you can
effectively size the area of interest.
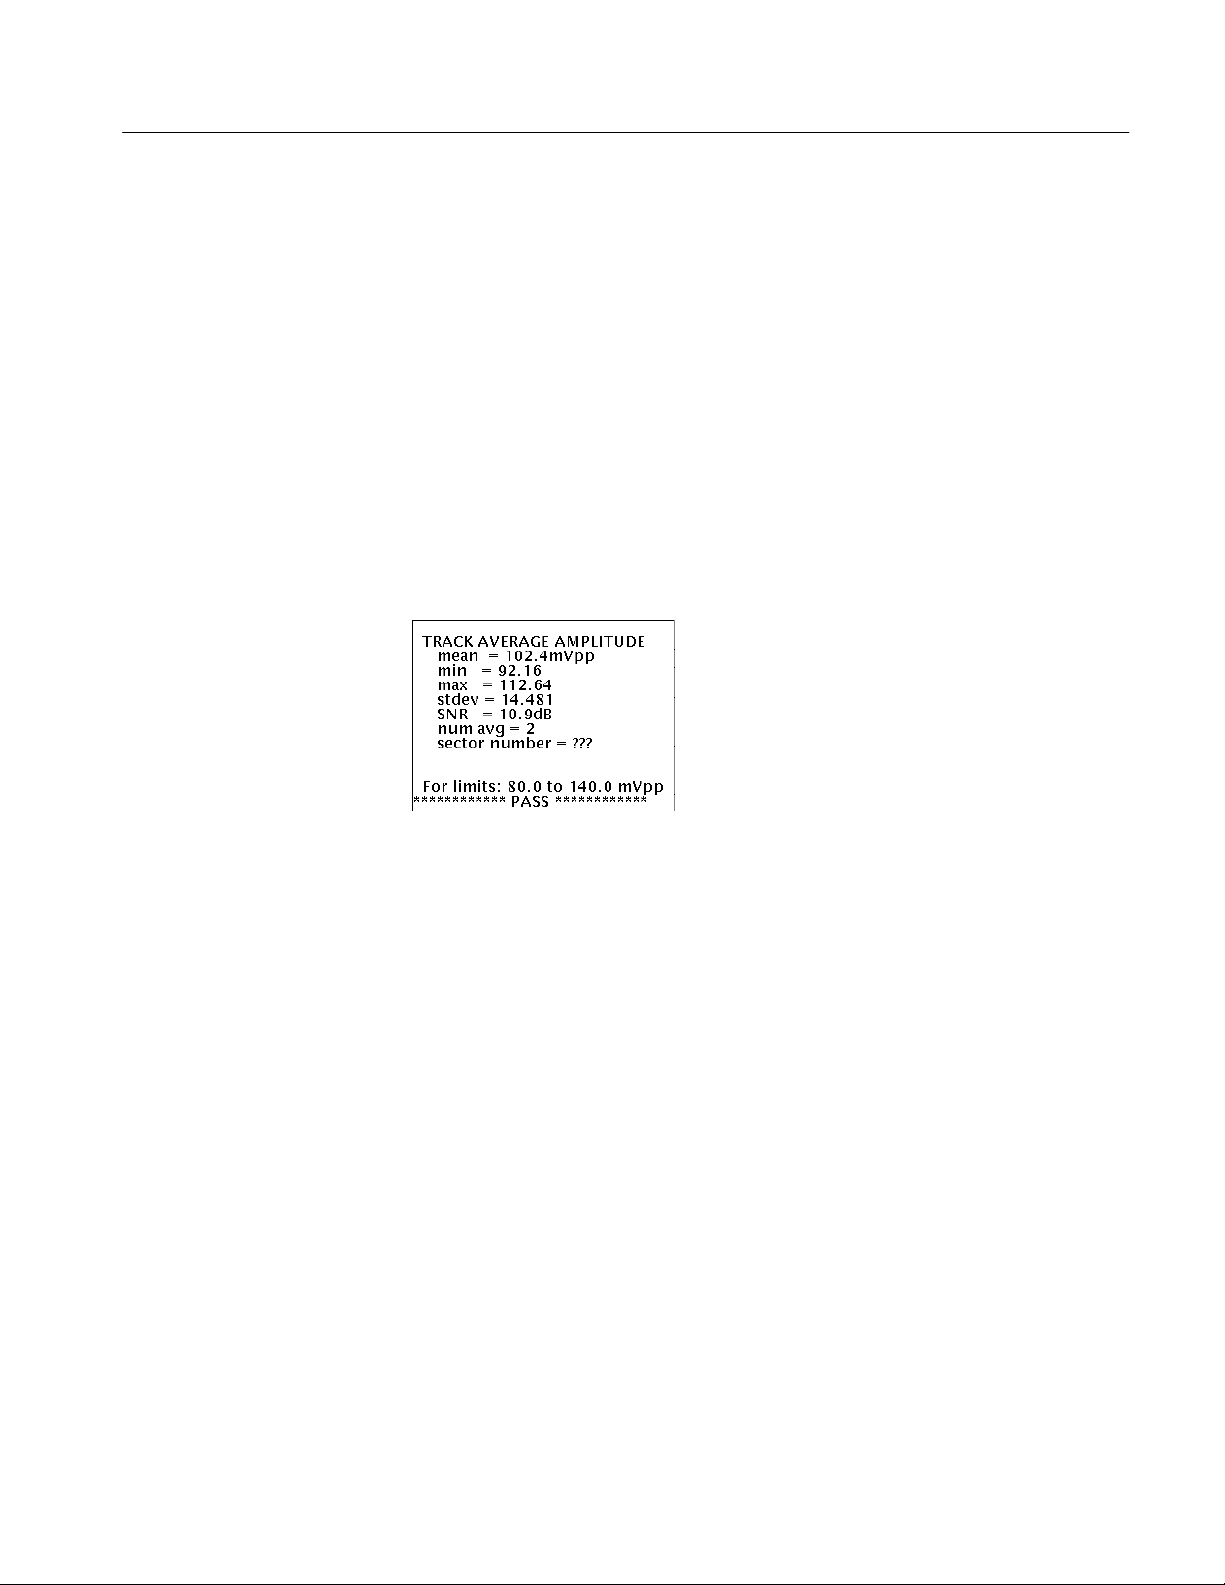
Adding Pass/Fail Results to Measurement Data
You can add a pass/fail test result to the measurement data, based on whether the
data falls within specified limits. See Figure 3–5 for an example.
Setup Parameters
Figure 3–5: Limit Test results
Use the Limit Test menu to set upper and lower limits to be used by the
measurements. See Figure 3–6.
To include Limit Test results, do the following:
1. Select a measurement from the Measure menu (main).
2. Press –menu– (main) ➞ Limit Test (main) ➞ On/Off (side). Select ON. See
Figure 3–6.
3. Set the upper and lower limits for the measurement.
4. Repeat steps 1 and 3 for each measurement.
TDSDDM1 Disk Drive Measurement Application User Manual
3–9
Page 52

Setup Parameters
Figure 3–6: Setting pass/fail limits
3–10
TDSDDM1 Disk Drive Measurement Application User Manual
Page 53
Measurement Descriptions
The following pages describe the measurements you can make with the Disk
Drive Measurement Application package. The descriptions include information
about how to take the measurement and information about the algorithm used to
perform the measurement operation.
Unless specifically stated otherwise, all measurements in the Disk Drive
Measurement Application are conducted in accordance with procedures specified
in the International Disk Drive Equipment and Materials Association (IDEMA)
Disk Drive Standard.
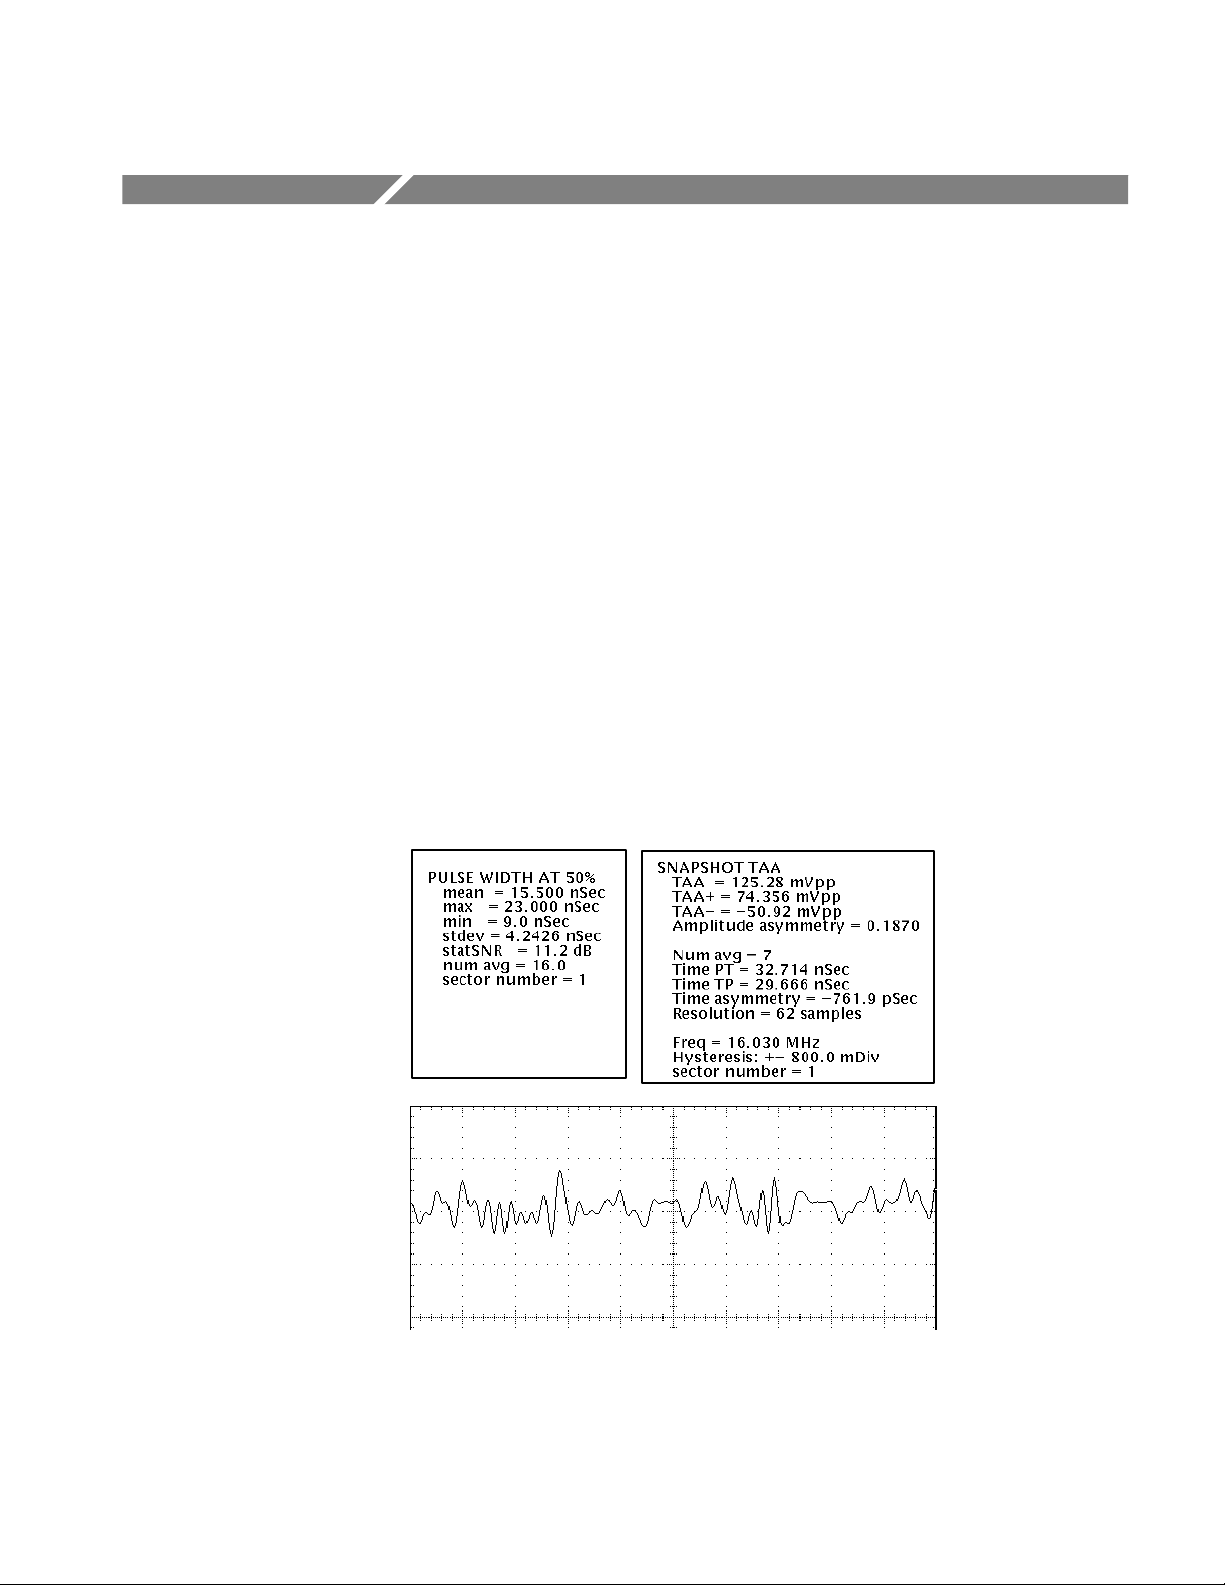
Measurement Features
There are two main groups of measurement types: standard measurements and
snapshot measurements. In addition, you can use track profiles to provide a
history of the track measurements. See Figure 3–7. Standard measurements
provide data associated with a specific measurement. Snapshots list measurement
data for that measurement group. Track profiles collect all the data for each
individual track and display the data graphically.
Figure 3–7: Standard measurement, snapshot measurement, and track profile
TDSDDM1 Disk Drive Measurement Application User Manual
3–11
Page 54

Measurement Descriptions
Warning Messages
Measurements do not continuously update unless you select Free Run mode in
the Control menu before starting the measurement. To take another measurement, press Start (side) again.
Standard measurements (not snapshots) provide a warning if the input conditions
do not support accurate measurements. The application warns you if the number
of samples in the measurement is less than 25. Similarly, the application warns
you of low vertical resolution if the number of digitizing levels is below 50.
3–12
TDSDDM1 Disk Drive Measurement Application User Manual
Page 55

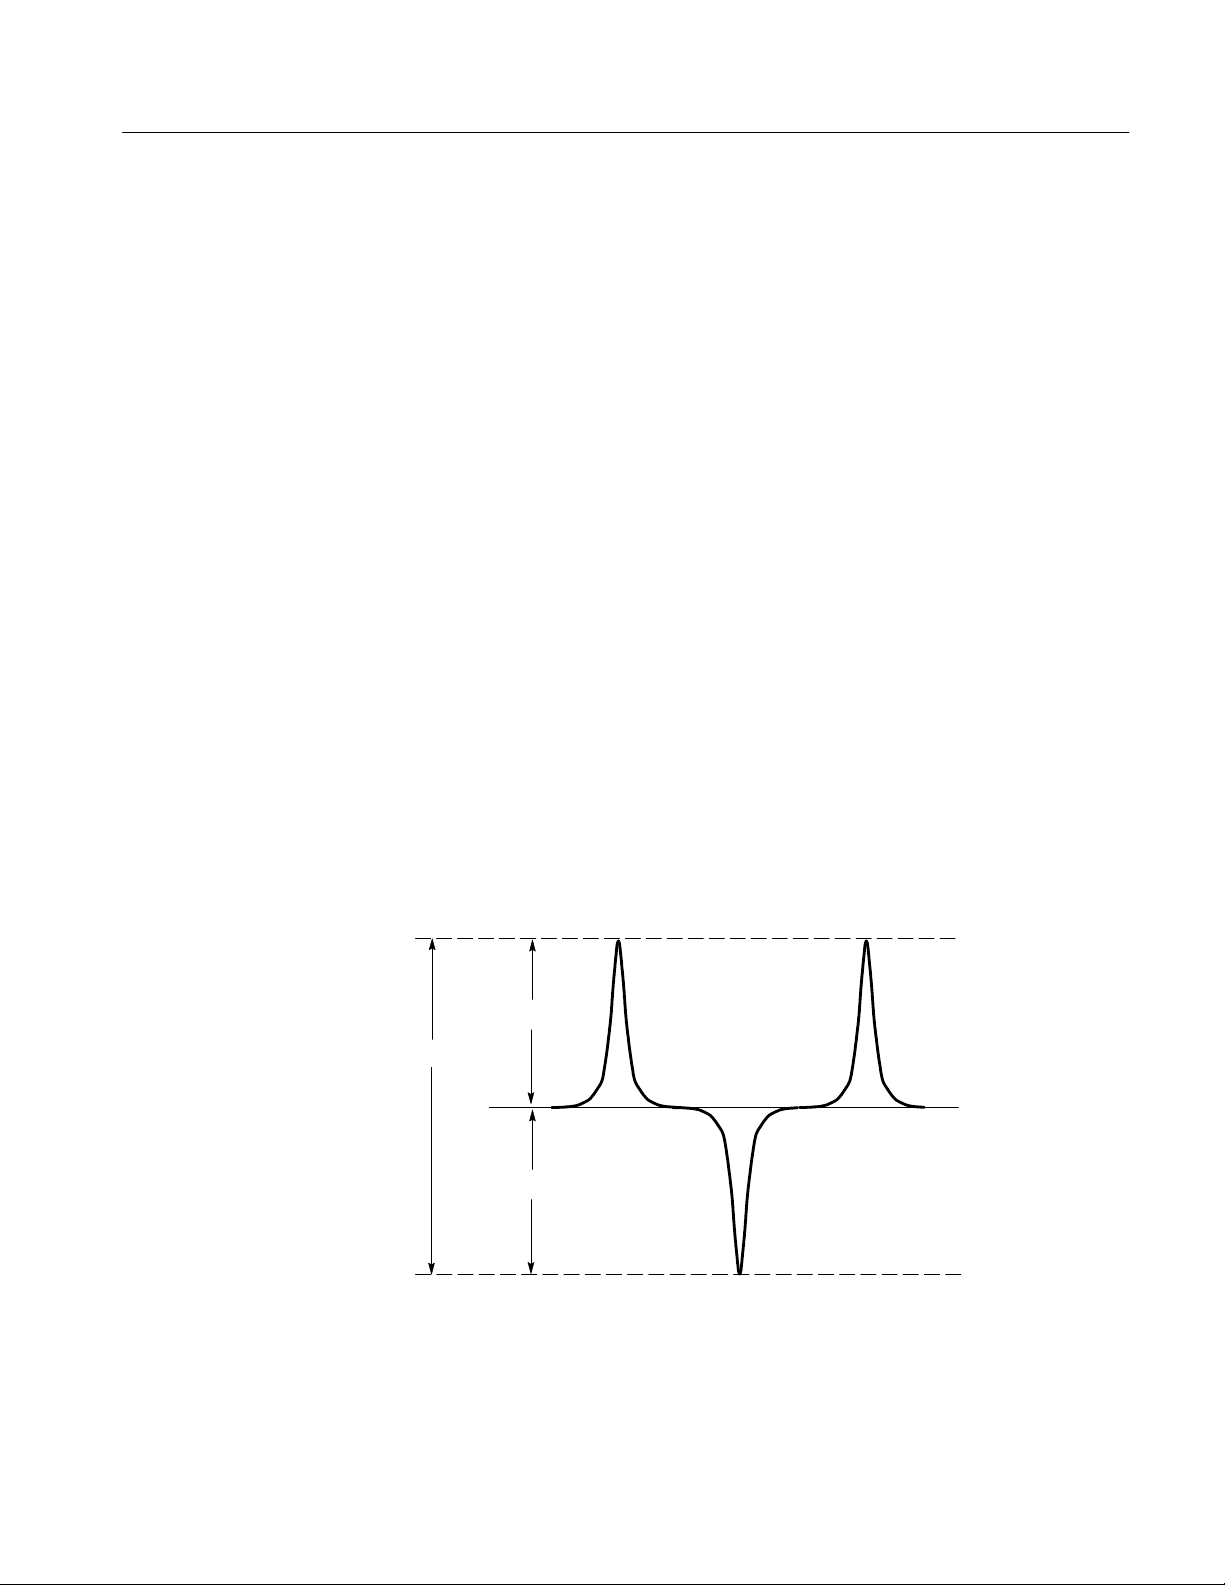
Track Average Amplitude, TAA
The track average amplitude, TAA, is the average peak-to-peak value of the data
on the Read channel signal over the specified range of sectors. IDEMA specifies
the duration to be over one complete track revolution.
Measurement Descriptions
Figure 3–8: Track average amplitude measurement
Definition
TDSDDM1 Disk Drive Measurement Application User Manual
The track average amplitude measurement, TAA, is defined as follows:
N–1
TAA +
Where: N is the number of positive and negative pulse pairs
1
N
i + 0
V
(i)
S
V
pp
is the peak-to-peak voltage
pp
3–13
Page 56

Measurement Descriptions
Procedure
Test Methodology
From the Disk Drive Measurement Application display, follow these steps:
1. Select the TAA measurement by pressing Measure (main) ➞ TAA (side).
2. If you want to change trigger settings or localize the measurement, do so
now. The application defaults to the settings specified in the Trigger menu.
For further information, see Setting Up the Application Trigger on page 1–8,
Measuring Over a Range of Sectors on page 3–6, and Cursor Gating on
page 3–7.
3. Press Control (main) ➞ Start (side) to start the measurement.
4. Wait for the measurement to complete, then view the results as shown in
Figure 3–8.
The application performs the measurement according to the following algorithm:
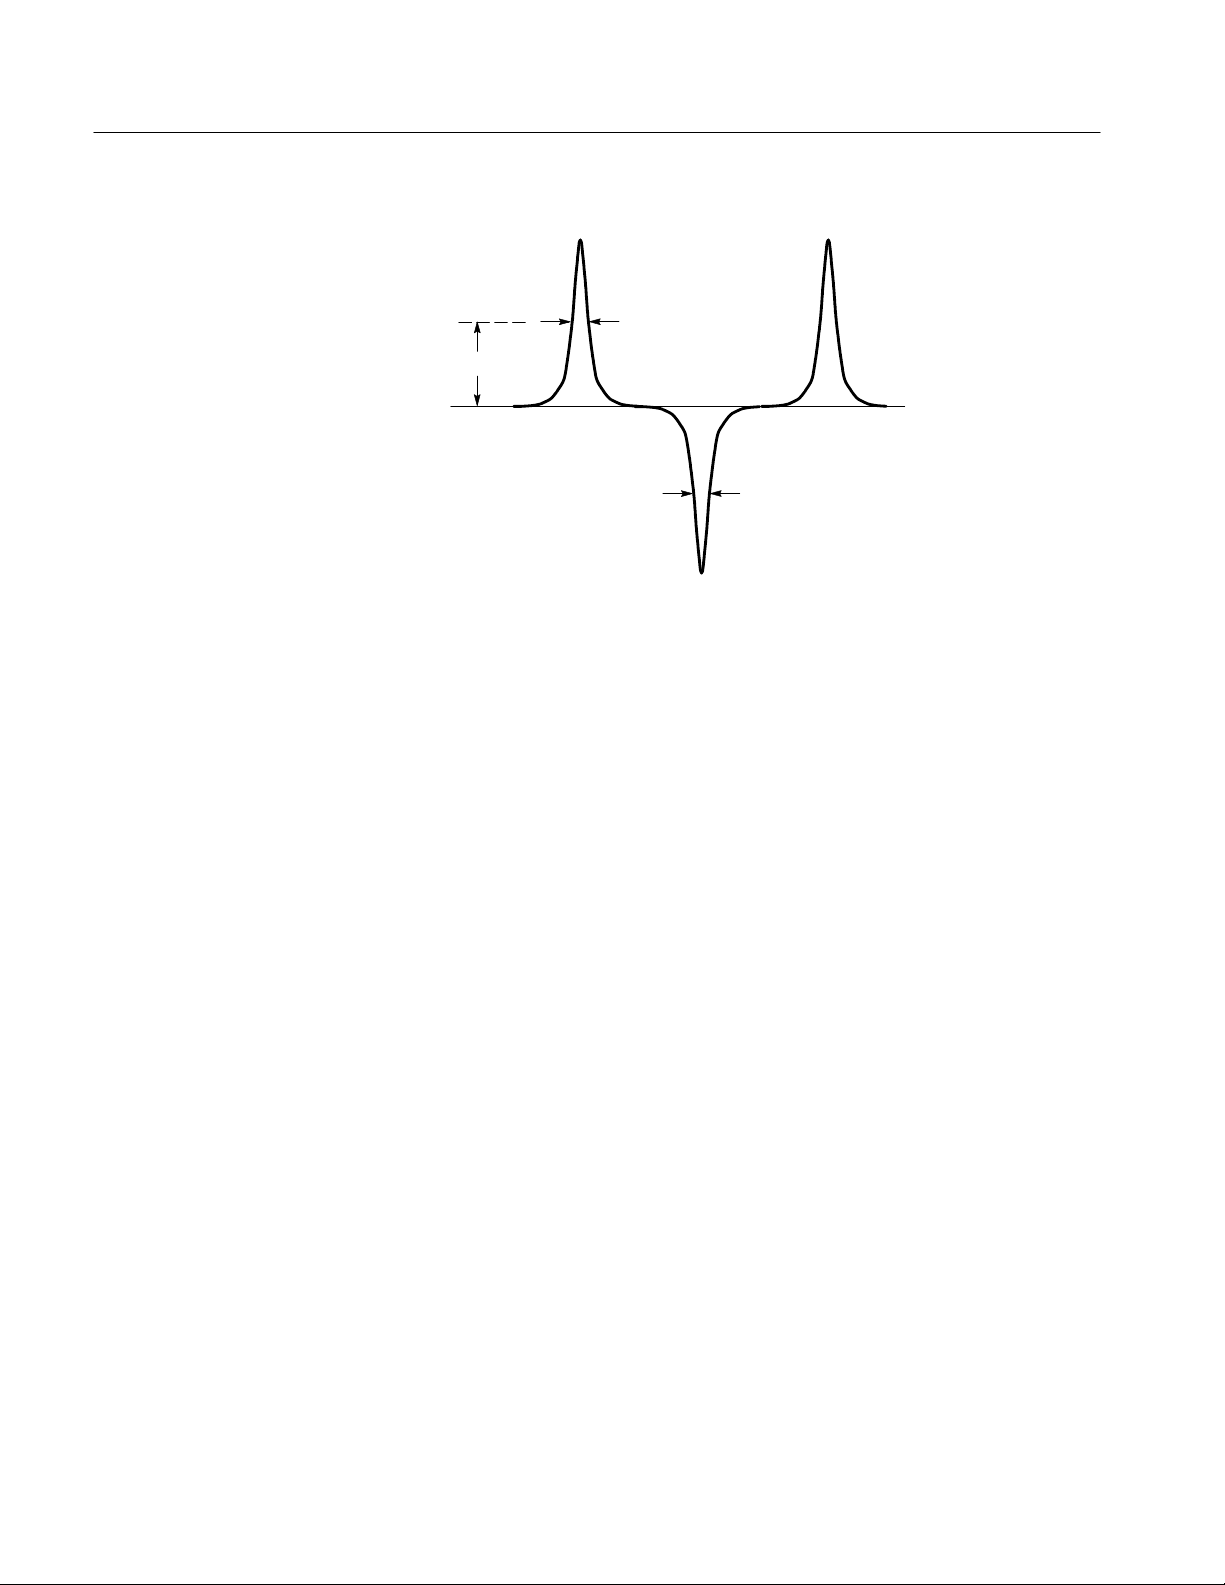
1. Find all of the peak-to-trough pairs in the data area to be measured.
Find the peak by searching from the first crossing of the signal above the
positive hysteresis level to the crossing of the signal below the negative
hysteresis level. (See Figure 3–9.) Keep the maximum value over this range.
Take one sample on either side of the maximum value and average the three
values to obtain the positive peak value. This is done to remove noise bias
which would otherwise occur.
2. Search the range from the negative hysteresis crossing to the next positive
hysteresis crossing; keep the minimum value. Take one sample on either side
of the minimum value and average the three values to obtain the negative
peak value.
3. Average all measured peak-to-peak values. The result is the TAA value.
3–14
TDSDDM1 Disk Drive Measurement Application User Manual
Page 57

Peak
TAA
Figure 3–9: TAA measurement
Measurement Descriptions
Trough
TDSDDM1 Disk Drive Measurement Application User Manual
3–15
Page 58

Measurement Descriptions
Track Average Amplitude (Plus), TAA+
Track Average Amplitude (Minus), TAA–
The track average amplitude (plus), TAA+, is the average positive peak value of
the data on the read channel signal over the specified range of sectors. IDEMA
specifies the duration to be over one complete track revolution.
The track average amplitude (minus), TAA–, is the average negative peak value
of the data on the read channel signal over the specified range of sectors. IDEMA
specifies the duration to be over one complete track revolution.
3–16
Definition
Figure 3–10: TAA– measurement
The track average amplitude positive or negative measurement is defined as
follows:
N–1
TAA "+
1
N
S
i + 0
TDSDDM1 Disk Drive Measurement Application User Manual
(i)
V
p
Page 59
Measurement Descriptions
Where: N is the number of positive or negative pulses
is the peak (positive or negative) voltage
V
p
The application measures enough peak/trough pairs to provide a good statistical
average.
Procedure
Test Methodology
From the Disk Drive Measurement Application menu, follow these steps:
1. Select the TAA+ or TAA– measurement by pressing Measure (main) ➞
TAA+ (side) or TAA– (side).
2. If you want to change trigger settings or localize the measurement, do so
now. The application defaults to the settings specified in the Trigger menu.
For further information, see Setting Up the Application Trigger on page 1–8,
Measuring Over a Range of Sectors on page 3–6, and Cursor Gating on
page 3–7.
3. Press Control (main) ➞ Start (side) to start the measurement.
4. Wait for the measurement to complete, then view the results.
The application performs the measurement according to the same algorithm used
in the TAA measurement, described on page 3–13, with the exception that only
positive pulses are measured for TAA+ and only negative pulses are measured
for TAA–.
Peak
TAA+
TAA
OV
TAA–
Figure 3–11: TAA+ and T AA– measurements
TDSDDM1 Disk Drive Measurement Application User Manual
Trough
3–17
Page 60

Measurement Descriptions
Pulse Width at 50%, PW50
The pulse width at 50% measurement, PW50, is the average pulse width at 50%
of the pulse peak of a group of both positive and negative pulses.
3–18
Definition
Procedure
Figure 3–12: PW50 measurement
PW50 is defined as the pulse width at 50% of the peak value of the pulse. Both
peaks and troughs are measured. The baseline reference for measuring the peak
or trough is zero volts.
From the Disk Drive Measurement Application display, follow these steps:
1. Select the PW50 measurement by pressing Measure (main) ➞ PW50 (side).
(If necessary, press –more– (side) until the PW50 measurement is shown.)
2. If you want to change trigger settings or localize the measurement, do so
now. The application defaults to the settings specified in the Trigger menu.
For further information, see Setting Up the Application Trigger on page 1–8,
Measuring Over a Range of Sectors on page 3–6, and Cursor Gating on
page 3–7.
3. Press Control (main) ➞ Start (side) to start the measurement.
TDSDDM1 Disk Drive Measurement Application User Manual
Page 61

Measurement Descriptions
4. Wait for the measurement to complete, then view the results as shown in
Figure 3–12.
Test Methodology
The application performs the measurement according to the following algorithm:
1. Set the disk drive to the specified speed.
2. Position the head to the desired gap, radius, and skew angle.
3. Precondition the media service. (See the IDEMA standard, document T3-91,
for information about preconditioning the media service.)
4. Write the specified frequency at the specified current for one revolution of
the disk.
5. Measure the peak-to-peak analog amplitude of the Read signal for one entire
revolution, excluding all non-uniform segments, such as write splices, servo
gaps, and header fields.
The hysteresis setting is used when looking for peaks.
6. Compute the track average amplitude around the entire track by summing up
the peak-to-peak voltages of each plus and minus pulse pair. Divide the
result by the number of pulse pairs.
7. Perform the measurement by acquiring one segment at a time, measuring it,
and combining all the results for the final value. To speed up the measurement process the user can specify a smaller region of each track segment to
measure by using the cursors or by decreasing the record length.
This measurement requires the user to specify the number of segments on the
track to be tested.
8. Use a value of 1/2 of the TAA value as the threshold level at which to
measure the pulse width of each positive and negative pulse. Compute the
average pulse width around the track for all pulses measured.
9. Display the measurement result. (The display also reads out the standard
deviation of the measurement for all pairs used.)
The pulse width at 50% measurement, PW50, is the average width of a group of
positive and negative pulses. The pulses making up the tested group are selected
by the following criteria:
H There must be enough pulses around the recording track to provide an
adequate statistical sample.
H The spacing between pulses must minimize any interaction between the
measured pulses.
TDSDDM1 Disk Drive Measurement Application User Manual
3–19
Page 62
Measurement Descriptions
Peak
PW50+
1/2 peak to baseline
Baseline
PW50 –
Trough
Figure 3–13: Parameters for PW50 disk drive measurements
0 V
3–20
TDSDDM1 Disk Drive Measurement Application User Manual
Page 63

50% Pulse Width (Positive), PW50+
50% Pulse Width (Negative), PW50–
The PW50+ measurement is the average pulse width around a track. It is the
width of the pulse at 50% of TAA+. Only positive pulses are measured.
The PW50– measurement is the average pulse width around a track. It is the
width of the pulse at 50% of TAA–. Only negative pulses are measured.
Measurement Descriptions
Figure 3–14: PW50+ measurement
Definition
Test Methodology
TDSDDM1 Disk Drive Measurement Application User Manual
PW50+ is defined as the pulse width at 50% of the peak value of the pulse. Only
peaks are measured. The baseline reference for measuring the peak is zero volts.
PW50– is defined as the pulse width at 50% of the trough value of the pulse.
Only troughs are measured. The baseline reference for measuring the trough is
zero volts.
The application performs the measurement according to the same algorithm used
in the PW50 measurement, described on page 3–18, with the exception that only
positive pulses are measured for PW50+ and only negative pulses are measured
for PW50–.
3–21
Page 64

Measurement Descriptions
Peak
PW50+
1/2 peak to baseline
Baseline
PW50 –
Trough
0 V
Figure 3–15: Parameters for PW50+ and PW50– disk drive measurements
3–22
TDSDDM1 Disk Drive Measurement Application User Manual
Page 65

Nonlinear T ransition Shift, NLTS
The nonlinear transition shift measurement, NLTS, measures three types of
nonlinear transition shift on the media:
H Initial magnetization (DC erased)
H First adjacent transition
H Second adjacent transition
The initial magnetization of the media can affect the position at which transitions
(reverses in magnetization) are recorded. Initial magnetization is characterized by
a delay in a transition, occurring when the new transition reverses the direction
of the previous magnetization.
The second transition in a series of consecutive transitions is called the adjacent
transition, or first adjacent transition. The first adjacent transition is characterized
as follows: when write data requires transitions on consecutive data bits, the
latter transition is shifted earlier in time. In other words, when one transition in a
series occurs, then the following transition occurs earlier than it should.
Measurement Descriptions
All subsequent transitions in the series of consecutive transitions are grouped
into the category called second adjacent transition. Second adjacent transitions
are similar to first adjacent transitions. The difference is that the transitions are
separated by two bit periods, not one.
When nonlinear transition shift can be characterized, its behavior can be
mitigated with write pre-compensation.
TDSDDM1 Disk Drive Measurement Application User Manual
3–23
Page 66

Measurement Descriptions
Definition
Figure 3–16: NLTS measurement
There is no NLTS specification in the IDEMA standard. The NLTS measurement
is based on a time domain cross-correlation method detailed in the IDEMA Test
and Measurement Committee PRML Working Group Working Paper Nonlinear
Distortion Measurement Techniques, September 1995.
NL TS Initial Magnetization. The NLTS initial magnetization measurement assumes
the following sequence:
1. The medium is initially magnetized in one direction (DC-erased)
2. Transitions that are written by a head field in the opposite direction are
e
shifted later by an amount
.
0
The NLTS initial magnetization measurement assumes the following:
V~(t) [ Vǒt–
Where: V
1
e
2
~
(t) is the playback voltage for a readback channel affected by
e
1
0
Ǔ
–
0
2
T
Vǒt–
1
2
e0)
ǒ
M0–
1
Ǔ
Ǔ
T
2
NLTS initial magnetization
3–24
V(t) is the playback voltage in the absence of nonlinear effects
TDSDDM1 Disk Drive Measurement Application User Manual
Page 67

Measurement Descriptions
T is the bit period
e
is the amount of shift
0
is an integer, whose unique value is determined by the
M
0
polynomial used to generate the recorded pseudo-noise bit
sequence
e
The measurement reports the nonlinear effect as a percentage of T; that is,
0
T
NL TS First Adjacent Transition. The NLTS first adjacent transition is the condition
where the location of a transition is shifted earlier by an amount
e
due to
1
another transition one bit interval earlier.
The NLTS first adjacent transition measurement assumes the following:
V~(t) [ Vǒt )
Where: V
1
e
2
~
(t) is the playback voltage for a readback channel affected by
e
1
1
Ǔ
)
2
Vǒt )
T
1
3
1
e
–
TǓ–
1
2
2
1
2
e
1
Vǒt )
T
1
2
e1)
ǒ
M1–
1
Ǔ
Ǔ
T
2
NLTS first adjacent transition
V(t) is the playback voltage in the absence of nonlinear effects
T is the bit period
e
is the amount of shift
1
is an integer, whose unique value is determined by the
M
1
polynomial used to generate the recorded pseudo-noise bit
sequence
e
The measurement reports the nonlinear effect as a percentage of T; that is,
1
T
NL TS Second Adjacent Transition. The NLTS second adjacent transition is similar
to the NLTS first adjacent transition, with the exception that there are two bit
intervals between the transitions. The amount of shift in this case is
e
. The
2
direction of the shift is determined by the direction of the transitions (earlier if
the transitions are opposite, and later if the transitions are in the same direction).
The NLTS second adjacent transition measurement assumes the following:
V~(t) [ V(t) –
1
2
e
2
T
Vǒt–
3
T
2
Where: V
e
1
)
2
2
T
Ǔ
5
Vǒt–
T
2
~
(t) is the playback voltage for a readback channel affected by
e
1
2
Ǔ
)
2
T
NLTS second adjacent transition
TDSDDM1 Disk Drive Measurement Application User Manual
Vǒt )ǒM1–
1
2
Ǔ
TǓ–
e
1
2
Vǒt )ǒM2–
2
T
1
Ǔ
Ǔ
T
2
3–25
Page 68

Measurement Descriptions
V(t) is the playback voltage in the absence of nonlinear effects
T is the bit period
e
is the amount of shift
2
and M2 are integers, whose unique values are determined by
M
1
the polynomial used to generate the recorded pseudo-noise bit
sequence
The measurement reports the nonlinear effect as a percentage of T; that is,
e
2
T
Procedure
For this measurement you must specify the polynomial used to generate a
pseudo-random data pattern which is written to the disk. You are also responsible
for specifying the cycle repeat time of the data pattern within a known tolerance.
From the Disk Drive Measurement Application display, follow these steps:
1. Access the NLTS measurements by pressing Measure (main). (If necessary,
press –more– (side) until the NLTS measurement is shown.)
2. Select one of the NLTS measurements in the side menu. See Figure 3–17.
3–26
Figure 3–17: Selecting an NL TS measurement
TDSDDM1 Disk Drive Measurement Application User Manual
Page 69

Measurement Descriptions
3. Press Pattern Duration (side). Specify a value.
The pattern duration is the length of time of a pseudo-random data pattern
period in the readback signal. The pattern duration can be an estimate, as
long as the estimate is within the tolerance that you specify in step 4; the
application will determine the exact duration of the pattern. (Due to
variations in revolution speed between disk drives, specifying the pattern
duration is necessarily an estimate.)
4. Press Duration Tolerance (side). Specify the tolerance of your pattern
duration estimate (up to 30%). Using a tighter tolerance reduces measurement time.
NOTE. If you know the exact duration of the data pattern, you can reduce the
measurement time to a minimum by specifying a Duration Tolerance of 0%. The
application will use the Pattern Duration that you specify without attempting to
adjust to the actual duration of the data pattern.
5. Press Polynomial Index (side). Use the general purpose knob to specify the
pseudo-random binary sequence polynomial. This should be the same
polynomial used to generate the data pattern written to the media. See
Figure 3–18.
The NLTS measurement is based on autocorrelation and uses a polynomial
to generate a pseudo-noise sequence. Selecting the polynomial using the
general purpose knob is a simple procedure; all selections provide a valid
pseudo-noise sequence. (The application removes invalid polynomials from
the selection set.) The polynomial index value on the scale is a condensed
notation of the selected polynomial, obtainable by making x=2.
TDSDDM1 Disk Drive Measurement Application User Manual
3–27
Page 70

Measurement Descriptions
NLTS polynomial
Figure 3–18: Specifying the NL TS polynomial
6. If you want to change trigger settings or localize the measurement, do so
now. The application defaults to the settings specified in the Trigger menu.
For further information, see Setting Up the Application Trigger on page 1–8,
Measuring Over a Range of Sectors on page 3–6, and Cursor Gating on
page 3–7.
7. Press Control (main) ➞ Start (side) to start the measurement.
8. Wait for the measurement results to display.
3–28
TDSDDM1 Disk Drive Measurement Application User Manual
Page 71

Measurement Descriptions
Measurement
Requirements
Test Methodology
The NLTS measurement has the following requirements:
H The waveform under test must have at least 1000 samples.
H There must be at least eight samples per bit.
H The oscilloscope must capture at least three periods of the pattern. This
depends on the waveform length, the oscilloscope sample rate specified, the
pattern duration specified, and the number of bits per period. The number of
bits per period for a pseudo-noise sequence depends on the polynomial used.
The NLTS measurement algorithm assumes that the acquired signal consists of a
periodic signal and independent additive noise. The noise is assumed to be
responsible for all the nonperiodic behavior of the acquired waveform.
The NLTS measurement is based on a time domain cross-correlation method, as
detailed in the IDEMA Test and Measurement Committee PRML Working
Group Working Paper Nonlinear Distortion Measurement Techniques, Septem-
ber 1995.
The application performs the measurement according to the following algorithm:
1. Acquire three or more cycles of the waveform.
2. The user specifies the polynomial used to generate the waveform, the
approximate duration of one period of the periodic signal captured in the
waveform, and the tolerance of the approximation.
NOTE. The specified polynomial must generate a pseudo-noise (maximum length)
sequence, or the measurement will not proceed.
3. (This step is not performed if the user specifies a Duration Tolerance of 0%.)
Compute the actual cycle time and delay values. NLTS guarantees that the
real cycle time is determined by the measurement if the initial user estimate
for the cycle time is within the specified tolerance (up to 30%) of its real
value.
The NLTS measurement uses several cycles of the waveform to improve the
accuracy of the measurement, averaging over multiple single-waveformcycle NLTS values.
NLTS values for the auto-correlation method are linearly related to the
autocorrelation of the acquired waveform at different time delays.
TDSDDM1 Disk Drive Measurement Application User Manual
3–29
Page 72

Measurement Descriptions
Signal-to-Noise Ratio, SNR
The signal-to-noise ratio measurement, SNR, determines the ratio of the variance
of the readback signal to readback noise. The measured noise consists of media
noise, crosstalk, electronic noise, and other noise types characteristic to disk
drives. Electronic readback noise effects can be mitigated by the averaging
operation performed by the SNR measurement.
3–30
Definition
Figure 3–19: SNR measurement
Signal-to-noise ratio is defined in terms of variances of the signal and noise, and
thus is independent of DC offsets of the readback voltage. The SNR measurement algorithm assumes that the acquired signal consists of a periodic signal and
independent additive noise. The noise is assumed to be responsible for all the
nonperiodic behavior of the acquired waveform. Noise samples are assumed to
be independent and identically distributed. The SNR measurement is defined as
follows:
2
s
s
ǒ
SNR + 10 log
Ǔ
10
2
s
n
TDSDDM1 Disk Drive Measurement Application User Manual
Page 73

Measurement Descriptions
Procedure
Where:
2
is the variance of the noise-free periodic signal
s
s
2
is the variance of the noise
s
n
From the Disk Drive Measurement Application display, follow these steps:
1. Select the SNR measurement by pressing Measure (main) ➞ SNR (side). (If
necessary, press –more– (side) until the SNR measurement is shown.)
2. Press Pattern Duration (side). Specify a value.
The pattern duration is the length of time of the bit data pattern period in the
readback signal. The pattern duration can be an estimate, as long as the
estimate is within the tolerance that you specify in step 3; the application
will determine the exact duration of the pattern. (Due to variations in
revolution speed between disk drives, specifying the pattern duration is
necessarily an estimate.)
Figure 3–20: Specifying the SNR parameters
3. Press Duration Tolerance (side). Specify the tolerance of your pattern
duration estimate (up to 30%). Using a tighter tolerance reduces measurement time.
TDSDDM1 Disk Drive Measurement Application User Manual
3–31
Page 74

Measurement Descriptions
NOTE. If you know the exact duration of the data pattern, you can reduce the
measurement time to a minimum by specifying a Duration Tolerance of 0%. The
application will use the Pattern Duration that you specify without attempting to
adjust to the actual duration of the data pattern.
4. Press Bits per Pattern (side).
Periodic signals used for the SNR measurement are isolated periodic
transitions (low frequency), isolated high-density periodic transitions (high
frequency), or patterned data such as pseudo-random sequences.
H Use two bits per pattern for the low frequency and high frequency
patterns.
H For general patterned data use the number of bits per pattern period,
depending on what was previously recorded on the disk.
H For pseudo-random data of pseudo-noise type generated with shift
registers (pseudo-random binary sequence), the number of bits per
pattern is 2
For example, for a 9th order polynomial the value would be 511 (2
for a 7th order polynomial the value would be 127 (2
L
– 1, where L is the order of the characteristic polynomial.
7
–1).
9
–1);
Measurement
Requirements
5. If you want to change trigger settings or localize the measurement, do so
now. The application defaults to the settings specified in the Trigger menu.
For further information, see Setting Up the Application Trigger on page 1–8,
Measuring Over a Range of Sectors on page 3–6, and Cursor Gating on
page 3–7.
6. Press Control (main) ➞ Start (side) to start the measurement.
7. Wait for the measurement results to display.
The SNR measurement has the following requirements:
H The waveform under test must have at least 1000 samples.
H There must be at least eight samples per bit.
H The oscilloscope must capture at least three periods of the pattern. This
depends on the waveform length, the oscilloscope sample rate specified, the
pattern duration specified, and the number of bits per period.
3–32
TDSDDM1 Disk Drive Measurement Application User Manual
Page 75

Measurement Descriptions
Test Methodology
The application performs the measurement according to the following algorithm:
1. Acquire three or more cycles of the waveform.
2. The user specifies the number of bits in the data pattern and the duration of
the pattern, within a known tolerance.
3. (This step is not performed if the user specifies a Duration Tolerance of 0%.)
Compute the actual cycle time and delay values. SNR guarantees that the
real cycle time is determined by the measurement if the initial user estimate
for the cycle time is within the specified tolerance (up to 30%) of its real
value.
The SNR measurement uses several cycles of the waveform to improve the
accuracy of the measurement, averaging over multiple single-waveformcycle SNR values.
TDSDDM1 Disk Drive Measurement Application User Manual
3–33
Page 76
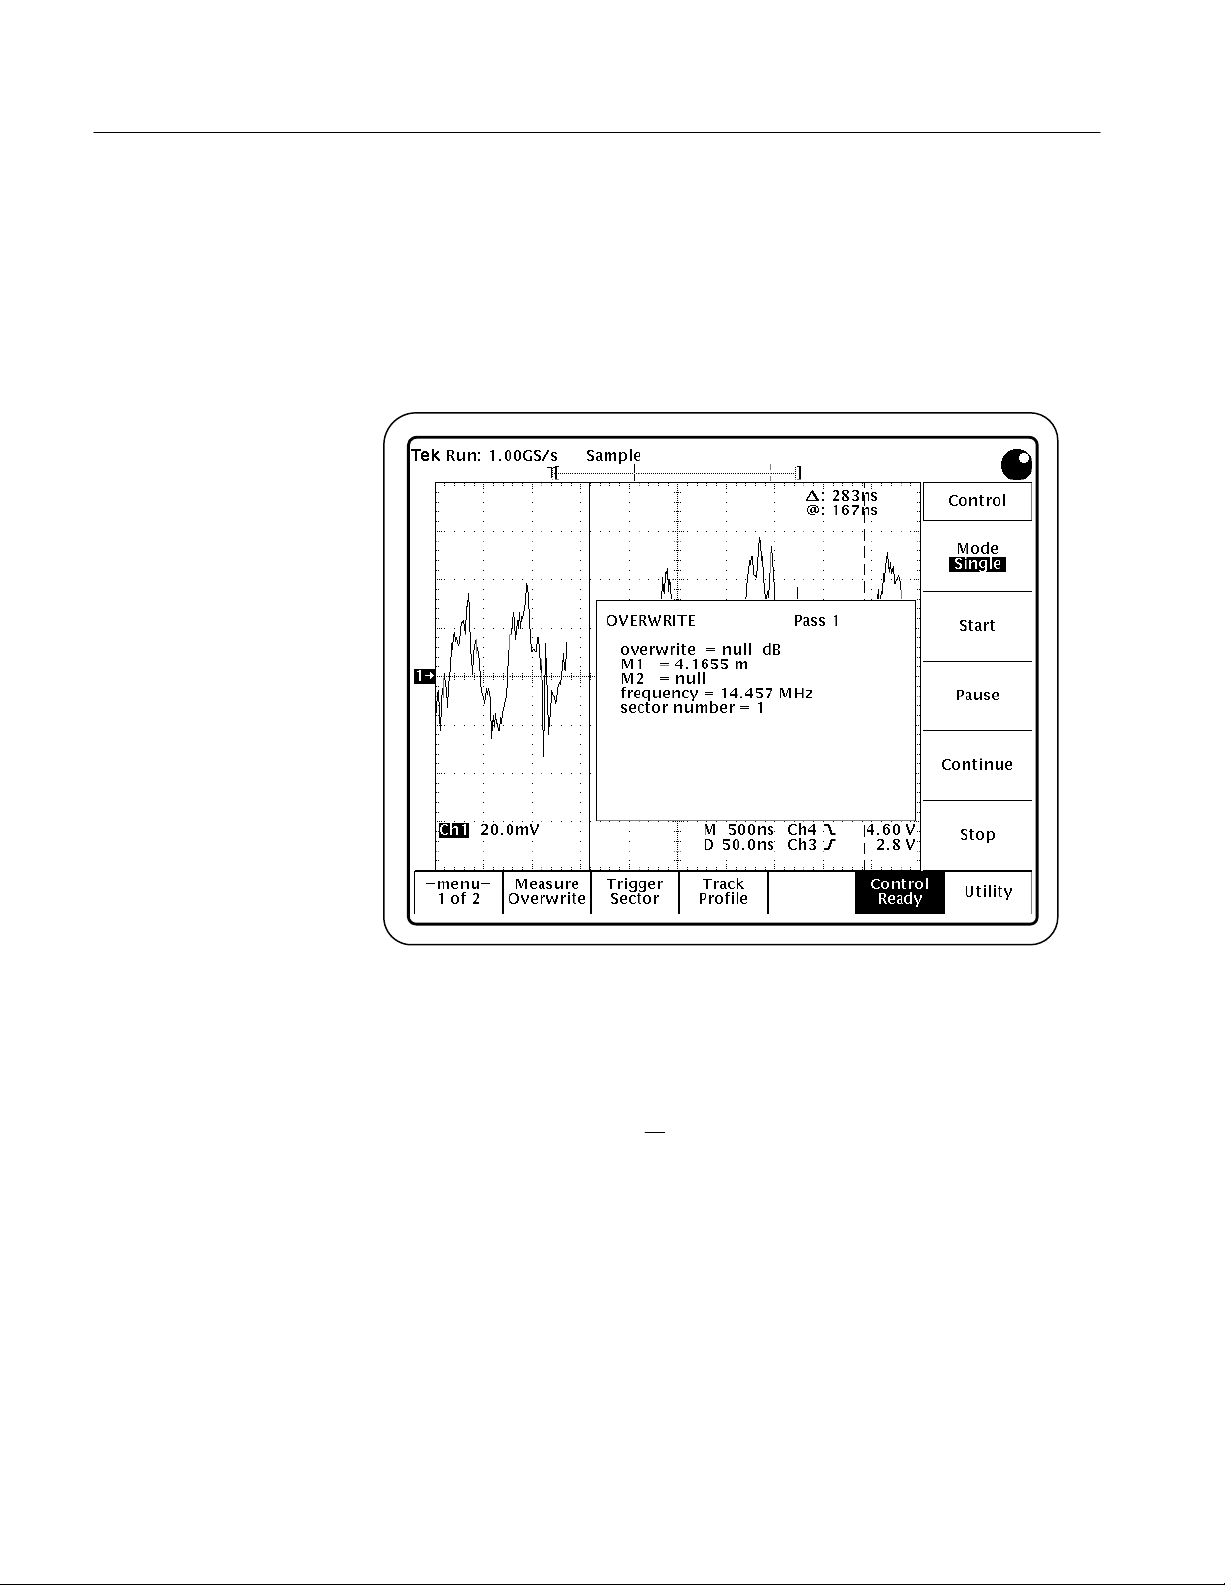
Measurement Descriptions
Overwrite
The overwrite measurement determines the amount of residual signal remaining
from a previous write after new data is written to the same location. The strength
of the residual signal depends on the coercivity of the media, write current
amplitude, and saturation characteristics of the head.
3–34
Definition
Figure 3–21: Overwrite measurement
The Overwrite measurement is defined as follows:
V
r
ǒ
Overwrite(dB)+ 20 log
Where: Vr is the residual RMS amplitude
is the RMS amplitude
V
o
TDSDDM1 Disk Drive Measurement Application User Manual
Ǔ
V
o
Page 77

Measurement Descriptions
Procedure
From the Disk Drive Measurement Application display, follow these steps. Note
that this measurement requires external interaction with a PC.
1. Erase the track using the PC or by using a permanent magnet.
2. Write a low-frequency data pattern of isolated pulses to the track.
3. Select the overwrite measurement by pressing Measure (main) ➞ Overwrite
(side). (If necessary, press –more– (side) until the Overwrite measurement is
shown.)
4. If you want to change trigger settings or localize the measurement, do so
now. The application defaults to the settings specified in the Trigger menu.
For further information, see Setting Up the Application Trigger on page 1–8,
Measuring Over a Range of Sectors on page 3–6, and Cursor Gating on
page 3–7.
5. Press Control (main) ➞ Start (side) to start the measurement.
The application computes the magnitude of the signal and then pauses,
waiting for input.
6. Without erasing the previous data, overwrite the track with the high-frequen-
cy pattern.
Test Methodology
7. Press Continue (side). The application measures the magnitude of the
high-frequency signal.
8. Wait for the measurement results to display.
The application performs the measurement according to the following algorithm:
1. Erase the test track.
2. Write data for one revolution at a low rate f1.
3. Measure the RMS amplitude (V
) through a narrow band filter tuned to f1.
o
4. Overwrite track with data at a high frequency f2.
5. Measure residual RMS amplitude (V
) at f1 again.
r
6. Calculate the results.
7. Display the results.
TDSDDM1 Disk Drive Measurement Application User Manual
3–35
Page 78

Measurement Descriptions
Resolution
The resolution measurement is a ratio of two TAA measurements: a low-frequency pattern to a high-frequency pattern. The result is expressed as a percentage.
From the resolution measurement, you can infer the raw write density of the
disk.
3–36
Definition
Figure 3–22: Resolution measurement
The resolution measurement is the ratio of TAA at two different write frequencies, as follows:
)
TAA(f
Resolution +
TAA(f
2
* 100%
)
1
Where: f1 is the high-frequency TAA measurement
is the low-frequency TAA measurement
f
2
TDSDDM1 Disk Drive Measurement Application User Manual
Page 79

Measurement Descriptions
Procedure
From the Disk Drive Measurement Application display, follow these steps. Note
that this measurement requires external interaction with a PC.
1. Erase the disk using the PC or by using a permanent magnet.
2. Using the PC, write a high-frequency data pattern of isolated pulses to the
disk.
3. Select the resolution measurement by pressing Measure (main) ➞ Resolution
(side). (If necessary, press –more– (side) until the Resolution measurement is
shown.)
4. If you want to change trigger settings or localize the measurement, do so
now. The application defaults to the settings specified in the Trigger menu.
For further information, see Setting Up the Application Trigger on page 1–8,
Measuring Over a Range of Sectors on page 3–6, and Cursor Gating on
page 3–7.
5. Press Control (main) ➞ Start (side) to start the measurement.
The oscilloscope performs a TAA measurement of the high-frequency pattern
over the selected range of sectors and then pauses, waiting for input.
6. Erase the disk track using the PC.
7. Using the PC, write a low-frequency data pattern of isolated pulses to the
disk.
8. Press Continue (side) to resume the measurement.
9. Wait for the measurement results to display.
TDSDDM1 Disk Drive Measurement Application User Manual
3–37
Page 80

Measurement Descriptions
Test Methodology
The application performs the measurement according to the following algorithm:
1. Erase the test track.
2. Write data for one revolution at a high frequency f1.
3. Measure the TAA over the selected range of sectors.
4. Erase the test track.
5. Overwrite the track with data at a low frequency f2.
6. Measure the TAA over the selected range of sectors.
7. Calculate the ratio of the low-frequency TAA to the high-frequency TAA.
8. Display the results.
3–38
TDSDDM1 Disk Drive Measurement Application User Manual
Page 81

Asperity
Measurement Descriptions
The asperity measurement determines whether the head has hit a flaw in the
media surface (a thermal asperity has occurred).
Figure 3–23: Asperity measurement
Definition
Procedure
TDSDDM1 Disk Drive Measurement Application User Manual
When the head hits the surface of the media, a large voltage spike results. The
application identifies these voltage spikes as thermal asperities.
From the Disk Drive Measurement Application display, follow these steps:
1. Select the Asperity measurement by pressing Measure (main) ➞ Asperity
(side). (If necessary, press –more– (side) until the Asperity measurement is
shown.)
2. Specify the Threshold by pressing Threshold (side), and then selecting a
value. The Threshold value specifies how large the positive peak signal must
be before it is considered an asperity. The Threshold is expressed as a
voltage.
The recommended initial setting is at least twice the peak value of the signal.
If the signal crosses this level, it is counted as an asperity. No additional
asperities are counted until the signal crosses zero volts again.
3–39
Page 82

Measurement Descriptions
3. If you want to change trigger settings or localize the measurement, do so
now. The application defaults to the settings specified in the Trigger menu.
For further information, see Setting Up the Application Trigger on page 1–8,
Measuring Over a Range of Sectors on page 3–6, and Cursor Gating on
page 3–7.
4. Press Control (main) ➞ Start (side) to start the measurement.
5. Wait for the measurement to complete, then view the results as shown in
Figure 3–12.
Test Methodology
The application performs the measurement according to the following algorithm:
1. The user enters a threshold value to specify what is considered an asperity.
2. Begin testing for asperities, checking each peak/trough pair against the
specified threshold. If the TAA for a peak/trough pair exceeds the threshold,
report an asperity.
3. Display the results: the sector number where the asperity occurred and the
time relative to the start of the acquired data record.
NOTE. If the Fit to Screen function is enabled, then the time readout for the
asperity is measured from the left side of the screen to the asperity position.
The application enters each asperity into a queue for display. Up to ten
asperities are listed; if more than ten asperities are displayed, the list scrolls
to display the latest asperities.
3–40
TDSDDM1 Disk Drive Measurement Application User Manual
Page 83

Snapshot Measurements
To see the summary measurements available for TAA, PW50, or NLTS, use the
snapshot version of these measurements. Figure 3–24 shows snapshot measurement data for two different measurements.
Select snapshot measurements in the same way you select regular measurements.
Measurement Descriptions
Figure 3–24: Snapshot measurement data
Snapshot Measurement Definitions
The following measurements are used in snapshots.
Vertical Asymmetry
(Vert asym)
The vertical asymmetry measurement uses TAA values to compare the symmetry
of the positive and negative pulses.
The vertical asymmetry is measured for each sector, and then the values are
averaged to provide a single vertical asymmetry value. The vertical asymmetry
value has no units and can range from –1.0 to 1.0. Interpret the values as
follows:
0.0 indicates that TAA+ = TAA–
1.0 indicates that TAA– = 0.0 (no negative pulses)
–1.0 indicates that TAA+ = 0.0 (no positive pulses)
The vertical asymmetry measurement is not available as an individual measurement. It is available only in the TAA snapshot display.
TDSDDM1 Disk Drive Measurement Application User Manual
3–41
Page 84

Measurement Descriptions
The vertical asymmetry measurement is defined as follows:
TAA))TAA–
Vert asym +
Where: TAA is the TAA measurement for a given sector, as
ǒ
defined on page 3–13
TAA+ is the TAA+ measurement for a given sector, as
defined on page 3–16
TAA– is the TAA– measurement for a given sector, as
defined on page 3–16
TAA
Ǔ
Timing Asymmetry, A
The timing asymmetry measurement, A, measures the ability of the head/media
combination to process positive and negative transitions identically.
The timing asymmetry measurement is not available as an individual measurement. It is available only in the TAA and PW50 snapshot displays and is not
available over the GPIB bus.
The timing asymmetry measurement is based on timing between pulse peaks,
calculated as follows:
1
ȍ
A +
4N
(
i + 1...N
Where: i indexes negative pulses
These measurements operate as other measurements in the sense that a range of
sectors is defined and the measurement average and standard deviation calculated. The range of the measurement within each sector is determined by the
cursors.
(
T1–T
|
)
N is the number of measured time intervals
is the time from the prior positive pulse to the current pulse
T
1
T
is the time from the current pulse to the next positive pulse
2
)
|
2
3–42
A constant frequency sequence is written onto a track.
TDSDDM1 Disk Drive Measurement Application User Manual
Page 85

Measurement Descriptions
Time Peak-to-Trough
(Time PT) and
Time Trough-to-Peak
(Time TP)
The time peak-to-trough (Time PT) is the time from a positive peak to the next
negative peak (trough). The time trough-to-peak (Time TP) is the time from a
trough to the next positive peak.
These measurements are available only as part of the Snapshot measurements.
Peak
Time PT
Trough
Time TP
Figure 3–25: Time PT and Time TP measurements
TDSDDM1 Disk Drive Measurement Application User Manual
3–43
Page 86

Measurement Descriptions
3–44
TDSDDM1 Disk Drive Measurement Application User Manual
Page 87

Track Profiles
Track profiles are reference memory waveforms that contain measurement results
from each track sector. The results are distributed over a 500 point record. You
can use track profiles to observe sector-to-sector variations in measurements and
to identify the location of flaws within a track. Using this feature you can better
observe characteristics of measurement variations around a track which may be
due to causes such as head height variations or surface media defects.
The resulting track profile then represents the value of the measurement as a
function of sector number over a range of sectors which can be specified in the
Trigger menu. (The Trigger Mode must be set to Sector to enable the sector
readout.)
Figure 3–26: Track profile waveform
TDSDDM1 Disk Drive Measurement Application User Manual
3–45
Page 88

Track Profiles
Using Track Profiles
From the Disk Drive Measurement Application display, perform these steps:
1. Press Track Profile (main) ➞ Off/On (side). Select ON. See Figure 3–27.
2. Select a reference memory to use as the track profile by pressing Track
Profile To (side). The application turns on the selected Ref waveform so it
becomes visible on the screen.
NOTE. The application uses the oscilloscope general purpose reference memories
to store track profiles.
3. Start the measurement, as you normally would. The measurement values are
now stored as a track profile in the reference memory.
To clear the track profile reference memory, press Track Profile (main) ➞ Reset
Profile (side).
You can view ongoing track profile results by setting the Control Mode to Free
Run. (Press Control (main) ➞ Mode (side). Select Free Run.) When the track
profile reference memory reaches its 500-point capacity, the application
continues to acquire data and the track profile scrolls across the screen as new
points are added and old points are deleted. See Figure 3–28 on page 3–48 for an
example of a track profile waveform during Free Run mode.
3–46
TDSDDM1 Disk Drive Measurement Application User Manual
Page 89

Track Profiles
Displaying Reference
Waveform Values
Figure 3–27: Specifying the track profile parameters
You can display a readout of the measurement at a given point on the track
profile waveform as follows:
1. Press Track Profile (main).
2. Select the track profile waveform (the reference waveform) by pressing
MATH, REF. (You must specify the reference waveform used for the track
profile so that the associated cursor displays, or you cannot view the track
profile cursor values.)
3. Move the cursor to the desired location on the track profile waveform.
The Value at Cursor is always expressed in volts, regardless of other measure-
ment settings.
The cursor readout values in the side menu are available only with current track
profile waveforms; they are not available with waveforms that are later recalled
from memory. In addition, the cursor readout values in the side menu are deleted
when you do the following:
H Change the measurement type in the Measure menu
H Press Reset Profile
TDSDDM1 Disk Drive Measurement Application User Manual
3–47
Page 90

Track Profiles
About the Track Profile Reference Memory
At the beginning of the measurement, the reference memory is filled with null
values. (Figure 3–28 shows a track profile waveform as the data is being stored.
The right portion of the waveform represents the memory which has not yet been
filled.) At the end of each track measurement the value for that measurement is
stored in the reference memory and a display cycle is activated. This causes the
reference memory waveform to sweep across the screen as the measurement
progresses around the track. You then have a clear indication of the progress of
the entire measurement over the specified range of sectors.
Values are stored in the reference memory as one point per measurement result,
up to a maximum of 500 points. If more than 500 points/measurements are
taken, the oldest results are discarded. Any unused points at the end of the
reference memory record are set to null values.
The measurements are stored in reference memory as 16-bit integers. A scale
factor or units are associated with the C-waveform header. This is accessible so
that the application can scale the measurements into the reference waveform. (As
long as the reference waveform has the scale factors in the waveform header set
up correctly, then when a cursor is attached to the reference waveform it will
read out the correct value for the measurement.)
3–48
Figure 3–28: Track profile reference memory
TDSDDM1 Disk Drive Measurement Application User Manual
Page 91

Appendices
Page 92

Page 93

Appendix A: Specifications
Table A–1 lists the measurements provided by the TDSDDM1 Disk Drive
Measurement Application.
T able A–1: TDSDDM1 Disk Drive Measurement Application measurements
Measurement name
Track Average Amplitude TAA Measures the average peak-to-peak value of the
Abbreviation
Description
data on the Read signal.
Track Average Amplitude
Plus
Track Average Amplitude
Minus
Pulse Width at 50% PW50 Measures the average pulse width of the Read
Pulse Width at 50% Plus PW50+ Measures the average positive pulse width of
Pulse Width at 50% Minus PW50– Measures the average negative pulse width of
Nonlinear Transition Shift
Initial Magnetization
Nonlinear Transition Shift 1st
Adjacent
Nonlinear Transition Shift
2nd Adjacent
Signal-to-Noise Ratio SNR Measures the signal-to-noise ratio of the
Overwrite Measures the amount of residual signal
Resolution Measures the ratio of two TAA measurements,
TAA+ Measures the average positive peak value of
the data on the Read signal.
TAA– Measures the average negative peak (trough)
value of the data on the Read signal.
signal.
the Read signal.
the Read signal.
NL TS Initial
Mag
NL TS 1st Adjacent
NL TS 2nd
Adjacent
Measures non-linear transition shift due to initial
DC erasure.
Measures non-linear transition shift due to
adjacent transitions spaced 1 bit apart.
Measures non-linear transition shift due to
adjacent transitions spaced 2 bits apart.
readback signal to readback noise.
remaining from a previous write operation after
new data is written to the same location.
performed at two different write frequencies.
Asperity Locates thermal asperities on the media
TDSDDM1 Disk Drive Measurement Application User Manual
surface.
A–1
Page 94

Appendix A: Specifications
A–2
TDSDDM1 Disk Drive Measurement Application User Manual
Page 95

Index
Page 96

Page 97

Index
A
Accessories, 1–2
Application
Leaving, 2–3
Starting, 2–1
Updates, 1–2
Downloading, 1–4
Asperity , 3–39
C
Changing settings during a measurement, 2–6
Channel assignments, 1–5, 1–11
CLEAR MENU button, 2–6
Configuration, 1–7
Contacting T ektronix, viii
Continue and Pause, 2–5
Control menu, 2–5, 3–2
Conventions, vii
Cursor gating, 3–7
Cursor Gating menu, 3–2
D
Disk drive connection, 1–4
diskdrv .ini file, 3–5
Display readout, Turning off, 2–6
H
Help, online, 2–6
Hysteresis menu, 1–9, 3–2
I
IDEMA Disk Drive Standard, vii, 3–11
Index trigger mode, 1–8, 1–11
Input Channels menu, 1–11, 3–2
Installation
Application, 1–3
Disk drive connection, 1–4
Primary setup, 1–5
Secondary setup, 1–6
Run-time environment, 1–3
L
Leaving the application, 2–3
Limit Test
Measurement example, 2–8
Menu, 3–2, 3–9
Localizing a measurement, 3–6, 3–7, 3–9
Lower and upper limits, 3–9
M
E
Examples, 2–7
Exiting the application, 2–3
Example, 2–11
F
Firmware requirements, 1–1
Free Run acquisition mode, 2–5, 3–12
G
Gated cursor measurements, 3–7
GPIB, 1–6
GPIB commands, 2–6
TDSDDM1 Disk Drive Measurement Application User Manual
Measure menu, 2–4, 3–1
Measurement
Asperity , 3–39
Descriptions, 3–11
Examples, 2–7
Localizing, 3–6, 3–7, 3–9
NLTS, 3–23
Over a range of sectors, 3–6
Overwrite, 3–34
PW50, 3–18
PW50+ and PW50–, 3–21
Resolution, 3–36
Snapshot, 3–11, 3–41
SNR, 3–30
Standard, 3–11, 3–12
Starting, 2–4
TAA, 3–13
TAA+ and TAA–, 3–16
Index–1
Page 98

Index
Time peak-to-trough and time trough-to-peak, 3–43
Timing asymmetry, 3–42
Track profile, 3–11
Turning off display, 2–6
Vertical asymmetry, 3–41
Memory
Reference memory, 3–46, 3–48
Requirements, 1–1
Menu
Control, 2–5, 3–2
Cursor Gating, 3–2
Hysteresis, 1–9, 3–2
Input Channel, 1–11
Input Channels, 3–2
Limit Test, 3–2, 3–9
Measure, 3–1
Operation, 2–1
Overview , 3–1
Structure, 3–3
Track Profile, 3–2, 3–46
Trigger, 1–8, 3–2
Utility, 3–2
Messages, W arning, 3–12
N
NLTS, 3–23
O
Online help, 2–6
Oscilloscope compatibility, 1–1
Overwrite, 3–34
Q
Quitting the application, 2–3
R
Range of sectors, 3–6
Read Gate trigger mode, 1–8, 1–11
Readout, Turning off, 2–6
Recalling a setup, Example, 2–12
Recalling and saving setups, 3–5
Requirements, Run-time environment installation, 1–3
Resolution, 3–36
S
Saving a setup, Example, 2–11
Saving and recalling setups, 3–5
Sector trigger mode, 1–8, 1–11, 3–6
Serial number requirements, 1–1
Setup
GPIB, 1–6
Primary, 1–5
Saving and recalling, 3–5
Secondary , 1–6
Trigger, 1–5
Setup parameters, 3–5
Single acquisition mode, 2–5
Snapshot measurements, 3–11, 3–41
SNR, 3–30
Specifications, A–1
Standard measurements, 3–11, 3–12
Starting the application, 2–1
Starting the measurement, 2–4
P
Pass/Fail results, 3–9
Pause and Continue, 2–5
Preamble duration, 1–9, 3–9
Probes, recommended, 1–4
Product
Compatibility, 1–1
Description, 1–1
Requirements, 1–2
Restrictions, 1–2
Updates, 1–2
PW50, 3–18
Measurement example, 2–8
PW50+ and PW50–, 3–21
Index–2
T
TAA, 3–13
Measurement example, 2–7
TAA+ and TAA–, 3–16
T echnical support, viii
T ektronix, contacting, viii
T erms, vii
Thermal asperity, 3–39
Time peak-to-trough and time trough-to-peak, 3–43
Timing asymmetry, 3–42
Track, Setup issues, 1–5
Track profile, Measurement example, 2–10
Track profile measurements, 3–1 1, 3–45
TDSDDM1 Disk Drive Measurement Application User Manual
Page 99

Index
Track Profile menu, 3–2, 3–46
Trigger menu, 1–8, 3–2
Trigger mode, 1–8
Trigger setup
Application, 1–8
Oscilloscope, 1–7
Trigger menu, 1–8
Tutorial, 2–7
U
Upper and lower limits, 3–9
User trigger mode, 1–8
Utility menu, 3–2
V
Vertical asymmetry, 3–41
Viewing obscured parts of the waveform, 2–6
W
Warning messages, 3–12
Waveform, Viewing obscured portions, 2–6
Web site, 1–2
TDSDDM1 Disk Drive Measurement Application User Manual
Index–3
Page 100

Index
Index–4
TDSDDM1 Disk Drive Measurement Application User Manual
 Loading...