

Page 1

User Manual
TDS3AAM
Advanced Analysis
Application Module
071-0946-01
*P071094601*
071094601
Page 2

Copyright E Tektronix. All rights reserved. Licensed software
products are owned by Tektronix or its subsidiaries or suppliers,
and are protected by national copyright laws and international
treaty provisions.
Tektronix products are covered by U.S. and foreign patents,
issued and pending. Information in this publication supercedes
that in all previously published material. Specifications and
price change privileges reserved.
TEKTRONIX, TEK, TEKPROBE, and TekSecure are registered
trademarks of Tektronix, Inc.
DPX, WaveAlert, and e*Scope are trademarks of
Tektronix, Inc.
Contacting Tektronix
Tektronix, Inc.
14200 SW Karl Braun Drive
P.O. Box 500
Beaverton, OR 97077
USA
For product information, sales, service, and technical support:
H In North America, call 1-800-833-9200.
H Worldwide, visit www.tektronix.com to find contacts in
your area.
Page 3

Contents
Safety Summary 2.............................
TDS3AAM Overview 5..........................
Installing the TDS3AAM Application Module 6........
Accessing Advanced Analysis Menus 6............
Measurement Functions 8.......................
DPO Math Functions 12.........................
Advanced Math Functions 14.....................
XY Cursors 21................................
1
Page 4

Safety Summary
To avoid potential hazards, use this product only as
specified. While using this product, you may need to
access other parts of the system. Read the General Safety
Summary in other system manuals for warnings and
cautions related to operating the system.
Preventing Electrostatic Damage
CAUTION. Electrostatic discharge (ESD) can
damage components in the oscilloscope and its
accessories. To prevent ESD, observe these
precautions when directed to do so.
Use a Ground Strap. Wear a grounded antistatic wrist strap
to discharge the static voltage from your body while
installing or removing sensitive components.
UseaSafeWorkArea.Do not use any devices capable of
generating or holding a static charge in the work area
where you install or remove sensitive components.
Avoid handling sensitive components in areas that have a
floor or benchtop surface capable of generating a static
charge.
2
Page 5
Handle Components Carefully. Do not slide sensitive
components over any surface. Do not touch exposed
connector pins. Handle sensitive components as little as
possible.
Transport and Store Carefully. Transport and store sensitive
components in a static-protected bag or container.
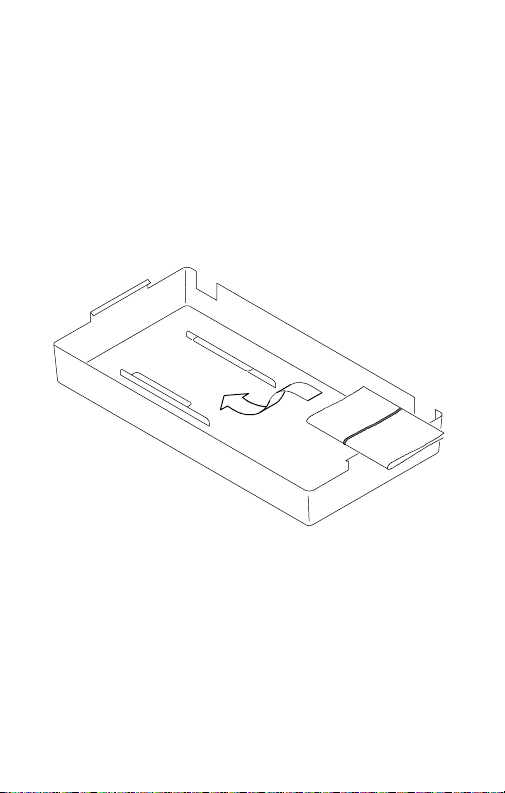
Manual Storage
The oscilloscope front cover has a convenient place to
store this manual.
3
Page 6

4
Page 7

TDS3AAM Overview
This section provides an overview of the TDS3AAM
Advanced Analysis application module features and
describes how to access the advanced analysis functions.
Y ou can do the following analysis tasks with the
TDS3AAM application module:
H DPO Math.
H Arbitrary math expressions. Allow you to create
waveforms using math operations on active and
reference waveforms, waveform measurements, up to
2 user-definable variables, and arithmetic expressions.
H Waveform area and cycle area measurements.
H Measurement statistics. Adds min/max or
mean/standard deviation readouts to displayed
measurements.
H XY waveform cursors.
5
Page 8

Installing the TDS3AAM Application Module
Refer to the TDS3000, TDS3000B, and TDS3000C
Series Application Module Installation manual for
instructions on installing and testing the application
module.
Accessing Advanced Analysis Menus
The TDS3AAM Advanced Analysis module adds Area,
Cycle Area, and statistical measurement functions to the
Measure menu, and DPO math and Advanced Math
functions to the Math menu, and XY cursors to the
Cursor menu. To access the Advanced Analysis functions, use the following table:
Accessing TDS3AAM Functions
Function
Area,
Cycle Area
measurement
Measurement
Statistics
Push
front
panel
button
MEASURE Select
MEASURE Statistics To select Min/Max or
Push
bottom
menu
button
Measrmnt
Push side menu
button
--More-- button until
you display Area and
Cycle Area buttons.
See page 8.
Mean/Standard Deviation. See page 9.
6
Page 9

Accessing TDS3AAM Functions (cont.)
Push
bottom
menu
button
Push side menu
button
Function
Push
front
panel
button
DPO Math MATH DPO Math To select waveform
sources and operator.
See page 12.
Math
waveform
expressions
MATH Advanced
Math
To create a math expression, define a
variable value, define
units, and display the
math expression. See
page 14.
XY Cursors CURSOR Function To select Waveform
XY cursor (you must
be in XY display mode
to see this menu). See
page 21.
7
Page 10

Measurement Functions
The TDS3AAM application module adds Area and
Cycle Area measurements to the Select Measurement
side menu list, and adds a Statistics bottom button to the
Measurement menu. To access these measurement menu
items, push the MEASURE front-panel button.
Area and Cycle Area Measurements
Bottom
Select
Measurmnt
Side Description
Area Voltage over time measurement.
The arithmetic area over the entire
waveform or gated region, measured in vertical unit-seconds (for
example, volt-seconds or amp-seconds).
Cycle Area Voltage over time measurement.
The arithmetic area over the first
cycle in the waveform, or the first
cycle in the gated region, measured in vertical-unit-seconds (for
example, volt-seconds or amp-seconds).
8
Page 11

Area and Cycle Area Measurements (cont.)
Bottom DescriptionSide
Statistics
OFF Disables displaying statistical
Min/Max Displays minimum and maximum
Mean/
Standard
Deviation
n
information with active measurements.
readouts for each active measurement readout.
Displays Mean and Standard
Deviation readouts for each active
measurement readout.
n is the number of measurement
values used to calculate the mean
and standard deviation values, and
ranges from 2 to 1000. Use the
general purpose knob to change
the value in increments of 1 (fine)
or 10 (coarse). The default value is
32.
Waveform Polarity. For area calculation, the waveform
area above ground is positive; the waveform area below
ground is negative.
9
Page 12

Waveform Clipping. For best results, make sure that all
End
EndCycl
e
input waveforms do not extend beyond the top or
bottom graticules of the display (referred to as clipping
the waveform). Using clipped waveforms with measurement or math functions can result in incorrect values.
Area. The following equation shows the algorithm for
calculating the waveform area for the entire record or
gated region.
If Start = End then return the (interpolated) value at
Start. Otherwise,
ጺ
Area=
Cycle Area. The following equation shows the algorithm
for calculating the waveform area for a single cycle in
the record or gated region.
If StartCycle = EndCycle then return the (interpolated)
value at StartCycle. Otherwise,
Waveform(t)dt
Start
CycleArea=
10
ጺ
StartCycle
Waveform(t)dt
Page 13

Min/Max. Min/Max displays a minimum and maximum
measurement readout directly below each active measurement. The following is an example of a Min/Max
readout.
Ch1 Freq
15.98 MHz
Min: 15.81MHz
Max: 16.17MHz
Mean/Standard Deviation. Mean/Standard Deviation
displays a mean () and standard deviation (σ) readout
directly below each active measurement. The mean and
standard deviation values are running calculations,
which means that the current calculation incorporates the
results of previous calculations. The following is an
example of a Mean/Standard Deviation readout.
Ch1 Freq
15.98 MHz
: 15.99MHz
σ: 82.92kHz
Screen Readouts. The Min/Max and Mean/Standard
Deviation readouts display directly below the waveform
measurements, in an area normally used for measurement qualifier text (such as “Low resolution”). If you
suspect the measurement, turn off statistics to see if the
oscilloscope displays any qualifier text.
11
Page 14

DPO Math Functions
The TDS3AAM application module adds the ability to
perform dual waveform math on DPO waveforms. The
resulting DPO math waveform contains intensity or gray
scale information that, like an analog oscilloscope,
increases waveform intensity where the signal trace
occurs most often. This gives you more information
about signal behavior. To access the DPO math menu,
push the MATH front-panel button, and then push the
DPO Math bottom button.
DPO Math Menu
Bottom
DPO Math
Intensity. Use the WAVEFORM INTENSITY front-panel
knob to control the overall waveform intensity as well as
how long the waveform data persists on the screen.
Side Description
Set 1st SourcetoSelects the first source wave-
Set OperatortoSelects the math operator:
form.
+, -- ,orX
Set 2nd
Source to
Selects the second source
waveform.
12
Page 15

Acquisition Modes. Changes to the acquisition mode
globally affect all input channel sources except for DPO
math, thereby modifying any math waveforms using
them. For example, with the acquisition mode set to
Envelope, a Ch1 + Ch2 math waveform will receive
enveloped channel 1 and channel 2 data, which results in
an enveloped math waveform.
Clearing Data. Clearing the data in a waveform source
causes a null waveform to be delivered to any math
waveform that includes that source, until the source
receives new data.
13
Page 16

Advanced Math Functions
The TDS3AAM application module lets you create a
custom math waveform expression that can incorporate
active and reference waveforms, measurements, and/or
numeric constants. To access the Advanced Math menu,
push the MATH front-panel button, and then push the
Advanced Math bottom button.
Advanced Math Menu
Bottom
Advanced
Math
Side Description
Edit
Expression
VAR1, VAR2
n.nnnn
Enn
Define Units Displays a screen in which you
Displays a screen in which you
can create or edit the expression that defines the math
waveform. See page 15.
Assigns numeric values to two
variables. You can use these
variables as part of an expression. Push the side menu button
to select between the base
(n.nnn) and the exponent (nn)
field. Use the general purpose
knob to enter values.
can enter user-defined unit
labels. These labels replace the
unknown “?” readout value.
14
Page 17

Advanced Math Menu (cont.)
Bottom DescriptionSide
Advanced
Math (cont.)
Display
Expression
Displays the current advanced
math expression on the graticule.
Edit Expression Screen. The Edit Expression screen lets
you create arbitrary math expressions. Refer to page 16
for a description of the Edit Expression controls.
Expression
cursor
Expression
field
Expression
list
15
Page 18

Edit Expression Screen
Menu item
Expression
cursor
Expression
field
Expression list The list of available elements. Use the general
Description
Location in expression field where the next
expression element is entered.
Area that displays the entered expression
elements, up to a maximum of 127 characters.
purpose knob to select an element. You can
only select elements that are syntactically
correct for the current math expression.
Non-selectable elements are grayed out. Refer
to page 17 for more expression element
information.
Edit Expression Controls. The Edit Expression screen
provides controls and menu items to create math expressions. The following table describes the Edit Expression
controls.
Edit Expression Controls
Control
General purpose knob
Enter Selection button
Description
Selects (highlights) an element in the expression list.
Adds the selected element to the expression
field. You can also use the front panel SELECT
button.
16
Page 19

Edit Expression Controls (cont.)
Control Description
Back Space
button
Clear button Clears (erases) the entire expression field.
OK Accept
button
MENU OFF
button
Erases the last-entered element from the
expression field.
Closes the Edit Expression screen and
displays the math expression waveform.
Closes the Edit Expression screen and returns
to the previous menu without changing the
math expression.
Expression List. The following gives more information on
the expression list items.
Expression List
Menu item
Ch1-Ch4
Ref1-Ref4
FFT(, Intg(,
Diff(
Description
Specifies a waveform data source.
Executes a Fast Fourier Transform, integration, or differentiation operation on the
expression that follows. The FFT operator
must be the first (left-most) operator in an
expression. All these operations must end with
a right parenthesis.
17
Page 20

Expression List (cont.)
Menu item Description
Period(
CycleArea(
Var1, Var2 Adds the user-defined variable to the expres-
+, --, ¢, Executes an addition, subtraction, multiplica-
(), Parentheses provide a way to control
1-0, ., E Specifies a numeric value in (optional)
Executes the selected measurement operation
on the waveform (active or reference) that
follows. All these operations must end with a
right parenthesis.
sion.
tion, or division operation on the following
expression. + and -- are also unary; use -- to
negate the expression that follows.
evaluation order in an expression. The comma
is used to separate the “from” and “to”
waveforms in Delay and Phase measurement
operations.
scientific notation.
User-Defined Variables. This feature lets you define two
variables, such as math constants, that you can then use
as part of a math expression. The side menu button
toggles between selecting the numeric field and selecting
the scientific notation field (E). Use the general purpose
knob to enter values in either field. Push the COARSE
front panel button to quickly enter larger numbers in the
numeric field.
18
Page 21

Edit Math Units Controls. The Edit Math Units screen
provides controls and menu items to create custom units
for math waveforms. Whenever the oscilloscope cannot
determine the horizontal or vertical units for a measurement, it displays the undefined unit character (?). The
user-defined units function replaces the undefined
horizontal or vertical unit character with the user-defined
vertical or horizontal unit for math waveforms only.
The following table describes the Edit Math Units
controls.
Edit Math Units Controls
Control
General purpose knob
Up Arrow,
Down Arrow
OK Accept
button
Enter Character button
Left Arrow,
Right Arrow
Description
Selects (highlights) a character in the label list.
Selects the Vertical or Horizontal label in the
unit label field.
Closes the Edit Math Units screen and
displays the math menu.
Adds the selected character at the cursor
position in the unit field.
Moves the unit label field cursor to the left or
right.
19
Page 22

Edit Math Units Controls (cont.)
Control Description
Back Space
button
Delete button Deletes the character at the cursor position in
Clear button Clears (erases) all characters in the current
MENU OFF
button
Erases the character to the left of the cursor
position.
the unit label field.
unit field (Horizontal or Vertical).
Closes the Edit Math Units screen and returns
to the previous menu without applying the
user-defined units.
Math Expression Example.
The following expression calculates the energy in a
waveform, where Ch1 is in volts and Ch2 is in amps:
Intg (Ch1×Ch2)
Taking an Area measurement on the resulting waveform
displays the waveform power value.
20
Page 23

XY Cursors
The TDS3AAM application module adds XY and XYZ
waveform measurement cursors. These cursor functions
are part of the Cursor menu. You must display an XY
waveform (DISPLAY > XY Display > Triggered XY
(or Gated XYZ)) in order to access the XY cursor menu
items.
The following figure shows XY cursors in Waveform
mode with polar readouts.
21
Page 24

XY Cursor Menu
Functio
n
LECT
SELECTbuttontoselectwhich
Mod
e
Bottom
Function
Mode
Readout
Side Description
Off Turns XY cursors off.
Waveform
Turns waveform or graticule cursor
modes on. Use the front-panel
SE
button to select which
Graticule
cursor to move (the active cursor).
Use the general purpose knob to
move the active cursor.
Independent Sets cursors to move independently.
Tracking Sets cursors to move together when
the reference cursor is selected.
Rectangular Displays values at and between the
cursor positions as X and Y readouts.
Polar Displays values at and between the
cursor positions as radius and angle
readouts.
Product Displays product values of the active
cursor and the difference vector of
the two cursors.
Ratio Displays ratio values of the active
cursor and the difference vector of
the two cursors.
22
Page 25

0, 0 Origin. The XY waveform origin is the 0 volt point of
each source waveform. Positioning both source waveform 0 volt points on the vertical center graticule places
the origin in the center of the screen. All actual (@)
measurements are referenced to the XY waveform’s 0, 0
origin, and show the value of the active cursor.
Waveform Mode. The Waveform mode uses cursors to
measure the actual waveform data to determine X and Y
values and units. While in Waveform mode, the XY
cursors always lock onto the XY waveform, and cannot
be positioned off the XY waveform.
Graticule Mode. The Graticule function does not connect
screen cursor position to waveform data. Instead, the
display is like a piece of graph paper, where the values of
the divisions are set by each channel’s vertical scale. The
graticule cursor readouts display the XY value of the
screen, not the waveform data. Because graticule cursors
are not associated with waveform data, the cursors are
not locked to the XY waveform and can be positioned
anywhere on the graticule.
All readout types (Polar, Rectangular, Product, and
Ratio) are available in both Waveform and Graticule
cursor modes. However, no time readouts are displayed
in Graticule mode because the cursors are not measuring
the waveform record.
23
Page 26

Turning XY Cursors Off. To turn off the XY cursors, push
the front panel CURSOR button, and then push the
Cursor Function Off side menu button.
Reference and Delta Cursors. Both Waveform and Grati-
cule modes use two XY cursors: a reference cursor (
and a delta cursor (፟). All difference () measurements
are measured from the reference cursor to the delta
cursor.
Switching Between XY and YT Display. You can switch
between XY and YT display mode to see the location of
the Waveform cursors in the YT waveform. The waveform record icon at the top of the graticule also shows
the relative cursor positions of the Waveform cursors in
the waveform record.
Waveform Sources. You can use XY cursors on active
acquisitions, single sequence acquisitions, and reference
waveforms. You must store both XY source waveforms
in order to recreate an XY waveform. The X axis waveform must be stored in Ref1.
),
24
Page 27

Rectangular Readouts. The Rectangular readouts display
the following information:
X, Y
@X, @Y The actual X and Y values of the active (selected)
t
(Waveform
Mode)
@t
(Waveform
Mode)
The X and Y difference from the reference cursor to
the delta cursor. A negative X value means that the
delta cursor is to the left of the reference cursor on
the X axis. A negative Y value means that the delta
cursor is below the reference cursor on the Y axis
cursor.
The time from the reference cursor to the delta
cursor. A negative value means that the delta
cursor is earlier in the waveform record than the
reference cursor.
The time from the trigger point to the active cursor.
A negative value means that the active cursor is
earlier in the waveform record than the trigger point.
The following is an example of Rectangular readouts in
Waveform mode:
X:1.43V @X:-140mV
Y:2.14V @Y:480mV
t:-660ns @t:1.61s
25
Page 28

Polar Readouts. The Polar readout displays the following
information:
r, θ
@r, @θ
t
(Waveform
Mode)
@t
(Waveform
Mode)
The radius and angle from the reference cursor to
the delta cursor.
The radius and angle from the XY waveform origin
to the active (selected) cursor.
The time from the reference cursor to the delta
cursor. A negative value means that the delta
cursor is earlier in the waveform record than the
reference cursor.
The time from the trigger point to the active cursor.
A negative value means that the active cursor is
earlier in the waveform record than the trigger point.
The following is an example of Polar readouts in Waveform mode:
r:2.90V @r:1.27V
θ:32.6° @θ:179°
t:-4.20s @t:8.36s
26
Page 29

The following figure shows an example of how the
oscilloscope calculates the difference vector from the
radius and angle values of the two cursors.
@r
= 3.17V
@ θ
= 45.0°
nr= 3.47V
θ
n
=--111°
(0,0)
@r
= 1.41V
@ θ
The following figure shows how the oscilloscope
determines polar angle values.
XY origin (or reference cursor
for
n measurements)
°
180
--180
°
°
0
= --45.0
°
27
Page 30

Product Readouts. The Product readouts displays the
following information:
X¢Y
@X¢@Y
t
(Waveform
Mode)
@t
(Waveform
Mode)
The product of the difference vector’s X component
multiplied by the difference vector’s Y component.
The product of the active cursor’s X value multiplied
by the active cursor’s Y value.
The time from the reference cursor to the delta
cursor. A negative value means that the delta
cursor is earlier in the waveform record than the
reference cursor.
The time from the trigger point to the active cursor.
A negative value means that the active cursor is
earlier in the waveform record than the trigger point.
The following is an example of Product readouts in
Waveform mode:
X¢Y: 7.16VV
@X¢@Y: 1.72VV
t:-4.68s @t:8.84s
28
Page 31
Ratio Readouts. The Ratio readouts displays the follow-
ing information:
X÷Y
@X÷@Y
t
(Waveform
Mode)
@t
(Waveform
Mode)
The ratio of the difference vector’s Y component
divided by the difference vector’s X component.
The ratio of the active cursor’s Y value divided by
the active cursor’s X value.
The time from the reference cursor to the delta
cursor. A negative value means that the delta
cursor is earlier in the waveform record than the
reference cursor.
The time from the trigger point to the active cursor.
A negative value means that the active cursor is
earlier in the waveform record than the trigger point.
The following is an example of Ratio readouts in Waveform mode:
÷X:1.22VV
Y
÷@X:1.10VV
@Y
t:-4.68ms @t:8.84ms
29
 Loading...