

Page 1

1 Preface
1.1 Brief description of the SM2 monitoring system
The SM2 monitoring system provides the user with statistics on the performance of the DP
system and on resource utilization.
It consists of the following components:
● the SM2 monitoring program
● the SM2U1 utility routine
● the SM2R1 analysis routine
The SM2 monitoring program collects statistical data and outputs it either to a terminal and/
or to a file. The first option is ideally suited for real-time (online) monitoring. If the data is
output to file, the stored data can be analyzed (offline) at a later time.
The SM2U1 utility routine manages the SM2 output files and is occasionally used as a file
conversion leader for the SM2R1 analysis routine.
The SM2R1 utility routine manages the statistical data registered by SM2 and written to a
system-global SM2 output file.
The following products are also available and can be used to edit and display SM2
monitored data:
● The SM2R1-PC analysis routine is used to graphically display the monitored data on a
PC.
● The SM2ONLINE-PC monitoring program is used to simultaneously monitor and
display monitored data from several BS2000/OSD computers on a PC.
● The SM2-PA analysis routine is used for user-specific SM2 output files.
U3585-J-Z125-8-76 1
Page 2

Summary of contents Preface
1.2 Target group
This manual is intended for system users who need information on the current system
workload. It will be of particular interest to computer center and systems support staff who
wish to assess the performance of their configuration and isolate bottleneck areas by
means of long-term monitoring.
1.3 Summary of contents
This is Volume 1 of a set of two manuals and describes the SM2 monitoring program.
Volume 2 describes the SM2U1 conversion routine and the SM2R1 analysis routine, and
gives an overview of the other analysis routines. These routines allow you to carry out
performance analyses in BS2000.
Volume 1: "Administration and Operation"
Chapter 1, Preface,
specifies the target group of the manual and provides pointers on how to use it.
Chapter 2, The SM2 monitoring program,
describes the monitoring program and gives a overview of the terminology used. This
chapter provides an introduction to system monitoring and optimization, and provides
suggestions on how to carry out performance monitoring with SM2.
Chapter 3, SM2 monitoring programs,
describes the SM2 monitoring programs and measurement data.
Chapter 4, SM2 operation,
describes SM2 operation and statements for real-time and background monitoring. The
statements are presented in two sections: an administration section and an ev aluation
section. The first section describes the statements for the SM2 administrator for
controlling the monitoring process and outputting the monitored data to the SM2 output
file. The second section describes the statements availab le to nonprivileged SM2 users
for selecting and controlling reports.
Chapter 5, SM2 screen outputs,
describes the individual output forms (SM2 reports) for monitored data and the SM2
information screens.
Chapter 6, Notes on SM2 operation,
contains important information to be taken into account when using the monitoring
system.
2 U3585-J-Z125-8-76
Page 3

Preface Summary of contents
Chapter 7, Variables reports,
contains a table detailing variables and report groups.
Chapter 8, Messages,
lists all the program messages, together with an explanation and the action to be tak en
in each case.
Chapter 9, Installation,
describes how to install SM2.
Chapter 10, Appendix,
contains descriptions of the SDF syntax and overviews of the SM2 statements.
At the back of the manual, you will find a glossary, lists of abbre viations, figures and tab les,
and related publications, and an index.
Volume 2: "Analysis and Display of SM2 Monitored Data"
Chapter 1, Preface,
specifies the target group of the manual and provides pointers on how to use it.
Chapter 2, SM2U1 utility routine,
describes the functions and operation of the SM2U1 conversion routine.
Chapter 3, SM2R1 analysis routine,
describes the functions and operation of the SM2R1 analysis routine and the records
of the SM2R1 transfer file.
Chapter 4, Other analysis routines,
provides a short description of other analysis routines for SM2 monitored data which
may be ordered.
Chapter 5, Variables reports,
contains tables detailing variables, report groups, report names and reports on
monitored variables (with information on the variables in question).
Chapter 6, SM2 program interfaces,
presents the C interfaces SM2GMS and SM2GDAT and the assembly language
interface PFMON.
Chapter 7, Appendix,
contains descriptions of the SDF syntax and the data structures for C.
At the back of the manual, you will find a glossary, lists of abbre viations, figures and tab les,
and related publications, and an index.
U3585-J-Z125-8-76 3
Page 4

Changes made since the last version Preface
1.4 Changes made since the last version of the manual
SM2 V ersion 13.0A (J une 1999) incorporates the follo wing major changes as compared to
the previous version (V12.0A, December 1996):
SM2
● New monitoring programs
– BCAM-CONNECTION
This monitoring program is used to record monitored data for defined connections.
– DISK-FILE
This monitoring program is used to record inputs and outputs for selected disks.
– HSMS
This monitoring program is used to record monitored data on the migration and
retrieval of files.
● Changes to the monitoring programs
– CHANNEL-IO
Monitored data is also output in the CHANNEL report and at the SM2GDAT
interface.
– DISK
The number of possible devices has been increased to 256.
– FILE
File-specific access times are also output.
–PFA
Monitored data from SYMMETRIX controllers that do not comply with the PFA
concept is also recorded.
– SERVICETIME
The number of possible devices has been increased to 256.
– TASK
The number of devices that can be monitored has been increased to 64.
4 U3585-J-Z125-8-76
Page 5

Preface Changes made since the last version
● New reports
– BCAM CONNECTION
Outputs information on data that has been received/sent and on bucket-specific
times.
– DISK FILE
Outputs files showing the inputs and outputs per second for the monitored disk
devices.
– SYMMETRIX CONTROLLER
Outputs monitored data on the use of SYMMETRIX controllers.
– SYMMETRIX DEVICE
Outputs monitored data on the use of the individual devices of a SYMMETRIX
controller.
● Modified report output for the CHANNEL, DAB, DAB CACHE, FILE, GS, ISAM, PFA
CONTROLLER and VM2000 reports
● New administrator statements
– ADD-BCAM-CONNECTION-SET
Specifies the connection set for the new BCAM-CONNECTION monitoring
program.
– REMOVE-BCAM-CONNECTION-SET
Specifies the connection set to be excluded from the monitoring process for the new
BCAM-CONNECTION monitoring program.
– SET-BCAM-CONNECTION-PARAMETER
Specifies the global monitoring parameters for the BCAM-CONNECTION
monitoring program.
– SET-DISK-FILE-PARAMETER
Defines the disk devices which are to be monitored by the new DISK-FILE
monitoring program.
● Modified and enhanced administrator statements
– SET-CHANNEL-IO-PARAMETER
Three-digit hexadecimal numbers can be specified for the CHANNELS operand.
– SET-DISK-PARAMETER
The DEVICES operand has been extended to accept 256 device names.
U3585-J-Z125-8-76 5
Page 6

Changes made since the last version Preface
– SET/MODIFY-COSMOS-PARAMETER
The new MEASUREMENT-TIME operand can be used to specify the duration of the
monitoring process.
In the TSN operand, up to 16 TSNs can be specified.
In the TSN, USER-ID, JOB-NAME and CATEGORY operands, the last character
may be an asterisk (*).
– SET-SERVICETIME-PARAMETER
The DEVICES operand has been extended to accept 256 device names.
– SET-TASK-PARAMETER
The DEVICES operand has been extended to accept 64 device names.
– SHOW-ACTIVE/DEFINED-PARAMETER
The TYPE operand has been extended to include the new monitoring programs
BCAM-CONNECTION and DISK-FILE.
– START/STOP/CHANGE-MEASUREMENT-PROGRAM
The TYPE operand has been extended to include the new monitoring programs
BCAM-CONNECTION, DISK-FILE and HSMS.
● New, enhanced and obsolete user statements
– The SELECT-SYMMETRIX-CONTROLLER user statement (select the
SYMMETRIX controller for the SYMMETRIX-DEVICE report) has been included in
the manual for the first time.
– The REPORT user statement has been extended to include the values BCAM,
DISK_FILE (DFILE) and SYMMETRIX (SYM).
– The CHANNEL user statement is now obsolete, since the CHANNEL report can
now output follow-up screens.
● SM2 program interface
In the SM2GDAT macro, the variable ’unsigned long buffer_flags’ is now incompatible.
The BCAM-CONNCETION, CHANNEL-IO, DISK-FILE and HSMS data buff ers are now
available .
● Changes to the SM2 output file
In SM2 output files with freely selectable file characteristics, the block length must be
16.
● Dynamic IO reconfiguration
SM2 recognizes a dynamic IO reconfiguration and, if necessary , automatically changes
the number of objects being monitored. This is described in a new section in chapter 2.
● The constraints on SR2000 have been incorporated. For further information, please
refer to section 5.8 of the manual "OSD-SVP V2.0 User Interfaces on Systems with
RISC Architecture" [20].
6 U3585-J-Z125-8-76
Page 7

Preface Notational conventions
SM2U1
● Extended statement: SELECT-MEASUREMENT-GROUPS
The statement has been extended to include
– the new monitoring programs BCAM-CONNECTION, DISK-FILE and HSMS
– the new report groups SYMMETRIX-CONTROLLER and SYMMETRIX-DEVICE.
SM2R1
● New statement: PRINT-HSMS-STATISTICS
Data from the HSMS monitoring program is displayed in the form of tables.
● Enhanced statement: PRINT-REPORTS
The statement has been extended to include the report groups BCAM-CONNECTION,
SYMMETRIX-CONTROLLER and SYMMETRIX-DEVICE.
The report groups CPU, DAB, DEVICE and FILE have been extended.
The operand REPORT-LIST=CHANNEL has been modified to take account of the
maximum channel number of 511.
● Extended statement: PRINT-DISK-STATISTICS
The DEVICES operand has been extended to accept 256 device names.
● Modified statement: PRINT-TASK-STATISTICS
The output has been modified to include a software and hardware operating time.
● The calculation of average values has been modified.
Manual structure
The manual has been divided into two volumes. The individual chapters ha ve been re vised
and some sections reformatted. All screens have been replaced.
1.5 Notational conventions
All statements for controlling monitoring operations (SM2 administration statements) and
the statement interfaces of the SM2U1 and SM2R1 utilities are fully supported by the SDF
statement syntax. ISP statements are no longer available.
The SM2 functions for selecting and controlling screen output can only be addressed via
ISP.
For a description of the SDF syntax, see the appendix.
U3585-J-Z125-8-76 7
Page 8

README file Preface
1.6 README file
Information on any functional changes and additions to the current version of the product
described in this manual can be found in the product-specific README file. You will find the
README file on your BS2000 system under the file name SYSRME.SM2.130.E.
Ask your systems support staff for the user ID under which the README file is located. You
can view the README file by using the /SHOW-FILE command or an editor, and you can
print it out on a standard printer by means of the following command:
/PRINT-DOCUMENT SYSRME.SM2.130.E, LINE-SPACING=*BY-EBCDIC-CONTROL
8 U3585-J-Z125-8-76
Page 9

2 The SM2 monitoring program
2.1 Overview
SM2 is a shareable program that runs under BS2000. It provides the user with inf ormation
on the status and performance of the system, making it possible to improve the performance of both the system and its applications. The mode and scope of monitored data
acquisition in SM2 can be controlled using commands and statements.
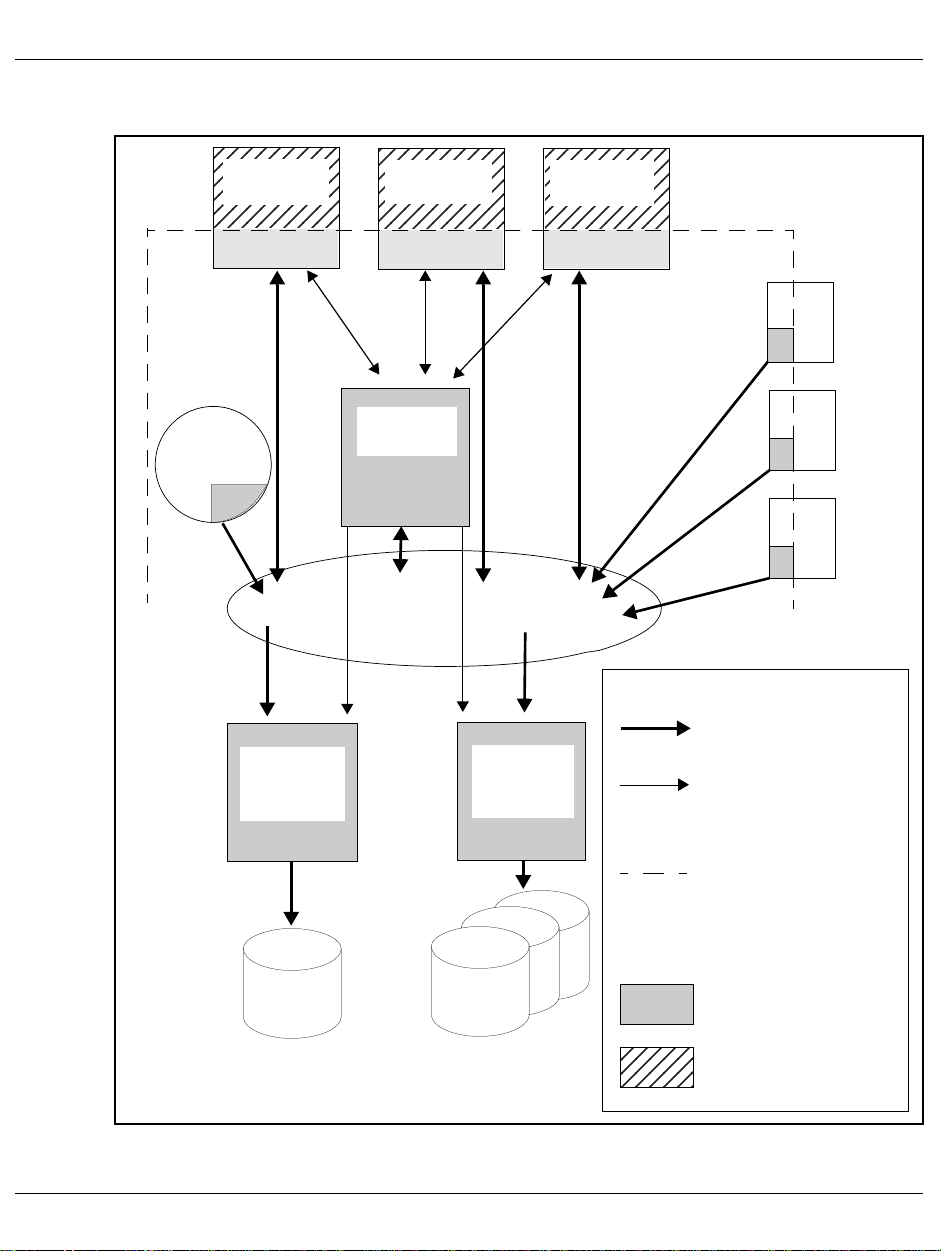
SM2 generates a number of system tasks which are responsible for collecting data and
writing it to the SM2 output files.
SM2 consists of privileged and nonprivileged components. Figure 1 shows the exchange of
information between the various SM2 tasks.
U3585-J-Z125-8-76 9
Page 10
Overview SM2 monitoring program
SM2
administrator
BS2000
system kernel
SM2
global write
task
SM2
user
SM2
monitoring
task
SM2
buffer
...
SM2
user write
task
SM2
user
Monitored
task
Key:
Flow of
monitored data
Communication for
controlling monitoring
operations
Boundary between
privileged and
nonprivileged
program sections
SM2
file
Figure 1: SM2 configuration
User
output file
Privileged
SM2 code
Nonprivileged
SM2 code
10 U3585-J-Z125-8-76
Page 11

SM2 monitoring program Operating modes/users
2.2 SM2 operating modes
SM2 offers three operating modes:
1. Real-time monitoring (information output to a data display terminal)
2. Background monitoring (information output to a file for subsequent analysis)
3. User-specific task monitoring
The operating modes can be used simultaneously.
When mode 1 is used, SM2 periodically outputs monitored data in the form of reports on
the data terminal. The color version of the 9752 Data Display Terminal is supported. This
data refers to the latest monitoring cycle (e.g. 150 seconds) and can be used as snapshots
for assessing the current system status. Only selected SM2 monitored data is output in this
mode.
When mode 2 is used, the collected data is output in the form records to a file, the SM2
output file. This data can be analyzed later using SM2 products. This mode allows for
selective use of the SM2 operands and is equally suitable for long-term monitoring with a
low system load and for brief special-purpose monitoring with a correspondingly higher
system load.
When mode 3 is used, the nonprivileged user (using the START-TASK-MEASUREMENT
command) can register tasks under his/her own ID for monitoring by SM2. In addition to the
task-specific monitored data, a command counter and SVC task statistics can be
requested. In the case of user-specific task monitoring, all information is written to userspecific SM2 output files.
U3585-J-Z125-8-76 11
Page 12

Operating modes/users SM2 monitoring program
2.3 Users
Privileged users
Privileged SM2 users are users who have been assigned the system privilege
SW-MONITOR-ADMINISTRATION. These fall into the following categories: "primary"
administrators, "secondary" administrators and other privileged users.
Entry of an administration statement gives the first privileged SM2 user the status of SM2
primary administrator. This user retains this status until he/she terminates his/her program
or switches over to online analysis using the CALL-EVALUATION-PART statement. The
SM2 primary administrator has all privileges, and there can only be one primary administrator at any one time.
The primary administrator is the only person who is authorized to admit other (secondary)
administrators (MODIFY-ADMINISTRA T OR-ADMISSION statement) and to permit nonprivileged users to run monitoring programs (MODIFY-USER-ADMISSION).
With the exception of the MODIFY-ADMISSION statements, the secondary administrators
have the same rights as the primary administrator.
All administrators can:
– create and close the SM2 output file
– set monitoring parameters
– activate or deactivate optional monitoring runs.
In addition to these privileges, the SM2 administrators can also use all statements of a
nonprivileged user. All other privileged users are only offered the SHO W functions and the
SELECT-HOSTS statement in the administration section.
Notes
SM2 cannot prevent the various administrators from carrying out operations which
contflict with one another. It is only possible to make sensible use of the system if the
different administrators agree on a common course of action.
Modification of the variables to be monitored and functions which can be added may
influence the real-time monitoring of other SM2 users. Modification of the monitoring
cycle applies to all SM2 users.
Nonprivileged users
All users who call the SM2 routine from a user ID without the system privilege
SW-MONITOR-ADMINISTRATION are categorized as nonprivileged users. These users
are only authorized to use the statements for controlling output during real-time monitoring.
12 U3585-J-Z125-8-76
Page 13

SM2 monitoring program Authorization table
2.4 Table of authorizations
The following table indicates which users are permitted to carry out which functions and
under what circumstances.
Sys. priv. SWMONADM
Function (group)
Start/stop functions
Start SM2 monitor
Terminate SM2 monitor
Administration functions
MODIFY-ADMINISTRATOR-ADMISSION
MODIFY-USER-ADMISSION
MODIFY-MEASUREMENT-PERIODS
OPEN-/CLOSE-LOG-FILE
ADD/REMOVE measurement object
SET/MOD measurement PARAMETER def.
INITIATE-COSMOS
START-/CHANGE-/STOP-MEASUREMENT-
PROGRAM
SHOW statements
CALL-EVALUATION-PART
SELECT-HOSTS
Analysis functions
OUTPUT / START
DEVICE
SELECT-DAB / -PCA / -PERIODIC-TASK / -PFA/
-UTM / -SYMMETRIX
STATUS
REPORT
RESTART
FILE
START-/CHANGE-/STOP-ISAM-STATISTICS
SHOW-USER-MEASURED-OBJECTS
CALL-ADMINISTRATION-PART
BS2000 commands
START-/STOP-TASK-MEASUREMENT 6 6 6 2 n
Other SM2 features
Monitor foreign files
Monitor foreign ISAM pools
Monitor foreign tasks
Monitor SVCs/PCounter
Table 1: Authorization table
Pr. adm Sec. adm
y
5
y
y
y
y
y
y
y
y
y
y
y
y
y
y
y
y
y
6
6
4
y
3
3
6
6
Other Priv. usr User
n
5
n
n
y
y
y
7
n
7
y
y
y
y
y
y
y
y
y
6
6
4
y
3
3
6
6
n
5
n
n
n
n
n
n
n
n
y
y
y
y
y
y
y
y
y
6
6
4
y
n
n
6
6
n
5
n
n
n
n
n
n
n
n
n
n
n
y
y
y
y
1
1
2
2
4
n
n
n
n
6
n
5
n
n
n
n
n
n
n
n
n
n
n
y
y
y
y
1
1
n
n
4
n
n
n
n
6
U3585-J-Z125-8-76 13
Page 14

Activating the monitoring task SM2 monitoring program
Key
Pr. adm: Primary administrator
Sec. adm: Secondary administrator
Other: Other privileged user
Priv. user: Users permitted to execute a monitoring program as specified by MODIFY-
USER-ADMISSION
User: Users not permitted to execute a monitoring program
y: Yes
n: No
1: Yes, but some reports are reserved for privileged users
2: Yes if the corresponding monitoring process is permitted for the caller
3: Yes, but only for the corresponding privileged monitoring program
4: Yes, but only for objects registered by this user
5: System privilege SUBSYSTEM-MANAGEMENT required; SM2 privileges
are irrelevant
6: Yes, provided that "Priv. user" is also active
7: Yes, except for the COSMOS monitoring program
2.5 Activating a monitoring task
When SM2 is called for the first time during a session, the SM2 monitoring task is activated.
This is an internal task which collects the monitored data, edits it, and stores it in a central
buffer. F rom this buffer , the data is transf erred to the v arious SM2 user tasks or to the SM2
output file for output. If different offline and online periods are selected, the monitored data
is written to two central buffer stores.
The precise time at which the SM2 monitoring task was initiated and the online or offline
period selected is given in the SM2 MEASUREMENT STATUS under SM2 GATHERING
TASK CREATED AT, ONLINE PERIOD, OFFLINE PERIOD.
14 U3585-J-Z125-8-76
Page 15

SM2 monitoring program Acquisition of monitored data
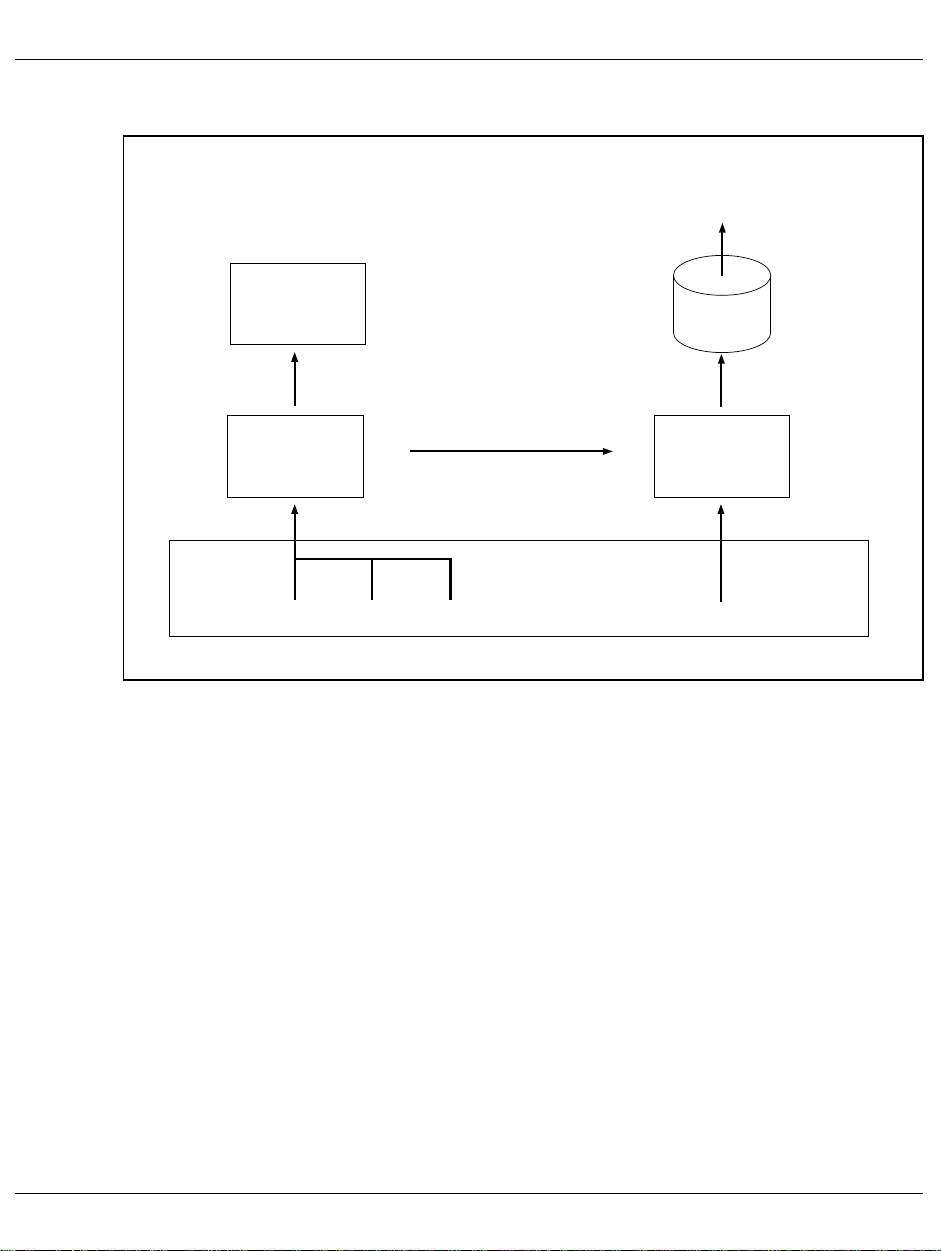
2.6 Acquisition of monitored data
SM2 records a wide range of monitored data and outputs it to either a screen and/or a file.
The data is collected at regular intervals, called monitoring cycles. Some of the monitoring
tasks are carried out by default, while others are carried out by special monitoring programs
which can be activated as and when required.
The monitored data is then processed and displayed internally by SM2 or by independent
SM2 monitoring and analysis routines.
There are three methods of collecting data:
● Based on the monitoring cycle
Most of the monitored data (e.g. the CPU load) is collected at the end of each
monitoring cycle. The current count (or time stamp) is taken from the SM2 or system
tables, and the difference between this value and the value at the end of the last
monitoring cycle is calculated.
The same procedure is used to calculate the intermediate values for the methods
described below at the end of the monitoring cycle (except for the monitoring programs
DISK and TASK).
A monitoring cycle can be set to between 10 seconds and 1 hour.
● Based on the sampling cycle
Because the status is constantly changing, it may not be appropriate to wait until the
end of the monitoring cycle to query some monitored data (e.g. device utilization). When
acquiring this type of monitored data, it is recommended that the monitoring cycle be
broken down into several sampling cycles. At the end of each sampling cycle, the
current monitored variable is obtained. Then, at the end of each monitoring cycle, the
mean value across all sampling cycles is computed.
A sampling cycle can be set between 200 milliseconds and 10 seconds.
● Event-driven
Some monitored data (e.g. the distribution of disk operation times) is determined by
monitoring events within the system. When an event occurs, such as the start of an
input/output operation, an SM2 routine is activated which collects the event-specific
data. This data is then used to calculate the monitored variables.
U3585-J-Z125-8-76 15
Page 16
Acquisition of monitored data SM2 monitoring program
Analysis routine
SM2R1
SM2R1-PC
Output
buffer
S M 2
SM2
file
in BS2000
SM2 data
buffer
Monitoring programs Tables Counter BS2000 monitored object, event
Figure 2: Collecting monitored data
buffer
I/O
16 U3585-J-Z125-8-76
Page 17

SM2 monitoring program Monitoring cycle
2.7 Monitoring cycle
As mentioned above, SM2 collects data at regular intervals known as monitoring cycles
(except for the monitoring programs DISK and TASK). At the end of each monitoring cycle,
the processed data is written to the data buffer and to the SM2 output file, if one is av ailable .
The length of the monitoring cycle is preset at 150 seconds when the subsystem is started.
The SM2 administrator can change this setting using the OFFLINE-PERIOD operand of the
MODIFY-MEASUREMENT-PERIODS statement. The value is entered under OFFLINE
PERIOD in SM2 MEASUREMENT STATUS .
Online monitoring cycle
The online cycle also defines a monitoring cycle in which the monitored data for online
analysis is collected and written to another buffer . The online cycle is deactivated by def ault.
It can be modified using the ONLINE-PERIOD parameter in the MODIFY-MEASUREMENT PERIODS statement. When the online cycle is deactivated, the ONLINE-PERIOD corresponds to the OFFLINE-PERIOD. The CYCLE column in each report shows the online
value currently set. In addition, the value under the ONLINE-PERIOD column is entered in
SM2 MEASUREMENT STATUS.
The online cycle should only be activated if the delay at the terminal is too great when
carrying out online monitoring. This may happen if a long monitoring cycle is set for output
to an SM2 output file. Please note that by activating the online cycle , you also increase the
workload on the system.
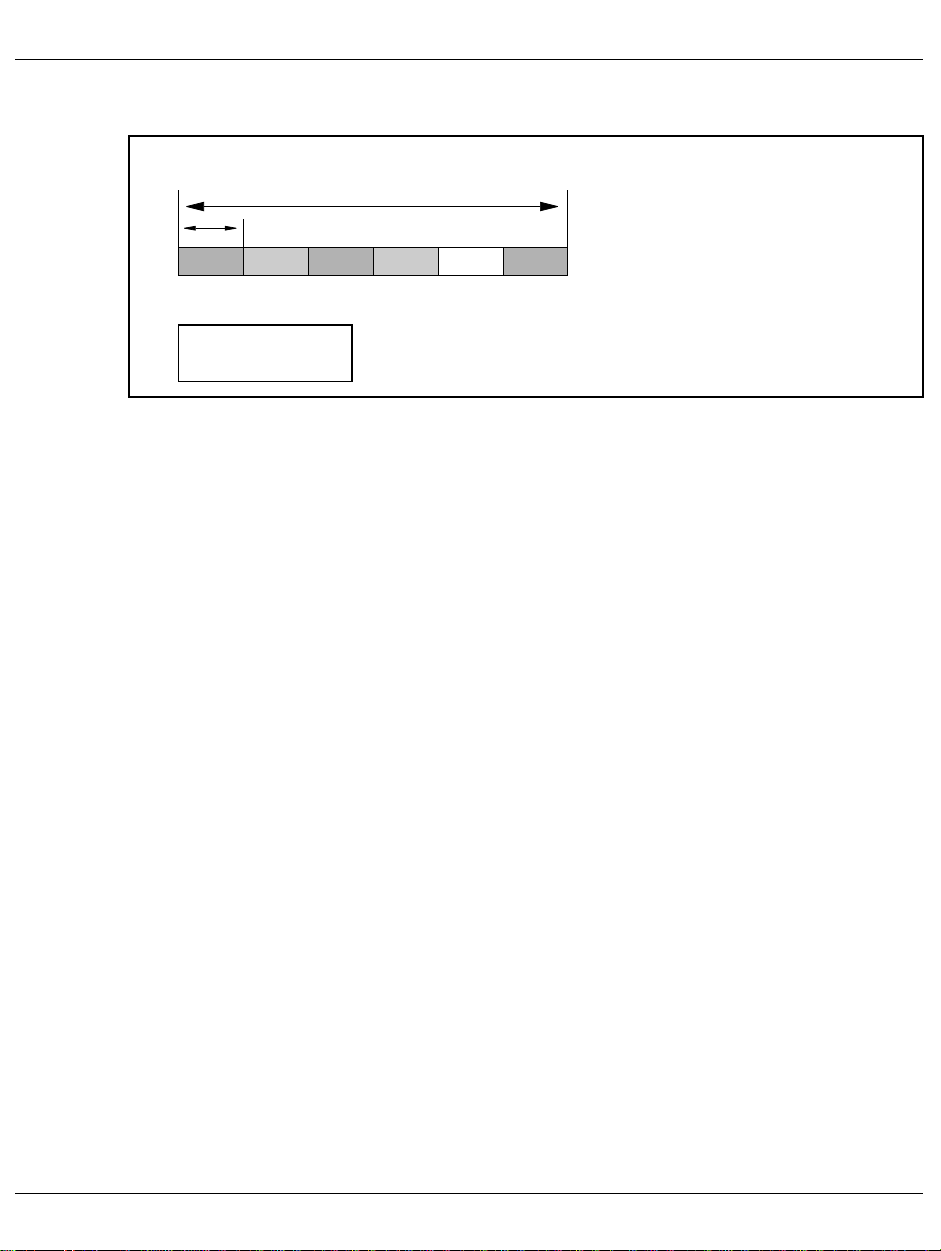
Sampling cycle
For monitored-data acquisition based on random sampling, SM2 subdivides the monitoring
cycle into a large number of small, regular time slots called sampling cycles. The monitoring
task is activated at the specified interval for data collection. At the end of each sampling
cycle, snapshots are taken for some v ariables. F rom the large number of snapshots, a mean
value is computed for each monitoring cycle.
The accuracy of the computed value thus depends on the length of the sampling cycle:
The shorter the sampling cycle, the greater the number of snapshots that can be taken
during the monitoring cycle. The SM2 workload on the system, however, increases simultaneously.
The sampling cycle is preset to 800 milliseconds when the subsystem is started.
The SM2 administrator can change this value in the SAMPLING-PERIOD operand of the
MODIFY-MEASUREMENT-PERIODS statement. The SAMPLING PERIOD column in the
SM2 MEASUREMENT STATUS indicates the current setting, while the SAMPLES column
in the individual reports contains the number of samples taken during the latest monitoring
cycle.
U3585-J-Z125-8-76 17
Page 18
Outputting and saving monitored data SM2 monitoring program
To obtain data, SM2 counts and
val1
Monitoring cycle
Sampling cycle
val2 val3 val4 ..... valn
system counts are evaluated.
Mean values are computed,
percentage frequencies are
determined, and total values are
calculated in order to arrive at
monitored data.
n
1
value
=
Figure 3: Relationship between the sampling cycle and the monitoring cycle
val
-- -
∑
n
j
1
2.8 Outputting and saving monitored data
At the end of a monitoring cycle, the monitored data is summarized into groups which have
similar content, extended by the SM2 monitoring task to include additional inf ormation (time
stamp, host, ...), and then written to a central SM2 data buffer.
If a user has activated online monitoring, the monitored data is transferred from the central
data buffer to the b uffer of the user task. Note that sensitiv e data is transf erred to privileged
users only. The monitored data is then processed and output in the address space of the
user task.
For background monitoring, the SM2 administrator can open an SM2 output file. At the end
of a monitoring cycle, the monitored data is grouped into data records and written to the
SM2 output file. The information in the SM2 output file can be used for subsequent problem
and trend analyses. Special analysis routines are provided for this purpose.
18 U3585-J-Z125-8-76
Page 19

SM2 monitoring program Outputting and saving monitored data
Methods used for compressed output of monitored data
1. Mean values
SM2 adds up the sampled values at the end of each sampling cycle and computes a
mean value for each monitoring cycle (e.g. the number of tasks) as follows:
Sum of sampled values
Average =
Number of samples
2. Percentage frequency
At the end of each sampling cycle, SM2 records the occurrence of specific events or
conditions and computes the percentage frequency of events (conditions) in relation to
the total number of samples (e.g. channel utilization) as follows:
Sum of occurrences
Frequency = *100 %
Number of samples
3. Ascending system counters and SM2 counters
The activity during the monitoring cycle can be determined by calculating the
differences between values gathered at the beginning and the end of the monitoring
cycle (e.g. idle time).
4. Computation
SM2 computes some data from monitored data, e.g. the summation values for all
categories.
Uninterruptible clock resetting
SM2 works internally with UTC time. During the switch from daylight saving time to winter
time and vice versa, SM2 can continue to work without interruption.
U3585-J-Z125-8-76 19
Page 20

SM2 monitored variables SM2 monitoring program
2.9 SM2 monitored variables
The table below shows the main monitored variables of SM2.
A table showing the links between the monitored variables and monitoring programs,
ONLINE reports, and SM2R1 report groups can be found in chapter “Variables reports” on
page 361.
Monitored variable Description
Cache
Access statistics and hit rates for
DAB caches
Access statistics for ISAM pools Number of ISAM accesses per second to pages in the ISAM
Access statistics and hit rates for
hiperfiles (PFA)
Access statistics and hit rates for
SYMMETRIX controllers
Access statistics and hit rates for
controllers with cache (PCA)
CPU
CPU utilization Time during which the processor is in one of the following
Number of system calls Number of SVC calls in TU/TPR per second, and the sum of all
Files
Catalog access statistics Number of read/write accesses to catalog entries/JV entries of
Table 2: SM2 monitored variables
Number of read/write accesses to DAB cache areas per second
and the percentage frequency of read/write accesses to DAB
subareas without disk access.
pool and directly to disk, as well as the number of ISAM
accesses with a delay per second.
Size of the ISAM pool, reserved pages and fixed pages in PAM
pages.
Number of read/write accesses to PCA or DAB cache areas per
second, and their percentage share of the total number of read/
write accesses.
Number of failed attempts to use the cache per second.
Number of read/write accesses to SYMMETRIX controllers and
devices.
Proportion of read/write accesses handled successfully by the
cache.
Number of read/write accesses and their percentage share of
the total number of read/write accesses for PCA controllers,
cache areas, and devices.
statuses: TU, TPR, SIH, IDLE or STOP.
In SR2000 systems, /390 time will also be output.
SVC calls per second.
files per second, as well as average access times in milliseconds.
20 U3585-J-Z125-8-76
Page 21

SM2 monitoring program SM2 monitored variables
Monitored variable Description
Files (continued)
File access statistics Number of PAM-WAIT, PAM-CHECK-READ, PAM-WRITE
operations and input/output operations per second for one file.
Distribution of input/output operations to files for selected disks.
File access times Average access time in milliseconds for each input/output.
IOs
Number of input/output operations Number of input/output operations per second.
Number of paging input/output
operations
Channel utilization and channel
transmission rates
Device utilization and transmission
rates
Length of device queues Number of input/output requests addressed to a device.
Duration of input/output operations Hardware operating time between SDV command and channel
Access distribution to cylinders/
PAM blocks of disks
Number of input/output operations Number of input/output operations per second.
Communication
Response times Aver age time in seconds between the receipt of a message on
Transaction times Average time in seconds between input and the last output.
Thinking time Time between an output and the resulting subsequent input.
Wait time Average wait time for incoming messages before being
Transaction rate Number of transactions per second.
Length of transaction message Average length in bytes of input/output messages for selected
Number of input/output operations
of network devices
Network transmission rate Transmission rate for all TCP/IP connections; data transfer
Table 2: SM2 monitored variables
Number of input/output operations or transferred PAM blocks
per channel.
Device utilization in % without/because of paging activities.
interruption for input/output operations of a specific device,
measured in milliseconds.
Cylinder number/PAM block addressed for input/output
operation.
the system and the sending of a response to the application.
processed by the application.
connection sets.
Number of read/write accesses per second, and the number of
bytes transferred.
information for specific connections.
U3585-J-Z125-8-76 21
Page 22

SM2 monitored variables SM2 monitoring program
Monitored variable Description
Memory
Main memory utilization Number of 4-KB pages in main memory.
Utilization of paging area Number of pageable 4-KB pages on the devices.
Utilization of virtual address space Number of class 1 through class 4 pages in the virtual address
space.
Page fault rate Number of page fault interrupts per second.
Access statistics forglobal storage Number of read/write accesses to global storage per second
and the number of bytes transferred per second.
Subsystem
PCS data Service rate of the affected categories in %, job delays and
SERVICE RATEs per second.
UTM response times and
transaction rates
Number and duration of send jobs
via MSCF
POSIX data File accesses, message accesses, semaphore activities, buff er
Lock requests to the DLM Number of enqueue, convert, dequeue and information lock
Data on synchronization functions
in HIPLEX (NSM)
HSMS data Data on the migration of files to the background level and the
Task
Number of tasks Number of BATCH, DIALOG, TP and system tasks.
Length of task queues Number of tasks in a category.
Dwell times in task queues Dwell times in task queues per category.
Frequency of task activation and
deactivation
Task-specific utilization of
resources
Utilization and queues for task
locks
Number of dialog and asynchronous transactions per second
and the average time in seconds taken for the transaction.
Number of send jobs per second, as well as average total and
wait times.
utilization and all types of system accesses per second.
requests per second, as well as the number of lock allocations
and releases per second.
retrieval of files to the processing level.
Service units per second, percentage CPU utilization,
input/output operations per second, used pages in 4-KB pages,
paging read per second.
Percentage utilization of a task lock and the n umber of tasks in
the task lock queue.
Table 2: SM2 monitored variables
22 U3585-J-Z125-8-76
Page 23

SM2 monitoring program SM2 monitored variables
Monitored variable Description
VM2000
Hypervisor activities Percentage active and idle times of the system.
Guest system activities Planned and measured CPU utilization as a percentage.
Table 2: SM2 monitored variables
U3585-J-Z125-8-76 23
Page 24

Analyzing monitored data SM2 monitoring program
2.10 Analyzing monitored data
There are several tools on various different platforms which can be used to process and
display monitored data.
SM2-ONLINE (BS2000/OSD)
SM2-ONLINE is a component of the SM2 monitoring program. At the end of each
monitoring cycle, it outputs monitored data in the form of reports. For further information,
please refer to chapter “SM2 screen output” on page 201ff.
SM2R1 (BS2000/OSD)
SM2R1 is a component of SM2 and analyzes the SM2 output file. SM2R1 outputs statistics
in tabular form and time series in chart form to a file which is ready to print. For further information, please refer to the chapter “SM2R1 analysis routine” in Volume 2 of the SM2
manual [21].
SM2R1-PC (Microsoft Windows)
The SM2R-PC routine can be purchased separately, and is a development of SM2R1. It
makes use of the graphical options off ered by a PC when displaying monitored data. SM2
output files from various BS2000/OSD computers can be analyzed in an single analysis
run. The result data can be displayed in tabular f orm and can be edited graphically. Charts
can be copied into the clipboard and transferred to any Windows application that can
access the clipboard. For further information, please refer to the chapter “Additional utility
routines” in Volume 2 of the SM2 manual [21].
SM2ONLINE-PC (Microsoft Windows)
The SM2ONLINE-PC utility can be purchased separately and is used to simultaneously
display and monitor SM2 data from sev eral BS2000/OSD computers online. The monitored
data is supplied in the form of charts which are updated at the end of every monitoring cycle.
Each monitored variable can be subjected to threshold monitoring. Alarms signalling
threshold violations can be both audible and visual. For further information, please refer to
the chapter “Additional utility routines” in Volume 2 of the SM2 manual [21].
SM2-PA (BS2000/OSD)
The SM2-P A routine can be purchased separately and is used to analyze user-specific SM2
output files from user task monitoring operations. The result data is displayed in the f orm of
statistics and offers information on task resource utilization and/or the performance of user
programs. For further information, please refer to the chapter “Additional utility routines” in
Volume 2 of the SM2 manual [21] and the manual “SM2-PA” [8].
24 U3585-J-Z125-8-76
Page 25

SM2 monitoring program Performance expectations of the user
2.11 Performance expectations of the user
When assessing the performance of a DP system, the user is generally interested in:
● the time it takes for the system to respond to requests,
● how many requests the system can handle within a given period of time, and
● what resources are used.
The performance level of the hardware (e.g. the number of instructions processed per
second) and of the operating system (e.g. task management efficiency) are generally of
secondary interest.
Interactive mode criteria
A distinction is made between inquiry-and-transaction mode and timesharing mode:
In inquiry-and-transaction mode, the terminal users can communicate only with
programs which are specific to a given application. Normally, a large number of users
interact with a relatively small number of application programs.
In interactive (or timesharing) mode, the terminal users enter their own application
programs for interactiv ely processing a giv en task. The application prog rams are generally
controlled by system programs for creating, testing and updating files and programs.
In both inquiry-and-transaction mode and timesharing mode, the unit of DP operation is a
transaction.
The transaction time is the delay between the arrival of the input at the host and the output
of the acknowledgment. The DP system can output several responses with different
response times for a singletransaction. If resources are not released when a transaction is
completed but are reserved for the ne xttransaction, the transaction is known as a multi-step
transaction.
U3585-J-Z125-8-76 25
Page 26

Performance expectations of the user SM2 monitoring program
The sum of single-step and multi-step transactions required for handling one application is
called an operation.
The characteristic criteria for describing performance expectations are:
● Transaction rate
Sum of all successfully completed transactions per unit of time
● Response time
Time required for processing by the DP system
● Number of simultaneously active users.
The monitored values for these characteristics are determined in SM2 by the monitoring
program BCAM-CONNECTION (page 35), RESPONSETIME (page 45) and UTM
(page 53).
Batch processing criteria
In batch processing, the unit of DP processing is a job.
● Throughput rate
Number of successfully processed jobs per unit of time
● Dwell time
Time required for processing a job
For the individual user, a satisfactory performance (short response time, short dwell time)
is obtained if the required resources are available when they are requested. This
requirement can easily be meet if utilization of the requested resources (in particular of the
input/output devices) is kept to a minimum.
The DP system performance, on the other hand, is characterized by the transaction and
throughput rates, where maximum utilization of the resources is desirable for economic
reasons.
These contradictory performance requirements relating to resource utilization can be
fulfilled only by carefully planning the workload and the associated resource requirements.
26 U3585-J-Z125-8-76
Page 27

SM2 monitoring program System monitoring
2.12 Using SM2 for system monitoring
Depending on the mode of monitored-data acquisition (frequency, scope), we must
consider two different applications:
● Trend monitoring (= long-term monitoring) for obtaining data for system capacity
planning
● Bottleneck analysis for locating and eliminating performance problems
Trend monitoring
The utilization data of the following resources is required in order to carry out long-term
system capacity planning:
– CPUs
– channels
– devices
– main memory
Additional monitoring routines need not be activated.
It is advisable to use the following settings for monitoring periods:
Sampling cycle (SAMPLING-PERIOD): 1000 milliseconds
Monitoring cycle (OFFLINE-PERIOD): 5 minutes
Analysis subinterval 1 hour
The monitoring period should cover the entire period from SYSTEM READY through to
SHUTDOWN. If output of the online screen report takes too long during the session, you
can shorten the online monitoring cycle.
Monitoring times are set using the MODIFY-MEASUREMENT-PERIODS statement.
It is a good idea to create a new SM2 output file every day (OPEN-LOG-FILE / CLOSELOG-FILE statements). The SM2U1 routine can be used to combine (and split) daily SM2
output files to create one large file, known as the master SM2 output file. The daily SM2
output files must be added to the master SM2 output file in chronological order.
U3585-J-Z125-8-76 27
Page 28

System monitoring SM2 monitoring program
Bottleneck analysis
Before monitoring is started, you must clarify any performance problems, i.e. performance
expectations that are not satisfied. The following problems may exist:
● System-oriented performance problems
These arise if the system throughput rate is unsatisfactory, and are indicated by a low
transaction rate and/or throughput rate. The most likely cause is the o verloading of one
or more resources.
● User-oriented performance problems
These occur due to long delays when handling specific load requirements.
The following monitored v ariables should be used to analyze bottlenec ks. SM2 also allo ws
for more extensive analysis through addition monitoring programs.
These monitored variables and monitoring programs make it easier to locate overloaded
resources:
Monitored variable Monitoring program
Number of tasks in the system queues and at devices Monitored by default
Number of input/output operations per device Monitored by default
Working set per category Monitored by default
CPU utilization and number of input/output operations per category SYSSTAT
Number of input/output operations and volume of data transf erred per
channel
Access to catalog entries CMS
Number of transactions RESPONSETIME, BCAM-
Table 3: Monitoring programs used to locate overloaded resources
CHANNEL-IO
CONNECTION, and UTM
The following settings are recommended for monitoring times (MODIFY-MEASUREMENTPERIODS statement):
Sampling cycle (SAMPLING PERIOD): 400 milliseconds
Monitoring cycle (OFFLINE-PERIOD): 60 seconds
Analysis subinterval: 1 - 5 minutes
Monitoring period: 0.5 - 5 hours
Monitoring must be carried out during peak load periods.
Due to the shorter monitoring cycle and the activated monitoring programs, bottleneck
analysis produces a large volume of data compared to trend monitoring. The volume of data
corresponds to the number of objects monitored and the number of events (DISK
monitoring program). The resulting SM2 output file may be very large.
28 U3585-J-Z125-8-76
Page 29

SM2 monitoring program Efficient DP system usage
Because of the volume of data generated, it does not make sense to copy all data record
types into the master SM2 output file. SM2U1 can be used to suppress certain data records
when updating the master SM2 output file.
To investigate delays when handling special load requirements, you will need further information in addition to the system utilization data described above. To begin with, the
monitoring program PERIODIC-T ASK or TASK can be used to select a task. The DISK-FILE
monitoring program can be used for ov erloaded disks to determine the files accessed most
frequently. It is not possible to list general guidelines for the additional selection of
monitoring programs. For further information, please refer to the “Performance Handbook”
[5].
2.13 Basic procedure for ensuring efficient DP system usage
T o minimiz e performance analysis problems, the f ollowing procedure should be adhered to:
● Define the performance expectations (see page 25).
● Check the extent to which performance expectations are satisfied once productive
operation has begun. This involves carrying out a “basis” test.
● If some performance expectations are not satisfied, check whether these are system-
oriented or user-oriented.
● Check for errors in the system setup.
● Carry out a bottleneck analysis (see the section “Automatic performance analysis” in
the chapter “SM2R1 analysis routine” and the description of the START-AUTOMATICANALYSIS statement in Volume 2 of the SM2 manual [21]).
Concentrate on those bottlenecks whose elimination promises the greatest performance improvement.
● After eliminating the detected bottlenecks, repeat the bottleneck analysis. Man y bottle-
necks remain hidden until after some kind of intervention.
● Monitor the system at regular intervals (see page 27) to detect saturation symptoms in
the main resources (due to increasing loads) and to avoid critical system conditions.
The procedure is described in detail in the “Performance Handbook” [5], which also e xplains
how to interpret the results.
U3585-J-Z125-8-76 29
Page 30

SM2 in computer networks SM2 monitoring program
2.14 SM2 in computer networks
SM2 provides functions for the central online monitoring and control of monitored-data
acquisition in a computer network.
The monitored data is independently recorded on each host in the network by a local SM2
monitoring program, and is exchanged between the hosts via a LAN. In this wa y, the online
reports of all hosts can be output on any computer in the network.
There are also reports which output the combined monitored data of the various hosts.
All control statements for the acquisition of monitored data (changing monitoring cycles,
switching monitoring programs, etc.) can be entered on any host for all computers in the
network.
The SM2 functions for monitored-data acquisition in a network are also available in a
HIPLEX network.
Prerequisites for using SM2 in computer networks
1. An MSCF connection of type CCS (Closely Coupled System) must exist between all
hosts in the network.
For further information on this connection type, refer to the “HIPLEX MSCF” manual [4].
2. The SM2 functions for monitored-data acquisition in a network can only be used for
those computers in the network which run the same version of SM2.
3. SM2 must be started once on all computers in the network (e.g. with ST AR T-SM2) or at
least loaded via the DSSM command /START-SUBSYSTEM
SUBSYSTEM-NAME=SM2.
Selecting hosts with SM2
The privileged statement SELECT-HOSTS (see page 110) selects the computers to which
all subsequently entered SM2 statements are to be sent. This statement always applies to
the user who issues it. Following the END statement and a restart, the default value applies
again, i.e. SM2 statements are only executed on the local host.
The SHOW-SELECTED-HOSTS statement (see page 140) provides information on the
selected hosts. This includes the time of the last monitored variable queried.
30 U3585-J-Z125-8-76
Page 31

SM2 monitoring program SM2 in computer networks
Users in a computer network
SM2 distinguishes between privileged users (“primary” and “secondary” administrators and
other privileged users) and nonprivileged users. This also applies in a computer network.
It does not distinguish between the rights of local and remote users.
Users can have different rights on different hosts, depending on their privileges and the
rights they have already been assigned. In particular, the primary administrator of a host
can come from a different host. These primary administrators can be identified on the
MEASUREMENT STATUS screen by the additional output of the host name.
The set of administration statements available may be restricted according to the rights of
the user. As a result, the set of permitted statements may vary from one host to the next.
Prohibited statements are rejected by the relev ant hosts. If sever al hosts are selected, the
statements of the first specified host are displayed in the user dialog.
Screen output
The screens containing the local data of a particular host are output in succession. These
are followed by the screens of the next host, and so on. The system name in the top lefthand corner of the screen indicates which host to which the screen belongs.
Before the local screens of the individual hosts, screens showing combined data from the
whole network can be output (GLOBAL, NSM and SHARED-PVS reports):
– The GLOBAL report provides an overview of the utilization of all hosts in the network.
– The NSM report outputs data of the NSM subsystem for all hosts in the network.
– The SHARED-PVS report shows the access to shared disk devices.
These reports only cover the hosts which have been previously selected by means of the
SELECT-HOSTS statement.
Standard SM2 output file
The standard SM2 output file is created on every host on the home pubset. To enable the
SM2 output files of the various hosts to be distinguished later on, the file name also includes
the system name.
U3585-J-Z125-8-76 31
Page 32

SM2 in computer networks SM2 monitoring program
Restrictions for the computer network
1. The BS2000 /START-TASK-MEASUREMENT command can only be used on the local
host.
2. Scroll commands
– Scrolling backward with “-” or “-R” is not supported across host boundaries; i.e. you
cannot scroll back from the first report of one host to the last report of the previous
host.
– You can only change to the first report of the previous host using the scroll
command “-N” (node) (see page 152).
– You can only access the reports containing combined monitored data using “-N”
while scrolling backward.
– The scroll command “--” always displays the first selected report.
3. The monitored values of the individual hosts are only output together if the time also
corresponds. The system clocks on all hosts should be synchronized as f ar as possible
and the same monitoring cycle must be set in SM2.
If no valid or new file exists, the following outputs are possible:
– SHOW-SELECTED-HOSTS statement
In the LAST BUFFER column, RSLT NOT VALID is output for the last monitored
variable queried instead of the time.
– GLOBAL and NSM reports
In the column for the monitored variables, “∗∗∗” is output.
– SHARED PVS report
The message “SOME DATA MISSED” is output.
– Local reports
For local reports, the message “NO DATA FROM xyz” is output.
Dynamic IO reconfiguration
SM2 recognizes a dynamic IO reconfiguration and, if need be, automatically modifies the
range of objects monitored. The monitoring programs CHANNEL-IO, SERVICETIME,
SYSSTAT, TASK and NET -DEVICE and the monitoring process for CHANNEL/DEVICE are
terminated internally and then restarted. As a result, monitored variables cannot be
supplied for the most recent monitoring cycle.
Monitoring program definitions with wildcards *ALL, *DISK or *TAPE are re-interpreted.
32 U3585-J-Z125-8-76
Page 33

3 SM2 monitoring programs
3.1 Overview
SM2 offers a range of optional monitoring programs that record additional data. A distinction
is drawn between privileged monitoring programs, which only an SM2 administrator can
start and stop, and monitoring programs for user-specific monitored objects, for which the
permission of the SM2 primary administrator is required (see the MODIFY-USERADMISSION statement, page 98).
The monitoring programs are started and stopped by means of START-MEASUREMENTPROGRAM and STOP-MEASUREMENT-PROGRAM. For some monitoring programs,
monitoring parameters must be defined with the SET-<programname>-PARAMETER
statement and/or the objects to be monitored must be selected with ADD-... and REMOVE... before the program is started.
The data supplied by the monitoring programs is output on screen and/or to the SM2 output
file. To start monitoring programs that output their data exclusively to the SM2 output file,
an SM2 output file must be open. All other monitoring programs also write their data to the
SM2 output file when it is open. In the case of screen output with some monitoring
programs, it is possible to use a SELECT-... statement to select additional, object-specific
online reports.
The following table indicates the monitoring programs:
– for which parameters must be defined or the objects to be monitored must be selected
– that output their data exclusively to the SM2 output file
– that output data in an online report on the screen
– that output data in an online report only to privileged users
– for which additional, object-specific reports can be selected.
Restriction
The monitoring programs GS and GSVOL cannot be used with SR2000 as certain
hardware and system requirements are not met.
U3585-J-Z125-8-76 33
Page 34

Overview SM2 monitoring programs
Monitoring programs Parameter/
monitored
object
definition
BCAM-CONNECTION
CHANNEL-IO
CMS
COSMOS
DAB
DISK
DISK-FILE
DLM
FILE
GS
GSVOL
HSMS
ISAM
MSCF
NET-DEVICE
NSM
PCA
PERIODIC-TASK
PFA
POSIX
RESPONSETIME
SERVICETIME
SVC
SYSSTAT
TASK
TCP-IP
TLM
UTM
VM
USER FILE
USER ISAM
USER TASK x (2)
Table 4: Overview of the SM2 monitoring programs
x
x
x
x
x
x
x
x
x
x
x
x
Output
exclusively to
file
x (1)
Name of the
online report
BCAM CONNECTION
CHANNEL
CMS
DAB
x
DISK FILE
DLM
FILE
GS
GSVOL
ISAM
MSCF
NET DEVICE
NSM
PCA
PERIODIC TASK
PFA, SYMMETRIX
POSIX
RESPONSETIME
x
SVC
CATEGORY
x
TCP/IP
TLM
UTM
VM2000
FILE
ISAM
Online output
Only
privileged
users
x
x
Selection
of additional reports
x
x
x
x
(1) COSMOS outputs data to a separate SM2 output file (see the description of COSMOS).
(2) Output is to a user-specific SM2 output file.
34 U3585-J-Z125-8-76
Page 35

SM2 monitoring programs BCAM-CONNECTION
3.2 Privileged SM2 monitoring programs
BCAM-CONNECTION Monitored data on connection sets
The BCAM-CONNECTION monitoring program supplies monitored data for connections
that are combined in connection sets. It provides monitored variables for DCAM applications (with NEA names) and socket applications (with port numbers) only. Information is
recorded on INWAIT, REACT, INPROC and OUTPROC times.
– The INWAIT time is defined as the time between the displa y of a BCAM message at an
application and the retrieval of this message by the application.
– The REACT time is defined as the time between an application’s send call and the
receive call which immediately precedes it. If the send and receive calls are logically
linked, then the REACT time can be seen as the time it takes for the application to
respond. In dialog-oriented applications, each input is normally followed by the appropriate output.
– The INPROC time is defined as the time between the arrival of a message at BCAM and
the retrieval of this message by the application. The INPR OC time includes the INW AIT
time.
– The OUTPROC time is defined as the time between a send call and the transfer of the
last byte of a message to the network. Data transfer to the network ma y also be delayed
by the receiving party.
In addition, statistics are recorded on incoming and outgoing data (jobs, the volume of data,
packets, etc.).
The SM2 administrator can use the SET-BCAM-CONNECTION-PARAMETER and ADDBCAM-CONNECTION-SET statements to define global and connection-specific monitoring
parameters respectively.
The SET-BCAM-CONNECTION-PARAMETER statement must be entered before the first
ADD-BCAM-CONNECTION-SET statement.
Global parameters
Time statistics are recorded bucket-specifically. The BUCKET parameters consist of a list
of the maximum INWAIT, REACT, INPROC and OUTPROC times, arranged in order of
magnitude. The ranges defined in these lists apply to all connection sets defined in the
ADD-BCAM-CONNECTION-SET statement.
<integer 1 .. 99999> is an integer which defines a limit value. The number of limit v alues in
this list implicitly determines the number of ranges. This may vary from list to list, but four
limit values is the maximum.
U3585-J-Z125-8-76 35
Page 36

BCAM-CONNECTION SM2 monitoring programs
The last value in the list of ranges specifies the overflow limit. All monitored variables that
exceed this limit are included under the last range. The b ucket par ameters in BCAM can be
specified by both SM2 and other applications. It is also possible to disable monitored data
acquisition entirely.
The SET-BCAM-CONNECTION-PARAMETER statement contains the *UNCHANGED
operand value. This causes SM2 to lea v e the b uc k et par ameters set in BCAM as they are ,
and to adopt these values for its own monitoring program definition.
If the SET-BCAM-CONNECTION-PARAMETER statement is used to define alternative
bucket parameters, then these will also be set in BCAM when you start the monitoring
program. If you modify the buc k et parameters in BCAM during the monitoring process, the
new parameters will also apply to SM2.
If monitore- data acquisition is disabled in BCAM during monitoring, SM2 will reenable it
using the parameters defined in SM2.
Connection-specific parameters
A connection is defined by an NEA name or a port number, the type of connection, and the
host name. A connection set is understood as a number of connections defined by specifying these objects.
The objects may be specified using
– a fully qualified name (name),
– a partially qualified name (name*), or
– or an unqualified name (*ANY, *LOCAL, *REMOTE, *BOTH).
Using an unqualified name may lead to fluctuations in the number of connections in a
connection set during monitoring. The BCAM-CONNECTION screen shows the number of
connections of the connection set which are currently being monitored. A connection set is
defined by specifying a list of up to 16 name definitions. You can specify either NEA application names or port numbers, but not both.
You must also specify the type of connection:
*LOCAL Only connections within the host
*REMOTE Only remote connections
*BOTH All connections
Another distinguishing feature used to select connections is the names of the hosts
between which the connection exists. It is possible to define up to 32 connection sets.
36 U3585-J-Z125-8-76
Page 37

SM2 monitoring programs BCAM-CONNECTION
Examples of monitoring program definitions
Example 1
SET-BCAM-CONNECTION-PARAMETER
INWAIT-BUCKETS = *UNCHANGED,
REACT-BUCKETS = *UNCHANGED,
INPROC-BUCKETS = *UNCHANGED,
OUTPROC-BUCKETS = *UNCHANGED
ADD-BCAM-CONNECTION-SET
SET-NAME = setname1,
CONNECTION-SELECTION = *BY-NEA-NAME (
CONNECTION-NAME = *SPECIFIED (
LOCAL-APPLICATION = $DIALOG,
PARTNER-APPLICATION = *ANY)),
CONNECTION-TYPE = *REMOTE,
HOST-SELECTION = *SPECIFIED (
LOCAL-HOST-NAME = *LOCAL,
PARTNER-HOST-NAME = hostname1)
START-MEASUREMENT-PROGRAM TYPE = *BCAM-CONNECTION
In these statements, the monitoring parameters set in BCAM are transferred. A connection
set is defined which records all connections with the name type NEA and the local application name $DIALOG. The connections are remote and lead to the specified hosts.
U3585-J-Z125-8-76 37
Page 38

CHANNEL-IO SM2 monitoring programs
Example 2
REMOVE-BCAM-CONNECTION-SET SET-NAME = *ALL
SET-BCAM-CONNECTION-PARAMETER
ADD-BCAM-CONNECTION-SET
SET-NAME = setname2,
CONNECTION-SELECTION = *BY-PORT-NUMBER(
PORT-NUMBER = *SPECIFIED (
LOCAL-PORT-NUMBER = 5000,
PARTNER-PORT-NUMBER = *ANY)),
CONNECTION-TYPE = *BOTH,
HOST-SELECTION = *SPECIFIED (
LOCAL-HOST-NAME = *LOCAL,
PARTNER-HOST-NAME = hostname2)
CHANGE-MEASUREMENT-PROGRAM TYPE = *BCAM-CONNECTION
These statements end the current monitoring process and restart it using new parameters.
The bucket parameters are set to their default values. A connection set is defined which
records all connections with the local port number 5000 and which lead to the specified
host.
CHANNEL-IO Monitored data on the channel load
The CHANNEL-IO monitoring program provides precise information on the channel load.
For each channel to be monitored, it returns the number of I/O operations for PAM block
transfer, byte transfer, and without data transfer (NODATA). In addition, it indicates the
volume of data transferred for PAM block and byte transfer in PAM blocks.
CMS
Monitored data on the catalog management system
The CMS monitoring program provides information on the performance of the catalog
management system. It outputs monitored variables for each catalog and for all private
disks.
38 U3585-J-Z125-8-76
Page 39

SM2 monitoring programs COSMOS
COSMOS
Monitored data on the system for bottleneck analysis
COSMOS is an event-driven monitoring progr am f or recording detailed system data that is
required particularly for bottleneck analyses of OL TP applications. It collects monitored data
for all tasks, for task groups (which can be selected by user ID, category, or job name), or
for individual tasks. Because of the high volume of very detailed monitored data involved,
COSMOS should only be used for short-term monitoring. Intimate knowledge of the internal
workings of the system is required to interpret the monitored data.
COSMOS is an SM2 add-on product and only available on special release. A detailed
description is supplied with the product.
DAB Monitored data on DAB activities
SM2 outputs highly detailed information on DAB activity in all DAB cache areas. Intensive
use of DAB in parallel may result in a large volume of data traffic in SM2.
DISK Monitored data on disk access
The monitoring program for disk statistics permits fine analysis of the frequency with which
the cylinders or blocks of a disk are accessed, and of the duration of I/O operations . SM2R1
provides analyses of the records supplied by SM2. These analyses, combined with a
knowledge of how files are mapped to cylinder/bloc k areas, make it possib le to optimize the
mean access time for disk I/O operations.
Monitored variables
The following information is recorded for each completed disk access to a selected disk
device:
– mnemonic device name
– cylinder/block number addressed when I/O is started (at the time of the SD V or START-
SUBCHANNEL command)
– duration of hardware I/O (time between the initiation of I/O using the SDV or START-
SUBCHANNEL command) until termination of I/O (as the result of a channel interrupt)
– I/O identifier specifying read, write or other I/O operations
The monitored data recorded is then written only to an SM2 output file, from which it can be
analyzed by SM2R1 (PRINT-DISK-STATISTICS statement).
U3585-J-Z125-8-76 39
Page 40

DISK-FILE SM2 monitoring programs
Due to the large amount of data generated and the resulting high load on the CPU, this
monitoring program should be used for short monitoring operations only (between half an
hour and one hour), and only on a small number of disk devices.
Note
The only access values recorded are ones where an I/O chain begins with a search
command (SEEK). This is usually the case for most access attempts, with the e xception
of the following instances:
1. When formatting disks (VOLIN)
2. When accessing the VOL1 label
DISK-FILE
Monitored data on file access for selected disks
This monitoring program provides information on physical access to files on a selected disk,
provided that access was by way of the I/O output system of privileged PAM (PPAM). This
includes file access using the methods EAM (Evanescent Access Method), ISAM (Index ed
Sequential Access Method), SAM (Sequential Access Method) and UPAM (User Primary
Access Method).
In the case of multiprocessor systems, monitoring is restricted to I/O operations originating
in the local system running SM2.
Note
Due to the extension of the I/O path, the monitoring program should only be used for
short periods of time.
DLM Monitored data on lock requests
The DLM (Distributed Lock Manager) monitoring program provides information on lock
requests from TU, TPR and NSM.
40 U3585-J-Z125-8-76
Page 41

SM2 monitoring programs FILE
FILE
Monitored data on file access for selected files
This monitoring program provides information on the number and average duration of file
access, provided that access was by way of the I/O output system of privileged PAM
(PPAM). This includes file access using the methods EAM (Evanescent Access Method)
and ISAM (Indexed Sequential Access Method).
In addition, data is recorded for the access methods SAM (Sequential Access Method) and
UP AM (User Primary Access Method), all disk access, and all access to magnetic tape files
with standard blocks.
The FILE statistics also contain the access times for files. The monitored time covers the
logical duration of I/O operations between start and end of a job from the point of view of
the software. For asynchronous I/O oper ations , this time can be consider ab ly g reater than
the hardware time.
In the case of multiprocessor systems, monitoring is restricted to I/O operations originating
in the local system running SM2.
HSMS
Monitored data on file migration
This monitoring program supplies information on the migration of files to the background
level and the retrieval of files to the processing level.
GS Monitored data on access to global storage
This monitoring program provides information on read and write access to global storage
(GS), categorized by partitions.
GSVOL Monitored data on volumes in global storage
This monitoring program provides information on read and write access to volumes which
are emulated on global storage.
U3585-J-Z125-8-76 41
Page 42

ISAM SM2 monitoring programs
ISAM Monitored data on ISAM pools
When the BS2000 component NK-ISAM is installed, the monitoring program for ISAM pools
provides information on the performance of the ISAM buffer management facility. ISAM
buffer management is aimed at reducing the physical I/O operations involved in accessing
ISAM files. Using the information recorded in this monitoring program, the access behavior
of this ISAM pool can be optimized by modifying the parameters of an ISAM pool, as
required (for more details on the ISAM access method, please refer to the "DMS Macros"
manual [2]).
Users can issue the BS2000 command SHOW-ISAM-POOL-ATTRIBUTES to obtain information on the pool names.
MSCF
Monitored data on communication between hosts
The MSCF (Multiple System Control Facility) monitoring program provides information on
communication between the local host and other hosts.
NET-DEVICE Monitored data on network devices
This monitoring program provides information on access to and the transferred data of
network devices (mainframe interface controllers).
NSM Monitored data on HIPLEX MSCF®
The NSM (Node Serialization Manager) monitoring program provides information on the
basic functions of a HIPLEX MSCF® network.
42 U3585-J-Z125-8-76
Page 43

SM2 monitoring programs PCA
PCA
Monitored data on 3419/21 disk controllers under PCA
This monitoring program records monitored data on 3419/21 disk controllers managed by
the PCA (Peripheral Cache Administrator) subsystem. It is used to record statistics on the
ADM PFA cache areas (Administrator Controlled Performant File Access). The main
purpose of the subsystem is to configure the cache integrated in the controller according to
the particular needs of the user, achieving a higher I/O throughput rate or shorter I/O times.
The monitored values recorded by the PCA monitoring program serve to evaluate the
efficiency of the cache configuration and to provide pointers on how to improve the utilization of the cache.
Unlike other SM2 monitoring programs, these statistics are not processor-oriented, rather
they relate globally to a particular controller. This fact should be tak en into account particularly when interpreting monitored data. For example, high hit or miss rates for a disk de vice
supported by the cache do not necessarily imply that these were triggered by the host
running SM2. Also, this does not mean that the disk device listed was ever addressed by
the SM2 host via the controller, or that the device has even been generated on this host.
This information about the particular configuration should be obtained before SM2 is put to
practical use, in other words before selecting controllers or caches, with the aid of PCA
subsystem SHOW commands.
PERIODIC-TASK Monitored data on tasks
This monitoring program records the most important utilization data for all tasks. Each user
can himself/herself use the SELECT-PERIODIC-TASK-PARAMETER statement to specify
the sort criterion and the output information for online output. The privileged statement
SET-PERIODIC-TASK-PARAMETER is used to specify the tasks whose data is to be
written to the SM2 output file. This prevents the SM2 output file from becoming too large.
Nonprivileged users receive information only on those tasks that are under their user ID.
U3585-J-Z125-8-76 43
Page 44

PFA SM2 monitoring programs
PFA Monitored data on caches under User PFA
User PFA (User Controlled Performant File Access) allows users to assign performance
attributes to files, thus converting them into hiperfiles (High Performance Files). The idea
behind hiperfiles is that file access is accelerated by buff ering the file in a high-speed cache
in order to avoid the slow disk input/output oper ations. The f ollowing cache media are used
for hiperfiles: main memory (MM), global storage (GS), 3419/21, 3860 and SYMMETRIX
cache controllers, and SSDs (solid state disks). Depending on the cache medium, the
caches are administered by DAB (main memory, ES, GS), by PCA (disk controllers with
cache, CTL), or by the hardware itself (SYMMETRIX).
The PF A monitoring program records monitored data on all user PF A caches. This data may
overlap with that contained in the PCA, DAB and SYMMETRIX reports.
Note
The PFA monitoring program also records information on SYMMETRIX controllers
which are not used in accordance with the PFA concept. This information is output to
the SYMMETRIX reports (see page 302ff) and applies globally to the SYMMETRIX
controller. In other words, the data output is not host-oriented.
The data in PFA reports refers to the PFA cache and is likewise not host-oriented.
Only SYMMETRIX reports should be taken into account for SYMMETRIX controllers.
With the introduction of SYMMETRIX reports, it no longer makes sense to configure
PFA pubsets in SYMMETRIX controllers.
POSIX Monitored data on POSIX
This monitoring program provides information on the POSIX subsystem.
This information corresponds to the options and output data of the SINIX command “sar”.
44 U3585-J-Z125-8-76
Page 45

SM2 monitoring programs RESPONSETIME
RESPONSETIME Monitored data on the BCAM pool
The RESPONSETIME monitoring program records information on response times, think
times, transactions times, and wait times in the BCAM pool. It supplies useful monitored
data for dialog-oriented DCAM applications only (with NEA names).
The response time is understood to mean the time between the receipt of a message by
the host and the sending of a response to the partner application.
SM2 makes a distinction between two kinds of response time:
Definition 1 The time between an input (receipt of a message) and the next output
(sending of a message) via the same connection .
Definition 2 The time between an input and the next output or all follow-up outputs sent
before a further input.
The SM2 administrator can choose between these two definitions (using the SETRESPONSETIME-PARAMETER or MODIFY -RESPONSETIME-PARAMETER statement).
The think time is understood to mean the time taken between output and the next (subse-
quent) input. The transaction time is understood to mean the total time elapsed between
an input and the final output. The wait time is understood to mean the time between entry
of a message in the BCAM pool and retrieval of the message from this pool.
For simplicity, interaction is the term used as an overall definition covering the wait,
response, think, transaction times.
U3585-J-Z125-8-76 45
Page 46

RESPONSETIME SM2 monitoring programs
Example: Calculating the time values
T
T
I
O1
T
O2
T
T
R
O3
T
O4
T
I,next
t
T
Input time stamp
I
T
Output time stamp
O
T
Time stamp of the current receive action in the BCAM application
R
RT1= TO1-T
I
Response time (definition 1)
RT2= RT2, TO2-TO1, TO3-TO2, TO4-TO3Response time (definition 2)
TrT = TO4-T
ThT = T
WT = TR-T
I
I,next-TO4
I
The outputs at times T
cannot refer to the input at time TI because the latter was not
O1,2
Transaction time
Think time
Wait time
retrieved until time TR.
The outputs at times T
can (but need not) refer to the input at time TI.
O3,4
Because the monitoring is performed in the BCAM transport system, no definite statement
can be made about the logical (application-specific) connection between the individual
inputs and outputs.
With dialog-oriented applications, each input is generally followed b y the associated output,
so the correct response times can be established.
SM2 interprets each message from a partner application to a BCAM application as an input
and each message from a BCAM application to a partner application as an output. No
distinction is made as to whether the communications partner of the BCAM application is a
data display terminal or an application in a partner system.
In order to restrict monitoring to individual connections, SM2 employs the BCAM application
name. SM2 assumes that the transmitter or receiver (data display terminal) has been
uniquely assigned to a specific application name.
There are some special applications for which this application name has not been defined.
Specific response time measurement by SM2 is not suitable for such cases, but the corresponding values are recorded in the total.
46 U3585-J-Z125-8-76
Page 47

SM2 monitoring programs RESPONSETIME
SHOW-FILE-ATTRIBUTES
30 :V:$ABCxxxxx.BEISP
54 :V:$ABCxxxxx.MAN.1
60 :V:$ABCxxxxx.MAN.2
60 :V:$ABCxxxxx.MAN.3
30 :V:$ABCxxxxx.MAN.4
30 :V:$ABCxxxxx.MAN.5
12 :V:$ABCxxxxx.MAN5.1
30 :V:$ABCxxxxx.MAN.6
51 :V:$ABCxxxxx.MAN.7
12 :V:$ABCxxxxx.MAN5.2
663 :V:$ABCxxxxx .SM2.MAN
:V: PUBLIC: 1 0= FILES. RES= 369, FREE= 164, REL= 153 PAGES
:V: PRIVATE: 1= FILES. RES= 663, FREE= 0, REL= 0 PAGES
Response time
as per def. 1
Response time
as per def. 2
Transaction
time
*
Wait times within the communications host and data transfer times cannot be taken into
consideration.
Example: Responses to a /SHOW-FILE-ATTRIBUTES command
The SM2 administrator can use the SET- or MODIFY-RESPONSETIME-PARAMETER
statement and the ADD-CONNECTION-SET statement to define global and connectionspecific monitoring parameters respectively.
Global parameters
If response times are recorded for specific categories (SCOPE=*CATEGORY), the calcu-
U3585-J-Z125-8-76 47
lation of means values per category only involves values which are below the maximum
corresponding bucket value. If no bucket-specific analysis is required, only one value is
required to determine the overflow limit. If more than one buc k et has been defined, values
below this limit are ignored as being irrelev ant, and the category assignment valid at the end
of interaction remains applicable
Using the parameter CONNECTION-NUMBER=<integer 1..8187>, the maximum number
of connections to be monitored is defined. Once this number is reached, response time
monitoring continues, in which case SM2 will react to any unrecorded interaction in the
following manner:
Page 48

RESPONSETIME SM2 monitoring programs
– The message "NOTE: CONNECTION NUMBER TOO LOW" will be issued in the SM2 output
report. Each of the RESPONSETIME screens (see description of the RESPONSETIME
report) will show the same message. The message is output only if no interactions were
recorded during the monitoring cycle in question.
– An indication to this effect will be given in the SM2 response record at the end of this
monitoring cycle.
– With SM2R1, the message SOME INTERACTIONS MISSED will be issued at the end
of the analysis. This message is output only if no interactions were recorded during the
analysis period in question.
The BUCKET parameters consists of a list of the maximum response, think,tr ansaction and
wait times, arranged in order of magnitude. The ranges defined in the specified lists apply
to all connection sets specified in the ADD-CONNECTION-SET statement.
<integer 1 .. 99999> is an integer which defines the limit value. The number of limit v alues
in this list implicitly determines the number of ranges. This may v ary from list to list, but five
limit values is the maximum. The last value in the list of ranges specifies the o v erflo w limit.
All monitored variables that exceed this limit v alue are included under the last value , but are
not included in the calculation of mean values given in the RESPONSETIME report.
Connection-specific parameters
The SM2 administrator can monitor the response time both globally, i.e. for all possible
connections, and for specific individual connections, connection g roups, or connection sets.
A connection is uniquely defined in the local the host by specifying the following objects:
– the name of an application
– the name of a partner
– the host name of the partner
– the type of connection
A connection group is understood as number of connections which are defined by specifying the objects listed above. The objects may be specified using a fully qualified name
(name), a partially qualified name (name*), or an unqualified name (*ALL). For example,
($DIALOG,*ALL,*ALL) defines a connection group which includes the $DIALOG application.
A connection set is understood as a combination of connection groups. It is defined by
specifying a list of up to five connection groups.
For example, (($DIALOG,*ALL,*ALL),(UTM1,*ALL,*ALL)) defines a connection set which
combines two connection groups with the $DIALOG and UTM1 applications.
48 U3585-J-Z125-8-76
Page 49

SM2 monitoring programs RESPONSETIME
This monitoring program supplies statistics for each connection set. In addition, the set of
all connections is monitored on an ongoing basis. When selecting which connections are to
be monitored, the SM2 administrator can define up to 15 connection sets. (*ALL,*ALL,*ALL)
is always set automatically as the additional connection set. Furthermore, the SM2 administrator must specify whether the selected connections are to be monitored or excluded
from monitoring using the *BY-CONNECTION or *EXCEPT -CONNECTION oper and of the
ADD-CONNECTION-SET statement. With *EXCEPT-CONNECTION, all connections
except for those in the specified connection groups are monitored.
The SM2 administrator can also specify the type of the connection. If *LOCAL is specified,
connections within the host are taken into account. This makes it possible to record the
response times for individual applications, even if it would normally appear to the system
that everything is running under the OMNIS carrier application.
Each defined connection set can consist of a maximum of five connection groups. The total
number of connection groups which can be defined is, in turn, limited to 15 at most.
Examples of the RESPONSETIME monitoring program
Example 1
SET-RESPONSETIME-PARAMETER
ADD-CONNECTION-SET SET-NAME=setname1,SET-DEFINITION=*BY-CONNECTION,
CONNECTION-SET=((utm1,*ALL,*ALL),(utm2,*ALL,*ALL),(utm3,t1,pr1))
ADD-CONNECTION-SET SET-NAME=setname2,SET-DEFINITION=*BY-CONNECTION,
CONNECTION-SET=(utm3,*ALL,*ALL),CONNECTION-TYPE=*BOTH,
ADD-CONNECTION-SET SET-NAME=setname3,SET-DEFINITION=*EXCEPT-CONNECTION,
CONNECTION-SET=((*ALL,termx*,*ALL),(omnis,*ALL,*ALL))
ADD-CONNECTION-SET SET-NAME=setname4,SET-DEFINITION=*EXCEPT-CONNECTION,
CONNECTION-SET=((utm1,*ALL,*ALL),(omnis,*ALL,*ALL),(apl1,t1,pr1))
START-MEASUREMENT-PROGRAM TYPE=*RESPONSETIME
The above statements are used to explicitly define four connection sets: the first by
specifying a list of three connection groups. These three connection groups are taken
as a whole. The second connection set takes account of local and remote connections.
All the other connection sets only take account of remote connections (ï default
setting). The third connection set defines all connections which are neither part of the
OMNIS application nor belong to a partner whose name begins with “termx”. The fourth
connection set combines all connections which belong to neither the UTM1 or OMNIS
application nor to the explicit connection (apl1,t1,pr1).
U3585-J-Z125-8-76 49
Page 50

SERVICETIME SM2 monitoring programs
Example 2
REMOVE-CONNECTION-SET SET-NAME=*ALL
MODIFY-RESPONSETIME-PARAMETER DEFINITION=*2
ADD-CONNECTION-SET SET-NAME=setname,SET-DEFINITION=*EXCEPT-CONNECTION,
CONNECTION-SET=($OMNIS,*ALL,*ALL)
CHANGE-MEASUREMENT-PROGRAM TYPE=*RESPONSETIME
The above statements terminate the RESPONSETIME monitoring program (apart from
*GLOBAL) and restart it, monitoring all connections with the exception of the $OMNIS
application. In addition, the response time as defined in definition 2 is monitored. All
other monitoring parameters from theresponse time monitoring process just terminated
are retained.
Example 3
SET-RESPONSETIME-PARAMETER CONNECTION-NUMBER=100,RESPONSETIME-BUCKETS=
(50,100,200),THINKTIME-BUCKETS=(50,100,150,200,250)
START-MEASUREMENT-PROGRAM TYPE=*RESPONSETIME
The SET-RESPONSETIME-PARAMETER statement is used to automatically define a
connection set with the name *GLOBAL; all connections in this set are monitored
(CONNECTION(*ALL,*ALL,*ALL)). In addition, here the number of connections is
limited to 100. Three limits (50,100,200) are set for the response time, and five limits
(50,100,150,200,250) for the think time. The transaction time and the wait time in the
BCAM pool are set to their default values.
SERVICETIME Monitored data on the service time
This monitoring program is used to carry out detailed monitoring of the service times of
individual devices. This applies, in particular, to systems using DCS (Dynamic Channel
Subsystem). For systems which do not hav e DCS, the service time is split up into the device
queue time and the remaining service time.
For systems with DCS, a more precise picture of the remaining service time can be
obtained. Information is output on the time from Start Subchannel to Start IO (function
pending time), the device queue time (further subdivided into the device connect time and
the device disconnect time), and the remaining service time (see definition in the glossary).
DCS does not support the detailed monitoring of devices on byte multiplexerchannels. F or
these devices, SM2 outputs the same monitored data as for systems which do not have
DCS.
In the case of systems with an incomplete DCS, SM2 outputs the same monitored data as
for systems which do not have DCS.
The monitored values are only output to the SM2 output file.
50 U3585-J-Z125-8-76
Page 51

SM2 monitoring programs SVC
In the case of processors with DCS in which there are several guest systems running under
VM2000, the SERVICETIME monitoring program can only be started by one of these guest
systems. Any attempts to start this function from a second guest system will be accepted
without an error message, but no DCS-specific monitored data will be returned. In general,
when using SHARED-DEVICES under VM2000, DCS-specific data will not be delivered by
any of the guest systems (see the "VM2000" manual [9]).
Note for SR2000
Information on device disconnect times cannot be supplied for devices connected to a bus.
SVC Monitored data on SVC calls
This monitoring program records all the SVC calls in the system.
The monitored data returned will be of interest only to performance specialists, since
detailed knowledge of the internal workings of the system is required to interpret it.
SYSSTAT
Global system and category-specific monitored data
This SM2 function provides information on important global system or category-specific
variables. The most important aspect of these variables is that they can be obtained using
event-driven methods . These monitored values mak e it possible to assign values which are
otherwise global by default (CPU, I/O) to individual categories, i.e. the category-related
share of the load can be determined. For precise determination of category dilation, the
SET-SYSSTAT-PARAMETER statement is required to include all devices in the monitoring
process. The queue statistics are automatically activated when the monitoring program is
started. The monitored data is written to the SM2 output file; some of the values are
displayed on screen in the CATEGORY report.
U3585-J-Z125-8-76 51
Page 52

TASK SM2 monitoring programs
TASK
Task-specific monitored data
The purpose of this function is to provide task-specific variables, from which the resource
requirements of individual tasks can be determined.
This data can be used for the following purposes:
– to determine which tasks most frequently use specific resources
– to optimize operation by relocating loads
– as input data for simulation models or analytic calculations.
SM2 writes this data to the SM2 output file, from which subsequent analysis is possible. As
with SM2 reports, data cannot be output during the monitoring process.
When defining the monitoring program, the tasks to be monitored must be specified. Both
user tasks and system tasks can be monitored.
SM2 can monitor both current tasks already executing or further tasks created in the course
of monitoring operations.
Monitoring information can be written to the SM2 output file at two points in time:
1. At task termination time, if the task is terminated during monitoring.
2. At monitoring termination time, if the task is still executing when the monitoring program
is terminated.
If the devices to be monitored are defined in the DEVICES operand of the SET-TASKPARAMETER statement, the number and service time of I/O operations for these devices
are output for each task according to whether they are hardware- or softw are-related. Due
to the time and effort involved in gathering this monitored data, this monitoring program
should only be used for brief periods of time (e.g. one hour) or for a small number of tasks.
For each task, it is possible to monitor up to 64 devices.
TCP-IP Monitored data on TCP/IP connections
This monitoring program provides information on TCP/IP connections.
52 U3585-J-Z125-8-76
Page 53

SM2 monitoring programs TLM
TLM Monitored data on locks
The TLM (TASK LOCK MANAGER) monitoring program records monitored data on locks
managed by the Task Lock Manager. The occupation and average queue length of each
lock are determined.
The monitored data returned will be of interest only to performance specialists, since
detailed knowledge of the internal workings of the system is required to interpret it.
UTM Monitored data on UTM applications
The UTM monitoring program records application-specific monitored data and outputs it to
the screen or to the SM2 output file. It can only generate monitored data if the following
conditions have been fulfilled:
– the UTM-SM2 subsystem is started
– the UTM applications are delivering data
– BS2000 Accounting is started (only for DB-specific user values).
For UTM versions < V5.0, the UTM-SM2 subsystem must be started manually before the
respective UTM application begins to deliver data.
As of UTM V5.0, the UTM-SM2 subsystem is started automatically.
The UTM application must be ready to deliver data to SM2.
In the KDCDEF run (operand MAX SM2=ON / OFF / NO), it is possible to influence the
transfer of monitored data.
– SM2=OFF (default setting)
No monitored data is delivered.
If you use the UTM administration interface with KDCAPPL and SM2=ON, the tr ansf er
of monitored data can be activated subsequently for each UTM application.
– SM2=ON
Data is delivered.
Additional administration is not required.
– SM2=NO
No data is delivered. It is not possible to start the transfer of data subsequently.
The settings for the transfer of monitored data are active only if the UTM-SM2 subsystem
has already been started (only applicable for UTM versions < V5.0).
U3585-J-Z125-8-76 53
Page 54

VM SM2 monitoring programs
DB-specific utilization figures (UDS and SESAM only) are only supplied if the following
conditions are met:
– BS2000 Accounting is active.
– The UTM accounting record UTMA is switched on (using the BS2000 command
MODIFY-ACCOUNTING-PARAMETERS SET-RECORD-TYPE=UTMA).
– UTM Accounting is switched on (using the KDCAPPL statement, parameter ACC=ON).
– Monitored-data acquisition is enabled in SESAM (using the statement
ACC,TP=ON,CPU).
More information on this subject can be found in the manual “UTM - Generating and Admin-
istering Applications” [10].
VM CPU shares of virtual machines
SM2 records the share of CPU time required by the various virtual machines of a VM2000
system. The monitoring program supplies information for all virtual machines on the VM1
monitoring system only. On all other VMs, only the values for the local VM are output. In
NATIVE mode, a message is output every time an attempt is made to start this monitoring
program.
54 U3585-J-Z125-8-76
Page 55

SM2 monitoring programs FILE
3.3 Nonprivileged SM2 monitoring programs
The following instructions must be heeded when using nonprivileged monitoring programs.
You should also refer to the descriptions of the corresponding privileged monitoring
programs for a better understanding of monitoring-program-specific features and variants.
FILE
Monitored data on file access
With this monitoring program, a user can only include files in the monitoring process if the
SM2 primary administrator has permitted the monitoring of file access values. This
permission can be granted either to all users or to users with certain IDs.
In this case, the SM2 MEASUREMENT STA TUS screen will ha v e the entry FILE in the line
entitled USER MEASUREMENTS ALLOWED.
Each authorized user can include and exclude files which are set up under his own ID. It is
also possible to include files which do not exist. Privileged users are not treated differently
from normal users.
The FILE statistics also contain the access times for files. The monitored time covers the
logical duration of I/O operations between start and end of a job from the point of view of
the software. For asynchronous I/O oper ations , this time can be consider ab ly g reater than
the hardware time.
Any monitored files are excluded from the monitoring process once SM2 is terminated.
All together, up to 16 files can be monitored b y this monitoring program; no values f or these
files are written to the SM2 output file.
ISAM Monitored data on ISAM pools
With this monitoring program, a user can only include ISAM pools in the monitoring process
if the SM2 primary administrator has permitted ISAM pool monitoring. This permission can
be granted either to all users or to users with certain IDs. In this case, the SM2
MEASUREMENT STATUS screen will have the entry ISAM in the line entitled USER
MEASUREMENTS ALLOWED.
Each authorized user can include or exclude global ISAM pools and all task-specific or
user-specific ISAM pools which have been created or are being created under his user ID.
U3585-J-Z125-8-76 55
Page 56

TASK SM2 monitoring programs
SM2 does not check whether an ISAM pool exists when a user tries to include it; in other
words an ISAM pool can be included in the monitoring process even before it has been
created. If an ISAM pool which has been included does not exist during the monitoring
cycle, all its monitored data will be listed with blanks. Since the total number of ISAM pools
that can be monitored by SM2 for nonprivileged users is limited to 16, care must be taken
not to unnecessarily include too many non-existent ISAM pools in the monitoring operations.
No values are written to the SM2 output file for ISAM pools monitored with the aid of this
monitoring program.
TASK
Task-specific monitored data
A user can start this monitoring program only if the primary SM2 administrator has
permitted user-specific task monitoring. This permission can be granted either to all users
or to users with certain IDs. In this case, the SM2 MEASUREMENT STATUS screen will
contain the entry TASK in the line entitled USER MEASUREMENTS ALLOWED.
With the /START-TASK-MEASUREMENT command, the user is then given the option of
including tasks under his/her own ID for monitoring by SM2. This task inf ormation is stored
in a user-specific SM2 output file and it can then be analyzed using the SM2-PA analysis
routine (see the "SM2-PA" manual [8]).
56 U3585-J-Z125-8-76
Page 57

4 SM2 operation
4.1 Starting and terminating SM2
4.1.1 Starting the program
SM2 is called with the following BS2000 command :
START-SM2
Format
START-SM2
VERSION = *STD / <product-version mandatory-man-corr> /
<product-version mandatory-man-without-corr> / <product-version without-man-corr>
,MONJV = *NONE / <filename 1..54 without-gen-vers>
,CPU-LIMIT = *JOB-REST / <integer 1..32767>
Operands
VERSION =
Specifies the version of SM2 to be called.
VERSION = *STD
The current version is called.
VERSION = <product-version>
The specified version is called.
U3585-J-Z125-8-76 57
Page 58

Starting and terminating SM2 SM2 operation
MONJV =
Specifies the name of the job variable to be monitored in the SM2 run. The job variable must
already be cataloged.
MONJV = *NONE
No job variable is specified.
MONJV = <filename 1..54 without-gen-vers>
Specifies the name of a job variable already cataloged.
CPU-LIMIT =
Specifies the CPU time required for the SM2 run. In interactive mode, the user is notified b y
the system if this time is exceeded. In batch mode, the SM2 run is terminated.
CPU-LIMIT = *JOB-REST
There is no limit on the CPU time available to the program.
CPU-LIMIT = <integer 1..32767>
Specifies the CPU time required for the SM2 run.
4.1.2 Terminating the program
SM2 is terminated using the END statement.
● The automatic output mode is terminated with the BREAK function. The END statement
is entered after returning to program mode (using /INFORM-PROGRAM).
● In controlled mode, END can be entered instead of an output control character just like
any other output statement.
SM2 acknowledges program termination with the message
SM2 TERMINATED NORMALLY.
Note
Monitored data acquisition is never terminated by the END statement. Termination of
the SM2 subsystem is only possible by explicitly issuing the command
/STOP-SUBSYSTEM SUBSYSTEM-NAME=SM2.
58 U3585-J-Z125-8-76
Page 59

SM2 operation Overview
4.2 Overview of SM2 operation
After the program load message, SM2 prompts you to enter statements.
Each caller (privileged or nonprivileged user, see section “Users” on page 12) is initially
taken to the analysis subinterval of SM2. Here the user can do the following:
– select monitored data for output on-screen
– control screen output
– output information on the monitoring process
In addition, the privileged user (SM2 call with the system privilege SW-MONITORADMINISTRATION) also has the option of using the CALL-ADMINISTRATION-PART
statement to change to the administration facility. Here the SM2 administrator can perform
the following administration tasks:
– define monitoring parameters
– activate/deactivate optional monitoring runs
– set up the SM2 output file
– assign privileges for nonprivileged users
– output information on the monitoring process
– specify a host for SM2 statements and reports (only applies for privileged users
themselves)
In order to be able to issue the statements used to control real-time monitoring, the privileged user must switch into the analysis subinterval (using the CALL-EVALUATION-PART
statement). In doing so, the privileged user defines his/her status as an SM2 administrator .
U3585-J-Z125-8-76 59
Page 60

Typical SM2 run SM2 operation
Typical SM2 run
Start SM2
SM2 monitoring task set up internally
(in first SM2 call during system run)
Switch to administration facility
Set monitoring cycle
Open SM2 output file
Start monitoring programs
Switch to analysis subinterval
Select online reports
During the monitoring cycle, data is
On completion of the monitoring cycle, data is
written to the central buffer and the SM2 file.
collected and formatted.
/START-SM2
CALL-ADMINISTRATION-PART
//MODIFY-MEASUREMENT-PERIODS
OFFLINE-PERIOD=<cycle>
//OPEN-LOG-FILE FILE=<filename>
//START-MEASUREMENT-PROGRAM
TYPE=<monitoring-program>
//CALL-EVALUATION-PART
REPORT <reportname>
SM2 output file
Start output of
online reports
Analyze SM2 output file
during SM2 run
Terminate SM2-ONLINE
Terminate monitored-data acquisition,
implicitly close SM2 output file,
and unload SM2
Analyze SM2 output file
after SM2 run
START
END
/STOP-SUBSYSTEM
SUBSYSTEM-NAME=SM2
60 U3585-J-Z125-8-76
Page 61

SM2 operation Statements for SM2 adminstrators
4.3 Statements for SM2 administrators
These statements are used by SM2 administrators to control data acquisition by SM2. The
statements for assigning authorizations to nonprivileged users and for admitting other SM2
administrators are only available to the SM2 primary administrator
Statements for switching between the analysis subinterval and the administration
facility
Statement Function
CALL-ADMINISTRATION-PART Switch from the analysis subinterval to the administration
facility
CALL-EVALUATION-PART Switch from the administration facility to the analysis
subinterval
Statements for defining monitoring programs
Some monitoring programs require you to specify which objects are to be monitored and
with what parameters. The ADD , REMO VE, SET and MODIFY statements are pro vided for
this purpose.
The ADD statements each define an object to be monitored by a particular monitoring
program. The REMOVE statements can be used to exclude a set of monitored objects,
defined with the aid of ADD statements, from the monitoring process. The SET statements
define a list of objects to be monitored or the monitoring parameters. The MODIFY statements can be used to modify the default values. The objects to be monitored or the
monitoring parameters defined using the statements listed above can be output using the
SHOW-DEFINED-PARAMETER statement. Monitoring of the defined objects does not
begin until the monitoring programs are started (using the START-MEASUREMENTPROGRAM statement) or restarted (using CHANGE-MEASUREMENT-PROGRAM).
The monitoring program definitions become active and can be output using the
SHOW-ACTIVE-PARAMETER statement.
U3585-J-Z125-8-76 61
Page 62

Statements for SM2 adminstrators SM2 operation
Statement Function
ADD-BCAM-CONNECTION-SET Add a connection set for BCAM-CONNECTION
monitoring
ADD-CONNECTION-SET Add a connection set (applications and partner
systems) for RESPONSETIME monitoring
ADD-COSMOS-EVENT Define events for monitored-data acquisition
ADD-FILE Define a file to be monitored
ADD-ISAM-POOL Define an ISAM pool to be monitored
MODIFY-COSMOS-PARAMETER Modify the parameters for COSMOS monitoring
MODIFY-RESPONSETIME- PARAMETER Modify the parameters for RESPONSETIME
monitoring
REMOVE-BCAM-CONNECTION-SET Exclude a connection set from BCAM-CONNECTION
monitoring
REMOVE-CONNECTION-SET Exclude a connection set from RESPONSETIME
monitoring
REMOVE-COSMOS-EVENT Remove events from the COSMOS monitoring param-
eters
REMOVE-FILE Remove file(s) from the FILE monitoring parameters
REMOVE-ISAM-POOL Remove ISAM pool(s) from the ISAM monitoring
parameters
SET-BCAM-CONNECTION-PARAMETER Define BCAM-CONNECTION monitoring parameters
SET-CHANNEL-IO-PARAMETER Define CHANNEL-IO monitoring parameters
SET-COSMOS-PARAMETER Define COSMOS monitoring parameters
SET-DISK-PARAMETER Define DISK monitoring parameters
SET-DISK-FILE-PARAMETER Define DISK-FILE monitoring parameters
SET-PERIODIC-TASK-PARAMETER Define PERIODIC-TASK monitoring parameters
SET-RESPONSETIME-PARAMETER Define RESPONSETIME monitoring parameters
SET-SERVICETIME-PARAMETER Define SERVICETIME monitoring parameters
SET-SYSSTAT-PARAMETER Define SYSTAT monitoring parameters
SET-TASK-PARAMETER Define TASK monitoring parameters
62 U3585-J-Z125-8-76
Page 63

SM2 operation Statements for SM2 adminstrators
Statements for preparing, starting, and stopping monitoring programs
Once you have defined the objects to be monitored, the monitoring program run can be
started. Certain preparations are recommended for the COSMOS monitoring program to
ensure that it starts quickly and without errors. After defining new monitored objects/
monitoring parameters, the monitoring program run must be stopped and then started
again in order to actually add the newly defined objects and parameters to the monitoring
program. The INITIATE, ST ART, CHANGE and STOP statements are used for this purpose.
Statement Function
INITIATE-COSMOS Prepare the COSMOS monitoring program
START-MEASUREMENT-PROGRAM Start the monitoring program run
CHANGE-MEASUREMENT-PROGRAM Stop the current monitoring program run and restart
it with new monitored objects/monitoring parameters
STOP-MEASUREMENT-PROGRAM Terminate the monitoring program run
The START statement is used to start the monitoring programs. The CHANGE statement
is required following the redefinition of monitored objects/monitoring parameters of the
monitoring program run in order to add the new objects/parameters to the monitoring
program. The monitoring program run is stopped and then started with the new monitored
objects/monitoring parameters. The STOP statement terminates the specified monitoring
programs.
The START , CHANGE and ST OP statements merely interrupt the current monitoring cycle.
Statements for opening and closing the SM2 output file and controlling monitoreddata acquisition
In addition to the output of reports on the screen, monitored data can be continuously
written to file. Creating the SM2 output file (OPEN-LOG-FILE) and closing it (CLOSE-LOGFILE) is a privilege reserved for SM2 administrators. The OPEN-LOG-FILE statement can
be used to modify the predefined SM2 file attributes.
The MODIFY-MEASUREMENT -PERIODS statement can be used to modify the monitoring
cycles for background monitoring (collecting and writing monitored data to the SM2 output
file), and to modify the screen output and the sampling cycle.
Statement Function
OPEN-LOG-FILE Open the SM2 output file
CLOSE-LOG-FILE Close the SM2 output file
MODIFY-MEASUREMENT-PERIODS Modify the SM2 monitoring cycle
U3585-J-Z125-8-76 63
Page 64

Statements for SM2 adminstrators SM2 operation
Statements for assigning privileges
At the beginning of the program, the nonprivileged user is not allowed to monitor tasks, files
or ISAM pools. But by using the MODIFY-USER-ADMISSION statement, the primary SM2
administrator can grant or withdraw permission for all BS2000 users to monitor tasks under
their own ID , files and ISAM pools. The MODIFY -ADMINISTRATOR-ADMISSION statement
allows the primary SM2 administrator to admit additional (secondary) administrators.
Statement Function
MODIFY-USER-ADMISSION Define authorizations for nonprivileged users
MODIFY-ADMINISTRATOR-ADMISSION Admit additional SM2 administrators
Statements for outputting information
The SHOW statements provide information on the monitoring status, the objects, and the
monitoring parameters for selected monitoring programs, as well as on the status of the
SM2 system tasks.
Statement Function
SHOW-MEASUREMENT-STATUS Output the monitoring status
SHOW-DEFINED-PARAMETER Output defined monitoring parameters
SHOW-ACTIVE-PARAMETER Output active monitoring parameters
SHOW-USER-MEASURED-OBJECTS Output monitored objects and associated users
SHOW-SM2-STATUS Output the status of SM2 system tasks
SHOW-SELECTED-HOSTS Output selected hosts
Statement for specifying hosts for administration statements and screen outputs
This statement is used to specify the hosts to which the SM2 administration statements
apply and for which the screens are to be output.
Statement Function
SELECT-HOSTS Define hosts for SM2 statements and screen output
64 U3585-J-Z125-8-76
Page 65

SM2 operation Statements for SM2 adminstrators
Statement for terminating the SM2 program
The END statement is used to terminate the SM2 session. However , monitoring operations
which have already been initiated are not affected, i.e. they continue to run.
Statement Function
END Terminate the SM2 run
The following sections describe the statements for SM2 administrators in alphabetical
order.
Notes
In all statements which allow you to use wildcard syntax, only the character * is supported
as the last character. All other constructs possible in SDF are rejected with a error message .
The internal program name for syntax validation in SM2 statements in EDT is SM2130.
U3585-J-Z125-8-76 65
Page 66

ADD-BCAM-CONNECTION-SET Statements for SM2 administrators
ADD-BCAM-CONNECTION-SET
Add connection set for BCAM-CONNECTION monitoring
Function
This statement is used to define a connection set which is to be added to the BCAMCONNECTION monitoring program definition.
The following features must be specified:
– the type of connection with local and partner (connection) names
– the names of the local and partner systems
– an indication of whether the connections are local or remote
It is possible to define up to 32 connection sets.
This statement must be preceded by a SET-BCAM-CONNECTION-PARAMETER
statement.
Format
ADD-BCAM-CONNECTION-SET
SET-NAME = <alphanum-name 1..16>
,CONNECTION-SELECTION = *BY-NEA-NAME(...) / *BY-PORT-NUMBER(...)
*BY-NEA-NAME(...)
CONNECTION-NAME = list-poss(16): *SPECIFIED(...)
*SPECIFIED(...)
LOCAL-APPLICATION = *ANY / <alphanum-name 1..8 with wild>
,PARTNER-APPLICATION = *ANY / <alphanum-name 1..8 with wild>
*BY-PORT-NUMBER(...)
PORT-NUMBER = list-poss(16): *SPECIFIED(...)
*SPECIFIED(...)
LOCAL-PORT-NUMBER = *ANY / <integer 1..65535>
,PARTNER-PORT-NUMBER = *ANY / <integer 1..65535>
,CONNECTION-TYPE = *REMOTE / *LOCAL / *BOTH
,HOST-SELECTION = *ANY / *SPECIFIED(...)
*SPECIFIED(...)
LOCAL-HOST-NAME = *LOCAL / <alphanum-name 1..8 with-wild>
,PARTNER-HOST-NAME = *ANY / <alphanum-name 1..8 with-wild>
66 U3585-J-Z125-8-76
Page 67

Statements for SM2 administrators ADD-BCAM-CONNECTION-SET
Operands
SET-NAME = <alphanum-name 1..16>
Defines a name for the selected connection set.
CONNECTION-SELECTION =
Defines the type of connection set to be monitored.
CONNECTION-SELECTION = *BY-NEA-NAME(...)
Defines a selection of connections in accordance with the application name.
CONNECTION-NAME = list-poss(16): *SPECIFIED(...)
LOCAL-APPLICATION = *ANY / <alphanum-name 1..8 with wild>
*ANY: No special local application is selected.
<alphanum-name 1..8>: Specifies the name of the selected local application.
An asterisk (*) is also permitted as the last character in a wildcard specification.
,PARTNER-APPLICATION = *ANY / <alphanum-name 1..8 with wild>
*ANY: No special partner application is selected.
<alphanum-name 1..8>: Specifies the name of the selected partner application.
An asterisk (*) is also permitted as the last character in a wildcard specification.
CONNECTION-SELECTION = *BY-PORT-NUMBER(...)
Defines a selection of connections in accordance with the port number.
PORT-NUMBER = list-poss(16): *SPECIFIED(...)
LOCAL-PORT-NUMBER = *ANY / <integer 1..65535>
*ANY: No special local transport address is selected.
<integer 1..65535>: Local transport address.
PARTNER-PORT-NUMBER = *ANY / <integer 1..65535>
*ANY: No special partner transport address is selected.
<integer 1..65535>: Partner transport address.
CONNECTION-TYPE =
Specifies the type of connection to be taken into consideration for the connection set.
CONNECTION-TYPE = *REMOTE
Only remote connections are taken into consideration.
CONNECTION-TYPE = *LOCAL
Only local connections are taken into consideration.
CONNECTION-TYPE = *BOTH
Both local and remote connections are taken into consideration.
U3585-J-Z125-8-76 67
Page 68

ADD-BCAM-CONNECTION-SET Statements for SM2 administrators
HOST-SELECTION =
Defines the names of the hosts between which the connections to be monitored should
exist.
HOST-SELECTION = *ANY
No special host name is selected.
HOST-SELECTION = *SPECIFIED(...)
LOCAL-HOST-NAME = *LOCAL / <alphanum-name 1..8 with-wild>
*LOCAL: The local host name should be used.
<alphanum-name 1..8>: Specifies the name of the local host. With some connections,
the local processor name may differ from the host name. An asterisk (*) is also
permitted as the last character in a wildcard specification.
PARTNER-HOST-NAME = *ANY / <alphanum-name 1..8 with-wild>
*ANY: No special partner host should be assumed.
<alphanum-name 1..8>: Specifies the name of the partner host. An asterisk (*) is also
permitted as the last character in a wildcard specification.
68 U3585-J-Z125-8-76
Page 69

Statements for SM2 administrators ADD-CONNECTION-SET
ADD-CONNECTION-SET
Add connection set for RESPONSETIME monitoring
Function
This statement is used to define a connection set which is to be added to the
RESPONSETIME monitoring program definition. A connection set consists of one or more
(as many as five) connection groups. The connection set can be either positively defined
(i.e. all groups specified in this connection set are monitored) or negatively defined (i.e . all
groups except those specified in the connection set are monitored). For each connection
set, a freely selectable name must be assigned; the name is the one under which this set
can be addressed in the REMOVE-CONNECTION-SET statement and also addressed by
SM2R1 for analysis purposes. If a connection set is defined, it is also possible to specify
whether remote, local or both types of connections are to be taken into account for the set.
SM2 then passes the correct parameter value to BCAM-SM2. This value then applies to this
connection set only.
This statement cannot be entered until after the SET-RESPONSETIME-PARAMETER
statement has been entered. The SET-RESPONSETIME-PARAMETER statement
automatically defines a connection set with the name *GLOBAL in which all connections are
monitored (*CONNECTION (*ALL,*ALL,*ALL)). The value CONNECTION-TYPE=
*REMOTE applies for this connection set and cannot be changed.
A total of 16 connection sets (*GLOBAL inclusions) may be defined with a total of 16
different connection groups ((*ALL,*ALL,*ALL) inclusion). If this number is exceeded, the
statement will be rejected and a message to this effect issued. If an attempt is made to
declare more than one set under one set name, the statement will be rejected and a
message will be issued.
U3585-J-Z125-8-76 69
Page 70

ADD-CONNECTION-SET Statements for SM2 administrators
Format
ADD-CONNECTION-SET
SET-NAME = <alphanum-name 1..16>
,SET-DEFINITION = *BY-CONNECTION / *EXCEPT-CONNECTION
,CONNECTION-SET = list-poss(5): *CONNECTION(...)
*CONNECTION(...)
APPLICATION = *ALL / <alphanum-name 1..8 with-wild>
,PARTNER = *ALL / <alphanum-name 1..8 with-wild>
,PROCESSOR = *ALL / <alphanum-name 1..8 with-wild>
,CONNECTION-TYPE = *REMOTE / *LOCAL / *BOTH
Operands
SET-NAME = <alphanum-name 1..16>
Defines a name for the selected connection set.
SET-DEFINITION =
Defines the connection set to be monitored.
SET-DEFINITION = *BY-CONNECTION
All connection groups defined in the connection set are monitored.
SET-DEFINITION = *EXCEPT-CONNECTION
All connection groups except those defined in the connection set are monitored.
CONNECTION-SET = list-poss(5): *CONNECTION(...)
Defines a selection of up to five connection groups.
APPLICATION = *ALL / <alphanum-name 1..8 with-wild>
*ALL: No special application is selected.
<alphanum-name 1..8>: Specifies the name of the selected application. An asterisk (*)
is also permitted as the last character in a wildcard specification.
PARTNER = *ALL / <alphanum-name 1..8 with-wild>
*ALL: No special partner is selected.
<alphanum-name 1..8>: Specifies the name of the selected partner. An asterisk (*) is
also permitted as the last character in a wildcard specification.
70 U3585-J-Z125-8-76
Page 71

Statements for SM2 administrators ADD-CONNECTION-SET
PROCESSOR = *ALL / <alphanum-name 1..8 with-wild>
*ALL: No special partner processor is selected.
<alphanum-name 1..8>: Specifies the name of the partner processor which has been
selected. An asterisk (*) is also permitted as the last character in a wildcard specification.
CONNECTION-TYPE =
Specifies the type of connection to be taken into consideration for the connection set.
CONNECTION-TYPE = *REMOTE
Only remote connections are taken into consideration.
CONNECTION-TYPE = *LOCAL
Only local connections are taken into consideration.
CONNECTION-TYPE = *BOTH
Both local and remote connections are taken into consideration.
Note
No application name is defined for applications that use the SOCKETS(BS2000) or
ICMX(BS2000) interface. Connections of these applications cannot be selected in SM2
using the ADD-CONNECTION-SET statement. They are contained in the *GLOBAL
connection set.
U3585-J-Z125-8-76 71
Page 72

ADD-COSMOS-EVENT Statements for SM2 administrators
ADD-COSMOS-EVENT
Define events for monitored-data acquisition
Function
This statement is used to define events which are to be added to theCOSMOS monitoring
program definition.
Format
ADD-COSMOS-EVENT
EVENT-NAME = *STANDARD-EVENTS / list-poss(67): *STANDARD-EVENTS / *ACF / *BCAM / *BCPT /
*BLS / *BOUR / *CHTM / *CMD / *CMS / *DAB / *DCAM / *DLM / *EIA / *EIA2 / *EIA3 /
*FITC / *GSAC / *HAL / *IDLE / *INTR / *IONQ / *ISEV / *ISPL / *KAI / *LOCK / *MSG / *NSM / *PAGE /
*PAM / *PCCC / *PCTC / *PDEA / *PEND / *PIO / *PMIO / *PRGS / *PRGT / *PRTY / *RELM /
*REQM / *SDV / *SLOT / *SNAP / *STD1 / *STDI / *STDN / *SVC / *TGMA / *TGMP / *TGMT /
*TINF / *TLM / *TLT / *TSKI / *TSVC / *UTM / *VMCH / *VMH / *VMI / *VMLK / *VMPD /
*VMPR / *VMS / *VM2 / *WSCT / *XEIA
Operands
EVENT-NAME =
Specifies the name of the events to be recorded.
EVENT-NAME = *STANDARD-EVENTS
The following events are to be recorded by default: ACF, BLS, BOUR, CHTM, CMS, DAB,
EIA2, EIA3, FITC, IDLE, INTR, IONQ, PAGE, PAM, PCCC, PCTC, PEND, PMIO, PRGS,
PRGT, RELM, REQM, SDV, SVC, TSKI, TSVC, WSCT.
EVENT-NAME = list-poss(67): *STANDARD-EVENTS / *ACF / *BCAM / *BCPT /
*BLS / *BOUR / *CHTM / *CMD / *CMS / *DAB / *DCAM / *DLM / *EIA / *EIA2 / *EIA3 /
*FITC / *GSAC / *HAL / *IDLE / *INTR / *IONQ / *ISEV / *ISPL / *KAI / *LOCK / *MSG /
*NSM / *PAGE / *PAM / *PCCC / *PCTC / *PDEA / *PEND / *PIO / *PMIO / *PRGS /
*PRGT / *PRTY / *RELM / *REQM / *SDV / *SLOT / *SNAP / *STD1 / *STDI / *STDN /
*SVC / *TGMA / *TGMP / *TGMT / *TIC / *TINF / *TLM / *TLT / *TSKI / *TSVC / *UTM /
*VMCH / *VMH / *VMI / *VMLK / *VMPD / *VMPR / *VMS / *VM2 / *WSCT / *XEIA
The events specified in the list are to be recorded. The mandatory events CREA, DEST,
INIT, LGON, MMRC, PTSK and STAT are always recorded.
72 U3585-J-Z125-8-76
Page 73

Statements for SM2 administrators ADD-FILE
ADD-FILE
Define file to be monitored
Function
This statement is used to define a file which is to be added to the FILE monitoring program
definition. This monitoring program allows you to define up to 16 files f or monitoring. If this
number is exceeded, the statement is rejected and a corresponding message is issued.
Format
ADD-FILE
FILE-NAME = <filename 1..54>
Operands
FILE-NAME = <filename 1..54>
Name of the file whose access values are to be monitored. The file name must be specified
as a fully qualified name.
U3585-J-Z125-8-76 73
Page 74

ADD-ISAM-POOL Statements for SM2 administrators
ADD-ISAM-POOL
Define ISAM pool to be monitored
Function
This statement is used to define an ISAM pool which is to be added to the ISAM monitoring
program definition. This monitoring program allows you to define up to 16 ISAM pools for
monitoring. If this number is exceeded, the statement is rejected and a message is issued.
Format
ADD-ISAM-POOL
POOL-NAME = <alphanum-name 1..8>
,SCOPE = *HOST-SYSTEM / *TASK(...) / *USER(...)
*TASK(...)
TSN = <alphanum-name 1..4>
*USER(...)
USER-ID = <alphanum-name 1..8>
,CAT-ID = *HOME-PVS / <catid 1..4>
Operands
POOL-NAME = <alphanum-name 1..8>
Specifies the name of the ISAM pool to be monitored.
SCOPE =
Defines the type of ISAM pool.
SCOPE = *HOST-SYSTEM
The pool here is a global ISAM pool.
SCOPE = *TASK(...)
The pool here is a task-specific ISAM pool.
TSN = <alphanum-name 1..4>
Specifies the TSN of the task under which the task-specific ISAM pool was set up.
74 U3585-J-Z125-8-76
Page 75

Statements for SM2 administrators ADD-ISAM-POOL
SCOPE = *USER(...)
The pool is a user-specific ISAM pool.
USER-ID = <alphanum-name 1..8>
Specifies the user ID under which the ISAM pool was set up. This must be specified
without the “$” sign.
CAT-ID =
Specifies the catalog ID of the public volume set to which the ISAM pool has been assigned.
The user ID must be specified without the “$” sign.
CAT-ID = *HOME-PVS
The ID here is the catalog ID of the home pubset.
CAT-ID = <cat-id 1..4>
Catalog ID of the public volume set to which the ISAM pool has been assigned.
U3585-J-Z125-8-76 75
Page 76

CALL-ADMINISTRATION-PART Statements for SM2 administrators
CALL-ADMINISTRATION-PART
Switch from evaluation part to administration facility
Function
This statement is used to switch from the ev aluation part to the administration facility, which
provides an SDF statement interface.
To switch back to the analysis subinterval, use the CALL-EVALUATION-PART command.
Format
CALL-ADMINISTRATION-PART
76 U3585-J-Z125-8-76
Page 77

Statements for SM2 administrators CALL-EVALUATION-PART
CALL-EVALUATION-PART
Switch from administration facility to evaluation part
Function
This statement is used to switch from the administration facility to the evaluation part, i.e.
after this statement is entered all statements required for online analysis can be entered. To
switch back to SDF statement mode for administration purposes, use the CALL-ADMINISTRATION-PART command.
Format
CALL-EVALUATION-PART
U3585-J-Z125-8-76 77
Page 78

CHANGE-MEASUREMENT-PROGRAM Statements for SM2 administrators
CHANGE-MEASUREMENT-PROGRAM
Stop current monitoring program run and restart it with new
monitored objects
Function
This statement is used to stop the current monitoring program run and restart it using newly
defined monitored objects/monitoring parameters. The current monitoring cycle is interrupted.
Format
CHANGE-MEASUREMENT-PROGRAM
TYPE = list-poss(12): *BCAM-CONNECTION / *CHANNEL-IO / *COSMOS / *DISK / *DISK-FILE / *FILE /
*ISAM / *PERIODIC-TASK / *RESPONSETIME / *SERVICETIME / *SYSSTAT / *TASK
Operands
TYPE =
Specifies the type of monitoring program (the descriptions below are in alphabetical order)
to be restarted using the modified monitored objects/monitoring parameters.
TYPE = *BCAM-CONNECTION
The BCAM-CONNECTION monitoring program is restarted with new monitoring parameters or connection sets.
TYPE = *CHANNEL-IO
The CHANNEL-IO monitoring program is restarted with a new range of channels.
TYPE = *COSMOS
The COSMOS monitoring program is restarted with a new scope.
TYPE = *DISK
The DISK monitoring program is restarted with a new range of disks.
TYPE = *DISK-FILE
The DISK-FILE monitoring program is restarted with a new range of disks.
TYPE = *FILE
The FILE monitoring program is restarted with a new range of files.
78 U3585-J-Z125-8-76
Page 79

Statements for SM2 administrators CHANGE-MEASUREMENT-PROGRAM
TYPE = *ISAM
The ISAM monitoring program is restarted with a new range of ISAM pools.
TYPE = *PERIODIC-TASK
The PERIODIC-TASK monitoring program is restarted with a new range of tasks.
TYPE = *RESPONSETIME
The RESPONSETIME monitoring program is restarted with a new set of parameters or a
new range of connection sets.
TYPE = *SERVICETIME
The SERVICETIME monitoring program is restarted with a new range of devices.
TYPE = *SYSSTAT
The SYSTAT monitoring program is restarted with a new range of devices.
TYPE = *TASK
The TASK monitoring program is restarted with a new set of TSNs or a new range of
devices.
Note
Even if errors are detected when processing the CHANGE statement before the
monitoring programs are stopped, the monitoring programs continue to ex ecute. If, after
stopping the program, errors are detected when restarting the monitoring programs, the
monitoring programs specified in the statement will still be stopped.
U3585-J-Z125-8-76 79
Page 80

CLOSE-LOG-FILE Statements for SM2 administrators
CLOSE-LOG-FILE
Close SM2 output file
Function
This statement is used to close an SM2 output file. The current monitoring cycle is interrupted.
Format
CLOSE-LOG-FILE
Note:
When the SM2 output file is closed, all monitoring programs are stopped and the
monitored data is written exclusively to the SM2 output file (see table “Overview of the
SM2 monitoring programs” on page 34).
80 U3585-J-Z125-8-76
Page 81

Statements for SM2 administrators END
END Terminate SM2 run
Function
This statement is used to terminate SM2 administration. All current measurements are
continued using the currently defined monitoring parameters. This is also the case if no
further user is working with SM2. The only way to terminate SM2 along with the privileged
system tasks is to issue the DSSM command /STOP-SUBSYSTEM SUBSYSTEMNAME=SM2.
Format
END
U3585-J-Z125-8-76 81
Page 82

INITIATE-COSMOS Statements for SM2 administrators
INITIATE-COSMOS Prepare COSMOS monitoring program
Function
The COSMOS monitoring program is fully initiated (prepared), but no ev ents are recorded
yet - not ev en mandatory events . This statement is used to ensure to a large extent that the
COSMOS monitoring program subsequently starts without errors and quickly (without
mount messages).
Format
INITIATE-COSMOS
82 U3585-J-Z125-8-76
Page 83

Statements for SM2 administrators MODIFY-ADMINISTRATOR-ADMISSION
MODIFY-ADMINISTRATOR-ADMISSION
Admit additional SM2 administrators
Function
This statement is used by the SM2 primary administrator to admit additional secondary
administrators.
Format
MODIFY-ADMINISTRATOR-ADMISSION
CONCURRENCY = *NO / *YES
Operands
CONCURRENCY =
Specifies whether additional SM2 administrators are to be admitted.
CONCURRENCY = *NO
No additional SM2 administrators are to be admitted.
CONCURRENCY = *YES
Additional administrators are admitted. These administrators are allowed to e xecute all SM2
statements with the exception of MODIFY-ADMINISTRATOR-ADMISSION and MODIFYUSER-ADMISSION.
U3585-J-Z125-8-76 83
Page 84

MODIFY-COSMOS-PARAMETER Statements for SM2 administrators
MODIFY-COSMOS-PARAMETER
Modify parameters for COSMOS monitoring
Function
This statement is used to modify the COSMOS monitoring program definition.
It is useful when the SHOW -DEFINED-PARAMETER statement finds parameters that have
to be modified.
Format
(part 1 of 2)
MODIFY-COSMOS-PARAMETER
TITLE = *UNCHANGED / <c-string 1..80>
,BUFFER-SIZE = *UNCHANGED / <integer 1..7>
,NUMBER-OF-BUFFERS = *UNCHANGED / <integer 2..128>
,ADDITIONAL-INFO = *UNCHANGED / *NONE / list-poss(2): *CONFIGURATION / *VM2000(...)
*VM2000(...)
FILE-NAME = <filename 1..54 without-gen-vers>
,OUTPUT = *UNCHANGED / *DISK(...) / *WRAP-AROUND(...) / *TAPE(...) / *STREAM-TAPE(...)
*DISK(...)
FILE-NAME = list-poss(16): <filename 1..54 without-gen-vers>
*WRAP-AROUND(...)
FILE-NAME = <filename 1..54 without-gen-vers>
*TAPE(...)
FILE-NAME = list-poss(16): <filename 1..54 without-gen-vers>
*STREAM-TAPE(...)
FILE-NAME = list-poss(16): <filename 1..54 without-gen-vers>
Continued ➠
84 U3585-J-Z125-8-76
Page 85

Statements for SM2 administrators MODIFY-COSMOS-PARAMETER
(part 2 of 2)
,TASK-SELECTION = *UNCHANGED / *ALL / *SPECIFIED(...)
*SPECIFIED(...)
,JOB-NAME = *NOT-SPECIFIED / list-poss(8): <alphanum-name 1..8 with-wild>
,CATEGORY = *NOT-SPECIFIED / list-poss(8): <alphanum-name 1..7 with-wild>
,USER-ID = *NOT-SPECIFIED / list-poss(8): <alphanum-name 1..8 with-wild>
TSN = *NOT-SPECIFIED / list-poss(16): <alphanum-name 1..4 with-wild>
,TYPE = *NOT-SPECIFIED / list-poss(4): *SYSTEM / *DIALOG / *BATCH / *TP
,EVENT-SELECTION = *UNCHANGED / *ALL-BY-ADD-COSMOS-EVENT / *SPECIFIED(...)
*SPECIFIED(...)
EIA-INTERRUPT-CLASS = *UNCHANGED / *ANY / list-poss(5): *SVC / *PROGRAM /
*MACHINE-CHECK / *IO / *EXTERNAL
,EIA-SVC-NUMBER = *UNCHANGED / *ANY / list-poss(8): <integer 1..255>
,IO-DEVICE = *UNCHANGED / *ANY / list-poss(8): <alphanum-name 2..4>
,DAB-CACHE-ID = *UNCHANGED / *ANY / list-poss(8): <alphanum-name 1..32>
,MEMORY-CLASS = *UNCHANGED / *ANY / list-poss(4): *3 / *4 / *5 / *6
,SLOT-MEMORY-CLASS = *UNCHANGED / *ANY / list-poss(4): *3 / *4 / *5 / *6
,PEND-CODE = *UNCHANGED / *ANY / list-poss(16): <integer 1..22>
,LOCK-ID = *UNCHANGED / *ANY / list-poss(4): <alphanum-name 1..2>
,TLT-DESCRIPTOR = *UNCHANGED / *ANY / list-poss(8): <alphanum-name 1..3>
,TSKI-SWITCH = *UNCHANGED / *ANY / *TASK
,TSVC-SVC-NUMBER = *UNCHANGED / *ANY / list-poss(8): <integer 1..255>
,UNLOAD = *UNCHANGED / *AT-MEASUREMENT-PROGRAM-STOP / *AT-SM2-STOP
,MEASUREMENT-TIME = *UNCHANGED / *NOT-SPECIFIED / <integer 1..60>
Operands
TITLE =
Specifies the title of the COSMOS monitoring process.
TITLE = *UNCHANGED
The currently specified title is not changed.
TITLE = <c-string 1..80>
The specified title is assigned.
BUFFER-SIZE =
Specifies the number of 4K pages per buffer.
U3585-J-Z125-8-76 85
Page 86

MODIFY-COSMOS-PARAMETER Statements for SM2 administrators
BUFFER-SIZE = *UNCHANGED
The currently specified number of pages per buffer is not changed.
BUFFER-SIZE = <integer 1..7>
Buffers of the specified size (number of pages) are created.
NUMBER-OF-BUFFERS =
Specifies the number of buffers.
NUMBER-OF-BUFFERS = *UNCHANGED
The currently specified number of buffers is not changed.
NUMBER-OF-BUFFERS = <integer 2..128>
COSMOS creates the specified number of buffers for writing events.
ADDITIONAL-INFO =
Specifies additional data to be recorded.
ADDITIONAL-INFO = *UNCHANGED
The existing data specified for ADDITIONAL-INFO is not changed.
ADDITIONAL-INFO = *NONE
No additional data is recorded.
ADDITIONAL-INFO = *CONFIGURATION
The configuration at the start of monitoring is also recorded.
ADDITIONAL-INFO = *VM2000(...)
The VM2000 events are also recorded. For this purpose, they must be explicitly opened
(ADD-COSMOS-EVENT statement).
FILE-NAME = <filename 1..54 without-gen-vers>
Specifies the name of the file to which the VM2000 events are written.
OUTPUT =
Specifies how the COSMOS output files are written.
OUTPUT = *UNCHANGED
The currently specified value for OUTPUT is not changed.
OUTPUT = *DISK(...)
The COSMOS monitoring data is written sequentially to the files on hard disk; i.e. there is
a write task for each output file. If a monitoring data buffer is full, a write task is activated
that writes the buffer to the corresponding file.
FILE-NAME = list-poss(16): <filename 1..54 without-gen-vers>
Specifies the file(s) to which the COSMOS monitored data is written.
86 U3585-J-Z125-8-76
Page 87

Statements for SM2 administrators MODIFY-COSMOS-PARAMETER
OUTPUT = *WRAP-AROUND(...)
COSMOS monitored data is written to a file on disk. If the disk space allocated (PRIMARYALLOCATION) is insufficient, the file is overwritten from the top. The secondary allocation
(SECONDARY-ALLOCATION) must be set to zero.
FILE-NAME = <filename 1..54 without-gen-vers>
Specifies the file to which COSMOS monitored data is written.
OUTPUT = *TAPE(...)
The COSMOS monitored data is written sequentially to the files on tape (works as
described for OUTPUT=*DISK).
FILE-NAME = list-poss(16): <filename 1..54 without-gen-vers>
Specifies the file(s) to which COSMOS monitored data is written.
OUTPUT = *STREAM-TAPE(...)
The COSMOS output files are written in streaming mode. This reduces the chances of
events not being recorded, because the files are written to the tape continuously without
any repositioning of the tape.
FILE-NAME = list-poss(16): <filename 1..54 without-gen-vers>
Specifies the file(s) to which COSMOS monitored data is written.
TASK-SELECTION =
Specifies the tasks to be monitored.
TASK-SELECTION = *UNCHANGED
The current selection of tasks to be monitored is not changed.
TASK-SELECTION = *ALL
All tasks are monitored.
TASK-SELECTION = *SPECIFIED(...)
Specifies the tasks to be monitored by means of their TSN, user ID, job name, category or
type.
JOB-NAME =
The tasks are selected by means of their job name. An asterisk (*) is also permitted as
the last character in a wildcard specification.
JOB-NAME = *NOT-SPECIFIED
No tasks are selected by means of their job name.
JOB-NAME = list-poss(8): <alphanum-name 1..8 with-wild>
Specifies the job names of the tasks to be monitored.
U3585-J-Z125-8-76 87
Page 88

MODIFY-COSMOS-PARAMETER Statements for SM2 administrators
CATEGORY =
The tasks are selected by means of their category. An asterisk (*) is also permitted as
the last character in a wildcard specification.
CATEGORY = *NOT-SPECIFIED
No tasks are selected by means of their category.
CATEGORY = list-poss(8): <alphanum-name 1..7 with-wild>
Specifies the categories of the tasks to be monitored.
USER-ID =
The tasks are selected by means of their user ID.
USER-ID = *NOT-SPECIFIED
No tasks are selected by means of their user ID.
USER-ID = list-poss(8): <alphanum-name 1..8 with-wild>
Specifies the user IDs of the tasks to be monitored. These must be specified without
the “$” sign. An asterisk (*) is also permitted as the last character in a wildcard specification.
TSN =
The tasks are selected by means of their TSN. An asterisk (*) is also permitted as the
last character in a wildcard specification.
TSN = *NOT-SPECIFIED
No tasks are selected by means of their TSN.
TSN = list-poss(16): <alphanum-name 1..4 with-wild>
Specifies the TSNs of the tasks to be monitored.
TYPE =
The tasks are selected by means of their type. An asterisk (*) is also permitted as the
last character in a wildcard specification.
TYPE = *NOT-SPECIFIED
No tasks are selected by means of their type.
TYPE = *SYSTEM
All system tasks are to be monitored.
TYPE = *DIALOG
All interactive tasks are to be monitored.
TYPE = *BATCH
All batch tasks are to be monitored.
TYPE = *TP
All TP tasks are to be monitored.
88 U3585-J-Z125-8-76
Page 89

Statements for SM2 administrators MODIFY-COSMOS-PARAMETER
EVENT-SELECTION =
Specifies the events to be recorded. Their recording is linked to specific conditions.
EVENT-SELECTION = *UNCHANGED
The existing values for EVENT-SELECTION are not changed.
EVENT-SELECTION = *ALL-BY-ADD-COSMOS-EVENT
All open events are recorded.
EVENT-SELECTION = *SPECIFIED(...)
Only those events that satisfy the specified conditions are recorded.
EIA-INTERRUPT-CLASS =
Controls the recording of EIA events on the basis of their interrupt class (IC).
EIA-INTERRUPT-CLASS = *UNCHANGED
The currently specified ICs are not changed.
EIA-INTERRUPT-CLASS = *ANY
The recording of EIA events is independent of their IC.
EIA-INTERRUPT-CLASS = list-poss(5): *SVC / *PROGRAM /
*MACHINE-CHECK / *IO / *EXTERNAL
Only those EIA events with the specified IC are recorded.
EIA-SVC-NUMBER =
Controls the recording of EIA events on the basis of their SVC.
EIA-SVC-NUMBER = *UNCHANGED
The currently specified SVCs are not changed.
EIA-SVC-NUMBER = *ANY
The recording of EIA events is independent of their SVC.
EIA-SVC-NUMBER = list-poss(8): <integer 1..255>
Only those EIA events with the specified SVC(s) are recorded.
IO-DEVICE =
Controls the recording of SDV, CHTM, IONQ and PMIO events on the basis of their
mnemonic device name.
IO-DEVICE = *UNCHANGED
The currently specified mnemonic device names are not changed.
IO-DEVICE = *ANY
The recording of SDV, CHTM, IONQ and PMIO events is independent of their
mnemonic device name.
IO-DEVICE = list-poss(8): <alphanum-name 2..4>
Only those SDV, CHTM, IONQ and PMIO events with the specified mnemonic device
names are recorded.
U3585-J-Z125-8-76 89
Page 90

MODIFY-COSMOS-PARAMETER Statements for SM2 administrators
DAB-CACHE-ID =
Controls the recording of DAB events on the basis of their DAB cache IDs.
DAB-CACHE-ID = *UNCHANGED
The currently specified DAB cache IDs are not changed.
DAB-CACHE-ID = *ANY
The recording of DAB events is independent of their DAB cache IDs.
DAB-CACHE-ID = list-poss(8): <alphanum-name 1..32>
Only those DAB events with the specified DAB cache IDs are recorded.
MEMORY-CLASS =
Controls the recording of RELM and REQM events on the basis of their memory class.
MEMORY-CLASS = *UNCHANGED
The currently specified memory classes for RELM and REQM events are not changed.
MEMORY-CLASS = *ANY
The recording of RELM and REQM events is independent of their memory class.
MEMORY-CLASS = list-poss(4): *3 / *4 / *5 / *6
Only those RELM and REQM events with the specified memory classes are recorded.
SLOT-MEMORY-CLASS =
Controls the recording of SLOT events on the basis of their memory class.
SLOT-MEMORY-CLASS = *UNCHANGED
The currently specified memory classes for SLOT events are not changed.
SLOT-MEMORY-CLASS = *ANY
The recording of SLOT events is independent of their memory class.
SLOT-MEMORY-CLASS = list-poss(4): *3 / *4 / *5 / *6
Only those SLOT events with the specified memory classes are recorded.
PEND-CODE =
Controls the recording of PEND events on the basis of their pend code.
PEND-CODE = *UNCHANGED
The currently specified pend codes are not changed.
PEND-CODE = *ANY
The recording of PEND events is independent of their pend code.
PEND-CODE = list-poss(16): <integer 1..22>
Only those PEND events with the specified pend code are recorded.
LOCK-ID =
Controls the recording of LOCK events on the basis of their lock ID.
90 U3585-J-Z125-8-76
Page 91

Statements for SM2 administrators MODIFY-COSMOS-PARAMETER
LOCK-ID = *UNCHANGED
The currently specified lock IDs are not changed.
LOCK-ID = *ANY
The recording of LOCK events is independent of their lock ID.
LOCK-ID = list-poss(4): <alphanum-name 1..2>
Only those LOCK events with the specified lock IDs are recorded.
TLT-DESCRIPTOR =
Controls the recording of TLT on the basis of their TLT descriptor (TLT = T ask Location
Table).
TLT-DESCRIPTOR = *UNCHANGED
The currently specified values for the TLT descriptor are not changed.
TLT-DESCRIPTOR = *ANY
The recording of TLT events is independent of their TLT descriptor.
TLT-DESCRIPTOR = list-poss(8): <alphanum-name 1..3>
Only those TLT events with the specified TLT descriptors are recorded.
TSKI-SWITCH =
Controls the recording of TSKI events on the basis of their TIC (Task in Control).
TSKI-SWITCH = *UNCHANGED
The currently specified value for TSKI-SWITCH is not changed.
TSKI-SWITCH = *ANY
The recording of TSKI events is independent of their TIC.
TSKI-SWITCH = *TASK
Only the first TSKI event of a TIC is recorded.
TSVC-SVC-NUMBER =
Controls the recording of TSVC events on the basis of their SVC numbers.
TSVC-SVC-NUMBER = *UNCHANGED
The currently specified SVC numbers are not changed.
TSVC-SVC-NUMBER = *ANY
The recording of TSVC events is independent of their SVC number.
TSVC-SVC-NUMBER = list-poss(8): <integer 1..255>
The TSVC events are recorded for the specified SVC numbers.
UNLOAD =
Specifies the time at which the COSMOS subsystem is to be unloaded.
UNLOAD = *UNCHANGED
The currently specified value is not changed.
U3585-J-Z125-8-76 91
Page 92

MODIFY-COSMOS-PARAMETER Statements for SM2 administrators
UNLOAD = *AT-MEASUREMENT-PROGRAM-STOP
The COSMOS subsystem is unloaded at the end of COSMOS monitoring.
UNLOAD = *AT-SM2-STOP
The COSMOS subsystem is unloaded at the end of SM2 monitoring.
MEASUREMENT-TIME =
Specifies the duration of the monitoring process.
MEASUREMENT-TIME = *UNCHANGED
The currently specified duration is not changed.
MEASUREMENT-TIME = *NOT-SPECIFIED
Monitoring is terminated by the user with the STOP-MEASUREMENT-PROGRAM
statement.
MEASUREMENT-TIME = <integer 1..60>
Specifies the time in minutes after which monitoring is to be terminated automatically.
92 U3585-J-Z125-8-76
Page 93

Statements for SM2 administrators MODIFY-MEASUREMENT-PERIODS
MODIFY-MEASUREMENT-PERIODS
Modify SM2 monitoring cycle
Function
This statement is used to modify the SM2 time periods which control the cyclical acquisition
of SM2 monitored data.
Format
MODIFY-MEASUREMENT-PERIODS
OFFLINE-PERIOD = *UNCHANGED / <integer 10..3600>
,ONLINE-PERIOD = *UNCHANGED / *SAME-AS-OFFLINE / <integer 10..3600>
,SAMPLING-PERIOD = *UNCHANGED / <integer 200..10000>
Operands
OFFLINE-PERIOD =
Specifies the SM2 monitoring cycle during which monitored data is collected and written to
a file.
OFFLINE-PERIOD = *UNCHANGED
The monitoring cycle defined here remains unchanged. At the time the program started this
value was defined as 150 seconds.
OFFLINE-PERIOD = <integer 10..3600>
Defines the SM2 monitoring cycle in seconds.
ONLINE-PERIOD =
Specifies the SM2 monitoring cycle during which the monitored data is collected for screen
output and then displayed. The cycle of the background monitoring operations (namely
gathering and writing the monitored data to the SM2 output file) is not changed.
ONLINE-PERIOD = *UNCHANGED
The online cycle remains unchanged. At program start time, this value is set to *SAME-ASOFFLINE, i.e. no separate online cycle is defined.
U3585-J-Z125-8-76 93
Page 94

MODIFY-MEASUREMENT-PERIODS Statements for SM2 administrators
ONLINE-PERIOD = *SAME-AS-OFFLINE
The online cycle is the same as for background monitoring. This setting is the optimum
setting for internal management of data. If the online cycle is not required for a longer period
of time, this offline setting is selected.
ONLINE-PERIOD = <integer 10..3600>
Defines an online cycle in seconds.
Note
If the same value is selected for OFFLINE-PERIOD and ONLINE-PERIOD, this is not
the equivalent of "ONLINE-PERIOD = *SAME-AS-OFFLINE". What is does mean is
that internally separate buffers are maintained and provided with data. For reasons
relating to the system load, such a parameter setting should be avoided.
SAMPLING-PERIOD =
Changes the sampling cycle during which samples are taken of some of the SM2 monitored
variables.
SAMPLING-PERIOD = *UNCHANGED
The sampling cycle remains unchanged. At program start time, this value is set to 800 milliseconds.
SAMPLING-PERIOD = <integer 200..10000>
Defines a sampling cycle in milliseconds. Values which are entered are rounded down to
multiples of 100 (milliseconds).
94 U3585-J-Z125-8-76
Page 95

Statements for SM2 administrators MODIFY-RESPONSETIME-PARAMETER
MODIFY-RESPONSETIME-PARAMETER
Modify parameters for RESPONSETIME monitoring
Function
This statement is used to modify the RESPONSETIME monitoring program definition.
Format
MODIFY-RESPONSETIME-PARAMETER
SCOPE = *UNCHANGED / list-poss(2): *BUCKET / *CATEGORY
,DEFINITION = *UNCHANGED / *1 / *2
,CONNECTION-NUMBER = *UNCHANGED / <integer 1..8187>
,RESPONSETIME-BUCKETS = *UNCHANGED / *STD-LIMITS / list-poss(5): <integer 1..99999>
,THINKTIME-BUCKETS = *UNCHANGED / *STD-LIMITS / list-poss(5): <integer 1..99999>
,TRANSACTTIME-BUCKETS = *UNCHANGED / *STD-LIMITS / list-poss(5): <integer 1..99999>
,WAITTIME-BUCKETS = *UNCHANGED / *STD-LIMITS / list-poss(5): <integer 1..99999>
Operands
SCOPE =
Defines whether recording of the response time data is to be bucket-specific or categoryspecific.
SCOPE = *UNCHANGED
The scope defined by this time will not be changed.
SCOPE = *BUCKET
The response time data is to be recorded based on buckets.
SCOPE = *CATEGORY
The response time data is to be recorded based on categories.
U3585-J-Z125-8-76 95
Page 96

MODIFY-RESPONSETIME-PARAMETER Statements for SM2 administrators
DEFINITION =
Defines the type of response time to be monitored.
DEFINITION = *UNCHANGED
The type of response time defined by this time will not be changed.
DEFINITION = *1
The response time valid is the period between user input and the first relevant output.
DEFINITION = *2
In addition to theresponse time defined by the value 1, the periods between output f ollowing
any entry are output individually as response times.
CONNECTION-NUMBER =
Specifies the maximum number of connections to be monitored.
CONNECTION-NUMBER = *UNCHANGED
The number of connections defined at this time for response time statistics remains
unchanged.
CONNECTION-NUMBER = <integer 1..8187>
The specified maximum number of connections is recorded.
RESPONSETIME-BUCKETS =
Defines the upper limits of up to five ranges (in units of 100 ms) in which the response times
are to be stored by order of magnitude.
RESPONSE-BUCKETS = *UNCHANGED
The currently defined upper limits of the ranges for response times are not changed.
RESPONSE-BUCKETS = *STD-LIMITS
Sets the upper limits of the ranges for responses time to 5, 10, 20, 50 and 100.
RESPONSE-BUCKETS = list-poss(5): <integer 1..99999>
Defines the upper limits of the ranges for response times. These must be specified in
ascending order.
THINKTIME-BUCKETS =
Defines the upper limits of up to five ranges (in units of 100ms) in which the think times are
to be stored by order of magnitude.
THINKTIME-BUCKETS = *UNCHANGED
The currently defined upper limits of the ranges for think times are not changed.
THINKTIME-BUCKETS = *STD-LIMITS
Sets the upper limits of the ranges for think times to 50, 150, 300, 600 and 1200.
THINKTIME-BUCKETS = list-poss(5): <integer 1..99999>
Defines the upper limits of the ranges for think times. These must be specified in ascending
order.
96 U3585-J-Z125-8-76
Page 97

Statements for SM2 administrators MODIFY-RESPONSETIME-PARAMETER
TRANSACTTIME-BUCKETS =
Defines the upper limits of up to five ranges (in units of 100ms) in which the transaction
times are to be stored by order of magnitude.
TRANSACTTIME-BUCKETS = *UNCHANGED
The currently defined upper limits of the ranges for transaction times are not changed.
TRANSACTTIME-BUCKETS = *STD-LIMITS
Sets the upper limits of the ranges for transaction times to 5, 10, 20, 50 and 100.
TRANSACTTIME-BUCKETS = list-poss(5): <integer 1..99999>
Defines the upper limits of the ranges for transaction times. These must be specified in
ascending order.
WAITTIME-BUCKETS =
Defines the upper limits of up to five ranges (in units of 100ms) in which the wait times in
the BCAM pool are to be stored by order of magnitude.
WAITTIME-BUCKETS = *UNCHANGED
The currently defined upper limits of the ranges for wait times in the BCAM pool are not
changed.
WAITTIME-BUCKETS =*STD-LIMITS
Sets the upper limits of the ranges for wait times in the BCAM pool to 1, 2, 5, 10 and 20.
WAITTIME-BUCKETS = list-poss(5): <integer 1..99999>
Defines the upper limits of the ranges for wait times in the BCAM pool. These must be
specified in ascending order.
U3585-J-Z125-8-76 97
Page 98

MODIFY-USER-ADMISSION Statements for SM2 administrators
MODIFY-USER-ADMISSION
Define authorizations for nonprivileged users
Function
This statement is used by the primary SM2 administrator to specify which users are
permitted to execute user-specific monitoring programs.
Format
MODIFY-USER-ADMISSION
TASK = *UNCHANGED / *ALLOW(...) / *INHIBIT
*ALLOW(...)
USER-ID = *ALL / list-poss(16): <alphanum-name 1..8>
,FILE = *UNCHANGED / *ALLOW(...) / *INHIBIT
*ALLOW(...)
USER-ID = *ALL / list-poss(16): <alphanum-name 1..8>
,ISAM = *UNCHANGED / *ALLOW(...) / *INHIBIT
*ALLOW(...)
USER-ID = *ALL / list-poss(16): <alphanum-name 1..8>
Operands
TASK =
Authorization for user-specific task monitoring is defined.
TASK = *UNCHANGED
The authorization for task monitoring defined at this point in time remains unchanged. At
program start time, user-specific task monitoring is not permitted.
TASK = *ALLOW(...)
User-specific task monitoring is permitted. The BS2000 commands /START-TASKMEASUREMENT and /STOP-TASK-MEASUREMENT are used to activate or deactivate
task monitoring.
98 U3585-J-Z125-8-76
Page 99

Statements for SM2 administrators MODIFY-USER-ADMISSION
USER-ID =
Specifies the users for whom task monitoring is permitted. An asterisk (*) is also
permitted as the last character in a wildcard specification.
USER-ID = *ALL
Task monitoring is permitted for all BS2000 users.
USER-ID = list-poss(16): <alphanum-name 1..8>
Task monitoring is permitted for users under the specified user IDs. These must be
specified without the “$” sign.
TASK = *INHIBIT
User-specific task monitoring using the BS2000 commands /START- and /STOP-TASKMEASUREMENT is prohibited. All currently active task monitoring operations are terminated.
FILE =
Authorization for file monitoring by nonprivileged users is defined.
FILE = *UNCHANGED
The authorization for file monitoring defined at this point in time remains unchanged. At
program start time, file monitoring by the nonprivileged user is not permitted.
FILE = *ALLOW(...)
File monitoring is permitted for nonprivileged users. The SM2 FILE statement is used to
activate a file to be monitored.
USER-ID =
Specifies the users for whom file monitoring is permitted.
USER-ID = *ALL
File monitoring is permitted for all BS2000 users.
USER-ID = list-poss(16): <alphanum-name 1..8>
File monitoring is permitted for users under the specified user IDs. These must be
specified without the “$” sign.
FILE = *INHIBIT
File monitoring is prohibited for nonprivileged users.
ISAM =
Authorization for monitoring ISAM pools by nonprivileged users is specified.
ISAM = *UNCHANGED
The authorization for monitoring ISAM pools defined at this point in time remains
unchanged. At program start time, monitoring of ISAM pools by a nonprivileged user is not
permitted.
U3585-J-Z125-8-76 99
Page 100

MODIFY-USER-ADMISSION Statements for SM2 administrators
ISAM = *ALLOW(...)
Monitoring of ISAM pools is permitted for nonprivileged users.
USER-ID =
Specifies the users for whom the monitoring of ISAM pools is permitted.
USER-ID = *ALL
Monitoring of ISAM pools is permitted for all BS2000 users.
USER-ID = list-poss(16): <alphanum-name 1..8>
Monitoring of ISAM pools is permitted for users under the specified user IDs. These
must be specified without the “$” sign.
ISAM = *INHIBIT
Monitoring of ISAM pools by means of the START-ISAM-STATISTICS or STOP-ISAMSTATISTICS statement is prohibited. All ISAM pool monitoring operations currently in
progress for nonprivileged SM2 users are terminated.
Notes
– The restriction regarding the maximum number of objects to be monitored is not
changed.
– If the *INHIBIT parameter is specified to withdraw execution permission from all users,
any objects monitored by a user are automatically deactivated f or monitoring purposes.
If the list of user IDs is updated (*ALLOW(USER-ID=...)), users who had previously
started a monitoring operation can complete this operation, i.e. monitoring is not deactivated automatically.
100 U3585-J-Z125-8-76
 Loading...