

Page 1
d
C
jWAVE™
Portable Transit Time Ultrasonic
Flow Meter Instructions
o
m
e
i
p
f
PROUDLY
MADE
IN THE
USA
i
t
r
e
C
ISO
9001:2008
a
n
y
Page 2

TABLE OF CONTENTS
General Information
General Information ...................................................................................................................................................Page 3
Specications ................................................................................................................................................................Page 3
Meter Features ..............................................................................................................................................................Page 4
App Features .................................................................................................................................................................Page 4
Dimensions ....................................................................................................................................................................Page 5
Technology ..................................................................................................................................................................... Page 5
Do’s and Don’ts ............................................................................................................................................................Page 5
App Installation
Getting Started .............................................................................................................................................................Page 6
Location Setup ..............................................................................................................................................................Page 6
Parameter Setup ..........................................................................................................................................................Page 7
Flow Meter Installation
Straight Pipe Recommendations ...........................................................................................................................Page 8
Full Pipe Recommendations ....................................................................................................................................Page 9
Flow Meter Orientation .............................................................................................................................................Page 9
Transducer Spacing .....................................................................................................................................................Page 10
Power Considerations ................................................................................................................................................Page 10
Installing the Flow Meter ..........................................................................................................................................Page 11
jWAVE INSTRUCTIONS
Operation
Collecting Your Data ...................................................................................................................................................Page 12
Data Logging .................................................................................................................................................................Page 12
Troubleshooting
Problems .........................................................................................................................................................................Page 15
Probable Causes ...........................................................................................................................................................Page 15
Things to Try ..................................................................................................................................................................Page 15
This device complies with Part 15 of FCC Rules and Industry Canada license-exempt RSS standard(s). Operation is subject to the following two
conditions: (1) this device may not cause harmful interference, and (2) this device must accept any interference received including interference that
may cause undesired operation. Contains FCC ID: XDULE40-S2, Contains IC: 8456A-LE4S2. CAN ICES-1/NMB-1; CAN ICES-3 (B)/NMB-3(B)
Seametrics • 253.872.0284 Page 2 seametrics.com
Seametrics jWAVE-01
Page 3

GENERAL INFORMATION
jWAVE INSTRUCTIONS
Meet the Seametrics jWAVE. Capture accurate and
reliable ow readings with your mobile device, with less
hassle and in less time—wherever you need a ow or
volume measurement.
No wires. No bulky electronics box to lug around. Your
ultrasonic ow meter hardware installs on the outside of
your pipe in a snap—and senses through the pipe wall.
Your mobile device displays readings and helps you set
up the hardware.
The jWAVE Flow Meter solution starts with the jWAVE App
(downloadable from the app stores) and works on both
iOS and Android devices.
The jWAVE Flow meter is a compact, strap-on transit
time ultrasonic transducer device. The jWAVE operates
by alternately transmitting and receiving a burst of
sound energy between two transducers. It then wirelessly
transmits ow measurements to your mobile device. Use
Specications*
the portable data logger to conveniently record ow for
as long as 14 days or as little as one minute.
The jWAVE is highly portable. Just bring the rechargeable
clamp-on meter in its lightweight, weatherproof case,
along with a tablet or smartphone (iOS or Android).
Bluetooth connectivity replaces wires, and the jWAVE App
guides you through setup.
The convenient cam cleats let you mount the ow
meter on any pipe in seconds—no cumbersome clamps
required.
Bi-directional readings are transmitted to your mobile
device for display and your location’s settings are stored
in the jWAVE App, ready for reuse.
When you are done, simply release the cleats, then take
the compact meter on to your next location.
Pipe Size 2” to 20”
Pressure Drop Zero
Materials Body Anodized aluminum channel, acetal end housings and feet
Mounting Straps EPDM
Temperature Ambient & Fluid -20˚ to 150˚ F (-29˚ to 65˚ C)
Display English and metric units provided on app
Flow Operation
Range
Turndown 200:1
Accuracy 1% to 2% of reading (typical)
Repeatability 0.5%
Output Signal Wireless Bluetooth 4.0 (BLE) connectivity to iOS¹ or Android² device
Power Rechargeable battery (up to 12 hours), 1W max, 150mA max current, 5 “AA” NiMH 6V pack with
Power Adapter For recharging battery - must use the 12W USB power adapter supplied with the jWAVE
Installation 10 pipe diameters upstream, 5 diameters downstream for optimal performance (typical)
Environmental IP65
*Specications subject to change • Please consult our website for current data (www.seametrics.com).
¹The following iOS devices support Bluetooth 4.0 (BLE): iPhone 4S and later, iPad 3rd generation and later, iPad mini, iPad Air, and iPod Touch 5th generation.
²If you have an Android device, check the settings on the device or specications for the device to be sure it supports Bluetooth 4.0 (BLE).
Bidirectional; 0.1 ft/s to 20 ft/s (0.03 m/s to 6 m/s)
thermistor, 5 month shelf life
Seametrics • 253.872.0284 Page 3 seametrics.com
Page 4

GENERAL INFORMATION
Meter Features
jWAVE INSTRUCTIONS
Bi-directional
Flow Sensing
Power Button
App Features
USB External
Power Plug &
Battery Charger
Anodized
Aluminum Channel
Integrated Ruler
Moveable
Acoustic
Transducers
Cam Cleat for
Mounting Strap
Rugged Acetal End
Housing & Foot
Interactive smart phone/tablet control
app—iOS or Android
• Handy built-in pipe
specications—or add your
own
• Save location information
• Drag and drop output
selection
• English or metric units
• Select liner and liquid
types—or dene your own.
• Easy-to-use data logging
Seametrics • 253.872.0284 Page 4 seametrics.com
Page 5
GENERAL INFORMATION
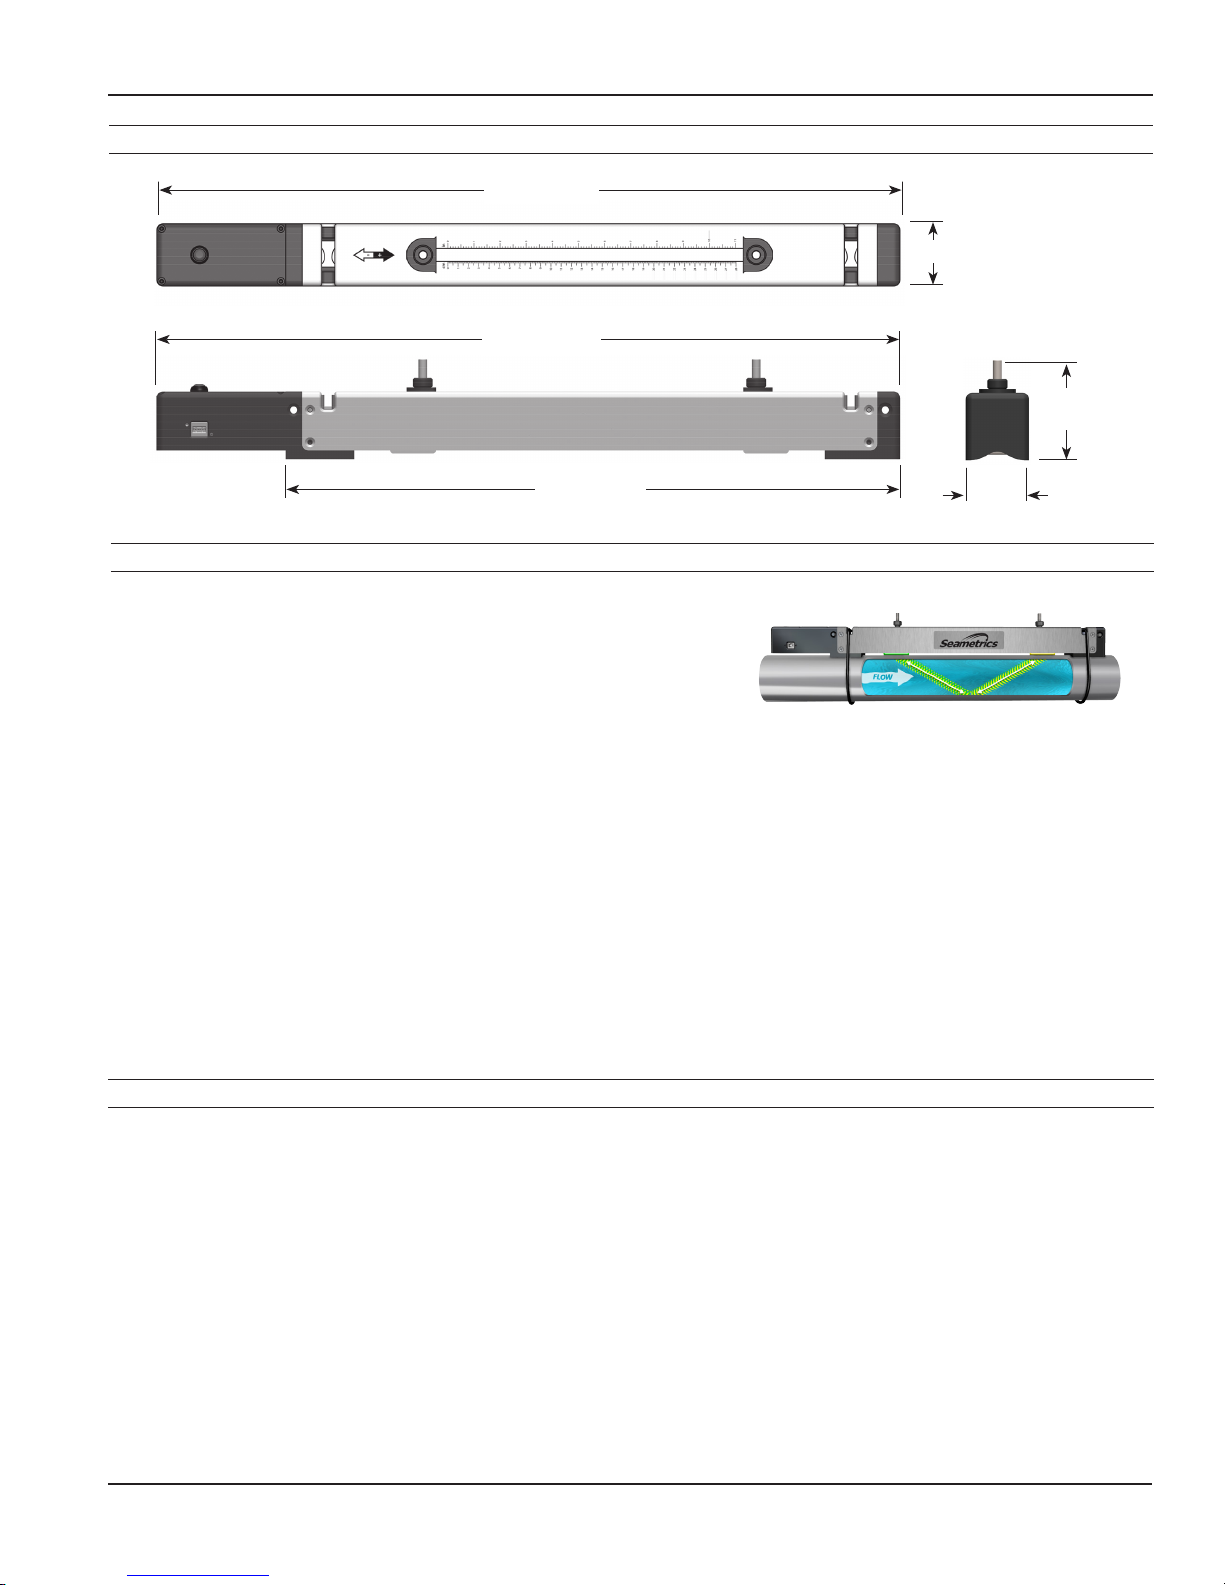
Dimensions
jWAVE INSTRUCTIONS
28.4” (72.1cm)
2.4” (6.1cm)
28.4” (72.1cm)
3.8”
(9.65cm)
23.5” (59.7cm)
2.4”
(6.1cm)
Technology
The transit time ow meter operates by alternately transmitting and
receiving a burst of sound energy between the two transducers.
The burst is rst transmitted in the direction of uid ow and then
against uid ow.
Since sound energy in a moving liquid is carried faster when it travels
in the direction of uid ow (downstream) than it does when it travels against uid ow (upstream), a differential
in the travel times will occur. The sound’s travel time is accurately measured in both directions and then used to
compute the ow rate.
Sound waves can bounce in many directions as they travel through various materials. The more the sound waves
scatter, the fewer actually reach the second transducer. The jWAVE uses sophisticated methods to maximize
transducer efciency, thus allowing the unit to run on very low power. Focusing of the sound wave is also
important to ensure it reaches the second transducer without degrading. This is accomplished by accurately
spacing the transducers to allow for optimum sound transit between transducers. The jWAVE app computes this
spacing based on the pipe size, pipe material, and type of liquid.
Transit time technology works best in clean or mildly dirty water or uids with minimal turbulence or ow
distortion.
Do’s and Don’ts
Do charge your jWAVE at least once a month.
Do store your jWAVE in a dry, inside area when
not in use.
Do store your jWAVE fully charged.
Do keep your jWAVE in its protective case when
transporting to prevent damage.
Do gently clean the transducer pads regularly
with isopropyl alcohol to prevent hardening
and build up of used coupling gel.
Seametrics • 253.872.0284 Page 5 seametrics.com
Don’t charge with any charger other than the
12W charger supplied. Other chargers may
damage the jWAVE.
Don’t store, transport, or use your jWAVE where
the device may exceed 150˚F (65˚C)—
battery may leak or explode!
Don’t bang or drop the jWAVE on hard objects or
surfaces.
Don’t nick the transducer pads.
Page 6

jWAVE INSTRUCTIONS
APP INSTALLATION
Getting Started
Begin by downloading the Seametrics jWAVE App to your iPhone™, Android phone, or other Bluetooth enabled
mobile device from the Apple Store™ or Google Play™. (Note: On an iPad, you must select iPhone Only in the app
store.) If you do not have automatic updates enabled on your device, be sure to update your app when notied that
there is a new version available.
jWAVE
NOTE: Be sure your mobile device supports Bluetooth 4.0 (BLE).
The following iOS devices support Bluetooth 4.0: iPhone 4S and later, iPad 3rd generation and
later, iPad mini, iPad Air, and iPod Touch 5th generation.
If you have an Android device, check the settings on the device or specications for the device.
Location Setup
Launching the app lands you on the locations screen. The
app always begins with this screen at launch, making
it easy to access previously saved location settings.
Begin by tapping on the add location (+) button.
jWAVE
for Agriculture
Add
location
Give your location a name and then set the specic
parameters for that location. Each location’s settings are
stored in the jWAVE App, ready for reuse.
Name
your
location
Seametrics • 253.872.0284 Page 6 seametrics.com
Page 7

jWAVE INSTRUCTIONS
APP INSTALLATION
Parameter Setup
Use the handy parameter selection screens to set your units of measure and display preferences.
Conveniently select pipe, liner, and liquid specications from lists of pre-loaded values. Don’t see the
right option? Add your custom values!
Units
Toggle between
English and metric
units of measure.
Select Flow Rate,
Volume, and
Velocity from our
pre-loaded values.
Display
The main screen
displays two outputs.
Drag and drop the
two outputs that
you rely on most to
display on the main
screen.
Pipe
Select Pipe Type,
Size, and Wall
Classications from
our pre-loaded
values or add custom
values by selecting
Custom under Pipe
Type. When entering
a custom type, you
must supply the
outer diameter, wall
thickness, speed of
sound through the
pipe material, and the
surface roughness—
enter zero if unknown
roughness.
Liner
Switch between liner
and no liner. When
selecting Liner
Enabled, enter
Liner Thickness
and choose Liner
Material from our
pre-loaded list or add
custom values. When
adding a custom
material, you must
enter the speed of
sound through that
material.
Liquid
Select Liquid Type
and Temperature
from our pre-loaded
list of values or add
a custom liquid
type. When adding
a custom liquid, you
will need to enter
the speed of sound
through that liquid,
the viscosity, and the
density.
Seametrics • 253.872.0284 Page 7 seametrics.com
Page 8

FLOW METER INSTALLATION
Straight Pipe Recommendations (X = diameter)
Reduced Pipe
Two Elbows In Plane
20X
jWAVE INSTRUCTIONS
5X15X
5X
Two Elbows, Out Of Plane
Expanded Pipe
Swirling Flow:
Propeller Meter
40X
30X
40X
5X
5X15X
5X
5X
Swirling Flow:
Partially Open
Buttery Valve
Seametrics • 253.872.0284 Page 8 seametrics.com
Page 9

FLOW METER INSTALLATION
Full Pipe Recommendations
jWAVE INSTRUCTIONS
Recommended:
Keep pipe full at meter for accuracy
Recommended:
Keeps pipe full at meter for accuracy
Not Ideal:
Allows air pockets to form at meter
Not Ideal:
Post-valve cavitation can create air pocket
Recommended:
Allows air to bleed off
Flow meter Orientation
Horizontal (3 o’clock or 9 o’clock
position) is the preferred installation
orientation, since it avoids problems
with trapped air and sediment.
Seametrics • 253.872.0284 Page 9 seametrics.com
Not Ideal:
Air can be trapped
Fair — Unacceptable if pipe
contains air
Air bubbles
Best Position
Sediment
Fair — Unacceptable if pipe
contains sediment
Page 10

FLOW METER INSTALLATION
Transducer Spacing
Once you entered your parameters in the previous section, the app
automatically computed the proper transducer spacing. This is shown at the
bottom of the main app screen.
The next step is to adjust the transducer spacing on the ow meter, as
follows:
1. Rotate the black knob to unlock the horizontal motion for each
transducer.
2. Move the transducers to the specied transducer spacing by sliding
them along the integrated ruler. Note: It is not necessary to start at
zero on the ruler, so long as the actual spacing is correct.
3. Lock into place using the black knobs. This is important to prevent the
transducer spacing from moving when mounting the ow meter!
jWAVE INSTRUCTIONS
Black locking knob
on transducer
Integrated
ruler
Power Considerations
Your jWAVE Flow meter battery has been fully charged at the factory before shipping and is ready to go.* When it’s
time to recharge the battery, the app will let you know.
When using the datalogging function and recording for more than 12 hours, the jWAVE must be connected to a power
source, such as a portable USB power bank or a USB power adapter connected to an external power source.
* On a full charge, the jWAVE will have a shelf life of up to ve months. It is a good idea to charge the unit for a full ve hours if it hasn’t been used for
a month or two. On a full charge the meter should operate for up to 12 hours of continuous use. Note that if the battery is at, the power button LED
will blink rapidly for ve seconds and then the meter will turn off.
Seametrics • 253.872.0284 Page 10 seametrics.com
To prevent damage, you must use the
supplied 12W charger ONLY.
Page 11

FLOW METER INSTALLATION
jWAVE INSTRUCTIONS
Installing the Flow meter
Once the transducer spacing has been set and locked in place, you are ready to install the ow meter on your pipe.
1. Rotate the silver knobs counter clockwise until they stop. This raises the transducers up above the meter
footings.
2. Apply coupling gel liberally to the transducer faces, covering the entire bottom face of each transducer.
3. Place ow meter on pipe, assuring that the footings are ush with the pipe and the meter is aligned with the
axis of the pipe.
4. Strap the meter to pipe with the mounting straps, clamping the straps into the cam cleats. Hand tighten only!
5. Rotate silver knobs clockwise to press transducers onto the pipe. Hand tighten only until seated rmly.
Warning: Tightening too much can lift the meter away from the pipe, causing incorrect readings.
Rotate silver knobs counter-clockwise to
raise the transducers, clockwise to lower.
Cover bottom face of transducers with coupling gel.
Wrap cords around pipe and secure with cam cleats.
Seametrics • 253.872.0284 Page 11 seametrics.com
Page 12

OPERATION
Collecting Your Data
jWAVE INSTRUCTIONS
Be sure the app is running on your mobile device.
Turn on power to the ow meter by pressing the power
button on the left top of the meter.
A steady LED indicates that power is on. The LED will ash if
the meter is charging on external power. (Note: Older units
may not ash.)
The app will display a list of all jWAVEs within its range. Tap
the one you are currently using.
(Note: Your app will check the ow meter to be sure it has
the most recent programming. If there is a newer version
available, it will give you the option of updating the meter.
This may take three to ve minutes.)
Your ow data will display on the jWAVE App.
When you are done collecting data, snap the cords out of
their cam cleats and you are ready to move on to your next
location. The next time you return to this location, the jWAVE
App will remember your settings.
Power
button
Data Logging
The purpose of the jWAVE’s built-in data logger is to record ow for a specied
period of time. It may be used to conveniently record ow for as long as 14 days
or as little as one minute. While conveniently battery powered, the jWAVE has
limited memory. Thus, only one data log may be used at any one time. As the
jWAVE data logger uses Bluetooth (BLE) to transfer data from the ow meter to
the mobile device, data transfer speed is limited by BLE, which is not designed
to transfer large data sets. Transferring the maximum sized data set will take up
to 5 1/2 minutes.
All data logging functions are accessed by tapping the Data Logging button in
the measurement view.
The jWAVE’s data logger stores only one data set at
any time, selecting “Rec” (which creates a new data
log) will write over the existing data log. A message
appears when selecting the “Rec” button indicating
that the existing data log will be over-written if a new
data log is started and gives the user the ability to
continue with the new data log or to cancel.
Seametrics • 253.872.0284 Page 12 seametrics.com
Page 13

OPERATION
Making a Recording
• Connect to the meter with the jWAVE App.
• Tap the Data Logging button to access the data logger
features.
• Using the slider bar in the app’s data logger setup view, set the
recording time. (See Explanation of Recording Times on the
next page.)
• Tap “Rec” to start the recording. Data will start recording
on the meter. You can disconnect the mobile app during
recording. The meter will turn off when done to save power,
unless still connected to the app.
• To stop recording prior to completing the time period, connect
the jWAVE App to the meter, tap the Data Logging button, and
tap “Stop.”
The status of the data logger is indicated by the color and text of
the data logger setup button, located in the measurement view. If
data logger is active, the button is outlined in red, shows a red disk
drive, and displays “in progress.” If the data logger is completed,
the button is outlined in green, shows a green disk drive, and
“complete.” The data logger setup view also displays the remaining
recording time for conveniently checking progress of data logging.
Active data
logging session
running.
jWAVE INSTRUCTIONS
Data logging
session complete.
Uploading Data
Data is stored on the ow meter and may be retrieved at any
time. To upload data, the data logger must be either complete or
stopped and the app must be connected to the ow meter. Data is
uploaded using the “share” button located to the right of the “Rec”
button. Uploading the maximum sized data set may take up to 5 1/2
minutes.
iOS users: If you want to quickly review your data at any time, tap
the “share” button, and then tap Quick Look. This displays the data
log in a spreadsheet for immediate viewing on your mobile device.
Sharing Data
You only need to upload the data log once from jWAVE. Once the
data is uploaded, it may be shared any number of times without
additional uploading, until a new data log is started. Tap the “share”
button to share the data by a number of methods, email, text,
AirDrop, Google Drive, etc., depending on what is available on
your mobile device. Shared data is formatted in a CSV le (comma
delimited le). The le name is unique and contains both the date
and time that the data log was started as well as the location
name. Setup information such as the date and time the data log
was started, the number of samples, sampling period, and location
name are located at the top of the data le. The data is arranged in
rows, where each row contains a single ow measurement including
sample number, time stamp, ow rate, velocity, volume, and quality.
The data le can be viewed or printed as a text le or formatted
using most spreadsheet and database programs, such as Microsoft®
Excel or Access.
iOS
Android
Upload data by tapping the “share” button.
iOS users: Tap “Quick Look” for immediate
viewing of your data. (Tap the upper left corner of
the screen to close the Quick Look view.)
NOTE: The app must be
connected to the jWAVE in
order to share the data or
view it with Quick Look.
Seametrics • 253.872.0284 Page 13 seametrics.com
Page 14

OPERATION
jWAVE INSTRUCTIONS
Explanation of Recording Times
The sampling rate (time between each recorded ow measurement) and total number of recorded measurements is
controlled by the jWAVE. The maximum possible number of ow measurements is 3750 and each includes ve values-
-ow rate, total, velocity, time stamp, and quality. The maximum sampling rate is two seconds.
The jWAVE data logger will attempt to maximize the sampling rate, based on the your selected recording time. For
example, if you select to record ow for one minute, then the jWAVE maximizes the sampling rate at two seconds and
will record 31 ow measurements (covering a total of 60 seconds).
If you select to record ow for four days, then the jWAVE again attempts to maximize the number of ow
measurements; however since there is not enough memory to record ow every two seconds for four days, it
congures the sampling period to maximize the number of ow measurements. For the case of four days, the jWAVE
sets the sampling period at 92 seconds giving you a total of 3716 ow measurements. (Note that because the jWAVE
uses whole seconds to set the sampling period, it is not able to always provide exactly 3750 samples to cover the
specied recording time. )
Length Sample Period
1 minute 2 seconds
1 hour 2 seconds
10 hours 9 seconds
1 day 23 seconds
When recording more than 12 hours,
the jWAVE must be connected to an
external power source, such as the
USB power adapter supplied with the
jWAVE.
4 days 92 seconds (1 min. 32 sec.)
10 days 230 seconds (3 min. 50 sec.)
14 days 322 seconds (5 min. 22 sec.)
Seametrics • 253.872.0284 Page 14 seametrics.com
Page 15

TROUBLESHOOTING
jWAVE INSTRUCTIONS
Problem Probable Causes Things to try…
Battery not charging Using wrong power supply Use the supplied 12W charger/power supply
No signal Incorrect setup Conrm pipe settings
Air in pipe Rotate meter to 3 o’clock position
Remove air
Relocate meter to another location where there
is no air
Corroded rusty pipe Relocate meter to clean section of pipe. If no
clean section is available, move meter to other
locations until a signal is found—try to nd a
section of pipe with less corrosion or rust.
Can’t nd iOS App Searching under iPAD only In Apple Store, select iPhone only from menu
Device does not support Bluetooth
4.0 (BLE)
Can’t nd Android App Device does not support Bluetooth
4.0 (BLE)
Can’t nd jWAVE with app Device does not support Bluetooth
4.0 (BLE)
Bluetooth is not turned on Turn on Bluetooth
Not in range Move closer to the jWAVE
Use a device that supports Bluetooth 4.0 (BLE)
Use a device that supports Bluetooth 4.0 (BLE)
Use a device that supports Bluetooth 4.0 (BLE)
Seametrics • 253.872.0284 Page 15 seametrics.com
Page 16

Seametrics • 19026 72nd Avenue South • Kent, Washington 98032 • USA
(P) 253.872.0284 • (F) 253.872.0285 • 1.800.975.8153 • seametrics.com
LT-14234r8.0-20160608
6/8/16
 Loading...