

Page 1
Product
Environmental
Profile
Smart-UPS® Online
PEP ecopassport SCHN-2011-564-V0
Page 2
Product Environmental Profile - PEP
Product overview
The Smart-UPS® Online product range prevents blackouts, brownouts, sags, and surges from reaching
critical electronic equipment. The Smart-UPS
and isolates your equipment from large disturbances by internally disconnecting from the utility line and
supplying continuous power from its internal battery pack until the utility line returns to safe levels. The
Smart-UPS
for servers, voice / data networks, medical labs, and light industrial applications.
This range consists of Smart UPS with different form factors (tower and rack) and with a maximum
configurable power comprises between 700 Watts / 1000 VA and 16000 Watts / 20000 VA.
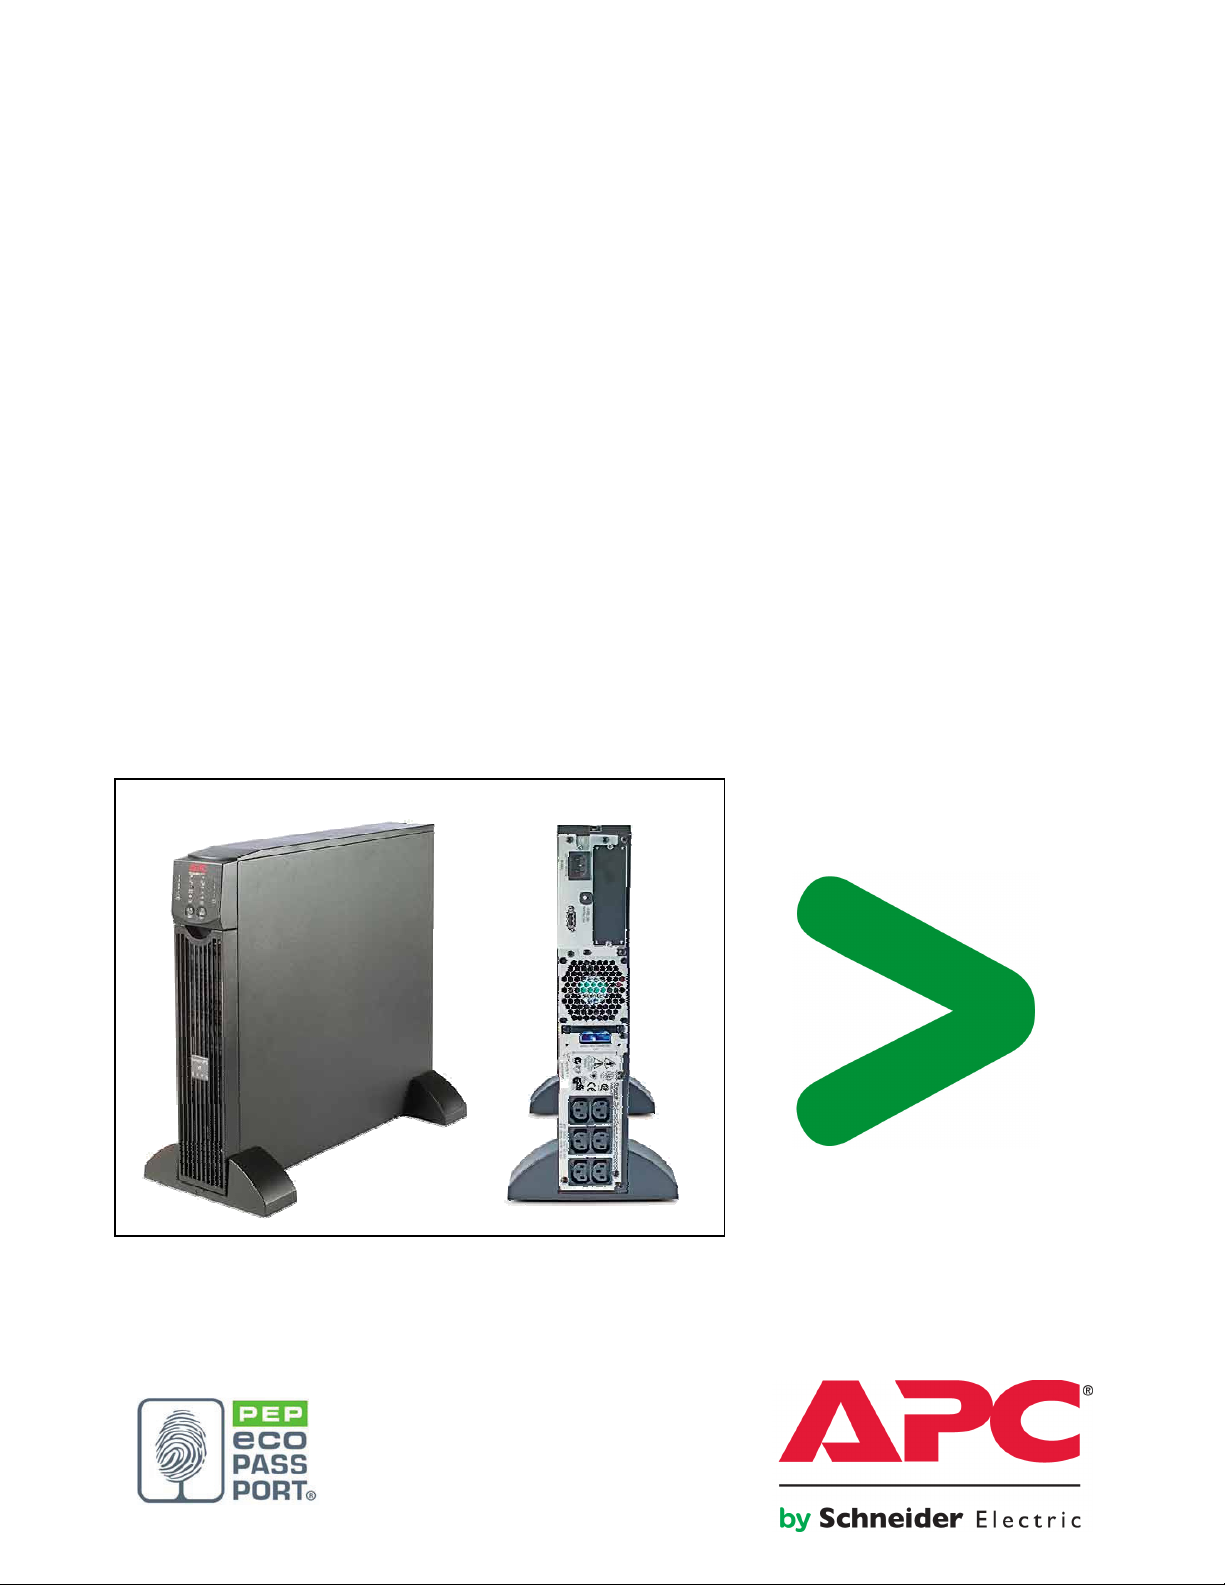
The representative product used for the analysis is the SURT1000XLI: APC Smart-UPS On-Line, 700 Watts /
1000 VA, Input 230V / Output 230V , Interface Port DB-9 RS-232, SmartSlot , Extended runtime model , Rack
Height 2 U
The environmental impacts of this referenced product are representative of the impacts of the other
products of the range which are developed with a similar technology.
The environmental analysis was performed in conformity with ISO 14040.
Products
®
Online product range provides high density, true double-conversion on-line power protection
Smart-UPS® RT Rack/Tower – SURT/SURTA/SURTD 1000 VA to 10,000 VA
Smart-UPS® RT Rack/Tower – DL/DLA/EMC/IBM/NEC/FJ 1000 VA to 10,000 VA
®
Online product range filters out small utility line fluctuations
Constituent materials
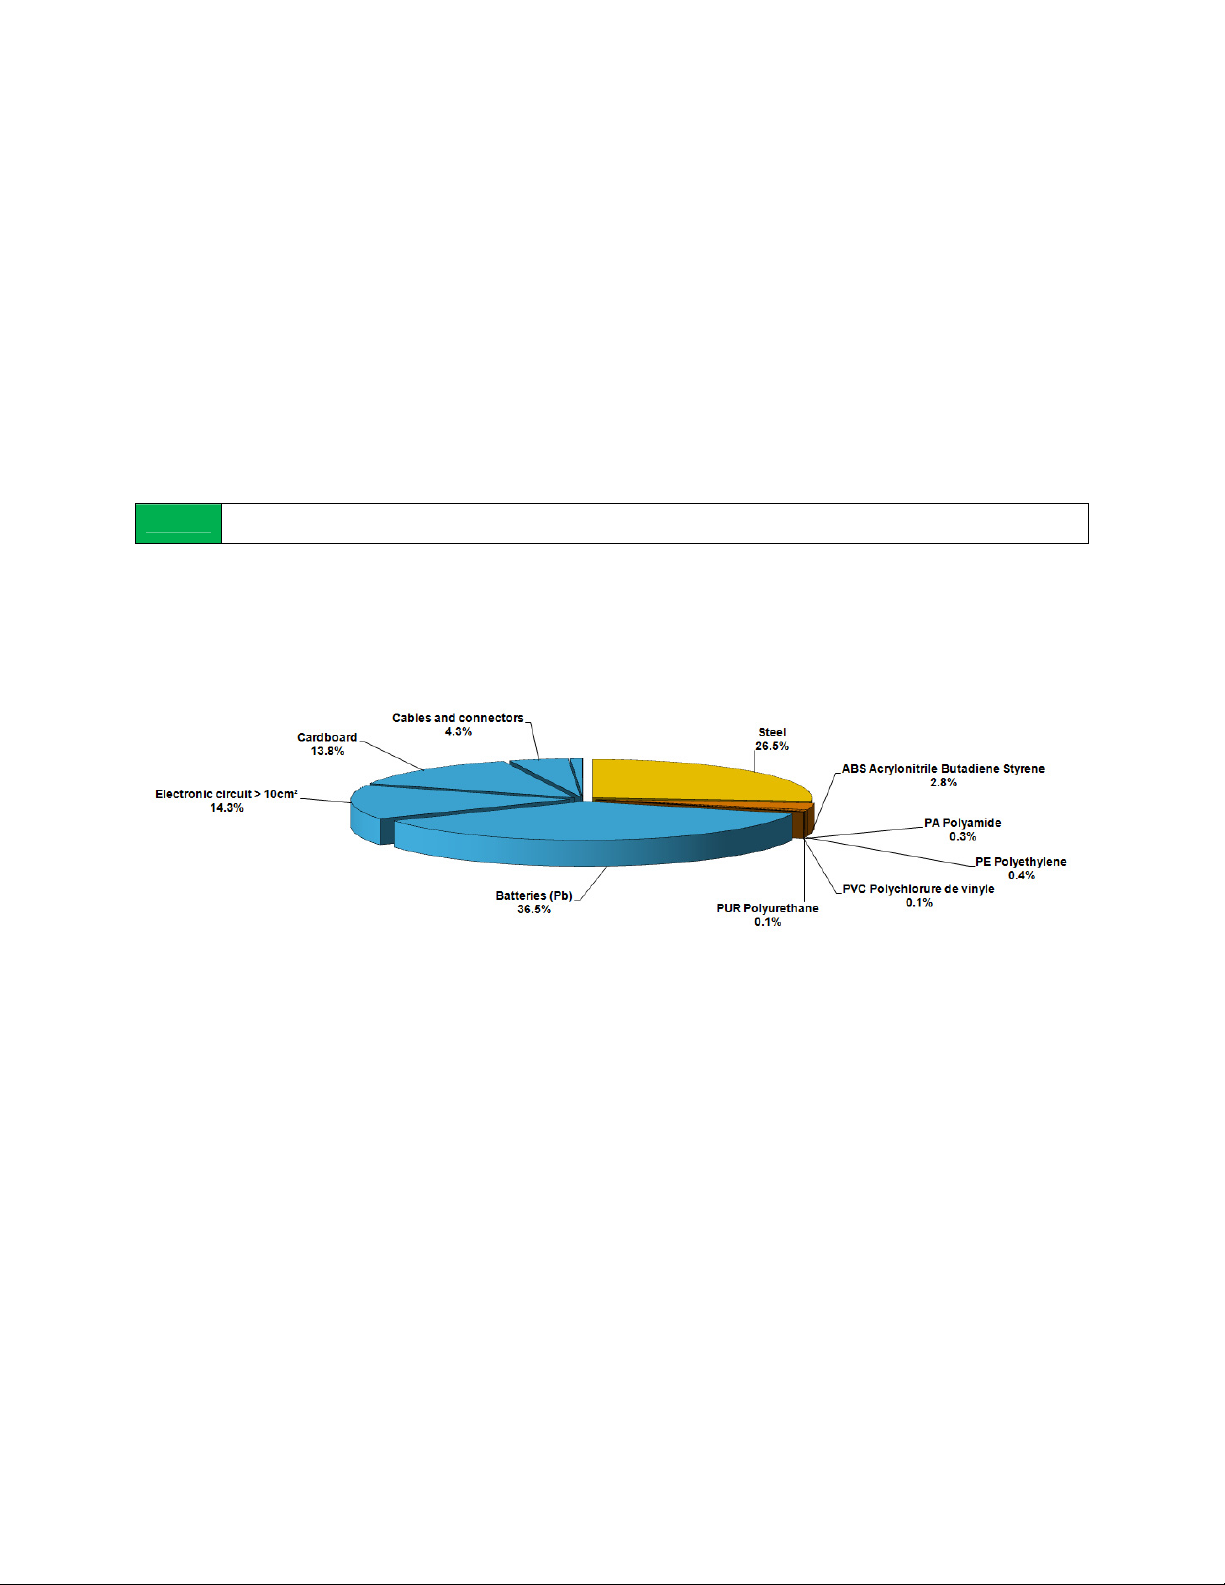
The mass of the product range is from 23.7 kg and 63.6 kg including packaging. It is 23.7 kg for the SURT1000XLI.
The constituent materials are distributed as follows:
Substance assessment
Products of this range are designed in conformity with the requirements of the RoHS directive (European Directive 2002/95/EC of 27 January
2003) and do not contain, or only contain in the authorised proportions, lead, mercury, cadmium, hexavalent chromium or flame retardants
(polybrominated biphenyls - PBB, polybrominated diphenyl ethers - PBDE) as mentioned in the Directive.
The battery pack within this product range are designed in conformity with the requirements of the Battery Directive (European Directive
2006/66/EC of 26 September 2006) and do not contain, or only contain in authorized proportions, lead, mercury and cadmium as mentioned in
the Battery Directive.
Manufacturing
The Smart-UPS® Online product range is manufactured at a Schneider Electric production site on which an ISO14001 certified environmental
management system has been established.
Distribution
The weight and volume of the packaging have been optimized, based on the European Union's packaging directive.
The Smart-UPS
PEP ecopassport SCHN-2011-564-V0
®
Online packaging weight is 4.128 kg. It consists of cardboard, Polyethylene and paper.
Page 3

Product Environmental Profile - PEP
Use
The products of the Smart UPS® Online range do not generate environmental pollution (emissions) requiring special precautionary measures in
standard use. Audible noise one meter from the surface of the product is between 45 and 53 dBA.
The usage scenario for Uninterruptible Power Supplies is specific; the methodology for the calculation of the electricity consumption is based on
the Energy Star rules under development by the U.S. Environmental Protection Agency (Energy Star Uninterruptible Power Supply Product
Category version 1, draft 2, 14 Oct 2011).
Weighted
SURTA1500XL–Reference
productandBestcase 75.0% 9.8% 102.8 901 10 9,007
SURTD5000XLT–Worstcase 75.0% 7.1% 247.5 2,168 10 21,683
Maintenance: The replacement of 1 battery pack is required during the service life of the product.
Average Load (%)
Weighted Average
Loss (%)
Weighted Average
Loss (W)
Annual Average
Consumption (kWh)
Life time
(years)
Lifetime Average
Consumption (kWh)
End of life
At end of life, the products in the Smart-UPS® Online have been optimized to decrease the amount of waste and allow recovery of the product
components and materials.
This product range contains batteries, external cables and electronic boards that should be separated from the stream of waste so as to
optimize end-of-life treatment by special treatments. The location of these components and other recommendations are given in the End of Life
Instruction document which is available for this product range.
The recyclability potential of the products has been evaluated using the “ECO’DEEE recyclability and recoverability calculation method” (version
V1, 20 Sep. 2008 presented to the French Agency for Environment and Energy Management: ADEME).
According to this method, the potential recyclability ratio is: 55%.
As described in the recyclability calculation method this ratio includes only metals and plastics which have proven industrial recycling processes.
Environmental impacts
Life cycle assessment has been performed on the following life cycle phases: Materials and Manufacturing (M), Distribution (D), Installation (I)
Use (U), and End of life (E).
Modeling hypothesis and method:
- th
e calculation was performed on the SURT1000XL
product packaging: is includ
Installation components: no special components included.
-
-
scenario for the Use phase: this product range is included in the category 2: Energy consuming product. The usage scenario for
ecific; the methodology for the calculation of the electricity consumption is based on the rules defined by the EPA for sm
is sp
ho
usehold UPS.
Assumed service life is 10 y
se scenario is: annual electricity consumption = 901 kWh per ye
U
The
electrical power model used for calculation is the average European model.
This equipment require the replacement of 1 pack of batteries during the life cycle
-
End of life impacts are based on a worst case transport distance to the recycling plant (1000km)
ed
ears
I
UPS
all
ar
Presentation of the product environmental impacts
Environmental indicators Unit SURT1000XLI
Raw Material Depletion Y-1
Energy Depletion MJ
3
Water depletion
Global Warming
Ozone Depletion g≈CFC-11
Air Toxicity
Photochemical Ozone Creation
Air acidification
Water Toxicity
Water Eutrophication
Hazardous waste production Kg
Life cycle assessment has been performed with the EIME software (Environmental Impact and Management Explorer), version 4, and with its
database version 11.0.
The Manufacturing phase and the use phase are the life cycle phase which has the greatest impact on the majority of environmental indicators.
PEP ecopassport SCHN-2011-564-V0
dm
g≈CO
3
m
g≈C
g≈H
3
dm
g≈PO
2H4
+
2
4
S = M + D
+ I + U + E
M D I U E
3.19E-12 1.98E-12 2.74E-17 0 1.21E-12 5.62E-17
1.06E+05 2.20E+03 2.01E+01 0 1.04E+05 4.12E+01
1.60E+04 8.45E+02 1.91E+00 0 1.52E+04 3.91E+00
5.37E+06 1.28E+05 1.59E+03 0 5.23E+06 3.26E+03
3.15E-01 2.12E-02 1.12E-03 0 2.90E-01 2.31E-03
9.74E+08 7.01E+07 2.99E+05 0 9.03E+08 6.15E+05
1.83E+03 5.11E+01 1.36E+00 0 1.77E+03 2.79E+00
7.42E+02 2.94E+01 2.03E-01 0 7.12E+02 4.16E-01
1.51E+06 2.44E+04 1.99E+02 0 1.49E+06 4.08E+02
2.01E+01 6.95E+00 2.64E-02 0 1.30E+01 5.42E-02
8.86E+01 1.96E+00 5.91E-04 0 8.66E+01 1.21E-03
Page 4

Product Environmental Profile - PEP
According to this environmental analysis,
on the impact analysis, the impact on the Raw Material Depletion of other products in this family may be proportional
of the products. The impacts on the other indicators are proportional to the electricity consumption.
proportionality
rules may be used to evaluate the impacts of other products of this range: Depending
extrapolated by the mass
System approach
As the products of the range are designed in accordance with the RoHS Directive (European Directive 2002/95/EC of 27 January 2003), they
can be incorporated without any restriction in an assembly or an installation subject to this Directive.
Please note that the values given above are only valid within the context specified and cannot be used directly to draw up the environmental
assessment of an installation.
PEP ecopassport SCHN-2011-564-V0
Page 5

Product Environmental Profile - PEP
A
Glossary
Material Depletion (RMD)
Raw
Energy Depletion (ED)
Water Depletion (WD)
Global Warming (GW)
Ozone Depletion (OD)
Air Toxicity (AT)
Photochemical Ozone Creation (POC)
Air Acidification (AA)
Water Toxicity (WT)
Hazardous Waste Production (HWP)
This indicator quantifies the consumption of raw materials during the life cycle of
the
product. It is expressed as the fraction of natural resources that disappear each
year, with respect to all the annual reserves of the material.
This indicator gives the quantity of energy consumed, whether it be from fossil,
ydroelectric, nuclear or other sources.
h
This indicator takes into account the energy from the material produced during
combustion. It is expressed in MJ.
This indicator calculates the volume of water consumed, including drinking water
water from industrial sources. It is expressed in dm
and
The global warming of the planet is the result of the increase in
greenhouse effect due to the sunlight reflected by the earth’s surface being
the
absorbed by certain gases known as "greenhouse-effect" gases. The effect is
quantified in gram equivalent of CO
This indicator defines the contribution to the phenomenon of
the
disappearance of the stratospheric ozone layer due to the emission
of certain specific gases. The effect is expressed in gram equivalent
of CFC-11.
This indicator represents the air toxicity in a human environment. It takes into
nt the usually accepted concentrations for several gases in the air and the
accou
quantity of gas released over the life cycle. The indication given corresponds to the
air volume needed to dilute these gases down to acceptable concentrations.
This indicator quantifies the contribution to the "smog" phenomenon
the photochemical oxidation of certain gases which generates ozone) and is
(
expressed in gram equivalent of ethylene (C
The acid substances present in the atmosphere are carried by rain.
high level of acidity in the rain can cause damage to forests.
The contribution of acidification is calculated using the acidification potentials of the
substances concerned and is expressed in mode equivalent of H
This indicator represents the water toxicity. It takes into account the usually
accep
ted concentrations for several substances in water and the quantity of
substances released over the life cycle. The indication given corresponds to the
water volume needed to dilute these substances down to acceptable
concentrations.
This indicator calculates the quantity of specially treated waste created during all
life cycle phases (manufacturing, distribution and utilization). For example,
the
special industrial waste in the manufacturing phase, waste associated with the
production of electrical power, etc.
It is expressed in kg.
3
.
.
2
).
2H4
+
.
APC by Schneider Electric has achieved compliance status and the accuracy of data in this PEP document is based on our best knowledge as
of the date of its publication.
Registration No.: SCHN-2011-564-V0 Writing rules: PCR PEPecopassport 2010 :1.0
Accreditation No. of verifier:: VH05 Programme information: www.pep-ecopassport.org
Date of issue: 11-2011 Period of validity: 4 years
Independent verification of the declaration and data, in compliance with ISO 14025:2006
Internal External X
In compliance with the ISO 14025:2006 type III environmental declaration standard.
The critical review of the PCR was conducted by a panel of experts chaired by. J. Chevalier (CSTB).
The information in the present PEP cannot be compared with information from another programme.
© 2011 - Schneider Electric – All rights reserved
ENVPEP111119EN_V0
05-2012
© 2011 - Schneider Electric – All rights reserved © 2012 - Schneider Electric – All rights reserved
 Loading...