

Page 1

Rosemount™ 3493 LOGView
Software Version 1.21
Manual Supplement
00809-0200-4841, Rev AC
January 2021
Page 2

Manual Supplement January 2021
Contents
Introduction.................................................................................................................................3
LogView software installation.......................................................................................................4
Collect data..................................................................................................................................5
Saving data.................................................................................................................................. 6
Open data.................................................................................................................................... 8
Table............................................................................................................................................ 9
Chart..........................................................................................................................................10
Print........................................................................................................................................... 11
Site database..............................................................................................................................12
Password protection.................................................................................................................. 14
Help........................................................................................................................................... 15
2 Emerson.com/Rosemount
Page 3

January 2021 Manual Supplement
1 Introduction
Rosemount 3493 LOGView is a software package that works with the
Rosemount 3493 Data Logging System.
LOGView allows the user to download the stored data from the Rosemount
3493 to the user's computer. The data available includes up to 7000 sample
values, 60 daily totals, and 60 maximum daily flow rates.
Within the LOGView software, the downloaded data can be used to produce
reports, summaries, and charts, each tailored to the user's requirements.
Many of the functions available in LOGView can be selected in more than
one way: by cursor, menu, function key, or dedicated button.
Figure 1-1: Rosemount 3493 LOGView
Manual Supplement 3
Page 4

Manual Supplement January 2021
2 LogView software installation
2.1 Download the LogView software
Procedure
1. Go to Emerson.com/Rosemount3493.
2. Scroll as needed to the green menu bar and click Documents &
Drawings → Training & Demonstrations.
3. Download and unzip the Rosemount LogView package.
2.2 Install the LogView software
Prerequisites
Supported operating systems: Up to Windows 7 (32-bit)
Procedure
1.
Double-click
2. Select Start Setup.
setup.exe to start the installation.
3. In the Install To: box, type the desired installation location.
The default location is C:\LOGVIEW.
4. Select Continue.
The files are then automatically installed on the PC. A LOGView icon
will display in the Start menu.
4 Emerson.com/Rosemount
Page 5

January 2021 Manual Supplement
3 Collect data
Procedure
1. Connect the PC to the Rosemount 3493 Data Logging System by
using the communications lead provided.
If a different connection lead is required, see Connection details.
2. Start LOGView from the Windows menu.
3. Click the Collect Data button or press F2 to collect all of the data
from the Rosemount 3493.
Postrequisites
After collecting the data, it may be saved in a CSV file.
3.1 Connection details
A cable is supplied with the Rosemount 3493 Data Logging System for
connection to a PC serial COM port. However, see Table 3-1 if a custom
connection is required.
Figure 3-1: Connection to a PC
Table 3-1: Connection Lead
Signal function Terminal block on
3493
Logger output 5 (Tx) PIN 2 PIN 3
Logger input 4 (Rx) PIN 3 PIN 2
Ground 6 (0V) PIN 5 PIN 7
Manual Supplement 5
PC RS232 Port 9way connection
PC RS232 Port 25way plug
Page 6
Manual Supplement January 2021
4 Saving data
There are two formats for saving data. The first option is as the standard CSV
format, in which case all the data collected is saved as one file. The second
format saves the data in a monthly CSV format, and automatically joins
together all the data from one month in one file. All of the LOGView data is
in Comma Separated Values (CSV) format.
4.1 Save data as CSV file format
After you have collected data from the logger you should save it in a CSV
File.
Procedure
Click the Save As button or select File → Save Data As CSV File.
LOGView automatically offers you a file name that consists of the unique ID
and a three digit number. That number is the next after the highest number
found in the CSV sub-directory.
Data is saved with the current international settings of your PC.
4.2 Write/add to monthly CSV file
A monthly file can be automatically built up from a number of data
collections.
If a monthly file is not complete, you can add data from subsequent CSV files
that contain data from that month.
Note
You can only append data at the end of a file, not at the beginning or in the
middle.
Procedure
Click the Save as Month button or select File → Write/Add to Monthly CSV
File.
A dialogue box is displayed to give you information on which files will be
created. It includes a Monthly CSV File Actions list box.
6 Emerson.com/Rosemount
Page 7

January 2021 Manual Supplement
4.2.1 Monthly CSV file actions box
This box shows all monthly file actions that could be possible for the current
data. After each file one of four possible comments is displayed:
• No action
• Add data to file
• Create new file
• Error in file
4.2.2 Monthly CSV file names
LOGView automatically builds up the file names from the Unique ID (5
digits), Year (2 digits) and one letter for the month (A= January etc.).
When saving a data file which starts in February and ends in April, the
dialogue box may say:
0000213B.CSV = February 2013: No action
0000213C.CSV = March 2013: Add data to file
0000213D.CSV = April 2013: Create new file
Manual Supplement 7
Page 8
Manual Supplement January 2021
5 Open data
Menu bar
Toolbar
The Open Data dialogue box is displayed to open an existing CSV file.
LOGView keeps track of the documents you last worked on. You can quickly
open one of the last 6 files used by selecting it from the bottom of the File
menu. Alternatively it can be opened in the normal Windows manner.
An example of a typical data file has been included in the CSV files subdirectory - it is named example.csv.
This example file was created with dates and numbers in the standard UK
format. If the PC is set to a different format the file may still be opened by
using the Open Data International option from the File menu. A dialogue box
will prompt for alternative date and number formats.
File → Open Data
8 Emerson.com/Rosemount
Page 9
January 2021 Manual Supplement
6 Table
Menu bar
Toolbar
Select the table command/button to select the table window. Once data has
been collected or loaded by opening a file, it can be tabulated in several
different ways.
Sample table
Header table
Other table
Day table
(summary)
Day/Month table
(summary)
Month table
(summary)
View → Table
The Sample table contains the transferred data
consisting of sample numbers, dates and times of
samples, sample values and flags. The flags tell you
whether there were any of the following actions
within that sample period:
FL
LE
LE + FL
This table also shows information about a Power
failure.
This table contains the information from the
Rosemount 3493 header block or the CSV file header
block.
This table gives information about Totalizer, Total
Flow and Max. Flow values.
This table gives information about daily summaries.
Summaries include values of Night Flow. The
duration of the night may be defined in Summary in
the Configuration menu
This table shows all daily summaries for one month
in one table.
This table shows the summary of one month.
Fast Logging
Lost Echo or Fault
Lost Echo and Fast Logging
Tables may be navigated by clicking the right mouse button or by selecting
, or simply by using cursor keys.
Manual Supplement 9
Page 10
Manual Supplement January 2021
7 Chart
Menu bar
Toolbar
Select the chart command/button to select the chart window. In this
window the sample data or daily totals may be charted against a variety of
timebases.
The different chart types are:
Samples chart
Total chart
Daily chart
Weekly chart
Monthly chart
(Chart bar)
Average day
View → Chart
Line chart of the sample data.
Bar chart of the daily totals.
Chart of sample data for 24 hours. The 24-hour
period does not necessarily have to start at
midnight. For example, you can chart data from
08:00 to 08:00 the next morning.
Chart of sample data or totalizer data for 7 days. The
first day does not necessarily have to be Monday. For
example, you can chart data from Wednesday to the
following Tuesday.
Chart of sample data or Total data for one calendar
month.
Click the Other button or press F7 to get a list of all
available chart types (i.e., Daily chart, Weekly chart,
Monthly chart, Between Specified Times chart, Show
All chart, and Average day chart).
This chart is available for the sample data and, for
each time of the day, it plots the average value of all
the samples in the data file. So, for example, a chart
of the typical flow for a month may simply be
produced.
The appearance of the charts may be customized by selecting Configuration
→ Chart or by clicking the right mouse button. This also allows the addition
of maximum and minimum limit lines as well as a cursor line which allows
peaks and troughs to be identified accurately.
10 Emerson.com/Rosemount
Page 11
January 2021 Manual Supplement
8 Print
Menu bar
Toolbar
Displays the Print Dialogue Box. It is possible to print out any of the tables,
charts or summaries outlined below:
Daily Summaries
Monthly
Summaries
Current Chart
Print Button
Chart Print Setup
File → Print
You can select the days you want to print. The table
"Day" and all Sample Data will be printed per Day.
Note that a value in a rectangle indicates the number
of missing samples due to a power failure.
You can select the months you want to print. The
tables "Month" and "Day/Month" will be printed for
each month.
Prints the current chart with limit lines (if selected)
but without the cursor line. The Current Chart option
is disabled (greyed-out) if you have no chart view
(window) of the data.
The Print button prints the current chart or table. Set
up the printer using the preferences option in
Windows.
Displays the Chart Print Setup Dialogue Box where
the line or bar colour, line width, bar style, and the
border width can be changed.
Note
All changeable information can be saved in the configuration file. On leaving
LOGView the user is prompted whether changes should be saved. The
normal configuration file is called START.INI but others names may be used if
more than one configuration is to be stored.
Manual Supplement 11
Page 12
Manual Supplement January 2021
9 Site database
Menu bar
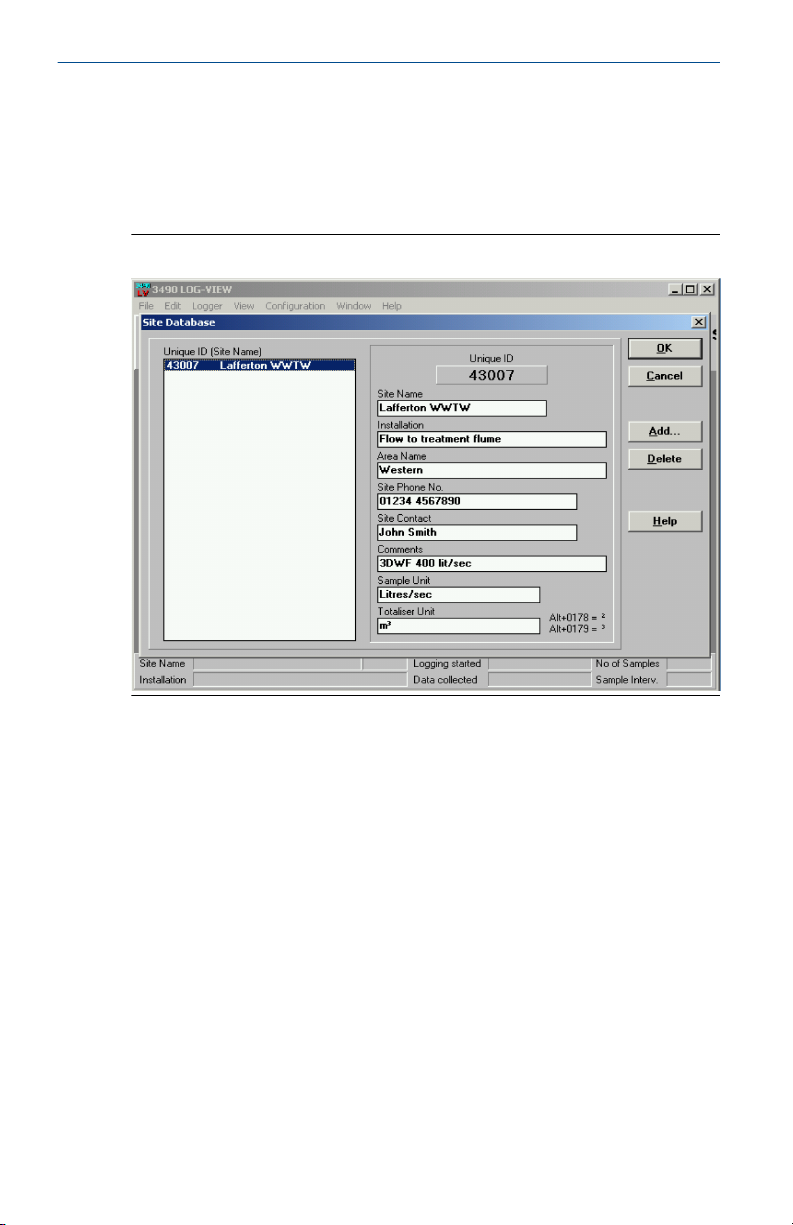
Figure 9-1 shows the Site Database Dialogue window.
Figure 9-1: Site Database Dialogue
Every Rosemount 3493 has a unique ID which it sends to the PC along with
the sample data. This ID gives the information to the software about the site
which assists in the presentation of the data in charts, tables and print-outs.
It is not essential that any data be entered but the fields listed are
particularly useful.
Configuration → Site Database
Site Name
Installation
Sample Unit
Totalizer Unit
Dialogue box options
Add
12 Emerson.com/Rosemount
Appears on the status bar and on print-outs.
Appears on the status bar and on print-outs.
Appears on charts, tables and print-outs.
Appears on charts, tables and print-outs.
To add a new site record to the site database.
Therefore you are asked to enter the Unique ID of
the Rosemount 3493, followed by the site data.
Page 13

January 2021 Manual Supplement
Delete
To delete a record from the site database, select the
Unique ID from the list by clicking on its entry in the
list box, then press Delete.
Note
The site database is saved in the SITEDB.SDB file in the LOGView directory
and, if preferred, it can simply be edited or extended using an ordinary text
editor.
Manual Supplement 13
Page 14

Manual Supplement January 2021
10 Password protection
Menu bar
LOGView can be used to Stop or Restart a Rosemount 3493 using the Logger
Control function from the Logger menu. This control is password protected.
The user password is entered using the Access function from the
Configuration menu. Further users may be added and passwords may be
changed.
Login
Logout
Change Password
Set Access
Configuration → Access
Some menu options are protected by user names
and passwords. If you select such an option before
you have logged in you are asked to login.
To log out the current user.
This option is designed to allow ordinary users to
change their own passwords.
Displays the Edit Users dialogue box. This dialogue
box is designed to enable a 'supervisor' to manage
LOGView users.
14 Emerson.com/Rosemount
Page 15
January 2021 Manual Supplement
11 Help
Menu bar
Toolbar
Executes the LOGView help file and shows the contents page. This gives a
comprehensive help facility, but throughout LOGView there is contextsensitive help available, either by local HELP buttons or by pressing F1.
Help → Contents
Manual Supplement 15
Page 16

*00809-0200-4841*
Manual Supplement
00809-0200-4841, Rev. AC
January 2021
Emerson Automation Solutions
6021 Innovation Blvd.
Shakopee, MN 55379, USA
+1 800 999 9307 or +1 952 906 8888
+1 952 949 7001
[email protected]
Latin America Regional Office
Emerson Automation Solutions
1300 Concord Terrace, Suite 400
Sunrise, FL 33323, USA
+1 954 846 5030
+1 954 846 5121
[email protected]
Asia Pacific Regional Office
Emerson Automation Solutions
1 Pandan Crescent
Singapore 128461
+65 6777 8211
+65 6777 0947
[email protected]
North America Regional Office
Emerson Automation Solutions
8200 Market Blvd.
Chanhassen, MN 55317, USA
+1 800 999 9307 or +1 952 906 8888
+1 952 949 7001
[email protected]
Europe Regional Office
Emerson Automation Solutions Europe
GmbH
Neuhofstrasse 19a P.O. Box 1046
CH 6340 Baar
Switzerland
+41 (0) 41 768 6111
+41 (0) 41 768 6300
[email protected]
Middle East and Africa Regional Office
Emerson Automation Solutions
Emerson FZE P.O. Box 17033
Jebel Ali Free Zone - South 2
Dubai, United Arab Emirates
+971 4 8118100
+971 4 8865465
[email protected]
Linkedin.com/company/Emerson-
Automation-Solutions
Twitter.com/Rosemount_News
Facebook.com/Rosemount
Youtube.com/user/
RosemountMeasurement
©
2021 Emerson. All rights reserved.
Emerson Terms and Conditions of Sale are
available upon request. The Emerson logo is a
trademark and service mark of Emerson Electric
Co. Rosemount is a mark of one of the Emerson
family of companies. All other marks are the
property of their respective owners.
 Loading...