


R&S®VSE-K96
OFDM Vector Signal Analysis
Application
User Manual
(;ÜÆU2)
1178563702
Version 10

This manual applies to the following software, version 2.20 and later:
●
R&S®VSE Enterprise Edition base software (1345.1105.06)
●
R&S®VSE Basic Edition base software (1345.1011.06)
The following software options are described:
●
R&S VSE-K96 (1320.7922.02)
●
R&S VSE-KT96 (1345.1792.02)
© 2022 Rohde & Schwarz GmbH & Co. KG
Muehldorfstr. 15, 81671 Muenchen, Germany
Phone: +49 89 41 29 - 0
Email: info@rohde-schwarz.com
Internet: www.rohde-schwarz.com
Subject to change – data without tolerance limits is not binding.
R&S® is a registered trademark of Rohde & Schwarz GmbH & Co. KG.
All other trademarks are the properties of their respective owners.
1178.5637.02 | Version 10 | R&S®VSE-K96
Throughout this manual, products from Rohde & Schwarz are indicated without the ® symbol, e.g. R&S®VSE is indicated as
R&S VSE.

R&S®VSE-K96
1.1 Introduction to vector signal analysis........................................................................ 5
1.2 Starting the R&S VSE OFDM VSA application........................................................... 6
1.3 Understanding the display information...................................................................... 7
2.1 OFDM VSA parameters...............................................................................................10
2.2 Evaluation methods for OFDM VSA measurements................................................ 11
3.1 General information on OFDM signals......................................................................31
3.2 Signal processing....................................................................................................... 38
Contents
Contents
1 Welcome to the OFDM vector signal analysis (VSA) application......5
2 OFDM VSA measurement and results................................................10
3 Measurement basics............................................................................31
3.3 Sample rate, record length and analysis bandwidth............................................... 42
3.4 DFT-S precoding......................................................................................................... 43
4 Configuring OFDM VSA measurements............................................ 46
4.1 Configuration overview.............................................................................................. 46
4.2 Signal description....................................................................................................... 48
4.3 Input and frontend settings........................................................................................52
4.4 Trigger settings........................................................................................................... 65
4.5 Data acquisition.......................................................................................................... 69
4.6 Burst search................................................................................................................ 72
4.7 Result ranges.............................................................................................................. 73
4.8 Synchronization, demodulation and tracking.......................................................... 74
4.9 Adjusting settings automatically...............................................................................78
5 Creating a configuration file using the wizard.................................. 81
5.1 Understanding the R&S VSE-K96 Configuration File Wizard display....................82
5.2 Configuration steps.................................................................................................... 89
5.3 Reference of wizard menu functions........................................................................ 96
5.4 Example: creating a configuration file from an input signal...................................99
6 Analyzing OFDM VSA vector signals............................................... 107
6.1 Result configuration................................................................................................. 107
6.2 Table configuration................................................................................................... 109
3User Manual 1178.5637.02 ─ 10

R&S®VSE-K96
6.3 Units........................................................................................................................... 110
6.4 Y-Scaling.................................................................................................................... 111
6.5 Markers.......................................................................................................................113
6.6 Trace settings............................................................................................................ 119
6.7 Trace / data export configuration............................................................................ 120
8.1 Introduction............................................................................................................... 125
8.2 Common suffixes...................................................................................................... 130
8.3 Activating OFDM VSA measurements.................................................................... 130
8.4 Configuring OFDM VSA............................................................................................131
Contents
7 How to perform measurements in the R&S VSE OFDM VSA applica-
tion.......................................................................................................123
8 Remote commands for OFDM VSA.................................................. 125
8.5 Analysis..................................................................................................................... 203
8.6 Configuring the result display................................................................................. 228
8.7 Retrieving results......................................................................................................237
8.8 Status reporting system........................................................................................... 262
8.9 Deprecated commands.............................................................................................265
8.10 Programming examples: OFDM vector signal analysis........................................ 266
Annex.................................................................................................. 271
A Menu reference...................................................................................273
A.1 Common R&S VSE menus....................................................................................... 273
A.2 OFDM vector signal analysis menus.......................................................................275
B Reference of toolbar functions......................................................... 278
C Formulae.............................................................................................282
C.1 Error vector magnitude (EVM)................................................................................. 282
C.2 I/Q impairments......................................................................................................... 283
D Reference: IQW format specification for user-defined constellation
points.................................................................................................. 284
List of commands (OFDM VSA)........................................................ 286
Index....................................................................................................293
4User Manual 1178.5637.02 ─ 10

R&S®VSE-K96
1 Welcome to the OFDM vector signal analy-
Welcome to the OFDM vector signal analysis (VSA) application
Introduction to vector signal analysis
sis (VSA) application
The R&S VSE OFDM VSA application performs vector and scalar measurements on
digitally modulated OFDM signals. To perform the measurements it converts RF signals into the complex baseband.
The R&S VSE OFDM VSA application features:
●
Analysis of non-standard and standard-conform OFDM systems
●
I/Q-based measurement results such as EVM, constellation diagrams, power spectrum
This user manual contains a description of the functionality that the application provides, including remote control operation.
Functions that are not discussed in this manual are the same as in the I/Q Analyzer
application and are described in the R&S VSE base software user manual. The latest
version is available for download at the product homepage http://www.rohde-
schwarz.com/product/VSE.html.
● Introduction to vector signal analysis........................................................................ 5
● Starting the R&S VSE OFDM VSA application......................................................... 6
● Understanding the display information......................................................................7
1.1 Introduction to vector signal analysis
The goal of vector signal analysis is to determine the quality of the signal that is transmitted by the device under test (DUT) by comparing it against an ideal signal. The DUT
is usually connected with the analyzer via a cable. The key task of the analyzer is to
determine the ideal signal. Hence, the analyzer aims to reconstruct the ideal signal
from the measured signal that is transmitted by the DUT. This ideal signal is commonly
referred to as the reference signal, while the signal from the DUT is called the mea-
surement signal.
After extracting the reference signal, the R&S VSE OFDM VSA application compares
the measurement signal and the reference signal, and the results of this comparison
are displayed.
Example:
The most common vector signal analysis measurement is the EVM ("Error Vector Magnitude") measurement. Here, the complex baseband reference signal is subtracted
from the complex baseband measurement signal. The magnitude of this error vector
represents the EVM value. The EVM has the advantage that it "summarizes" all potential errors and distortions in one single value. If the EVM value is low, the signal quality
of the DUT is high.
5User Manual 1178.5637.02 ─ 10

R&S®VSE-K96
1.2 Starting the R&S VSE OFDM VSA application
Welcome to the OFDM vector signal analysis (VSA) application
Starting the R&S VSE OFDM VSA application
Figure 1-1: Simplified schema of vector signal analysis
OFDM Vector Signal Analysis is a separate application on the R&S VSE. It is activated
by creating a new measurement channel in OFDM VSA mode.
To activate the R&S VSE OFDM VSA application
1.
Select the "Add Channel" function in the Sequence tool window.
A dialog box opens that contains all operating modes and applications currently
available in your R&S VSE.
6User Manual 1178.5637.02 ─ 10

R&S®VSE-K96
Welcome to the OFDM vector signal analysis (VSA) application
Understanding the display information
2. Select the "OFDM VSA" item.
The R&S VSE opens a new measurement channel for the R&S VSE OFDM VSA
application.
1.3 Understanding the display information
The following figure shows a measurement diagram during analyzer operation. All different information areas are labeled. They are explained in more detail in the following
sections.
7User Manual 1178.5637.02 ─ 10

R&S®VSE-K96
Welcome to the OFDM vector signal analysis (VSA) application
Understanding the display information
1
2
1
1 = Color coding for windows of same channel
2 = Channel bar with measurement settings
3 = Window title bar with diagram-specific (trace) information
4 = Diagram area
5 = Diagram footer with diagram-specific information, depending on result display
3
4
5
Channel bar information
In the R&S VSE OFDM VSA application, the R&S VSE shows the following settings:
Table 1-1: Information displayed in the channel bar in R&S VSE OFDM VSA application application
Ref Level Reference level
Att Mechanical and electronic RF attenuation
Freq Center frequency for the RF signal
Offset Reference level offset
SRate Sample Rate
Config Currently loaded configuration file
Capture Time How long data was captured in current sweep
FFT FFT size
CP Length Cyclic prefix length
Res Len Result length
In addition, the channel bar also displays information on instrument settings that affect
the measurement results even though this is not immediately apparent from the display
of the measured values (e.g. transducer or trigger settings). This information is displayed only when applicable for the current measurement. For details see the
R&S VSE Base Software User Manual.
Window title bar information
For each diagram, the header provides the following information:
8User Manual 1178.5637.02 ─ 10

R&S®VSE-K96
Welcome to the OFDM vector signal analysis (VSA) application
Understanding the display information
0
21 64 75
Figure 1-2: Window title bar information in R&S VSE OFDM VSA application
0 = Color coding for windows of same channel
1 = Edit result display function
2 = Channel name
3 = Window number
4 = Window type
5 = Trace color, trace number, trace mode
6 = Dock/undock window function
7 = Close window function
3
Diagram area
The diagram area displays the results according to the selected result displays (see
Chapter 2.2, "Evaluation methods for OFDM VSA measurements", on page 11).
Diagram footer information
The diagram footer (beneath the diagram) contains the start and stop symbols or time
of the evaluation range.
Status bar information
The software status, errors and warnings and any irregularities in the software are indicated in the status bar at the bottom of the R&S VSE window.
9User Manual 1178.5637.02 ─ 10

R&S®VSE-K96
2 OFDM VSA measurement and results
OFDM VSA measurement and results
OFDM VSA parameters
For each measurement, a separate measurement channel is activated. Each measurement channel can provide multiple result displays, which are displayed in individual
windows. The measurement windows can be rearranged and configured in the
R&S VSE to meet your requirements. All windows that belong to the same measurement (including the channel bar) are indicated by a colored line at the top of the window title bar.
To add further result displays for the OFDM VSA channel
►
Select the
"Add Window" icon from the toolbar, or select the "Window > New
Window" menu item.
For details on working with channels and windows, see the "Operating Basics" chapter
in the R&S VSE base software user manual.
● OFDM VSA parameters.......................................................................................... 10
● Evaluation methods for OFDM VSA measurements...............................................11
2.1 OFDM VSA parameters
Several signal parameters are determined during vector signal analysis and displayed
in the Result Summary.
For details concerning the calculation of individual parameters, see Chapter C, "Formu-
lae", on page 282.
Table 2-1: OFDM VSA parameters
Parameter Description SCPI Parameter *)
EVM All [%/dB] Error Vector Magnitude of the payload symbols over all carri-
ers (except the guard carriers)
EVM Data Symbols
[%/dB]
Error Vector Magnitude of the payload symbols over all data
carriers
EVM[:ALL]
EVM:DATA
EVM Pilot Symbols
[%/dB]
MER [dB] Average Modulation Error Ratio (MER) for all data and all
I/Q offset [dB] Transmitter center frequency leakage relative to the total Tx
Gain imbalance [dB] Amplification of the quadrature phase component of the sig-
*) Required to retrieve the parameter result,
See FETCh:SUMM:<parameter>:<statistic> on page 241
Error Vector Magnitude of the payload symbols over all pilot
carriers
pilot cells of the analyzed frames. The MER is the ratio of the
RMS power of the ideal reference signal to the RMS power
of the error vector.
channel power
nal relative to the amplification of the in-phase component
EVM:PILot
MER[:ALL]
IQOFset
GIMBalance
10User Manual 1178.5637.02 ─ 10

R&S®VSE-K96
OFDM VSA measurement and results
Evaluation methods for OFDM VSA measurements
Parameter Description SCPI Parameter *)
Quadrature error [°] Phase angle between Q-channel and I-channel deviating
from the ideal 90 degrees; measure for crosstalk from the Qbranch into the I-branch
Frequency Error [Hz] Frequency error between the signal and the currently defined
center frequency
The absolute frequency error includes the frequency error of
the connected instrument and that of the DUT. If possible,
the transmitter connected instrument and the DUT should be
synchronized (using an external reference).
See R&S VSE base software user manual > "Configuring
Instruments"
Sample Clock Error Clock error between the signal and the sample clock of the
R&S VSE in parts per million (ppm), i.e. the symbol timing
error
The sample clock error is only estimated if at least one of the
following conditions applies:
●
At least 2 subcarriers have 4 or more pilot cells
●
At least 256 subcarriers have 2 or more pilot cells
Otherwise, the sample clock error is indicated as "---" and
treated as 0 for compensation purposes.
If possible, the transmitter connected instrument and the
DUT should be synchronized (using an external reference).
See R&S VSE base software user manual > "Configuring
Instruments"
Frame Power Average time domain power of the analyzed signal frame
QUADerror
FERRor
SERRor
POWer
Crest factor [dB] The ratio of the peak power to the mean power of the ana-
lyzed signal frame
*) Required to retrieve the parameter result,
See FETCh:SUMM:<parameter>:<statistic> on page 241
CRESt
The R&S VSE OFDM VSA application also performs statistical evaluation over several
frames and displays the following results:
Table 2-2: Calculated summary results
Result type Description
Min Minimum measured value
Average Average measured value
Max Maximum measured value
2.2 Evaluation methods for OFDM VSA measurements
The data that was measured by the R&S VSE can be evaluated using various different
methods without having to start a new measurement. Which results are displayed
depends on the selected evaluation.
The OFDM VSA measurement provides the following evaluation methods:
11User Manual 1178.5637.02 ─ 10
R&S®VSE-K96
OFDM VSA measurement and results
Evaluation methods for OFDM VSA measurements
Allocation Matrix............................................................................................................12
Bitstream.......................................................................................................................13
CCDF............................................................................................................................ 14
Channel Flatness.......................................................................................................... 15
Constellation Diagram...................................................................................................15
Constellation vs Carrier.................................................................................................17
Constellation vs Symbol................................................................................................18
EVM vs Carrier..............................................................................................................19
EVM vs Symbol.............................................................................................................20
EVM vs Symbol vs Carrier............................................................................................ 21
Group Delay..................................................................................................................22
Impulse Response........................................................................................................ 23
Magnitude Capture........................................................................................................24
Marker Table................................................................................................................. 25
Power vs Carrier........................................................................................................... 25
Power vs Symbol.......................................................................................................... 26
Power vs Symbol vs Carrier..........................................................................................27
Power Spectrum............................................................................................................28
Result Summary............................................................................................................29
Signal Flow....................................................................................................................30
Trigger to Sync..............................................................................................................30
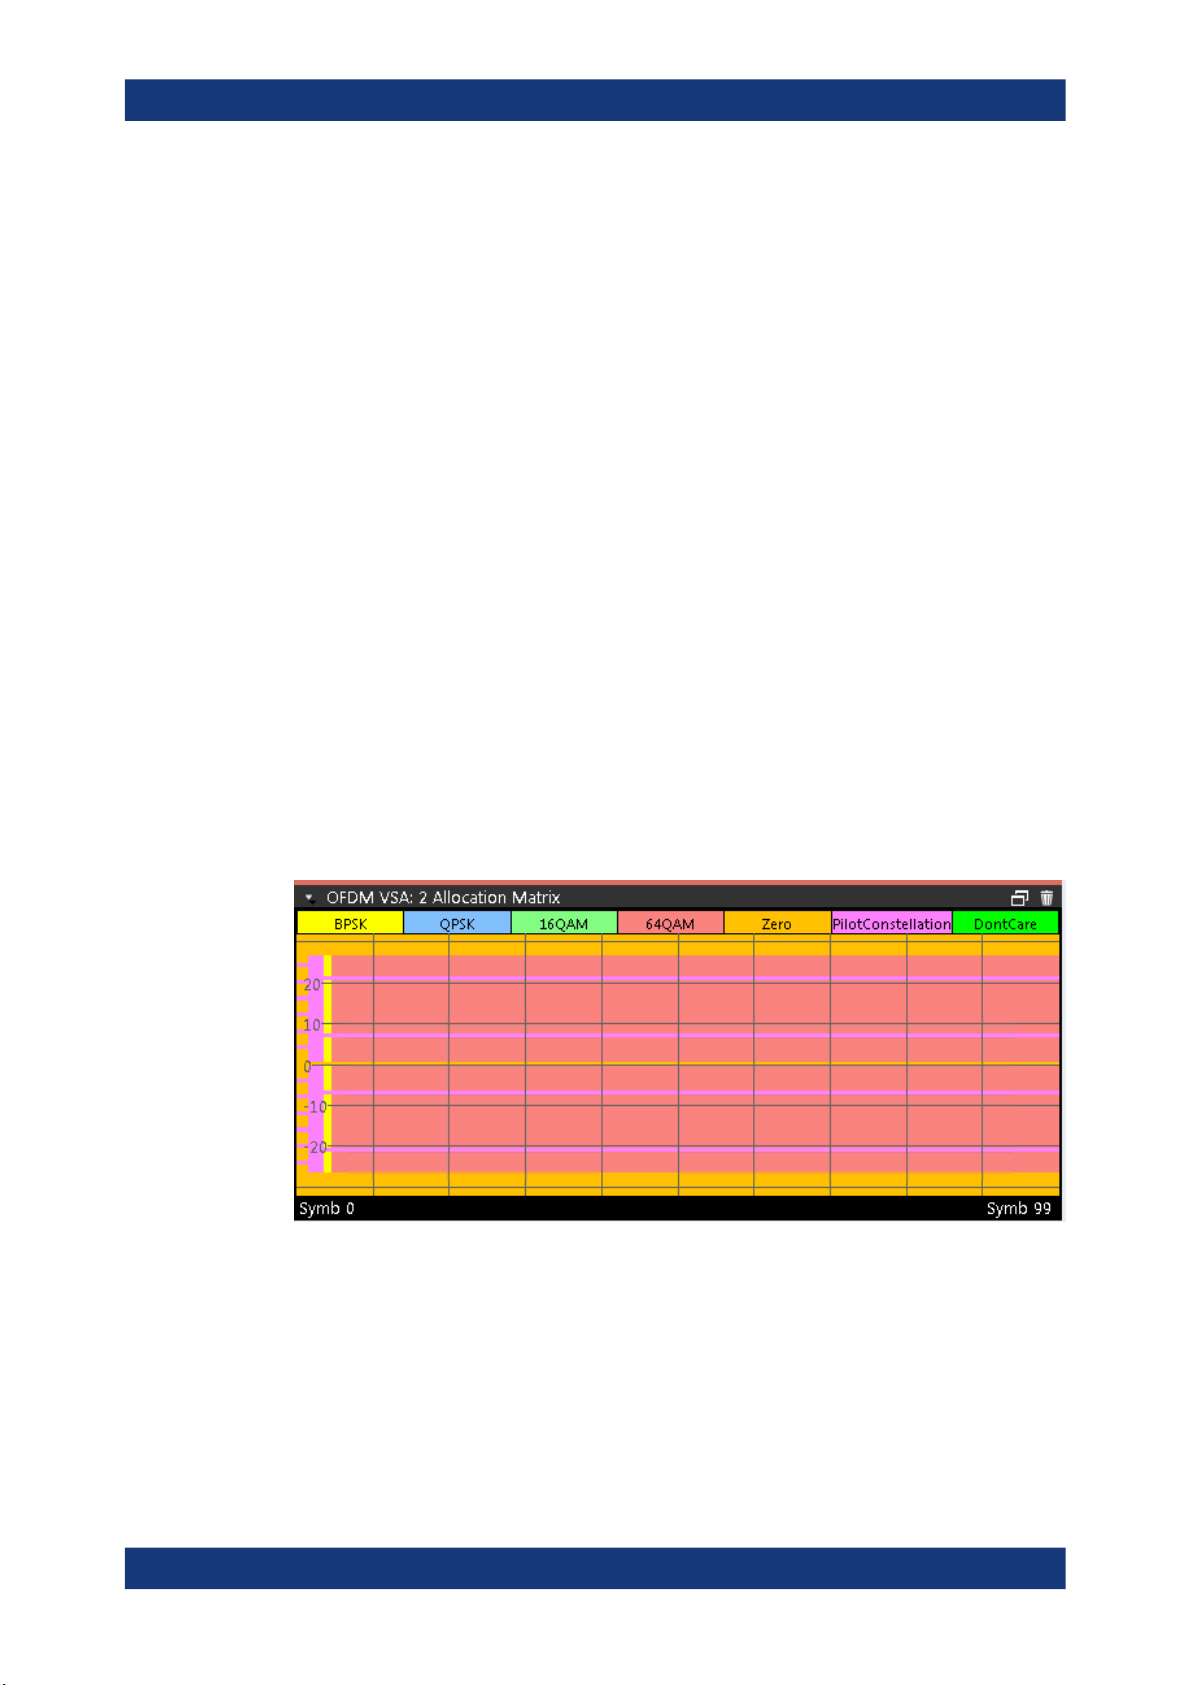
Allocation Matrix
The Allocation Matrix display is a graphical representation of the OFDM cell structure
defined in the currently loaded configuration file.
Use markers to get more detailed information on the individual cells.
Figure 2-1: Allocation Matrix
The legend for the color coding is displayed at the top of the matrix.
Note: Markers in the Allocation Matrix. Using markers you can detect individual alloca-
tion points for a specific symbol or carrier. When you activate a marker in the Allocation
Matrix, its position is defined by the symbol and carrier number the point belongs to.
The marker result indicates the I and Q values of the point.
See also "Markers in the Constellation diagram and Allocation Matrix" on page 113.
12User Manual 1178.5637.02 ─ 10
R&S®VSE-K96
OFDM VSA measurement and results
Evaluation methods for OFDM VSA measurements
Remote command:
LAY:ADD? '1',RIGH,AMATrix, see LAYout:ADD[:WINDow]? on page 231
TRACe<n>[:DATA]? on page 251, see Chapter 8.7.4.1, "Allocation matrix",
on page 256
TRACe<n>[:DATA]:X? on page 251
TRACe<n>[:DATA]:Y? on page 252
Symbol unit: UNIT:SAXes on page 210
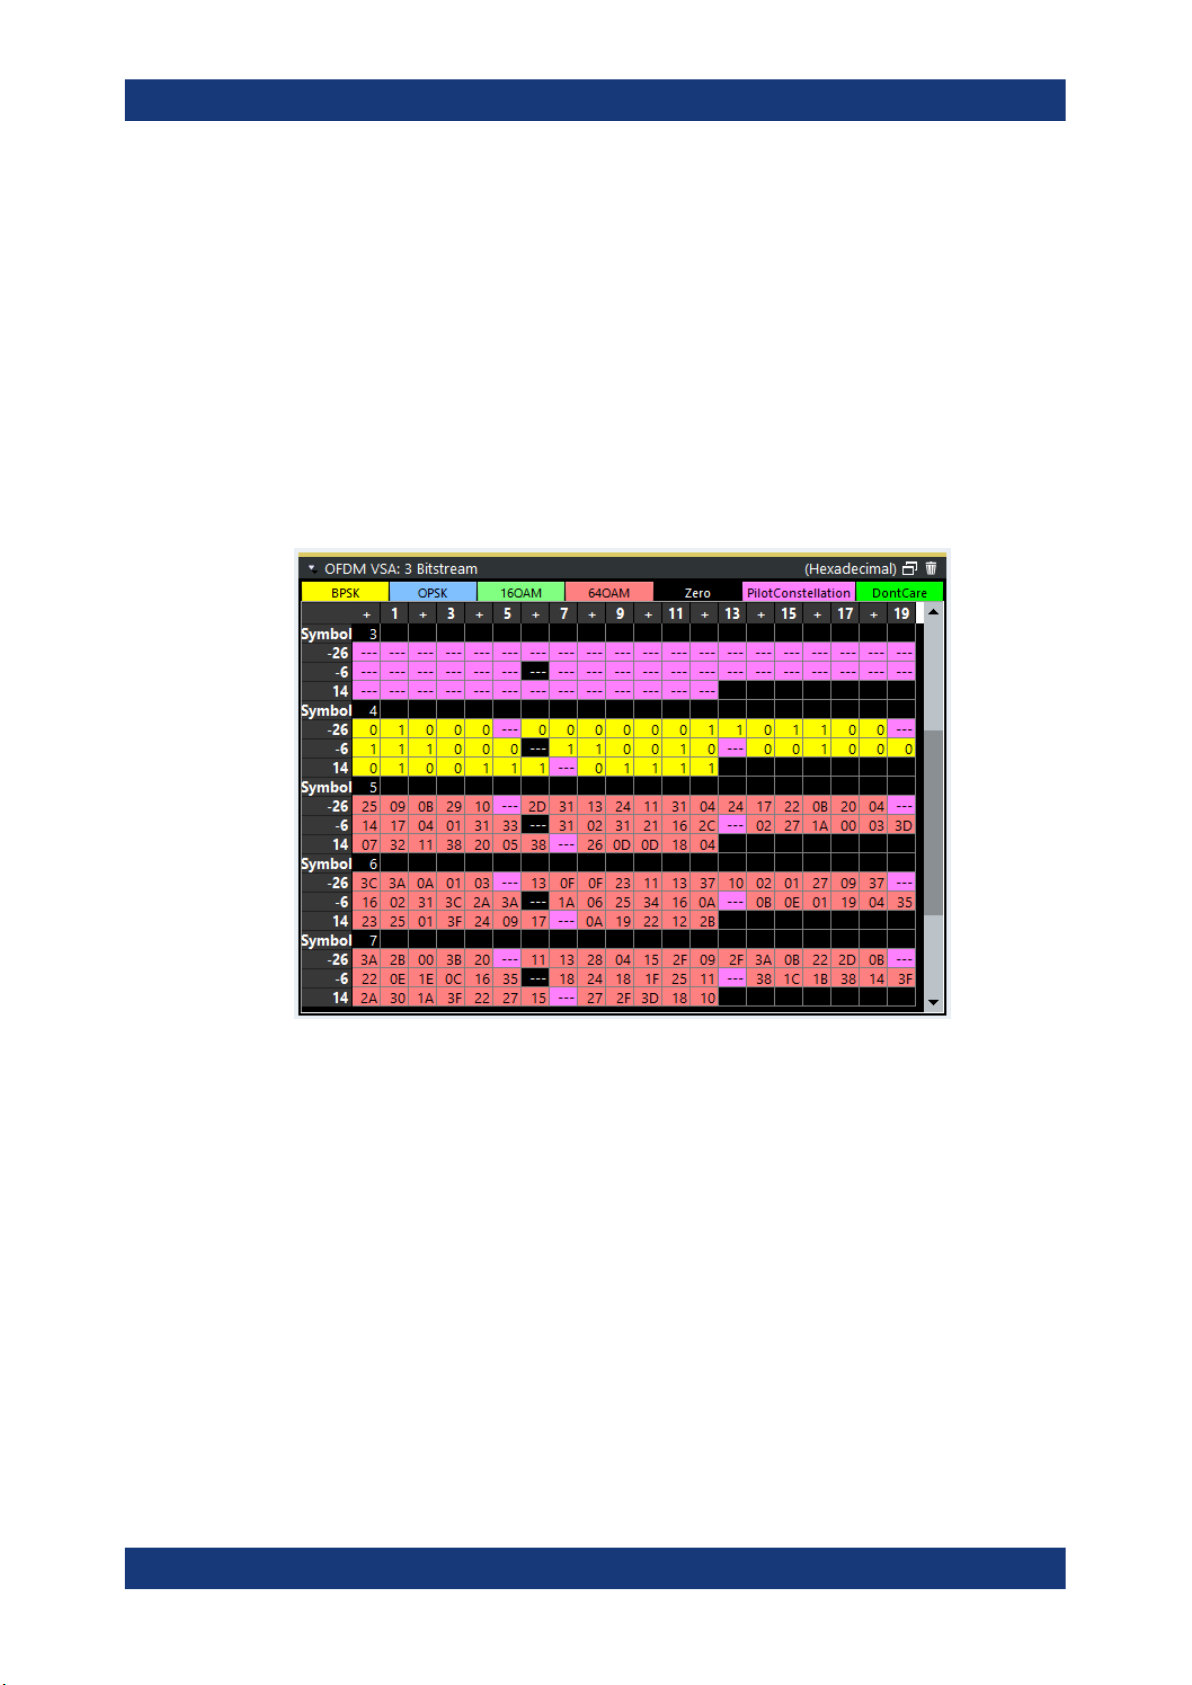
Bitstream
This result display shows a demodulated data stream for the symbols in the currently
analyzed result ranges. The different modulation types are indicated by color, as
shown in the legend at the top of the window. Guard carriers are not included in the
display, but are returned as non-data cells ("---") in trace export files.
The bitstream is derived from the order of the constellation points in the configuration
file.
13User Manual 1178.5637.02 ─ 10
R&S®VSE-K96
OFDM VSA measurement and results
Evaluation methods for OFDM VSA measurements
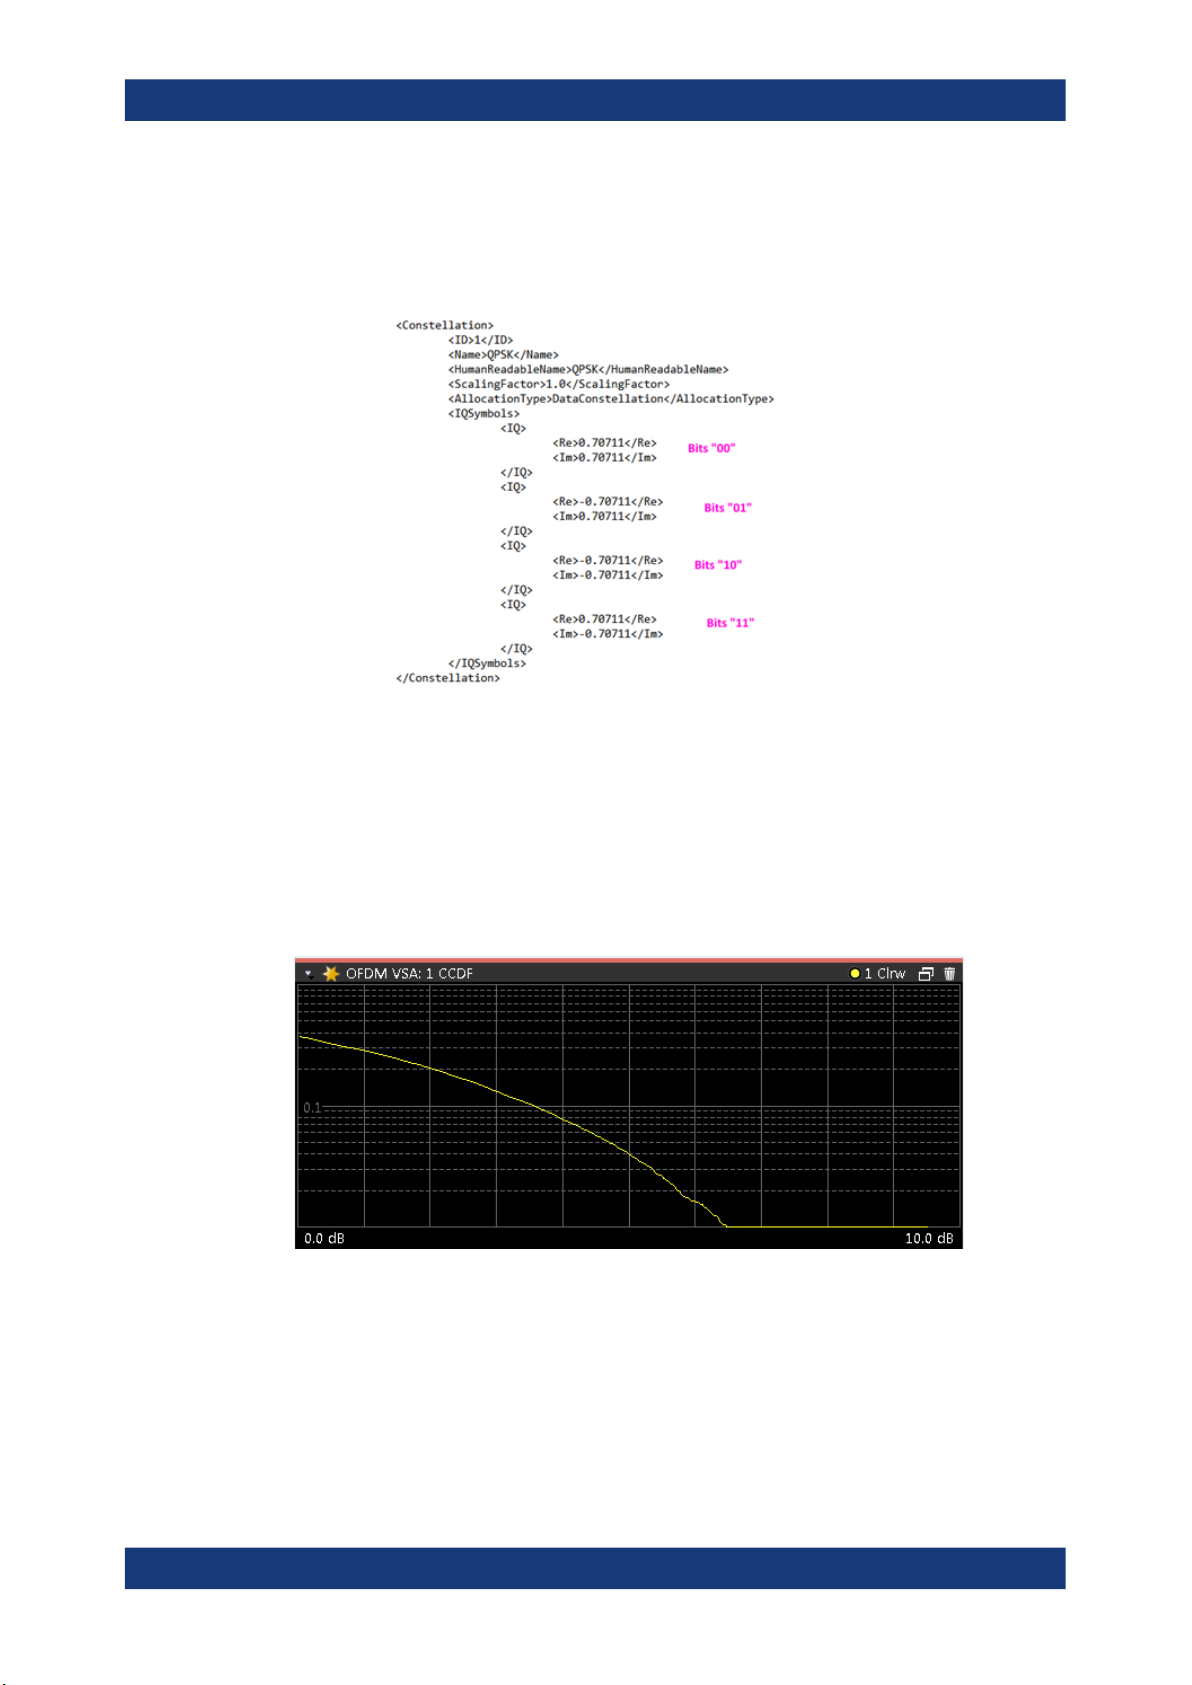
Example:
For QPSK, the value that is in the first position defines "00", the value that is in the second position defines "01", the value that is in the third position "10" and the last value
"11".
Figure 2-2: Extract from configuration file defining the constellation points
Remote command:
LAY:ADD? '1',RIGH,BITS, see LAYout:ADD[:WINDow]? on page 231
TRACe:DATA?, see Chapter 8.7.4.2, "Bitstream", on page 256
CCDF
The CCDF results display shows the probability of an amplitude exceeding the mean
power. The x-axis displays power relative to the measured mean power.
Figure 2-3: CCDF display
Remote command:
LAY:ADD? '1',RIGH,CCDF, see LAYout:ADD[:WINDow]? on page 231
TRACe:DATA?, see Chapter 8.7.4.3, "CCDF", on page 256
TRACe<n>[:DATA]:X? on page 251
14User Manual 1178.5637.02 ─ 10

R&S®VSE-K96
OFDM VSA measurement and results
Evaluation methods for OFDM VSA measurements
Channel Flatness
The Channel Flatness display shows the amplitude of the channel transfer function vs.
carrier.
The statistic is performed over all analyzed frames.
Figure 2-4: Channel Flatness Display
Remote command:
LAY:ADD? '1',RIGH,CHFL, see LAYout:ADD[:WINDow]? on page 231
TRACe:DATA?, see Chapter 8.7.4.4, "Channel flatness", on page 256
TRACe<n>[:DATA]:X? on page 251
Carrier unit: UNIT:CAXes on page 209
Constellation Diagram
The Constellation Diagram shows the inphase and quadrature results for the analyzed
input data. The ideal points for the selected cell types are displayed for reference purposes.
15User Manual 1178.5637.02 ─ 10

R&S®VSE-K96
OFDM VSA measurement and results
Evaluation methods for OFDM VSA measurements
Figure 2-5: Constellation diagram
The legend for the color coding is displayed at the top of the matrix. If you click on one
of the codes, only the selected constellation points are displayed. Click again, and all
constellation points are displayed again (according to the constellation filter).
See Chapter 6.1, "Result configuration", on page 107.
Note: Markers in the Constellation diagram. Using markers you can detect individual
constellation points for a specific symbol or carrier. When you activate a marker in the
Constellation diagram, its position is defined by the symbol and carrier number the
point belongs to. The marker result indicates the I and Q values of the point.
16User Manual 1178.5637.02 ─ 10

R&S®VSE-K96
OFDM VSA measurement and results
Evaluation methods for OFDM VSA measurements
Figure 2-6: Marker in a Constellation diagram
See also "Markers in the Constellation diagram and Allocation Matrix" on page 113.
Remote command:
LAY:ADD? '1',RIGH,CONS, see LAYout:ADD[:WINDow]? on page 231
TRACe:DATA?, see Chapter 8.7.4.5, "Constellation diagram", on page 257
Marker I/Q values:
CALCulate<n>:MARKer<m>:Z on page 248
Constellation vs Carrier
The Constellation vs. Carrier display shows the inphase and quadrature magnitude
results of all analyzed symbols over the corresponding carriers. The inphase values
are displayed as yellow dots; the quadrature-values are displayed as blue dots.
17User Manual 1178.5637.02 ─ 10

R&S®VSE-K96
OFDM VSA measurement and results
Evaluation methods for OFDM VSA measurements
Figure 2-7: Constellation vs. Carrier display
Note: This result display is only available if synchronization is successful.
Remote command:
LAY:ADD? '1',RIGH,CCAR, see LAYout:ADD[:WINDow]? on page 231
TRACe:DATA?, see Chapter 8.7.4, "Using the TRACe[:DATA] command", on page 255
Carrier unit: UNIT:CAXes on page 209
Symbol selection for marker: CALCulate<n>:MARKer<m>:Z on page 248
Constellation vs Symbol
The Constellation vs. Symbol display shows the inphase and quadrature magnitude
results of all analyzed carriers over the corresponding symbols. The inphase values
are displayed as yellow dots; the quadrature-values are displayed as blue dots.
18User Manual 1178.5637.02 ─ 10

R&S®VSE-K96
OFDM VSA measurement and results
Evaluation methods for OFDM VSA measurements
Figure 2-8: Constellation vs. Symbol display
Note: This result display is only available if synchronization is successful.
Remote command:
LAY:ADD? '1',RIGH,CSYM, see LAYout:ADD[:WINDow]? on page 231
TRACe:DATA?, see Chapter 8.7.4, "Using the TRACe[:DATA] command", on page 255
Symbol unit: UNIT:SAXes on page 210
Carrier selection for marker: CALCulate<n>:MARKer<m>:Z on page 248
EVM vs Carrier
The EVM vs Carrier display shows the EVM of each carrier of the analyzed signal
frame in the frequency domain. The results are provided in dB. Multiple traces display
statistical evaluations over carriers.
19User Manual 1178.5637.02 ─ 10

R&S®VSE-K96
OFDM VSA measurement and results
Evaluation methods for OFDM VSA measurements
Figure 2-9: EVM vs Carrier display
Note: This result display is only available if synchronization is successful.
Guard carriers to the left and right of the spectrum are not included in the EVM calculation. However, zero cells and the DC carrier are included.
Remote command:
LAY:ADD? '1',RIGH,EVC, see LAYout:ADD[:WINDow]? on page 231
TRACe:DATA?, see Chapter 8.7.4.8, "EVM vs carrier", on page 259
TRACe<n>[:DATA]:X? on page 251
Carrier unit: UNIT:CAXes on page 209
EVM unit: UNIT:EVM on page 209
EVM vs Symbol
The EVM vs. Symbol display shows the EVM of each symbol of the analyzed signal
frame in the time domain. The results are provided in dB. Multiple traces display statistical evaluations over symbols.
Blue lines indicate the border between different OFDM frames if more than one frame
is analyzed.
20User Manual 1178.5637.02 ─ 10

R&S®VSE-K96
OFDM VSA measurement and results
Evaluation methods for OFDM VSA measurements
Figure 2-10: EVM vs Symbol display
Note: This result display is only available if synchronization is successful.
Guard carriers to the left and right of the spectrum are not included in the EVM calculation. However, zero cells and the DC carrier are included.
Remote command:
LAY:ADD? '1',RIGH,EVSY, see LAYout:ADD[:WINDow]? on page 231
TRACe:DATA?, see Chapter 8.7.4.9, "EVM vs symbol", on page 259
TRACe<n>[:DATA]:X? on page 251
Symbol unit: UNIT:SAXes on page 210
EVM unit: UNIT:EVM on page 209
EVM vs Symbol vs Carrier
The EVM vs Symbol vs Carrier display shows the EVM of each carrier (frequency
domain) and in each symbol (time domain) of the analyzed signal frame.
The results are provided in dB or percent, depending on the unit settings.
21User Manual 1178.5637.02 ─ 10

R&S®VSE-K96
OFDM VSA measurement and results
Evaluation methods for OFDM VSA measurements
Figure 2-11: EVM vs Symbol vs Carrier display
The EVM values are represented by colors. The corresponding color map is displayed
at the top of the result display.
Note: This result display is only available if synchronization is successful.
Remote command:
LAY:ADD? '1',RIGH,EVSC, see LAYout:ADD[:WINDow]? on page 231
TRACe:DATA?, see Chapter 8.7.4.10, "EVM vs symbol vs carrier", on page 260
TRACe<n>[:DATA]:X? on page 251
TRACe<n>[:DATA]:Y? on page 252
Carrier unit: UNIT:CAXes on page 209
Symbol unit: UNIT:SAXes on page 210
EVM unit: UNIT:EVM on page 209
Carrier selection for marker: CALCulate<n>:MARKer<m>:Z on page 248
Group Delay
The Group Delay display shows the relative group delay of the transmission channel
per carrier.
Multiple traces display statistical evaluations over all analyzed frames.
22User Manual 1178.5637.02 ─ 10

R&S®VSE-K96
OFDM VSA measurement and results
Evaluation methods for OFDM VSA measurements
Remote command:
LAY:ADD? '1',RIGH,GDEL, see LAYout:ADD[:WINDow]? on page 231
TRACe:DATA?, see Chapter 8.7.4.11, "Group delay", on page 260
TRACe<n>[:DATA]:X? on page 251
Carrier unit: UNIT:CAXes on page 209
Impulse Response
The "Channel Impulse Response" display shows the impulse response of the channel
and its position within the guard interval. The start and the end of the cyclic prefix are
marked with blue lines.
Multiple traces display statistical evaluations over all analyzed frames.
23User Manual 1178.5637.02 ─ 10

R&S®VSE-K96
OFDM VSA measurement and results
Evaluation methods for OFDM VSA measurements
Figure 2-12: Channel Impulse Response Display
Remote command:
LAY:ADD? '1',RIGH,IRES, see LAYout:ADD[:WINDow]? on page 231
TRACe:DATA?, see Chapter 8.7.4.12, "Impulse response", on page 260
TRACe<n>[:DATA]:X? on page 251
Linear/ logarithmic scaling: UNIT:IRESponse on page 210
Magnitude Capture
The capture buffer contains the complete range of captured data for the last sweep.
The "Magnitude Capture" display shows the power of the captured I/Q data in dBm
versus time. The analyzed frames are identified with a green bar at the bottom of the
"Magnitude Capture" display.
24User Manual 1178.5637.02 ─ 10

R&S®VSE-K96
OFDM VSA measurement and results
Evaluation methods for OFDM VSA measurements
Figure 2-13: Magnitude Capture display
Remote command:
LAY:ADD? '1',RIGH,MCAP, see LAYout:ADD[:WINDow]? on page 231
TRACe:DATA?, see Chapter 8.7.4.13, "Magnitude capture", on page 261
TRACe<n>[:DATA]:X? on page 251
Time unit: UNIT:TAXes on page 211
Marker Table
Displays a table with the current marker values for the active markers.
This table is displayed automatically if configured accordingly.
Remote command:
LAY:ADD? '1',RIGH, MTAB, see LAYout:ADD[:WINDow]? on page 231
Results:
CALCulate<n>:MARKer<m>:X on page 215
CALCulate<n>:MARKer<m>:Y? on page 247
Power vs Carrier
The Power vs. Carrier display shows the power of all OFDM symbols in the analyzed
signal frames for each carrier. The power is measured with a resolution bandwidth
equal to the carrier spacing.
25User Manual 1178.5637.02 ─ 10

R&S®VSE-K96
OFDM VSA measurement and results
Evaluation methods for OFDM VSA measurements
Multiple traces display statistical evaluations over all analyzed frames.
Figure 2-14: Power vs Carrier display
Note: This result display is only available if synchronization is successful.
Remote command:
LAY:ADD? '1',RIGH,PCAR, see LAYout:ADD[:WINDow]? on page 231
TRACe:DATA?, see Chapter 8.7.4.14, "Power vs carrier", on page 261
TRACe<n>[:DATA]:X? on page 251
Carrier unit: UNIT:CAXes on page 209
Power vs Symbol
The Power vs Symbol display shows the power of all OFDM carriers in the analyzed
signal frames for each symbol. The power is measured with a resolution bandwidth
equal to the carrier spacing. Carriers which contain 'Zero'-cells over the complete symbol range (e.g. guard carriers or DC carrier) are excluded.
Multiple traces display statistical evaluations over all analyzed frames.
Vertical blue lines indicate the borders between frames.
26User Manual 1178.5637.02 ─ 10

R&S®VSE-K96
OFDM VSA measurement and results
Evaluation methods for OFDM VSA measurements
Figure 2-15: Power vs Symbol display
Note: This result display is only available if synchronization is successful.
Remote command:
LAY:ADD? '1',RIGH,PSYM, see LAYout:ADD[:WINDow]? on page 231
TRACe:DATA?, see Chapter 8.7.4.15, "Power vs symbol", on page 261
TRACe<n>[:DATA]:X? on page 251
Symbol unit: UNIT:SAXes on page 210
Power vs Symbol vs Carrier
The Power vs Carrier vs Symbol display shows the power of each carrier (= frequency
domain) in each symbol (= time domain) of the analyzed signal frames in dBm. The
power is measured with a resolution bandwidth that equals the carrier spacing.
Figure 2-16: Power vs Symbol vs Carrier display
27User Manual 1178.5637.02 ─ 10
R&S®VSE-K96
OFDM VSA measurement and results
Evaluation methods for OFDM VSA measurements
The power levels are represented by colors. The corresponding color map is displayed
at the top of the result display.
Note: This result display is only available if synchronization is successful.
Remote command:
LAY:ADD? '1',RIGH,PSC, see LAYout:ADD[:WINDow]? on page 231
TRACe:DATA?, see Chapter 8.7.4.16, "Power vs symbol vs carrier", on page 262
TRACe<n>[:DATA]:X? on page 251
TRACe<n>[:DATA]:Y? on page 252
Carrier unit: UNIT:CAXes on page 209
Symbol unit: UNIT:SAXes on page 210
Carrier selection for marker: CALCulate<n>:MARKer<m>:Z on page 248
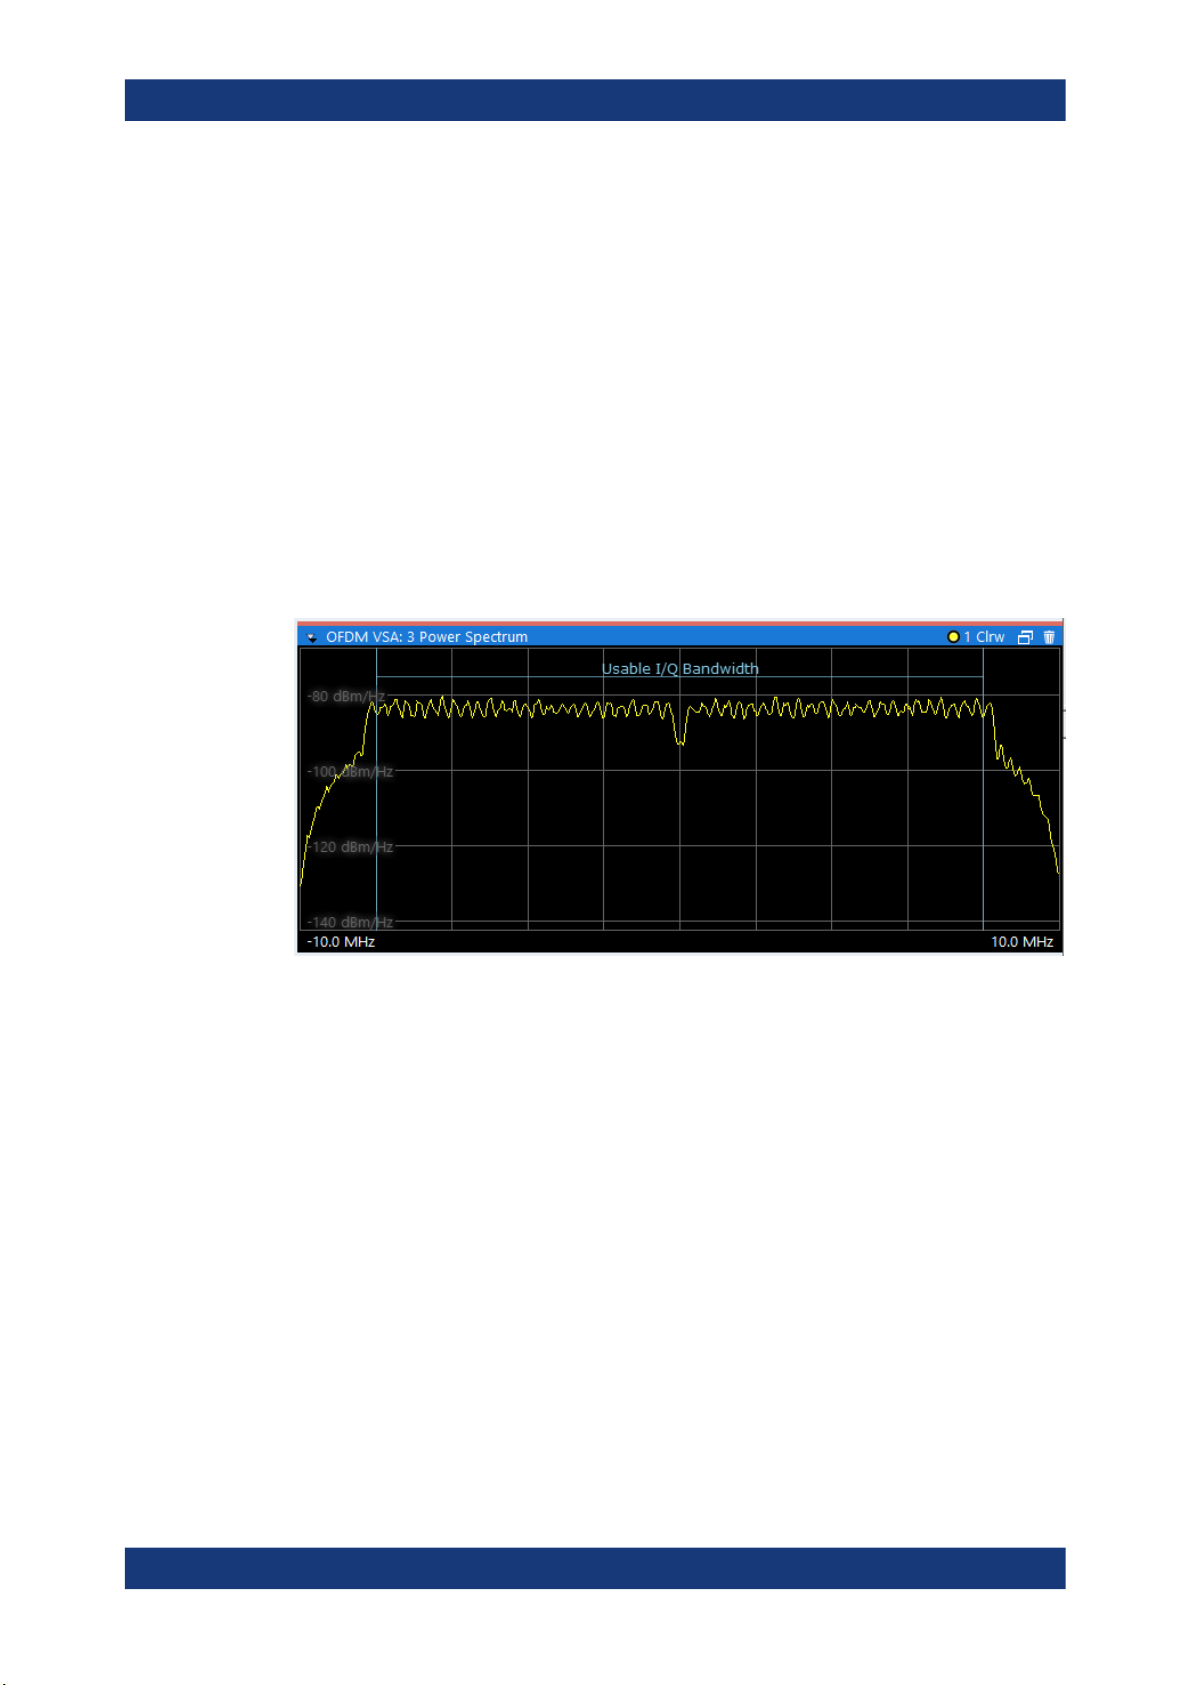
Power Spectrum
The Power Spectrum display shows the power in dBm/Hz vs frequency results of the
complete capture buffer. This display is always available.
Figure 2-17: Power Spectrum display
The usable I/Q bandwidth is indicated for reference. If a channel filter is active, the 6dB-bandwidth of the filter is indicated instead.
See Chapter 4.5, "Data acquisition", on page 69.
28User Manual 1178.5637.02 ─ 10

R&S®VSE-K96
OFDM VSA measurement and results
Evaluation methods for OFDM VSA measurements
Figure 2-18: Power spectrum with active channel filter
Remote command:
LAY:ADD? '1',RIGH,PSP, see LAYout:ADD[:WINDow]? on page 231
TRACe:DATA?, see Chapter 8.7.4.17, "Power spectrum", on page 262
Frequency unit: UNIT:FAXes on page 210
Result Summary
The Result Summary table provides numerical measurement results.
Statistical evaluation is performed over all analyzed frames within the capture buffer.
Figure 2-19: Result Summary display
Note: If only one frame is available for analysis, the minimum and maximum values
are not displayed, as they are identical to the average value.
For details on the individual results, see Table 2-1.
29User Manual 1178.5637.02 ─ 10

R&S®VSE-K96
OFDM VSA measurement and results
Evaluation methods for OFDM VSA measurements
Remote command:
LAY:ADD? '1',RIGH,RSUM, see LAYout:ADD[:WINDow]? on page 231
Results:
FETCh:SUMMary[:ALL]? on page 239
Signal Flow
The Signal Flow display shows a detailed description of the current measurement status. If demodulation is not successful, it provides useful hints on possible reasons.
Unused blocks are shown in gray.
Figure 2-20: Signal Flow display
For the synchronization blocks, a colored bar provides information about the reliability
of the synchronization result. If the level in the bar falls below the thresholds indicated
by the horizontal line, the color of the bar changes from green to yellow and finally to
red. If the synchronization of the block fails, all succeeding arrows change their color,
too.
For detailed information about the complete synchronization process, refer to Chap-
ter 3.2.2.1, "Synchronization block", on page 41.
Remote command:
LAY:ADD? '1',RIGH,SFL, see LAYout:ADD[:WINDow]? on page 231
Retrieving results:
Chapter 8.7.2, "Retrieving signal flow results", on page 242
Trigger to Sync
Indicates the time offset between the trigger event and the start of the first OFDM
frame. One value per capture is displayed.
Remote command:
LAY:ADD? '1',RIGH,TRIG, see LAYout:ADD[:WINDow]? on page 231
Retrieving results:
FETCh:TTFRame? on page 241
30User Manual 1178.5637.02 ─ 10
 Loading...