

Page 1

User’s Guide RIGOL
Publication number VS5000-080331
March 2008
VS5000 Series Digital Oscilloscope
VS5000D, VS5000
Copyright ©1998-2008 RIGOL Technologies, Inc. All Rights Reserved.
Page 2

Page 3

RIGOL
z Copyright © 1998-2008 RIGOL Technologies, Inc. All Rights Reserved.
z RIGOL products are protected by patent laws in and outside of the P.R. China.
z Information in this publication replaces all previously corresponding material.
z RIGOL Technologies, Inc. reserves the right to modify or change part of or all
the specifications and pricing policies at company’s sole decision.
NOTE: RIGOL is registered trademark of RIGOL TECHNOLOGIES, INC.
Copyright ©1998-2008 RIGOL Technologies, Inc.
User’s Guide for VS5000 Series
I
Page 4

RIGOL
Safety Notices
Review the following safety precautions carefully before operate the instrument to
avoid any personal injuries or damages to the instrument and any products
connected to it.
To avoid potential hazards, use the instrument as specified by this user’s guide only.
The instrument should be serviced by qualified personnel only.
To Avoid Fire or Personal Injury.
Use Proper Power Cord.
Use only the power cord designed for the instrument and authorized in your country
only.
Connect and Disconnect Accessories Properly.
Do not connect or disconnect probes or test leads while they are connected to a
voltage source.
Connect the Probe Properly.
Do not connect the ground terminals to a high voltage.
Observe All Terminal Ratings.
To avoid fire or shock hazard, observe all ratings and marks on the instrument.
Follow the user’s guide for further ratings information before making connections to
the instrument.
Do not Operate without Covers.
Do not operate the oscilloscope with covers or panels removed.
Use Proper Fuse.
Use the fuse of the type, voltage and current ratings as specified for the instrument.
Avoid Circuit or Wire Exposure.
Do not touch exposed connections and components when power is on.
Copyright ©1998-2008 RIGOL Technologies, Inc.
II
User’s Guide for VS5000 Series
Page 5

RIGOL
Do not Operate with Suspected Failures.
If suspected damage or malfunctions occur with the instrument, have it inspected by
qualified service personnel before further operations.
Provide Proper Ventilation.
Refer to the manual’s installation instructions for proper ventilation of the
instrument.
Use only UL/cUL or cCSAus certified probes with the oscilloscope.
Do not Operate in Wet/Damp Conditions.
Do not Operate in an Explosive Atmosphere.
Keep Product Surfaces Clean and Dry.
The disturbance test of all the models meet the limit values of A in the
standard of EN 61326: 1997+A1+A2+A3, but can’t meet the limit values
of B.
Measurement Category
The VS5000 series Digital Oscilloscope is intended to be used for measurements in
Measurement Category I.
Measurement Category Definitions
Measurement Category I is for measurements performed on circuits not directly
connected to MAINS. Examples are measurements on circuits not derived from MAINS,
and specially protected (internal) MAINS derived circuits. In the latter case, transient
stresses are variable; for that reason, the transient withstand capability of the equipment
is made known to the user.
Copyright ©1998-2008 RIGOL Technologies, Inc.
User’s Guide for VS5000 Series
III
Page 6
RIGOL
V
WARNING
IEC Measurement Category I. The HI and LO input terminals may be connected to
circuit terminal in IEC Category I installations for voltages up to 300 VAC. To avoid
the danger of electric shock, do not connect the inputs to circuit’s voltages above 300
VAC.
Transient overvoltage is also present on circuits that are isolated from mains. The
VS5000 series Digital Oscilloscopes is designed to safely withstand occasional
transient overvoltage up to 500 Vpk. Do not use this equipment to measure circuits
where transient overvoltage could exceed this level.
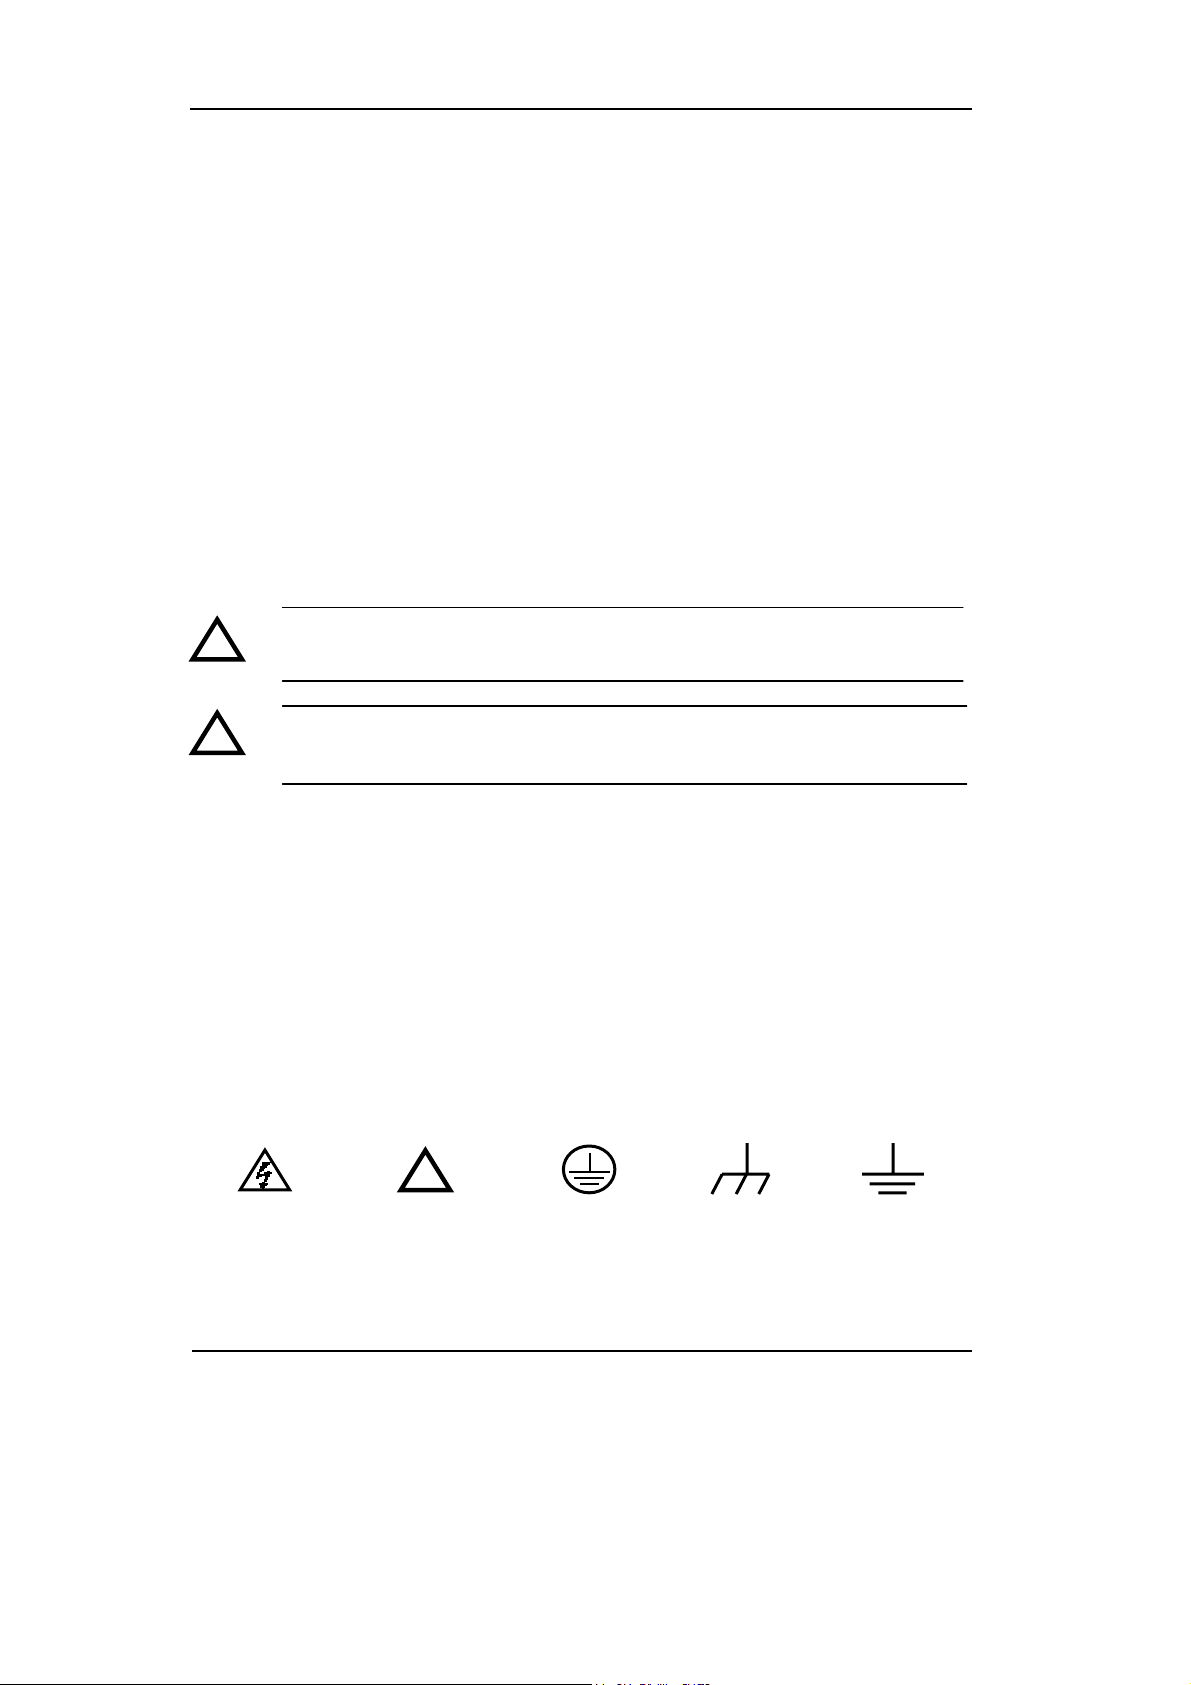
Safety Terms and Symbols
Terms in this manual. These terms may appear in this guide:
!
!
Terms on the Product: These terms may appear on the product:
DANGER indicates an injury hazard may be immediately accessible.
WARNING indicates an injury hazard may be not immediately accessible.
CAUTION indicates that a potential damage to the instrument or other property
might occur.
Symbols on the Product: These symbols may appear on the Instrument:
Hazardous
Voltage
WARNING: Warning statements identify conditions or practices that could
result in injury or loss of life.
CAUTION: Caution statements identify conditions or practices that could
result in damage to this product or other property.
!
Refer to
Instructions
Protective
Earth
Terminal
Grounding
Terminal
of Chassis
Test
Grounding
Terminal
Copyright ©1998-2008 RIGOL Technologies, Inc.
I
User’s Guide for VS5000 Series
Page 7

V
RIGOL
VS5000 Oscilloscopes at a Glance
RIGOL VS5000 Series Digital Oscilloscopes offer good waveform view and
measurements in a compact, lightweight package. VS5000 series are ideal for
production test, field service, research and design and all of the applications
involving analog circuits test and troubleshooting, as well as education and training.
Product features:
z Dual Channel, Bandwidth:
200MHz (VS5202, VS5202D)
100MHz (VS5102, VS5102D)
60MHz (VS5062, VS5062D)
40MHz (VS5042, VS5042D)
25MHz (VS5022, VS5022D)
z A true Mixed Signal Oscilloscope with 16 channels Logic Analyzer (for some
models)
z 400 MSa/s maximum real-time sample rate and 25 GSa/s maximum equivalent
sample rate
z Memory depth: 1M points (Single Channel), 512k points (Dual Channels), 512k
points (Logic Analyzer)
z Adjustable waveform intensity, more effective waveform view
z One-touch automatic setup for ease of use (AUTO)
z 20 Automatic measurements
z Automatic cursor tracking measurements
z Waveform recorder, record and replay dynamic waveforms
z User selectable fast offset calibration
z Built-in FFT function, Frequency Counter
z Digital filters, includes LPF, HPF, BPF, BRF
z Add, Subtract and Multiply Mathematic Functions
z Advanced trigger types include: Edge, Video, Pulse width, Slope, Alternative,
Pattern and Duration
z Adjustable trigger sensitivity
Copyright ©1998-2008 RIGOL Technologies, Inc.
User’s Guide for VS5000 Series
Page 8

RIGOL
V
Content
Safety Notices ........................................................................................... II
VS5000 Oscilloscopes at a Glance ............................................................... V
Chapter 1 Quick Start .......................................................................... 1-1
The Front Panel and User’s Interface ........................................................ 1-2
To Inspect the Instrument ....................................................................... 1-5
To Perform a Functional Check ................................................................ 1-6
To Compensate Probes ........................................................................... 1-8
To Use Digital Leads (for VS5***D only) .................................................. 1-9
To Display a Signal Automatically ............................................................ 1-11
To Understand the Vertical Window ........................................................ 1-12
To Understand the Horizontal System ...................................................... 1-14
To Trigger the Oscilloscope .................................................................... 1-16
Chapter 2 Operating Your Oscilloscope ............................................... 2-1
To Set the Vertical system ....................................................................... 2-2
To Set the Horizontal System .................................................................. 2-23
To Set the Trigger System ...................................................................... 2-29
To Set the Sampling System ................................................................... 2-43
To Save/Load and Print Setup ................................................................. 2-47
To Set the Measurement Function ........................................................... 2-53
To Set the Utility Function ...................................................................... 2-66
To Use Run Control Buttons .................................................................... 2-72
Chapter 3 Application Examples .......................................................... 3-1
Example 1: Taking Simple Measurements ................................................. 3-1
Example 2: View a Signal Delay Caused by a Circuit .................................. 3-3
Example 3: Capture a Single-Shot Signal .................................................. 3-4
Example 4: To Reduce the Random Noise on a Signal ............................... 3-5
Example 5: Making Cursor Measurements ................................................. 3-7
Example 6: The Application of the X-Y Operation ...................................... 3-9
Example 7: Triggering on a Video Signal .................................................. 3-11
Example 8: FFT Cursor Measurement ...................................................... 3-13
Example 9: Pass/Fail Test ....................................................................... 3-14
Example 10: Triggering on a Digital Signal ............................................... 3-15
Copyright ©1998-2008 RIGOL Technologies, Inc.
I
User’s Guide for VS5000 Series
Page 9

RIGOL
V
Chapter 4 Prompt Messages & Troubleshooting ................................. 4-1
Prompt Messages .................................................................................... 4-1
Troubleshooting ...................................................................................... 4-4
Chapter 5 Specifications ...................................................................... 5-1
Chapter 6 Appendix ............................................................................. 6-1
Appendix A: Accessories .......................................................................... 6-1
Appendix B: Warranty .............................................................................. 6-1
Appendix C: Maintenance ......................................................................... 6-2
Appendix D: Contact RIGOL ..................................................................... 6-3
Index ..........................................................................................................1
Copyright ©1998-2008 RIGOL Technologies, Inc.
User’s Guide for VS5000 Series
II
Page 10

Page 11

Chapter 1 Quick Start
This chapter covers the following topics:
z The front panel and user interface of VS5000 Series
z To inspect the instrument
z To perform a functional check
z To compensate probes
z To use digital leads (for VS5xxxD only)
z To display a signal automatically
z To set up the vertical system
z To set up the horizontal system
RIGOL
z To trigger the oscilloscope
Copyright ©1998-2008 RIGOL Technologies, Inc.
User’s Guide for VS5000 Series
1-1
Page 12
RIGOL
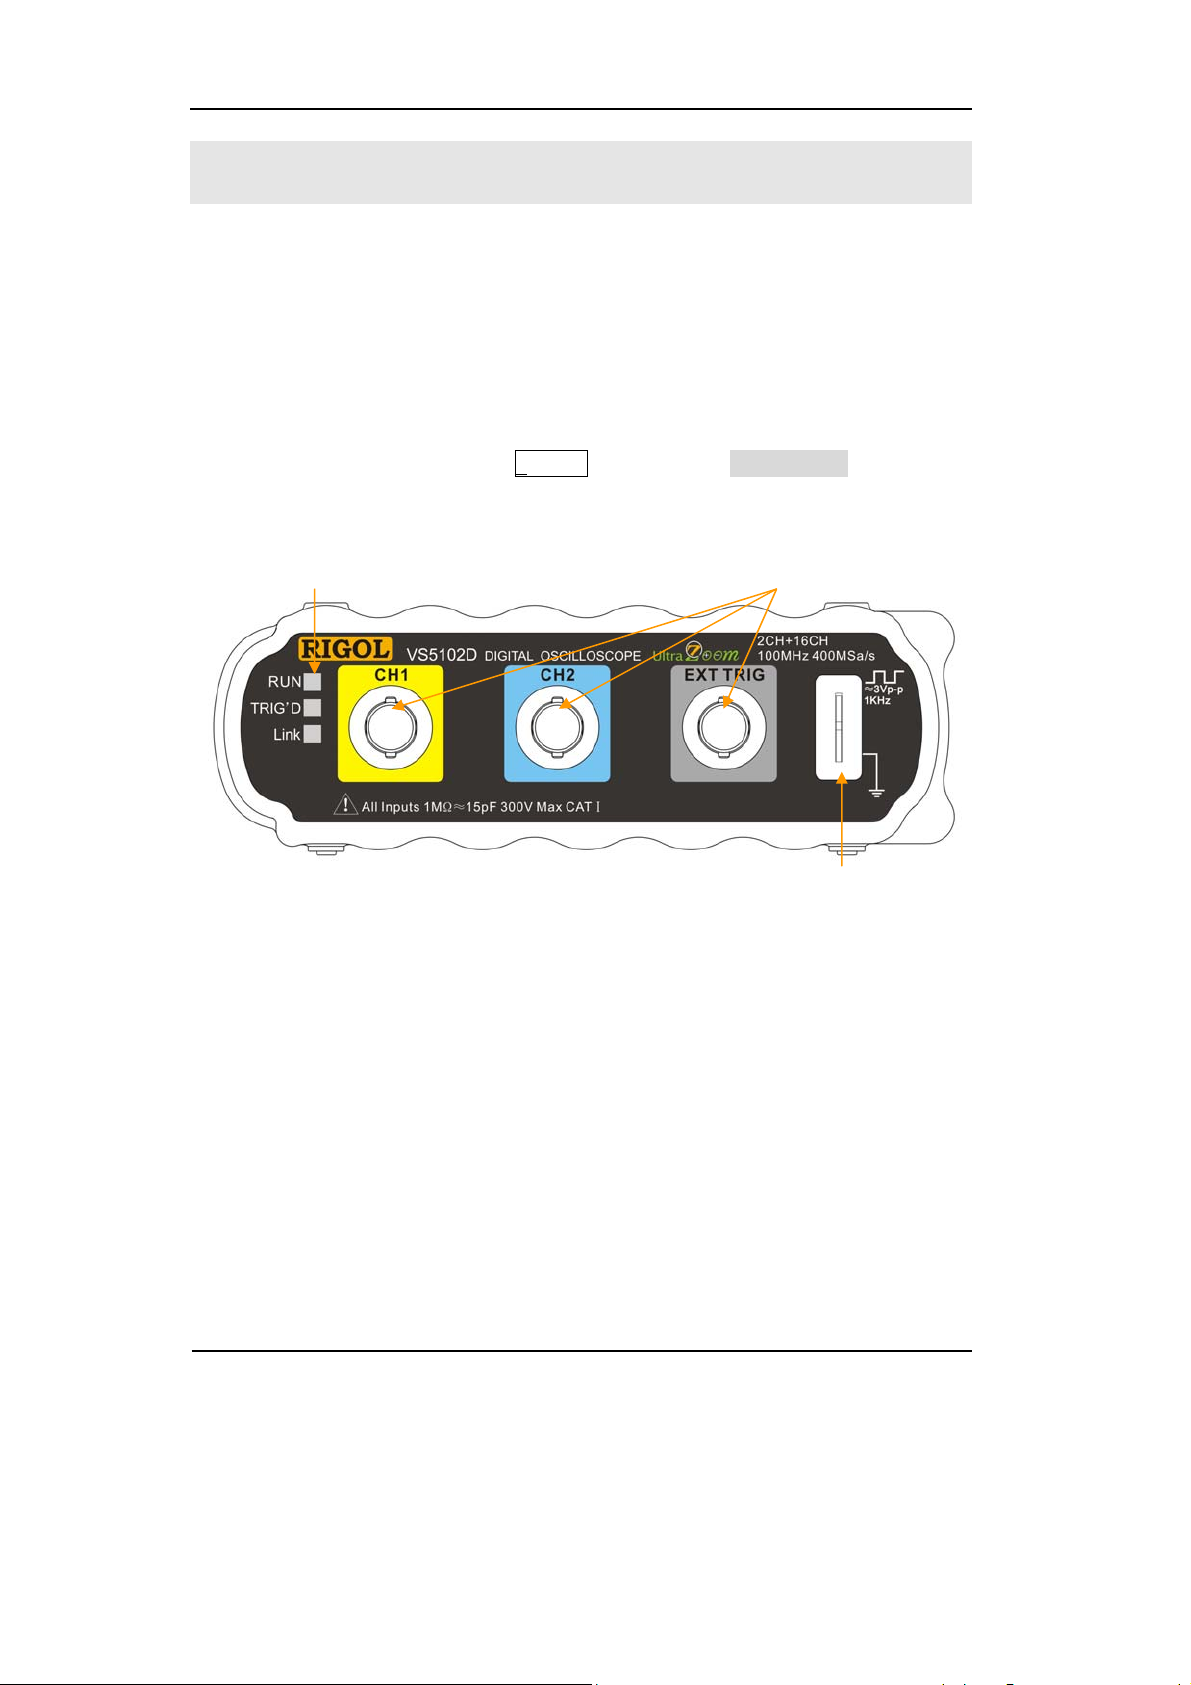
The Front Panel and User Interface
The first thing to do with a new oscilloscope is to become acquainted with its front
panel. This chapter will help to be familiar with the layout of the connectors,
graphical representations, interfaces, and how to use them. Read the chapter
carefully before further operations.
Figure 1-1
VS5000 Series Oscilloscope
VS5000 series oscilloscopes provide an easy-to-use user interface. In the main menu,
access the function options from the menu and the drop-down menu to operate
VS5000 series oscilloscope. There’re shortcuts for some common functions.
1-2
User’s Guide for VS5000 Series
Copyright ©1998-2008 RIGOL Technologies, Inc.
Page 13
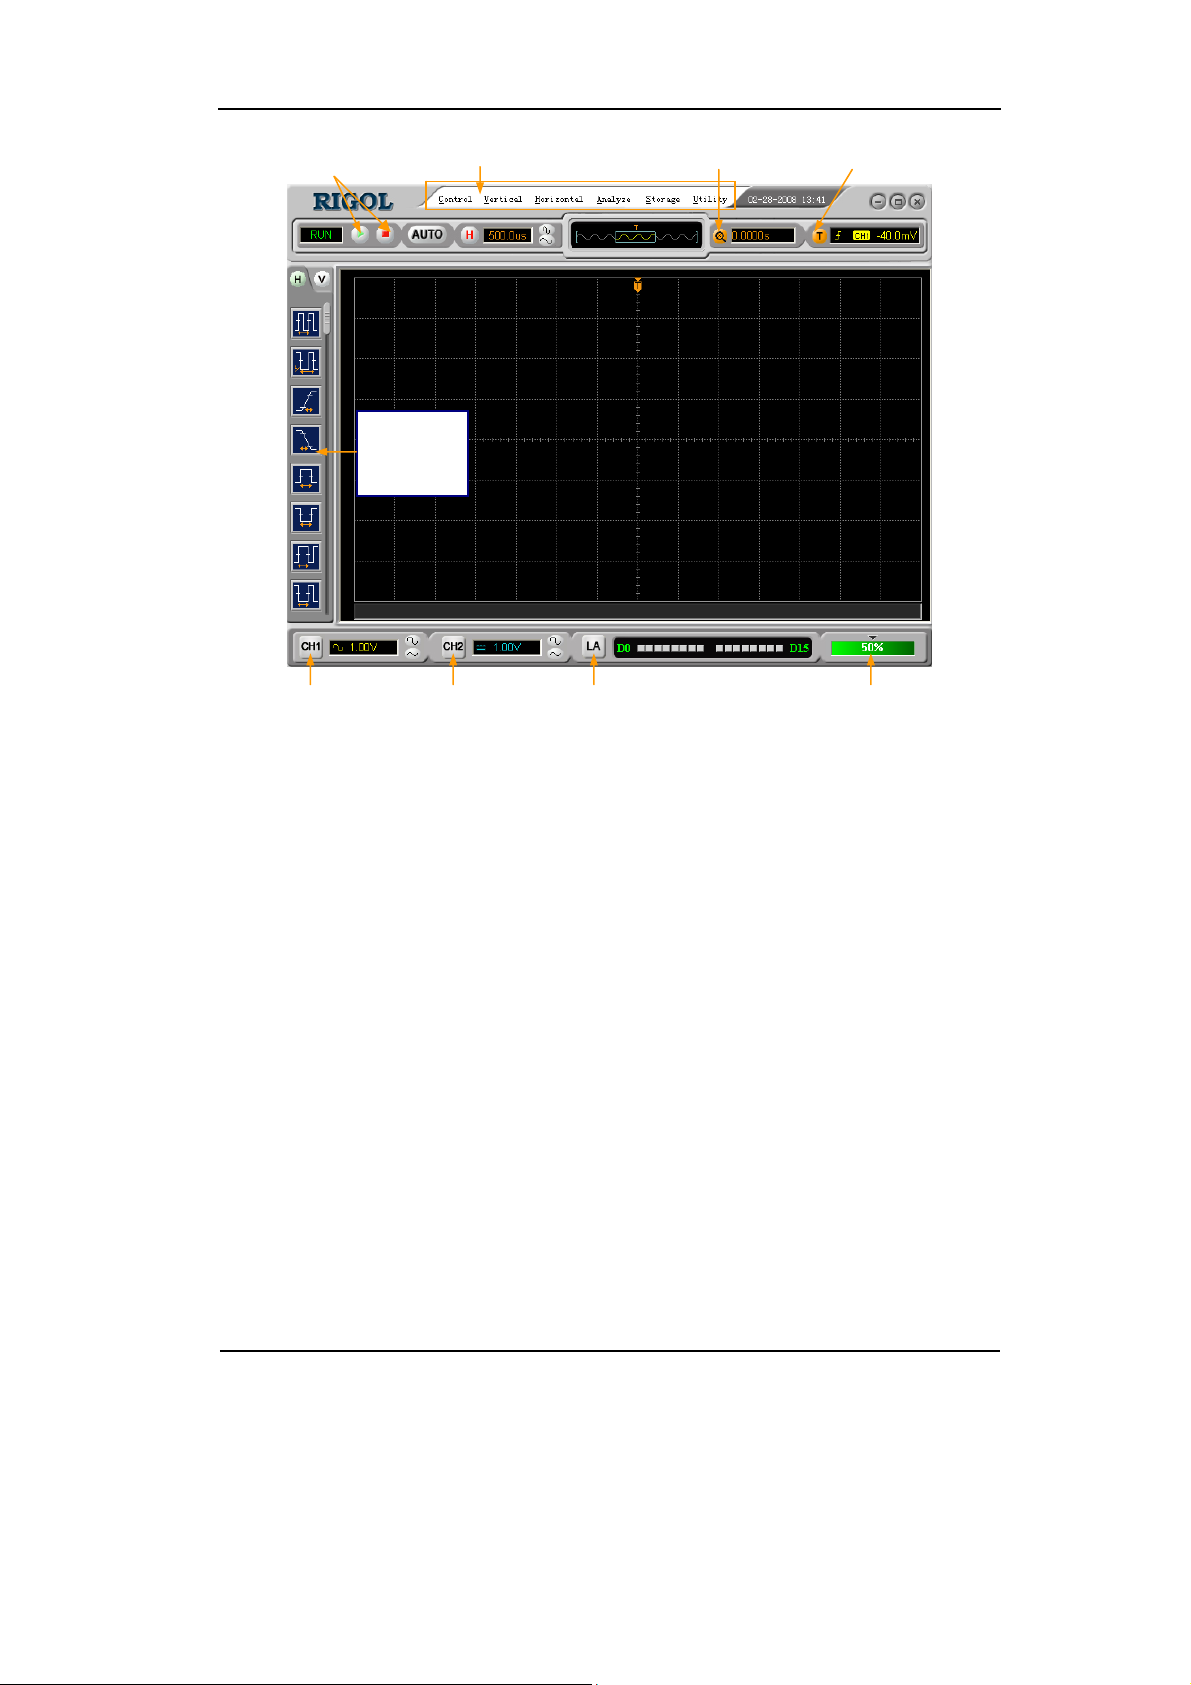
RIGOL
Run Control Buttons Main menu
Automatic
Measurement
Shortcut
Delay Setting
Trigger Setting
CH1 Setting
CH2 Setting Digital Signal Control Waveform
Brightness Setting
Figure 1-2
VS5000 Operation Interface
Copyright ©1998-2008 RIGOL Technologies, Inc.
User’s Guide for VS5000 Series
1-3
Page 14
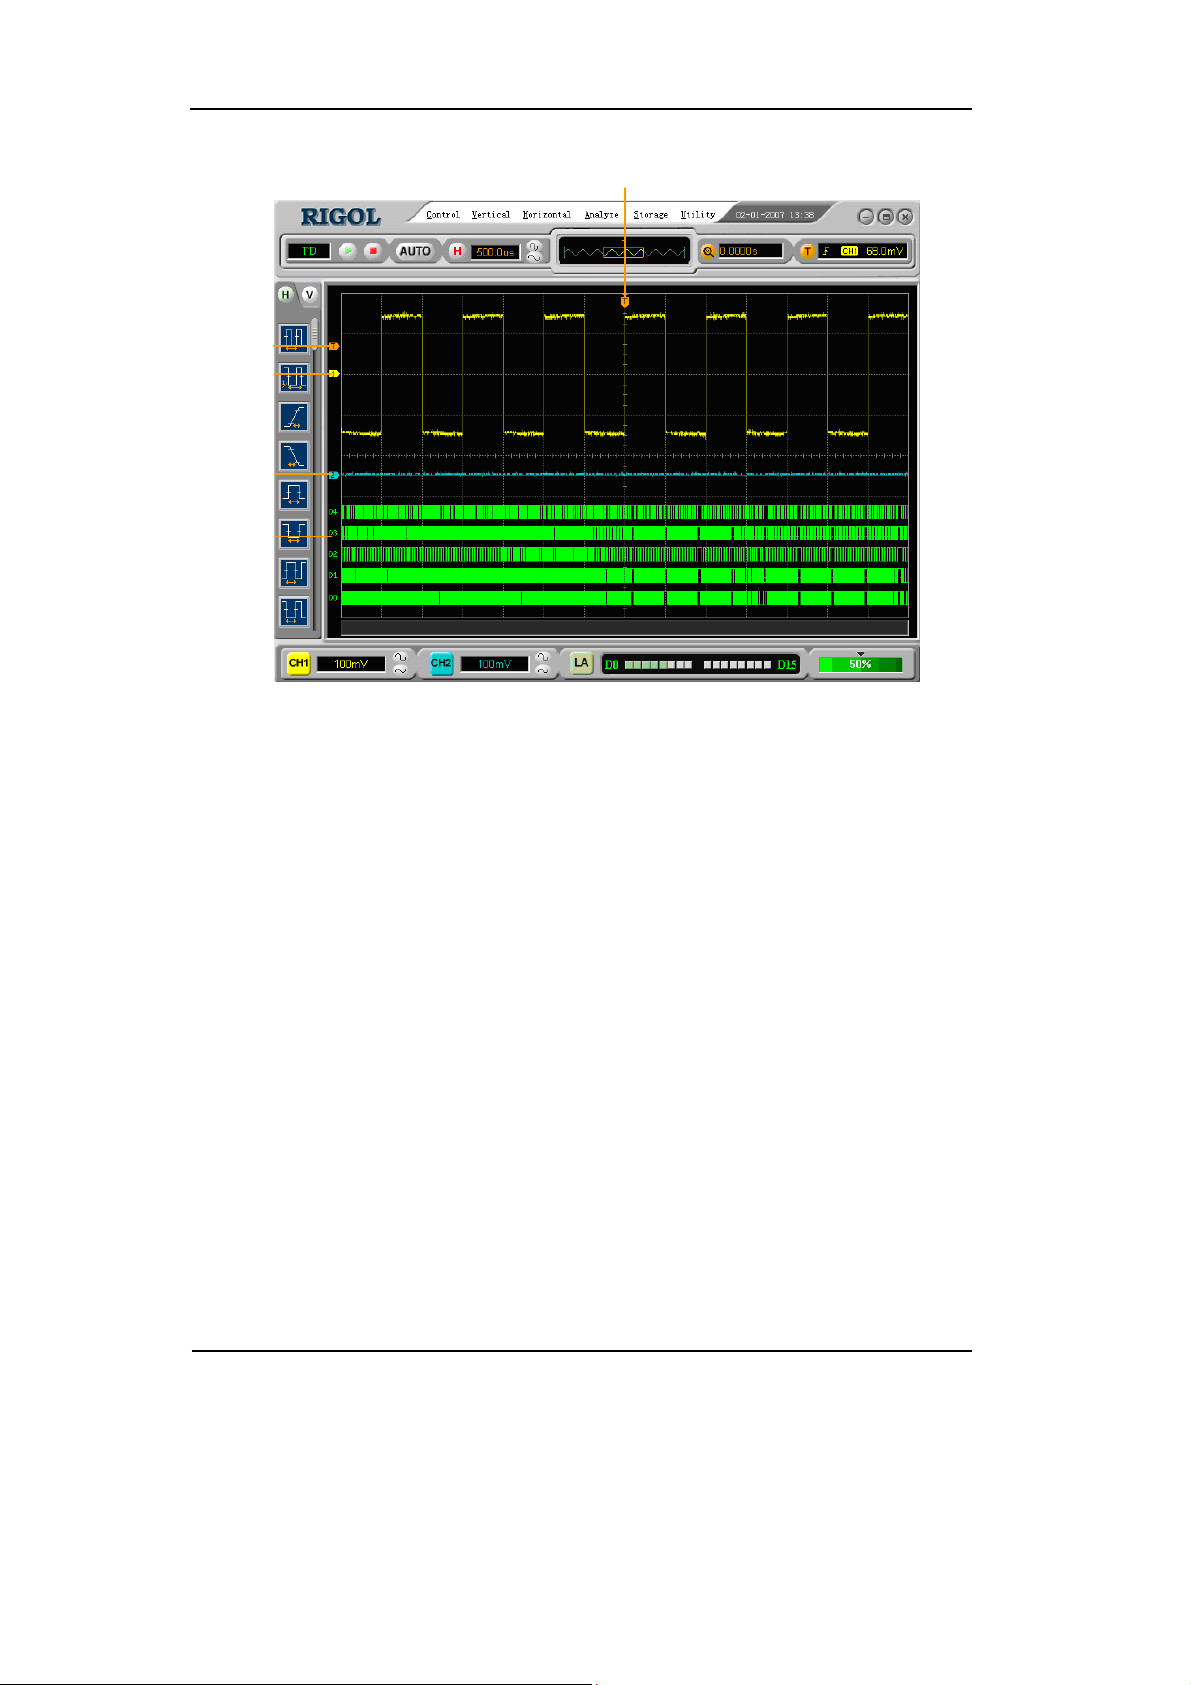
RIGOL
Trigger
level
Channel 1
Channel 2
Digital
Channels
Trigger point,
Time reference
Figure 1-3
Display Interface (Analog and Digital channels)
1-4
Copyright ©1998-2008 RIGOL Technologies, Inc.
User’s Guide for VS5000 Series
Page 15

RIGOL
To Inspect the Instrument
After receiving a new VS5000 series oscilloscope, please inspect the instrument as
following steps:
1. Inspect the shipping container for damage.
Keep the damaged shipping container or cushioning material until the contents
of the shipment have been checked for completeness and the instrument has
been checked mechanically and electrically.
2. Check the accessories.
Accessories supplied with the instrument are listed in "Accessories" in this guide.
If the contents are incomplete or damaged notify the RIGOL Sales
Representative.
3. Inspect the instrument.
In case there is any mechanical damage or defect, or the instrument does not
operate properly or fails performance tests, notify the RIGOL Sales
Representative.
If the shipping container is damaged, or the cushioning materials show signs of
stress, notify the carrier as well as the RIGOL sales office. Keep the shipping
materials for the carrier’s inspection.
RIGOL offices will arrange for repair or replacement at option of RIGOL without
waiting for claim settlement.
Copyright ©1998-2008 RIGOL Technologies, Inc.
User’s Guide for VS5000 Series
1-5
Page 16
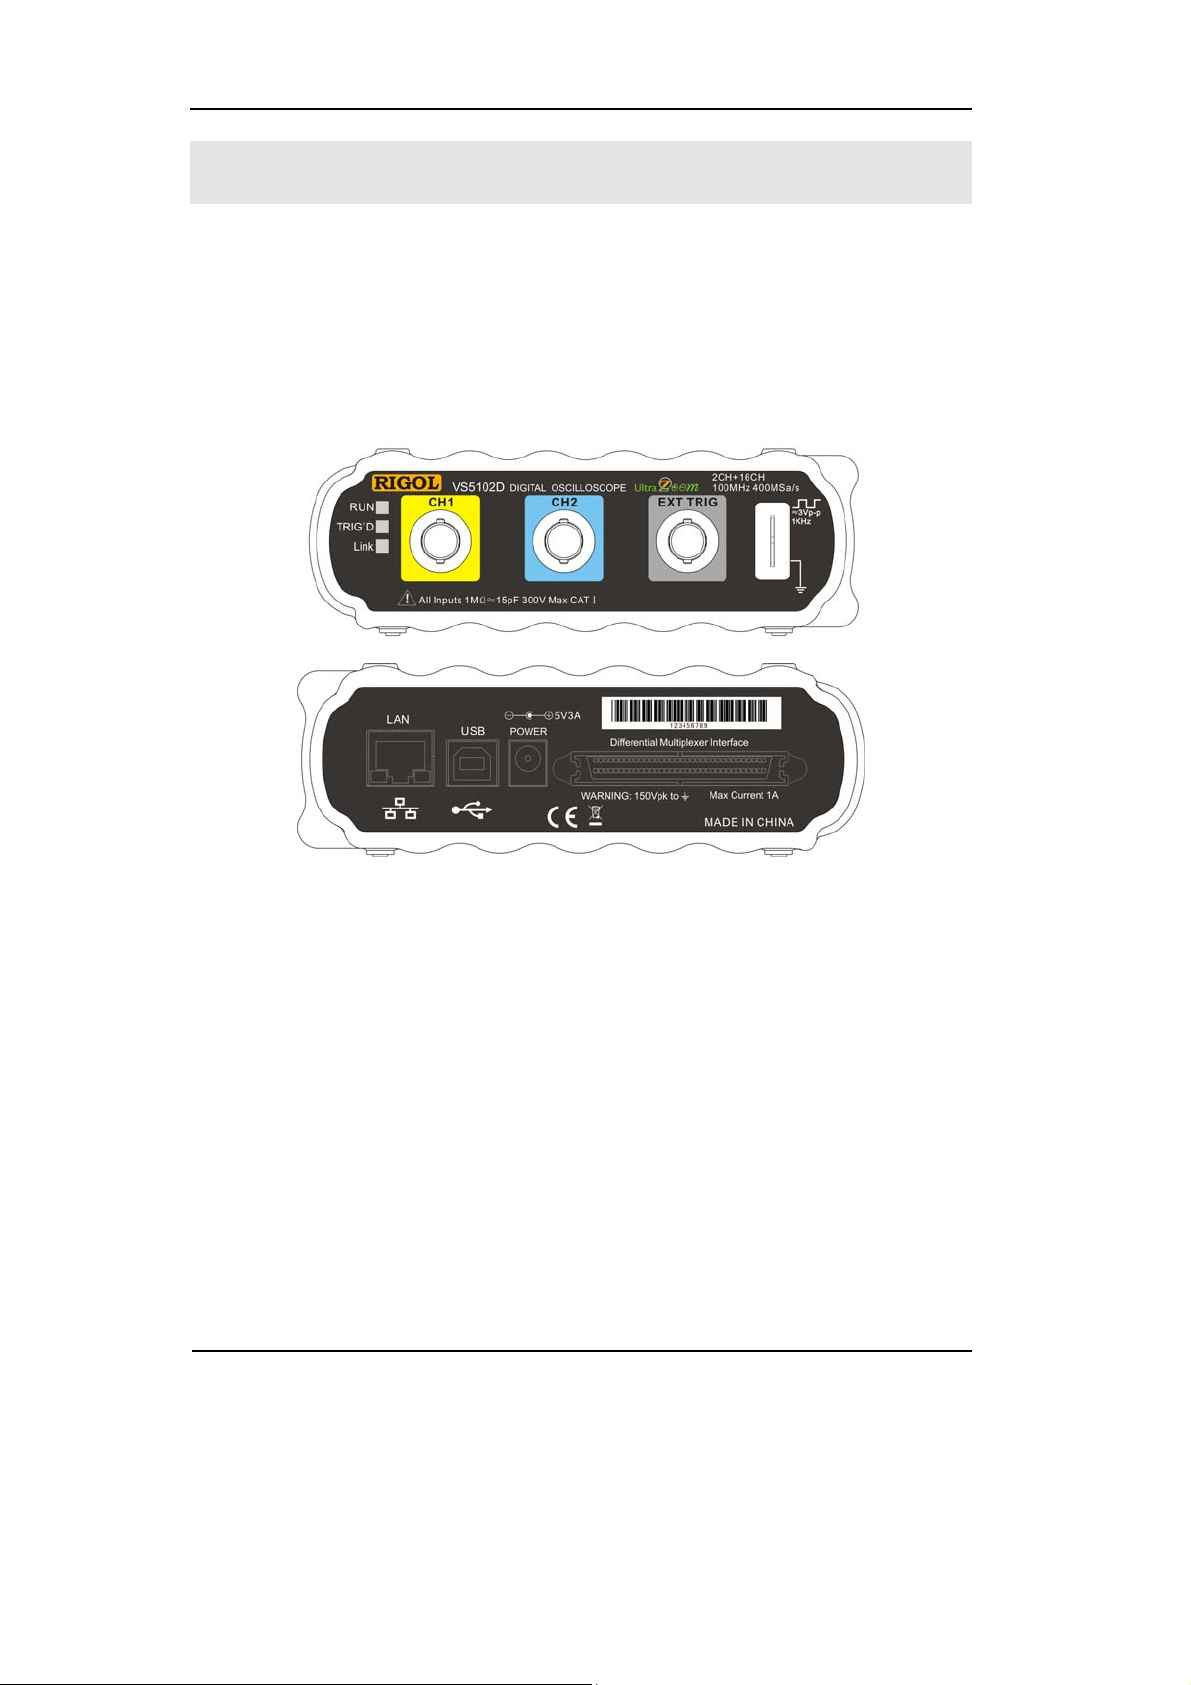
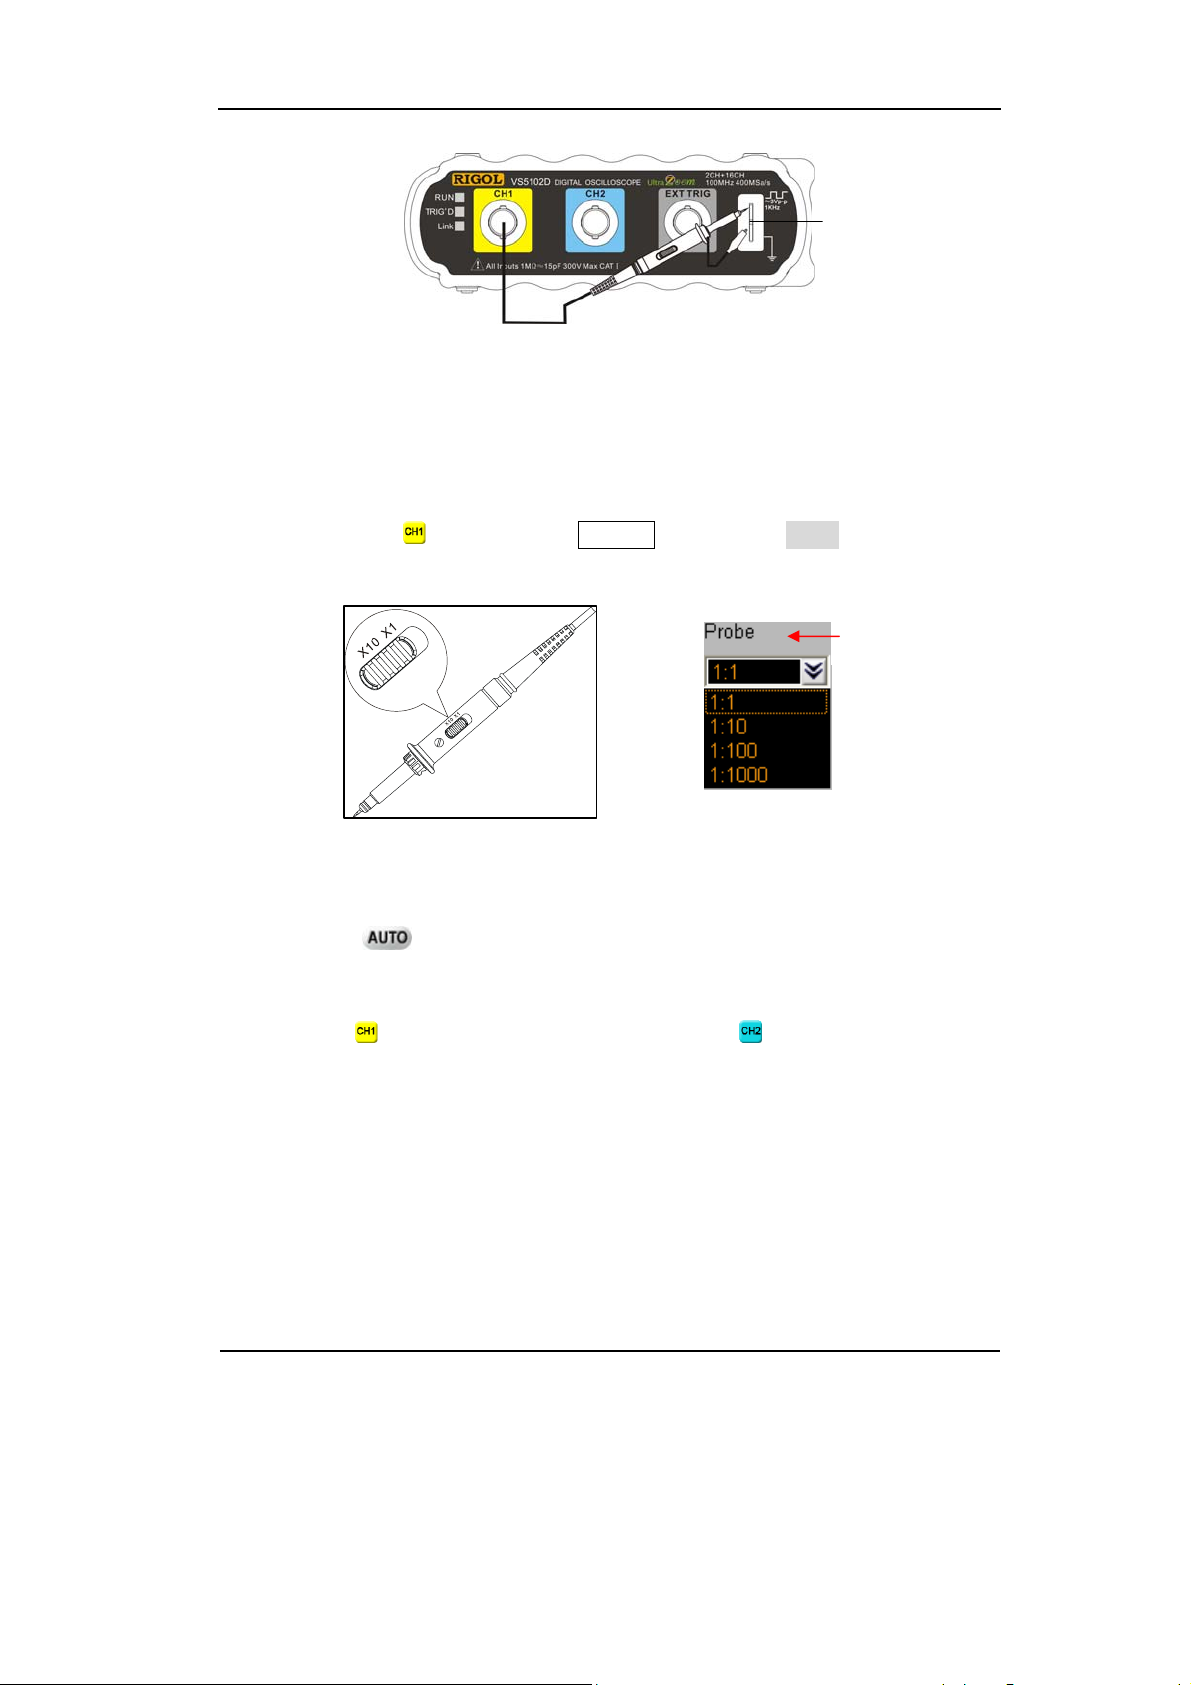
RIGOL
To Perform a Functional Check
Perform this quick functional check to verify that the instrument is operating
correctly.
1. Prepare for using the instrument.
Use the power cords designed for the oscilloscope only. Connect to a power
source that delivers 100 to 240 VAC, 45Hz to 440Hz. Power up the system,
initiate the program. Click the Storage button, select Load Default in the menu
box.
Status indicators
Channel 1, 2 and Ext Trigger
Probe compensator
Figure 1-4
Instruction of the Front Panel
2. Input a signal to a channel of the oscilloscope
VS5000 Series are equipped with dual channels plus external trigger, and 16
channels logic analyzer (only for VS5***D models).
Please defer to the following steps to connect to signal:
1) Set the attenuation switch on the probe to 10X (Figure 1-6) and connect the
probe to CH1 on the oscilloscope. Align the slot in the probe connector with the
key on the CH1 BNC connector. Push to connect, and twist to the right to lock
the probe in place. Attach the probe tip and ground lead to the Probe
compensator connector.
1-6
User’s Guide for VS5000 Series
Copyright ©1998-2008 RIGOL Technologies, Inc.
Page 17
RIGOL
Probe
compensator
Figure 1-5
Probe Compensation
2) Set the probe attenuation of the oscilloscope to X10. (Default probe attenuation
is X1).
Method of set the probe attenuation:
Right click the button into the Channel menu. In the Probe menu, select the
probe attenuation. Now select the 1:10 option.
Probe
attenuation
Figure 1-6 Figure1-7
To Set the Probe To Set the Probe Attenuation
3) Click the
button. Within a few seconds, a square wave will display
(approximately 1 kHz 3 V peak- to- peak).
4) Click the
button to turn Channel 1 off, click the button to turn Channel 2
on. Repeat steps 2 and 3.
Copyright ©1998-2008 RIGOL Technologies, Inc.
User’s Guide for VS5000 Series
1-7
Page 18
RIGOL
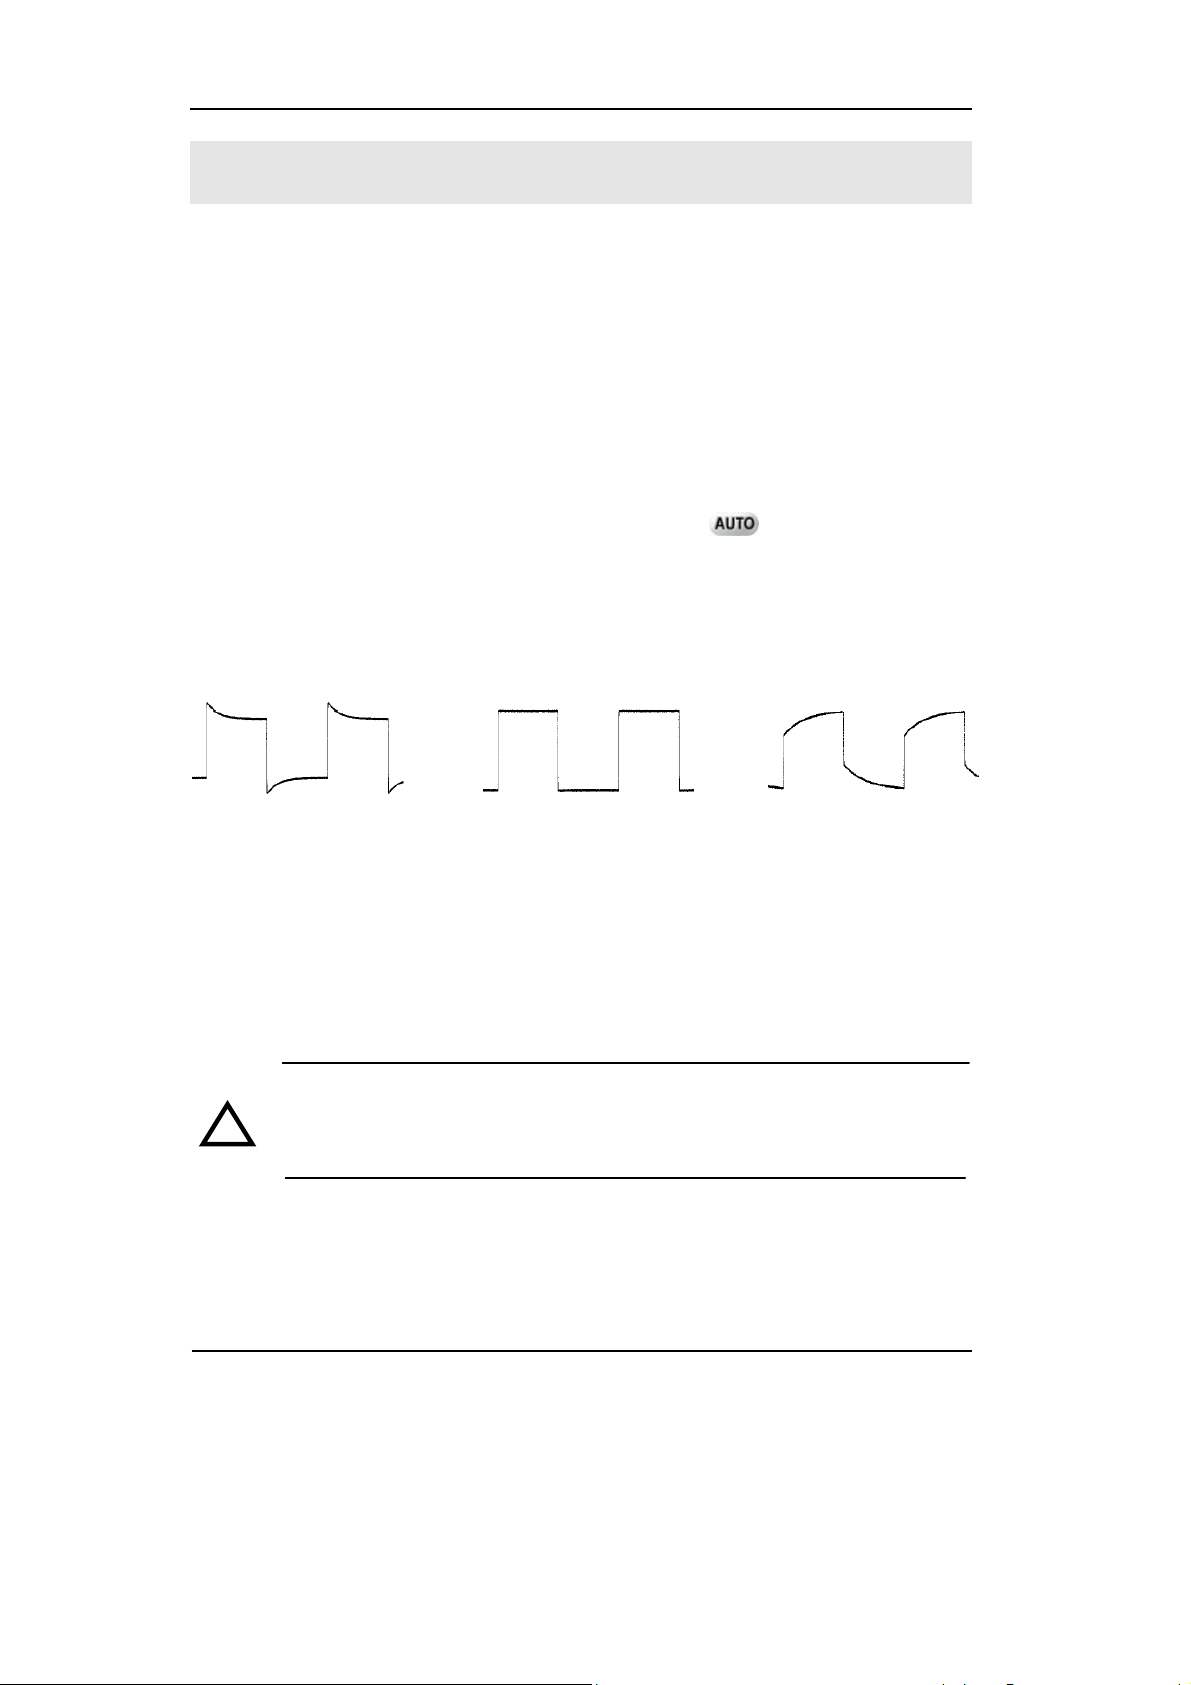
To Compensate Probes
Perform this adjustment to match the characteristics of the probe and the channel
input. This should be performed whenever attaching a probe to any input channel
the first time.
1. From the Probe menu, select attenuation to 1:10. Set the switch to X10 on the
probe and connect it to CH 1 of the oscilloscope. When using the probe hook-tip,
insert the tip onto the probe firmly to ensure a proper connection.
Attach the probe tip to the Probe Compensator and the reference lead to the
ground connector, select CH 1, and then press the
2. Check the shape of the displayed waveform.
Over compensated Correctly Compensated Under Compensated
button.
Figure 1-8
Instruction Waveform of Probe Compensation
3. If necessary, use a non-metallic tool to adjust the trimmer capacitor of the probe
for the flattest square wave being displayed on the oscilloscope.
4. Repeat if necessary.
WARNNING: To avoid electric shock while using the probe, be sure the
!
perfection of the insulated cable, and do not touch the metallic portions of
the probe head while it is connected with a voltage source.
1-8
User’s Guide for VS5000 Series
Copyright ©1998-2008 RIGOL Technologies, Inc.
Page 19
RIGOL
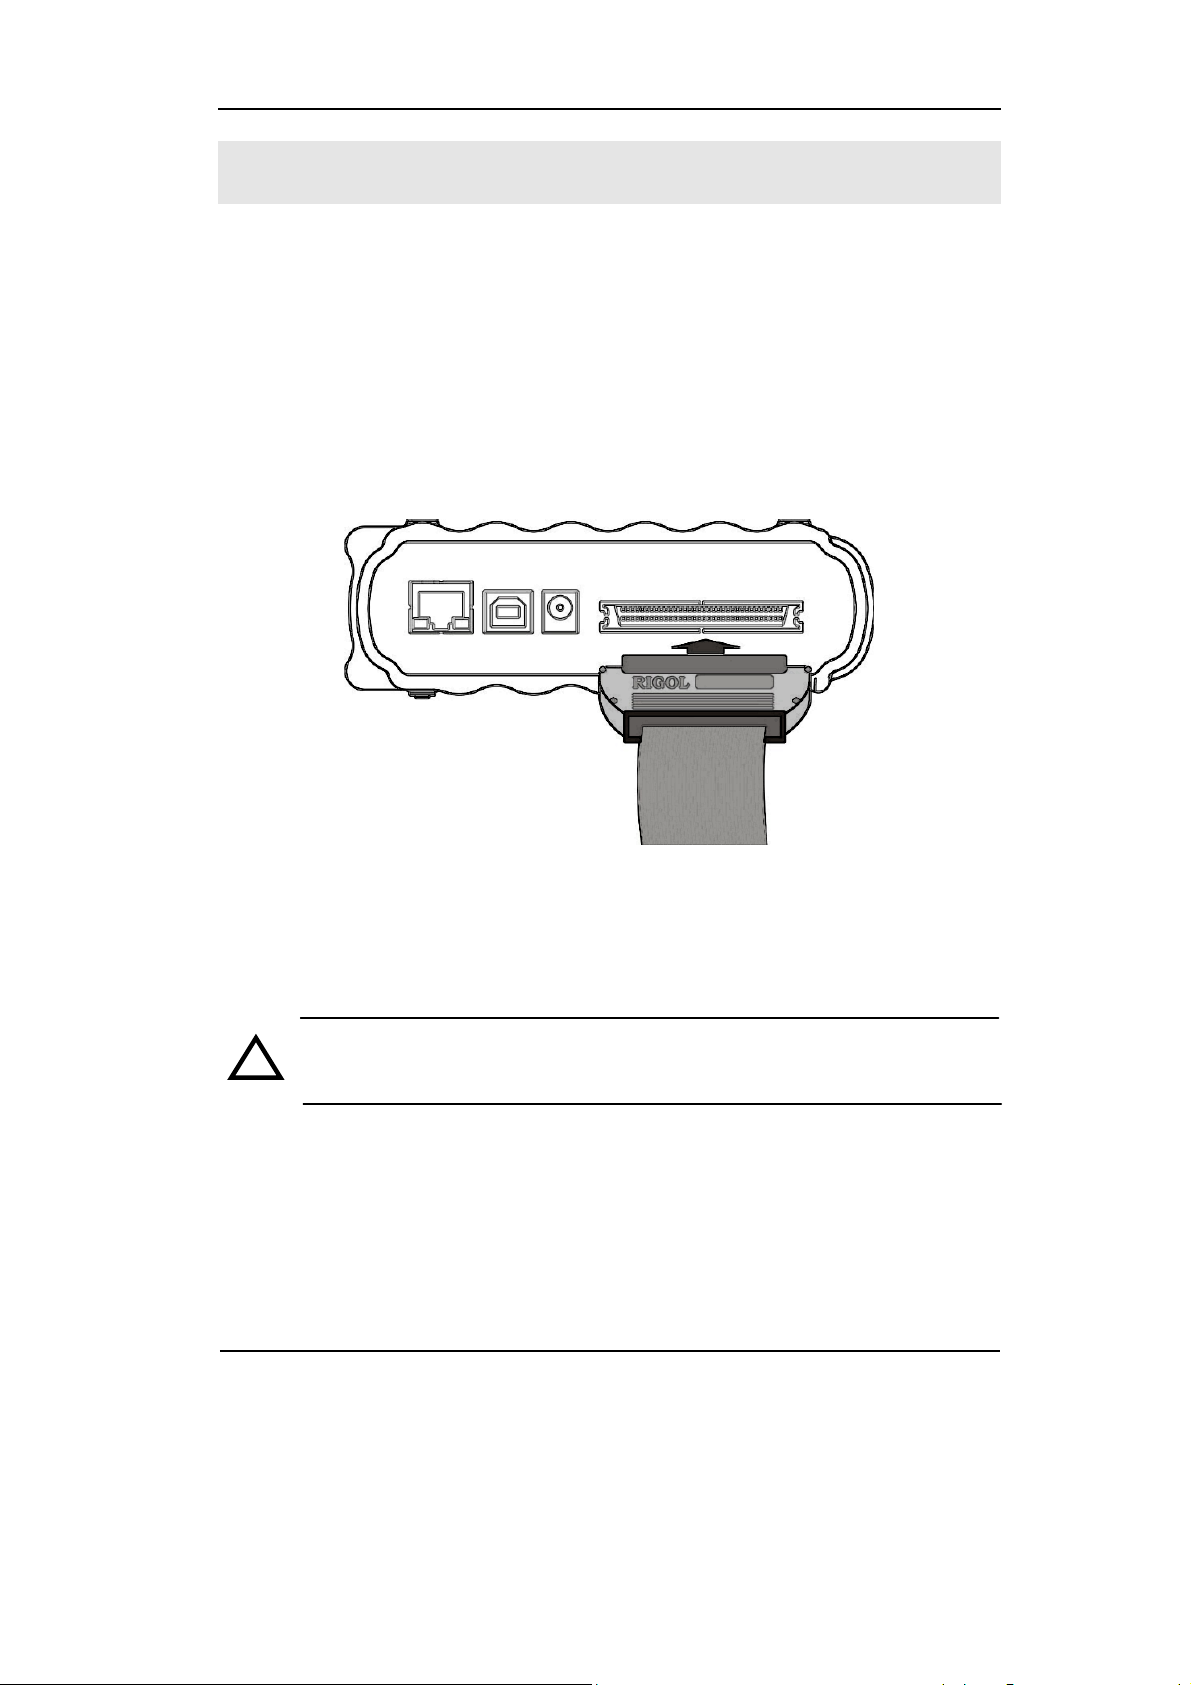
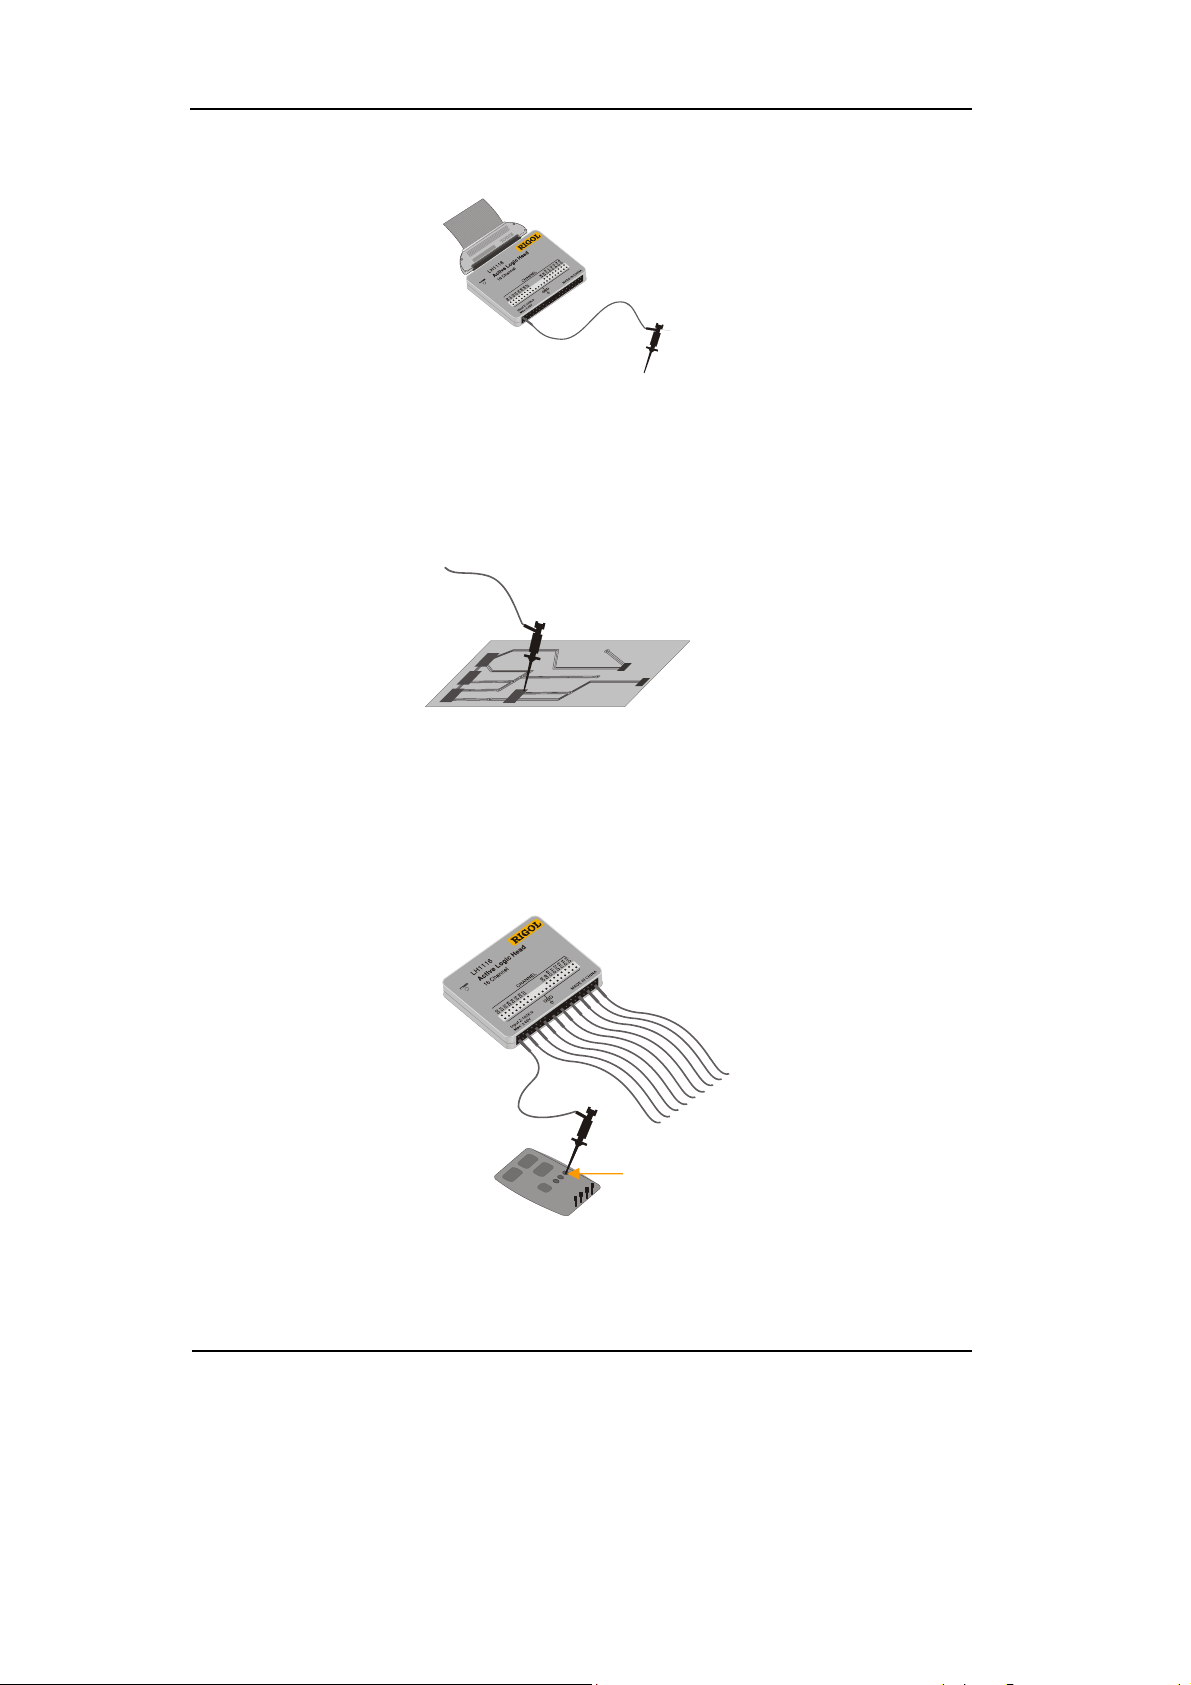
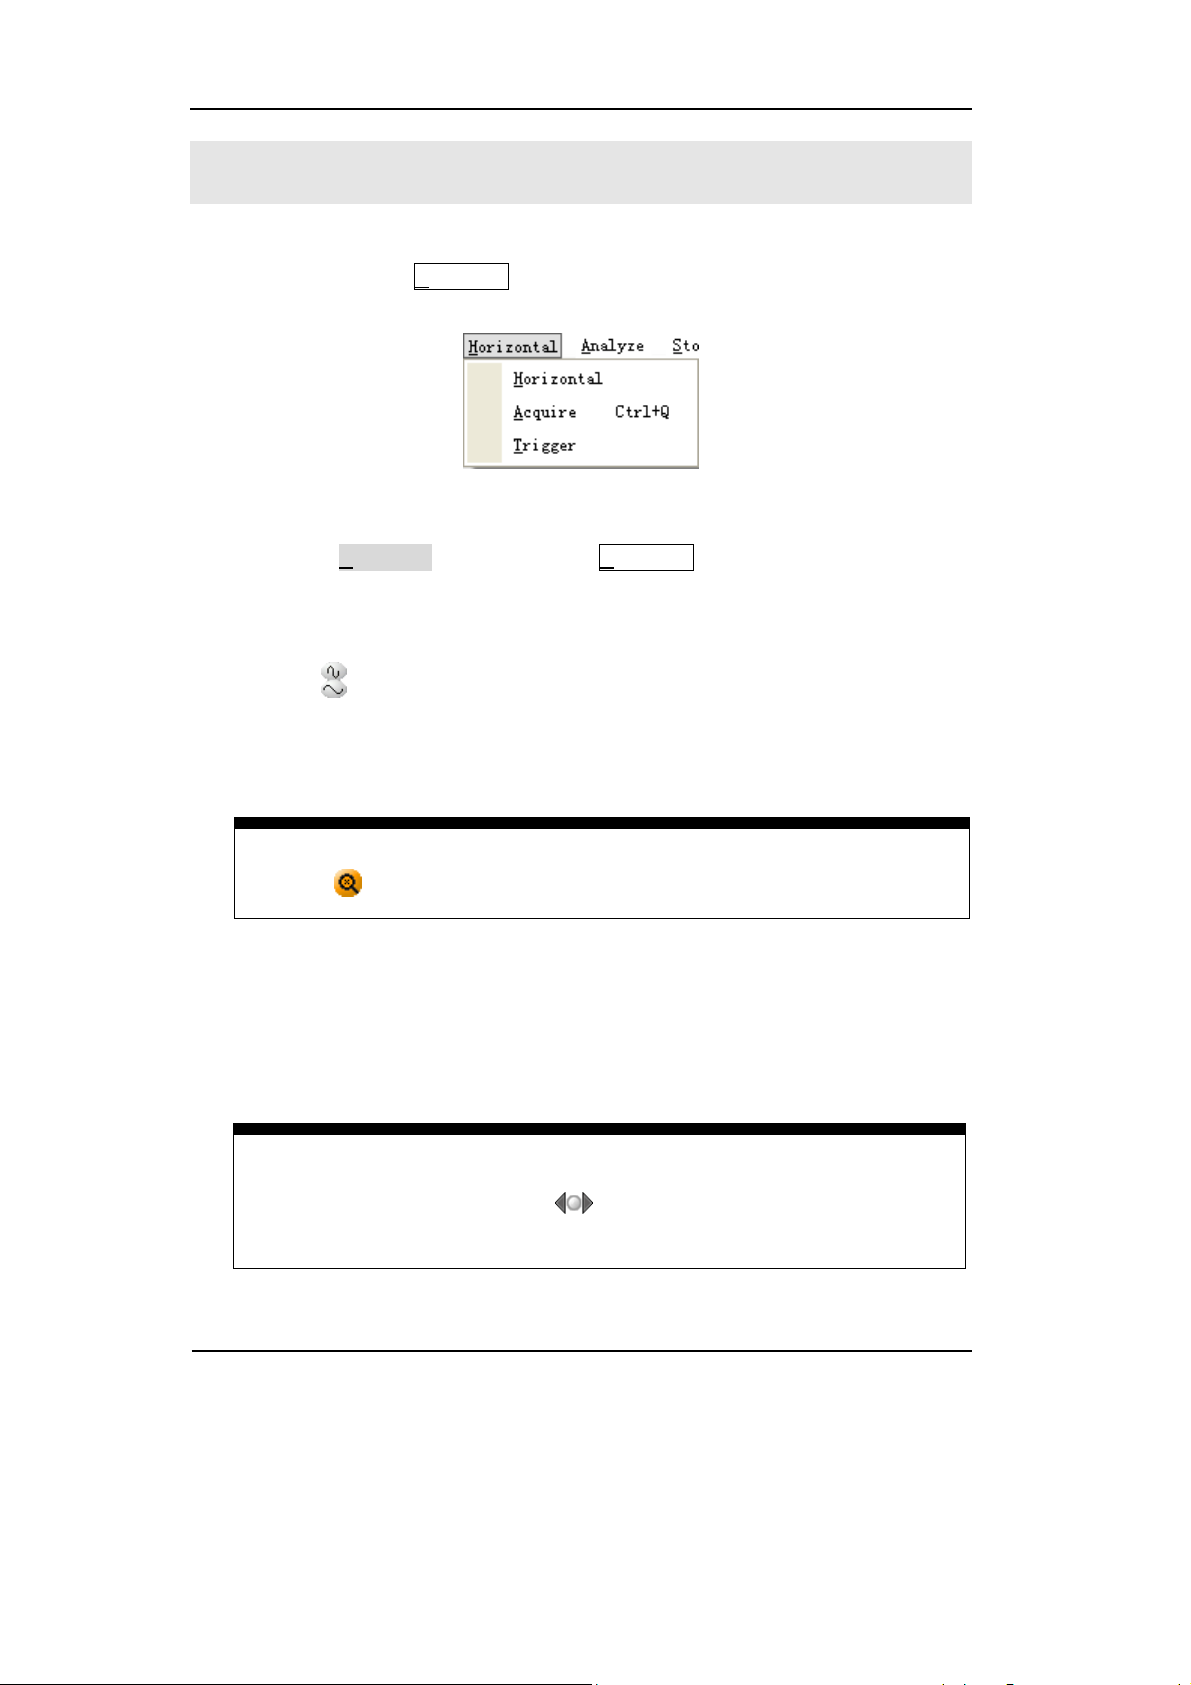
To Use Digital Leads (for VS5***D only)
1. Switch off power supply of the Device under Test if necessary to avoid short
circuit. Since no voltage is applied to the leads at this step, the oscilloscope may
remain on.
2. Connect one end of the flex cable FC1868 to the Logic Analyzer Input; connect
the other end to Logic Head LH1116. It is unnecessary to switch off power supply
of the oscilloscope while connecting the cable.
Figure 1-9
Connect the Flex Cable
CAUTION:Use only FC1868, LH1116, TC1100 and LC1150 made by
!
RIGOL for specified mixed signal oscilloscopes.
Copyright ©1998-2008 RIGOL Technologies, Inc.
User’s Guide for VS5000 Series
1-9
Page 20
RIGOL
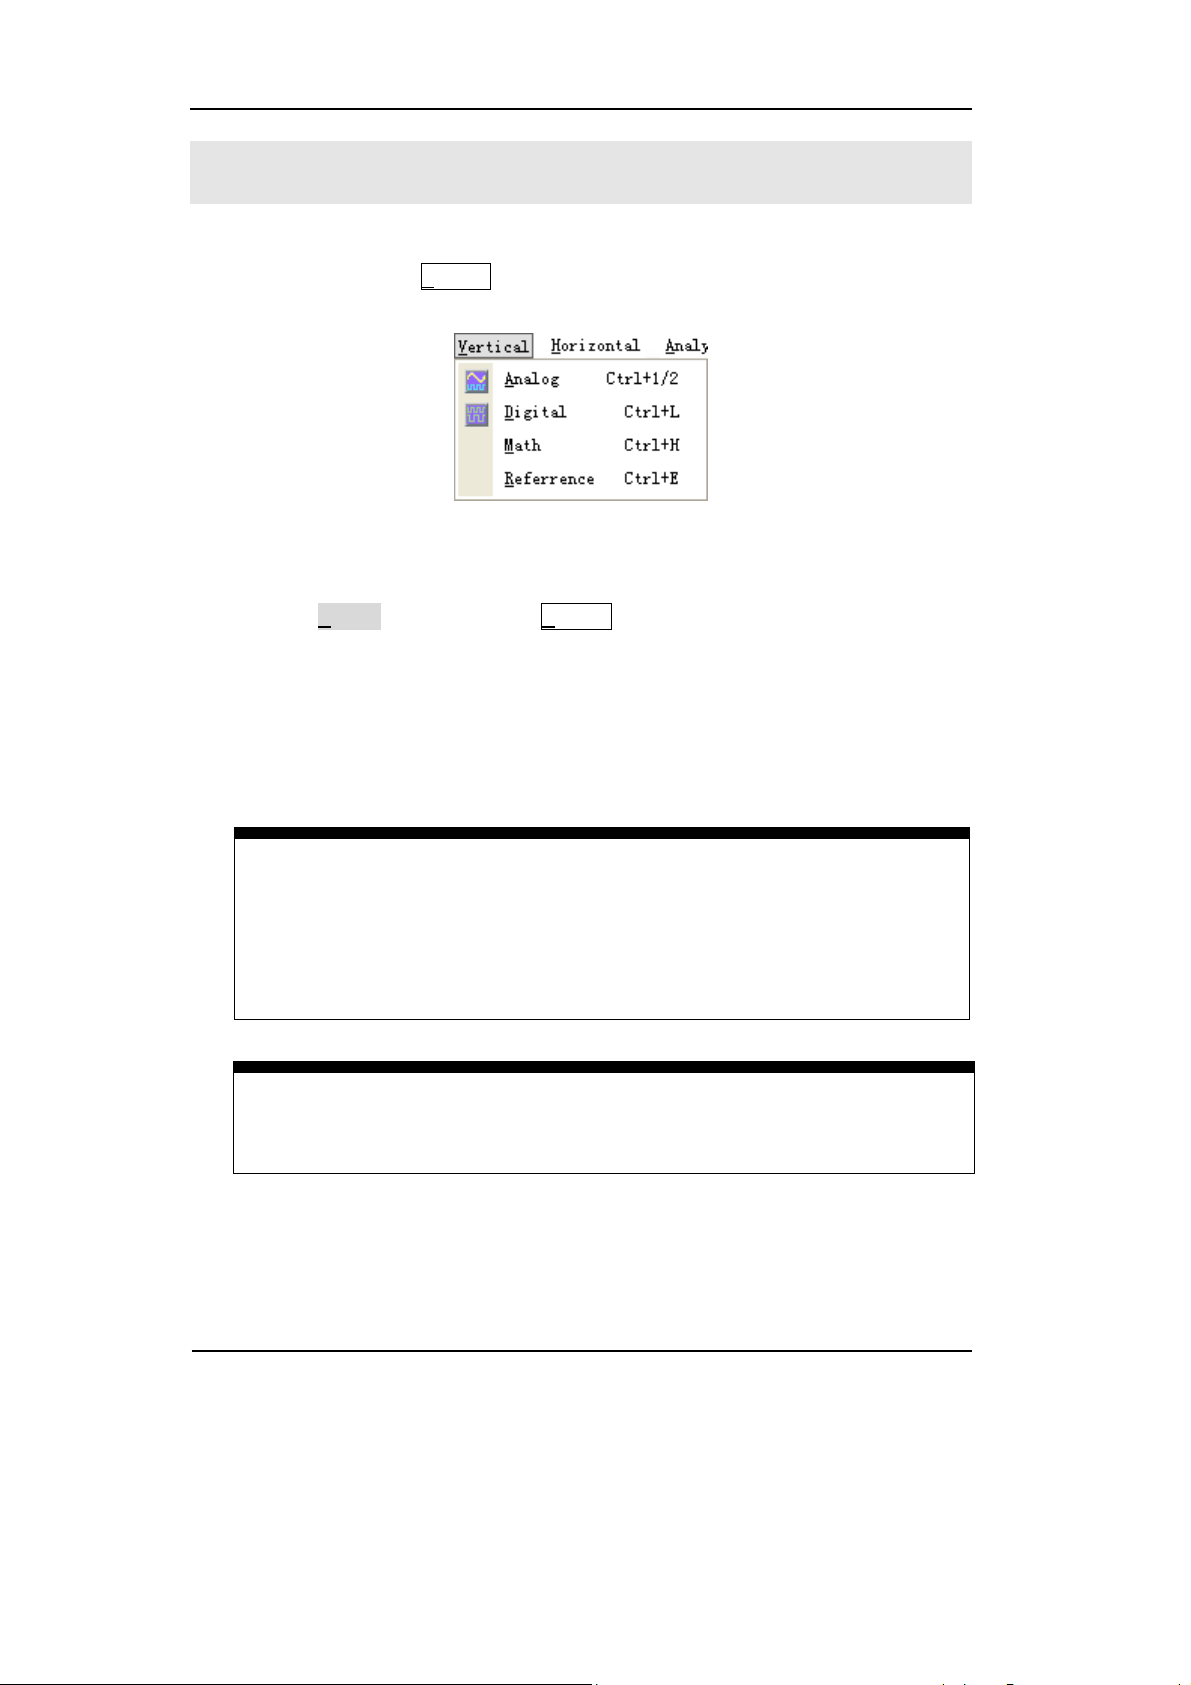
3. Connect a test clip to one lead wire; make sure it is connected well.
Test clip
Figure 1-10
Connect the Test Clip
4. Test the device with the clip.
Figure 1-11
Testing Instruction
5. Remember to connect Ground Channel to the ground terminal of the DUT.
GND
Figure 1-12
Ground Connection
1-10
Copyright ©1998-2008 RIGOL Technologies, Inc.
User’s Guide for VS5000 Series
Page 21

RIGOL
To Display a Signal Automatically
The VS5000 series oscilloscope has an automated function to display the input signal
in best fit. This feature requires a 50 Hz or higher and a duty cycle greater than 1%
input signal.
Press the
HORIZINTAL and TRIGGER controls to display the input signal. Adjust the controls
manually to get the best results if necessary.
Connect a signal to the Channel 1 (CH1) input:
1. Connect a signal to the oscilloscope as described above.
button, the oscilloscope automatically sets up VERTICAL,
2. Click the
button.
The oscilloscope may change the current settings to display the signal, i.e. the
vertical and horizontal scale, the trigger coupling, type, position, slope, level, and
mode.
Copyright ©1998-2008 RIGOL Technologies, Inc.
User’s Guide for VS5000 Series
1-11
Page 22
RIGOL
To Understand the Vertical Window
Figure 1-13 shows the V
parameters.
1. Use the Analog function in the Vertical menu to adjust the functions of the
analog channels. A voltage value is displayed for a short time indicating how far
the ground reference is located from the center of the screen. Use the left
mouse button to dragging the CH1 symbol, and/or use the Scale and Offset
options to set the scale and offset precisely.
ertical menu, which leads to the setting of the vertical
Figure 1-13 Vertical Menu
Measurement hints
If the channel is DC coupled, measuring the DC component of the signal by
simply noting its distance from the ground symbol.
If the channel is AC coupled, the DC component of the signal is blocked,
allowing to use greater sensitivity to display the AC component of the signal.
Vertical offset back to 0 shortcut
Double click the channel sign, as a shortcut, to set the vertical display position
back to 0.
1-12
User’s Guide for VS5000 Series
Copyright ©1998-2008 RIGOL Technologies, Inc.
Page 23

RIGOL
2. Change the vertical setup and notice that each change affects the status bar
differently.
Left-click the vertical status and use the number keyboard to input the exact
Scale value (volt/div); and/or adjust the Scale quickly with the
Click A
nalog, Digital, Math and Reference in the Vertical menu, to set analog
channels, digital channels, math and waveform reference functions.
button.
Copyright ©1998-2008 RIGOL Technologies, Inc.
User’s Guide for VS5000 Series
1-13
Page 24
RIGOL
To Understand the Horizontal System
Figure 1-14 shows the H
parameters.
1. Using the Horizontal function in the Horizontal menu to set the waveform
horizontal options. In the Horizontal window, set the waveform display format
(Y-T, X-Y and Roll) and horizontal Scale and Offset.
orizontal menu, which leads the setting of the horizontal
Figure 1-14 Horizontal Menu
Click the
button, changes the sweep speed in a 1-2-5 step sequence and the
value is displayed in the status bar. The time base ranges of the VS5000 series
are listed as follows. The horizontal scan speed is from 5ns/div
[1]
to 50s/div.
Delayed Scan Shortcut key
Click the button to enter Delayed Scan mode.
[1] NOTE: The speed of horizontal scan varies in different models.
2. Click the Offset function in the Horizontal window to adjust the horizontal
offset.
Horizontal offset back to 0 shortcut key
Click the middle circular button “
shortcut key
” to set the horizontal offset to 0 as a
1-14
Copyright ©1998-2008 RIGOL Technologies, Inc.
User’s Guide for VS5000 Series
Page 25

RIGOL
3. In the Format window of the Horizontal functions window, select the display
mode to Y-T, X-Y or Roll.
Horizontal position control
Trig-Offset: In this setting, the trigger position will be changed horizontally
when the offset value changed.
Copyright ©1998-2008 RIGOL Technologies, Inc.
User’s Guide for VS5000 Series
1-15
Page 26
RIGOL
To Trigger the Oscilloscope
Figure 1-15 shows the Trigger Control, use the functions in the Trigger window of
the H
orizontal menu. The following exercise guides through the buttons and
settings.
Figure 1-15 Trigger Control
1. To set the trigger function in the T
rigger menu.
Drag the Trigger level to adjust the trigger level; or input the trigger level directly
on the top right corner (Status window right side of the
2. Click the
button, turn the Trigger window on (Figure 1-16), to set the
button).
trigger options.
Figure 1-16 Trigger Window
Trigger level back to 0 shortcut key
Double click the trigger level sign to set the trigger level to 0 as a shortcut key.
1-16
User’s Guide for VS5000 Series
Copyright ©1998-2008 RIGOL Technologies, Inc.
Page 27

RIGOL
3. Double click the trigger point, to set the horizontal delayed time to 0 as a
shortcut key.
4. Click the
button to start an acquisition regardless of an adequate trigger
signal, usually used in “Normal” or ”Single” trigger mode. If the acquisition is
already stopped, click this button to start the acquisition again.
Key point:
Holdoff: A time interval before the oscilloscope response to next trigger signal.
During this holdoff period, the trigger system becomes “blind” to trigger
signals. This function helps to view complex signals such as an AM waveform.
In order to set the holdoff time, set the Holdoff Time option in the Trigger
menu.
Copyright ©1998-2008 RIGOL Technologies, Inc.
User’s Guide for VS5000 Series
1-17
Page 28

Page 29
RIGOL
Chapter 2 Operating Your Oscilloscope
The VERTICAL, HORIZONTAL, and TRIGGER control systems and know how to
determine the system setup from the status bar of a VS5000 Series oscilloscope were
introduced in the previous chapter.
This chapter will go through all groups of buttons, knobs, and menus, expanding the
knowledge of operations by hints in this guide.
It is recommended to perform all of the following exercises to get the most of the
powerful measurement capabilities of the oscilloscope.
z Understand the vertical system (
, ,
[1]
, Vertical )
z Understand the horizontal system ( Horizontal )
z Understand the trigger system ( Trigger )
z To set up the sampling system ( Acquire )
z To set up the display system ( Display )
z To save and recall ( Storage )
z To set up utility ( Utility )
z To measure the waveform ( Analyzer )
z To use the run control buttons ( , and )
[1] NOTE: This function is for VS5***D model only.
Copyright ©1998-2008 RIGOL Technologies, Inc.
User’s Guide for VS5000 Series
2-1
Page 30
RIGOL
To Set the Vertical system
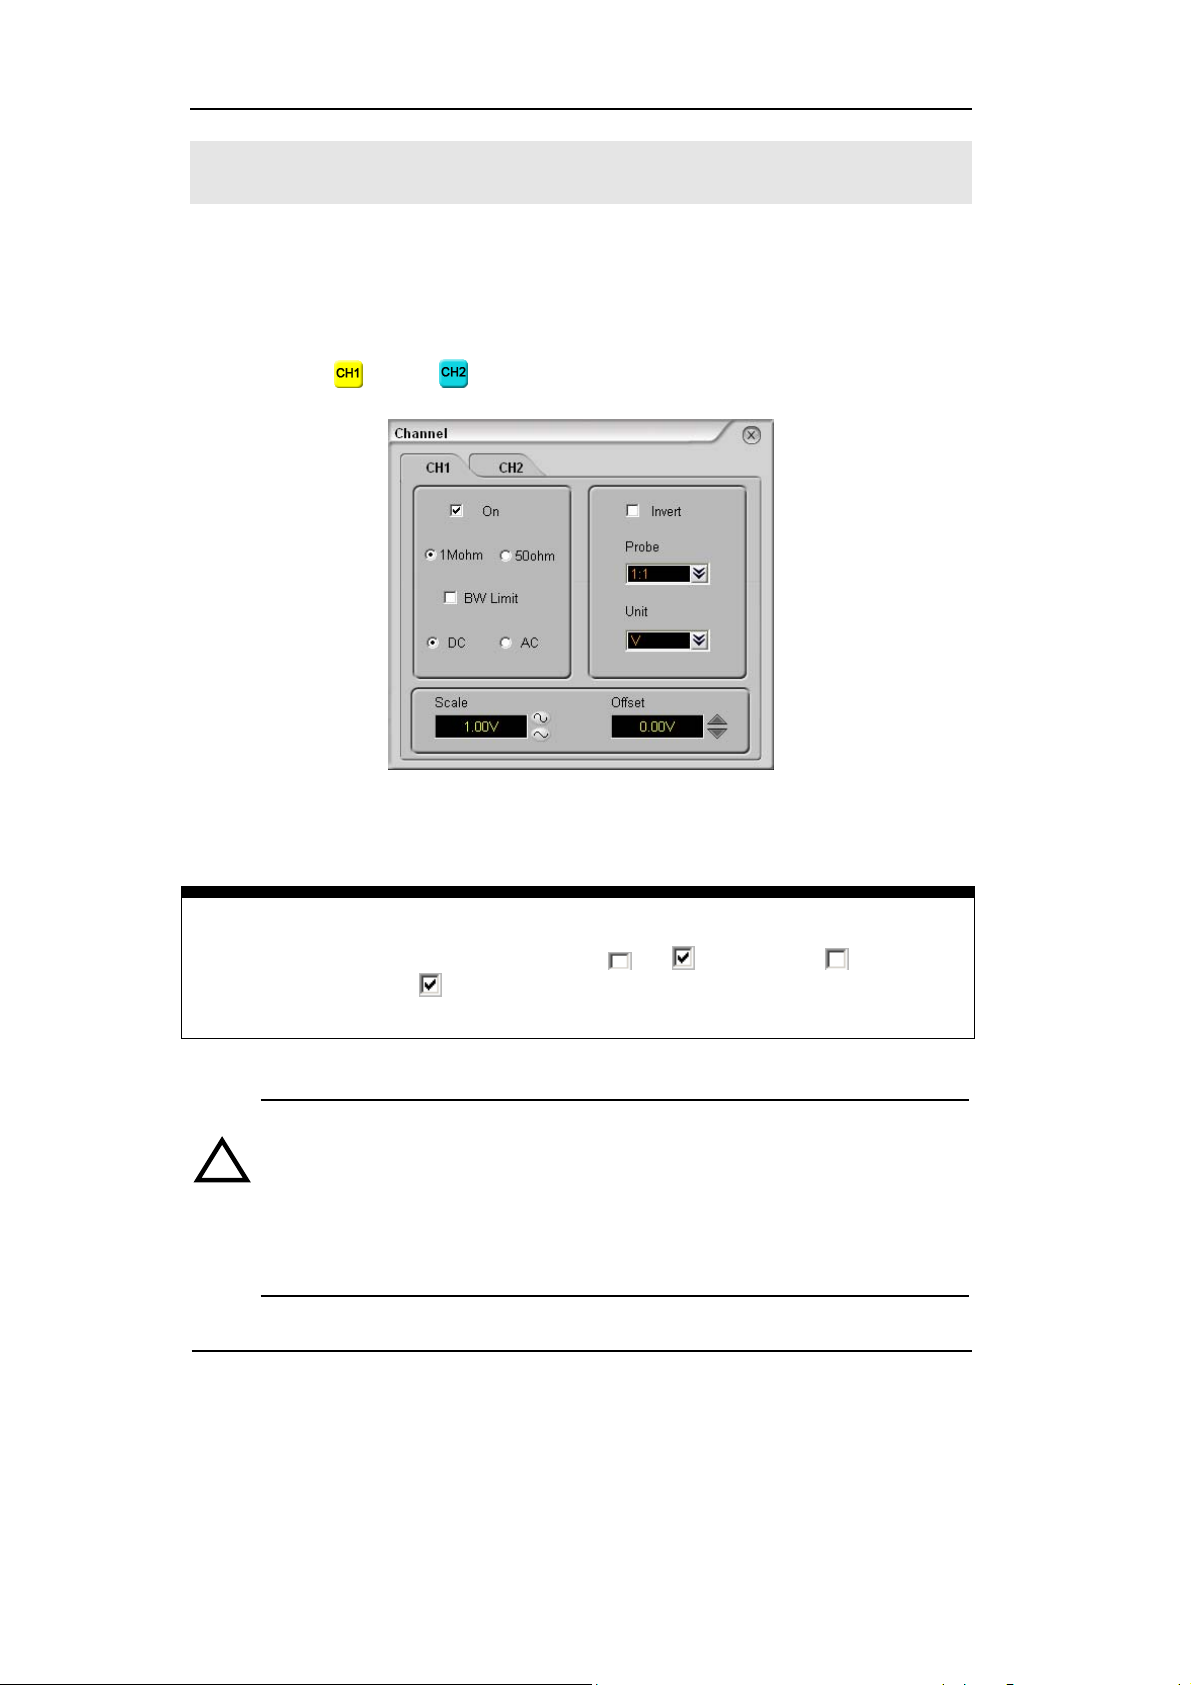
Analog Channel Settings
Each channel of VS5000 has an operation menu.
Right click the
Turn the function On/Off:
or the button; the “Channel” window will appear.
Figure 2-1
Channel Window
In front of the function option there is a
function is turned OFF,
CAUTION: 1. To aviod damaging the input part of the oscilloscope, when
!
2. For the probe provided for the oscilloscope, do not use 50
ohm settings directly.
2-2
means it is turned ON.
use 50 ohm settings, make sure that the input voltage do not
exceed the limit voltage (5Vrms, corresponding to the 1:1
probe)
Copyright ©1998-2008 RIGOL Technologies, Inc.
User’s Guide for VS5000 Series
or choice box, means this
Page 31

Table 2-1 Analog Channel Functions
Function Setting Description
Channel Switch
ON
OFF
Open the Channel
Close the Channel
RIGOL
Input
Impedance
BW Limit
Coupling
[1]
1M ohm
50 ohm
ON
OFF
DC
AC
Set the Input Impedance to be 1M ohm
Set the Input Impedance to be 50 ohm
Limit the channel bandwidth to 20MHz to
reduce display noise.
Get full bandwidth.
Pass both AC and DC components of the input
signal
Block the DC component of the input signal
1:1
Probe
1:10
1:100
Set this to match the probe attenuation factor
to make the vertical scale read correct
1:1000
Scale
Invert
Coarse
Exactitude
ON
OFF
Select the resolution of the
a 1-2-5 sequence.
Input the scale value directly.
Turn on the invert function.
Restore to original display of the waveform.
button defines
[1] NOTE: The Input Impedance option is only used for VS5202D or
VS5202.
Copyright ©1998-2008 RIGOL Technologies, Inc.
User’s Guide for VS5000 Series
2-3
Page 32
RIGOL
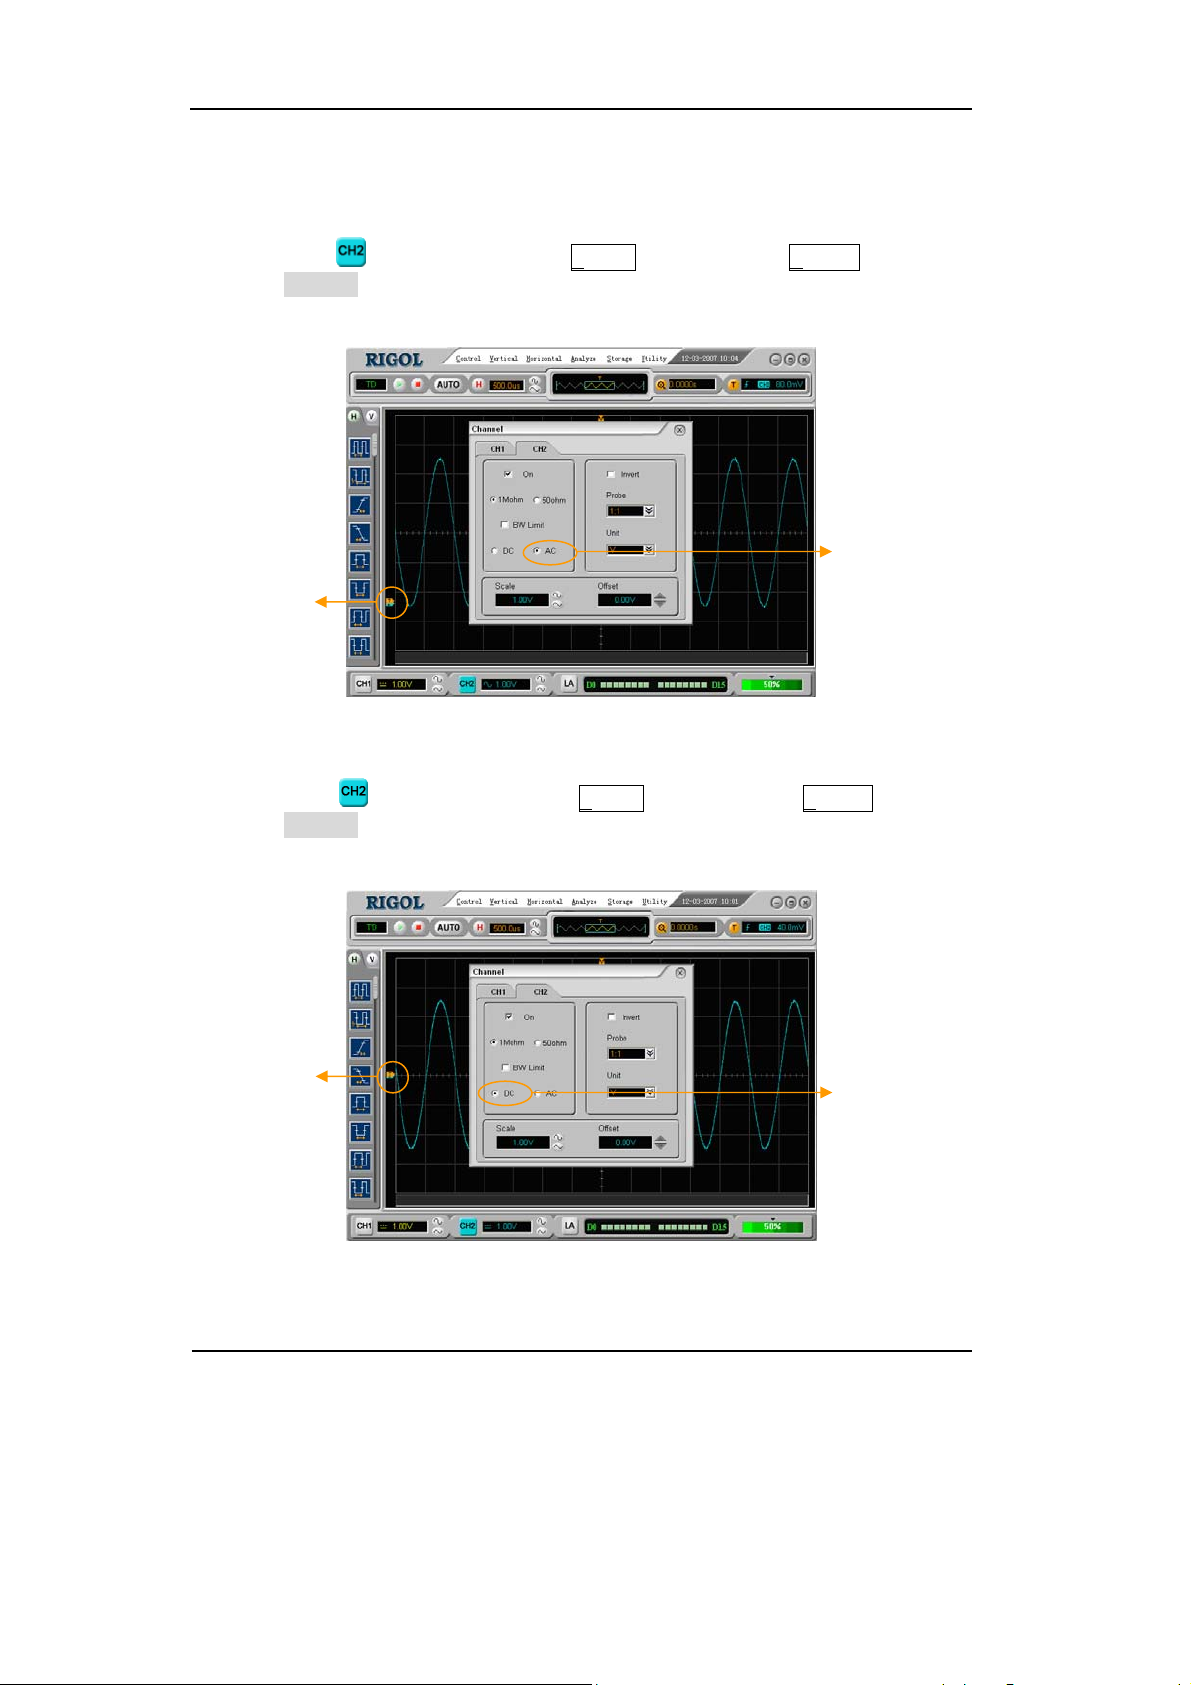
1. Channel Coupling
To use Channel 2 as an example, input a sine wave signal with DC offset.
Right click the button or select the Analog function in the Vertical menu, and
enter the Channel window. Set the Coupling to AC. In this setting, it blocks the DC
component of the input signal.
AC Coupling
Channel
Sign
Figure 2-2
To Set AC Coupling
Right click the
button or select the Analog function in the Vertical menu, to
enter the Channel window. Set the Coupling to DC. In this setting, it blocks the AC
component of the input signal.
Channel
Sign
DC Coupling
Figure 2-3
To Set DC Coupling
2-4
Copyright ©1998-2008 RIGOL Technologies, Inc.
User’s Guide for VS5000 Series
Page 33

RIGOL
2. Set up the Channel Bandwidth Limit
To use Channel 1 as an example, input a signal that contains high frequency
component.
Right-click the button, the Channel window will appear. Turn the BW Limit
function off. The oscilloscope is set to full bandwidth and will pass the high frequency
component in the signal.
Turn o f f the
BW Limit
Figure 2-4
Turn off the BW Limit
Right-click the button, the Channel window will appear. Turn the BW Limit
function on. It will reject the frequency component higher than 20MHz.
20MHz BW
Limit
Figure 2-5
Turn on the BW Limit
Copyright ©1998-2008 RIGOL Technologies, Inc.
User’s Guide for VS5000 Series
2-5
Page 34

RIGOL
3. Probe Attenuation Setting
Select the attenuation factor for the probe. The attenuation factor changes the
vertical scale of the oscilloscope so that the measurement results reflect the actual
voltage levels at the probe tip.
To change (or check) the probe attenuation setting, press the CH1 or CH2 button
(according to which channel are in using), toggle the Probe soft button to match the
attenuation factor of the probe.
This setting remains in effect until changed again.
Figure 2-6 gives an example for using a 1:1000 probe and its attenuation factor.
Vertical volt/div
Table 2-2 Probe setting
Probe attenuation factors Corresponding settings
1:1 1X
1:10 10X
1:100 100X
1:1000 1000X
Probe
Attenuation
Figure 2-6
To Set the Probe Attenuation
2-6
Copyright ©1998-2008 RIGOL Technologies, Inc.
User’s Guide for VS5000 Series
Page 35

RIGOL
4. Volts/Div Settings
The Volts/Div control has Coarse or Fine configuration. The Vertical Sensitivity is
2mV-5V/div.
Coarse:
It is the default setting of Volts/Div, in a 1-2-5-step sequence from 2mV/div, 5mV/div,
10mV, to 5 V/div.
Fine:
This setting changes the vertical scale with accurate value.
Fine adjustment
setting value
Fine adjustment data Coarse adjustment
Fine adjustment data Coarse adjustment
Figure 2-7
Scale and Offset Window
Set the vertical scale and offset in the Scale and Offset function of the Channel
window.
Copyright ©1998-2008 RIGOL Technologies, Inc.
User’s Guide for VS5000 Series
2-7
Page 36

RIGOL
5. To Invert a Waveform
Invert turns the displayed waveform 180 degrees, with respect to the ground level.
When the oscilloscope is triggered on the inverted signal, the trigger is also inverted.
Figure 2-8 and 2-9 show the changes before after inversion.
Invert OFF
Figure 2-8
The Waveform before Inversion
Figure 2-9
The Waveform after Inversion
Invert ON
2-8
Copyright ©1998-2008 RIGOL Technologies, Inc.
User’s Guide for VS5000 Series
Page 37

RIGOL
Digital Channel Settings (for VS5***D only)
It allows to turn single channel or group channels ON or OFF, to set the Wave Size, to
change display location of digital channel on screen and to select Threshold Type.
Left click the D
igital button in the Vertical menu, or right click the button to
show the Logic Analyzer window.
Logic Analyzer Interface
Table 2-3 Logic Analyzer Settings
Function Setting Description
D7-D0 Set up channel group D7-D0
Figure 2-10
D15-D8 Set up channel group D15-D8
All on ON/OFF
Turn all (D7-D0 or D15-D8) digital
channels ON/OFF
Wave Size Big/Small Select the waveform display size.
Reset Reset the waveform display position.
TTL
Threshold
Type
CMOS
ECL
USER
Copyright ©1998-2008 RIGOL Technologies, Inc.
User’s Guide for VS5000 Series
Select mode of all digital channels.
The threshold voltage can be set by
user in user-defined style.
2-9
Page 38

RIGOL
1.Display and re-line up the digital channels
1) Tu rn on the Logic Analyzer window. Use the options in this window to set the
Channel ON/OFF, Wave Size, Threshold Type and Reset the waveform display
position.
2) Drag the digital channel sign to move the digital waveform to the designated
location.
3) Click the Reset button to reset the waveform position.
Figure 2-11
Open the Channels of D0~D7
2-10
User’s Guide for VS5000 Series
Copyright ©1998-2008 RIGOL Technologies, Inc.
Page 39
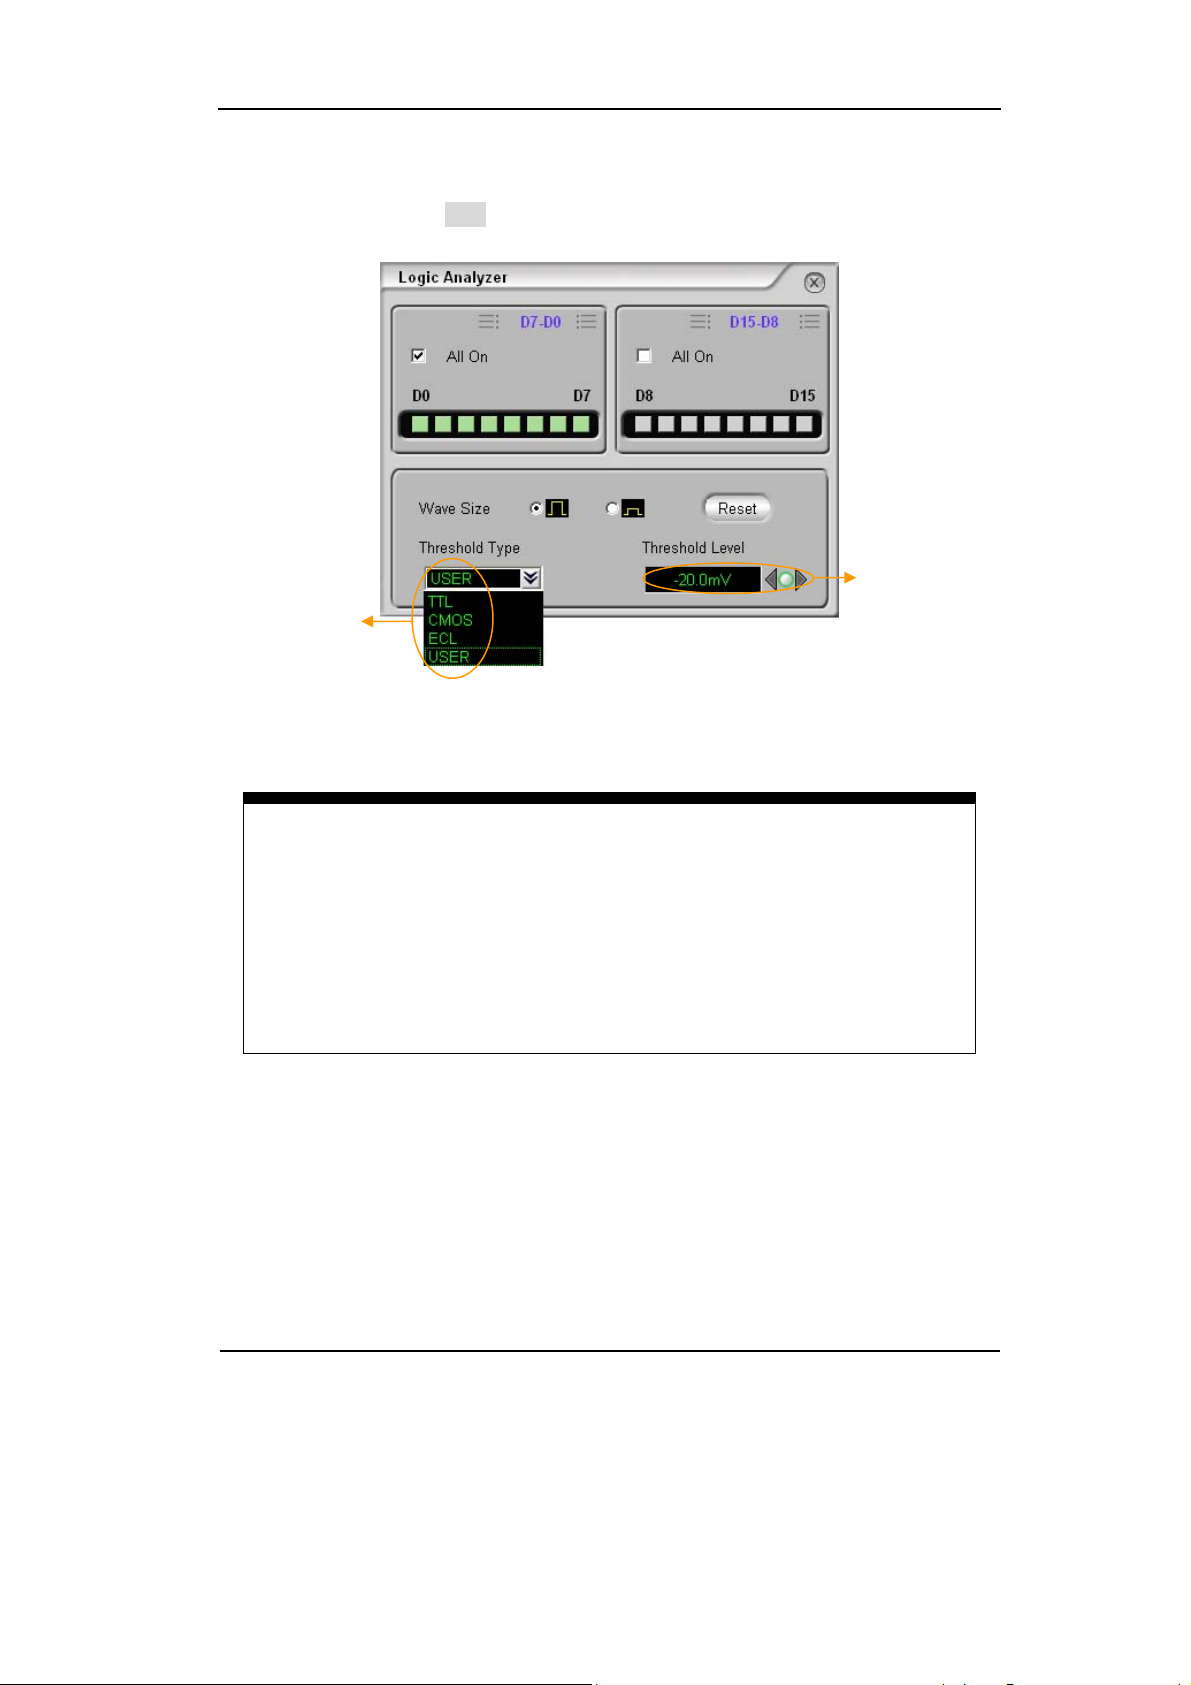
2.Set Threshold Type of Digital Channels
Select logic standard or User to define the threshold voltage.
Threshold
type
Figure 2-12
To Set the Threshold Type
Setup the
value of
threshold
by user
RIGOL
Threshold explanation
LOGIC STANDARD THRESHOULD VOLTAGE
TTL 1.4V
CMOS 2.5V
ECL -1.3V
USER -8V to +8V
Copyright ©1998-2008 RIGOL Technologies, Inc.
User’s Guide for VS5000 Series
2-11
Page 40

RIGOL
Math Functions
The mathematic functions include “add”, “subtract”, “multiply” and “FFT” for Channel
1 and Channel 2. The mathematic result can be measured by the grid and the cursor.
The Math function may turn on four channels, each channel could be operated
independently (Except Delayed display).
Figure 2-13
Interface of the Mathematic Function
Table 2-4 Mathematic Function
Function Setting Description
Math
On
Off
A+B
A- B
Operation
A×B
FFT
Filter
Source A
Source B
CH1
CH2
CH1
CH2
Turn this math channel on.
Turn this math channel off.
Add source A and source B
Subtract source B from source A
Multiply source A by source B
Fast Fourier Transform
Digital filter
Define CH1 or CH2 as source A
Define CH1 or CH2 as source B
2-12
Copyright ©1998-2008 RIGOL Technologies, Inc.
User’s Guide for VS5000 Series
Page 41

RIGOL
1. Digital Filter
Left click the Math button in the Vertical menu. Select Filter function. In Filter Type,
select the type of filter: Low Pass, High Pass, Band Pass or Band Reject. Set
high and low limit of frequency.
Turn off
Digital Filter
Turn o n
Digital Filter
Figure 2-14
Interface of the Digital Filter
Table 2-5 Digital Filter Function
Function Setting Description
Source
Digital Filter
CH1
CH2
Off
On
Low Pass
Filter Type
High Pass
Band Pass
Band Reject
Upper limit
Lower limit
Define CH1 or CH2 as source
Turn off the digital filter
Turn on the digital filter
Setup as LPF (Low Pass Filter)
Setup as HPF(High Pass Filter)
Setup as BPF (Band Pass Filter)
Setup as BRF(Band Reject Filter)
Set high limit
Set low limit
Copyright ©1998-2008 RIGOL Technologies, Inc.
User’s Guide for VS5000 Series
2-13
Page 42

RIGOL
2. Addition, Subtraction and Multiplication Function
In Math function, use the addition, subtraction and multiplication function to operate
and analyze the waveform.
Figure 2-15
The Addition, Subtraction and Multiplication Function
Enter the Math window. Select the math function in the Operator menu. Select
Source A and B. Then adjust the vertical Scale and Offset to view the math channel
clearly.
2-14
Copyright ©1998-2008 RIGOL Technologies, Inc.
User’s Guide for VS5000 Series
Page 43
RIGOL
3. Using the FFT
The FFT (Fast Fourier Transform) process converts a time-domain signal into its
frequency components mathematically. FFT waveforms are useful in the following
applications:
z Measuring harmonic content and distortion in systems
z Characterizing noise in DC power supplies
z Analyzing vibration
Table 2-6 FFT Function
Function Setting Description
Source
Window
Display
CH1
CH2
Rectangle
Hanning
Hamming
Blackman
Split
Full screen
Define CH1 or CH2 as FFT source
Select window for FFT
Display FFT waveform on half screen
Display FFT waveform on full screen
Scale
Vrms
dBVrms
Set “Vrms ” as vertical unit
Set “dBVrms ” as vertical unit
Key points for FFT
1. Signals that have a DC component or offset can cause incorrect FFT
waveform component magnitude values. To minimize the DC component,
choose AC Coupling on the source signal.
2. To reduce random noise and aliases components in repetitive or single-shot
events, set the oscilloscope acquisition mode to average.
3. To display FFT waveforms with a large dynamic range, use the dBVrms scale.
The dBVrms scale displays component magnitudes using a log scale.
Copyright ©1998-2008 RIGOL Technologies, Inc.
User’s Guide for VS5000 Series
2-15
Page 44
RIGOL
Selecting a FFT Window
VS5000 series digital oscilloscopes provide four FFT window functions. Each window
is a trade-off between frequency resolution and amplitude accuracy. It depends on
the desired measurements and source signals characteristics to determine the
window to use. Use the following guidelines to select the best window.
Table 2-7 FFT Windows description
Window Features Best for measuring
Transients or bursts, the signal
levels before and after the event
are nearly equal.
Equal-amplitude sine waves with
fixed frequencies.
Broadband random noise with a
Rectangle
Best frequency resolution
and worst magnitude
resolution. This is
essentially the same as
no window.
relatively slow varying spectrum.
Hanning
Hamming
Better frequency, poorer
magnitude accuracy than
Rectangular.
Hamming has slightly
better frequency
resolution than Hanning.
Blackman Best magnitude, worst
frequency resolution.
Sine, periodic, and narrow-band
random noise.
Transients or bursts where the
signal levels before and after the
events are significantly different.
Single frequency waveforms, to
find higher order harmonics.
Key points:
FFT Resolution
With a fixed FFT points, the lower sampling rate results in better resolution.
Nyquist Frequency
The highest frequency that any real-time digital oscilloscope can acquire
without aliasing. It’s normally half of the sample rate. This frequency is
called the Nyquist frequency. Frequency above the Nyquist frequency will be
under sampled, causing a situation known as aliasing.
2-16
User’s Guide for VS5000 Series
Copyright ©1998-2008 RIGOL Technologies, Inc.
Page 45

RIGOL
Set the Reference
Reference Waveforms are saved waveforms to be selected for display. The reference
function will be available after saving the selected waveform to non-volatile memory.
Click the Reference button in the Vertical menu, go to the Reference window.
Table 2-8 Reference Function
Function Setting Description
CH1
CH2
Source
MATH1
MATH2
MATH3
MATH4
File
Off
On
Save Save Reference waveform
Select CH1 as Reference channel
Select CH2 as Reference channel
Select Math1 as Reference channel
Select Math2 as Reference channel
Select Math3 as Reference channel
Select Math4 as Reference channel
Turn the file selection off
Turn the file selection on
Load Into the Open File window
Figure 2-16
Interface of Reference
Copyright ©1998-2008 RIGOL Technologies, Inc.
User’s Guide for VS5000 Series
2-17
Page 46

RIGOL
1. Export
Click the Load button in the Reference window.
Table 2-9 Export Function
Function Setting Description
Open Load the file that was selected
Cancel Cancel the current operation
Keyboard
Use the soft-keyboard input the file
name
The Open File window as shown below:
2-18
Figure 2-17
Open a Reference File
Copyright ©1998-2008 RIGOL Technologies, Inc.
User’s Guide for VS5000 Series
Page 47

2. Import
Click the Save button in the Reference window.
Table 2-10 Import Function
Function Setting Description
Save Save the file that was named
Cancel Cancel the current operation
RIGOL
Keyboard
Use the soft-keyboard input the file
name
The Save File window as shown below:
Figure 2-18
Save a Reference File
Copyright ©1998-2008 RIGOL Technologies, Inc.
User’s Guide for VS5000 Series
2-19
Page 48

RIGOL
3. Open/Save File Window
Click the Load button in the Reference window to turn on the “Open File”
window.
Table 2-11 Open/Save Functions
Function Setting Description
Driver
Select the
driver location
Switch the driver
Open the selected file
Open/Save
Save the file with the input File
Name
Cancel Cancel the current operation
Keyboard
Use the soft-keyboard input the
file name
The Open/Save File Window as shown below:
Open/Save File Windows
NOTE:
The File function is default Off (
the File function On ( ).
2-20
User’s Guide for VS5000 Series
Figure 2-19
), to save the file in the hard driver, turn
Copyright ©1998-2008 RIGOL Technologies, Inc.
Page 49

Operation Comments
RIGOL
1) Click On (
) to turn the Reference function on.
2) Click Source to select CH1, CH2, MATH1, MATH2, MATH3 and MATH4 channel.
3) Adjust the Scale and Offset of the Vertical and Horizontal.
4) Click the Save button to save the waveform being displayed on the screen as
Reference.
NOTE: The Reference function is not available in X-Y mode.
Copyright ©1998-2008 RIGOL Technologies, Inc.
User’s Guide for VS5000 Series
2-21
Page 50

RIGOL
Turn on/off Channels
The CH1, CH2, Ext Trigger and LA (for VS5***D only) channels on VS5000 series are
input channels. All functionalities applied will be based on operating the instrument
with channels. So MATH and REF can be regarded as relatively isolated channels.
To turn on/off any one of the channels, press the corresponding button on the front
panel. The button turns coloured indicates the channel is currently active. Press the
button again or chose Off in Channel/Logic Analyzer window to turn the channel
off.
Table 2-12 Turn On/Off channels
Channel Mode Settings
Channel 1 (CH1)
Channel 2 (CH2)
ON
OFF
ON
OFF
ON
MATH
OFF
[1]
ON
OFF
ON
OFF
Reference
Logic Analyzer
CH1 (yellow background)
CH1 (gray background)
CH2 (blue background)
CH2 (gray background)
M1 M2 M3 M4 (to distinguish
between the four colors)
No indicator
Ref 1/2/3/4 (white background)
No indicator
LA (green background)
LA (gray background)
Status Indicator
NOTE:
The status indicators (CH1, CH2 and LA) of the VS5000 series in the above table are
displayed on the lower-left of the main window.
The four MATH function channels are distinguished between the four colors.
Click of
will turn all the digital channels on/off.
[1] Logic Analyzer for VS5***D model only.
2-22
User’s Guide for VS5000 Series
Copyright ©1998-2008 RIGOL Technologies, Inc.
Page 51

RIGOL
To Set the Horizontal System
The oscilloscope shows the time per division in the scale readout. Since all active
waveforms use the same time base, the oscilloscope only displays one value for all
the active channels, except when using Delayed Scan, or Alternative Trigger.
The horizontal controls changes the horizontal scale and position of waveforms. The
horizontal center of the screen is the time reference for waveforms. Changing the
horizontal scale causes the waveform to expand or contract with respect to the
screen center.
Horizontal position changes the displayed waveform position, relative to the trigger
point.
Scale
: Set the horizontal time/div (scale factor) for the main or the Delayed Scan
time base. When Delayed Scan is enabled, it changes the width of the window zone
by changing the Delayed Scan time base.
Offset
: Adjusts the horizontal position of all channel (including Math)
waveforms. The resolution of this control varies with the time base. Click the
Mid-circular button clears trigger offset and moves the trigger point to the horizontal
center of the screen.
Table 2-13 Horizontal Setting Function
Function Setting Description
Show the relative relation between
vertical voltage and horizontal time.
Show CH1 value at X axis; CH2
value at Y axis.
In Roll Mode, the waveform display
updates from right to left.
Time
Base
Y-T
X-Y
Roll
Scale Set the horizontal scale
Offset Set the horizontal offset
Delayed
Copyright ©1998-2008 RIGOL Technologies, Inc.
Off
On
User’s Guide for VS5000 Series
Turn off Delayed Scan mode
Turn on the Delayed Scan mode
2-23
Page 52

RIGOL
④①②③⑤
Figure 2-20
Horizontal Setting Information in Main Interface
Marks Indicator
①. The current waveform position window in the memory.
②. The trigger position in the memory.
③. The trigger position in the current waveform windows.
④. The horizontal time base (the main time base).
⑤. The trigger’s horizontal offset according to the center of the window.
2-24
Copyright ©1998-2008 RIGOL Technologies, Inc.
User’s Guide for VS5000 Series
Page 53

RIGOL
gg
Key Points
Y-T:
The conventional oscilloscope display format. It shows the voltage of a waveform
record (on the vertical axis) as it varies over time (on the horizontal axis).
X-Y:
X-Y format displays channel 1 in the horizontal axis and channel 2 in the vertical axis.
Roll Mode:
In this mode, the waveform display rolls from right to left. No trigger or horizontal
offset control of waveforms is available during Roll Mode, and it’s only available
when set to 500 ms/div or slower.
Slow Scan Mode:
This mode is available when the horizontal time base is set to 50ms or slower. In this
mode, the oscilloscope acquires sufficient data for the left part to the trigger point,
then wait for tri
er, when trigger occurs, it continue to draw the rest part from the
trigger point to the end of the right side. When choosing this mode to view low
frequency signals, it is recommended that the channel coupling be set as DC.
Time/Div:
Horizontal scale. If the waveform acquisition is stopped (using the
Time/Div control expands or compresses the waveform.
Copyright ©1998-2008 RIGOL Technologies, Inc.
User’s Guide for VS5000 Series
button), the
2-25
Page 54

RIGOL
p
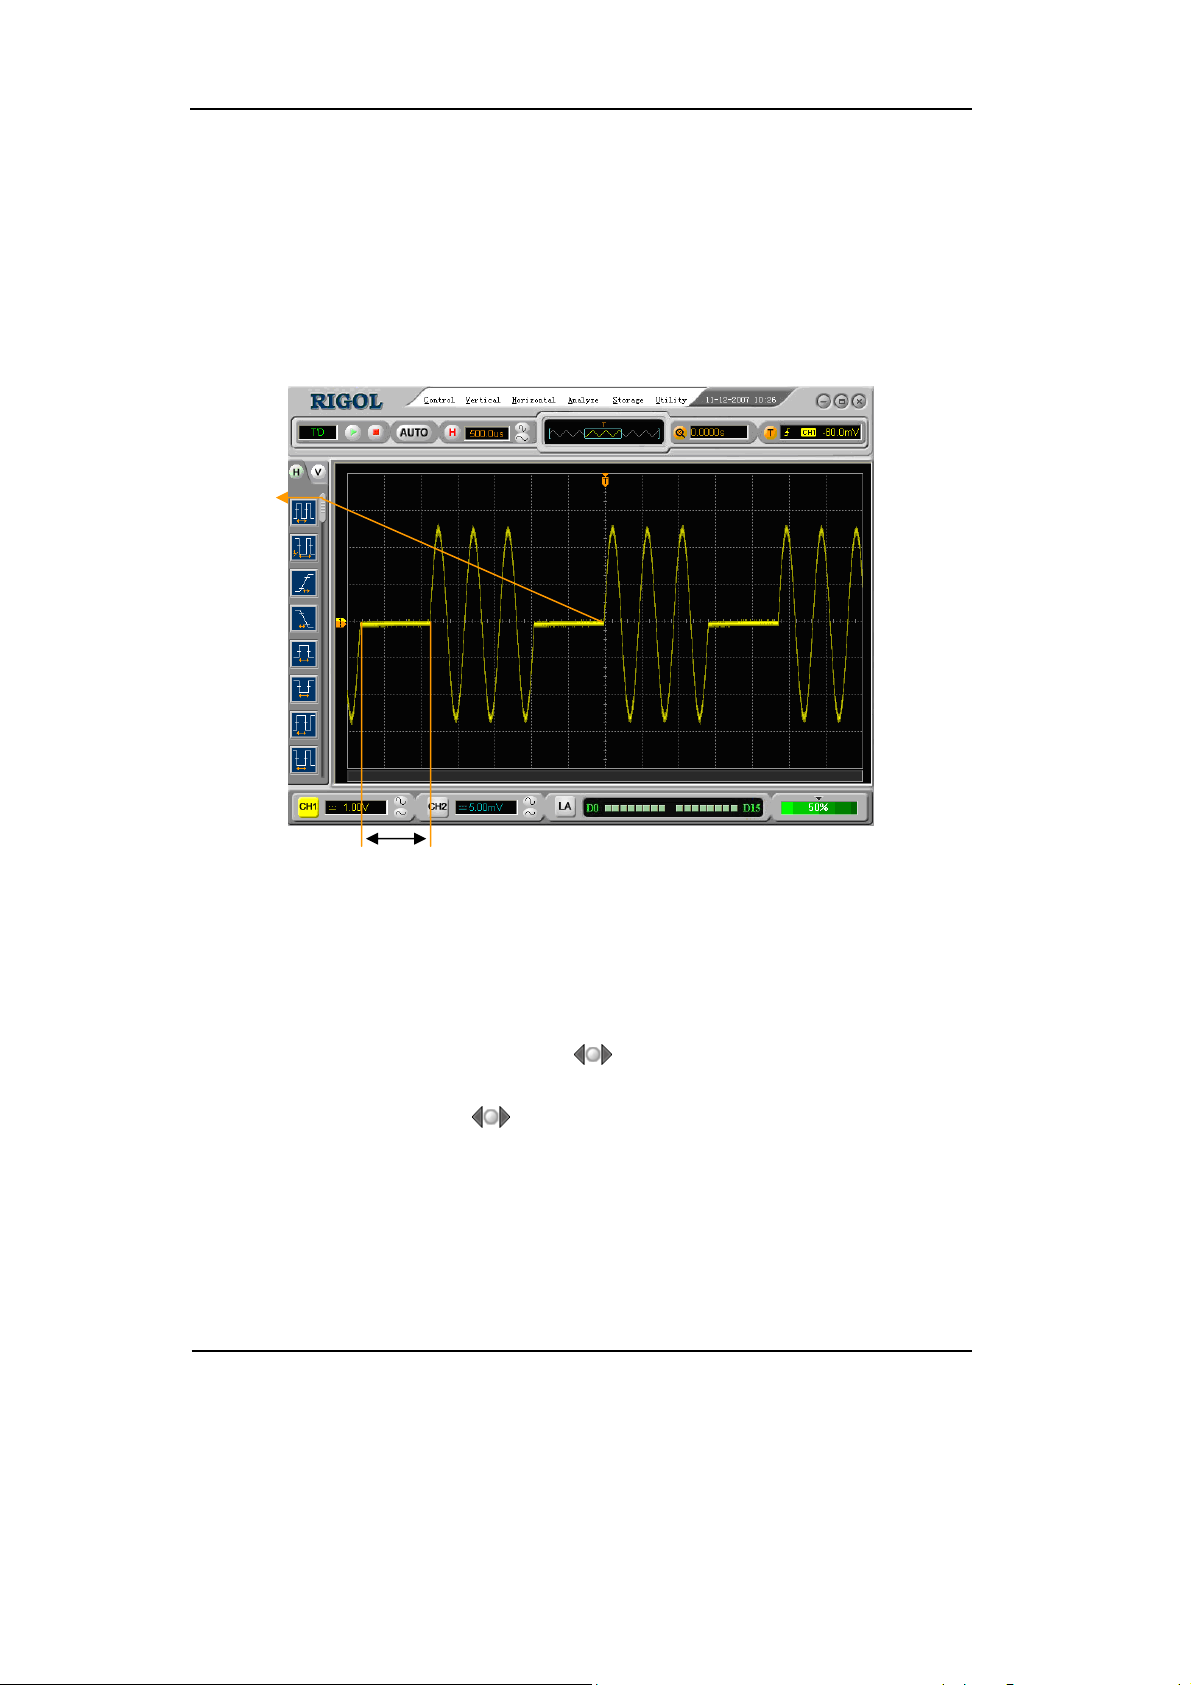
1. Delayed Scan
The Delayed Scan is a magnified portion of the main waveform window. Use Delayed
Scan to locate and horizontally expand part of the main waveform window for a more
detailed (higher horizontal resolution) analysis of signal. The Delayed Scan time base
setting cannot be set slower than the main time base setting.
Main time base
Waveform to be horizontally expanded
Time base of Delayed Scan
Ex
anded waveform in horizontal
Figure 2-21
Delayed Scan
The following describes the Delayed Scan display.
The screen is divided into two parts. The upper half displays the main waveform
window and the lower half displays an expanded portion of the main waveform
window. This expanded portion of the main window is called the Delayed Scan
window. Two blocks shadow the upper half; the un-shadowed portion is expanded in
the lower half. The horizontal
2-26
and knobs control the size and position of the
Copyright ©1998-2008 RIGOL Technologies, Inc.
User’s Guide for VS5000 Series
Page 55

RIGOL
Delayed Scan. The symbol at bottom of the screen means the main time base and
the symbol on the center bottom means the Delayed Scan time.
Delayed Scan shortcut key:
Delayed Scan function can be activated not only by the menu but also by click
the
.
Copyright ©1998-2008 RIGOL Technologies, Inc.
User’s Guide for VS5000 Series
2-27
Page 56

RIGOL
2. X-Y Mode
This format is useful for studying phase relationships between two signals.
Channel 1 in the horizontal axis(X) and Channel 2 in the vertical axis(Y). The
oscilloscope uses a none-trigger acquisition mode, data is displayed as dots.
Figure 2-22
The X-Y Display Format
The following modes or functions will not work in X-Y mode.
z LA Function (for VS5***D only)
z Automatic Measurements
z Cursor Measurements
z REF and MATH Operations
z Delayed Scan Mode
z Vector Display Mode
z Horizontal
Button
z Trigger Controls
2-28
Copyright ©1998-2008 RIGOL Technologies, Inc.
User’s Guide for VS5000 Series
Page 57

RIGOL
To Set the Trigger System
The trigger determines when the oscilloscope starts to acquire data and display a
waveform. When a trigger is set up properly, it can convert unstable displays or blank
screens into meaningful waveforms.
When the oscilloscope starts to acquire a waveform, it collects enough data so that it
can draw the waveform to the left of the trigger point. The oscilloscope continues to
acquire data while waiting for the trigger condition to occur. After it detects a trigger,
the oscilloscope continues to acquire enough data so that it can draw the waveform
to the right of the trigger point.
In the H
Mode: Select the trigger mode.
orizontal of the main menu, there is Trigger menu include:
Setting: Set the trigger Source channel, trigger Level and trigger Slope mode.
Sweep: Set the sweep mode to Auto, Normal or Single.
Trigger setting: Set the trigger Coupling, adjust the trigger Sensitivity and
adjust the Holdoff Time.
Figure 2-23
Interface of Trigger Settings
Copyright ©1998-2008 RIGOL Technologies, Inc.
User’s Guide for VS5000 Series
2-29
Page 58

RIGOL
Trigger Modes
The oscilloscope provides seven trigger modes: Edge, Pulse, Slope, Video,
Alternative, Pattern and Duration trigger (for VS5***D only).
Edge:
An edge trigger occurs when the trigger input passes through a specified voltage
level in the specified slope direction.
Pulse:
Use this trigger type to catch pulses with certain pulse width.
Video:
Use video trigger on fields or lines for standard video signals.
Slope:
The oscilloscope begins to trigger according to the signal rising or falling speed.
Alternative:
Trigger on non-synchronized signals
Pattern:
To trigger through detecting specified codes.
Duration:
To trigger within a specified time on the conditions of a specified code.
2-30
Copyright ©1998-2008 RIGOL Technologies, Inc.
User’s Guide for VS5000 Series
Page 59

RIGOL
Settings for Edge Trigger
An edge trigger determines whether the oscilloscope finds the trigger point on the
rising or the falling edge of a signal. Select Edge trigger Mode to trigger on Rising
edge or falling edge.
Table 2-14 Edge Trigger Settings
Function Setting Description
Mode
Source
CH1
CH2
EXT
EXT/5
AC Line
D15-D0
Select the trigger mode to Edge
Select CH1 as trigger signal
Select CH2 as trigger signal
Select EXT TRIG as trigger signal
Select attenuated EXT TRIG/5 as trigger signal
Select power line as trigger signal
Select a digital channel in D15-D0 as trigger
source (for VS5***D only)
Slope
Sweep
Rising
Falling
Auto
Normal
Single
Trigger on rising edge
Trigger on falling edge
Acquire waveform even no trigger occurred
Acquire waveform when trigger occurred.
When trigger occurs, acquire one waveform
then stop
Set Up To go to the Set Up menu
Copyright ©1998-2008 RIGOL Technologies, Inc.
User’s Guide for VS5000 Series
2-31
Page 60

RIGOL
Settings for Pulse Width Trigger
Pulse trigger occurs according to the width of a pulse. The abnormal signals can be
detected through setting up the pulse width condition.
Table 2-15 Pulse Width Trigger Settings
Function Setting Description
Select CH1 as trigger signal
Select CH2 as trigger signal
Select EXT TRIG as trigger signal
Select attenuated EXT TRIG/5 as
trigger signal
Select a digital channel in D15-D0
as trigger source(for VS5***D
only)
Source
CH1
CH2
EXT
EXT/5
D15-D0
Level To set the trigger level
+Pulse width more than
+Pulse width less than
+Pulse width equal to
-Pulse width more than
-Pulse width less than
-Pulse width equal to
When
+More than
+Less than
+Equal
-More than
-Less than
-Equal
Pulse Width Set required pulse width
Acquire waveform even no trigger
occurred
Acquire waveform when trigger
occurred.
When trigger occurs, acquire one
waveform then stop
Sweep
Auto
Normal
Single
Set Up To go to the Set Up menu
NOTE: The Pulse width adjusts range is 20ns - 10s. When the rule is met, it will
trigger and acquire the waveform.
2-32
Copyright ©1998-2008 RIGOL Technologies, Inc.
User’s Guide for VS5000 Series
Page 61

RIGOL
Settings for Video Trigger
Choose video trigger to trigger on fields or lines of NTSC, PAL, or SECAM standard
video signals. Trigger coupling preset to DC.
Table 2-16 Video Trigger Settings
Function Setting Description
Source
Polarity
Standard
CH1
CH2
EXT
EXT/5
Normal polarity
Inverted polarity
NTSC
PAL/SECAM
Select CH1 as trigger source
Select CH2 as trigger source
Select EXT TRIG as trigger source
Select EXT TRIG/5 as trigger source
Triggers on negative going sync pulses
Triggers on positive going sync pulses
Select Video standard
Set up To go to the Set Up menu
Sync
All Lines
Line Num
Odd field
Even field
Trigger on all lines
Trigger on an specified line
Select to trigger on odd field
Select to trigger on even field
Key points
Sync Pulses: When Normal Polarity is selected, the trigger always occurs
on negative-going sync pulses. If the video signal has positive-going sync
pulses, use the inverted Polarity.
Copyright ©1998-2008 RIGOL Technologies, Inc.
User’s Guide for VS5000 Series
2-33
Page 62
RIGOL
Figure 2-24
Video trigger: Line Synchronization
2-34
Figure 2-25
Video trigger: Field Synchronization
Copyright ©1998-2008 RIGOL Technologies, Inc.
User’s Guide for VS5000 Series
Page 63
RIGOL
Settings for Slope Trigger
Slope trigger sets the oscilloscope as the positive/negative slope trigger within the
specified time.
Table 2-17 Slope Trigger Settings
Function Setting Description
Source
When
CH1
CH2
EXT
EXT/5
+More than
+Less than
+Equal
-More than
-Less than
-Equal
Set channel 1 as trigger source
Set channel 2 as trigger source
Set EXT channel as trigger source
Set EXT/5 as trigger source
+Slope width more than
+Slope width less than
+Slope width equal to
-Slope width more than
-Slope width less than
-Slope width equal to
Time To set slope time
Level A
Level B
Set Up
To set the Level A
To set the Level B
To go to the Set Up menu
NOTE: Slope time can be set from 20ns to 10s. When a signal meets the trigger
condition, scope will execute the acquisition. Level A/ Level B is adjustable.
Copyright ©1998-2008 RIGOL Technologies, Inc.
User’s Guide for VS5000 Series
2-35
Page 64

RIGOL
Settings for Alternative Trigger
When alternative trigger is on, the trigger sources are from two vertical channels.
This mode can be used to observe two non-related signals. Choose two different
trigger modes for the two vertical channels. The options are as follows: Edge, Pulse,
Slope and Video. The information of the trigger level of the two channels will be
displayed on the upper-right of the screen.
Table 2-18 Alternative Trigger Settings
Function Setting Description
Channel
Trigger
Type
Set Up
CH1
CH2
Edge/Pulse/
Slope/Video
Set trigger mode for Channel 1
Set trigger mode for Channel 2
Set Edge/Pulse/Slope/Video Trigger
as the trigger type
To go to the Set Up menu
NOTE:
In Alternative Trigger, each channel is allowed to set the trigger mode independently.
The trigger setting of CH1 and CH2 are mutually independently. Please make
attention to the Channel options.
2-36
Copyright ©1998-2008 RIGOL Technologies, Inc.
User’s Guide for VS5000 Series
Page 65

RIGOL
Settings for Pattern Trigger (for VS5***D only)
Pattern trigger identifies trigger terms by checking appointed code. The code is
logical relationship of all channels, with High (H), Low (L), Ignore (X), Rising and
Falling.
Table 2-19 Pattern Trigger Settings
Function Setting Description
Defining D15-D0 Choose digital channel for Pattern trigger
High
Low
Ignore
Rising
Falling
Acquire waveform even no trigger occurred
Acquire waveform when trigger occurred
When trigger occurs, acquire one waveform
and then stop
To go to the Set Up menu
Pattern
Sweep
Set Up
H
L
X
Rising
Falling
Auto
Normal
Single
Key Points:
H (High): Logic high: Voltage is higher than threshold setting.
L (Low): Logic low: Voltage is lower than threshold setting.
X (Ignore): Don’t care. If all the channels are ignored, the oscilloscope won’t be
triggered.
Edge of appointed code
Appoint one code as edge only. If an edge is appointed, then appointed another
edge in a different channel and the first appointed edge will be set to X (Ignore).
Copyright ©1998-2008 RIGOL Technologies, Inc.
User’s Guide for VS5000 Series
2-37
Page 66

RIGOL
Settings for Duration Trigger (for VS5***D only)
Trigger in appointed time when code terms are satisfied.
Table 2-20 Duration Trigger Settings
Function Setting Description
More than
When
Time Set duration and limit symbol time
Less than
Equal
Set time limit terms
Key Points:
Qualifier: A timer begins when code terms are satisfied. Duration
trigger occurs in the time set by the qualifier.
2-38
Copyright ©1998-2008 RIGOL Technologies, Inc.
User’s Guide for VS5000 Series
Page 67

RIGOL
Trigger Set Up
In the trigger set up menu, set up different trigger settings according to different
trigger modes. When in the mode of Edge and Pulse, the source is D15-D0 (for
VS5***D only), only Holdoff is adjustable. When source is non-digital channel and in
slope trigger, only trigger coupling, trigger sensitivity and Holdoff can be set. For
video trigger, Sensitivity and Holdoff can be set. For Pattern trigger and Duration
trigger (for VS5***D only), only Holdoff can be set. When in Alternative trigger,
make different settings according to selected different trigger modes.
Table 2-21 (Settings for trigger coupling, trigger sensitivity and holdoff)
Function Setting Description
Coupling
DC
AC
HF Reject
LF Reject
Allow all signals pass
Block DC signals
Reject high frequency signals
Reject DC and low frequency signals
Sensitivity
Holdoff
Time
Set trigger sensitivity
Set time slot before another trigger
event
Table 2-22 (Settings for sensitivity and holdoff)
Function Setting Description
Sensitivity
Holdoff
Set trigger sensitivity
Set time slot before another trigger
event
Table 2-23 (Settings only for holdoff)
Function Setting Description
Holdoff
Set time slot before another trigger
event
Copyright ©1998-2008 RIGOL Technologies, Inc.
User’s Guide for VS5000 Series
2-39
Page 68
RIGOL
Trigger Holdoff
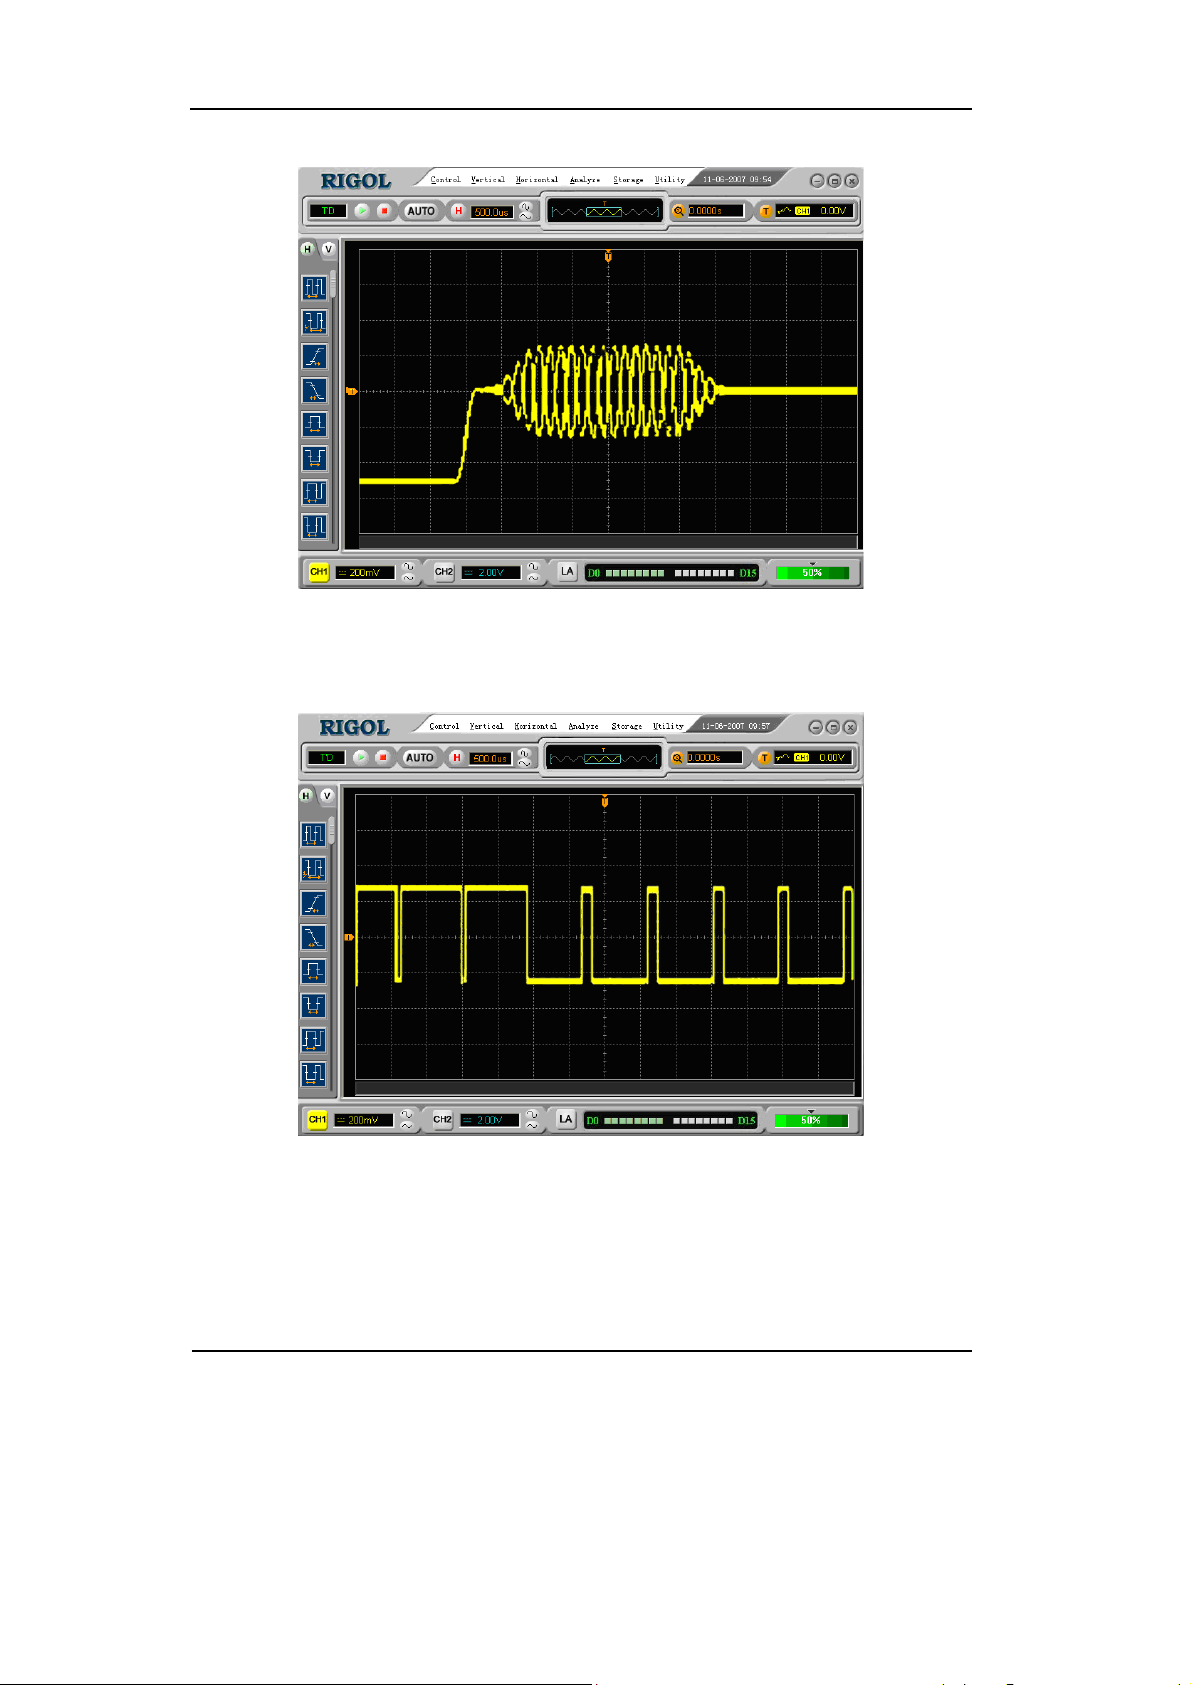
Use Trigger Holdoff to stabilize a complex waveform, such as a pulse range. Holdoff
time is the oscilloscope’s waiting period before starting a new trigger. During Holdoff,
oscilloscope will not trigger until Holdoff ends. For instance: To trigger on the first
pulse on a group of them, users can set the holdoff time to Pulse cluster width.
Trigger
Point
Time of
Holdoff
Figure 2-26 Trigger Holdoff
To use trigger Holdoff:
1. Tu r n on the Trigger window, and go to th e Tr i g g e r f u n c t i o n s Menu.
2. Click the left and the right arrow (
) button to change Holdoff time until
waveform is stable.
3. Click the circular button (
) could reset the Holdoff time to its default value.
2-40
User’s Guide for VS5000 Series
Copyright ©1998-2008 RIGOL Technologies, Inc.
Page 69

RIGOL
Trigger Key Points
1. Trigger Source:
Trigger occurs from several sources: Input channels (CH1, CH2 and D15-D0 (for
VS5***D only)), AC Line, Ext, Ext/5.
z CH1 or CH2: It is the most commonly used trigger source. The channel will
work when selected as a trigger source whatever displayed or not.
z Ext Trig: The instrument can be trigged from a third source while acquiring
data from CH1 and CH2. For example, to trigger from an external clock or with a
signal from another part of the test circuit. The Ext, Ext/5 trigger sources use an
external trigger signal connected to the Ext Trig connector. It has a trigger level
range of +1.2 V to -1.2 V. The Ext/5 trigger source attenuates the signal by 5X,
which extends the trigger level range to +6 V to -6 V, allowing the oscilloscope
to trigger on a larger signal.
2. Sweep Mode:
The sweep mode determines how the oscilloscope behaves in the absence of a
trigger event. The oscilloscope provides three trigger modes: Auto, Normal, and
Single.
z Auto: This sweep mode allows the oscilloscope to acquire waveforms even
when it does not detect a trigger condition. If no trigger condition occurs while
the oscilloscope is waiting for a specific period (as determined by the time-base
setting), it will force itself to trigger.
When forcing invalid triggers, the oscilloscope cannot synchronize the waveform,
and the waveform seems to roll across the display. If valid triggers occur, the
display becomes stable on the screen.
Any factor results in the un-stability of waveforms can be detected by Auto
Trigger, such as the output of power supply.
NOTE: When horizontal control is set more than 50 ms/div, Auto mode allows
the oscilloscope to capture without trigger signal.
z Normal: The Normal mode allows the oscilloscope to acquire a waveform only
when it is triggered. If no trigger occurs, the oscilloscope keeps waiting, and the
previous waveform, if any, will remain on the display.
Copyright ©1998-2008 RIGOL Technologies, Inc.
User’s Guide for VS5000 Series
2-41
Page 70

RIGOL
z Single: In Single mode, after pressing the RUN/STOP key, the oscilloscope
waits for trigger. While the trigger occurs, the oscilloscope acquires one
waveform and then stop.
3. Coupling:
Trigger coupling determines which signal component passed to the trigger circuit.
Coupling types include AC, DC, LF Reject and HF Reject.
z AC: AC coupling blocks DC components.
z DC: DC coupling passes both AC and DC components.
z LF Reject: LF Reject coupling blocks DC component, and attenuates all signal
with a frequency lower than 8 kHz.
z HF Reject: HF Reject coupling attenuates all signals with a frequency higher
than 150 kHz.
4. Pre-trigger/delayed trigger:
The data collected before and after trigger.
The trigger position is typically set at the horizontal center of the screen. In the
full-screen display 6 divisions data of pre-trigger and delayed trigger can be
surveyed. More data (14div) of pre-trigger and 1s delayed trigger can be
surveyed by adjusting the horizontal scale and offset.
This feature is very useful to study the events that led up to the trigger point.
Everything to the right of the trigger point is called post-trigger information. The
amount of delay range (pre-trigger and post-trigger information) depends on the
sweep speed selected.
z Adjustable trigger sensitivity
To avoid the influence of noise from the environment and get the stable trigger,
the trigger circuit has adopted stickiness. In VS5000 series, the stickiness is
adjustable from 0.1div-1.0div, which means when it sets to 1.0div, the trigger
circuit will not care any signal with peak-peak amplitude less than 1.0div, so as to
avoid the influence of the noise.
2-42
Copyright ©1998-2008 RIGOL Technologies, Inc.
User’s Guide for VS5000 Series
Page 71

RIGOL
To Set the Sampling System
The Acquire button in the Horizontal menu is used for sampling system setup.
Acquire setup button
Figure 2-27
Choose the Acquire System
Click the Acquire button in the Horizontal menu, go to the Acquire window.
Figure 2-28
To Set the Acquire System
Copyright ©1998-2008 RIGOL Technologies, Inc.
User’s Guide for VS5000 Series
2-43
Page 72

RIGOL
Table 2-24 Acquire System Settings
Function Setting Description
Sampling
Real Time
Equal Time
Normal
Acquisition
Average
Peak Detect
Averages 2 to 256
Memory
Normal
Long
Real-time sampling mode
Equivalent sampling mode
Normal Acquisition mode
Average Acquisition mode
Peak Detect Acquisition mode
Step by multiple of two. Set
average times from 2 to 256
Set up memory as 1k or 2k
Set up memory as 512k or 1M
The waveform displayed on the screen will change in conjunction with the setting of
the Acquire menu.
2-44
Figure 2-29
Signal that contains noise, and without average sampling
Copyright ©1998-2008 RIGOL Technologies, Inc.
User’s Guide for VS5000 Series
Page 73

RIGOL
Figure 2-30
Signal after average sampling
NOTE:
z Select Real Time acquisition to observe the single-shot or pulse signals.
z Select Equal Time to observe high frequency repetitive signals.
z To reduce the displayed random noise, select the Average acquisition and this
mode would make the waveform update slower.
z To avoid signal aliasing, select Peak Detect acquisition.
Figure 2-31
The Peak Detect Effect
Copyright ©1998-2008 RIGOL Technologies, Inc.
User’s Guide for VS5000 Series
2-45
Page 74

RIGOL
Stop Acquisition: When the scope is acquiring waveforms, the waveforms are in
live status; when acquisition is stopped, a frozen waveform will be displayed. The
position and scale can still be adjusted by vertical control and horizontal control.
Key Points
Real-time Sampling:
VS5000 has Real-time sampling rate up to 400MSa/s. At the time base 50ns or
faster, the oscilloscopes use the sine(x)/x interpolation to expand the horizontal time
base.
Equivalent sampling:
Known as Repetitive sampling to get up to 40 ps of horizontal resolution (equivalent
25Gsa/s). This mode is good for observing repetitive signals, and it is not
recommended for single-shot or pulse.
Normal:
Oscilloscope acquires signal by equal time interval.
Average Acquisition:
Apply averaging to signal to remove uncorrelated noise and improve measurement
accuracy. Reduces random or uncorrelated noise in the signal display. The averaged
waveform is a running average over a specified number of acquisitions from 2 to
256.
Peak Detect:
Peak Detect mode captures the maximum and minimum values of a signal. Finds
highest and lowest record points over many acquisitions.
2-46
Copyright ©1998-2008 RIGOL Technologies, Inc.
User’s Guide for VS5000 Series
Page 75
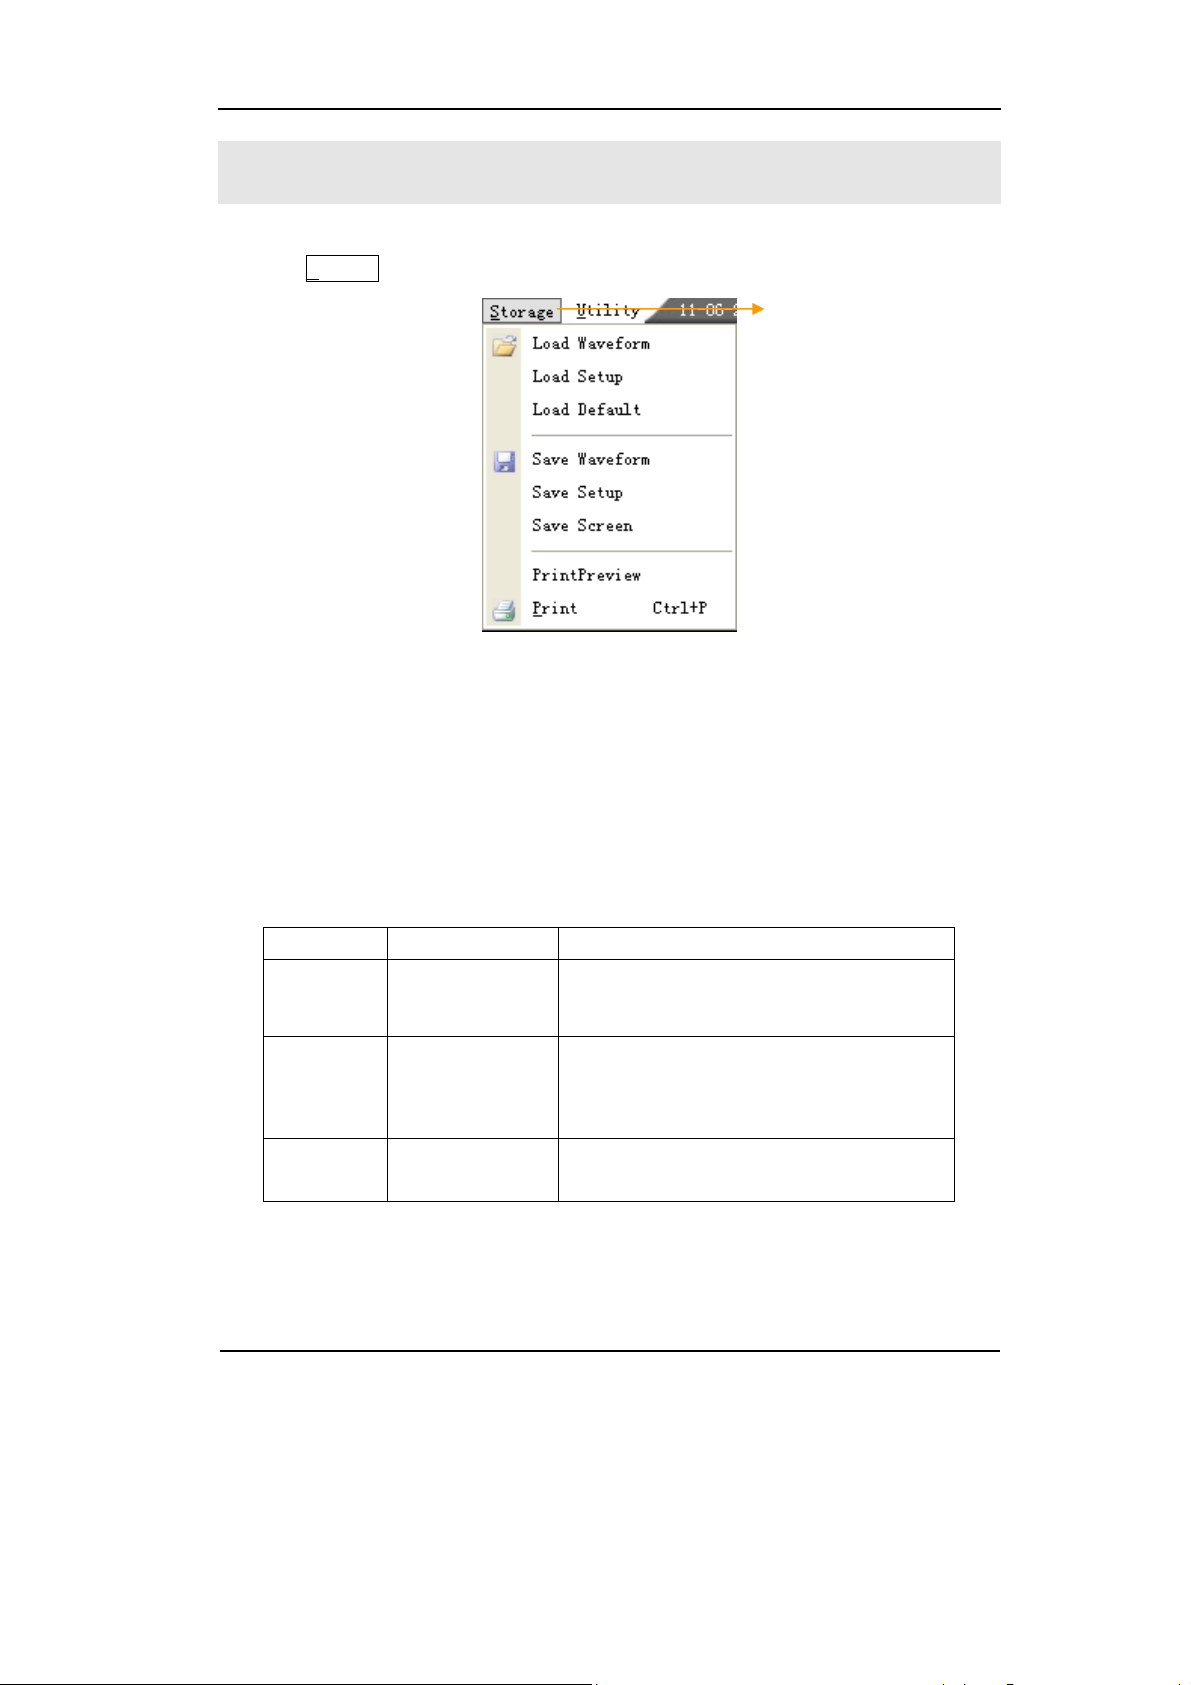
To Save/Load and Print Setup
Click the S
torage button to get into the Save/Load and Print options.
Figure 2-32
The Storage Menu
RIGOL
Storage Menu
Use this menu to:
z Save and load the waveform,
z Load default setting,
z Save screen as a .bmp or .JPG file.
Table 2-25 Storage Functions
Function Setting Description
Load
Save
Print
Load Waveform
Load Setup
Load Default
Save Waveform
Save Setup
Save Screen
PrintPreview
Print
Load the waveform that had saved
Load the instrument that had saved
Load the instrument default settings
Save the current waveform
Save the current instrument settings
Save the PC software window as a .bmp
or .jpg file
Preview the waveform
Print setting and do the print operation
Copyright ©1998-2008 RIGOL Technologies, Inc.
User’s Guide for VS5000 Series
2-47
Page 76

RIGOL
1. Save/Load Window
Click the Load/Save button in the Storage menu.
Table 2-26 The Save/Load Functions
Function Setting Description
Open/Save Open/Save the file that is selected
Select folder in the Folder window
Window
comments
Cancel Cancel the current operation
Select file in the File window
Input the file name in the File Name
window
Select the file type in the File Type
Keyboard
Use the soft-keyboard input the file
name
An example with the Open File window:
Current driver
Current folder
Input the
file name
File type
Files
2-48
Figure 2-33
Open a Waveform File
Copyright ©1998-2008 RIGOL Technologies, Inc.
User’s Guide for VS5000 Series
Page 77

2. Load Default
The oscilloscope has default settings and can be recalled at anytime by user.
3. Files location
Specify the files location to save/load the waveform and setup.
4. Load
Recall saved waveform, setup and default settings.
5. Save
RIGOL
Save waveform, setups and screen.
NOTE:
Select Save Waveform stores the waveforms, and the current settings of the
oscilloscope
Copyright ©1998-2008 RIGOL Technologies, Inc.
User’s Guide for VS5000 Series
2-49
Page 78

RIGOL
6. Print Settings
Set the printer to print the current waveform.
Figure 2-34 The Print Menu
Print button
Table 2-27 The Print Functions
Function Setting Description
PrintPreview
Preview the waveform which current
will be print
Print Print the current waveform
2-50
Copyright ©1998-2008 RIGOL Technologies, Inc.
User’s Guide for VS5000 Series
Page 79

RIGOL
1. PrintPreview
Click the PrintPreview button to get into the Preview window.
Figure 2-35 Print Preview
In this window, use the Zoom In and the Zoom Out to change the size of the
waveform graph.
Click the Close button to turn this window off.
Copyright ©1998-2008 RIGOL Technologies, Inc.
User’s Guide for VS5000 Series
2-51
Page 80

RIGOL
2. Print
Click the Print button to get into the Print Setup window.
Figure 2-36
The Print Interface
In the Printer option select the document to print, and then click OK to execute
printing operation.
2-52
Copyright ©1998-2008 RIGOL Technologies, Inc.
User’s Guide for VS5000 Series
Page 81

RIGOL
To Set the Measurement Function
The Measure functions are in the Analyzer menu; to do Horizontal Measure and
Vertical Measure, or to use shortcut buttons to perform measurement operations.
Figure 2-37
Choose the Measurement Menu
Menu explanation:
The oscilloscopes provide 20 parametric auto measurements (10 voltage and 10 time
measurements):
z Vpp, Vmax, Vmin, Vtop, Vbase, Vamp, Vavg, Vrms, Overshoot, Preshoot.
z Frequency, Period, Rise Time, Fall Time, +Width, -Width, +Duty, -Duty,
Delay1-2
, Delay1-2 .
Copyright ©1998-2008 RIGOL Technologies, Inc.
User’s Guide for VS5000 Series
2-53
Page 82

RIGOL
1.Shortcuts for Horizontal Measurements
Figure 2-38 Table 2-28 Horizontal Measurement Functions
Function Setting Description
Period Measure Period of a waveform
Frequency Measure Frequency of a waveform
Rise time Measure Rise Time of a rising edge
Fall time Measure Fall Time of a falling edge
+Width Measure +Pulse Width of a pulse wave
-Width Measure –Pulse Width of a pulse wave
+Duty Measure +Duty Cycle of a pulse wave
-Duty Measure –Duty Cycle of a pulse wave
Delay1→2
Delay1→2
Drives the automatic
measurement shortcut enter the
main display interface, starts this
automatic measurement.
Measure the signals delay between
two channels at the rising edge
Measure the signals delay between
two channels at the falling edge
2-54
Figure 2-39
Quickly Measurement
Copyright ©1998-2008 RIGOL Technologies, Inc.
User’s Guide for VS5000 Series
Page 83

2.Shortcuts for Vertical measurements
Figure 2-40 Table 2-29 Vertical Measurement Functions
Function Setting Description
Vmax Measure maximum voltage of a waveform
Vmin Measure minimum voltage of a waveform
Vpp Measure Peak-to-Peak voltage
Vtop Measure a top voltage of a waveform
Vbase Measure a base voltage of a waveform
Vamp Measure voltage between Vtop and Vbase
Vavg Measure average voltage of a waveform
RIGOL
Vrms
Overshoot
Preshoot
Measure Root Mean Square Voltage of a
waveform
Measure overshoot in percentage of an
edge
Measure preshoot in percentage of an
edge
NOTE: The results of the automatic measurements will be displayed on the bottom
of the screen. Maximum 3 results could be displayed at the same time. When there is
no room, the next new measurement result will make the previous results moving
left, out of screen.
Copyright ©1998-2008 RIGOL Technologies, Inc.
User’s Guide for VS5000 Series
2-55
Page 84

RIGOL
Apply Automatic Measurement as the following steps:
1. Select the signal channel for measuring, select CH1 or CH2 according to the
signal of interest.
2. To see all the measurement values, click All Measure in the Analyze menu, 18
measurement parameters will be displayed on the screen.
3. Get the measured value on the screen; select the parameters of interest by
clicking the correspond button, and read the data on the bottom of the screen.
4. To Clear the measure values; click Clear Measure, and all auto measured values
disappear from the screen.
2-56
Copyright ©1998-2008 RIGOL Technologies, Inc.
User’s Guide for VS5000 Series
Page 85

V
x
RIGOL
The Automatic Measurement of Voltage Parameters
The VS5000 series oscilloscopes provide automatic voltage measurements: Vpp,
Vmax, Vmin, Vavg, Vamp, Vrms, Vtop, Vbase, Overshoot and Preshoot. Figure 2-41
below shows a pulse with some of the voltage measurement points.
Overshoot
Vma
Vpp
Vtop
amp
Vbase
Vmin
Preshoot
Figure 2-41 Definition of Voltage Parameters
Vpp: Peak-to-Peak Voltage.
Vmax: The maximum amplitude. The most positive peak voltage measured over the
entire waveform.
Vmin: The minimum amplitude. The most negative peak voltage measured over the
entire waveform.
Vamp: Voltage between Vtop and Vbase of a waveform
Vtop: Voltage of the waveform’s flat top, useful for square/pulse waveforms.
Vbase: Voltage of the waveform’s flat base, useful for square/pulse waveforms.
Overshoot: Defined as (Vmax-Vtop)/Vamp, useful for square and pulse waveforms.
Preshoot: Defined as (Vmin-Vbase)/Vamp, useful for square and pulse waveforms.
Average: The arithmetic mean over the entire waveform.
Vrms: The true Root Mean Square voltage over the entire waveform.
Copyright ©1998-2008 RIGOL Technologies, Inc.
User’s Guide for VS5000 Series
2-57
Page 86

RIGOL
The Automatic Measurement of Time Parameters
VS5000 series oscilloscopes provide automatic timing parameters measurements;
Frequency, Period, Rise Time, Fall Time, +Width, -Width, Delay 1→2
, Delay 1→2 ,
+Duty and -Duty.
Figure 2-42 shows a pulse with some of the time measurement points.
Rise Time
Fall Time
90%
50%
10%
+Width
-Width
Figure 2-42 Definition of Time Parameters
Rise Time: Time that the rising edge of the first pulse in the waveform takes to rise
from 10% to 90% of its amplitude.
Fall Time: Time that the falling edge of the first pulse in the waveform takes to
fall from 90% to 10% of its amplitude.
+Width: The width of the first positive pulse in 50% amplitude points.
-Width: The width of the first negative pulse in the 50% amplitude points.
Delay 1→2
Delay 1→2
+Duty: +Duty Cycle, defined as +Width/Period
: The delay between the two channels at the rising edge.
: The delay between the two channels at the falling edge.
-Duty: -Duty Cycle, defined as -Width/Period
2-58
User’s Guide for VS5000 Series
Copyright ©1998-2008 RIGOL Technologies, Inc.
Page 87

RIGOL
To Measure with Cursor Measurements
Click the Cursor button in the Analyze menu to select the Cursor functions.
Cursor
measurement
Figure 2-43
Choose the Menu of Cursor Measurement
The Cursor measurement has three modes: Auto Measure, Manual and Track.
Auto Measure:
This mode will take effect with Automatic Measurements. The instruments will
display cursors while measuring parameters automatically. These cursors
demonstrate the physical meanings of these measurements.
Manual:
In this mode, the screen displays two parallel cursors. Move the cursors to make
custom voltage or time measurements of the signal. The values are displayed on the
boxes below the menu. Before using cursors, make sure that to set the Signal Source
as the channel for measuring.
Track:
In this mode, the screen displays two cross cursors. The cross cursor sets the
position on the waveform automatically. Adjust the horizontal position of cursor on
the waveform by click the
oscilloscope displays the values of the coordinates on the boxes below the menu.
button or drag the cursor on the screen. The
NOTE: The Auto Measure mode for Cursor measuring will take no effect without
automatic measurements.
Copyright ©1998-2008 RIGOL Technologies, Inc.
User’s Guide for VS5000 Series
2-59
Page 88

RIGOL
Comments of Cursor Measurements
1. Auto Cursor Mode:
Table 2-30 Auto Cursor Measurement
Function Setting Description
Display the cursors for the current
Mode Auto
The cursors
position
automatic measuring. (See the following
figure)
Figure 2-44
Auto Measure Mode of Cursor Measurement
There will be no cursor display if no parameter is chosen in the M
easure menu. The
oscilloscope could move cursor automatically to measure 20 parameters in the
M
easure menu.
2-60
User’s Guide for VS5000 Series
Copyright ©1998-2008 RIGOL Technologies, Inc.
Page 89
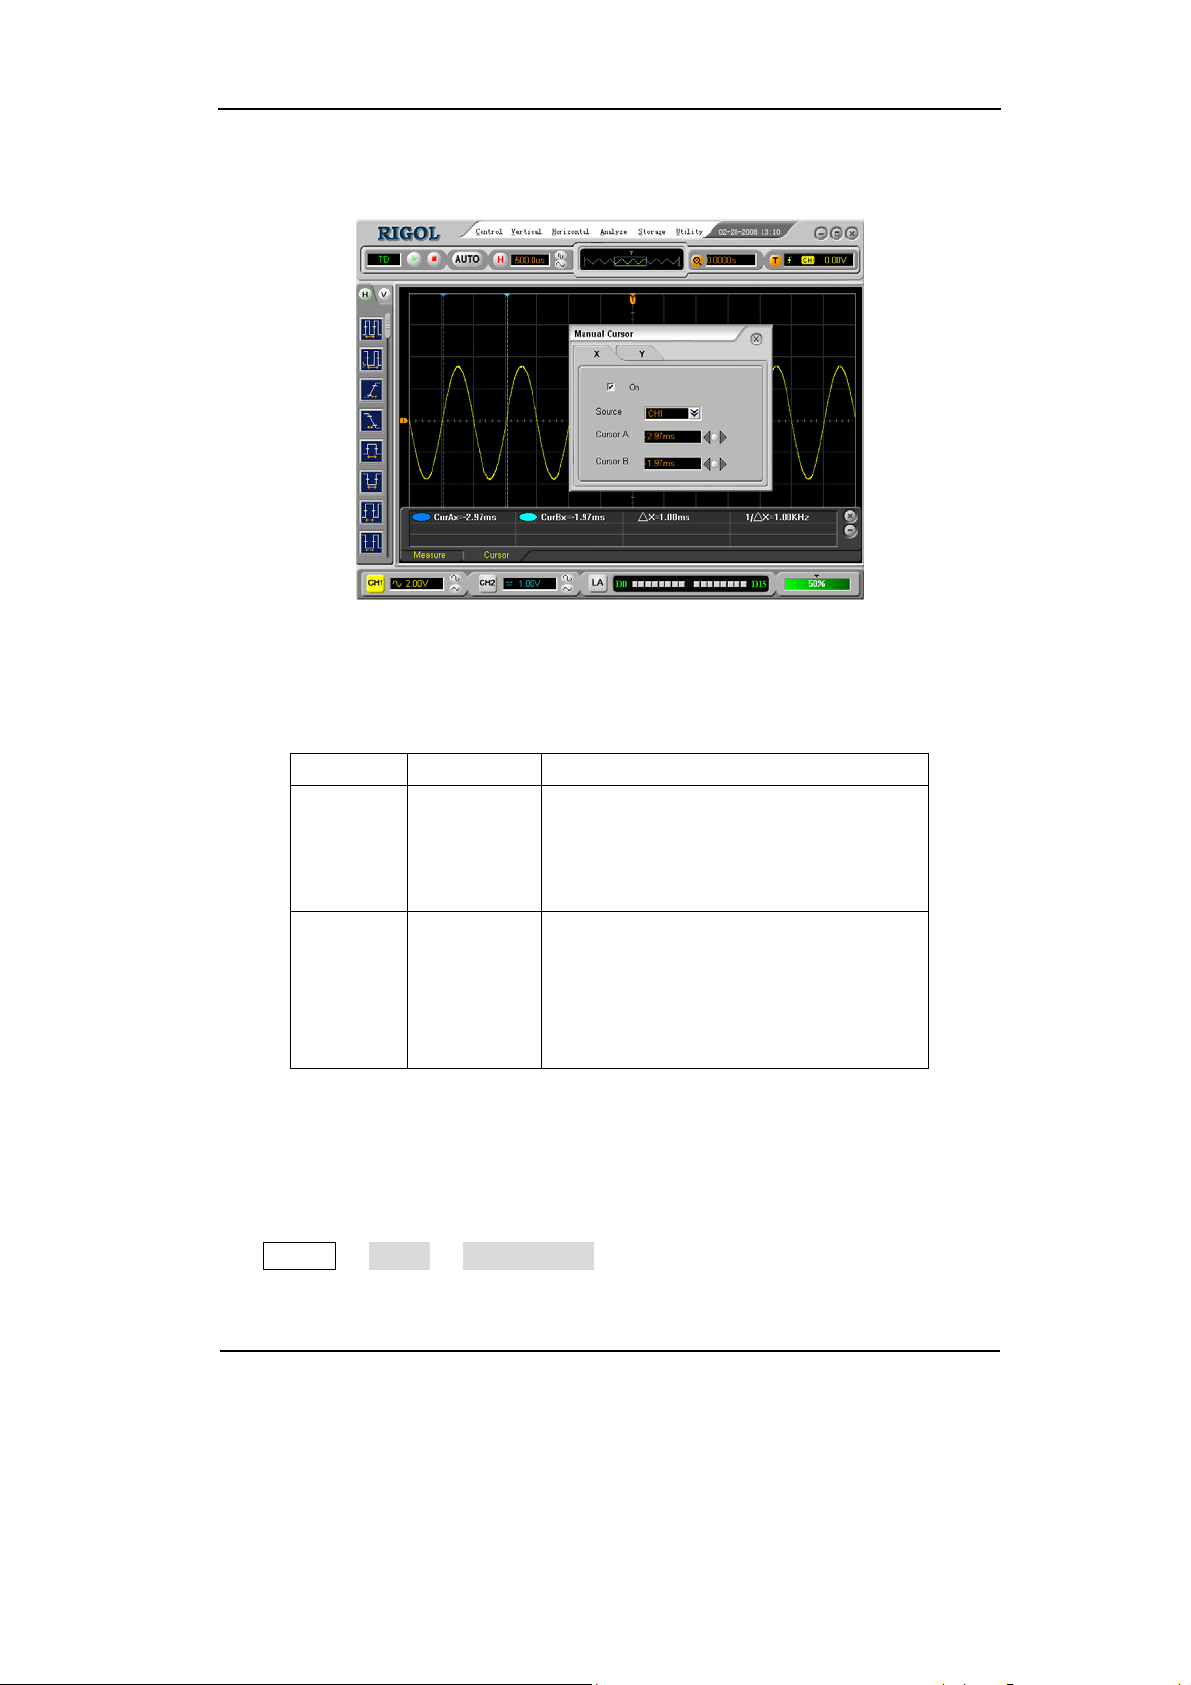
2. Manual Cursor Mode
Manual Measure Mode of Cursor Measurement
RIGOL
Figure 2-45
Table 2-31 Manual Cursor Measurement
Function Setting Description
Shown as vertical line to measure the
horizontal parameters
Shown as horizontal line to measure the
vertical parameters
Type
X
Y
CH1
Source
CH2
MATH (1, 2,
3 and 4)
Select the measurement signal source.
(LA is applicable for VS5***D only)
LA
In this mode, the oscilloscope measures the Y or X coordinate values of the cursors,
and the increments between the two cursors.
Please do as the following steps:
1) Select the Manual Cursor mode for cursor measurement; click the buttons as:
Analyze Æ Cursor Æ Manual Cursor.
Copyright ©1998-2008 RIGOL Technologies, Inc.
User’s Guide for VS5000 Series
2-61
Page 90
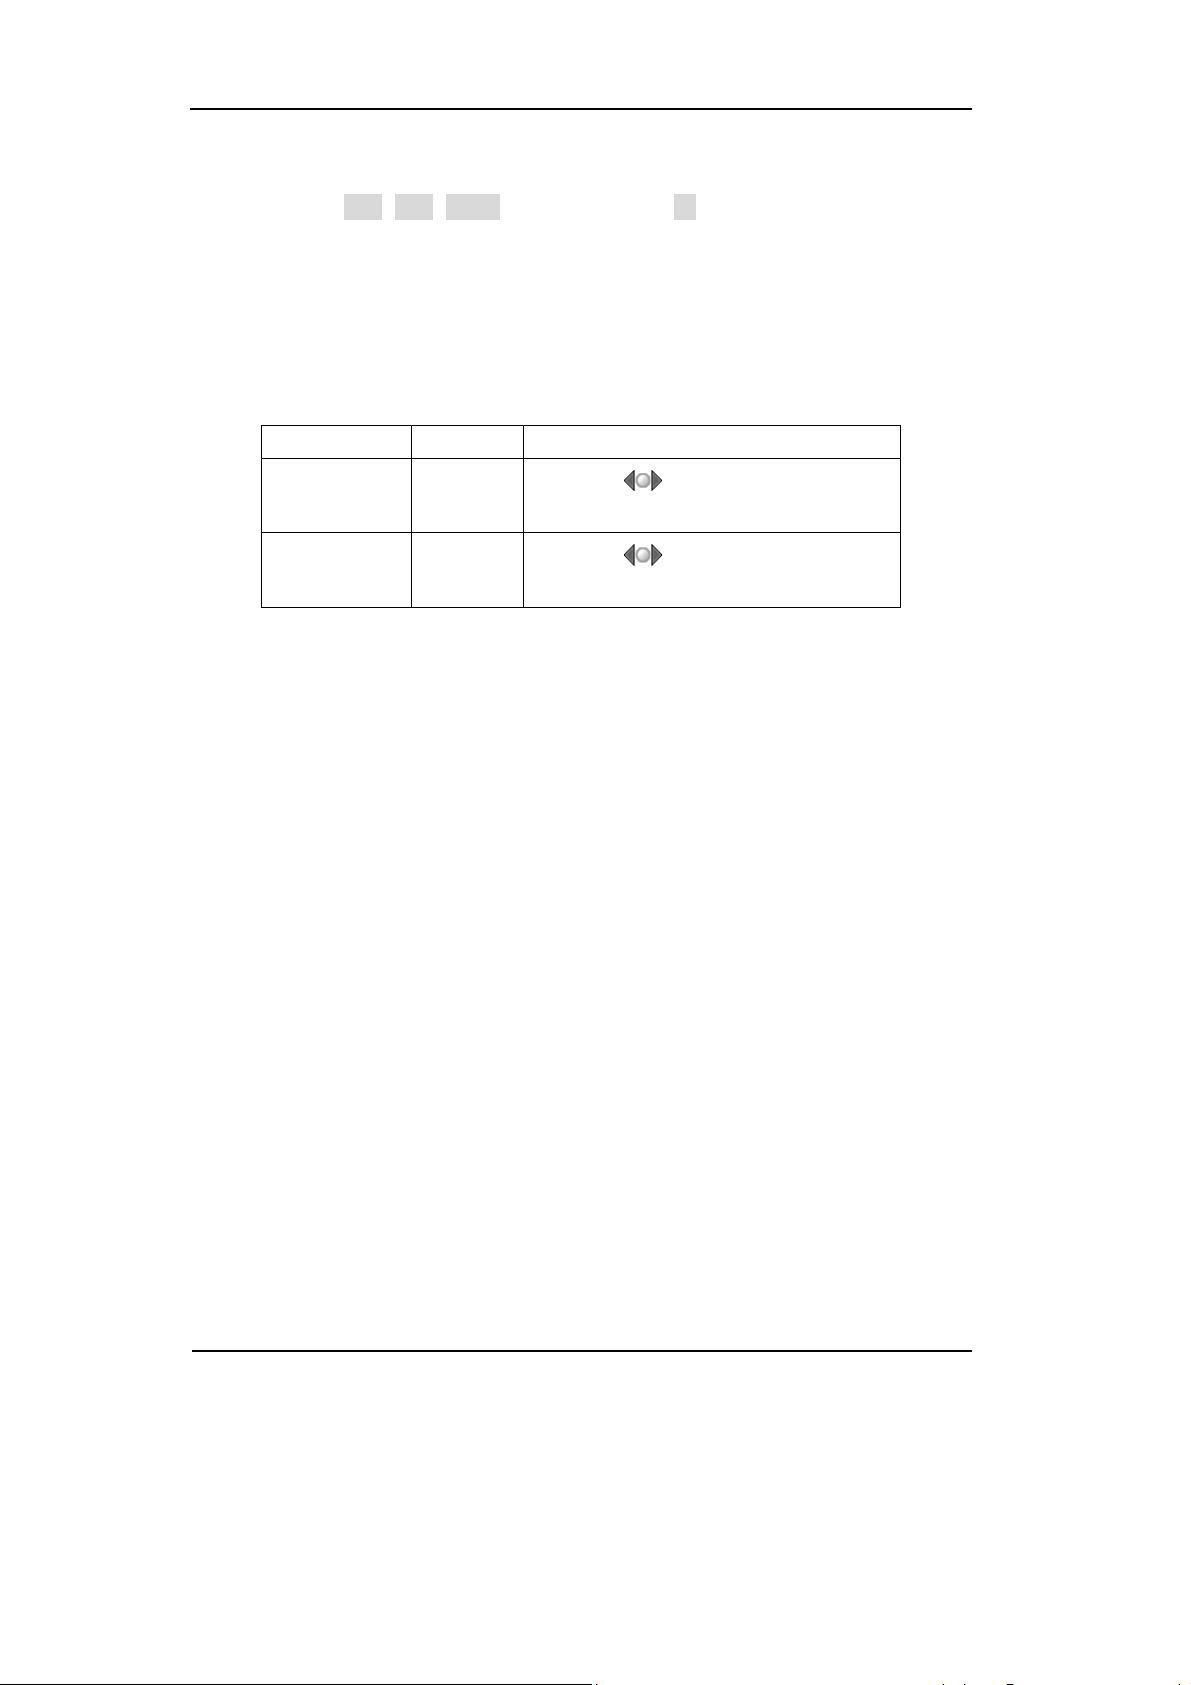
RIGOL
2) Select channel Source for measurements, click the buttons as:
Source Æ CH1, CH2, MATH (1, 2, 3 and 4) or LA (for VS5***D only).
3) Select the Cursor type by clicking the appropriate buttons; in the Manual Cursor
window, there are X and Y operation windows to select the cursor type.
4) Move the cursors to adjust the increment between the cursors: (Details in the
following Table)
Table 2-32 Definition of the Manual Cursors
Increment Cursor Operation
X
Y
Cursor A
Cursor B
Cursor A
Cursor B
Click the button to adjust the
cursor A and B horizontally.
Click the
button to adjust the
cursor A and B vertically.
NOTE: Cursor could be moved only when the cursor function menu is displayed.
5) To get measurement values:
z Position of Cursor 1 (time cursor centered on the midpoint of screen; Voltage
cursor centered on channel ground level).
z Position of Cursor 2 (same as above).
z Horizontal space between cursor 1 and 2 (
△X): Time between cursors (1/△X),
units in Hz, kHz, MHz, GHz.
z Vertical space between cursor 1 and 2 (
△Y): Voltage between cursors.
If the source is LA (for VS5***D only), the measurement value is as follows:
z Position of Cursor 1 (time cursor centered on the midpoint of screen).
z Position of Cursor 2 (time cursor centered on the midpoint of screen).
z Cursor 1 value: Hex.
z Cursor 1 value: Binary.
z Cursor 2 value: Hex.
z Cursor 2 value: Binary.
NOTE: The values will be automatically displayed on the right upper corner of screen
when the cursor function menu is hidden or displaying other menus.
2-62
Copyright ©1998-2008 RIGOL Technologies, Inc.
User’s Guide for VS5000 Series
Page 91

RIGOL
Key Points
Cursor Y: Cursors Y appears as horizontal lines on the display to measure the
vertical parameters. Usually it is used to measure the Volts. When the source is
set as function, the units are assigned to the function.
Cursor X: Cursors X appears as vertical line on the display and measure the
horizontal parameters. Usually it indicates the time of trigger excursion. When the
source is set as FFT, X means frequency.
Copyright ©1998-2008 RIGOL Technologies, Inc.
User’s Guide for VS5000 Series
2-63
Page 92

RIGOL
3. Track Cursor Mode
Interface of Track Cursor Measurement
Figure 2-46
Table 2-33 Track Cursor Measurement Functions
Function Setting Description
On/Off Turn the Cursor A or B on/off.
Cursor A
Cursor B
CH1
CH2
CH1
CH2
Set Cursor A in conjunction with CH1 or
CH2. Adjust the cursor A horizontally.
Set Cursor B in conjunction with CH1 or
CH2. Adjust the cursor B horizontally.
In cursor track mode, the cursor A and cursor B move together with the selected
waveform.
Please do as the following steps:
1) Select the Track Cursor mode for cursor measurement; click the buttons as
follows: Analyze Æ Cursor Æ Track Cur s o r.
2) Select channel Source for measurements; click the buttons as follows:
Source Æ CH1 or CH2.
2-64
Copyright ©1998-2008 RIGOL Technologies, Inc.
User’s Guide for VS5000 Series
Page 93

RIGOL
3) Move the cursors to adjust the increment between the cursors: (Details in the
following Table)
Table 2-34 Definition of the Track Cursor
Cursor Operation
A (cursor A)
B (cursor B)
Click the
horizontally.
Click the
horizontally.
button to adjust the cursor A
button to adjust the cursor B
NOTE: Moving cursor horizontally is not allowed when other (not tracking cursor)
menu is activated.
4) To get measurement values:
z Position of Cursor 1 (Time cursor centered on the midpoint of screen; Voltage
cursor centered on channel ground level).
z Position of Cursor 2 (Time cursor centered on the midpoint of screen; Voltage
cursor centered on channel ground level).
z Horizontal space between cursor 1 and 2 (
Second, (1/
△X), units in Hz, kHz, MHz, GHz.
z Vertical space between cursor 1 and 2 (
△X): Time between cursors, units in
△Y): Voltage between cursors, units in
V.
NOTE:
Cursor A and B can be dragged on screen.
Copyright ©1998-2008 RIGOL Technologies, Inc.
User’s Guide for VS5000 Series
2-65
Page 94
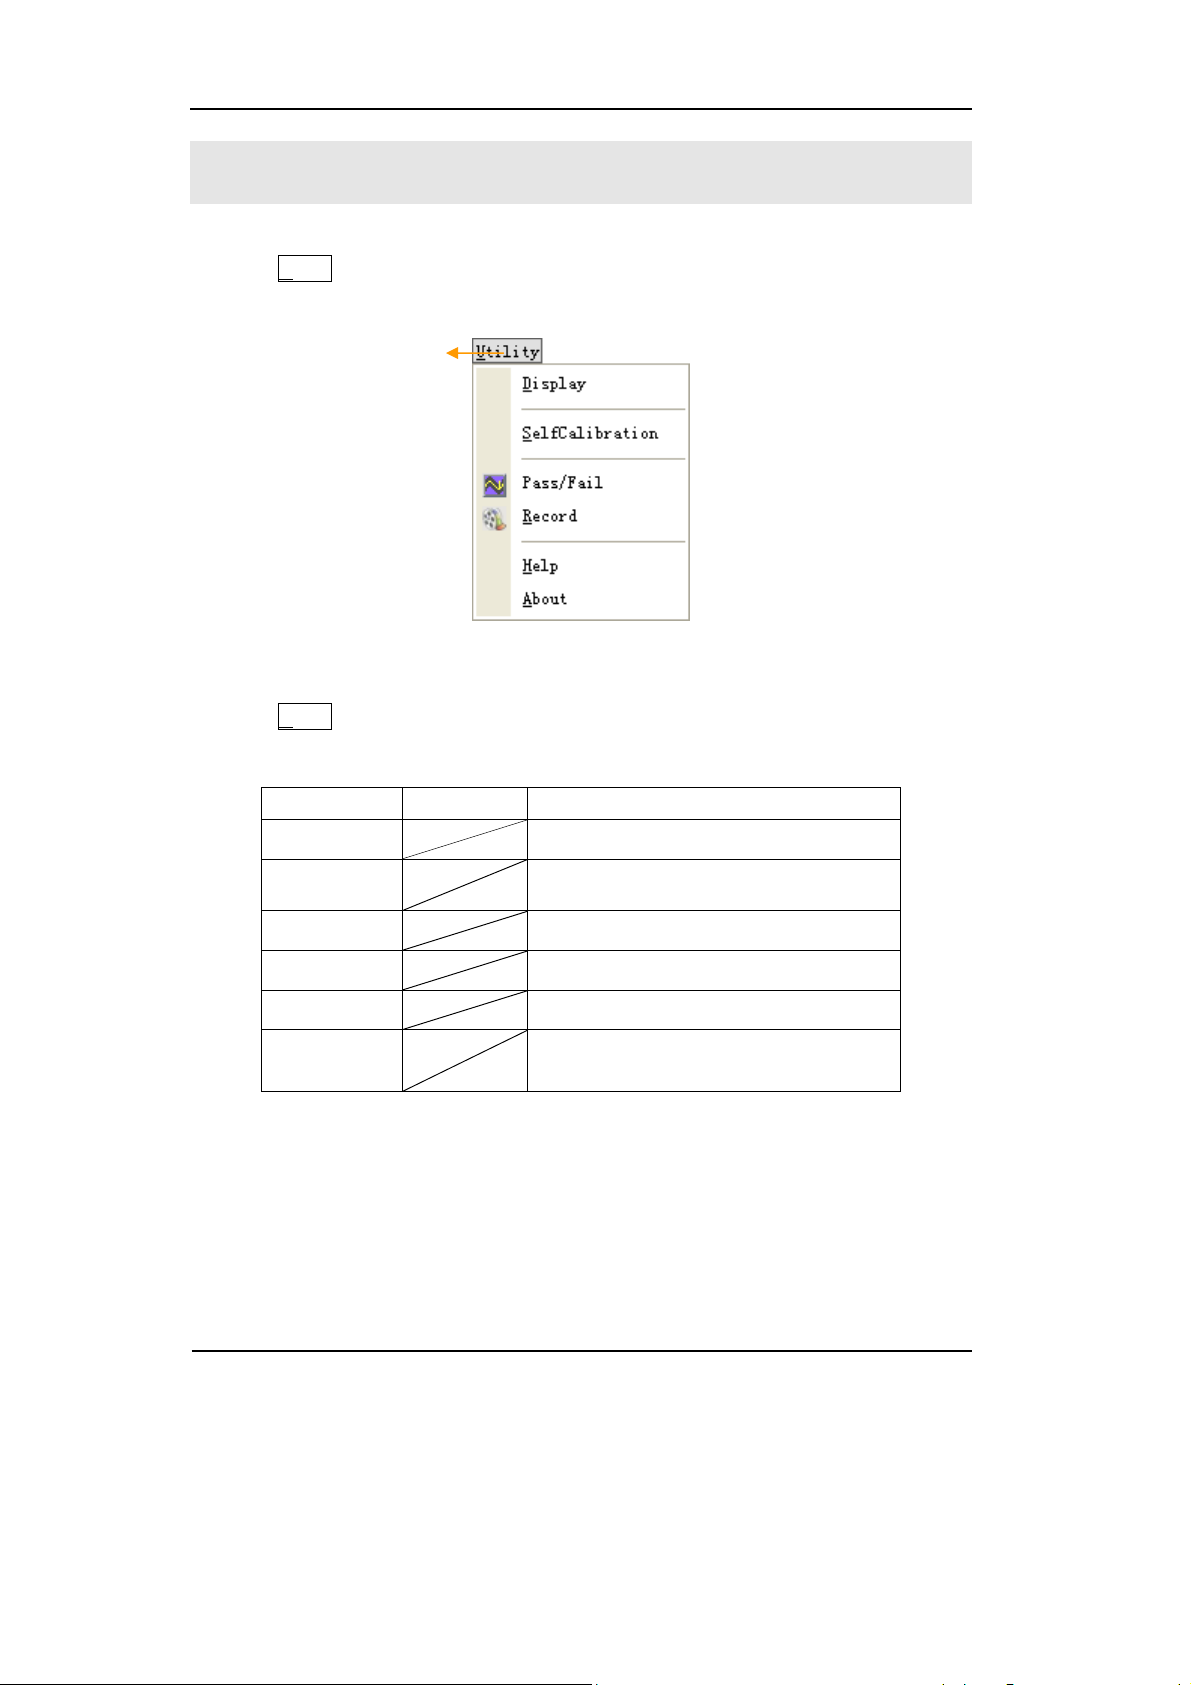
RIGOL
To Set the Utility Function
Click the U
System functions setup menu
tility button to get into the Utility menu.
Figure 2-47 The Menu of Utility
Click the U
tility button to show the menu of the settings of in the Utility system.
Table 2-35 Utility Functions
Function Setting Description
Display Set the display functions
Self
Calibration
Execute Self Calibration
Pass/Fail Setup Pass/Fail test
Record Setup waveform Record
Help Get the help of VS5000 series
About
Get the instrument information of this
VS5000
NOTE:
Self Calibration: Oscilloscope will calibrate parameters of the vertical system (CH1,
CH2, and Ext), the horizontal system and the trigger system.
2-66
Copyright ©1998-2008 RIGOL Technologies, Inc.
User’s Guide for VS5000 Series
Page 95
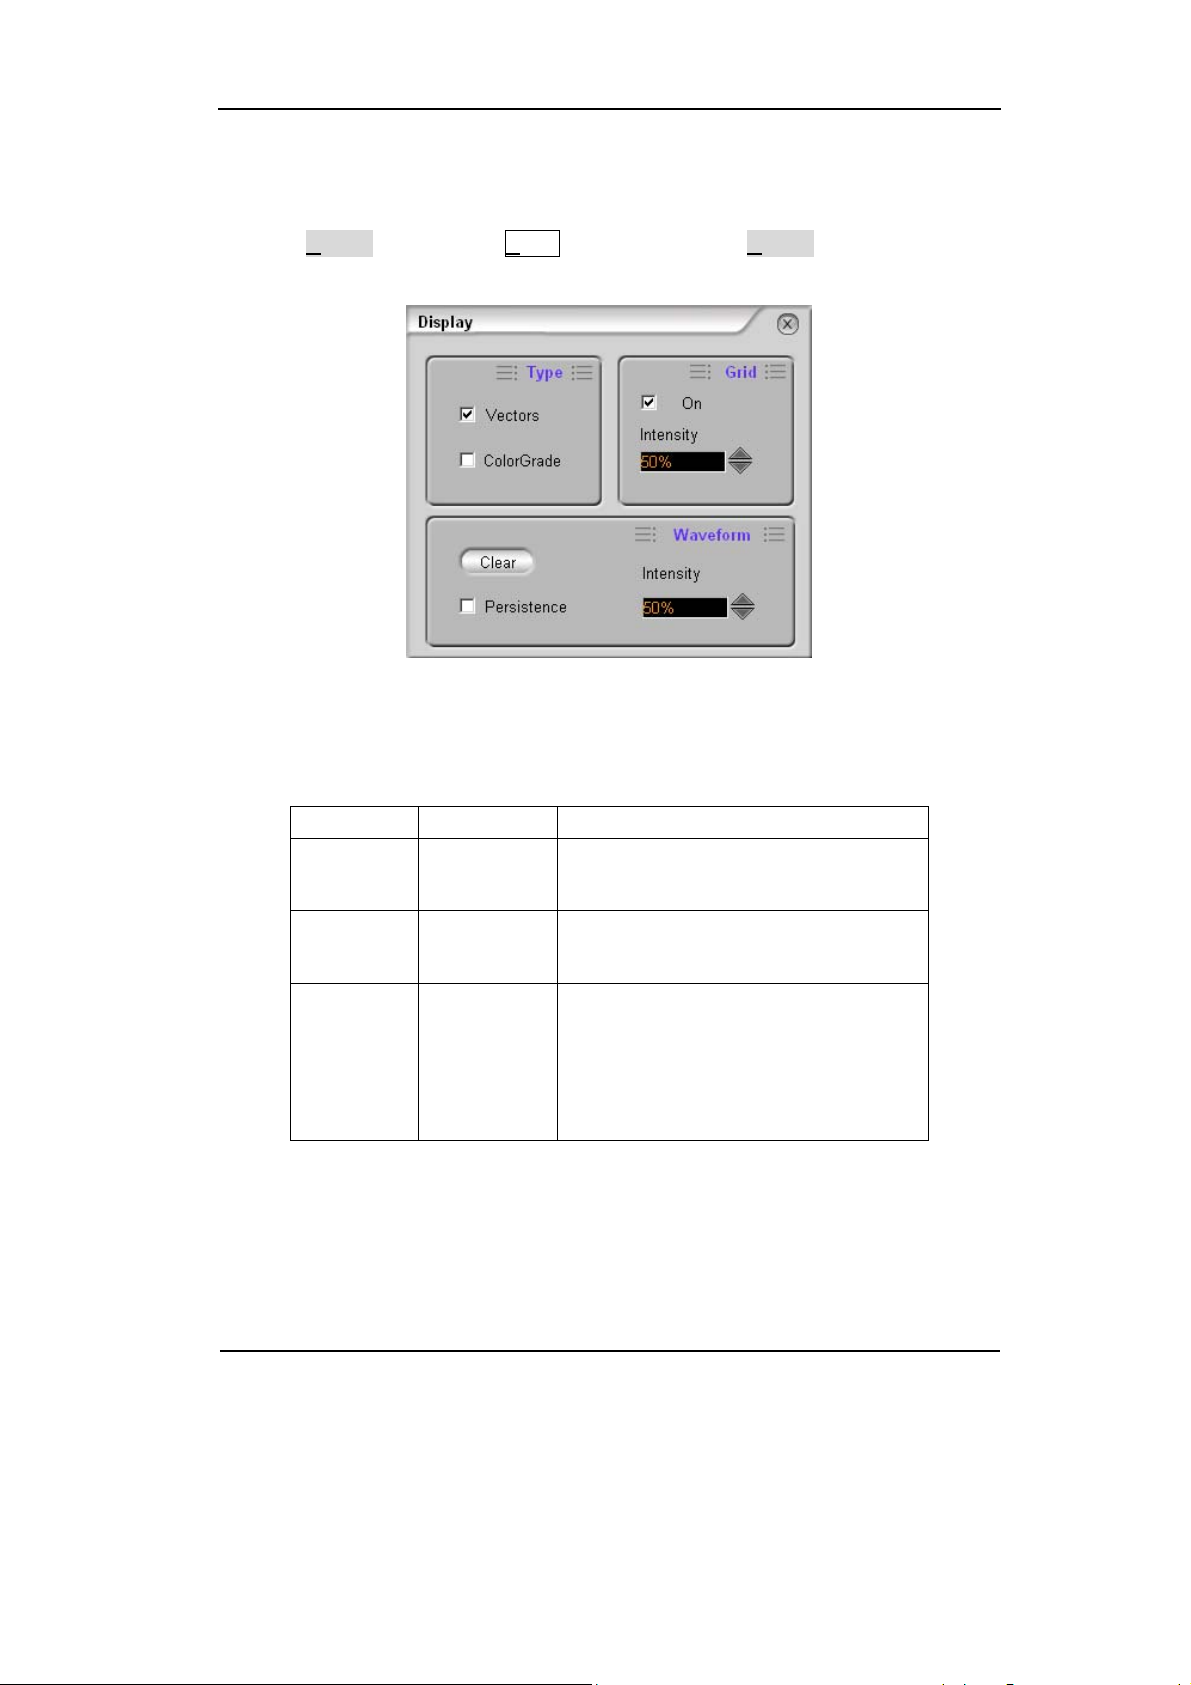
The Display Setup
Click the Display button in the Utility menu, to show the Display window.
RIGOL
Display Setting Interface
Table 2-36 Display Setting
Function Setting Description
Type
Grid
Vectors
Color Grade
On/Off
Intensity
Persistence
Waveform
Intensity
Figure 2-48
Display waveforms as vectors or dots
Use color express the density of dots
Turn the grids On or Off
Adjust brightness of the grids
The sample points remain displayed
until turn the persistence “OFF” or
click the Clear button
Adjust brightness of the persistence
waveform
Copyright ©1998-2008 RIGOL Technologies, Inc.
User’s Guide for VS5000 Series
2-67
Page 96

RIGOL
Self Calibration
The Self Calibration adjusts the internal circuitry to get the best accuracy. Use these
functions to calibrate the vertical and horizontal systems.
For maximum accuracy at any time, run this calibration if the ambient temperature
changes by 5℃ or more.
Before running this procedure, do these steps:
1. Disconnect any probes or cables from all channel inputs, otherwise failure or
damage to the oscilloscope may occur.
2. Click the Self Calibration button in the Utility menu.
Figure 2-49
Self Calibration Interface
NOTE:
The oscilloscope must have been working or warm-up at least 30-minutes before
running self-calibration to get best accuracy.
2-68
User’s Guide for VS5000 Series
Copyright ©1998-2008 RIGOL Technologies, Inc.
Page 97

RIGOL
Pass/Fail
The Pass/Fail function monitors changes of signals and outputs pass or fail signals by
comparing the input signal with the pre-defined mask.
Click the Pass/Fail button in the Utility menu to show the Pass/Fail Setup window.
Figure 2-50
Pass/Fail Setting Interface
Table 2-37 Pass/Fail Settings
Function Setting Description
On Off/On
Source
CH1
CH2
FAIL
FAIL+BEEPER
Output
PASS
PASS+BEEPER
Stop When
Pass/Fail
Display
Information
Off/On
Off/On Turn the Pass/Fail information off or on
Turn off or on the Pass/Fail test
Select Pass/Fail test on CH1
Select Pass/Fail test on CH2
Output when Fail condition detected
Output and beep when Fail condition
detected
Output when Pass condition detected
Output and beep when Pass condition
detected
Continue test when output occurs
Stop test when output occurs
Copyright ©1998-2008 RIGOL Technologies, Inc.
User’s Guide for VS5000 Series
2-69
Page 98

RIGOL
g
Mask Setting
Use the operations in Setup and Mask windows to set the Pass/Fail mask.
Table 2-38 Mask Settings
Function Setting Description
Create
Vertical
Horizontal
Create a Pass/Fail mask as the followin
Vertical and Horizontal settings
Set vertical clearance to the waveform
(0.04div-4.00div)
Set horizontal clearance to the waveform
(0.04div-4.00div)
Save Save this Pass/Fail mask as a file
Load Load a Pass/Fail mask file
Table 2-39 Operation Settings
Function Setting Description
Run Start the Pass/Fail function
Stop Stop the Pass/Fail function
NOTE: Pass/Fail function is unavailable in X-Y mode.
2-70
Copyright ©1998-2008 RIGOL Technologies, Inc.
User’s Guide for VS5000 Series
Page 99

RIGOL
Waveform Record
Waveform recorder records input waveform from CH1, CH2 and Pass/Fail Out with a
maximum record length of 1000 frames. This performance can also be activated by
the Pass/Fail test output, which makes this function especially useful to capture
abnormal signals in long term without keeping an eye watching it.
Click the Record button in the Utility menu.
Stop button
Run button
Fast Forward and
Backward buttons
Record button
Set Repeat or
Single time play
mode
Current frame
Figure 2-51
Waveform Recording Interface
Waveform recorder: Record the waveforms with specified interval.
Table 2-40 Waveform Recording Functions
Function Setting Description
Select record source channel
Set number of record frames, the
max frames are 1000
Set save path of the Record file
Set time interval between record
frames
Set play path of the Record file
Record Setup
Play Setup
Select Source
Max Frames
Save Path
Time Interval
Play Path
Copyright ©1998-2008 RIGOL Technologies, Inc.
User’s Guide for VS5000 Series
2-71
Page 100

RIGOL
To Use Run Control Buttons
The Run Control buttons include and / .
:
The
signal.
Auto-set functions
After the button is clicked the oscilloscope is configured to the following
defaults:
features automatic adjustments to produce a stable display of the input
Table 2-41 Auto-set Functions
Function Setting
Display format Y-T
Acquire mode Normal
Vertical coupling Adjust to AC or DC according to the signal.
Vertical “V/div” Adjusted
Volts/Div Coarse
Bandwidth limit Full
Signal Invert OFF
Horizontal position Center
Horizontal “S/div” Adjust to right position
Trigger type Edge
Trigger source
Find the channel with input signal
automatically.
Trigger coupling DC
Trigger voltage Midpoint setting
Trigger mode Auto
knob
Trigger offset
/ :
Run or Stop waveform acquiring.
NOTE:
In STOP status, the volts/div and horizontal time base can be adjusted in a fixed limit,
to zoom in/out the signal in vertical and horizontal directions.
2-72
User’s Guide for VS5000 Series
Copyright ©1998-2008 RIGOL Technologies, Inc.
 Loading...