

Page 1

User’s Manual
CS+ V8.03.00
Integrated Development Environment
User’s Manual: RX Debug Tool
Target Device
RX Family
All information contained in these materials, including products and product specification s,
represents information on the product at the time of publication and is subject to change by
Renesas Electronics Corp. without notice. Please review the latest information published by
Renesas Electronics Corp. through various means, including the Renesas Electronics Corp.
website (http://www.renesas.com).
www.renesas.com
Rev.1.00 2019.11
Page 2

Notice
1. Descriptions of circuits, software and other related information in this document are provided only to illustrate the operation of semiconductor products
and application examples. You are fully responsible for the incorporation or any other use of the circuits, software, and information in the design of your
product or system. Renesas Electronics disclaims any and all liability for any losses and damages incurred by you or third part ies arising from the use of
these circuits, software, or information.
2. Renesas Electronics hereby expressly disclaims any warranties against and liability for infringement or any other claims involving patent s, copyright s, or
other intellectual property rights of third parties, by or arising from the use of Renesas Electronics products or technical information described in this
document, including but not limited to, the product data, drawings, charts, programs, algorithms, and application examples.
3. No license, express, implied or otherwise, is granted hereby under any patents, copyright s or other intellectual property rights of Renesas Electronics or
others.
4. You shall not alter, modify, copy, or reverse engineer any Renesas Electronics produ ct, whether in whole or in part. Renesas Electronics disclaims any
and all liability for any losses or damages incurred by you or third parties arising from such alteration, modification, copying or reverse engineering.
5. Renesas Electronics products are classified according to th e following two quality grades: "St andard" and "High Quality". The intended applications for
each Renesas Electronics product depends on the product's quality grade, as indicated below.
"Standard": Computers; office equipment; communications equipment; test and measurement equipment; audio and visual equipment; home
"High Quality": Transportation equipment (automobiles, trains, ships, etc.); traffic control (traff ic lights); large-scale communication equipment; key
Unless expressly designated as a high reliability product or a product for harsh environments in a Renesas Electronics data sheet or other Renesas
Electronics document, Renesas Electronics products are not intended or authorized for use in products or systems that may pose a direct threat to
human life or bodily injury (artificial life support devices or systems; surgical implantations; etc.), or may cause serious property damage (space system;
undersea repeaters; nuclear power control systems; aircraft control systems; key plant systems; military equipment; etc.). Renesas Electronics disclaims
any and all liability for any damages or losses incurred by you or any third parties arising from the use of any Renesas Electronics product that is
inconsistent with any Renesas Electronics data sheet, user's manual or other Renesas Electronics document.
6. When using Renesas Electronics products, refer to the latest product information (data sheets, user's manuals, application notes, "General Notes for
Handling and Using Semiconductor Devices" in the reliability handbook, etc.), and ensure that usage conditions are within the ranges specified by
Renesas Electronics with respect to maximum ratings, operating power supply voltage rang e, heat dissipation characteristics, installation, etc. Renesas
Electronics disclaims any and all liability for any malfunctions, failure or accident arising out of the use of Renesas Electronics products outside of such
specified ranges.
7. Although Renesas Electronics endeavors to improve the quality and reliability of Renesas Electronics product s , semiconductor products have specific
characteristics, such as the occurrence of failure at a certain rate and malfunctions under certain use conditions. Unless designated as a high reliability
product or a product for harsh environment s in a Renesas Electron ics dat a sheet or other Rene sas E lectronics document, Renesas Electronics product s
are not subject to radiation resistance design. You are responsible for implementing safety measures to guard against the possibility of bodily injury ,
injury or damage caused by fire, and/or danger to the public in the event of a failure or malfunct i on of Renesas Electronics products, such as safety
design for hardware and software, including but not limited to redundan cy, fire control and malfunction prevention, appropriate treatment fo r aging
degradation or any other appropriate measures. Because the evaluation of microcomput er software alone is very difficult and imp
responsible for evaluating the safety of the final products or systems manufactured by you.
8. Please contact a Renesas Electronics sales office for details as to environmental matters such as the environmental compatibility of each Renesas
Electronics product. You are responsible for carefully and sufficiently investi gating applicable laws and regulations that regulate the inclusion or use of
controlled substances, including without limitation, the EU RoHS Directive, and using Renesas Electronics products in compliance with all these
applicable laws and regulations. Renesas Electronics disclaims any and all liability for damages or losses occurring as a result of your noncompliance
with applicable laws and regulations.
9. Renesas Electronics products and technologies shall not be used for or i ncorporated into any products or systems whose manufacture, use, or sale is
prohibited under any applicable domestic or foreign laws or regulations. You shall comply with any applicable export control l a ws and regula tions
promulgated and administered by the governments of any countries assertin g jurisdiction over the parties or transactions.
10. It is the responsibility of the buyer or distributor of Renesas Ele ctronics products, or any other party who distributes, disposes of, or otherwise sells or
transfers the product to a third party, to notify such third party in advance of the contents and conditions set forth in this document.
11. This document shall not be reprinted, reproduced or duplicated in any form, in whole or in part, withou t prior written consent of Renesas Electronics.
12. Please contact a Renesas Electronics sales office if you have any questions regarding the information contained in this document or Renesas
Electronics products.
(Note1) "Renesas Electronics" as used in this document means Renesas Electronics Corporation and also includes its directly or indirectly controlled
subsidiaries.
(Note2) "Renesas Electronics product(s)" means any product developed or manufactured by or for Renesas Electronics.
electronic appliances; machine tools; personal electronic equipment; industrial robots; etc.
financial terminal systems; safety control equipment; etc.
ractical, you are
Corporate Headquarters Contact Information
TOYOSU FORESIA, 3-2-24 Toyosu,
Koto-ku, Tokyo 135-0061, Japan
www.renesas.com
For further information on a product, technology, the most up-to-date
version of a document, or your nearest sales office, please visit:
www.renesas.com/contact/
Trademarks
Renesas and the Renesas logo are trademarks of Renesas Electronics
Corporation. All trademarks and registered trademarks are the property
of their respective owners.
© 2019 Renesas Electronics Corporation. All rights reserved.
(Rev.4.0-1 November 2017)
Page 3

How to Use This Manual
This manual describes the role of the CS+ integrated development environment for developing applications and sys-
tems for RX family, and provides an outline of its features.
CS+ is an integrated development environment (IDE) for RX family, integrating the necessary tools for the development
phase of software (e.g. design, implementation, and debugging) into a single platform.
By providing an integrated environment, it is possible to perform all development using just this product, without the
need to use many different tools separately.
Readers This manual is intended for users who wish to understand the functions of the CS+ and
design software and hardware application systems.
Purpose This manual is intended to give users an understanding of the functions of the CS+ to use
for reference in developing the hardware or software of systems using these devices.
Organization This manual can be broadly divided into the following units.
1.GENERAL
2.FUNCTIONS
A.WINDOW REFERENCE
B.I/O FUNCTIONS
How to Read This Manual It is assumed that the readers of this manual have general knowledge of electricity, logic
circuits, and microcontrollers.
Conventions Data significance: Higher digits on the left and lower digits on the right
Active low representation: XXX
Note: Footnote for item marked with Note in the text
Caution: Information re quiring particular attention
Remarks: Supplementary information
Numeric representation: Decimal ... XXXX
(overscore over pin or signal name)
Hexadecimal ... 0xXXXX
Page 4

TABLE OF CONTENTS
1. GENERAL . . . . . . . . . . . . . . . . . . . . . . . . . . . . . . . . . . . . . . . . . . . . . . . . . . . . . . . 10
1.1 Summary . . . . . . . . . . . . . . . . . . . . . . . . . . . . . . . . . . . . . . . . . . . . . . . . . . . . . . . . . . . . . . . . . . . . . . . . . . . . . 10
1.2 Features. . . . . . . . . . . . . . . . . . . . . . . . . . . . . . . . . . . . . . . . . . . . . . . . . . . . . . . . . . . . . . . . . . . . . . . . . . . . . . 10
2. FUNCTIONS. . . . . . . . . . . . . . . . . . . . . . . . . . . . . . . . . . . . . . . . . . . . . . . . . . . . . . 11
2.1 Overview . . . . . . . . . . . . . . . . . . . . . . . . . . . . . . . . . . . . . . . . . . . . . . . . . . . . . . . . . . . . . . . . . . . . . . . . . . . . . 11
2.2 Preparation before Debugging. . . . . . . . . . . . . . . . . . . . . . . . . . . . . . . . . . . . . . . . . . . . . . . . . . . . . . . . . . . . . 13
2.2.1 Confirm the connection to a host machine . . . . . . . . . . . . . . . . . . . . . . . . . . . . . . . . . . . . . . . . . . . . . . . . 13
2.2.1.1 [E1] . . . . . . . . . . . . . . . . . . . . . . . . . . . . . . . . . . . . . . . . . . . . . . . . . . . . . . . . . . . . . . . . . . . . . . . . . . 13
2.2.1.2 [E20] . . . . . . . . . . . . . . . . . . . . . . . . . . . . . . . . . . . . . . . . . . . . . . . . . . . . . . . . . . . . . . . . . . . . . . . . . 14
2.2.1.3 [EZ Emulator]. . . . . . . . . . . . . . . . . . . . . . . . . . . . . . . . . . . . . . . . . . . . . . . . . . . . . . . . . . . . . . . . . . . 14
2.2.1.4 [Simulator] . . . . . . . . . . . . . . . . . . . . . . . . . . . . . . . . . . . . . . . . . . . . . . . . . . . . . . . . . . . . . . . . . . . . . 15
2.3 Configuration of Operating Environment of the Debug Tool . . . . . . . . . . . . . . . . . . . . . . . . . . . . . . . . . . . . . . 16
2.3.1 Select the debug tool to use. . . . . . . . . . . . . . . . . . . . . . . . . . . . . . . . . . . . . . . . . . . . . . . . . . . . . . . . . . . 16
2.3.2 [E1]. . . . . . . . . . . . . . . . . . . . . . . . . . . . . . . . . . . . . . . . . . . . . . . . . . . . . . . . . . . . . . . . . . . . . . . . . . . . . . 17
2.3.2.1 [Connect Settings] tab. . . . . . . . . . . . . . . . . . . . . . . . . . . . . . . . . . . . . . . . . . . . . . . . . . . . . . . . . . . . 18
2.3.2.2 [De bug Tool Settings] tab . . . . . . . . . . . . . . . . . . . . . . . . . . . . . . . . . . . . . . . . . . . . . . . . . . . . . . . . . 23
2.3.2.3 [Download File Settings] tab . . . . . . . . . . . . . . . . . . . . . . . . . . . . . . . . . . . . . . . . . . . . . . . . . . . . . . . 30
2.3.2.4 [Hook Transaction Settings] tab. . . . . . . . . . . . . . . . . . . . . . . . . . . . . . . . . . . . . . . . . . . . . . . . . . . . . 30
2.3.3 [E20]. . . . . . . . . . . . . . . . . . . . . . . . . . . . . . . . . . . . . . . . . . . . . . . . . . . . . . . . . . . . . . . . . . . . . . . . . . . . . 31
2.3.3.1 [Connect Settings] tab. . . . . . . . . . . . . . . . . . . . . . . . . . . . . . . . . . . . . . . . . . . . . . . . . . . . . . . . . . . . 32
2.3.3.2 [De bug Tool Settings] tab . . . . . . . . . . . . . . . . . . . . . . . . . . . . . . . . . . . . . . . . . . . . . . . . . . . . . . . . . 36
2.3.3.3 [Download File Settings] tab . . . . . . . . . . . . . . . . . . . . . . . . . . . . . . . . . . . . . . . . . . . . . . . . . . . . . . . 44
2.3.3.4 [Hook Transaction Settings] tab. . . . . . . . . . . . . . . . . . . . . . . . . . . . . . . . . . . . . . . . . . . . . . . . . . . . . 44
2.3.4 [EZ Emulator] . . . . . . . . . . . . . . . . . . . . . . . . . . . . . . . . . . . . . . . . . . . . . . . . . . . . . . . . . . . . . . . . . . . . . . 45
2.3.4.1 [Connect Settings] tab. . . . . . . . . . . . . . . . . . . . . . . . . . . . . . . . . . . . . . . . . . . . . . . . . . . . . . . . . . . . 45
2.3.4.2 [De bug Tool Settings] tab . . . . . . . . . . . . . . . . . . . . . . . . . . . . . . . . . . . . . . . . . . . . . . . . . . . . . . . . . 48
2.3.4.3 [Download File Settings] tab . . . . . . . . . . . . . . . . . . . . . . . . . . . . . . . . . . . . . . . . . . . . . . . . . . . . . . . 54
2.3.4.4 [Hook Transaction Settings] tab. . . . . . . . . . . . . . . . . . . . . . . . . . . . . . . . . . . . . . . . . . . . . . . . . . . . . 54
2.3.5 [Simulator]. . . . . . . . . . . . . . . . . . . . . . . . . . . . . . . . . . . . . . . . . . . . . . . . . . . . . . . . . . . . . . . . . . . . . . . . . 55
2.3.5.1 [Connect Settings] tab. . . . . . . . . . . . . . . . . . . . . . . . . . . . . . . . . . . . . . . . . . . . . . . . . . . . . . . . . . . . 55
2.3.5.2 [De bug Tool Settings] tab . . . . . . . . . . . . . . . . . . . . . . . . . . . . . . . . . . . . . . . . . . . . . . . . . . . . . . . . . 56
2.3.5.3 [Download File Settings] tab . . . . . . . . . . . . . . . . . . . . . . . . . . . . . . . . . . . . . . . . . . . . . . . . . . . . . . . 60
2.3.5.4 [Hook Transaction Settings] tab. . . . . . . . . . . . . . . . . . . . . . . . . . . . . . . . . . . . . . . . . . . . . . . . . . . . . 60
2.4 Connect to/Disconnect from the Debug Tool . . . . . . . . . . . . . . . . . . . . . . . . . . . . . . . . . . . . . . . . . . . . . . . . . . 61
2.4.1 Connect the debug tool to CS+ . . . . . . . . . . . . . . . . . . . . . . . . . . . . . . . . . . . . . . . . . . . . . . . . . . . . . . . . 61
2.4.2 Disconnect the debug tool from CS+ . . . . . . . . . . . . . . . . . . . . . . . . . . . . . . . . . . . . . . . . . . . . . . . . . . . . 63
2.4.3 Connect the debug tool to CS+ using hot plug-in [E1(JTAG)] [E20(JTAG)] . . . . . . . . . . . . . . . . . . . . . . . 63
Page 5

2.5 Download and Upload . . . . . . . . . . . . . . . . . . . . . . . . . . . . . . . . . . . . . . . . . . . . . . . . . . . . . . . . . . . . . . . . . . . 66
2.5.1 Execute downloading . . . . . . . . . . . . . . . . . . . . . . . . . . . . . . . . . . . . . . . . . . . . . . . . . . . . . . . . . . . . . . . . 66
2.5.2 An applied method of download . . . . . . . . . . . . . . . . . . . . . . . . . . . . . . . . . . . . . . . . . . . . . . . . . . . . . . . . 68
2.5.2.1 Changing the download conditions for load module files . . . . . . . . . . . . . . . . . . . . . . . . . . . . . . . . . 69
2.5.2.2 Addin g a download file (*.hex, *.mot, or *.bin). . . . . . . . . . . . . . . . . . . . . . . . . . . . . . . . . . . . . . . . . . 71
2.5.2.3 Downloading multiple load module files . . . . . . . . . . . . . . . . . . . . . . . . . . . . . . . . . . . . . . . . . . . . . . 72
2.5.2.4 Performing source-level debug with hex format, Motorola S format, or binary data format files. . . . 74
2.5.2.5 Downloading files to external flash memory [E1] [E20]. . . . . . . . . . . . . . . . . . . . . . . . . . . . . . . . . . . 75
2.5.3 Executing an upload. . . . . . . . . . . . . . . . . . . . . . . . . . . . . . . . . . . . . . . . . . . . . . . . . . . . . . . . . . . . . . . . . 77
2.6 Displaying and Changing Programs . . . . . . . . . . . . . . . . . . . . . . . . . . . . . . . . . . . . . . . . . . . . . . . . . . . . . . . . 79
2.6.1 Displaying source files . . . . . . . . . . . . . . . . . . . . . . . . . . . . . . . . . . . . . . . . . . . . . . . . . . . . . . . . . . . . . . . 79
2.6.2 Displaying the disassembled result . . . . . . . . . . . . . . . . . . . . . . . . . . . . . . . . . . . . . . . . . . . . . . . . . . . . . 80
2.6.2.1 Changing the display mode. . . . . . . . . . . . . . . . . . . . . . . . . . . . . . . . . . . . . . . . . . . . . . . . . . . . . . . . 80
2.6.2.2 Changing the display form. . . . . . . . . . . . . . . . . . . . . . . . . . . . . . . . . . . . . . . . . . . . . . . . . . . . . . . . . 81
2.6.2.3 Moving to a specified address. . . . . . . . . . . . . . . . . . . . . . . . . . . . . . . . . . . . . . . . . . . . . . . . . . . . . . 82
2.6.2.4 Moving to a symbol definition part. . . . . . . . . . . . . . . . . . . . . . . . . . . . . . . . . . . . . . . . . . . . . . . . . . . 82
2.6.2.5 Sa ving the displayed contents of disassembled results . . . . . . . . . . . . . . . . . . . . . . . . . . . . . . . . . . 82
2.6.3 Executing a build in parallel with other processes . . . . . . . . . . . . . . . . . . . . . . . . . . . . . . . . . . . . . . . . . . 83
2.6.4 Performing line assembly . . . . . . . . . . . . . . . . . . . . . . . . . . . . . . . . . . . . . . . . . . . . . . . . . . . . . . . . . . . . 84
2.6.4.1 Editing instructions . . . . . . . . . . . . . . . . . . . . . . . . . . . . . . . . . . . . . . . . . . . . . . . . . . . . . . . . . . . . . . 84
2.6.4.2 Editing instruction code . . . . . . . . . . . . . . . . . . . . . . . . . . . . . . . . . . . . . . . . . . . . . . . . . . . . . . . . . . . 85
2.7 Usage of PIC/PID Function . . . . . . . . . . . . . . . . . . . . . . . . . . . . . . . . . . . . . . . . . . . . . . . . . . . . . . . . . . . . . . . 86
2.7.1 Changing the allocation of a load module using the PIC/PID function . . . . . . . . . . . . . . . . . . . . . . . . . . . 86
2.8 Setting Overlay Sections . . . . . . . . . . . . . . . . . . . . . . . . . . . . . . . . . . . . . . . . . . . . . . . . . . . . . . . . . . . . . . . . . 89
2.8.1 Selecting the priority section. . . . . . . . . . . . . . . . . . . . . . . . . . . . . . . . . . . . . . . . . . . . . . . . . . . . . . . . . . . 89
2.9 Execute Programs. . . . . . . . . . . . . . . . . . . . . . . . . . . . . . . . . . . . . . . . . . . . . . . . . . . . . . . . . . . . . . . . . . . . . . 92
2.9.1 Reset microcontroller (CPU). . . . . . . . . . . . . . . . . . . . . . . . . . . . . . . . . . . . . . . . . . . . . . . . . . . . . . . . . . . 92
2.9.2 Execute programs. . . . . . . . . . . . . . . . . . . . . . . . . . . . . . . . . . . . . . . . . . . . . . . . . . . . . . . . . . . . . . . . . . . 92
2.9.2.1 Execute after resetting microcontroller (CPU). . . . . . . . . . . . . . . . . . . . . . . . . . . . . . . . . . . . . . . . . . 93
2.9.2.2 Execute from the current address . . . . . . . . . . . . . . . . . . . . . . . . . . . . . . . . . . . . . . . . . . . . . . . . . . . 93
2.9.2.3 Execute after changing PC value . . . . . . . . . . . . . . . . . . . . . . . . . . . . . . . . . . . . . . . . . . . . . . . . . . . 94
2.9.3 Execute programs in steps. . . . . . . . . . . . . . . . . . . . . . . . . . . . . . . . . . . . . . . . . . . . . . . . . . . . . . . . . . . . 94
2.9.3.1 Step into the function (Step In execution) . . . . . . . . . . . . . . . . . . . . . . . . . . . . . . . . . . . . . . . . . . . . . 95
2.9.3.2 Step over the function (Step Over execution) . . . . . . . . . . . . . . . . . . . . . . . . . . . . . . . . . . . . . . . . . . 95
2.9.3.3 Execute until return is completed (Return Out execution). . . . . . . . . . . . . . . . . . . . . . . . . . . . . . . . . 95
2.9.4 Execute a specified routine [E1] [E20] [EZ Emulator]. . . . . . . . . . . . . . . . . . . . . . . . . . . . . . . . . . . . . . . . 96
2.10 Stop Programs (Break) . . . . . . . . . . . . . . . . . . . . . . . . . . . . . . . . . . . . . . . . . . . . . . . . . . . . . . . . . . . . . . . . . . 99
2.10.1 Stop the program manually. . . . . . . . . . . . . . . . . . . . . . . . . . . . . . . . . . . . . . . . . . . . . . . . . . . . . . . . . . . . 99
2.10.2 Stop the program at the arbitrary position (breakpoint) . . . . . . . . . . . . . . . . . . . . . . . . . . . . . . . . . . . . . . 99
2.10.2.1 Set the type of breakpoints/break timing to use [E1] [E20] [EZ Emulator]. . . . . . . . . . . . . . . . . . . . . 99
2.10.2.2 Set a breakpoint . . . . . . . . . . . . . . . . . . . . . . . . . . . . . . . . . . . . . . . . . . . . . . . . . . . . . . . . . . . . . . . . 99
2.10.2.3 Edit a hardware breakpoint . . . . . . . . . . . . . . . . . . . . . . . . . . . . . . . . . . . . . . . . . . . . . . . . . . . . . . . 100
Page 6

2.10.2.4 Delete a breakpoint . . . . . . . . . . . . . . . . . . . . . . . . . . . . . . . . . . . . . . . . . . . . . . . . . . . . . . . . . . . . . 101
2.10.3 Stop the program at the arbitrary position (break event) [E1] [E20] [EZ Emulator]. . . . . . . . . . . . . . . . . 101
2.10.3.1 Set a beak event (execution-related). . . . . . . . . . . . . . . . . . . . . . . . . . . . . . . . . . . . . . . . . . . . . . . . 101
2.10.3.2 Edit a break event (execution-related). . . . . . . . . . . . . . . . . . . . . . . . . . . . . . . . . . . . . . . . . . . . . . . 102
2.10.3.3 Delete a break event (execution-related) . . . . . . . . . . . . . . . . . . . . . . . . . . . . . . . . . . . . . . . . . . . . 102
2.10.4 Stop the program with the access to variables/I/O registers. . . . . . . . . . . . . . . . . . . . . . . . . . . . . . . . . . 102
2.10.4.1 Set a break event (access-related) to a variable/I/O register . . . . . . . . . . . . . . . . . . . . . . . . . . . . . 103
2.10.4.2 Edit a break event (access-related) to a variab le / IO register . . . . . . . . . . . . . . . . . . . . . . . . . . . . . 107
2.10.4.3 Delete a break event (access-related) to a variable/IO register . . . . . . . . . . . . . . . . . . . . . . . . . . . 107
2.10.5 Set multiple break events in combination (Combination break) [E1] [E20] [EZ Emulator] . . . . . . . . . . . 107
2.10.6 Other break factors. . . . . . . . . . . . . . . . . . . . . . . . . . . . . . . . . . . . . . . . . . . . . . . . . . . . . . . . . . . . . . . . . 108
2.11 Displaying and Changing Memory, Registers, and Variables . . . . . . . . . . . . . . . . . . . . . . . . . . . . . . . . . . . . 110
2.11.1 Displaying and changing memory contents . . . . . . . . . . . . . . . . . . . . . . . . . . . . . . . . . . . . . . . . . . . . . . 110
2.11.1.1 Specifying the display position. . . . . . . . . . . . . . . . . . . . . . . . . . . . . . . . . . . . . . . . . . . . . . . . . . . . . 110
2.11.1.2 Changing the display form of values . . . . . . . . . . . . . . . . . . . . . . . . . . . . . . . . . . . . . . . . . . . . . . . . 111
2.11.1.3 Changing memory contents. . . . . . . . . . . . . . . . . . . . . . . . . . . . . . . . . . . . . . . . . . . . . . . . . . . . . . . 112
2.11.1.4 Displaying and changing memory contents during program execution. . . . . . . . . . . . . . . . . . . . . . 113
2.11.1.5 Searching for memory contents. . . . . . . . . . . . . . . . . . . . . . . . . . . . . . . . . . . . . . . . . . . . . . . . . . . . 116
2.11.1.6 Collectively changing (initializing) memory contents. . . . . . . . . . . . . . . . . . . . . . . . . . . . . . . . . . . . 117
2.11.1.7 Saving displayed memory contents. . . . . . . . . . . . . . . . . . . . . . . . . . . . . . . . . . . . . . . . . . . . . . . . . 118
2.11.2 Displaying and changing the CPU registers. . . . . . . . . . . . . . . . . . . . . . . . . . . . . . . . . . . . . . . . . . . . . . 121
2.11.2.1 Changing the form in which values are displayed . . . . . . . . . . . . . . . . . . . . . . . . . . . . . . . . . . . . . . 121
2.11.2.2 Changing the CPU register contents. . . . . . . . . . . . . . . . . . . . . . . . . . . . . . . . . . . . . . . . . . . . . . . . 122
2.11.2.3 Saving the displayed CPU register contents. . . . . . . . . . . . . . . . . . . . . . . . . . . . . . . . . . . . . . . . . . 122
2.11.3 Displaying and changing the I/O registers . . . . . . . . . . . . . . . . . . . . . . . . . . . . . . . . . . . . . . . . . . . . . . . 122
2.11.3.1 Searching I/O register . . . . . . . . . . . . . . . . . . . . . . . . . . . . . . . . . . . . . . . . . . . . . . . . . . . . . . . . . . . 123
2.11.3.2 Putting the I/O registers in order . . . . . . . . . . . . . . . . . . . . . . . . . . . . . . . . . . . . . . . . . . . . . . . . . . . 123
2.11.3.3 Changing the form in which values are displayed . . . . . . . . . . . . . . . . . . . . . . . . . . . . . . . . . . . . . . 124
2.11.3.4 Changing the contents of I/O registers . . . . . . . . . . . . . . . . . . . . . . . . . . . . . . . . . . . . . . . . . . . . . . 124
2.11.3.5 Displaying and changing I/O register contents during program execution . . . . . . . . . . . . . . . . . . . 124
2.11.3.6 Saving the displayed I/O register contents . . . . . . . . . . . . . . . . . . . . . . . . . . . . . . . . . . . . . . . . . . . 125
2.11.4 Displaying and changing global and static variables . . . . . . . . . . . . . . . . . . . . . . . . . . . . . . . . . . . . . . . 125
2.11.5 Displaying and changing local variables. . . . . . . . . . . . . . . . . . . . . . . . . . . . . . . . . . . . . . . . . . . . . . . . . 125
2.11.5.1 Changing the form in which values are displayed . . . . . . . . . . . . . . . . . . . . . . . . . . . . . . . . . . . . . . 126
2.11.5.2 Changing the contents of local variables. . . . . . . . . . . . . . . . . . . . . . . . . . . . . . . . . . . . . . . . . . . . . 126
2.11.5.3 Saving the displayed contents of local variables. . . . . . . . . . . . . . . . . . . . . . . . . . . . . . . . . . . . . . . 127
2.11.6 Displaying and changing watch-expressions . . . . . . . . . . . . . . . . . . . . . . . . . . . . . . . . . . . . . . . . . . . . . 127
2.11.6.1 Registering watch-expressions . . . . . . . . . . . . . . . . . . . . . . . . . . . . . . . . . . . . . . . . . . . . . . . . . . . . 128
2.11.6.2 Putting the registered watch-expressions in order . . . . . . . . . . . . . . . . . . . . . . . . . . . . . . . . . . . . . 129
2.11.6.3 Editing the registered watch-expressions . . . . . . . . . . . . . . . . . . . . . . . . . . . . . . . . . . . . . . . . . . . . 130
2.11.6.4 Removing watch-expressions . . . . . . . . . . . . . . . . . . . . . . . . . . . . . . . . . . . . . . . . . . . . . .
2.11.6.5 Changing the form in which values are displayed . . . . . . . . . . . . . . . . . . . . . . . . . . . . . . . . . . . . . . 130
. . . . . . . 130
Page 7

2.11.6.6 Changing the contents of watch-expressions . . . . . . . . . . . . . . . . . . . . . . . . . . . . . . . . . . . . . . . . . 131
2.11.6.7 Displaying and changing the contents of watch-expressions during program execution . . . . . . . . 131
2.11.6.8 Exporting/importing watch-expressions. . . . . . . . . . . . . . . . . . . . . . . . . . . . . . . . . . . . . . . . . . . . . . 131
2.11.6.9 Saving the displayed contents of watch-expressions . . . . . . . . . . . . . . . . . . . . . . . . . . . . . . . . . . . 133
2.12 Display Function Call Information from the Stack . . . . . . . . . . . . . . . . . . . . . . . . . . . . . . . . . . . . . . . . . . . . . 134
2.12.1 Display call stack information . . . . . . . . . . . . . . . . . . . . . . . . . . . . . . . . . . . . . . . . . . . . . . . . . . . . . . . . . 134
2.12.1.1 Changing the form in which values are displayed . . . . . . . . . . . . . . . . . . . . . . . . . . . . . . . . . . . . . . 134
2.12.1.2 Jumping to the source line. . . . . . . . . . . . . . . . . . . . . . . . . . . . . . . . . . . . . . . . . . . . . . . . . . . . . . . . 135
2.12.1.3 Displaying local variables . . . . . . . . . . . . . . . . . . . . . . . . . . . . . . . . . . . . . . . . . . . . . . . . . . . . . . . . 135
2.12.1.4 Saving the displayed contents of call stack information . . . . . . . . . . . . . . . . . . . . . . . . . . . . . . . . . 135
2.13 Collecting an Execution History. . . . . . . . . . . . . . . . . . . . . . . . . . . . . . . . . . . . . . . . . . . . . . . . . . . . . . . . . . . 136
2.13.1 Setting up a trace operation . . . . . . . . . . . . . . . . . . . . . . . . . . . . . . . . . . . . . . . . . . . . . . . . . . . . . . . . . . 136
2.13.1.1 For [E1] . . . . . . . . . . . . . . . . . . . . . . . . . . . . . . . . . . . . . . . . . . . . . . . . . . . . . . . . . . . . . . . . . . . . . . 136
2.13.1.2 For [E20] . . . . . . . . . . . . . . . . . . . . . . . . . . . . . . . . . . . . . . . . . . . . . . . . . . . . . . . . . . . . . . . . . . . . . 138
2.13.1.3 For [EZ Emulator] . . . . . . . . . . . . . . . . . . . . . . . . . . . . . . . . . . . . . . . . . . . . . . . . . . . . . . . . . . . . . . 141
2.13.1.4 For [Simulator]. . . . . . . . . . . . . . . . . . . . . . . . . . . . . . . . . . . . . . . . . . . . . . . . . . . . . . . . . . . . . . . . . 142
2.13.2 Collecting an execution history up to a halt . . . . . . . . . . . . . . . . . . . . . . . . . . . . . . . . . . . . . . . . . . . . . . 143
2.13.3 Collecting an execution history in a section . . . . . . . . . . . . . . . . . . . . . . . . . . . . . . . . . . . . . . . . . . . . . . 143
2.13.3.1 Setting a trace start event and a trace end event . . . . . . . . . . . . . . . . . . . . . . . . . . . . . . . . . . . . . . 143
2.13.3.2 Combining multiple events [E1] [E20] [EZ Emulator]. . . . . . . . . . . . . . . . . . . . . . . . . . . . . . . . . . . . 146
2.13.3.3 Executing the program . . . . . . . . . . . . . . . . . . . . . . . . . . . . . . . . . . . . . . . . . . . . . . . . . . . . . . . . . . 146
2.13.3.4 Editing trace start and trace end events . . . . . . . . . . . . . . . . . . . . . . . . . . . . . . . . . . . . . . . . . . . . . 146
2.13.3.5 Deleting a trace start or trace end event . . . . . . . . . . . . . . . . . . . . . . . . . . . . . . . . . . . . . . . . . . . . . 147
2.13.4 Collecting an execution history only when conditions are met . . . . . . . . . . . . . . . . . . . . . . . . . . . . . . . . 147
2.13.5 Stopping/Restarting Collection of Execution History [E20] [Simulator]. . . . . . . . . . . . . . . . . . . . . . . . . . 148
2.13.5.1 To temporarily stop collection of execution history . . . . . . . . . . . . . . . . . . . . . . . . . . . . . . . . . . . . . 148
2.13.5.2 To restart collection of execution history . . . . . . . . . . . . . . . . . . . . . . . . . . . . . . . . . . . . . . . . . . . . . 150
2.13.6 Displaying an execution history . . . . . . . . . . . . . . . . . . . . . . . . . . . . . . . . . . . . . . . . . . . . . . . . . . . . . . . 150
2.13.6.1 Changing the display mode. . . . . . . . . . . . . . . . . . . . . . . . . . . . . . . . . . . . . . . . . . . . . . . . . . . . . . . 150
2.13.6.2 Changing the form in which values are displayed . . . . . . . . . . . . . . . . . . . . . . . . . . . . . . . . . . . . . . 151
2.13.6.3 Getting linked to other panels . . . . . . . . . . . . . . . . . . . . . . . . . . . . . . . . . . . . . . . . . . . . . . . . . . . . . 151
2.13.7 Clearing the trace memory . . . . . . . . . . . . . . . . . . . . . . . . . . . . . . . . . . . . . . . . . . . . . . . . . . . . . . . . . . . 151
2.13.8 Searching for trace data . . . . . . . . . . . . . . . . . . . . . . . . . . . . . . . . . . . . . . . . . . . . . . . . . . . . . . . . . . . . . 152
2.13.8.1 Searching at the instruction level. . . . . . . . . . . . . . . . . . . . . . . . . . . . . . . . . . . . . . . . . . . . . . . . . . . 152
2.13.8.2 Searching at the source level . . . . . . . . . . . . . . . . . . . . . . . . . . . . . . . . . . . . . . . . . . . . . . . . . . . . . 154
2.13.9 Saving the displayed content of an execution history. . . . . . . . . . . . . . . . . . . . . . . . . . . . . . . . . . . . . . . 156
2.14 Measuring the Execution Time . . . . . . . . . . . . . . . . . . . . . . . . . . . . . . . . . . . . . . . . . . . . . . . . . . . . . . . . . . . 158
2.14.1 Setting the timer measurement operation [E1] [E20] [EZ Emulator]. . . . . . . . . . . . . . . . . . . . . . . . . . . . 158
2.14.2 Measuring execution time from start to stop. . . . . . . . . . . . . . . . . . . . . . . . . . . . . . . . . . . . . . . . . . . . . . 158
2.14.2.1 Checking the status bar for confirmation. . . . . . . . . . . . . . . . . . . . . . . . . . . . . . . . . . . . . . . . . . . . . 159
2.14.2.2 Checking the Events panel for confirmation . . . . . . . . . . . . . . . . . . . . . . . . . . . . . . . . . . . . . . . . . . 159
2.14.3 Measuring execution time in a section . . . . . . . . . . . . . . . . . . . . . . . . . . . . . . . . . . . . . . . . . . . . . . . . . . 160
Page 8

2.14.3.1 Setting the timer start event and timer end event . . . . . . . . . . . . . . . . . . . . . . . . . . . . . . . . . . . . . . 160
2.14.3.2 Execute the program. . . . . . . . . . . . . . . . . . . . . . . . . . . . . . . . . . . . . . . . . . . . . . . . . . . . . . . . . . . . 164
2.14.3.3 Editing a timer measurement event [E1] [E20] [EZ Emulator]. . . . . . . . . . . . . . . . . . . . . . . . . . . . . 166
2.14.3.4 Editing timer start and timer end events . . . . . . . . . . . . . . . . . . . . . . . . . . . . . . . . . . . . . . . . . . . . . 167
2.14.3.5 Deleting a timer start event or timer end event . . . . . . . . . . . . . . . . . . . . . . . . . . . . . . . . . . . . . . . . 167
2.14.4 Range of measurable time . . . . . . . . . . . . . . . . . . . . . . . . . . . . . . . . . . . . . . . . . . . . . . . . . . . . . . . . . . . 167
2.15 Measure Coverage [Simulator] [E20 [RX71M, RX66x, RX65x, RX64M, RX66T, RX72T, RX72M, and RX72N
Groups]]169
2.15.1 Configure the coverage measurement . . . . . . . . . . . . . . . . . . . . . . . . . . . . . . . . . . . . . . . . . . . . . . . . . . 169
2.15.2 Display coverage measurement results . . . . . . . . . . . . . . . . . . . . . . . . . . . . . . . . . . . . . . . . . . . . . . . . . 170
2.16 Set an Action into Programs . . . . . . . . . . . . . . . . . . . . . . . . . . . . . . . . . . . . . . . . . . . . . . . . . . . . . . . . . . . . . 173
2.16.1 Insert printf . . . . . . . . . . . . . . . . . . . . . . . . . . . . . . . . . . . . . . . . . . . . . . . . . . . . . . . . . . . . . . . . . . . . . . . 173
2.16.1.1 Set a Printf event. . . . . . . . . . . . . . . . . . . . . . . . . . . . . . . . . . . . . . . . . . . . . . . . . . . . . . . . . . . . . . . 173
2.16.1.2 Execute the program. . . . . . . . . . . . . . . . . . . . . . . . . . . . . . . . . . . . . . . . . . . . . . . . . . . . . . . . . . . . 174
2.16.1.3 Check the output result . . . . . . . . . . . . . . . . . . . . . . . . . . . . . . . . . . . . . . . . . . . . . . . . . . . . . . . . . . 174
2.16.1.4 Edit Printf event. . . . . . . . . . . . . . . . . . . . . . . . . . . . . . . . . . . . . . . . . . . . . . . . . . . . . . . . . . . . . . . . 174
2.16.2 Insert an interrupt event [Simulator] . . . . . . . . . . . . . . . . . . . . . . . . . . . . . . . . . . . . . . . . . . . . . . . . . . . . 175
2.16.2.1 Set an interrupt event . . . . . . . . . . . . . . . . . . . . . . . . . . . . . . . . . . . . . . . . . . . . . . . . . . . . . . . . . . . 175
2.16.2.2 Execute the program. . . . . . . . . . . . . . . . . . . . . . . . . . . . . . . . . . . . . . . . . . . . . . . . . . . . . . . . . . . . 176
2.16.2.3 Edit interrupt event . . . . . . . . . . . . . . . . . . . . . . . . . . . . . . . . . . . . . . . . . . . . . . . . . . . . . . . . . . . . . 176
2.17 Event Management . . . . . . . . . . . . . . . . . . . . . . . . . . . . . . . . . . . . . . . . . . . . . . . . . . . . . . . . . . . . . . . . . . . . 177
2.17.1 Changing states of setting (Enabled/Disabled). . . . . . . . . . . . . . . . . . . . . . . . . . . . . . . . . . . . . . . . . . . . 179
2.17.2 Displaying only a specific type of event . . . . . . . . . . . . . . . . . . . . . . . . . . . . . . . . . . . . . . . . . . . . . . . . . 179
2.17.3 Jump to an event address . . . . . . . . . . . . . . . . . . . . . . . . . . . . . . . . . . . . . . . . . . . . . . . . . . . . . . . . . . . 179
2.17.4 Editing detailed settings of events . . . . . . . . . . . . . . . . . . . . . . . . . . . . . . . . . . . . . . . . . . . . . . . . . . . . . 180
2.17.4.1 Editing execution-related events . . . . . . . . . . . . . . . . . . . . . . . . . . . . . . . . . . . . . . . . . . . . . . . . . . . 180
2.17.4.2 Editing access-related events . . . . . . . . . . . . . . . . . . . . . . . . . . . . . . . . . . . . . . . . . . . . . . . . . . . . . 181
2.17.4.3 Editing combination conditio ns of events [E1] [E20] [EZ Emulator]. . . . . . . . . . . . . . . . . . . . . . . . . 183
2.17.5 Deleting events. . . . . . . . . . . . . . . . . . . . . . . . . . . . . . . . . . . . . . . . . . . . . . . . . . . . . . . . . . . . . . . . . . . . 186
2.17.6 Entering comments for events . . . . . . . . . . . . . . . . . . . . . . . . . . . . . . . . . . . . . . . . . . . . . . . . . . . . . . . . 186
2.17.7 Points to note regarding event setting . . . . . . . . . . . . . . . . . . . . . . . . . . . . . . . . . . . . . . . . . . . . . . . . . . 186
2.17.7.1 Allowable number of valid events . . . . . . . . . . . . . . . . . . . . . . . . . . . . . . . . . . . . . . . . . . . . . . . . . . 187
2.17.7.2 Types of events that can be set or removed during execution . . . . . . . . . . . . . . . . . . . . . . . . . . . . 188
2.17.7.3 Other precautions . . . . . . . . . . . . . . . . . . . . . . . . . . . . . . . . . . . . . . . . . . . . . . . . . . . . . . . . . . . . . . 189
2.18 Setting Up the Hook Process. . . . . . . . . . . . . . . . . . . . . . . . . . . . . . . . . . . . . . . . . . . . . . . . . . . . . . . . . . . . . 190
2.19 Measuring Current Consumption [E2] . . . . . . . . . . . . . . . . . . . . . . . . . . . . . . . . . . . . . . . . . . . . . . . . . . . . . . 193
2.20 Using the Debug Console . . . . . . . . . . . . . . . . . . . . . . . . . . . . . . . . . . . . . . . . . . . . . . . . . . . . . . . . . . . . . . . 199
2.21 About Input Value. . . . . . . . . . . . . . . . . . . . . . . . . . . . . . . . . . . . . . . . . . . . . . . . . . . . . . . . . . . . . . . . . . . . . . 203
2.21.1 Input rule. . . . . . . . . . . . . . . . . . . . . . . . . . . . . . . . . . . . . . . . . . . . . . . . . . . . . . . . . . . . . . . . . . . . . . . . . 203
2.21.2 Symbol name completion function . . . . . . . . . . . . . . . . . . . . . . . . . . . . . . . . . . . . . . . . . . . . . . . . . . . . . 207
2.21.3 Icons for invalid input . . . . . . . . . . . . . . . . . . . . . . . . . . . . . . . . . . . . . . . . . . . . . . . . . . . . . . . . . . . . . . . 208
2.22 Differences between the Microcontroller and the Emulator. . . . . . . . . . . . . . . . . . . . . . . . . . . . . . . . . . . . . . 209
2.23 Other Notes on Usage [E1] [E20] [EZ Emulator]. . . . . . . . . . . . . . . . . . . . . . . . . . . . . . . . . . . . . . . . . . . . . . 210
Page 9

A. WINDOW REFERENCE . . . . . . . . . . . . . . . . . . . . . . . . . . . . . . . . . . . . . . . . . . . 211
A.1 Description. . . . . . . . . . . . . . . . . . . . . . . . . . . . . . . . . . . . . . . . . . . . . . . . . . . . . . . . . . . . . . . . . . . . . . . . . . . 211
B. I/O FUNCTIONS. . . . . . . . . . . . . . . . . . . . . . . . . . . . . . . . . . . . . . . . . . . . . . . . . . 406
B.1 Standard I/O and File I/O. . . . . . . . . . . . . . . . . . . . . . . . . . . . . . . . . . . . . . . . . . . . . . . . . . . . . . . . . . . . . . . . 406
Revision Record . . . . . . . . . . . . . . . . . . . . . . . . . . . . . . . . . . . . . . . . . . . . . . . . . . . . . . C - 1
Page 10

CS+ V8.03.00 1. GENERAL
1. GENERAL
CS+ is an integrated developing environment platform for RH850 family, RX family, V850 family, RL78 family, 78K0R
microcontroller and 78K0 microcontroller.
CS+ comprehensively supports the operations required for program development such as designing, coding, building,
debugging, and flash programming.
In this manual, the debugging is explained out of those operations needed for the program development.
Caution When the E2 emulator Lite (abbreviated name: E2 Lite) is used, please read references to "E1" in this
manual as also meaning "E2 Lite".
When the E2 emulator (abbreviated name: E2) is used, please read references to "E1" in this manual as
also meaning "E2".
Among them, this manual focuses on the description of debugging the outline of which is provided in this chap ter.
1.1 Summary
You can efficiently debug the program developed for the RX family, using the debugger provided by CS+.
1.2 Features
The following are the features of the debugger provided by CS+.
- Connectable to various debugging tools
Usable in combination with the on-chip debugging emulator (E1/E20/EZ Emulator) and the simulator, it provides
improved efficiency in program development.
- Mixed display of C/C++ source text and disassembled text
The C/C++ source text and the disassembled text can be displayed together on the same panel.
- Source level debugging and instruction level debugging
C/C++ source program can be debugged either at the source or the instruction level.
- Data flash memory programming
When the selected microcontroller is provided with a data flash memory, you can display or edit the contents of the
data flash memory using the same access method as in other normal memory operations (not including the simulator).
- Real-time display updating function
The values of memory, registers and variables are automatically updated not only when the program is stopped, but
also in execution.
- Saving/restoring the debugging environment
The debugging environment such as breakpoints, event configurati on information, file download information, display
condition/position of the panel, etc. can be saved.
R20UT4588EJ0100 Rev.1.00 Page 10 of 423
Nov 01, 2019
Page 11

CS+ V8.03.00 2. FUNCTIONS
2. FUNCTIONS
This chapter describes the debugging process using CS+ as well as main debugging functions.
2.1 Overview
Following shows the basic sequence of program debugging using CS+.
(1) Start CS+
Launch CS+ from the [Start] menu of Windows.
Remark For details on "Start CS+", see "CS+ Integrated Development Environment User's Manual: Project
Operation".
(2) Set a project
Create a new project, or load the existing one.
Remark For details on "Set a project", see "CS+ Integrated Development Environment User's Manual: Proj-
ect Operation".
(3) Create a load module
Once you are finished with the setting of the active project and the build, execute the build to create a load module.
Remark For details on "Create a load module" with CC-RX, see "CS+ Integrated Development Environment
User's Manual: CC-RX Build Tool Operation".
(4) Confirm the connection to a host machine
Connect the debug tool (E1, E20, EZ Emulator or Simulator) to be used to a host machine.
(5) Select the debug tool to use
Select the debug tool to be used in a project.
Remark The selectable debug tool differs depending on the microcontroller type to be used in a project.
(6) Configure the operating environment for the debug tool
Configure the operating environment for the debug tool selected in step (5).
- [E1]
- [E20]
- [EZ Emul ator]
- [Simulator]
(7) Connect the debug tool to CS+
Connect the debug tool to CS+ to start communication.
(8) Execute downloading
Download the load module created in step (3) to the debug tool.
(9) Displaying source files
Display the contents of the downloaded load module (source files) on the Editor panel or Disassemble panel.
(10) Execute programs
Execute the program using the operation method that matches your purpose.
If you wish to stop the program at the arbitrary position, set a breakpoint/break event
gram (see "2.10.2 Stop the program at the arbitrary position (breakpoint)"/"2.10.3 Stop the program at the arbi-
trary position (break event) [E1] [E20] [EZ Emulator]").
Note These functions are implemented by setting events to the debug tool used.
See "2.17.7 Points to note regarding event setting", when you use events.
(11) Stop the program manually
Stop the program currently being executed.
Note that if a breakpoint/break event has been set in steps (10), the program execution will be stopped automatically when the condition of the breakpoint/break event is met.
(12) Check the result of the program execution
Check the following information that the debug tool acquired by the program execution.
- Displaying and Changing Memory, Registers, and Variables
Note
before executing the pro-
R20UT4588EJ0100 Rev.1.00 Page 11 of 423
Nov 01, 2019
Page 12

CS+ V8.03.00 2. FUNCTIONS
- Display Function Call Information from the Stack
- Collecting an Execution History
- Measuring the Execution T i me
- Measure Coverage [Simulator] [E20 [RX71M, RX66x, RX65x, RX64M, RX66T, RX72T, RX72M, and RX72N
Groups]]
Note These functions are implemented by setting events to the debug tool used.
See "2.17.7 Points to note regarding event setting", when you use events.
Debug the program, repeating steps (9) to (12) as required.
Note that if the program is modified during debugging, steps (3) and (8) also should be repeated.
Remark 1. Other than the above, you can also check the result of the program execution by using the following
functions.
- Set an Action into Programs
- Setting Up the Hook Process
- Using the Debug Console
Remark 2. The acquired information can be saved to a file.
- Saving the displayed contents of disassembled results
- Saving displayed memory contents
- Saving the displayed CPU register co ntents
- Saving the displayed I/O register contents
- Saving the displayed contents of local variables
- Saving the displayed contents of watch-expressions
- Saving the displayed contents of call stack information
- Saving the displayed content of an execution history
(13) Execu ting an upload
Save the program (the memory contents) to a file in the arbitrary format (e.g. Intel hex format, binary data format,
etc.), as required.
(14) Disconnect the debug tool from CS+
Disconnect the debug tool from CS+ to terminate communication.
(15) Save the project file
Save the setting information of the project to the project file.
Remark For details on "Save the project file", see "CS+ Integrated Development Environment User's Man-
ual: Project Operation".
Note
Note
R20UT4588EJ0100 Rev.1.00 Page 12 of 423
Nov 01, 2019
Page 13
CS+ V8.03.00 2. FUNCTIONS
2.2 Preparation before Debugging
This section describes the preparation to start debugging the created program.
2.2.1 Confirm the connection to a host machine
Connection examples for each debug tool are shown.
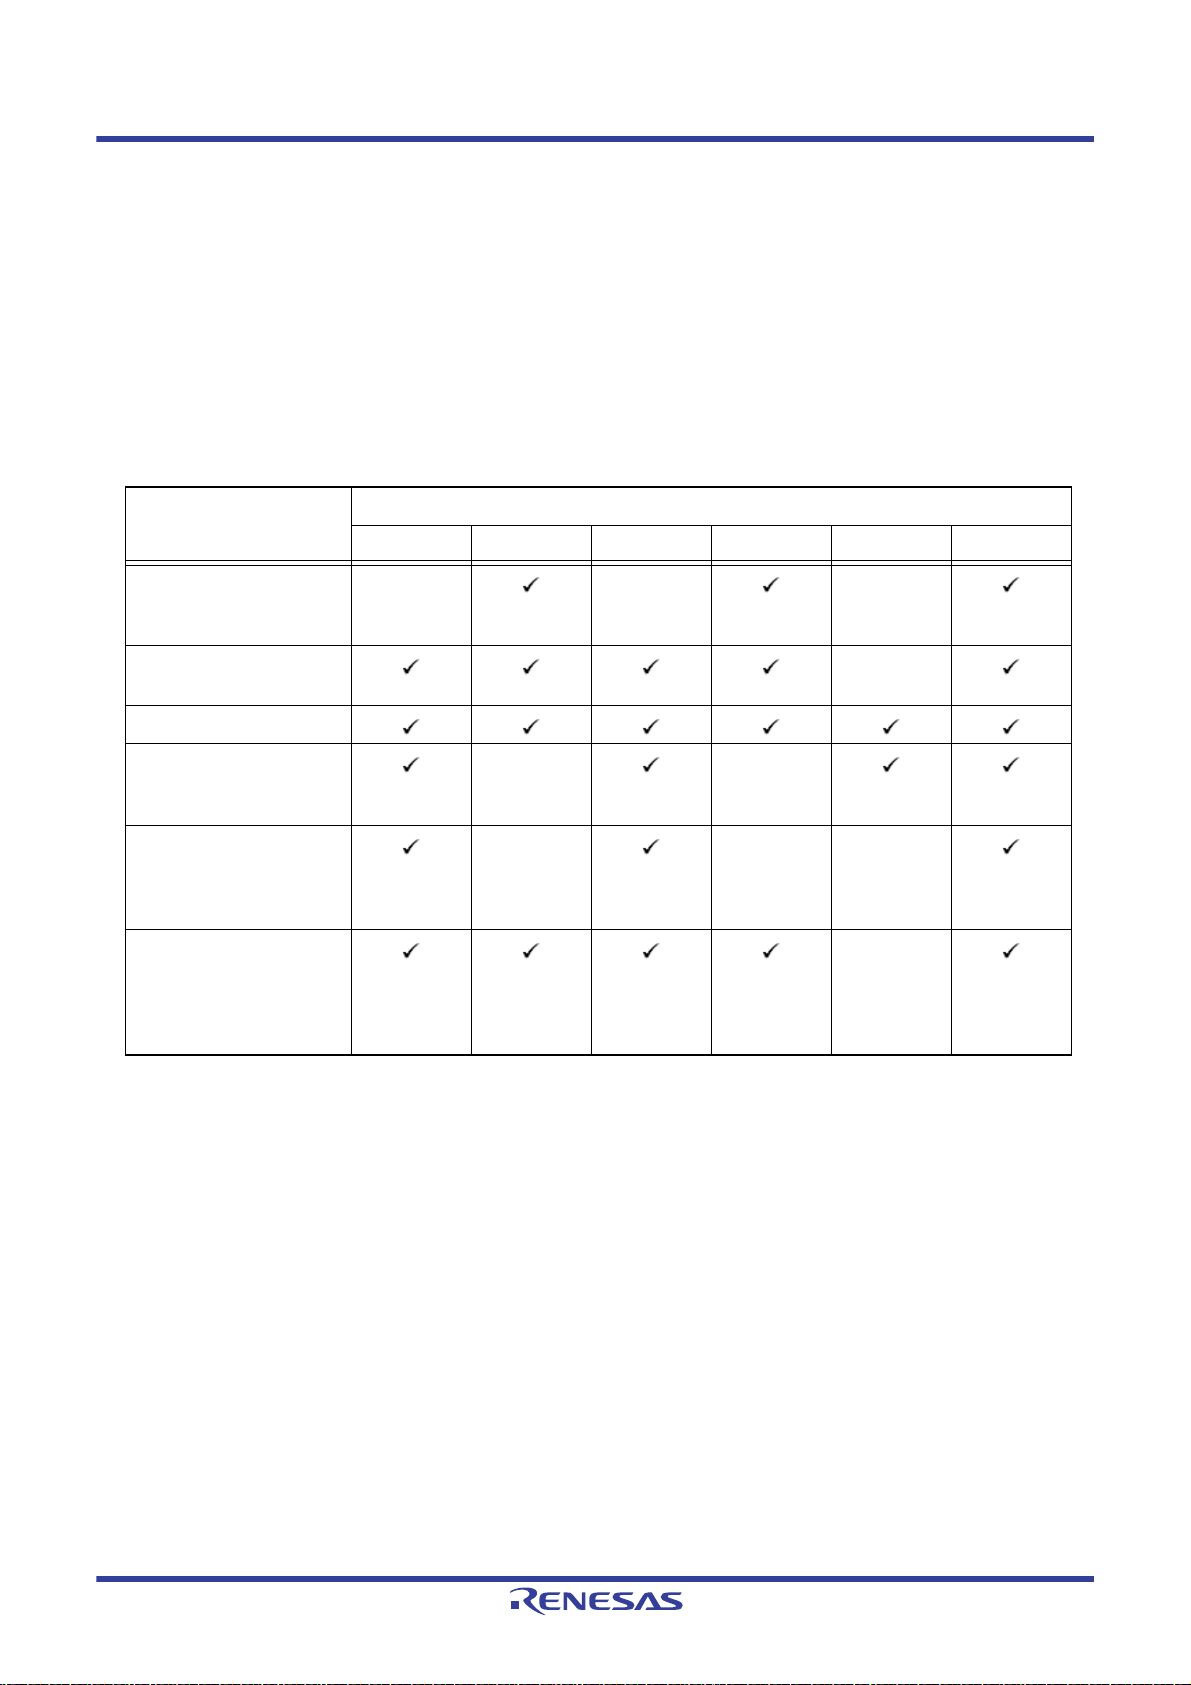
Note that the relationship between the microcontroller selected in the project and the connectable debug tools is as the
following table.
Remark "(Serial)"/"(JTAG)" in the table below means that E1/E20 is used with FINE communications or JTAG
communications.
Table 2.1 Relationship between Typ es of Microcon troller and Connectable Debug Tools
Microcontroller Debug Tool
E1(Serial) E1(JTAG) E20(Serial) E20(JTAG) EZ Emulator Simulator
RX610, RX621, RX62N,
RX62T, and RX62G
Groups
RX630, RX631, RX63N,
and RX634 Groups
RX63T Group
RX110, RX111, RX113,
RX210, and RX220
Groups
RX21A, RX211, RX231,
RX23W, RX23T, RX24T,
RX24U, RX130, RX13T
and RX23E-A Groups
RX71M, RX66x, RX64M,
RX65N, RX651, RX65N2M, RX651-2M, RX72T,
RX72M and RX72N
Groups
2.2.1.1 [E1]
2.2.1.2 [E20]
2.2.1.3 [EZ Emulator]
2.2.1.4 [Simulator]
---
-
--
---
-
2.2.1.1 [E1]
Connect a host machine and E1. If required, connect a target board, too.
You can make a choice between FINE communications [E1(Serial)] and JTAG communications [E1(JTAG)] as the com-
munication method to the target system (see "2.3.1 Select the debug tool to use").
See E1 User's Manual for details on the connection method.
R20UT4588EJ0100 Rev.1.00 Page 13 of 423
Nov 01, 2019
Page 14
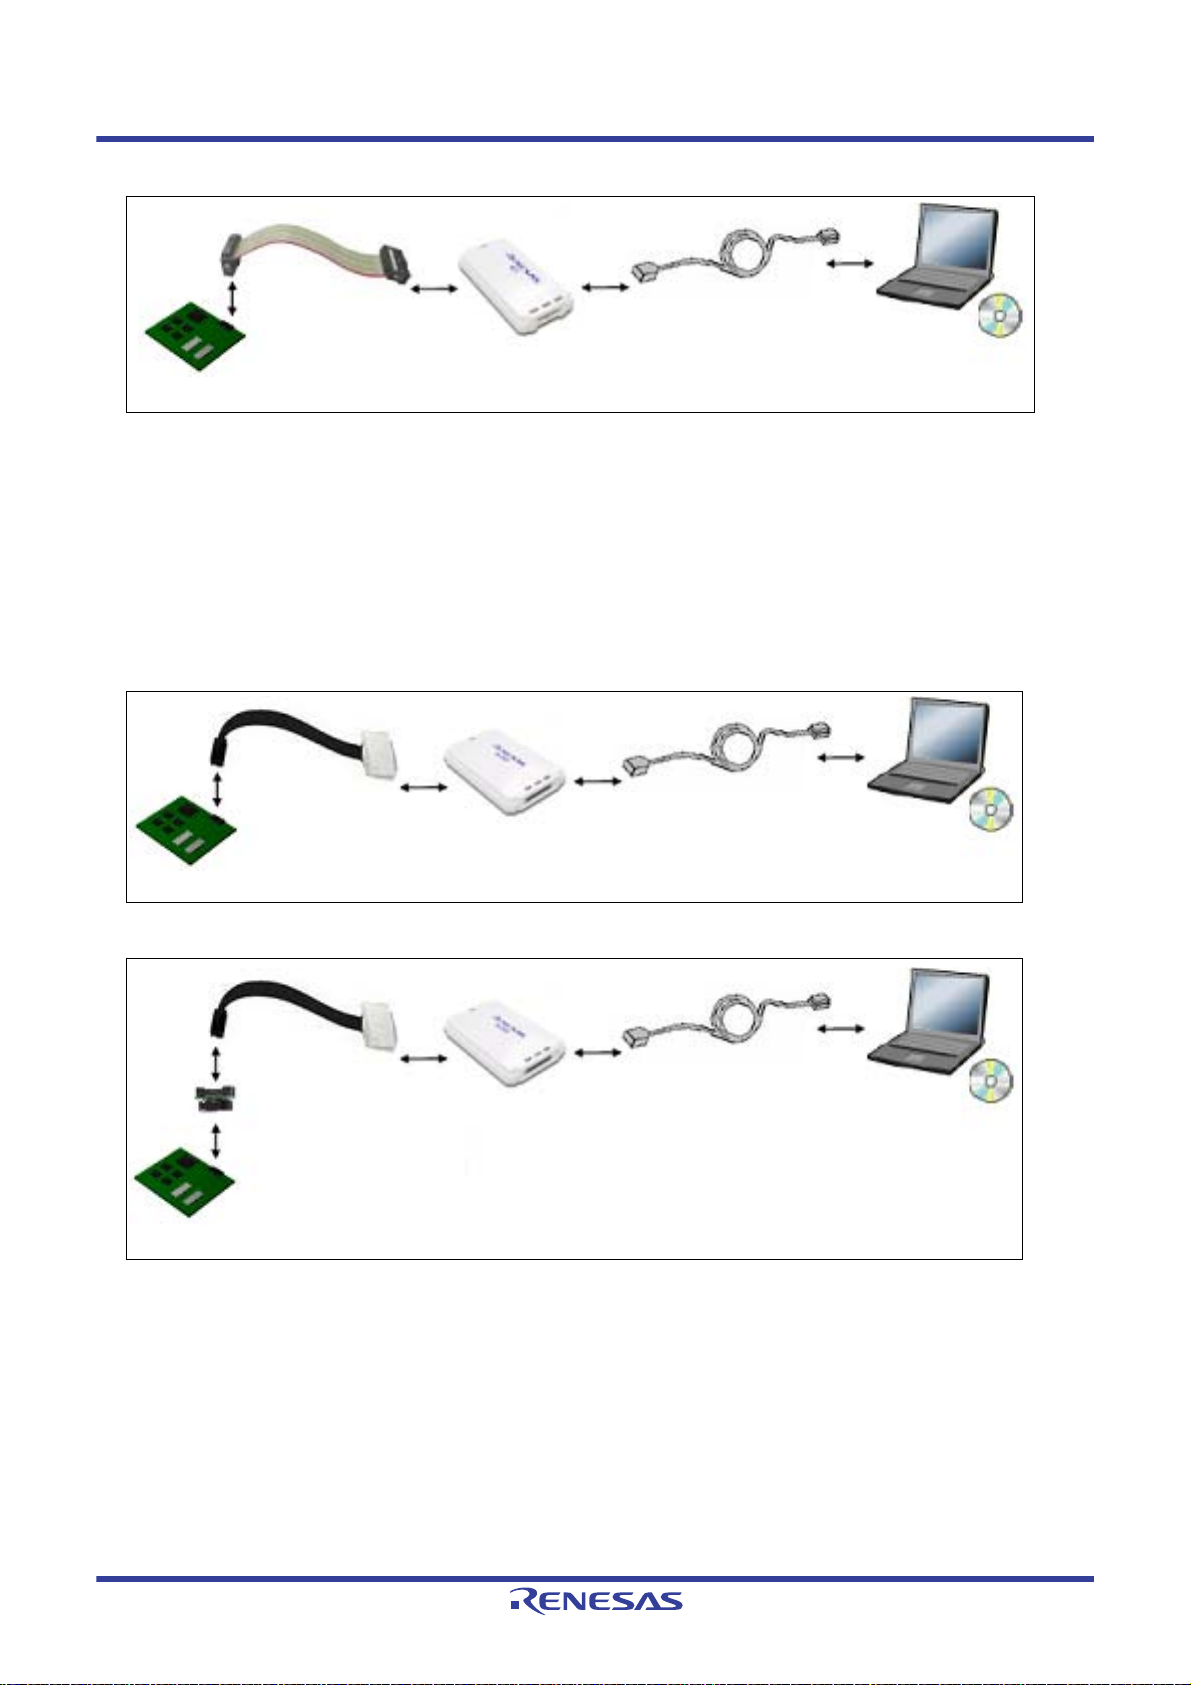
CS+ V8.03.00 2. FUNCTIONS
Target system
E1
USB interface cable
CS+
Host machine
Dedicated probe
Target system
E20
USB interface cable
CS+
Host machine
Dedicated probe
38-pin
Target system
E20
USB interface cable
CS+
Host machine
Dedicated probe
38-pin to 14-pin
conversion adapter
Note
Figure 2.1 Connection Example [E1]
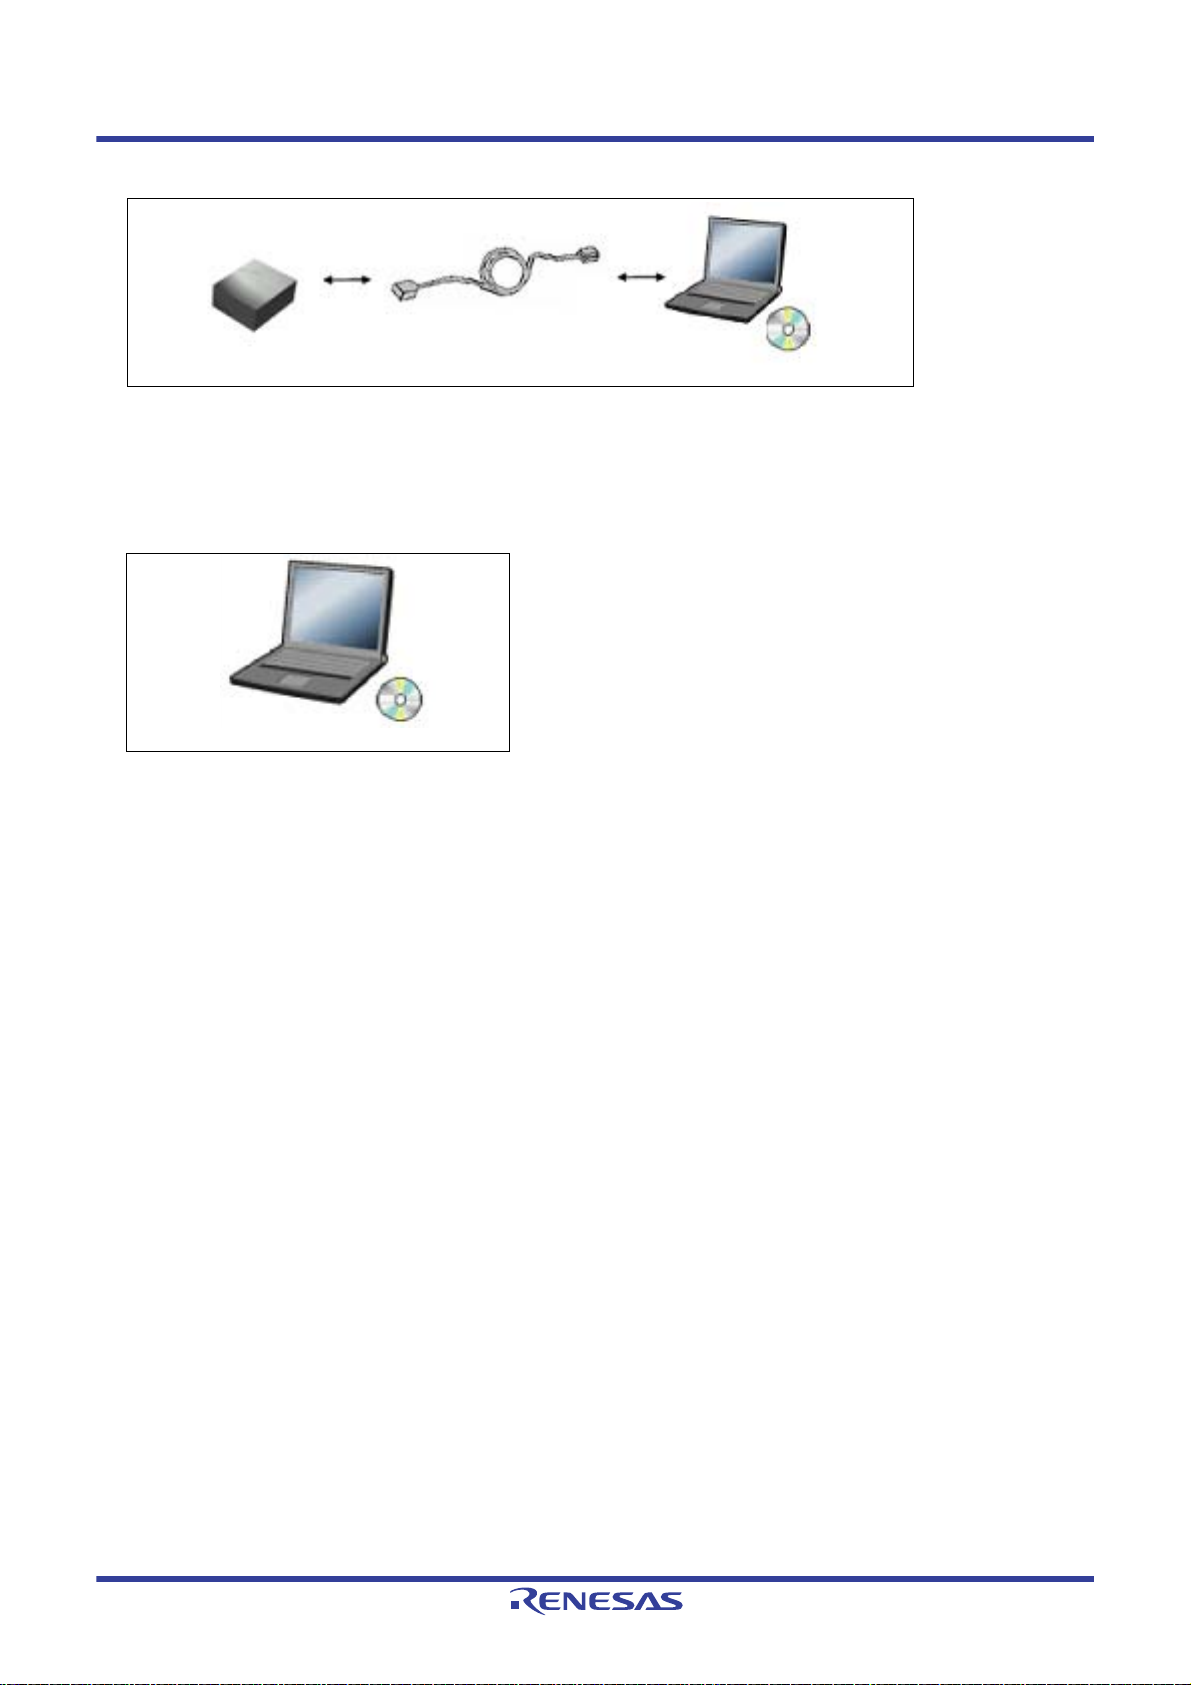
2.2.1.2 [E20]
Connect a host machine and E20. If required, connect a target board, too.
You can make a choice between FINE communications [E20(Serial)] and JTAG communications [E20(JTAG)] as the
communication method to the target system (see "2.3.1 Select the debug tool to use").
See E20 User's Manual for details on the connection method.
Figure 2.2 Connection Example [E20(JTAG)]
R20UT4588EJ0100 Rev.1.00 Page 14 of 423
Nov 01, 2019
Figure 2.3 Connection Example [E20(Serial)]
Note Use a 38-pin to 14-pin conversion adapter attached to the E20 emulator if you have selected FINE [E20
(Serial)] as the method of communication with the target system.
For more details on the connection using a 38-pin to 14-pin conversion adapter, see E20 User's Manual
2.2.1.3 [EZ Emulator]
Connect a host machine and EZ Emulator. If required, connect a target board, too.
See EZ Emulator User's Manual for details on the connection method.
Page 15
CS+ V8.03.00 2. FUNCTIONS
EZ Emulator
USB interface cable
CS+
Host machine
CS+
Host machine
Figure 2.4 Connection Example [EZ Emulator]
2.2.1.4 [Simulator]
A host machine is only needed for debugging (emulators are not needed).
Figure 2.5 Connection Example [Simulator]
R20UT4588EJ0100 Rev.1.00 Page 15 of 423
Nov 01, 2019
Page 16
CS+ V8.03.00 2. FUNCTIONS
2.3 Configuration of Operating Environment of the Debug Tool
This section describes the configuration of the operating environment for each debug tool.
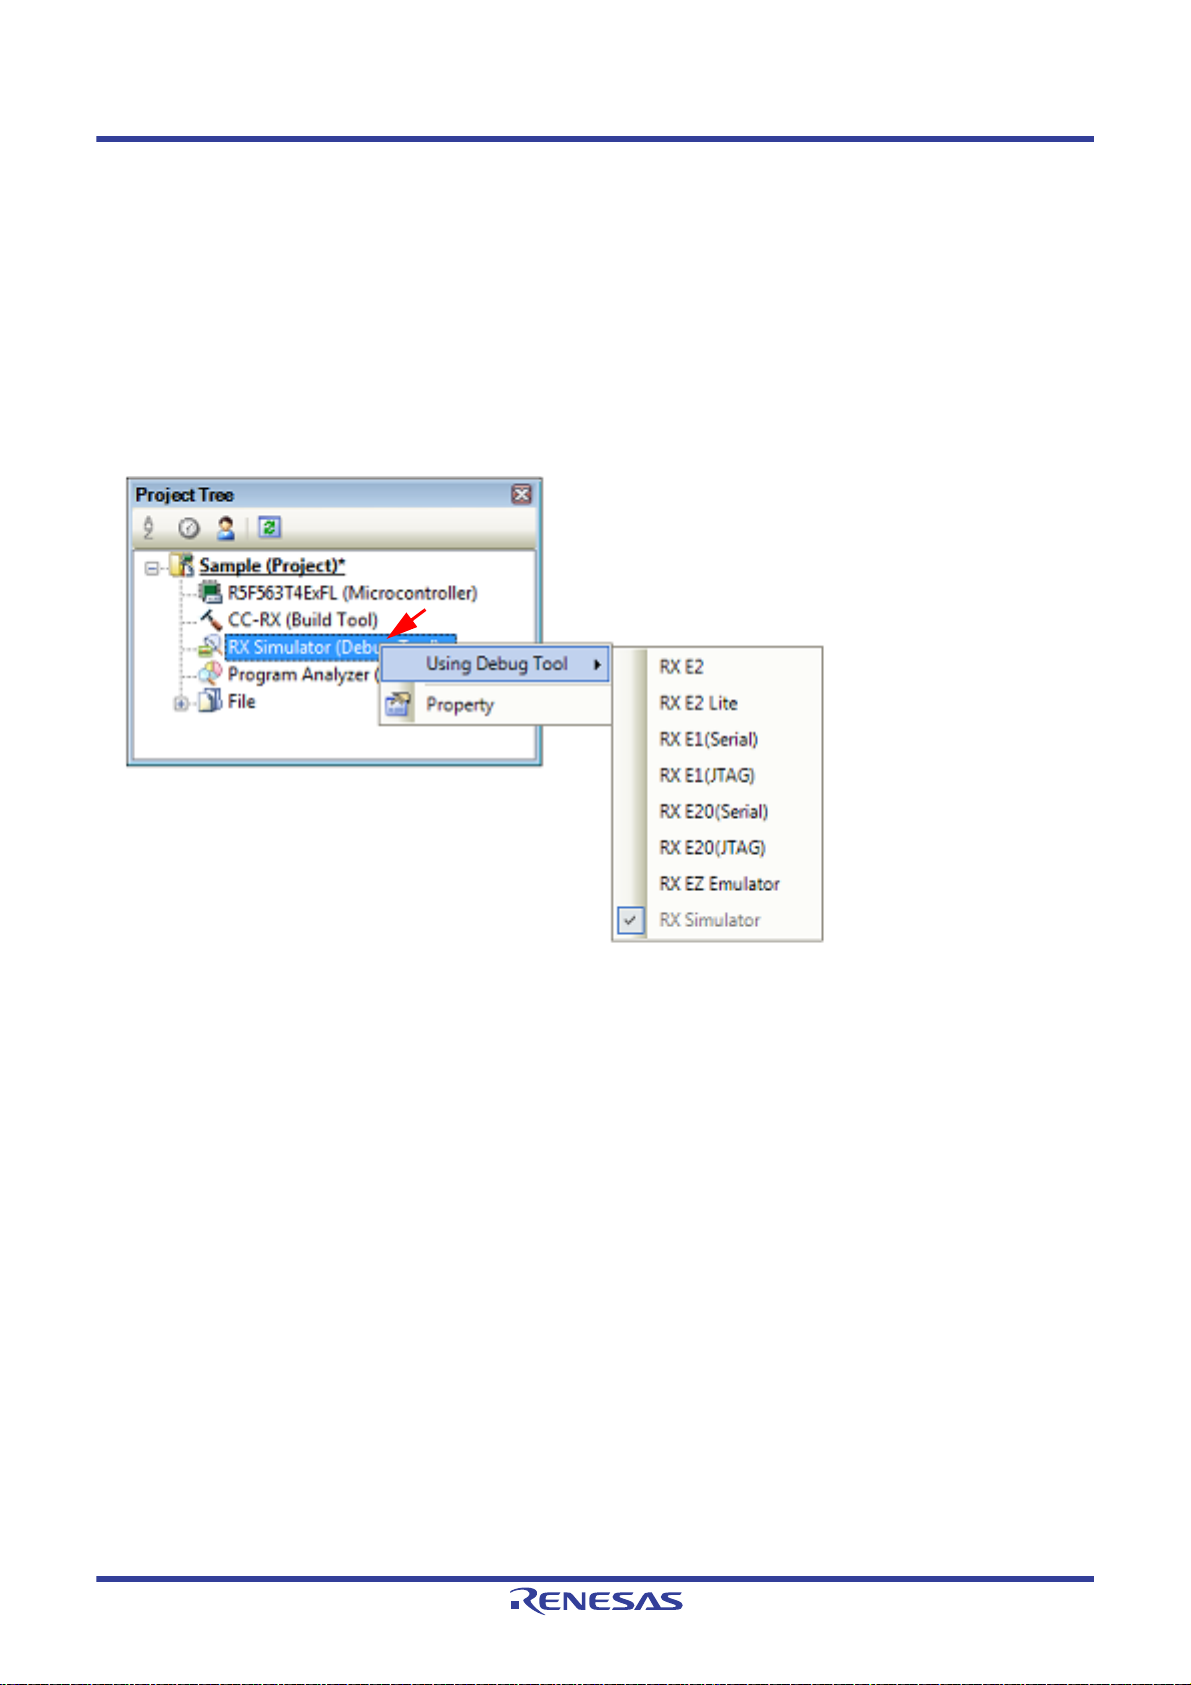
2.3.1 Select the debug tool to use
You can configure the operating environment in the Property panel corresponding to the debug tool to use.
Therefore, first, select the debug tool to be used in a project (the debug tool to be used can be specified in the individual
projects).
To select or switch the debug tool, use the context menu shown by right clicking on the [Microcontroller type Debug tool
name (Debug Tool)] node on the Project Tree panel.
Figure 2.6 Select/Switch Debug Tool to Use
Caution The context menu items displayed differ depending on the microcontroller selected in the project (see
"Table 2.1 Relationship between Types of Microcontroller and Connectable Debug Tools").
Remark 1. [E1] [E20]
Select [Microcontroller type E1(Serial)]/[Microcontroller type E20(Serial)] to perform FINE communications between E1/E20 and the target system.
Select [Microcontroller type E1(JTAG)]/[Microcontroller type E20(JTAG)] to perform JTAG communications between E1/E20 and the target system.
Remark 2. [EZ Emulator]
Only FINE is supported for communication between the EZ Emulator and the target system.
If the Property panel is already open, click the [Microcontroller type Debug tool name (Debug Tool)] node again. The
view switches to the Property panel of the selected debug tool.
If the Property panel is not open, double-click the above mentioned node to open the corresponding Property panel.
R20UT4588EJ0100 Rev.1.00 Page 16 of 423
Nov 01, 2019
Page 17
CS+ V8.03.00 2. FUNCTIONS
2.3.2 [E1]
Configure the operating environment on the Property panel below when using E1.
Note that the contents of the Property panel differ depending on the communication method (FINE communications
[E1(Serial)] or JTAG communications [E1(JTAG)]) between E1 and the target system.
Figure 2.7 Property Panel [E1(Serial)]
R20UT4588EJ0100 Rev.1.00 Page 17 of 423
Nov 01, 2019
Page 18
CS+ V8.03.00 2. FUNCTIONS
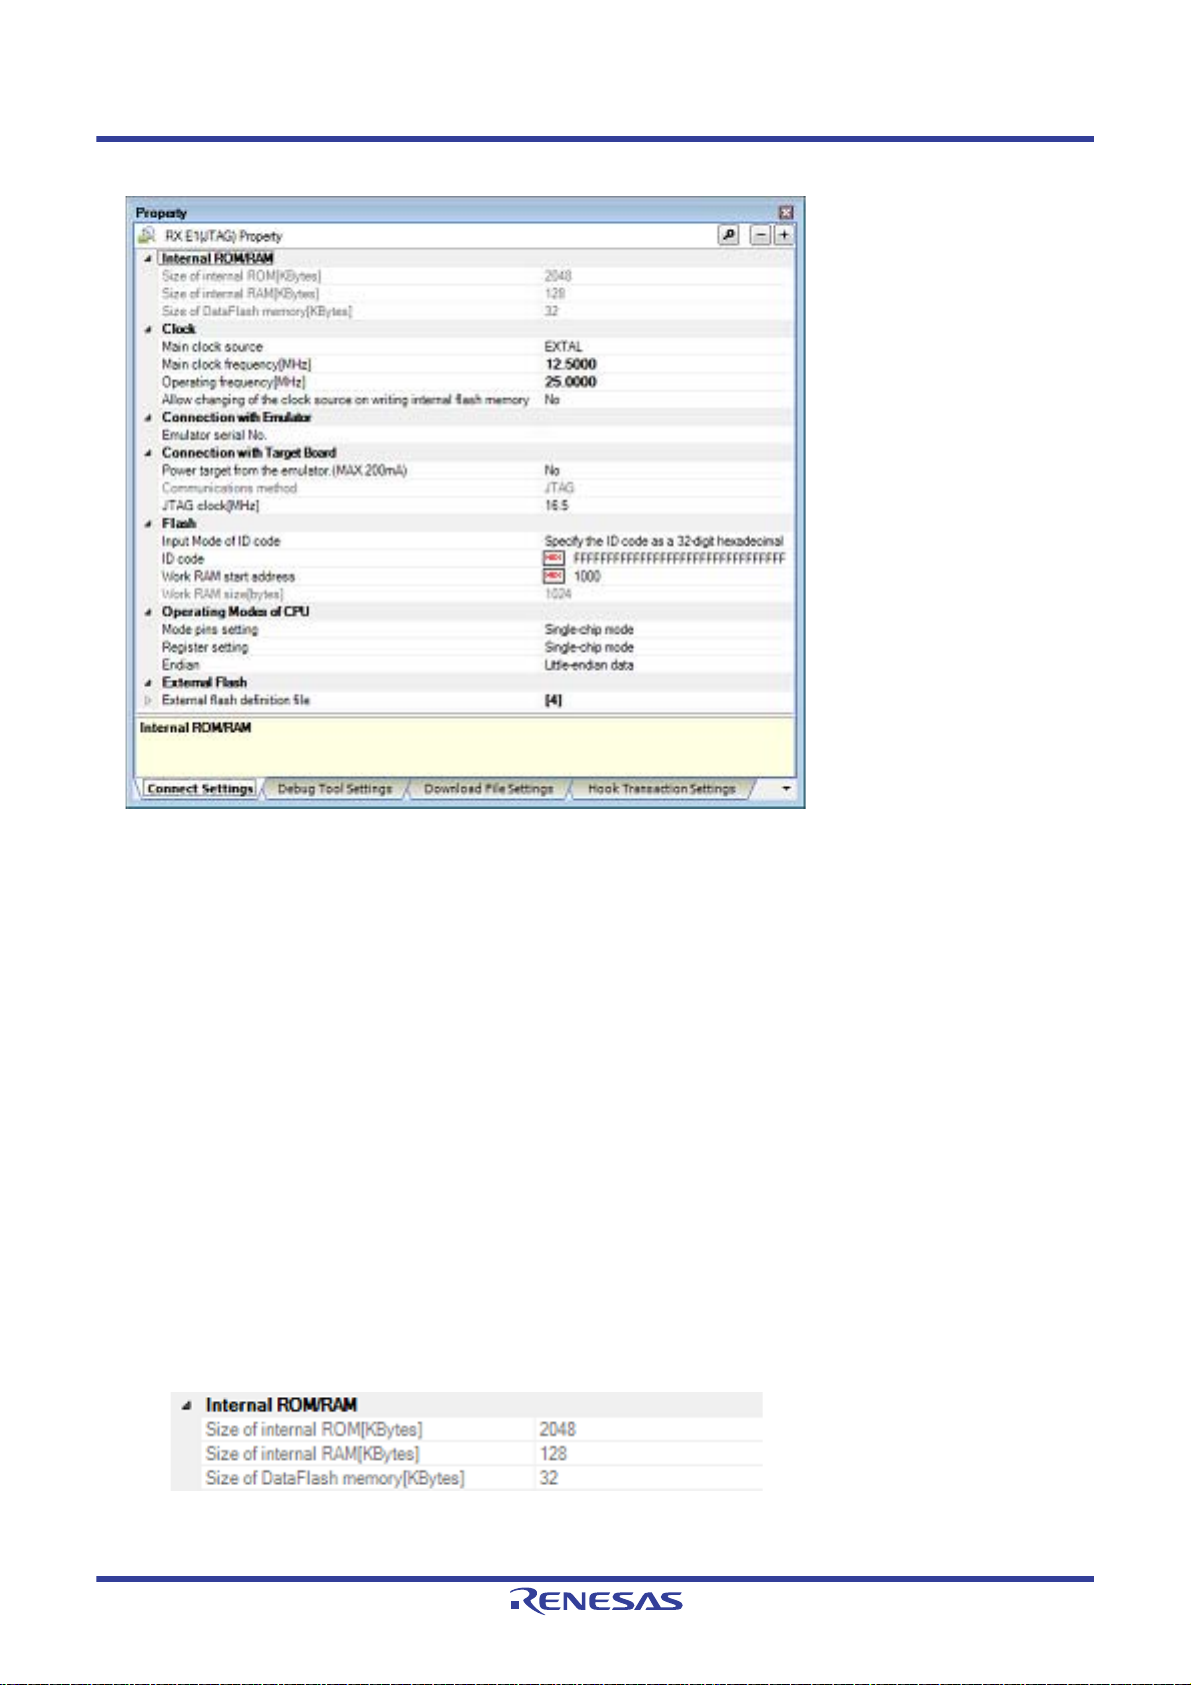
Figure 2.8 Property Panel [E1(JTAG)]
Follow the steps below by selecting the corresponding tab on the Property panel.
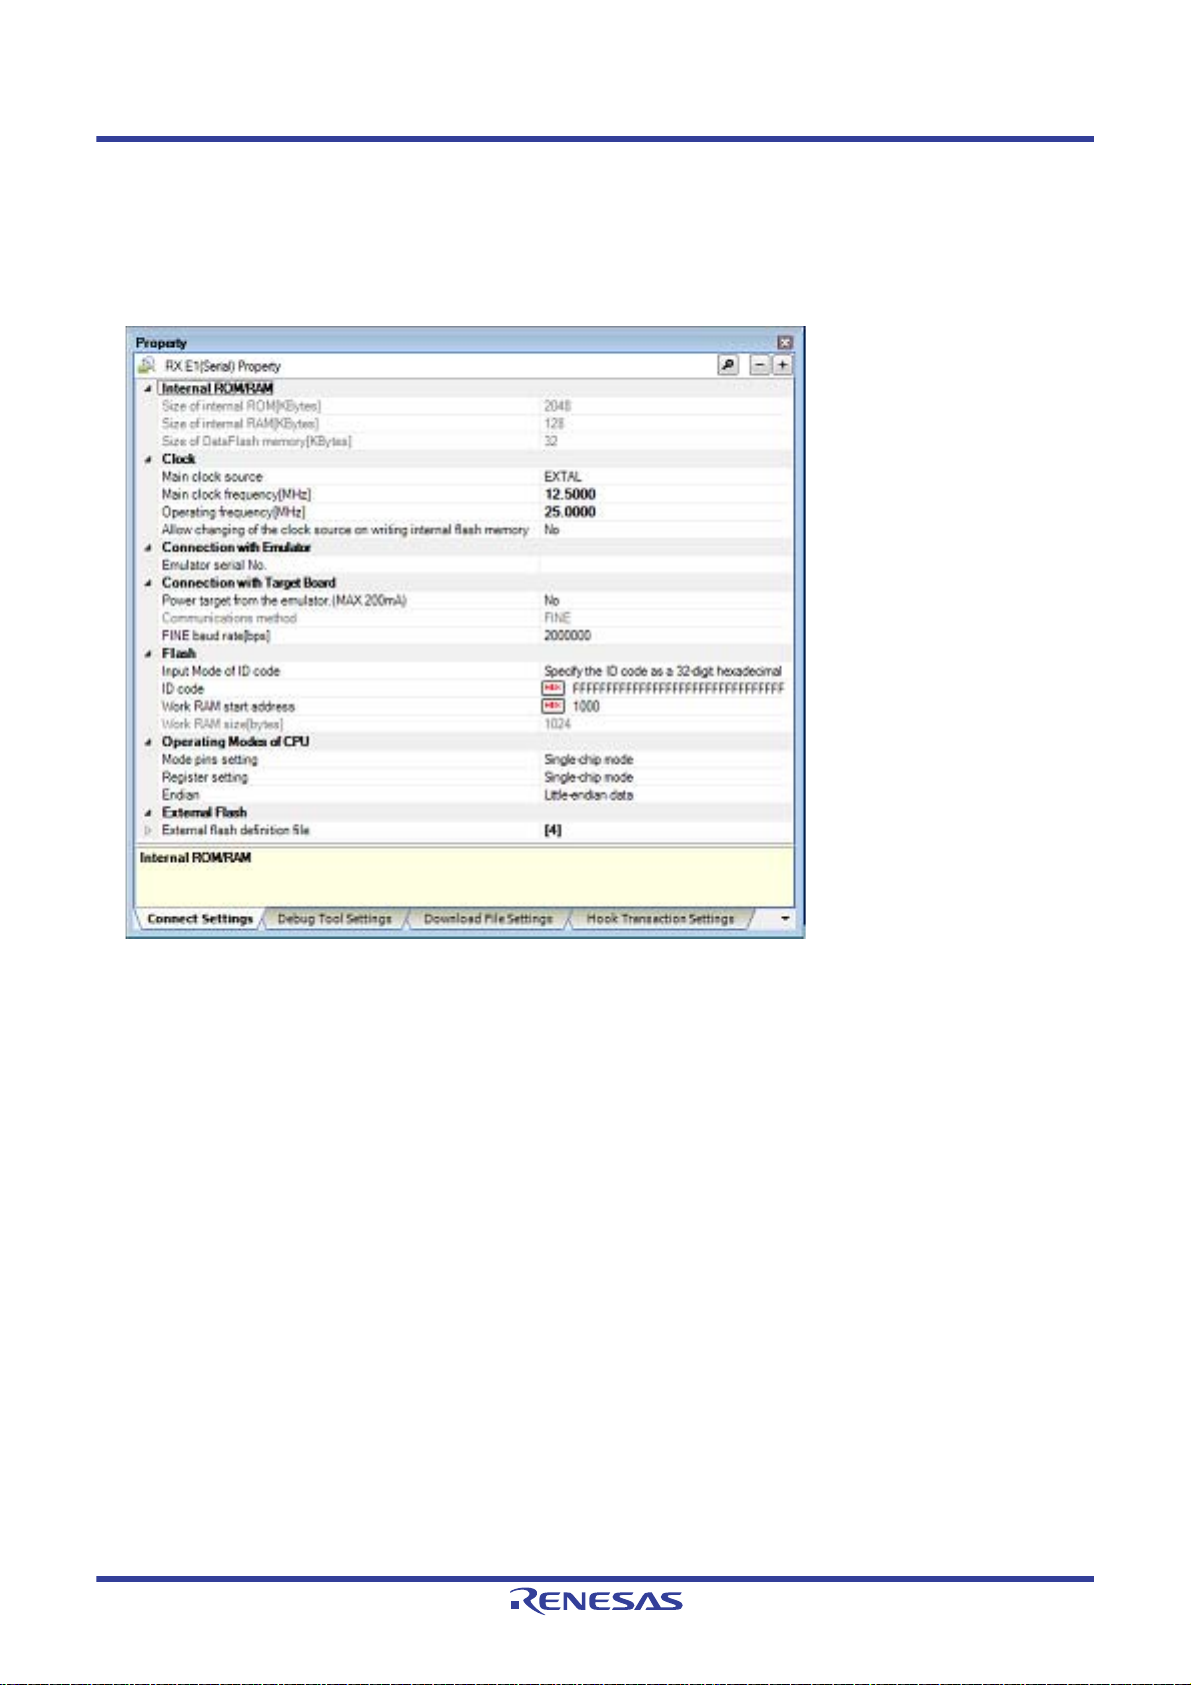
2.3.2.1 [Connect Settings] tab
2.3.2.2 [Debug Tool Settings] tab
2.3.2.3 [Download File Settings] tab
2.3.2.4 [Hook Transaction Settings] tab
2.3.2.1 [Connect Settings] tab
In the [Connect Settings] tab, you configure the connection with the debug tool for each one of the following categories.
(1) [Internal ROM/RAM]
(2) [Clock]
(3) [Connection with Emulator]
(4) [Connection with Target Board]
(5) [E2 Expansion Interface] [E2]
(6) [Flash]
(7) [Operating Modes of CPU]
(8) [External Flash]
(1) [Internal ROM/RAM]
The configuration of internal ROM/RAM is displayed in this category.
Figure 2.9 [Internal ROM/RAM] Category
(a) [Size of internal ROM[KBytes]
The internal ROM size to emulate is displayed (unit: Kbytes).
R20UT4588EJ0100 Rev.1.00 Page 18 of 423
Nov 01, 2019
Page 19
CS+ V8.03.00 2. FUNCTIONS
You cannot change the value of this property.
(b) [Size of internal RAM[Bytes]]
The internal RAM size to emulate is displayed (unit: bytes).
You cannot change the value of this property.
(c) [Size of DataFlash memory[KBytes]]
The data flash memory size is displayed (unit: Kbytes).
If the currently selected microcontroller does not incorporate the data flash, [0] is displayed.
You cannot change the value of this property.
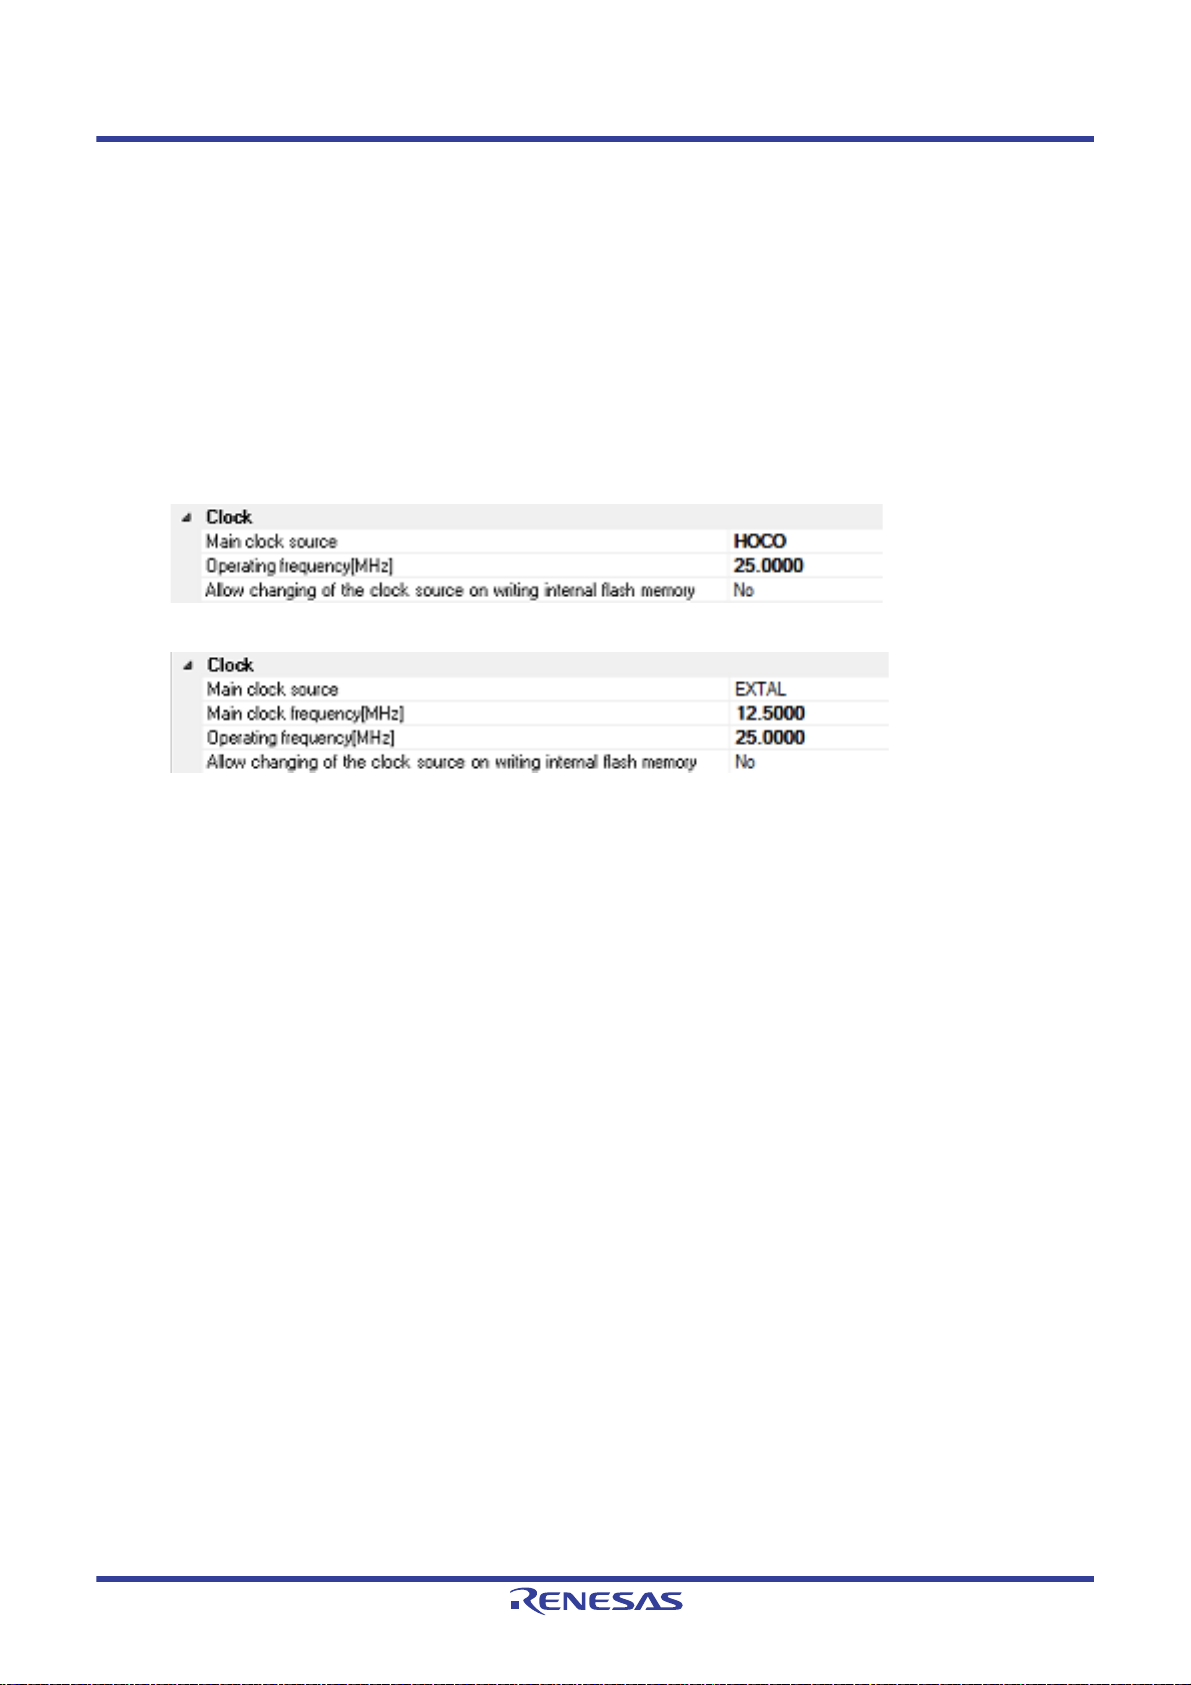
(2) [Clock]
You can configure the clock in this category.
Caution You cannot change the property in this category while connected to E1.
Figure 2.10 [Clock] Category [HOCO]
Figure 2.11 [Clock] Category [EXTAL]
(a) [Main clock source]
Select EXTAL frequency or internal HOCO as the main clock source. [EXTAL] will be displayed for microcontrollers with no internal HOCO.
(b) [Main clock frequency [MHz]]
Specify the main clock frequency (before multiplier).
Specify EXTAL frequency by directly entering a number between 0.0001 and 99.9999 (MHz). The entered value
will be truncated to 4 decimal places. If the value is out of the specifiable range, it will be rounded to 0.0001
(when 0 or below) or to 99.9999 (when 100 or above).
This property is displayed only when you have selected [EXTAL] in the [Main clock source] property.
(c) [Operating frequency [MHz]]
Specify the Operating frequency (ICLK) by directly entering a number between 0.0001 and 999.999 (MHz).
If the value is out of the specifiable range, it will be rounded to 0.0001 (if 0 or negative) or to 999.999 (if 1000 or
greater).
(d) [Allow changing of the clock source on writing internal flash memory]
Specify whether to allow a debugger to operate the clock while the internal flash memory is being rewritten.
Caution [E1]
When [Y es] is selected, if internal flash ROM is rewritten by the debugger while the FlashIF clock
(FCLK) of the microcontroller is outside of the guaranteed operating range (that is, while operating with LOCO or subclock), the E1 will switch the clock source. After rewriting to the internal
flash ROM is completed, the clock will be restored to the previous clock source.
Note that the operating frequency of the peripheral clock will change during internal flash memory rewriting because the clock source is switched.
The clock manipulation enabling setting takes effect when the internal flash ROM is rewritten
after program execution or step execution. Note that the clock source is forcibly switched regardless of the clock manipulation enabling setting if FCLK is outside of the guaranteed operating
range immediately after the debug tool is activated or when the [CPU Reset] button is clicked.
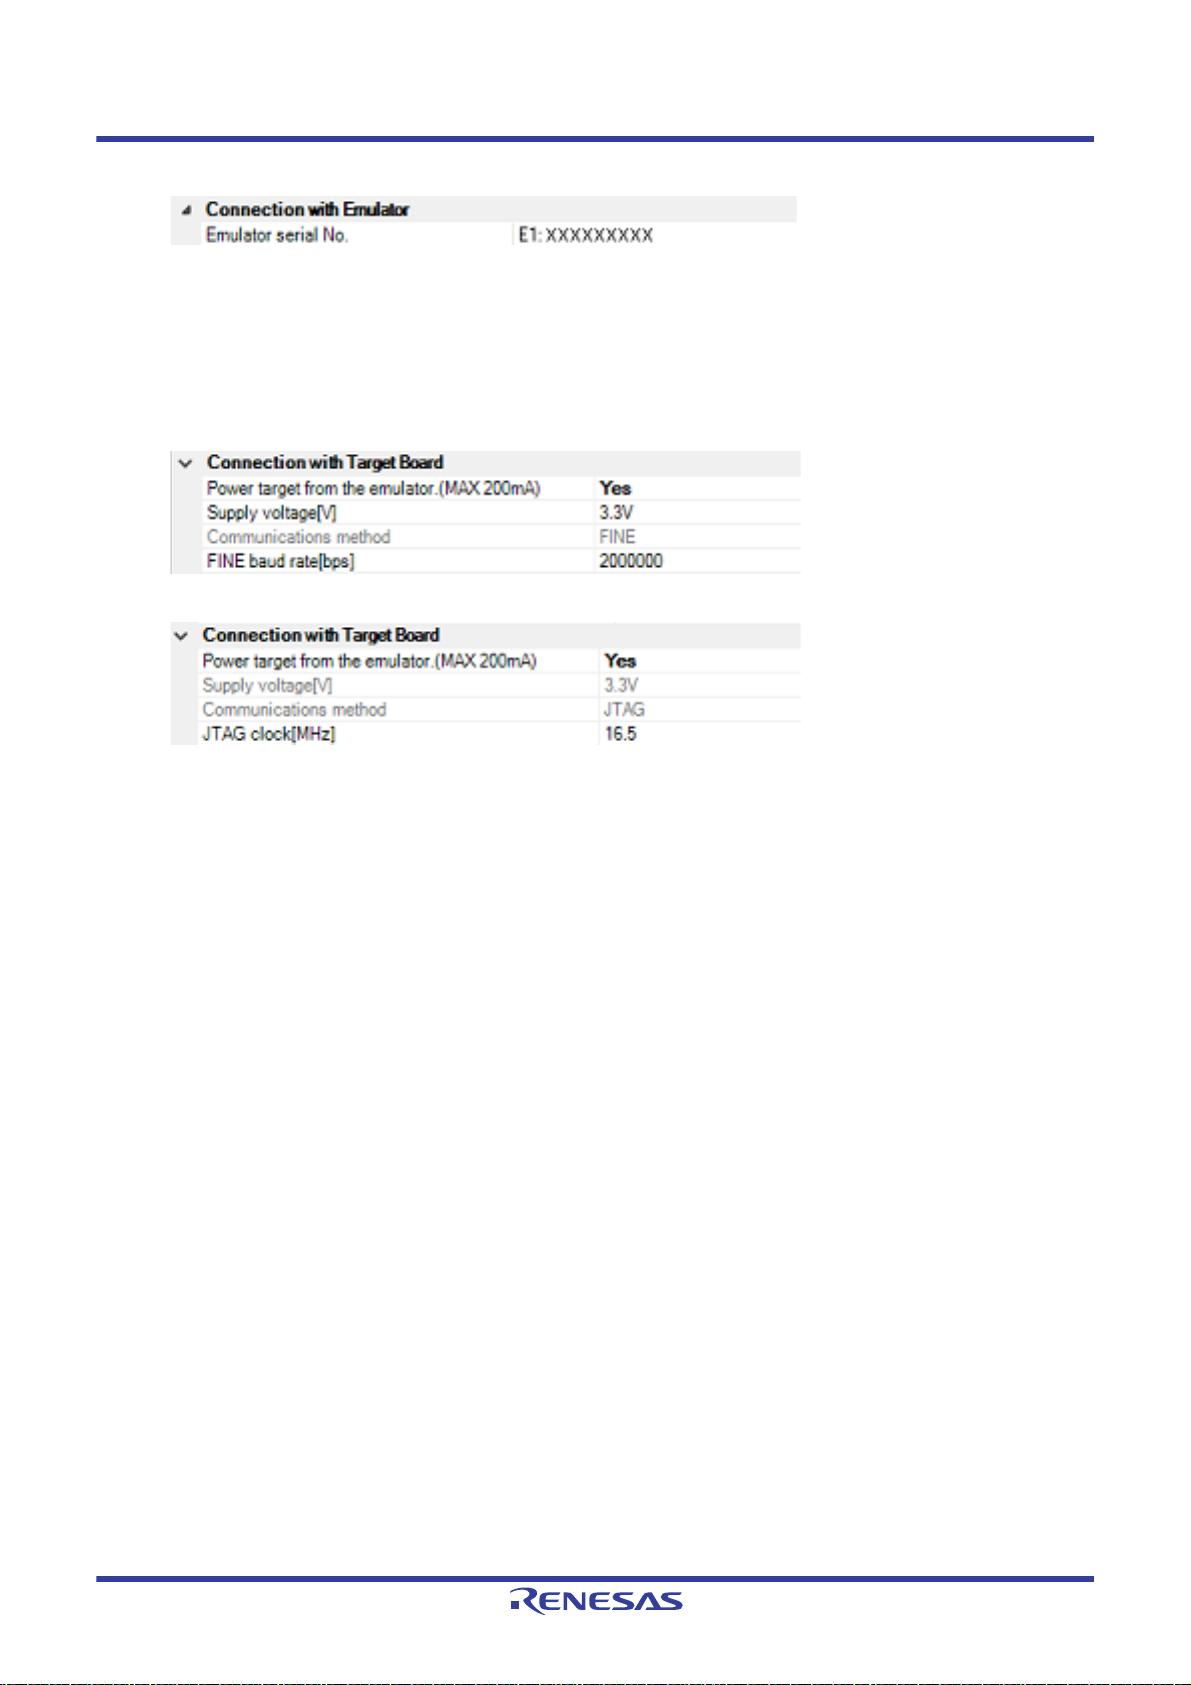
(3) [Connection with Emulator]
You can configure the connection between E1 and the host machine in this category.
Caution You cannot change the property in this category while connected to E1.
R20UT4588EJ0100 Rev.1.00 Page 19 of 423
Nov 01, 2019
Page 20
CS+ V8.03.00 2. FUNCTIONS
Figure 2.12 [Connection with Emulator] Category
(a) [Emulator serial No.]
Serial numbers of all connected E1 emulators are displayed in the drop-down list.
Select the one to be connected to the target system.
The drop-down list is updated every time it is used.
(4) [Connection with Target Board]
You can configure the connection between E1 and the target board in this category.
Figure 2.13 [Connection with Target Board] Category [E1(Serial)]
Figure 2.14 [Connection with Target Board] Category [E1(JTAG)]
(a) [Power target from the emulator. (MAX 200mA)]
Specify whether to supply power to the target system from E1.
Select [Yes] to supply power to the target system ([No] is selected by default).
Caution This property cannot be changed while connected to E1.
(b) [Interface for supplying the power] [E2]
This property appears only when the [Power target from the emulator. (MAX 200mA)] property is set to [Yes].
Select the interface for supplying the power to the target board from the emulator (default: [USER I/F]).
(c) [Supply voltage]
Specify the power voltage supplied to the target system from the following drop-down list.
This property appears only when the [Power target from the emulator. (MAX 200mA)] property is set to [Yes].
The voltage value that can be specified differs depending on the type of the microcontroller.
Caution [E1]
This property cannot be changed while connected to E1.
[E2 Lite]
This property cannot be changed.
(d) [Communications method]
Displays the method of communication used by the E1 emulator for communicating with the microcontroller on
the target system. Specifying [RX E1(Serial)] for a debug tool in the Project Tree panel will display [FINE] in this
property, and specifying [RX E1(JTAG)] will display [JTAG].
You cannot change the value of this property when specifying E1. When specifying [RX E2 Lite] or [RX E2],
whether this property can be changed differs with the type of the selected microcontroller and the communication method. See "2.2.1 Confirm the connection to a host machine" for the relationship between types of the
microcontroller and the communication method.
For the details of debug tool selection, see "2.3.1 Select the debug tool to use".
(e) [JTAG clock[MHz]]
From the drop-down list, select the baud rate (JTAG clock) to be used by the E1 emulator for communicating
with the microcontroller on the target system.
This property is displayed only when [JTAG] is selected in the [Communications method] property.
The following baud rate is displayed in the drop-down list.
- 16.5 (default), 12.38, 6.188, 3.094, 1.547 [E1]
- 6.00 (default), 3.00, 1.50 [E2 Lite]
- 16.5 (default), 12.5, 6.25, 3.125, 1.562 [E2]
R20UT4588EJ0100 Rev.1.00 Page 20 of 423
Nov 01, 2019
Page 21
CS+ V8.03.00 2. FUNCTIONS
Caution 1. This property cannot be changed while connected to E1.
Caution 2. Depending on the length or the method of JTAG signal wiring on the target system, it may not be
possible to communicate using the selected JTAG clock. In such a case, reducing the JTAG
clock may achieve successful communication.
(f) [FINE baud rate[bps]]
From the drop-down list, select the baud rate (FINE baud rate) to be used by the E1 emulator for communicating
with the microcontroller on the target system.
This property is displayed only when [FINE] is selected in the [Communications method] property.
The following baud rate is displayed in the drop-down list.
- 2000000 (default), 750000, 500000, 250000 [E1][E2]
- 1500000 (default), 750000, 500000, 250000 [E2 Lite]
Caution 1. This property cannot be changed while connected to E1.
Caution 2. Depending on the length or the method of FINE signal wiring on the target system, it may not be
possible to communicate using the selected FINE baud rate. In such a case, reducing the FINE
baud rate achieve successful communication.
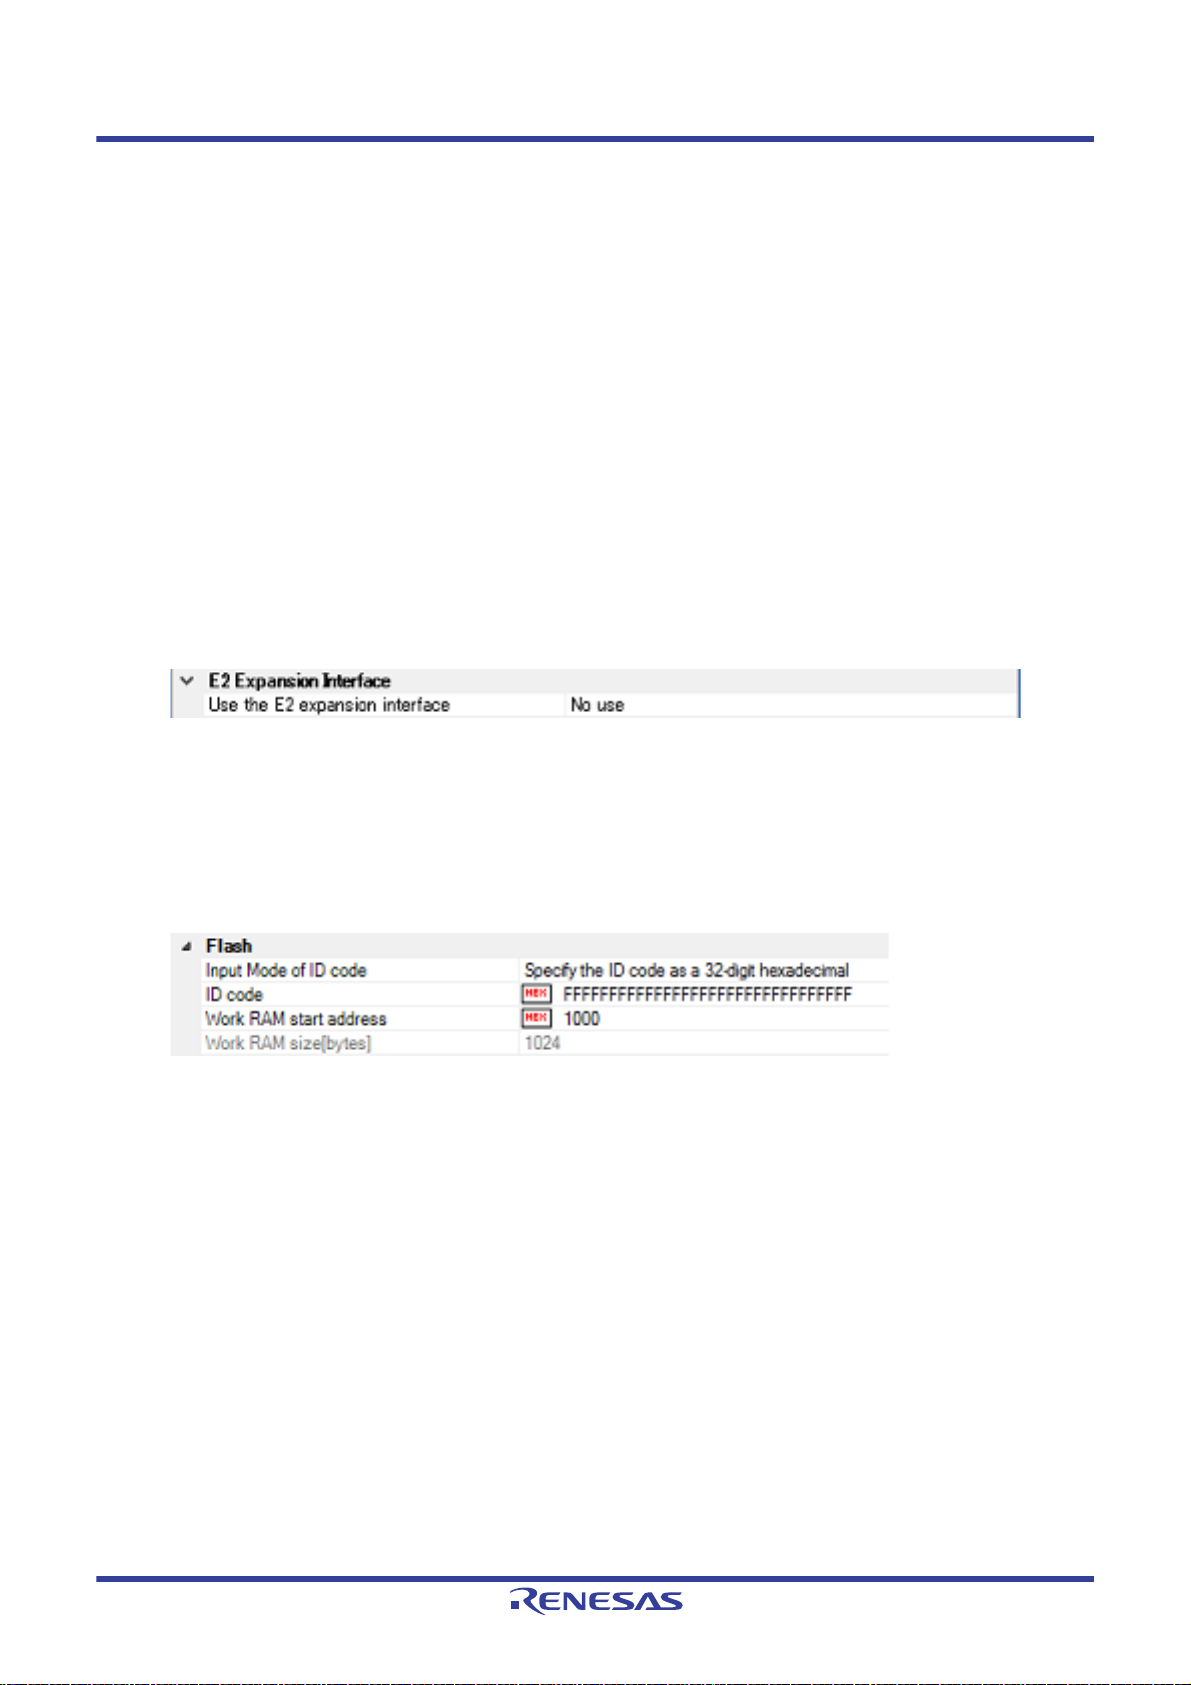
(5) [E2 Expansion Interface] [E2]
You can configure the E2 expansion interface.
Figure 2.15 [E2 Expansion Interface] Category [E2]
(a) [Interface for supplying the power]
Select whether to use the E2 expansion interface.
If you want to use the E2 expansion interface, select the power used by the E2 expansion interface.
(6) [Flash]
You can configure the flash memory rewriting in this category.
Caution This property cannot be changed while connected to E1.
Figure 2.16 [Flash] Category
(a) [Input Mode of ID code]
Specify a mode for the input of ID code.
Caution This property cannot be changed while connected to E1.
(b) [ID code]
Enter the ID code to release the flash memory from the protected state.
If you have selected [Specify the ID code as a 32-digit hexadecimal] in the [Input Mode of ID code] property,
enter the ID code in a 32-digit hexadecimal number. If you have selected [Specify the ID code as an ASCII code
within 16 characters], enter the ID code using maximum 16 ASCII characters.
Caution 1. This property cannot be changed while connected to E1.
Caution 2. To enter the ID code as a 32-digit hexadecimal value, arrange it as a sequence of 32-bit units of
data.
Byte order of the ID code of the flash programmer can be different from that of CS+. Please confirm the specification about ID code of the flash programmer you’re using.
Caution 3. If the ID code entered in ASCII characters is shorter than 16 characters, the unused space will be
padded with 0.
Caution 4. Even if you have downloaded a program that contains an ID code, that ID code is replaced with
FFFFFFFFFFFFFFFFFFFFFFFFFFFFFFFF.
R20UT4588EJ0100 Rev.1.00 Page 21 of 423
Nov 01, 2019
Page 22
CS+ V8.03.00 2. FUNCTIONS
(c) [Work RAM start address]
Specify the location address of the work RAM to be used by the debugger. Specify an address value that is a
multiple of four bytes. If the entered value is not a multiple of four bytes, the value is automatically corrected.
The amount of memory indicated by the [Work RAM size[bytes] property beginning with this address is to be
used by the debugger firmware.
Caution 1. This property cannot be changed while connected to E1.
Caution 2. The work RAM area can also be used by the user program because the emulator saves and
restores data in this area. Note, however, that the work RAM area is not specifiable as:
the destination or origin of a DMA or DTC transfer, an address where a DTC vector table or transfer information is to be allocated, or the interrupt vector for a DMAC or DTC activation source.
(d) [Work RAM size[bytes]
Displays the size of the work RAM to be used by the debugger.
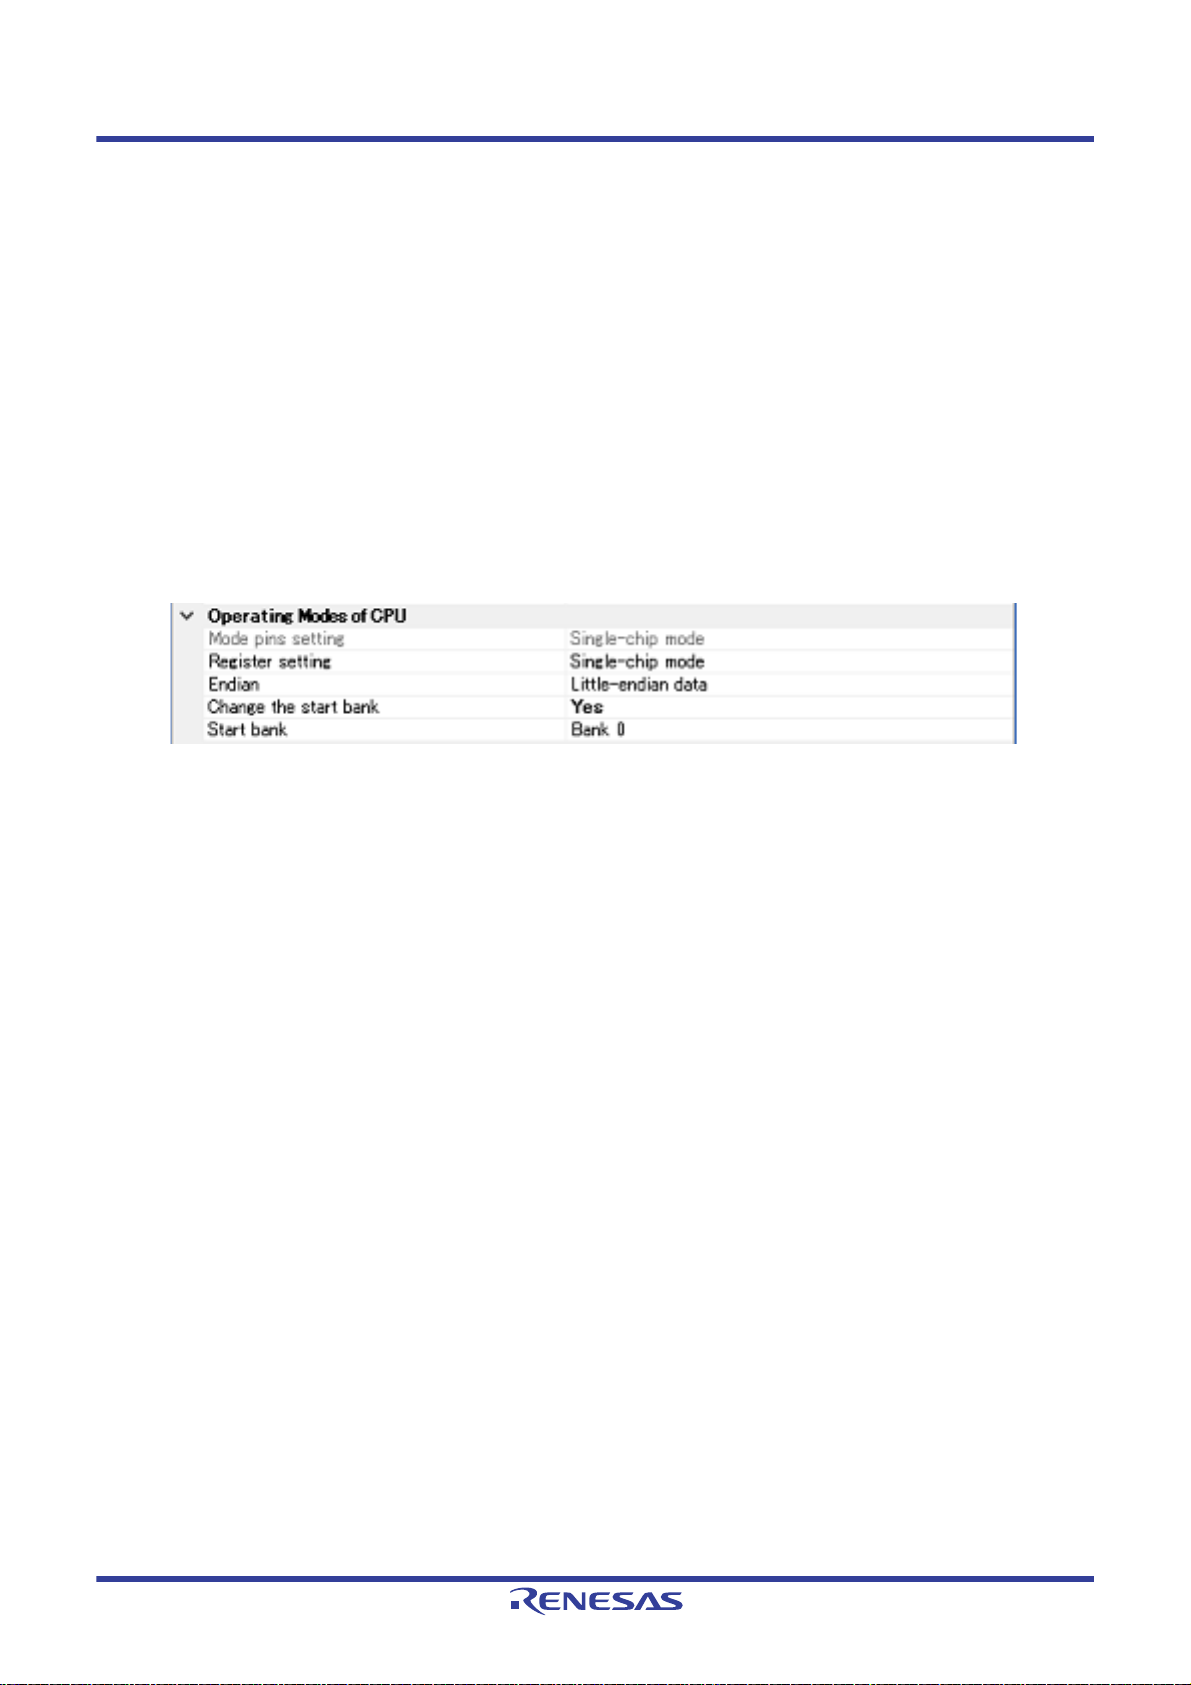
(7) [Operating Modes of CPU]
In this category, you configure the operating mode of the microcontroller to be emulated.
Caution This property cannot be changed while connected to E1.
Figure 2.17 [Operating Modes of CPU] Category
(a) [Mode pins setting]
Specify the operating mode set by the mode pin of the microcontroller.
(b) [Allow erasing the USB boot program]
Select whether to erase the USB boot program in the user boot area when you are starting up the emulator in
the user boot mode by using a microcontroller in which the USB boot program is stored.
This property is displayed only when [User boot mode] is selected for the [Mode pins setting] property.
Note that this is not displayed for an microcontroller in which the USB boot program in the user boot area does
not need to be erased when you are starting up the emulator.
(c) [Register setting]
Specify the operating mode to be set by the register.
The operating mode that can be speci fi e d d epends on the type of the microcontroller.
(d) [Endian]
Display the project endian. Acquires endian information from the project and displays its value. Can be selected
only when the debug tool is disconnected.
(e) [Change the start bank][RX651-2M, RX65N-2M, RX72M, RX66N, and RX72N Groups]
Specify whether to change the start bank before connecting to the debug tool.
Select [Yes] to change the start bank before connecting to the debug tool ([No] is selected by default).
(f) [Start bank][RX651-2M, RX65N-2M, RX72M, RX66N, and RX72N Groups]
Specify the start bank to be changed before connecting to the debug tool.
This property is displayed only when [Yes] is selected for the [Change the start bank][RX651-2M, RX65N-2M,
RX72M, RX66N, and RX72N Groups] property.
(8) [External Flash]
In this category, you can configure external flash.
The settings in this category are required when downloading to an external flash memory . For more details regarding property setting, see "2.5.2.5 Downloading files to external flash memory [E1] [E20]“.
Caution You cannot change the property in this category while connected to E1.
R20UT4588EJ0100 Rev.1.00 Page 22 of 423
Nov 01, 2019
Page 23
CS+ V8.03.00 2. FUNCTIONS
2.3.2.2 [Debug Tool Settings] tab
In the [Debug Tool Settings] tab, you configure the basic settings of the debug tool for each one of the following catego-
ries.
(1) [Memory]
(2) [Access Memory While Running]
(3) [Register]
(4) [E2 Expansion Interface] [E2]
(5) [Break]
(6) [System]
(7) [Trace]
(8) [Timer] [RX600, RX700 series]
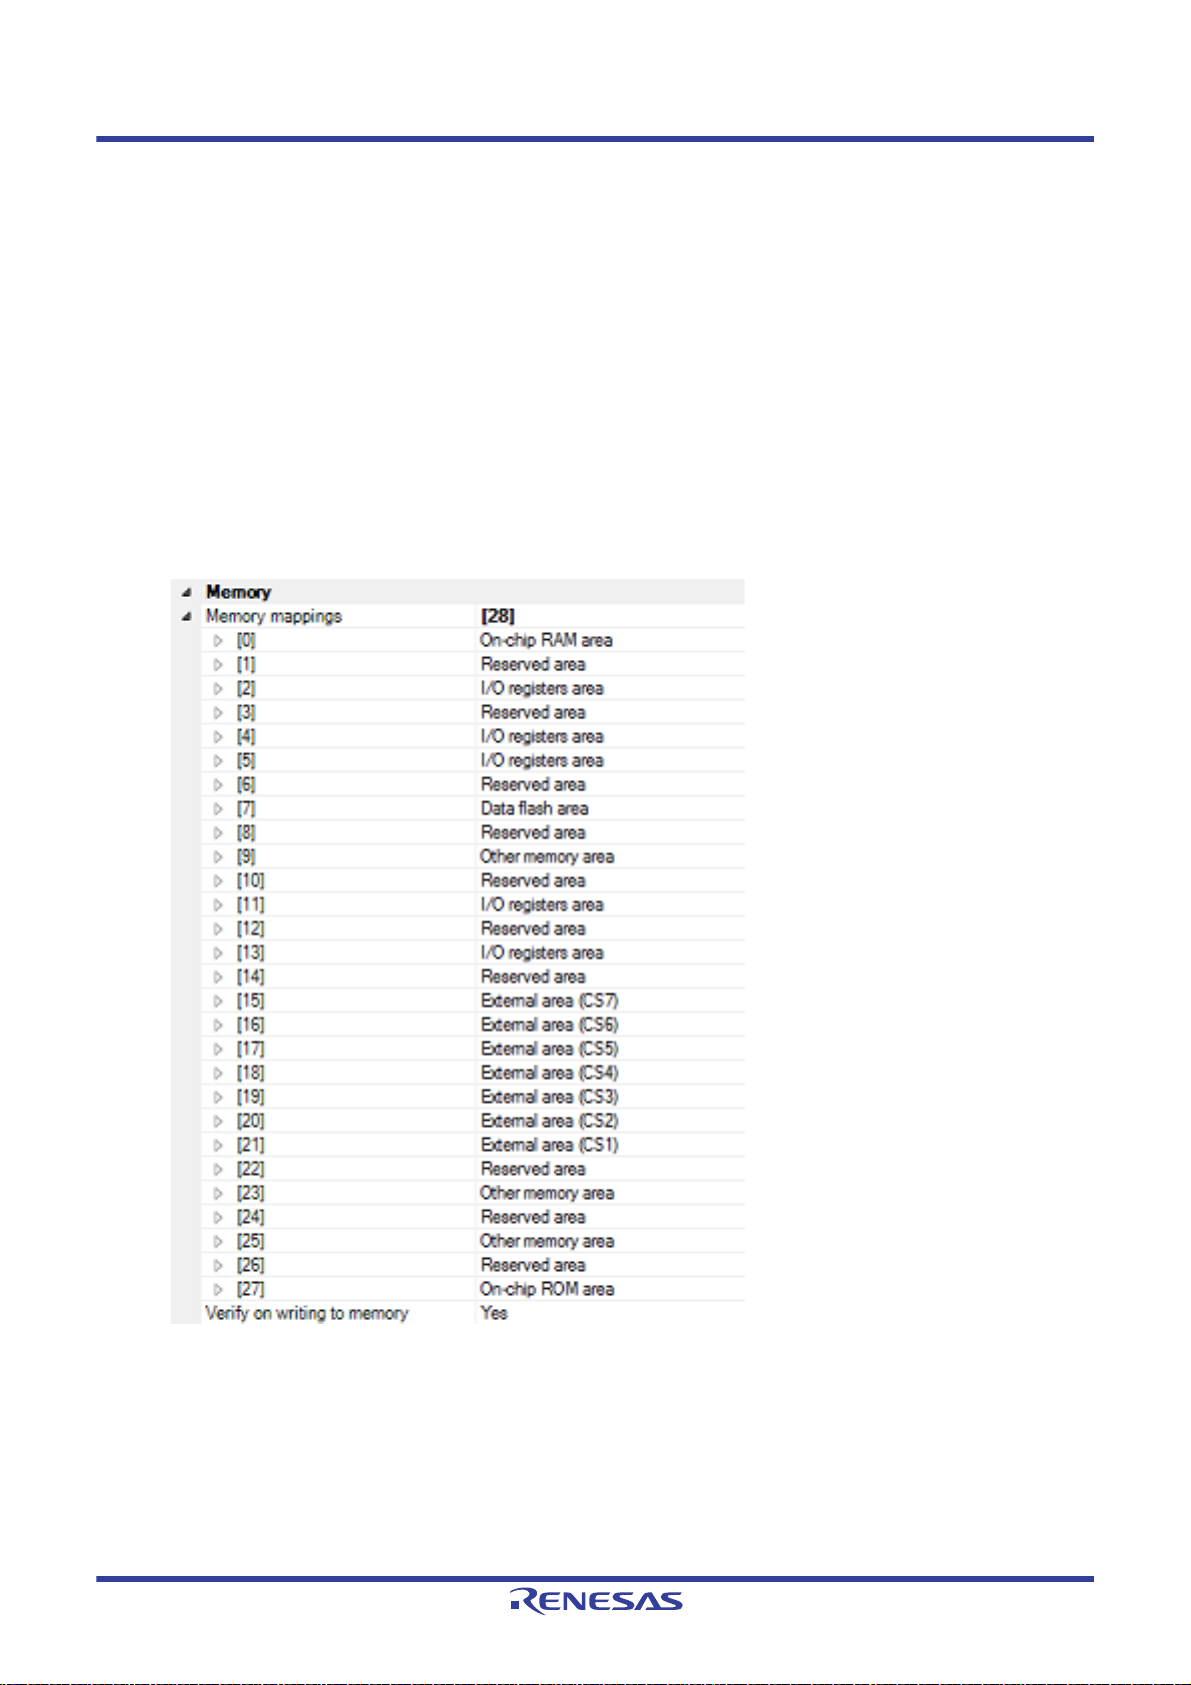
(1) [Memory]
You can configure the memory in this category.
Figure 2.18 [Memory] Category
(a) [Memory mappings]
Current memory mapping status is displayed for each type of memory area.
It is not possible to change mapping on this panel.
To add or delete an I/O protection area, select the [Memory mappings] property and click on the [...] button that
appears on the right to open the Memory Mapping dialog box. For details on how to change settings, refer to the
section of the Memory Mapping dialog box.
This property displays only the number of memory areas.
Expanding the [Memory mappings] property will display the following sub-items.
R20UT4588EJ0100 Rev.1.00 Page 23 of 423
Nov 01, 2019
Page 24

CS+ V8.03.00 2. FUNCTIONS
- [Memory type]
Indicates the memory type of the corresponding area.
Each memory type corresponds to the following areas.
On-chip ROM area Program ROM
On-chip RAM area On-chip RAM
Note 1
and data flash
Note 4
I/O registers area Peripheral I/O register
Divided into areas with different endians for display
External area(CS7/CS6/.../CS0) External address space
CS0 to CS7 are displayed separa te ly
Other memory area FCU-RAM
Note 3
, FCU firmware
Reserved area Areas other than those listed above
I/O protection area Address range in an external area that is not read by the
debugger. Register this area in the Memory Mapping dialog
box.
Note 1. If data in the on-chip flash ROM area is changed by means other than downloading (e.g. by
manipulating it via the Memory panel or line assembling), the flash ROM reflects this change
next time the user program is run.
Note 2. If an attempt is made to reference data in erased data flash ROM, only undefined values are
displayed due to the specifications of the microcontroller. If the debugger is used to write to the
data flash ROM, on the othe r h an d , data is written in 256-byte units. Written areas do not hold
undefined values.
Note 3. Do not use the debugger to write to FCU-RAM. The FCU firmware area also cannot be written
by the debugger.
Note 4. The area including the option setting memory areas listed below is displayed as an on-chip
RAM area. Note that values cannot be specified in this area through the memory panel.
Note 3
Note 2
, user boot
[RX71M, RX66x, RX65x, RX64M, and RX72T Groups]
- S PCC Serial Programmer Command Control Reg.
- OSIS OCD/Serial Programmer ID Setting Reg.
- E ndian select registers (MDE)
- Option function select register 0 (OFS0)
- Option function select register 1 (OFS1)
[RX65N-2M, RX651-2M, RX72M, RX66N, and RX72N]
- S PCC Serial Programmer Command Control Reg.
- OSIS OCD/Serial Programmer ID Setting Reg.
- E ndian select registers (MDE)
- Option function select register 0 (OFS0)
- Option function select register 1 (OFS1)
- Bank Select Register (BANKSEL)
- Flash Access Window Setting Register (F AW)
- [Start address]
Displays the starting address of the corresponding area.
- [End address]
Displays the ending address of the corresponding area.
- [Access width[bits]]
Displays the access width of the corresponding area.
R20UT4588EJ0100 Rev.1.00 Page 24 of 423
Nov 01, 2019
Page 25
CS+ V8.03.00 2. FUNCTIONS
When [Memory type] is an external area, the access width can only be changed when the debug tool is disconnected.
- [Endian]
Displays the endians of the external area and the I/O register area.
When [Memory type] is an external area, the endian can only be changed when the debug tool is disconnected.
Caution Connecting to a debug tool (see "2.4.1 Connect the debug tool to CS+") will display details for
each memory type.
(b) [Verify on writing to memory]
Specify whether to perform a verify check when the memory value is initialized from the drop-down list.
Select [Yes] to perform verification after download or when values are changed in the Watch panel/ Memory
panel.
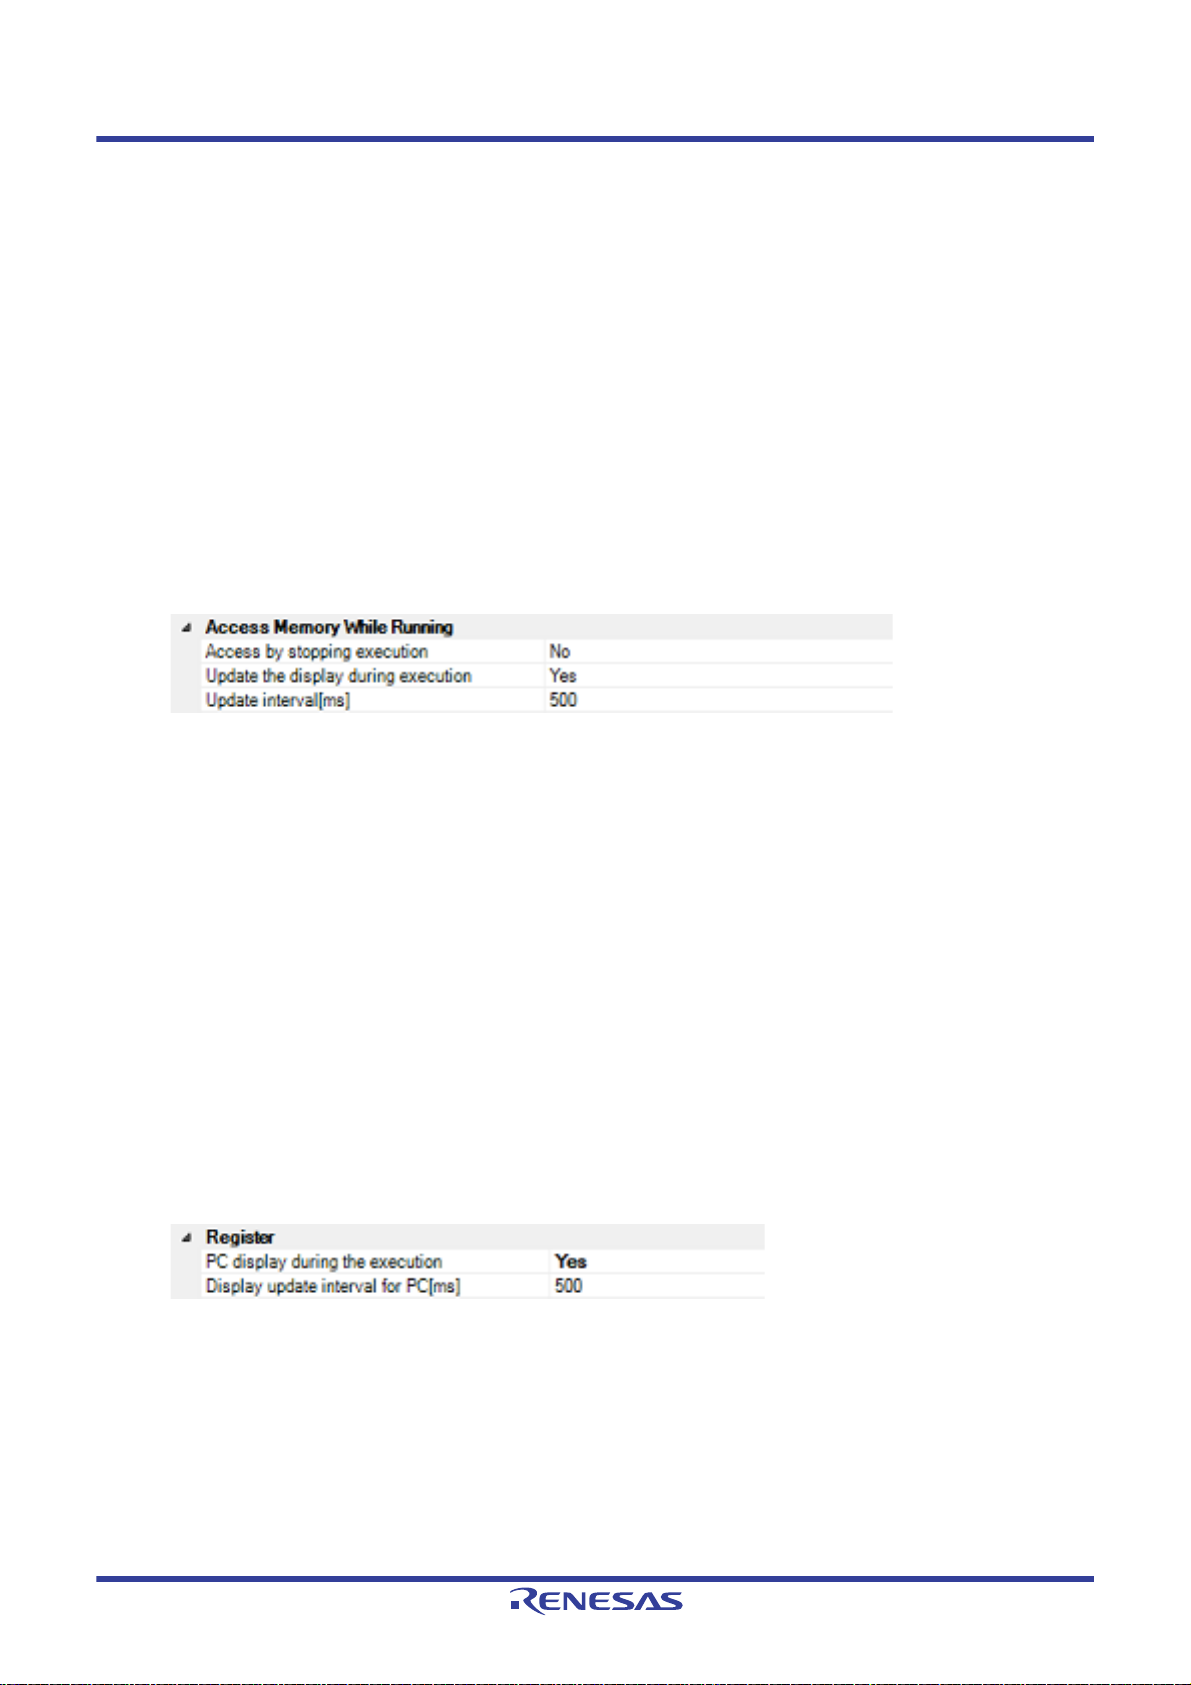
(2) [Access Memory While Running]
You can configure the memory access while executing a program in this category.
The settings of this category are required when using the real-time display update function. See "2.1 1.1.4 Display-
ing and changing memory contents during program execution" for details on the real-time display update function.
Figure 2.19 [Access Memory While Running] Category
(a) [Access by stopping execution]
Specify from the drop-down list whether to allow access to the memory area while executing a program.
Select [Yes] to allow access ([No] is sele cted by default).
(b) [Update the display during execution]
Specify whether to update the display in the Watch panel/Memory panel while executing a program.
Select [Yes] to update the display (default).
Caution You cannot change this property while the program is in execution.
(c) [Display update interval[ms]]
This property is displayed only when the [Update the display during execution] property is set to [Yes].
Specify the interval in 100ms unit to update the contents in the Watch panel/Memory panel display while execut-
ing a program.
Directly enter the Integer number between 100 and 65500 (rounding up the fractions less than 100ms) ([500] is
specified by default).
Note that if you've changed the specified value of the [Update the display during execution] property from [No] to
[Yes], the previous set value is displayed in this property.
Caution You cannot change this property while the program is in execution.
(3) [Register]
In this category, make settings related to PC display in the Status bar during program execution.
Figure 2.20 [Register] Category
(a) [PC display during the execution]
This property specifies whether the PC value is displayed in the Status bar during program execution.
When you select [No], the Status bar under execution will show "Running."
Caution 1. You cannot change this property while the program is in execution.
Caution 2. [RX100 Series]
This property is hidden because these microcontrollers do not support display of the PC value in
the status bar during program execution.
Caution 3. While current consumption is being measured, this property is fixed to [No].
(b) [Display update interval for PC[ms]]
R20UT4588EJ0100 Rev.1.00 Page 25 of 423
Nov 01, 2019
Page 26
CS+ V8.03.00 2. FUNCTIONS
This property is displayed only when you've selected [Yes] in the [PC display during the execution] property.
During program execution, specify a PC display updating interval in the Status bar in 100 ms units.
Enter an integer directly in the range 100 to 65500 (with fractions below 100 ms rounded up). (By default, [500]
is specified.)
Note that if you've changed the specified value of the [PC display during the execution] property fro m [No] to
[Yes], the previous set value is displayed in this property.
Caution You cannot change this property while the program is in execution.
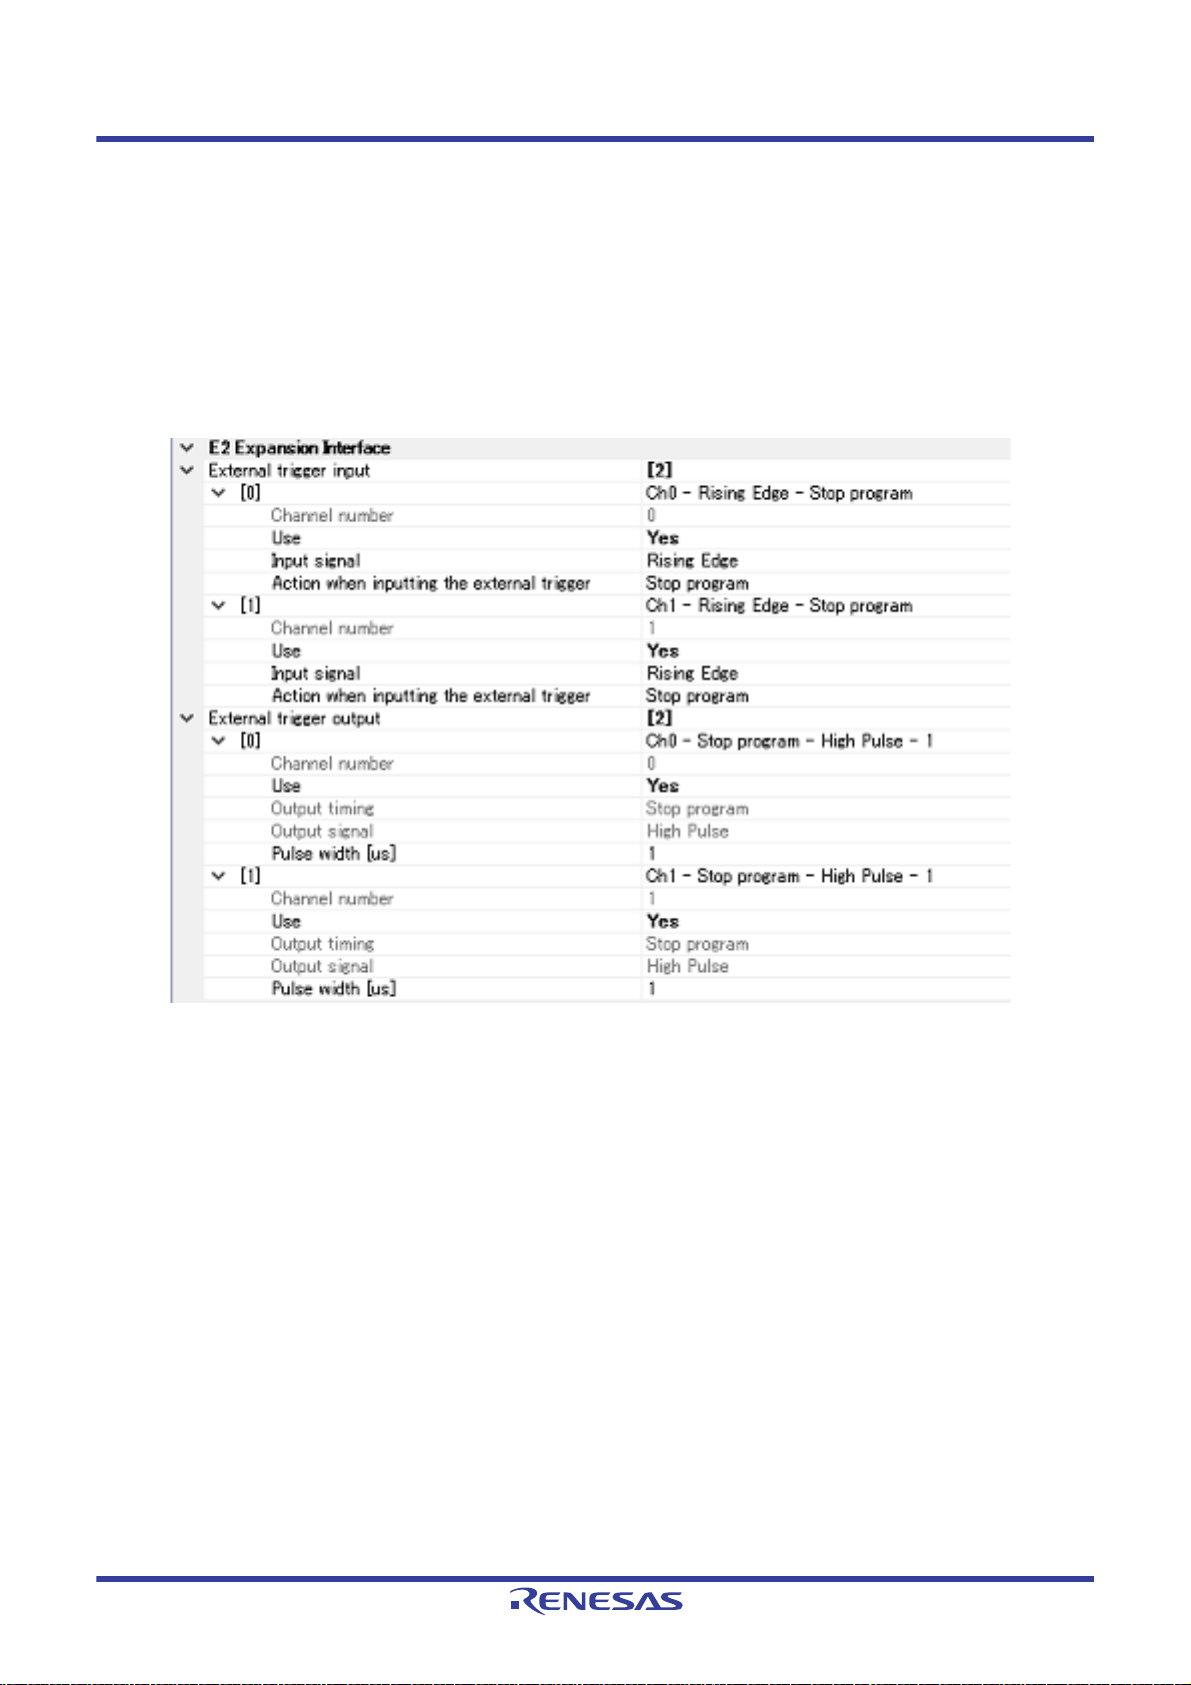
(4) [E2 Expansion Interface] [E2]
You can configure the E2 Expansion Interface.
Figure 2.21 [E2 Expansion Interface] Category
(a) [External trigger input]
Set the settings related to the external trigger input.
You can select different actions for each channel.
<1> Channel number
The channel number is displayed.
<2> Use
Specify whether to use the external trigger input for this channel number.
<3> Input signal
Specify the input signal.
<4> Action when inputting the external trigger
The action when inputting the external trigger is displayed.
(b) [External trigger output]
Set the settings related to the external trigger output.
You can select different actions for each channel.
<1> Channel number
The channel number is displayed.
<2> Use
Specify whether to use the external trigger output for this channel number.
<3> Output timing
The output timing is displayed.
R20UT4588EJ0100 Rev.1.00 Page 26 of 423
Nov 01, 2019
Page 27
CS+ V8.03.00 2. FUNCTIONS
<4> Output signal
The output signal displayed.
<5> Pulse width [us]
Specify the pulse width.
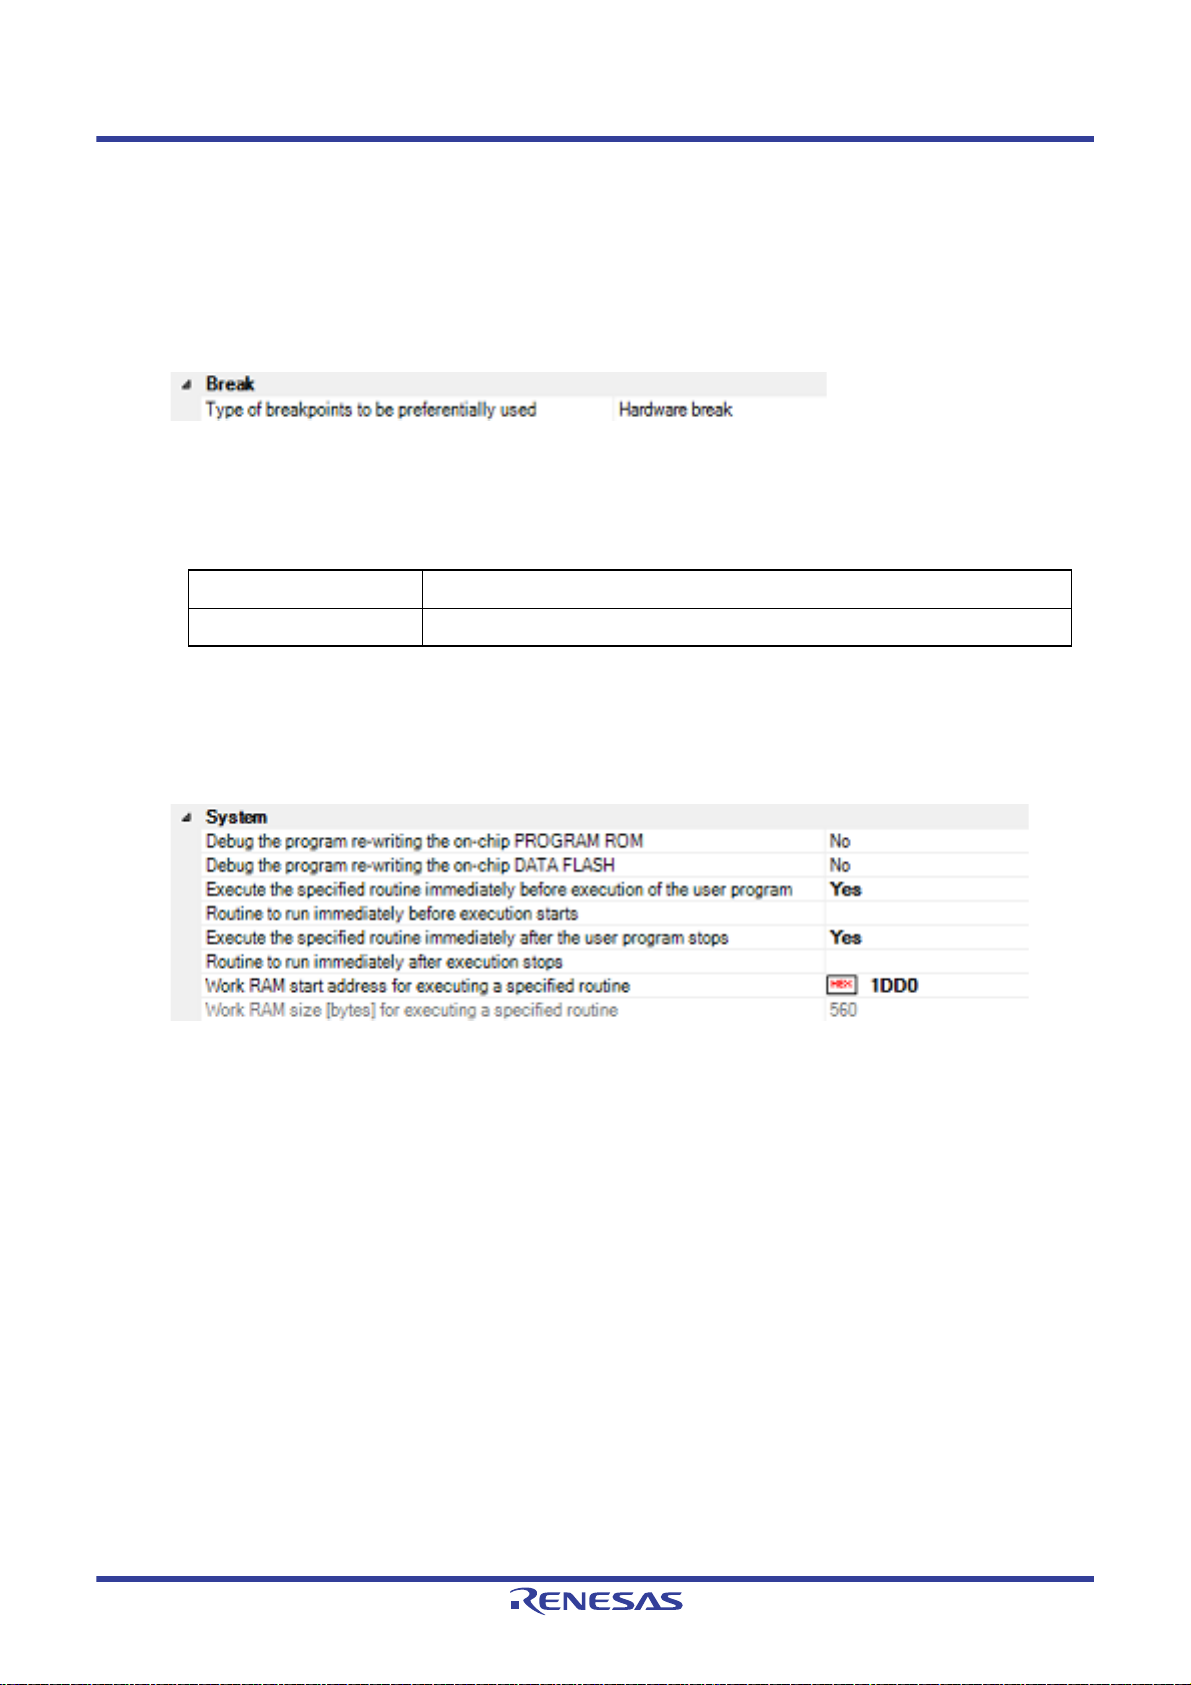
(5) [Break]
You can configure the break function in this category.
Figure 2.22 [Break] Category
(a) [Type of breakpoints to be preferentially used]
Specify from the following drop-down list the type of preferential breakpoint to be used with a single click of the
mouse in the Editor panel/Disassemble panel.
When setting a break point after the preferential break point type has been used up, the other break point type
will be automatically selected.
See "2.10.2 Stop the program at the arbitrary position (breakpoint)" for details on breakpoints.
Software break Sets software breakpoint preferentially.
Hardware break Sets hardware breakpoint preferentially (default).
(6) [System]
You can configure the emulation system in this category.
For more information regarding the execution of a specified routine before the execution and after the break of a
program, see "2.9.4 Execute a specified routine [E1] [E20] [EZ Emulator]".
Figure 2.23 [System] Category
(a) [Debug the program re-writing the on-chip PROGRAM ROM]
Specify whether to debug programs that rewrite on-chip program ROM area, such as those that use ROM P/E
mode.
Caution You cannot change this property while connected to E1.
(b) [Debug the program re-writing the on-chip DATA FLASH]
Specify whether to debug programs that rewrite on-chip data flash area, such as those that use data flash P/E
mode.
Caution You cannot change this property while connected to E1.
(c) [Execute the specified routine immediately before execution of the user program]
Specify whether to execute a specified routine before executing the user program.
Caution You cannot change this property while the program is in execution.
(d) [Routine to run immediately before execution starts]
Specify the address to be executed immediately before the user program execution. This property is displayed
only when [Execute the specified routine immediately before execution of the user program] property is set to
[Yes].
Caution You cannot change this property while the program is in execution.
(e) [Execute the specified routine immediately after the user program stops]
Specify whether to execute a specified routine after the user program break.
Caution You cannot change this property while the program is in execution.
R20UT4588EJ0100 Rev.1.00 Page 27 of 423
Nov 01, 2019
Page 28
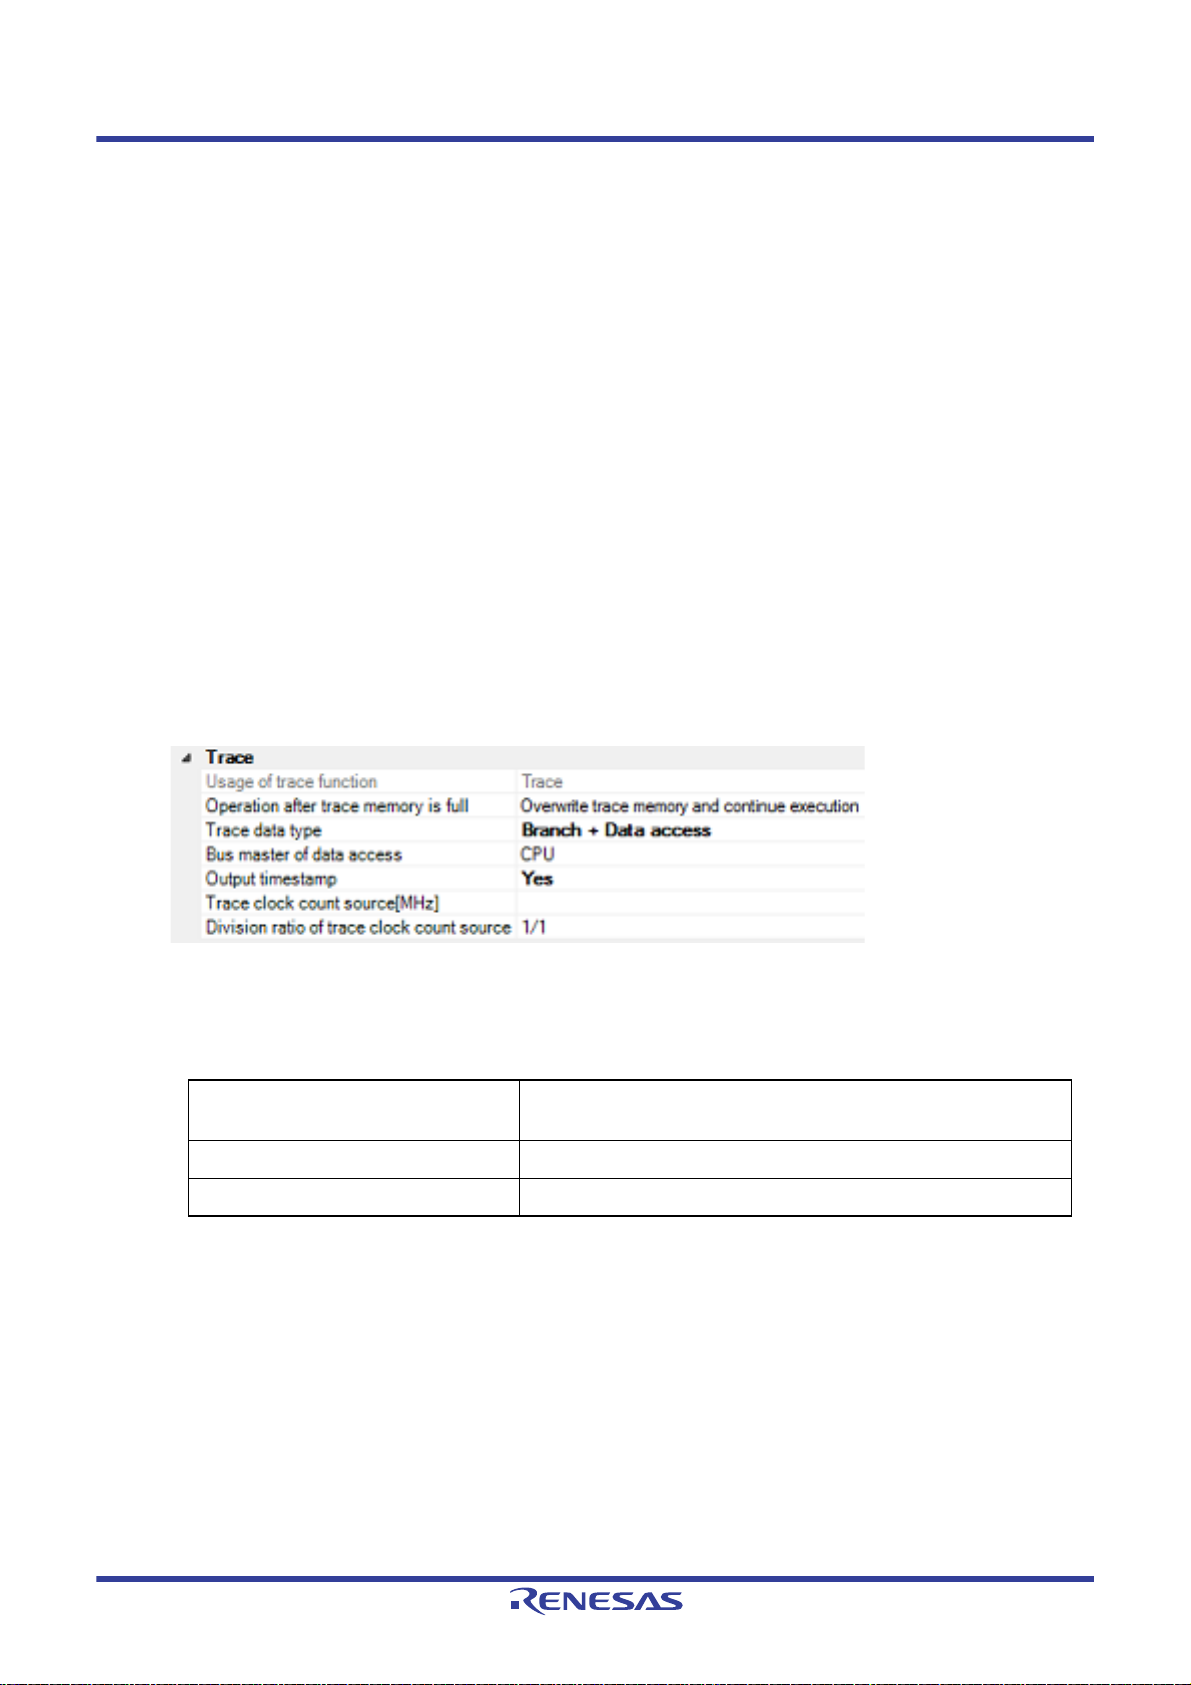
CS+ V8.03.00 2. FUNCTIONS
(f) [Routine to run immediately after execution stops]
Specify the address to be executed immediately after the user program break. This property is displayed only
when [Execute the specified routine immediately after the user program stops] property is set to [Yes].
Caution You cannot change this property while the program is in execution.
(g) [Work RAM start address for executing a specified routine]
Specify the address where the work RAM for use in execution of the specified routine starts. Specify an address
value that is a multiple of four bytes. If the entered value is not a multiple of four bytes, the value is automatically
corrected. The amount of memory indicated by the [Work RAM size [bytes] for executing a specified routine]
property beginning with this address is to be used by the debugger firmware.
This property is displayed only when you have selected [Yes] either for the [Execute the specified routine imme-
diately before execution of the user program] or [Execute the specified routine immediately after the user program stops] property.
Caution 1. You cannot change this property while the program is in execution.
Caution 2. Specify the range of memory that is not used by the user program.
(h) [Work RAM size [bytes] for executing a specified routine]
Indicates the size of the work RAM for use in execution of the specified routine.
This property is displayed only when you have selected [Yes] either for the [Execute the specified routine imme-
diately before execution of the user program] or [Execute the specified routine immediately after the user program stops] property.
(7) [Trace]
You can configure the trace function in this category.
Figure 2.24 [Trace] Category
(a) [Usage of trace function]
[Trace] is displayed as the usage of trace function.
You cannot change the value of this property.
(b) [Operation after trace memory is full]
Select the trace acquisition mode from the following drop-down list.
Overwrite trace memory and continue
execution
Stop trace Stops writing the trace data after the trace memory is full.
Stop Breaks after the trace memory is full.
(c) [Trace data type]
Select the type of data for which trace is to be acquired from the drop-down list.
The type of data that can be selected differs depending on the series of the microcontroller.
Following data types are displayed in the drop-down list.
- [RX600, RX700 Series]
Branch, Branch + Data access, Data access
- [RX100, RX200 Series]
Branch, Data access
(d) [Bus master of data access][RX71M, RX66x, RX65x, RX64M, RX72M, RX72N, and RX72T Groups]
This property is displayed only when [Branch + Data access] or [Data access] is specified in the [Trace data
type] property.
Select the Bus master of data access from the drop-down list.
The following bus masters are displayed in the drop-down list.
Continues overwriting the older trace data after the trace memory is
full.
R20UT4588EJ0100 Rev.1.00 Page 28 of 423
Nov 01, 2019
Page 29

CS+ V8.03.00 2. FUNCTIONS
- CPU (default), DMAC/DTC
For data access tracing, only the trace results of data access from the specified bus master are displayed on the
trace panel.
Caution 1. This property setting cannot be changed during program execution.
Caution 2. For an microcontroller that does not have the function for selecting the Bus master of data
access, the [Bus master of data access][RX71M, RX66x, RX65x, RX64M, RX72M, RX72N, and
RX72T Groups] property is not displayed. In this case, the bus master is fixed to [CPU].
(e) [Output timestamp]
Specify whether timestamp information is added to the trace data to be collected.
The change options in this property vary depending on the microcontroller series and the specified value of
[Trace data type] property, as follows:
Microcontroller Data type Change options
RX600, RX700
Series
RX200 Series Branch Not changeable.
RX100 Series Branch, Data access Not changeable.
(f) [Trace clock count source[MHz]]
This property is displayed only when you've specified [Yes] in the [Output timestamp] property.
Enter a count source with which a timestamp value is calculated from a count value.
To specify this, enter a value directly in the range 0.0001 to 999.999.
Note that if this property is blank, the set value of the [Operating frequency [MHz]] property in the [Clock] category of a [Connect Settings] tab is used in place of the count source.
Caution 1. You cannot change this property while the program is in execution.
Caution 2. The property's set value is not reflected in the trace data that has already been collected. The
property you've set is reflected beginning with the trace data that is collected after it is set.
(g) [Division ratio of trace clock count source][RX71M, RX66x, RX65x, and RX64M Groups]
This property is displayed only when [Yes] is selected in the [Output timestamp] property.
Select the frequency division ratio for the timestamp count source from the drop-down list.
The following frequency division ratios are displayed in the drop-down list.
- 1/1 (default), 1/16, 1/256, 1/4096
Branch, Branch + Data access,
Data access
Data access Changeable only when program is halted.
Changeable only when program is halted.
[No] is always displayed.
[No] is always displayed.
The frequency specified in the [Trace clock count source[MHz]] property is divided by the specified value (the
frequency is multiplied by 1/n) and one cycle of the obtained frequency is used as the unit for timestamp count
(the frequency for count value 1).
Caution 1. This property setting cannot be changed during program execution.
Caution 2. For an microcontroller that does not have the function for dividing the timestamp frequency for
tracing, the [Division ratio of trace clock count source][RX71M, RX66x, RX65x, and RX64M
Groups] property is not displayed. In this case, the division ratio is fixed to [1/1].
(8) [Timer] [RX600, RX700 series]
You can configure the timer function in this category.
Figure 2.25 [Timer] Category
(a) [Use 64bit counter]
Specify whether to use two 32-bit counters or one 64-bit counter.
R20UT4588EJ0100 Rev.1.00 Page 29 of 423
Nov 01, 2019
Page 30

CS+ V8.03.00 2. FUNCTIONS
2.3.2.3 [Download File Settings] tab
You can configure downloading to the debug tool in [Download File Settings] tab. For the details of settings in each cat-
egory, see "2.5.1 Execute downloading".
2.3.2.4 [Hook Transaction Settings] tab
In the [Hook Transaction Settings] tab, you can configure hook transaction for the debug tool.
See "2.18 Setting Up the Hook Process" for details on hook transaction and the settings in each category.
R20UT4588EJ0100 Rev.1.00 Page 30 of 423
Nov 01, 2019
Page 31

CS+ V8.03.00 2. FUNCTIONS
2.3.3 [E20]
Configure the operating environment on the Property panel below when using E20.
Note that the contents of the Property panel differ depending on the communication method (FINE communications
[E20(Serial)] or JTAG communications [E20(JTAG)]) between E20 and the target system.
Figure 2.26 Property Panel [E20(Serial)]
R20UT4588EJ0100 Rev.1.00 Page 31 of 423
Nov 01, 2019
Page 32

CS+ V8.03.00 2. FUNCTIONS
Figure 2.27 Property Panel [E20(JTAG)]
Follow the steps below by selecting the corresponding tab on the Property panel.
2.3.3.1 [Connect Settings] tab
2.3.3.2 [Debug Tool Settings] tab
2.3.3.3 [Download File Settings] tab
2.3.3.4 [Hook Transaction Settings] tab
2.3.3.1 [Connect Settings] tab
In the [Connect Settings] tab, you configure the connection with the debug tool for each one of the following categories.
(1) [Internal ROM/RAM]
(2) [Clock]
(3) [Connection with Emulator]
(4) [Connection with Target Board]
(5) [Flash]
(6) [Operating Modes of CPU]
(7) [External Flash]
(1) [Internal ROM/RAM]
The configuration of internal ROM/RAM is displayed in this category.
Figure 2.28 [Internal ROM/RAM] Category
(a) [Size of internal ROM[KBytes]
The internal ROM size to emulate is displayed (unit: Kbytes).
You cannot change the value of this property.
R20UT4588EJ0100 Rev.1.00 Page 32 of 423
Nov 01, 2019
Page 33

CS+ V8.03.00 2. FUNCTIONS
(b) [Size of internal RAM[Bytes]]
The internal RAM size to emulate is displayed (unit: bytes).
You cannot change the value of this property.
(c) [Size of DataFlash memory[KBytes]]
The data flash memory size is displayed (unit: Kbytes).
If the currently selected microcontroller does not incorporate the data flash, [0] is displayed.
You cannot change the value of this property.
(2) [Clock]
You can configure the clock in this category.
Caution You cannot change the property in this category while connected to E20.
Figure 2.29 [Clock] Category [HOCO]
Figure 2.30 [Clock] Category [EXTAL]
(a) [Main clock source]
Select EXTAL frequency or internal HOCO as the main clock source. [EXTAL] will be displayed for microcontrollers with no internal HOCO.
(b) [Main clock frequency [MHz]]
Specify the main clock frequency (before multiplier).
Specify EXTAL frequency by directly entering a number between 0.0001 and 99.9999 (MHz). The entered value
will be truncated to 4 decimal places. If the value is out of the specifiable range, it will be rounded to 0.0001
(when 0 or below) or to 99.9999 (when 100 or above).
This property is displayed only when you have selected [EXTAL] in the [Main clock source] property.
(c) [Operating frequency [MHz]]
Specify the Operating frequency (ICLK) by directly entering a number between 0.0001 and 999.999 (MHz).
If the value is out of the specifiable range, it will be rounded to 0.0001 (if 0 or negative) or to 999.999 (if 1000 or
greater).
(d) [Allow changing of the clock source on writing internal flash memory]
Specify whether to allow a debugger to operate the clock while the internal flash memory is being rewritten.
Caution [E20]
When [Y es] is selected, if internal flash ROM is rewritten by the debugger while the FlashIF clock
(FCLK) of the microcontroller is outside of the guaranteed operating range (that is, while operating with LOCO or subclock), the E20 will switch the clock source. After rewriting to the internal
flash ROM is completed, the clock will be restored to the previous clock source.
Note that the operating frequency of the peripheral clock will change during internal flash memory rewriting because the clock source is switched.
The clock manipulation enabling setting takes effect when the internal flash ROM is rewritten
after program execution or step execution. Note that the clock source is forcibly switched regardless of the clock manipulation enabling setting if FCLK is outside of the guaranteed operating
range immediately after the debug tool is activated or when the [CPU Reset] button is clicked.
(3) [Connection with Emulator]
You can configure the connection between E20 and a host machine in this category.
Caution You cannot change the property in this category while connected to E20.
Figure 2.31 [Connection with Emulator] Category
R20UT4588EJ0100 Rev.1.00 Page 33 of 423
Nov 01, 2019
Page 34

CS+ V8.03.00 2. FUNCTIONS
(a) [Emulator serial No.]
Serial numbers of all connected E20 emulators are displayed in the drop-down list.
Select the one to be connected to the target system.
The drop-down list is updated every time it is used.
(4) [Connection with Target Board]
You can configure the connection between E20 and the target board in this category.
Figure 2.32 [Connection with Target Board] Category [E20(Serial)]
Figure 2.33 [Connection with Target Board] Category [E20(JTAG)]
(a) [Power target from the emulator. (MAX 200mA)]
[No] is displayed as the property value.
E20 does not support power supply function.
(b) [Communications method]
Displays the method of communication used by the E20 emulator for communicating with the microcontroller on
the target system. Specifying [RX E20(Serial)] for a debug tool in the Project Tree panel will display [FINE] in
this property, and specifying [RX E20(JTAG)] will display [JTAG].
You cannot change the value of this property.
For the details of debug tool selection, see "2.3.1 Select the debug tool to use“.
(c) [JTAG clock[MHz]]
From the drop-down list, select the baud rate (JTAG clock) to be used by the E20 emulator for communicating
with the microcontroller on the target system.
This property is displayed only when [JTAG] is selected in the [Communications method] property.
The following baud rate is displayed in the drop-down list.
- 16.5 (default), 12.38, 6.188, 3.094, 1.547
Caution 1. This property cannot be changed while connected to E20.
Caution 2. Depending on the length or the method of JTAG signal wiring on the target system, it may not be
possible to communicate using the selected JTAG clock. In such a case, reducing the JTAG
clock may achieve successful communication.
(d) [FINE baud rate[bps]]
From the drop-down list, select the baud rate (FINE baud rate) to be used by the E20 emulator for communicating with the microcontroller on the target system.
This property is displayed only when [FINE] is selected in the [Communications method] property.
The following baud rate is displayed in the drop-down list.
- 2000000 (default), 750000, 500000, 250000
Caution 1. This property cannot be changed while connected to E20.
Caution 2. Depending on the length or the method of FINE signal wiring on the target system, it may not be
possible to communicate using the selected FINE baud rate. In such a case, reducing the FINE
baud rate may achieve successful communication.
(5) [Flash]
You can configure the flash memory rewriting in this category.
R20UT4588EJ0100 Rev.1.00 Page 34 of 423
Nov 01, 2019
Page 35

CS+ V8.03.00 2. FUNCTIONS
Figure 2.34 [Flash] Category
(a) [Input Mode of ID code]
Specify the mode in which to input the ID codes.
Caution This property cannot be changed while connected to E20.
(b) [ID code]
Enter the ID code to release the flash memory from the protected state.
If you have selected [Specify the ID code as a 32-digit hexadecimal] in the [Input Mode of ID code] property,
enter the ID code in a 32-digit hexadecimal number. If you have selected [Specify the ID code as an ASCII code
within 16 characters], enter the ID code using maximum 16 ASCII characters.
Caution 1. This property cannot be changed while connected to E20.
Caution 2. To enter the ID code as a 32-digit hexadecimal value, arrange it as a sequence of 32-bit units of
data.
Byte order of the ID code of the flash programmer can be different from that of CS+. Please confirm the specification about ID code of the flash programmer you’re using.
Caution 3. If the ID code entered in ASCII characters is shorter than 16 characters, the unused space will be
padded with 0.
Caution 4. Even if you have downloaded a program that contains an ID code, that ID code is replaced with
FFFFFFFFFFFFFFFFFFFFFFFFFFFFFFFF.
(c) [Work RAM start address]
Specify the location address of the work RAM to be used by the debugger. Specify an address value that is a
multiple of four bytes. If the entered value is not a multiple of four bytes, the value is automatically corrected.
The amount of memory indicated by the [Work RAM size[bytes]] property beginning with this address is to be
used by the debugger firmware.
Caution 1. This property cannot be changed while connected to E20.
Caution 2. The work RAM area can also be used by the user program because the emulator saves and
restores data in this area. Note, however, that the work RAM area is not specifiable as:
the destination or origin of a DMA or DTC transfer, an address where a DTC vector table or transfer information is to be allocated, or the interrupt vector for a DMAC or DTC activation source.
(d) [Work RAM size[bytes]]
Displays the size of work RAM to be used by the debugger.
(6) [Operating Modes of CPU]
In this category, you configure the operating mode of the microcontroller to be emulated.
Caution This property cannot be changed while connected to E20.
Figure 2.35 [Operating Modes of CPU] Category
(a) [Mode pins setting]
Specify the operating mode set by the mode pin of the microcontroller.
(b) [Allow erasing the USB boot program]
Select whether to erase the USB boot program in the user boot area when you are starting up the emulator in
the user boot mode by using a microcontroller in which the USB boot program is stored.
This property is displayed only when [User boot mode] is selected for the [Mode pins setting] property. Note that
this is not displayed for an microcontroller in which the USB boot program in the user boot area does not need
to be erased when you are starting up the emulator.
R20UT4588EJ0100 Rev.1.00 Page 35 of 423
Nov 01, 2019
Page 36

CS+ V8.03.00 2. FUNCTIONS
(c) [Register setting]
Specify the operating mode to be set by the register.
The operating mode that can be speci fi e d d epends on the type of the microcontroller.
(d) [Endian]
Displays the project endian. Acquires endian information from the project and displays its value. Can be
selected only when the debug tool is disconnected.
(e) [Change the start bank][RX651-2M, RX65N-2M, RX72M, RX66N, and RX72N Groups]
Specify whether to change the start bank before connecting to the debug tool.
Select [Yes] to change the start bank before connecting to the debug tool ([No] is selected by default).
(f) [Start bank][RX651-2M, RX65N-2M, RX72M, RX66N, and RX72N Groups]
Specify the start bank to be changed before connecting to the debug tool.
This property is displayed only when [Yes] is selected for the [Change the start bank][RX651-2M, RX65N-2M,
RX72M, RX66N, and RX72N Groups] property.
(7) [External Flash]
In this category, you can configure external flash.
The settings in this category are required when downloading to an external flash memory . For more details regarding property setting, see “2.5.2.5 Downloading files to external flash memory [E1] [E20]“.
Caution You cannot change the property in this category while connected to E20.
2.3.3.2 [Debug Tool Settings] tab
In the [Debug Tool Settings] tab, you configure the basic settings of the debug tool for each one of the following catego-
ries.
(1) [Memory]
(2) [Access Memory While Running]
(3) [Register]
(4) [Break]
(5) [System]
(6) [Trace]
(7) [Timer] [RX600, RX700 series]
(8) [Coverage] [RX71M, RX66x, RX65x, RX64M, RX72M, RX72N, and RX72T Groups]
(1) [Memory]
You can configure the memory in this category.
R20UT4588EJ0100 Rev.1.00 Page 36 of 423
Nov 01, 2019
Page 37

CS+ V8.03.00 2. FUNCTIONS
Figure 2.36 [Memory] Category
(a) [Memory mappings]
Current memory mapping status is displayed in detail for each type of memory area.
It is not possible to change mapping on this panel.
To add or delete an I/O protection area, select the [Memory mappings] property and click on the [...] button that
appears on the right to open the Memory Mapping dialog box. For details on how to change settings, refer to the
section of the Memory Mapping dialog box.
This property displays only the number of memory areas.
Expanding the [Memory mappings] property will display the following sub-items.
- [Memory type]
Indicates the memory type of the corresponding area.
Each memory type corresponds to the following areas.
On-chip ROM area Program ROM
On-chip RAM area On-chip RAM
Note 1
and data flash
Note 4
Note 2
I/O registers area Peripheral I/O register
Divided into areas with different endians for display
External area(CS7/CS6/.../CS0) External address space
CS0 to CS7 are displayed separa te ly
Other memory area FCU-RAM
Note 3
, FCU firmware
Note 3
, user boot
Reserved area Areas other than those listed above
R20UT4588EJ0100 Rev.1.00 Page 37 of 423
Nov 01, 2019
Page 38

CS+ V8.03.00 2. FUNCTIONS
I/O protection area Address range in an external area that is not read by the
debugger. Register this area in the Memory Mapping dialog
box.
Note 1. If data in the on-chip flash ROM area is changed by means other than downloading (e.g. by
manipulating it via the Memory panel or line assembling), the flash ROM reflects this change
next time the user program is run.
Note 2. If an attempt is made to reference data in erased data flash ROM, only undefined values are
displayed due to the specifications of the microcontroller. If the debugger is used to write to the
data flash ROM, on the othe r h an d , data is written in 256-byte units. Written areas do not hold
undefined values.
Note 3. Do not use the debugger to write to FCU-RAM. The FCU firmware area also cannot be written
by the debugger.
Note 4. The area including the option setting memory areas listed below is displayed as an on-chip
RAM area. Note that values cannot be specified in this area through the memory panel.
[RX71M, RX66x, RX65x, RX64M, and RX72T Groups]
- S PCC Serial Programmer Command Control Reg.
- OSIS OCD/Serial Programmer ID Setting Reg.
- E ndian select registers (MDE)
- Option function select register 0 (OFS0)
- Option function select register 1 (OFS1)
[RX65N-2M, RX651-2M, RX72M, RX66N, and RX72N]
- S PCC Serial Programmer Command Control Reg.
- OSIS OCD/Serial Programmer ID Setting Reg.
- E ndian select registers (MDE)
- Option function select register 0 (OFS0)
- Option function select register 1 (OFS1)
- Bank Select Register (BANKSEL)
- Flash Access Window Setting Register (F AW)
- [Start address]
Displays the start address of the corresponding area.
- [End address]
Displays the end address of the corresponding area.
- [Access width[bits]]
Displays the address width of the corresponding area.
When [Memory type] is an external area, the access width can only be changed when the debug tool is disconnected
- [Endian]
Displays the endians of the external area and the I/O register area.
When [Memory type] is an external area, the endian can only be changed when the debug tool is disconnected.
Caution Connecting to a debug tool (see "2.4.1 Connect the debug tool to CS+") will display details for
each memory type.
(b) [Verify on writing to memory]
Specify whether to perform a verify check when the memory value is initialized from the drop-down list.
Select [Yes] to perform verification after download or when values are changed in the Watch panel/ Memory
panel.
(2) [Access Memory While Running]
You can configure the memory access while executing a program in this category.
R20UT4588EJ0100 Rev.1.00 Page 38 of 423
Nov 01, 2019
Page 39

CS+ V8.03.00 2. FUNCTIONS
The settings of this category are required when using the real-time display update function. See "2.1 1.1.4 Display-
ing and changing memory contents during program execution" for details on the real-time display update function.
Figure 2.37 [Access Memory While Running] Category [E20(Serial) ]
Figure 2.38 [Access Memory While Running] Category [E20(JTAG)[RX600, RX700 Series]]
(a) [Access by stopping execution]
Specify from the drop-down list whether to allow access to the memory area while executing a program.
Select [Yes] to allow access ([No] is sele cted by default).
(b) [Update the display during execution]
Specify whether to update the display in the Watch panel/Memory panel while executing a program.
Select [Yes] to update the display (default).
Caution You cannot change this property while the program is in execution.
(c) [Update interval[ms]]
This property is displayed only when the [Update the display during execution] property is set to [Yes].
Specify the interval in 100ms unit to update the contents in the Watch panel/Memory panel display while execut-
ing a program.
Directly enter the Integer number between 100 and 65500 (rounding up the fractions less than 100ms) ([500] is
specified by default).
Note that if you've changed the specified value of the [Update the display during execution] property from [No] to
[Yes], the previous set value is displayed in this property.
Caution You cannot change this property while the program is in execution.
(d) [Enable the automatic update of realtime display]
Specify whether to set RRM area automatically.
This property is displayed only when you have selected [Real-time RAM Monitor] in the [Usage of trace function]
property. If you have selected [Trace] there, [No] is displayed instead.
Caution You cannot change this property while the program is in execution.
(3) [Register]
In this category, make settings related to PC display in the Status bar during program execution.
Figure 2.39 [Register] Category
(a) [PC display during the execution]
This property specifies whether the PC value is displayed in the Status bar during program execution.
When you select [No], the Status bar under execution will show "Running."
Caution 1. You cannot change this property while the program is in execution.
Caution 2. [RX100 Series]
This property is hidden because these microcontrollers do not support display of the PC value in
the status bar during program execution.
(b) [Display update interval for PC[ms]]
This property is displayed only when you've selected [Yes] in the [PC display during the execution] property.
During program execution, specify a PC display updating interval in the Status bar in 100 ms units.
Enter an integer directly in the range 100 to 65500 (with fractions below 100 ms rounded up). (By default, [500]
is specified.)
R20UT4588EJ0100 Rev.1.00 Page 39 of 423
Nov 01, 2019
Page 40

CS+ V8.03.00 2. FUNCTIONS
Note that if you've changed the specified value of the [PC display during the execution] property fro m [No] to
[Yes], the previous set value is displayed in this property.
Caution You cannot change this property while the program is in execution.
(4) [Break]
You can configure the break function in this category.
Figure 2.40 [Break] Category
(a) [Type of breakpoints to be preferentially used]
Specify from the following drop-down list the type of preferential breakpoint to be used with a single click of the
mouse in the Editor panel/Disassemble panel.
When setting a break point after the preferential break point type has been used up, the other break point type
will be automatically selected.
See "2.10.2 Stop the program at the arbitrary position (breakpoint)" for details on breakpoints.
Software break Sets software breakpoint preferentially.
Hardware break Sets hardware breakpoint preferentially (default).
(5) [System]
You can configure the emulation system in this category.
For more information regarding the execution of a specified routine before the execution and after the break of a
program, see "2.9.4 Execute a specified routine [E1] [E20] [EZ Emulator]".
Figure 2.41 [System] Category
(a) [Debug the program re-writing the on-chip PROGRAM ROM]
Specify whether to debug programs that rewrite on-chip program ROM area, such as those that use ROM P/E
mode.
Caution You cannot change this property while connected to E20.
(b) [Debug the program re-writing the on-chip DATA FLASH]
Specify whether to debug programs that rewrite on-chip data flash area, such as those that use data flash P/E
mode.
Caution You cannot change this property while connected to E20.
(c) [Execute the specified routine immediately before execution of the user program]
Specify whether to execute a specified routine before executing the user program.
Caution You cannot change this property while the program is in execution.
(d) [Routine to run immediately before execution starts]
Specify the address to be executed immediately before the user program execution. This property is displayed
only when [Execute the specified routine immediately before execution of the user program] property is set to
[Yes].
Caution You cannot change this property while the program is in execution.
(e) [Execute the specified routine immediately after the user program stops]
Specify whether to execute a specified routine after the user program break.
Caution You cannot change this property while the program is in execution.
(f) [Routine to run immediately after execution stops]
R20UT4588EJ0100 Rev.1.00 Page 40 of 423
Nov 01, 2019
Page 41

CS+ V8.03.00 2. FUNCTIONS
Specify the address to be executed immediately after the user program break. This property is displayed only
when [Execute the specified routine immediately after the user program stops] property is set to [Yes]
Caution You cannot change this property while the program is in execution.
(g) [Work RAM start address for executing a specified routine]
Specify the address where the work RAM for use in execution of the specified routine starts. Specify an address
value that is a multiple of four bytes. If the entered value is not a multiple of four bytes, the value is automatically
corrected. The amount of memory indicated by the [Work RAM size [bytes] for executing a specified routine]
property beginning with this address is to be used by the debugger firmware.
This property is displayed only when you have selected [Yes] either for the [Execute the specified routine imme-
diately before execution of the user program] or [Execute the specified routine immediately after the user program stops] property.
Caution 1. You cannot change this property while the program is in execution.
Caution 2. Specify the range of memory that is not used by the user program.
(h) [Work RAM size [bytes] for executing a specified routine]
Indicates the size of the work RAM for use in execution of the specified routine.
This property is displayed only when you have selected [Yes] either for the [Execute the specified routine imme-
diately before execution of the user program] or [Execute the specified routine immediately after the user program stops] property.
(6) [Trace]
You can configure the trace function in this category.
Figure 2.42 [Trace] Category
(a) [Usage of trace function]
Specify whether to use it as real-time RAM monitor function (RRM function ) ut il izing the trace function. If you
select [Real-time RAM Monitor], part of the trace functions will be disabled.
For details on applicable restrictions, see "2.11.1.4 Displaying and changing memory contents during program
execution".
This property can be changed only when the program is not running.
Caution To use the real-time RAM monitor function, the E20 and the target board must be connected via
a 38-pin JTAG cable. If the E20 and the target board are connected in any other way or via the
38-pin to 14-pin conversion adapter, select [Trace].
(b) [Operation after trace memory is full]
Select the trace acquisition mode from the following drop-down list.
Overwrite trace memory and continue execution
Stop trace Stops writing the trace data after the trace memory is full.
Stop Breaks after the trace memory is full.
Caution [E20(JTAG) [RX600, RX700 Series]]
If you have selected [Real-time RAM Monitor] in [Usage of trace function] property, the property
value is displayed as [Overwrite trace memory and continue execution] and becomes unchangeable.
(c) [Trace data type]
Continues overwriting the older trace data after the trace memory is full.
R20UT4588EJ0100 Rev.1.00 Page 41 of 423
Nov 01, 2019
Page 42

CS+ V8.03.00 2. FUNCTIONS
Select the type of data for which trace is to be acquired from the drop-down list.
The type of data that can be selected differs depending on the series of the microcontroller.
Following data types are displayed in the drop-down list.
- [RX66x, RX65N-2M, RX651-2M, RX72M, RX72N, and RX72T Groups]
Branch, Branch + Data access, Data access, Branch + Data access (without Access data), or Dat a ac cess
(without Access data)
- [RX600, RX700 Series]
Branch, Branch + Data access, Data access
- [RX100, RX200 Series]
Branch, Data access
Caution [E20(JTAG) [RX600, RX700 Series]]
If you have selected [Real-time RAM Monitor] in [Usage of trace function] property, the property
value is displayed as [Data access] and becomes unchangeable.
(d) [Start address for trace area without access data][RX65N-2M, RX651-2M, RX66T, RX72T, RX72M, RX66N, and
RX72N Group]
Specify the start address for the trace area without access data.
(e) [End address for trace area without access data][RX65N-2M, RX651-2M, RX66T, RX72T, RX72M, RX66N, and
RX72N Group]
Specify the end address for the trace area without access data.
(f) [Bus master of data access] [RX71M, RX66x, RX65x, RX64M, RX72M, RX72N, and RX72T Groups]
Select the bus master which generated the data access.
This property is displayed only when [Branch+Data access] or [Data access] is specified in the [Trace data type]
property.
The following bus masters are displayed in the drop-down list.
- CPU (d ef au l t), DMAC/D T C
When [Trace] is selected in the [Usage of trac e fu nction] property,
for data access tracing, only the trace results of data access from the specified bus master are displayed on the
trace panel.
Caution 1. This property setting cannot be changed during program execution.
Caution 2. When [Real-time RAM Monitor] is selected in the [Usage of trace function] property, The bus
master is fixed to [CPU] and cannot be changed.
Caution 3. For an microcontroller that does not have the function for selecting the Bus master of data
access, the [Bus master of data access] [RX71M, RX66x, RX65x, RX64M, RX72M, RX72N, and
RX72T Groups] property is not displayed. In this case, the bus master is fixed to [CPU].
(g) [External trace output][E20(JTAG)]
From the following drop-down list, select the method in which to externally output the trace acquisition data.
CPU execution CPU execution given priority over trace output. Trace information may be lost if output.
Trace output Trace output given priority over CPU execution. CPU execution stops during trace out-
put, affecting real-time performance.
Do not output Only the internal buffer of the microcontroller will be used, with no output of trace infor-
mation.
Caution 1. If you have selected [Real-time RAM Monitor] in [Usage of trace function] property, [Do not out-
put] cannot be selected from the drop-down list.
Caution 2. If Step in is executed when [CPU execution] or [Trace output] is specified and trace data is being
displayed on the Trace panel, correct trace data may not always be displayed.
Caution 3. [RX71M, RX66x, RX65x, RX64M, RX72M, RX72N, and RX72T Groups]
When this property is changed from [Do not output] to [CPU execution] or [Trace output], the
timer measurement results are initialized.
(h) [Trace memory size[MByte]][E20(JTAG)]
Specify the size of memory used to retain the trace data.
The following memory sizes are displayed in the drop-down list.
R20UT4588EJ0100 Rev.1.00 Page 42 of 423
Nov 01, 2019
Page 43

CS+ V8.03.00 2. FUNCTIONS
- 1 (default), 2, 4, 8, 16, 32
Caution If you have selected [Real-time RAM Monitor] in [Usage of trace function] property, the property
value is displayed as [1] and becomes unchangeable.
(i) [Output timestamp]
Specify whether timestamp information is added to the trace data to be collected.
This property is selectable only when you've specified [Trace] in the [Usage of trace function] property.
The change options in this property vary depending on the microcontroller series and the specified value of
[Trace data type] property, as follows:
Microcontroller Data type Change options
RX66x, RX65N-2M,
RX651-2M, RX72M,
RX72N, and RX72T
Group
RX600 Series other
than those listed
above
RX200 Series Branch Not changeable.
RX100 Series Branch, Data access Not changeable.
(j) [Trace clock count source[MHz]]
This property is displayed only when you've specified [Yes] in the [Output timestamp] property.
Enter a count source with which a timestamp value is calculated from a count value.
To specify this, enter a value directly in the range 0.0001 to 999.999.
Note that if this property is blank, the set value of the [Operating frequency [MHz]] property in the [Clock] category of a [Connect Settings] tab is used in place of the count source.
Caution 1. You cannot change this property while the program is in execution.
Caution 2. The property's set value is not reflected in the trace data that has already been collected. The
property you've set is reflected beginning with the trace data that is Division ratio of trace clock
count source collected after it is set.
(k) [Division ratio of trace clock count source][RX71M, RX66x, RX65x, RX64M, RX72M, RX72N, and RX72T
Groups]
Specify the division ratio of trace clock count source for the timestamp.
This property is displayed only when [Yes] is selected in the [Output timestamp] property.
Select the frequency division ratio for the timestamp count source from the drop-down list.
The following frequency division ratios are displayed in the drop-down list.
- 1/1, 1/16, 1/256, 1/4096
Branch, Branch + Data access,
Data access, Branch + Data
access (without Access data),
Data access (without Access
data)
Branch, Branch+Data access,
Data access
Data access Changeable only when program is halted.
Changeable only when program is halted.
Changeable only when program is halted.
[No] is always displayed.
[No] is always displayed.
The frequency specified in the [Trace clock count source[MHz]] property is divided by the specified value (the
frequency is multiplied by 1/n) and one cycle of the obtained frequency is used as the unit for timestamp count
(the frequency for count value 1).
Caution 1. This property setting cannot be changed during program execution.
Caution 2. For an microcontroller that does not have the function for dividing the timestamp frequency for
tracing, the [Division ratio of trace clock count source][RX71M, RX66x, RX65x, RX64M, RX72M,
RX72N, and RX72T Groups] property is not displayed. In this case, the division ratio is fixed to [1/
1]
(7) [Timer] [RX600, RX700 series]
You can configure the timer function in this category.
R20UT4588EJ0100 Rev.1.00 Page 43 of 423
Nov 01, 2019
Page 44

CS+ V8.03.00 2. FUNCTIONS
Figure 2.43 [Timer] Category
(a) [Use 64bit counter]
Specify whether to use two 32-bit counters or one 64-bit counter.
(8) [Coverage] [RX71M, RX66x, RX65x, RX64M, RX72M, RX72N, and RX72T Groups]
You can configure the coverage function in this category.
See "2.15 Measure Coverage [Simulator] [E20 [RX71M, RX66x, RX65x, RX64M, RX66T, RX72T, RX72M, and
RX72N Groups]]" for details on the coverage function and this category configuration.
2.3.3.3 [Download File Settings] tab
You can configure downloading to the debug tool in [Download File Settings] tab.
For the details of settings in each category, see "2.5.1 Execute downloading".
2.3.3.4 [Hook Transaction Settings] tab
In the [Hook Transaction Settings] tab, you can configure hook transaction for the debug tool.
See "2.18 Setting Up the Hook Process" for details on hook transaction and the settings in each category.
R20UT4588EJ0100 Rev.1.00 Page 44 of 423
Nov 01, 2019
Page 45

CS+ V8.03.00 2. FUNCTIONS
2.3.4 [EZ Emulator]
Configure the operating environment on the Property panel below when using EZ Emulator.
Figure 2.44 Property Panel
Follow the steps below by selecting the corresponding tab on the Property panel.
2.3.4.1 [Connect Settings] tab
2.3.4.2 [Debug Tool Settings] tab
2.3.4.3 [Download File Settings] tab
2.3.4.4 [Hook Transaction Settings] tab
2.3.4.1 [Connect Settings] tab
In the [Connect Settings] tab, you configure the connection with the debug tool for each one of the following categories.
(1) [Internal ROM/RAM]
(2) [Clock]
(3) [Connection with Target Board]
(4) [Flash]
(5) [Operating Modes of CPU]
(6) [External Flash]
(1) [Internal ROM/RAM]
The configuration of internal ROM/RAM is displayed in this category.
Figure 2.45 [Internal ROM/RAM] Category
(a) [Size of internal ROM[KBytes]
The internal ROM size to emulate is displayed (unit: Kbytes).
You cannot change the value of this property.
R20UT4588EJ0100 Rev.1.00 Page 45 of 423
Nov 01, 2019
Page 46

CS+ V8.03.00 2. FUNCTIONS
(b) [Size of internal RAM[Bytes]]
The internal RAM size to emulate is displayed (unit: bytes).
You cannot change the value of this property.
(c) [Size of DataFlash memory[KBytes]]
The data flash memory size is displayed (unit: Kbytes).
If the currently selected microcontroller does not incorporate the data flash, [0] is displayed.
You cannot change the value of this property.
(2) [Clock]
You can configure the clock in this category.
Caution You cannot change the property in this category while connected to EZ Emulator.
Figure 2.46 [Clock] Category [HOCO]
Figure 2.47 [Clock] Category [EXTAL]
(a) [Main clock source]
Select EXTAL frequency or internal HOCO as the main clock source. [EXTAL] will be displayed for microcontrollers with no internal HOCO.
(b) [Main clock frequency [MHz]]
Specify the main clock frequency (before multiplier).
Specify EXTAL frequency by directly entering a number between 0.0001 and 99.9999 (MHz). The entered value
will be truncated to 4 decimal places. If the value is out of the specifiable range, it will be rounded to 0.0001
(when 0 or below) or to 99.9999 (when 100 or above).
This property is displayed only when you have selected [EXTAL] in the [Main clock source] property.
(c) [Operating frequency [MHz]]
Specify the Operating frequency (ICLK) by directly entering a number between 0.0001 and 999.999 (MHz).
If the value is out of the specifiable range, it will be rounded to 0.0001 (if 0 or negative) or to 999.999 (if 1000 or
greater).
(d) [Allow changing of the clock source on writing internal flash memory]
Specify whether to allow a debugger to operate the clock while the internal flash memory is being rewritten.
Caution [EZ Emulator]
When [Y es] is selected, if internal flash ROM is rewritten by the debugger while the FlashIF clock
(FCLK) of the microcontroller is outside of the guaranteed operating range (that is, while operating with LOCO or subclock), the EZ Emulator will switch the clock source. After rewriting to the
internal flash ROM is completed, the clock will be restored to the previous clock source.
Note that the operating frequency of the peripheral clock will change during internal flash memory rewriting because the clock source is switched.
The clock manipulation enabling setting takes effect when the internal flash ROM is rewritten
after program execution or step execution. Note that the clock source is forcibly switched regardless of the clock manipulation enabling setting if FCLK is outside of the guaranteed operating
range immediately after the debug tool is activated or when the [CPU Reset] button is clicked.
(3) [Connection with Target Board]
You can configure the connection between EZ Emulator and the target board in this category.
R20UT4588EJ0100 Rev.1.00 Page 46 of 423
Nov 01, 2019
Page 47

CS+ V8.03.00 2. FUNCTIONS
Figure 2.48 [Connection with Target Board] Category
(a) [User Vcc[V]]
Specify the value of the microcontroller’s operating voltage that is actually supplied to the user board.
Directly enter a numerical value from 0.0001 to 9.9999 (unit: V).
Caution This property cannot be changed while connected to EZ Emulator.
(b) [Communications method]
Displays the method of communication used by the EZ Emulator for communicating with the microcontroller on
the target system.
You cannot change the value of this property.
For the details of debug tool selection, see "2.3.1 Select the debug tool to use".
(c) [FINE baud rate[bps]]
From the drop-down list, select the baud rate (FINE baud rate) to be used by the EZ Emulator for communicating with the microcontroller on the target system.
The following baud rate is displayed in the drop-down list.
- 1000000 (default), 500000, 250000
Caution 1. This property cannot be changed while connected to EZ Emulator.
Caution 2. Depending on the length or the method of FINE signal wiring on the target system, it may not be
possible to communicate using the selected FINE baud rate. In such a case, reducing the FINE
baud rate may achieve successful communication.
(4) [Flash]
You can configure the flash memory rewriting in this category.
Caution This property cannot be changed while connected to EZ Emulator.
Figure 2.49 [Flash] Category
(a) [Input Mode of ID code]
Specify a mode for the input of ID code.
Caution This property cannot be changed while connected to EZ Emulator.
(b) [ID code]
Enter the ID code to release the flash memory from the protected state.
If you have selected [Specify the ID code as a 32-digit hexadecimal] in the [Input Mode of ID code] property,
enter the ID code in a 32-digit hexadecimal number. If you have selected [Specify the ID code as an ASCII code
within 16 characters], enter the ID code using maximum 16 ASCII characters.
Caution 1. This property cannot be changed while connected to EZ Emulator.
Caution 2. To enter the ID code as a 32-digit hexadecimal value, arrange it as a sequence of 32-bit units of
data.
Byte order of the ID code of the flash programmer can be different from that of CS+. Please confirm the specification about ID code of the flash programmer you’re using.
Caution 3. If the ID code entered in ASCII characters is shorter than 16 characters, the unused space will be
padded with 0.
Caution 4. Even if you have downloaded a program that contains an ID code, that ID code is replaced with
FFFFFFFFFFFFFFFFFFFFFFFFFFFFFFFF.
(c) [Work RAM start address]
Specify the location address of the work RAM to be used by the debugger. Specify an address value that is a
multiple of four bytes. If the entered value is not a multiple of four bytes, the value is automatically corrected.
R20UT4588EJ0100 Rev.1.00 Page 47 of 423
Nov 01, 2019
Page 48
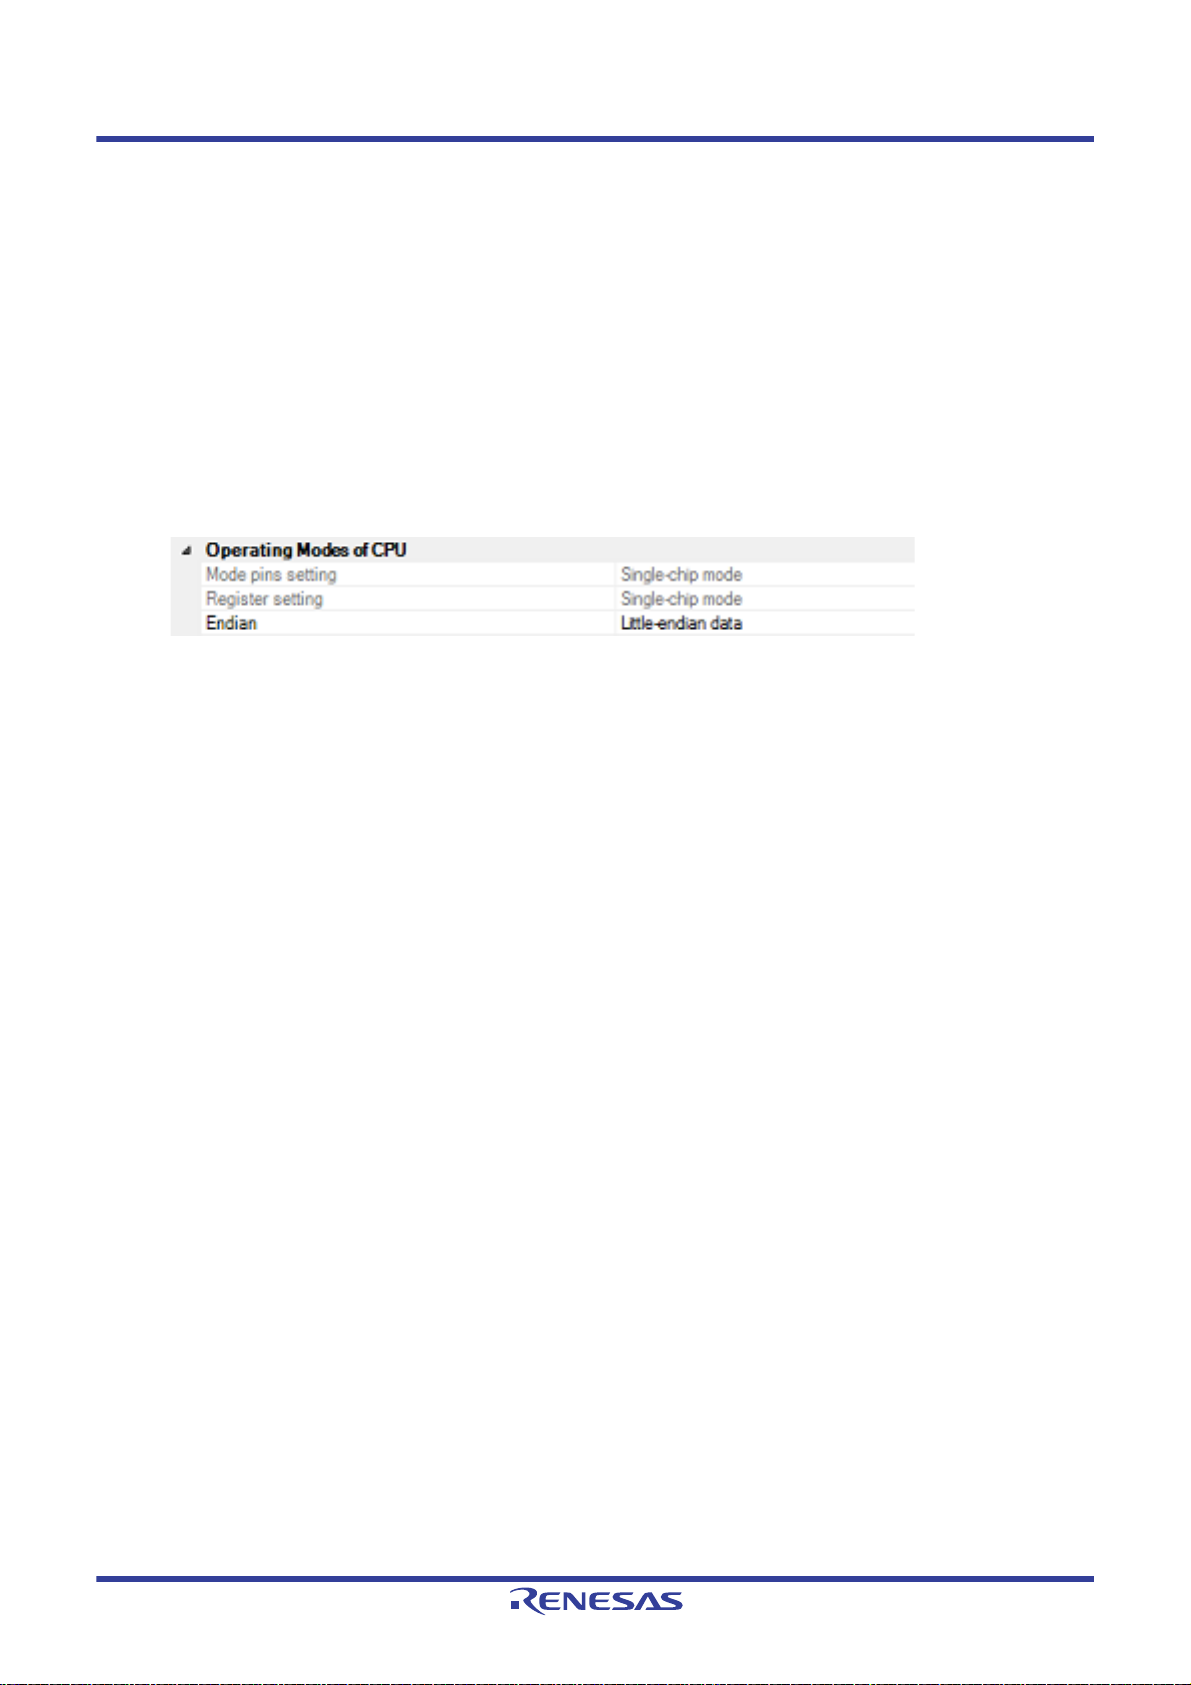
CS+ V8.03.00 2. FUNCTIONS
The amount of memory indicated by the [Work RAM size[bytes]] property beginning with this address is to be
used by the debugger firmware.
Caution 1. This property cannot be changed while connected to EZ Emulator.
Caution 2. The work RAM area can also be used by the user program because the emulator saves and
restores data in this area. Note, however, that the work RAM area is not specifiable as:
the destination or origin of a DMA or DTC transfer, an address where a DTC vector table or transfer information is to be allocated, or the interrupt vector for a DMAC or DTC activation source.
(d) [Work RAM size[bytes]]
Displays the size of the work RAM to be used by the debugger.
(5) [Operating Modes of CPU]
In this category, you configure the operating mode of the microcontroller to be emulated.
Caution This property cannot be changed while connected to EZ Emulator.
Figure 2.50 [Operating Modes of CPU] Category
(a) [Mode pins setting]
Specify the operating mode set by the mode pin of the microcontroller.
The setting is fixed to single-chip mode while the EZ Emulator is in use.
(b) [Register setting]
Specify the operating mode to be set by the register.
The setting is fixed to single-chip mode while the EZ Emulator is in use.
(c) [Endian]
Display the project endian. Acquires endian information from the project and displays its value. Can be selected
only when the debug tool is disconnected.
(6) [External Flash]
In this category, you can configure external flash.
Although this category is controllable while the EZ Emulator is in use, any setting for this category is not reflected
because the microcontroller’s operating mode is fixed to single-chip mode.
2.3.4.2 [Debug Tool Settings] tab
In the [Debug Tool Settings] tab, you configure the basic settings of the debug tool for each one of the following catego-
ries.
(1) [Memory]
(2) [Access Memory While Running]
(3) [Register]
(4) [Break]
(5) [System]
(6) [Trace]
(7) [Timer] [RX600 series]
(1) [Memory]
You can configure the memory in this category.
R20UT4588EJ0100 Rev.1.00 Page 48 of 423
Nov 01, 2019
Page 49

CS+ V8.03.00 2. FUNCTIONS
Figure 2.51 [Memory] Category
(a) [Memory mappings]
Current memory mapping status is displayed for each type of memory area.
It is not possible to change mapping on this panel.
To add or delete an I/O protection area, select the [Memory mappings] property and click on the [...] button that
appears on the right to open the Memory Mapping dialog box. For details on how to change settings, refer to the
section of the Memory Mapping dialog box.
This property displays only the number of memory areas.
Expanding the [Memory mappings] property will display the following sub-items.
- [Memory type]
Indicates the memory type of the corresponding area.
Each memory type corresponds to the following areas.
On-chip ROM area Program ROM
Note 1
and data flash
Note 2
On-chip RAM area On-chip RAM
I/O registers area Peripheral I/O register
Divided into areas with different endians for display
External area(CS7/CS6/.../CS0) External address space
CS0 to CS7 are displayed separa te ly
Other memory area FCU-RAM
Note 3
, FCU firmware
Note 3
, user boot
Reserved area Areas other than those listed above
R20UT4588EJ0100 Rev.1.00 Page 49 of 423
Nov 01, 2019
Page 50

CS+ V8.03.00 2. FUNCTIONS
I/O protection area Address range in an external area that is not read by the
debugger. Register this area in the Memory Mapping dialog
box.
Note 1. If data in the on-chip flash ROM area is changed by means other than downloading (e.g. by
manipulating it via the Memory panel or line assembling), the flash ROM reflects this change
next time the user program is run.
Note 2. If an attempt is made to reference data in erased data flash ROM, only undefined values are
displayed due to the specifications of the microcontroller. If the debugger is used to write to the
data flash ROM, on the othe r h an d , data is written in 256-byte units. Written areas do not hold
undefined values.
Note 3. Do not use the debugger to write to FCU-RAM. The FCU firmware area also cannot be written
by the debugger.
- [Start address]
Displays the starting address of the corresponding area.
- [End address]
Displays the ending address of the corresponding area.
- [Access width[bits]]
Displays the access width of the corresponding area.
When [Memory type] Indicates the memory type of the corresponding area. Each memory type correspo nds
to the following areas. is an external area, the access width can only be changed when the debug tool is dis-
connected.
- [Endian]
Displays the endians of the external area and the I/O register area.
When [Memory type] Indicates the memory type of the corresponding area. Each memory type correspo nds
to the following areas. is an external area, the endian can only be changed when the debug tool is discon-
nected.
Caution Connecting to a debug tool (see "2.4.1 Connect the debug too l to CS+") will display details for
each memory type.
(b) [Verify on writing to memory]
Specify whether to perform a verify check when the memory value is initialized from the drop-down list.
Select [Yes] to perform verification after download or when values are changed in the Watch panel/ Memory
panel.
(2) [Access Memory While Running]
You can configure the memory access while executing a program in this category.
The settings of this category are required when using the real-time display update function. See "2.1 1.1.4 Display-
ing and changing memory contents during program execution" for details on the real-time display update function.
Figure 2.52 [Access Memory While Running] Category
(a) [Access by stopping execution]
Specify from the drop-down list whether to allow access to the memory area while executing a program.
Select [Yes] to allow access ([No] is sele cted by default).
(b) [Update the display during execution]
Specify whether to update the display in the Watch panel/Memory panel while executing a program.
Select [Yes] to update the display (default).
Caution You cannot change this property while the program is in execution.
(c) [Update interval[ms]]
This property is displayed only when the [Update the display during execution] property is set to [Yes].
Specify the interval in 100ms unit to update the contents in the Watch panel/Memory panel display while execut-
ing a program.
R20UT4588EJ0100 Rev.1.00 Page 50 of 423
Nov 01, 2019
Page 51

CS+ V8.03.00 2. FUNCTIONS
Directly enter the Integer number between 100 and 65500 (rounding up the fractions less than 100ms) ([500] is
specified by default).
Note that if you've changed the specified value of the [Update the display during execution] property from [No] to
[Yes], the previous set value is displayed in this property.
Caution You cannot change this property while the program is in execution.
(3) [Register]
In this category, make settings related to PC display in the Status bar during program execution.
Figure 2.53 [Register] Category
(a) [PC display during the execution]
This property specifies whether the PC value is displayed in the Status bar during program execution.
When you select [No], the Status bar under execution will show "Running."
Caution 1. You cannot change this property while the program is in execution.
Caution 2. [RX100 Series]
This property is hidden because these microcontrollers do not support display of the PC value in
the status bar during program execution.
(b) [Display update interval for PC[ms]]
This property is displayed only when you've selected [Yes] in the [PC display during the execution] property.
During program execution, specify a PC display updating interval in the Status bar in 100 ms units.
Enter an integer directly in the range 100 to 65500 (with fractions below 100 ms rounded up). (By default, [500]
is specified.)
Note that if you've changed the specified value of the [PC display during the execution] property fro m [No] to
[Yes], the previous set value is displayed in this property.
Caution You cannot change this property while the program is in execution.
(4) [Break]
You can configure the break function in this category.
Figure 2.54 [Break] Category
(a) [Type of breakpoints to be preferentially used]
Specify from the following drop-down list the type of preferential breakpoint to be used with a single click of the
mouse in the Editor panel/Disassemble panel.
When setting a break point after the preferential break point type has been used up, the other break point type
will be automatically selected.
See "2.10.2 Stop the program at the arbitrary position (breakpoint)" for details on breakpoints.
Software break Sets software breakpoint preferentially.
Hardware break Sets hardware breakpoint preferentially (default).
(5) [System]
You can configure the emulation system in this category.
For more information regarding the execution of a specified routine before the execution and after the break of a
program, see "2.9.4 Execute a specified routine [E1] [E20] [EZ Emulator]".
R20UT4588EJ0100 Rev.1.00 Page 51 of 423
Nov 01, 2019
Page 52

CS+ V8.03.00 2. FUNCTIONS
Figure 2.55 [System] Category
(a) [Debug the program re-writing the on-chip PROGRAM ROM]
Specify whether to debug programs that rewrite on-chip program ROM area, such as those that use ROM P/E
mode.
Caution You cannot change this property while connected to EZ Emulator.
(b) [Debug the program re-writing the on-chip DATA FLASH]
Specify whether to debug programs that rewrite on-chip data flash area, such as those that use data flash P/E
mode.
Caution You cannot change this property while connected to EZ Emulator.
(c) [Execute the specified routine immediately before execution of the user program]
Specify whether to execute a specified routine before executing the user program.
Caution You cannot change this property while the program is in execution.
(d) [Routine to run immediately before execution starts]
Specify the address to be executed immediately before the user program execution. This property is displayed
only when [Execute the specified routine immediately before execution of the user program] property is set to
[Yes].
Caution You cannot change this property while the program is in execution.
(e) [Execute the specified routine immediately after the user program stops]
Specify whether to execute a specified routine after the user program break.
Caution You cannot change this property while the program is in execution.
(f) [Routine to run immediately after execution stops]
Specify the address to be executed immediately after the user program break. This property is displayed only
when [Execute the specified routine immediately after the user program stops] property is set to [Yes].
Caution You cannot change this property while the program is in execution.
(g) [Work RAM start address for executing a specified routine]
Specify the address where the work RAM for use in execution of the specified routine starts. Specify an address
value that is a multiple of four bytes. If the entered value is not a multiple of four bytes, the value is automatically
corrected. The amount of memory indicated by the [Work RAM size [bytes] for executing a specified routine]
property beginning with this address is to be used by the debugger firmware.
This property is displayed only when you have selected [Yes] either for the [Execute the specified routine imme-
diately before execution of the user program] or [Execute the specified routine immediately after the user program stops] property.
Caution 1. You cannot change this property while the program is in execution.
Caution 2. Specify the range of memory that is not used by the user program.
(h) [Work RAM size [bytes] for executing a specified routine]
Indicates the size of the work RAM for use in execution of the specified routine.
This property is displayed only when you have selected [Yes] either for the [Execute the specified routine imme-
diately before execution of the user program] or [Execute the specified routine immediately after the user program stops] property.
(6) [Trace]
You can configure the trace function in this category.
R20UT4588EJ0100 Rev.1.00 Page 52 of 423
Nov 01, 2019
Page 53
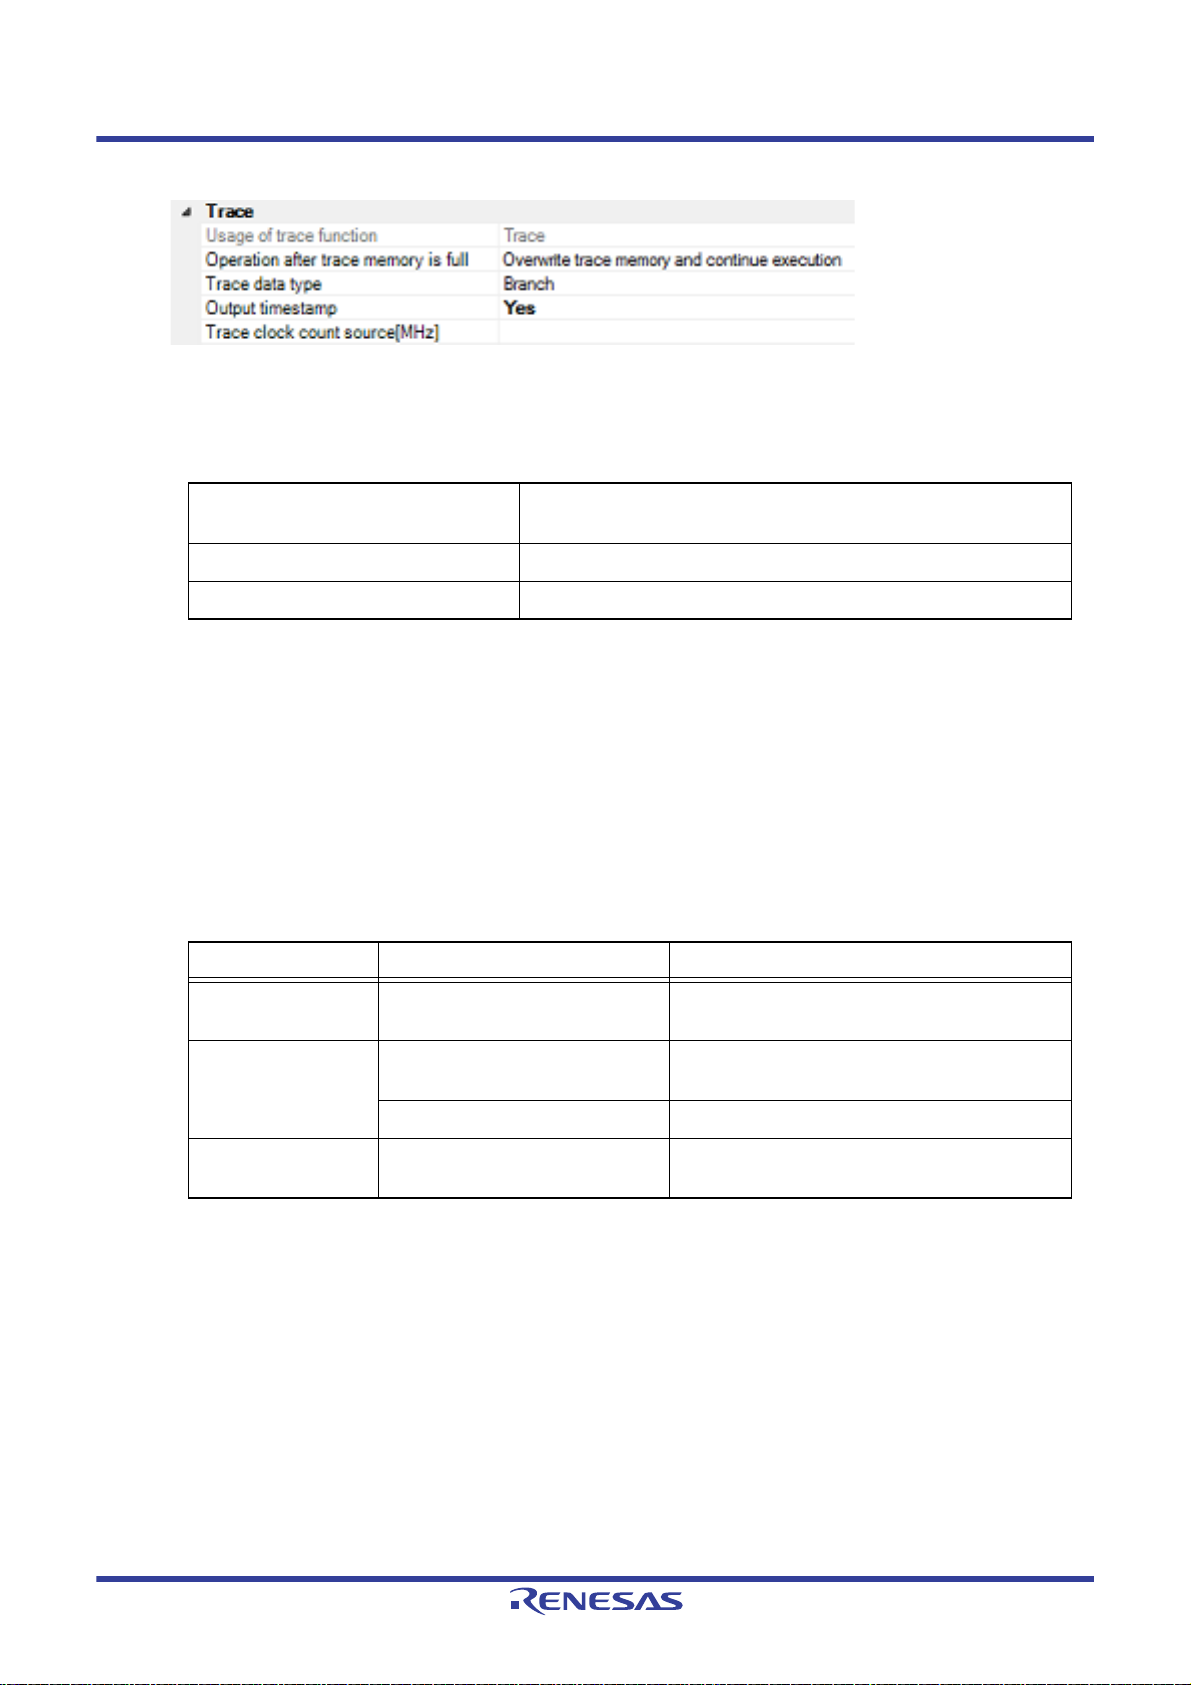
CS+ V8.03.00 2. FUNCTIONS
Figure 2.56 [Trace] Category
(a) [Usage of trace function]
[Trace] is displayed as the usage of trace function.
You cannot change the value of this property.
(b) [Operation after trace memory is full]
Select the trace acquisition mode from the following drop-down list.
Overwrite trace memory and continue
execution
Stop trace Stops writing the trace data after the trace memory is full.
Stop Breaks after the trace memory is full.
(c) [Trace data type]
Select the type of data for which trace is to be acquired from the drop-down list.
The type of data that can be selected differs depending on the series of the microcontroller.
Following data types are displayed in the drop-down list.
- [R X6 00, RX700 Series]
Branch, Branch+Data access, Data access
- [RX100, RX200 Series]
Branch, Data access
(d) [Output timestamp]
Specify whether timestamp information is added to the trace data to be collected.
The change options in this property vary depending on the microcontroller series and the specified value of
[Trace data type] property, as follows:
Microcontroller Data type Change options
RX600, RX700
Series
RX200 Series Branch Not changeable.
Branch, Branch+Data access,
Data access
Continues overwriting the older trace data after the trace memory is
full.
Changeable only when program is halted.
[No] is always displayed.
Data access Changeable only when program is halted.
RX100 Series Branch, Data access Not changeable.
[No] is always displayed.
(e) [Trace clock count source[MHz]]
This property is displayed only when you've specified [Yes] in the [Output timestamp] property.
Enter a count source with which a timestamp value is calculated from a count value.
To specify this, enter a value directly in the range 0.0001 to 999.999.
Note that if this property is blank, the set value of the [Operating frequency [MHz]] property in the [Clock] category of a [Connect Settings] tab is used in place of the count source.
Caution 1. You cannot change this property while the program is in execution.
Caution 2. The property's set value is not reflected in the trace data that has already been collected. The
property you've set is reflected beginning with the trace data that is collected after it is set.
(7) [Timer] [RX600 series]
You can configure the timer function in this category.
R20UT4588EJ0100 Rev.1.00 Page 53 of 423
Nov 01, 2019
Page 54

CS+ V8.03.00 2. FUNCTIONS
Figure 2.57 [Timer] Category
(a) [Use 64bit counter]
Specify whether to use two 32-bit counters or one 64-bit counter.
2.3.4.3 [Download File Settings] tab
You can configure downloading to the debug tool in [Download File Settings] tab. For the details of settings in each cat-
egory, see "2.5.1 Execute downloading".
2.3.4.4 [Hook Transaction Settings] tab
In the [Hook Transaction Settings] tab, you can configure hook transaction for the debug tool.
See "2.18 Setting Up the Hook Process" for details on hook transaction and the settings in each category.
R20UT4588EJ0100 Rev.1.00 Page 54 of 423
Nov 01, 2019
Page 55
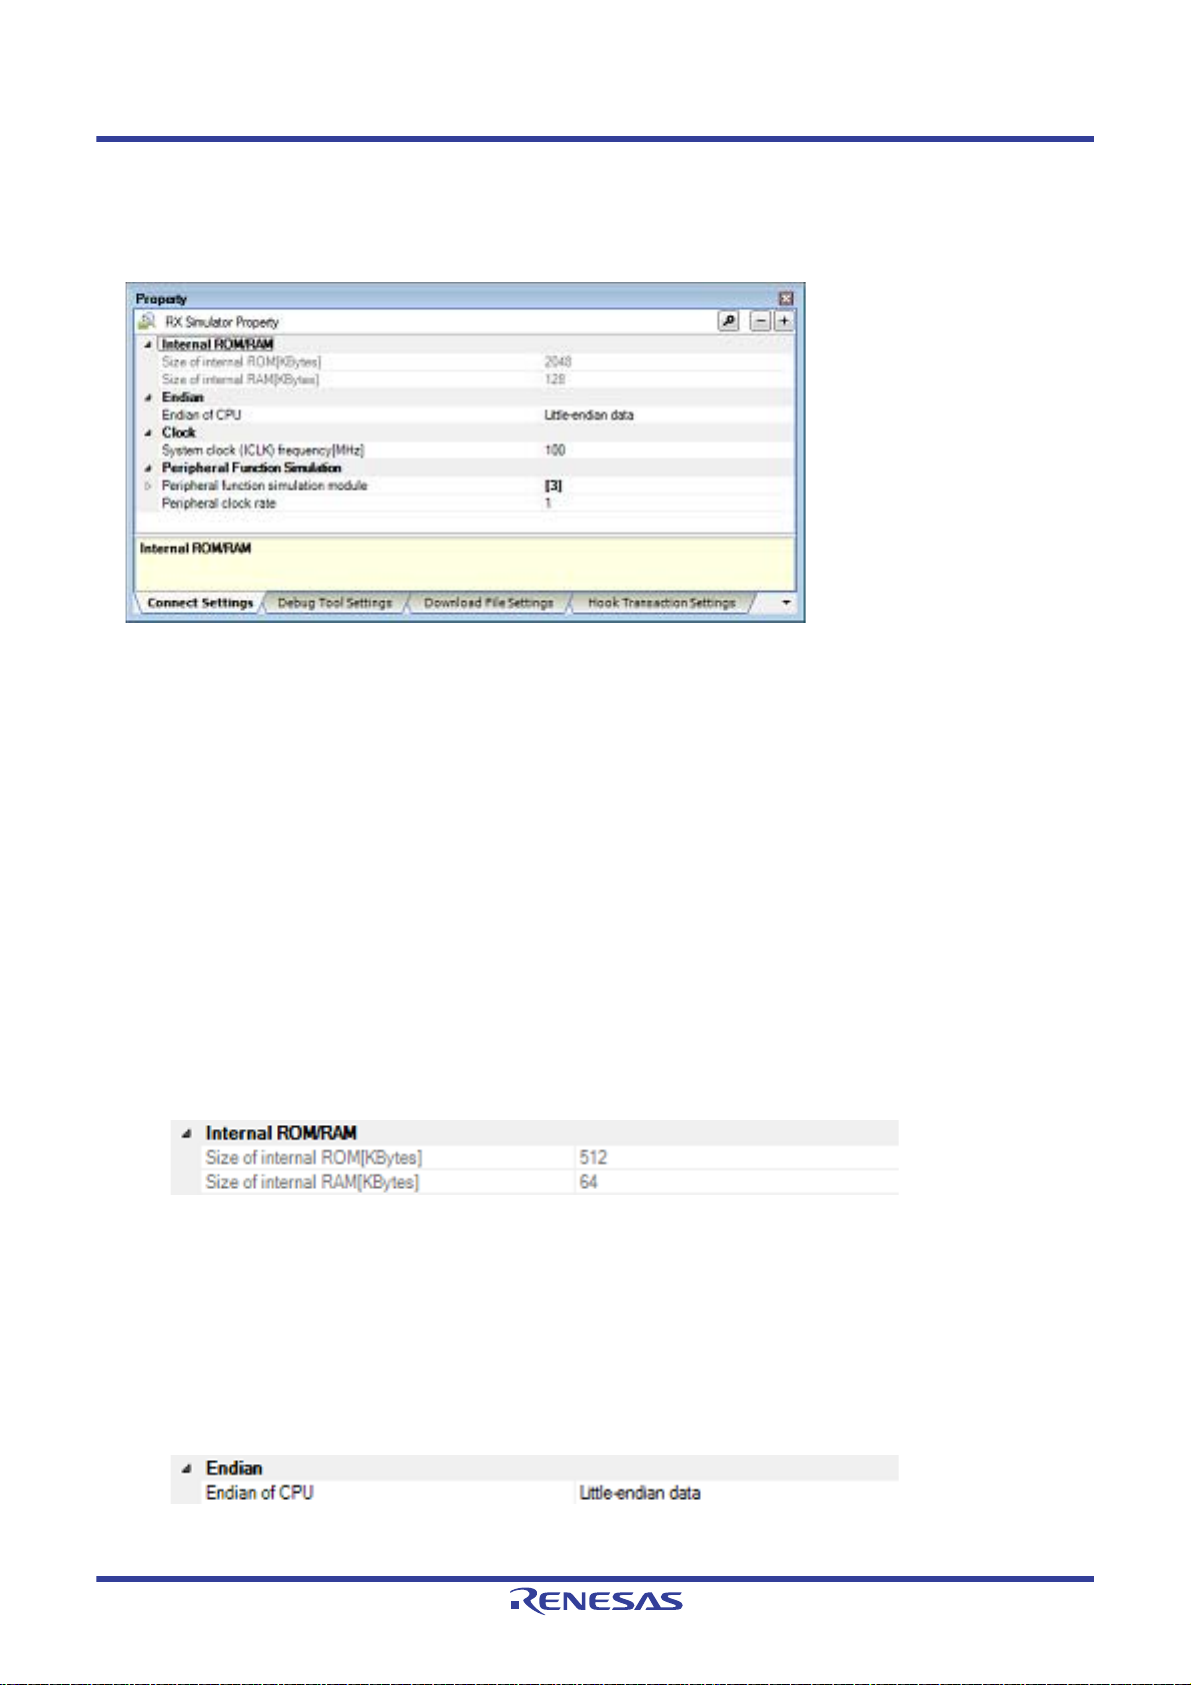
CS+ V8.03.00 2. FUNCTIONS
2.3.5 [Simulator]
Configure the operating environment on the Property panel below when using Simulator.
Figure 2.58 Operating Environment Settings [Simulator] (Property Panel)
Follow the steps below by selecting the corresponding tab on the Property panel.
2.3.5.1 [Connect Settings] tab
2.3.5.2 [Debug Tool Settings] tab
2.3.5.3 [Download File Settings] tab
2.3.5.4 [Hook Transaction Settings] tab
2.3.5.1 [Connect Settings] tab
In the [Connect Settings] tab, you can configure the connection with the debug tool for each one of the following catego-
ries.
(1) [Internal ROM/RAM]
(2) [Endian]
(3) [Clock]
(4) [Peripheral Function Simulation]
(1) [Internal ROM/RAM]
The size of internal ROM/RAM of the selected microcontroller is displayed in this category.
Figure 2.59 [Internal ROM/RAM] Category [Simulator]
(a) [Size of internal ROM[KBytes]
The internal ROM size to simulate is displayed (unit: Kbytes).
You cannot change the value of this property.
(b) [Size of internal RAM[KBytes]]
The internal RAM size to simulate is displayed (unit: Kbytes).
You cannot change the value of this property.
(2) [Endian]
You can configure endian in this category.
Figure 2.60 [Endian] Category [Simulator]
(a) [Endian of CPU]
Specify the endian for the CPU.
R20UT4588EJ0100 Rev.1.00 Page 55 of 423
Nov 01, 2019
Page 56

CS+ V8.03.00 2. FUNCTIONS
By default, the endian selected in the build tool property is displayed.
Caution You cannot change this property while connected to the Simulator.
(3) [Clock]
You can configure clock in this category.
Figure 2.61 [Clock] Category [Simulator]
(a) [System clock (ICLK) frequency [MHz]]
Specify the clock frequency for the CPU (unit: MHz).
You can specify a desired frequency value.
Enter an integer directly in the range 1 to 1,000.
Caution You cannot change this property while connected to the Simulator.
(4) [Peripheral Function Simulation]
You can configure simulation of peripheral functions in this category.
Figure 2.62 [Peripheral Function Simulation] Category
(a) [Peripheral function simulation mod ule]
It displays the name of available peripheral function simulation modules and lets you select from the drop-down
list whether to use each module being displayed.
Select [Use] when using the module ([Not Use] is selected by default).
You cannot change the name of peripheral function simulation modules on this panel.
(b) [Peripheral clock rate]
Specify from the drop-down list the peripheral-to-internal clock ratio that shows the number of internal clock that
is equivalent to 1 peripheral clock.
The following clock rates are displayed in the drop-down list.
1(Default), 2, 3, 4, 6, 8, 12, 16, 24, 32, 64
Caution You cannot change this property while connected to the Simulator.
2.3.5.2 [Debug Tool Settings] tab
In the [Debug Tool Settings] tab, you can configure th e debug tool for each one of the following categories.
(1) [Memory]
(2) [Access Memory While Running]
(3) [Register]
(4) [Trace]
(5) [Coverage]
(6) [Stream I/O]
(7) [Execution mode]
(8) [Instruction decode cache]
(1) [Memory]
You can configure the memory in this category.
R20UT4588EJ0100 Rev.1.00 Page 56 of 423
Nov 01, 2019
Page 57

CS+ V8.03.00 2. FUNCTIONS
Figure 2.63 [Memory] Category [Simulator]
(a) [Memory mappings]
Current memory mapping status is displayed for each type of memory area.
The memory mapping status cannot be changed on this panel. When necessary, you can add a memory mapping in the Memory Mapping dialog box. This dialog box can be displayed by clicking on the [...] button which
appears on the right end of the setting field after selecting [Memory Mapping] prope rty.
See the section for the Memory Mapping dialog box for details on how to configure the parameters.
Figure 2.64 Opening the Memory Mapping Dialog Box
(2) [Access Memory While Running]
You can configure the memory access while executing a program in this category.
The settings of this category are required when using the real-time display update function. See "2.1 1.1.4 Display-
ing and changing memory contents during program execution" for details on the real-time display update function.
Figure 2.65 [Access Memory While Running] Category [Simulator]
(a) [Update display during the execution]
Specify from the drop-down list whether to update the display in the Watch panel/Memory panel during a program execution.
Select [Yes] to update the display (default).
Caution You cannot change this property while the program is in execution.
(b) [Display update interval[ms]]
This property is displayed only when the [Update display during the execution] property is set to [Yes].
Specify the interval in 100ms unit to update the contents in the Watch panel/Memory panel display while execut-
ing a program.
Directly enter the Integer number between 100 and 65500 (rounding up the fractions less than 100ms) ([500] is
selected by default).
Note that if you've changed the specified value of the [Update display during the execution] property from [No] to
[Yes], the previous set value is displayed in this property.
Caution You cannot change this property while the program is in execution.
R20UT4588EJ0100 Rev.1.00 Page 57 of 423
Nov 01, 2019
Page 58
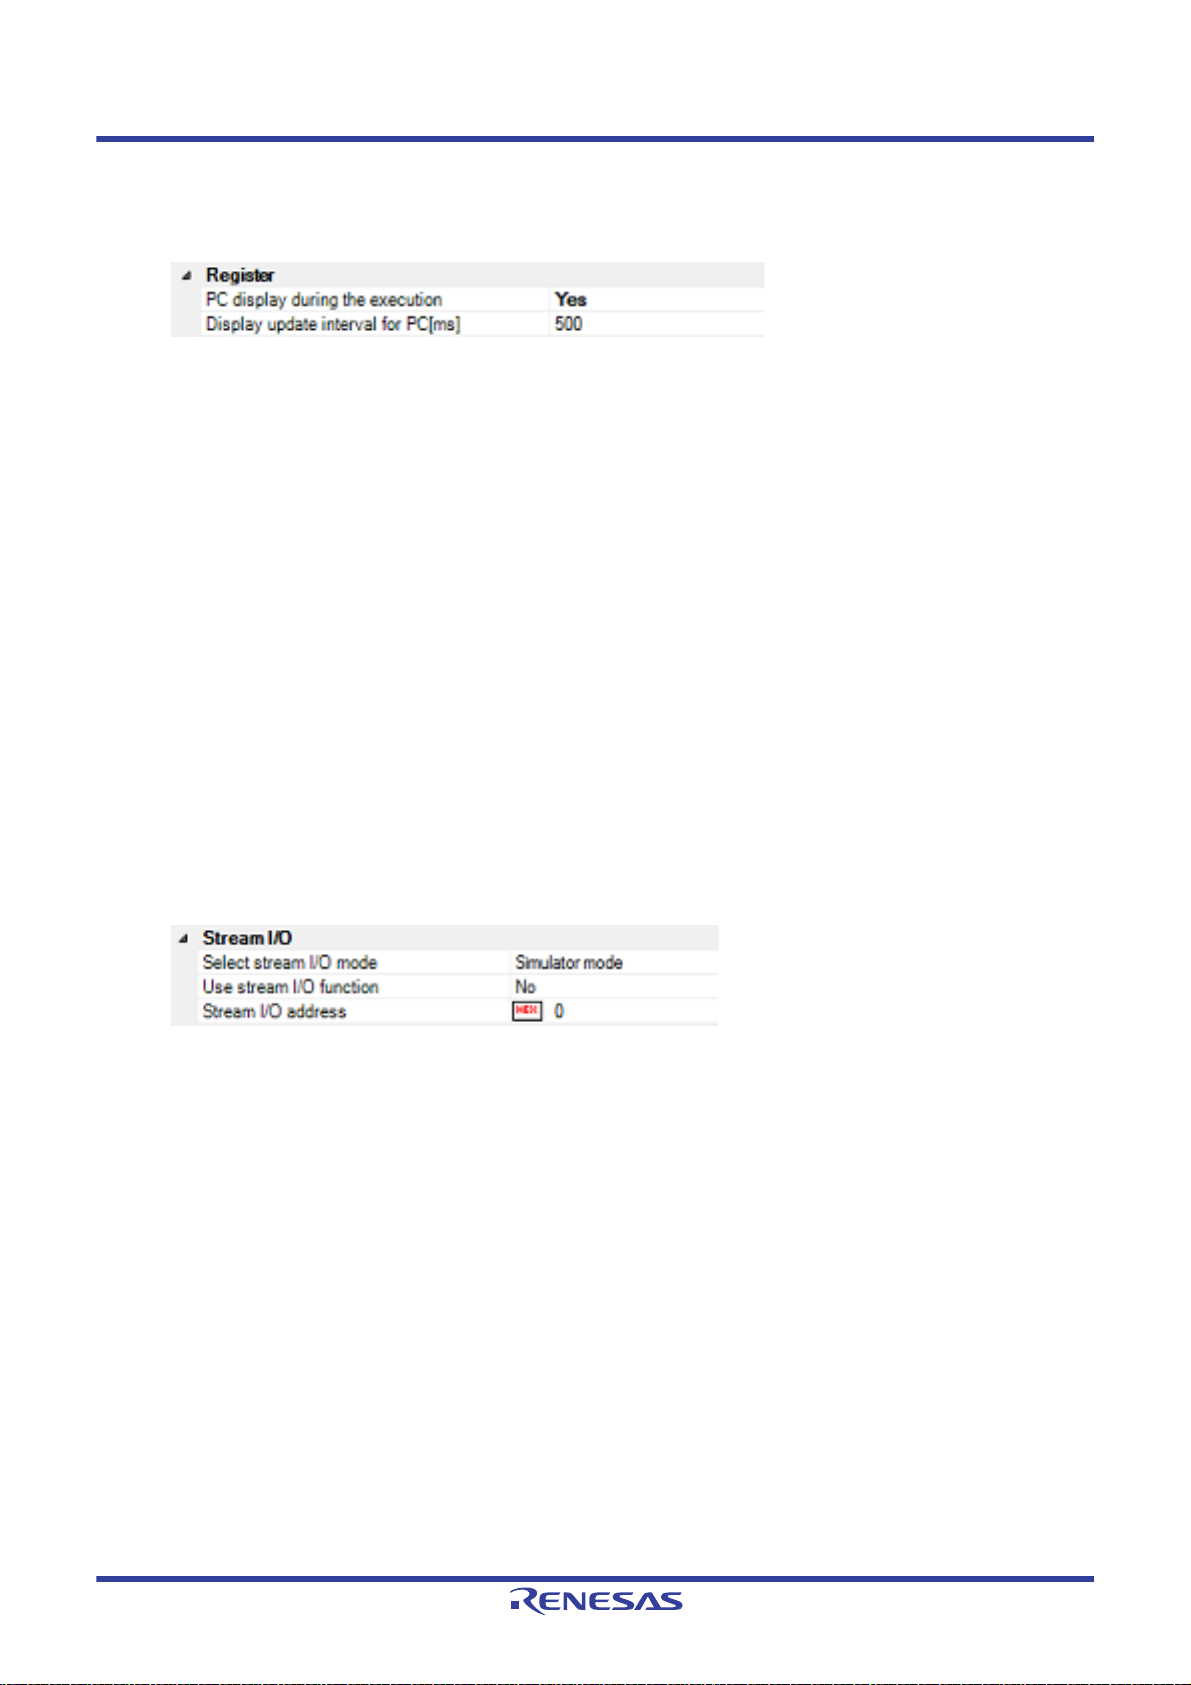
CS+ V8.03.00 2. FUNCTIONS
(3) [Register]
In this category, make settings related to PC display in the Status bar during program execution.
Figure 2.66 [Register] Category [Simulator]
(a) [PC display during the execution]
This property specifies whether the PC value is displayed in the Status bar during program execution.
When you select [No], the Status bar under execution will show "Running."
Caution You cannot change this property while the program is in execution.
(b) [Display update interval for PC[ms]]
This property is displayed only when you've selected [Yes] in the [PC display during the execution] property.
During program execution, specify a PC display updating interval in the Status bar in 100 ms units.
Enter an integer directly in the range 100 to 65500 (with fractions below 100 ms rounded up). (By default, [500]
is specified.)
Note that if you've changed the specified value of the [PC display during the execution] property fro m [No] to
[Yes], the previous set value is displayed in this property.
Caution You cannot change this property while the program is in execution.
(4) [Trace]
You can configure the trace function in this category.
See "2.13 Collecting an Execution History" for details on the trace function and this category configuration.
(5) [Coverage]
You can configure the coverage function in this category.
See "2.15 Measure Coverage [Simulator] [E20 [RX71M, RX66x, RX65x, RX64M, RX66T, RX72T, RX72M, and
RX72N Groups]]" for details on the coverage function and this category configuration.
(6) [Stream I/O]
You can configure the stream I/O for performing standard I/O or file I/O to/from the user program in this category.
Figure 2.67 [Stream I/O] Category
(a) [Select stream I/O mode]
In this property, specify an I/O mode from the drop-down list in which mode you want standard I/O to be executed.
To use files for the same low-level interface routines (assembly language part) as the emulator, specify [Emulator mode]. (By default, [Simulator mode] is specified.)
Remark File I/O is usable only when [Simulator mode] is specified. File I/O cannot be used when [Emula-
tor mode] is specified.
Caution This property cannot be changed when a simulator is connected.
(b) [Use stream I/O function]
This property is displayed only when [Simulator mode] is specified in the [Select stream I/O mode] property.
Specify from the drop-down list whether or not to use the stream I/O function while simulator mode is in use.
Select [Yes] when using this function ([No] is selected by default).
(c) [Stream I/O address]
This property is displayed only when [Simulator mode] is specified in the [Select stream I/O mode] property.
Specify the position at which stream I/O starts while simulator mode is in use.
Directly enter the desired address ([0x00000000] is specified by default).
(7) [Execution mode]
You can configure the operation that is required in the event of simulation error or exception in this category.
R20UT4588EJ0100 Rev.1.00 Page 58 of 423
Nov 01, 2019
Page 59
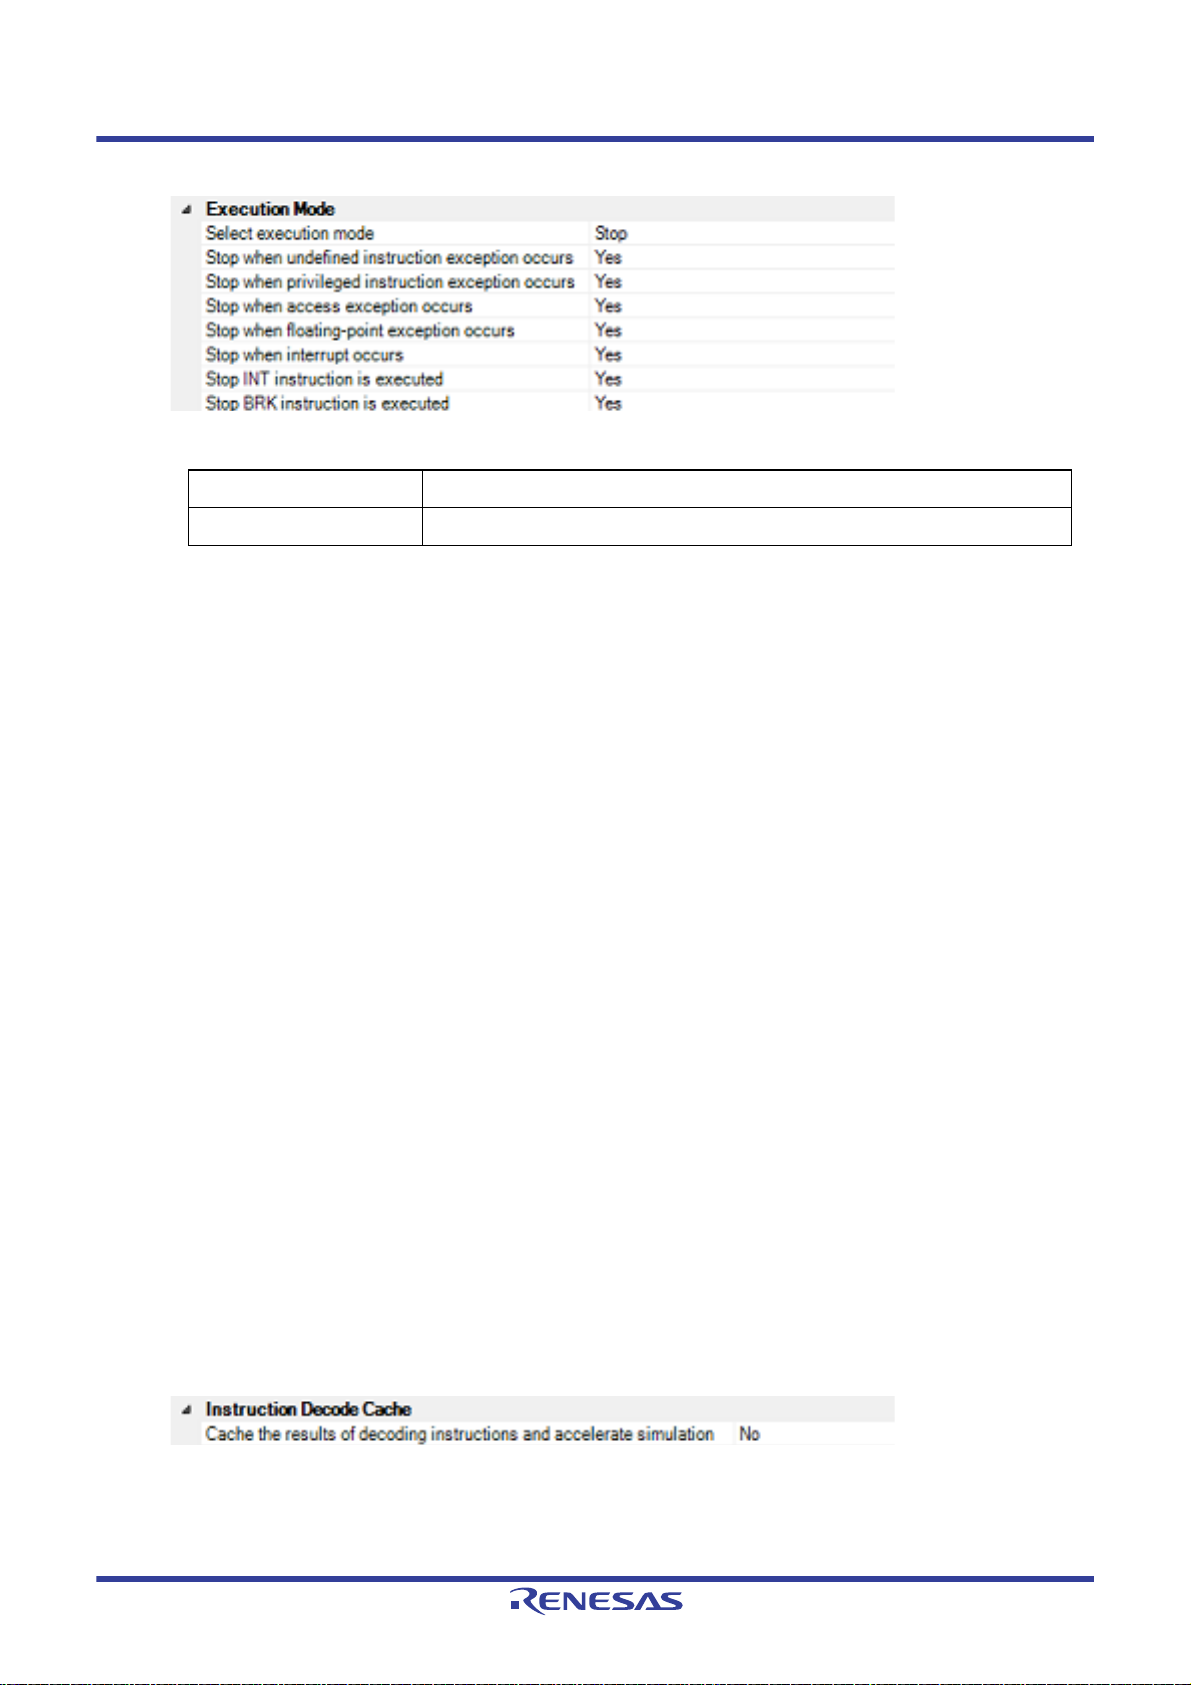
CS+ V8.03.00 2. FUNCTIONS
Figure 2.68 [Execution mode] Category
(a) [Select execution mode]
In this property, you can select the execution mode from the following drop-down list.
Stop Stops simulation (default).
Continue Continues simulation (Property items in the bottom section will be enabled.)
(b) [Stop when undefined instruction exception is encountered]
This property is displayed only when you have selected [Stop] in [Select execution mode] property. S pecify from
the drop-down list whether to stop when undefined instruction exception is encountered. Select [Yes] if you wish
to stop at the occurrence of undefined instruction exception (default).
(c) [Stop when privileged instruction exception is encountered]
This property is displayed only when you have selected [Stop] in [Select execution mode] property. S pecify from
the drop-down list whether to stop when privileged instruction exception is encountered. Select [Yes] if you wish
to stop at the occurrence of privileged instruction exception (default).
(d) [Stop when access exception is encountered]
This property is displayed only when an MPU module exists in [Peripheral function simulation module] property
and you have selected [Stop] in [Select execution mode] property. Specify from the drop-down list whether to
stop when access exception is encountered. Select [Yes] if you wish to stop at the occurrence of access exception (default).
(e) [Stop when floating-point exception is encountered][The microcontrollers with the FPU]
This property is displayed only when you have selected [Stop] in [Select execution mode] property. S pecify from
the drop-down list whether to stop when single-precision floating-point exception is encountered. Select [Yes] if
you wish to stop at the occurrence of single-precision floating-point exception (default).
(f) [Stop when interrupt is encountered]
This property is displayed only when you have selected [Stop] in [Select execution mode] property. S pecify from
the drop-down list whether to stop when interrupt is encountered. Select [Yes] if you wish to stop at the occurrence of interrupt (default).
(g) [Stop INT instruction is executed]
This property is displayed only when you have selected [Stop] in [Select execution mode] property. S pecify from
the drop-down list whether to stop when INT instruction is executed. Select [Yes] if you wish to stop at the execution of INT instruction (default).
(h) [Stop BRK instruction is executed]
This property is displayed only when you have selected [Stop] in [Select execution mode] property. S pecify from
the drop-down list whether to stop when BRK instruction is executed. Select [Yes] if you wish to stop at the execution of BRK instruction (default).
(8) [Instruction decode cache]
In this category, you can configure instruction decode cache, a function which retains decode result during instruction execution so that it can be used again when the instruction at the same address is executed.
Figure 2.69 [Instruction decode cache] Category
(a) [Increase simulation speed by caching instruction decode result]
Specify from the drop-down list whether to enable instruction decode cache function.
Select [Yes] to enable this function ([No] is selected by default).
R20UT4588EJ0100 Rev.1.00 Page 59 of 423
Nov 01, 2019
Page 60

CS+ V8.03.00 2. FUNCTIONS
Caution As the instruction decode cache function reuses the decode result, it cannot be used in programs
that employ self-modifying code. If an instruction is modified as a result of unintended program
operation, error detection may not be performed properly.
2.3.5.3 [Download File Settings] tab
In the [Download File Settings] tab, you can configure download setting for the debug tool.
See "2.5.1 Execute downloading" for details on each category configuration.
2.3.5.4 [Hook Transaction Settings] tab
In the [Hook Transaction Settings] tab, you can configure hook transaction for the debug tool.
See "2.18 Setting Up the Hook Process" for details on each category configuration and hook transaction.
R20UT4588EJ0100 Rev.1.00 Page 60 of 423
Nov 01, 2019
Page 61

CS+ V8.03.00 2. FUNCTIONS
The information of the debug tool appears at this area.
2.4 Connect to/Disconnect from the Debug Tool
This section describes connection to and disconnection from the debug tool including hot plug-in connection.
2.4.1 Connect the debug tool to CS+
Select the [Debug] menu >> [Connect to Debug Tool] to connect to the debug tool selected in the currently active proj-
ect.
After succeeding in the connection to the debug tool, the Status bar of the Main window changes as follows:
For details on each item displayed on the Status bar, see the section of the "Main window".
Figure 2.70 Status Bar Indicating the Successful Connection to the Debug Tool
Remark When the button on the Debug toolbar is clicked, it will download the specified file after connecting
to the debug tool (see "2.5.1 Execute downloading").
When the button on this toolbar is clicked, it will build the project, connect to the debug tool and then
download the specified file.
(1) Display the Version Information [E1] [E20] [EZ Emulator]
After successful connection to the debug tool, the version information such as the emulator firmware version and
the emulator information such as supplied voltage are displayed on the Output panel.
Figure 2.71 Output Panel after Connection [E1]
R20UT4588EJ0100 Rev.1.00 Page 61 of 423
Nov 01, 2019
Page 62
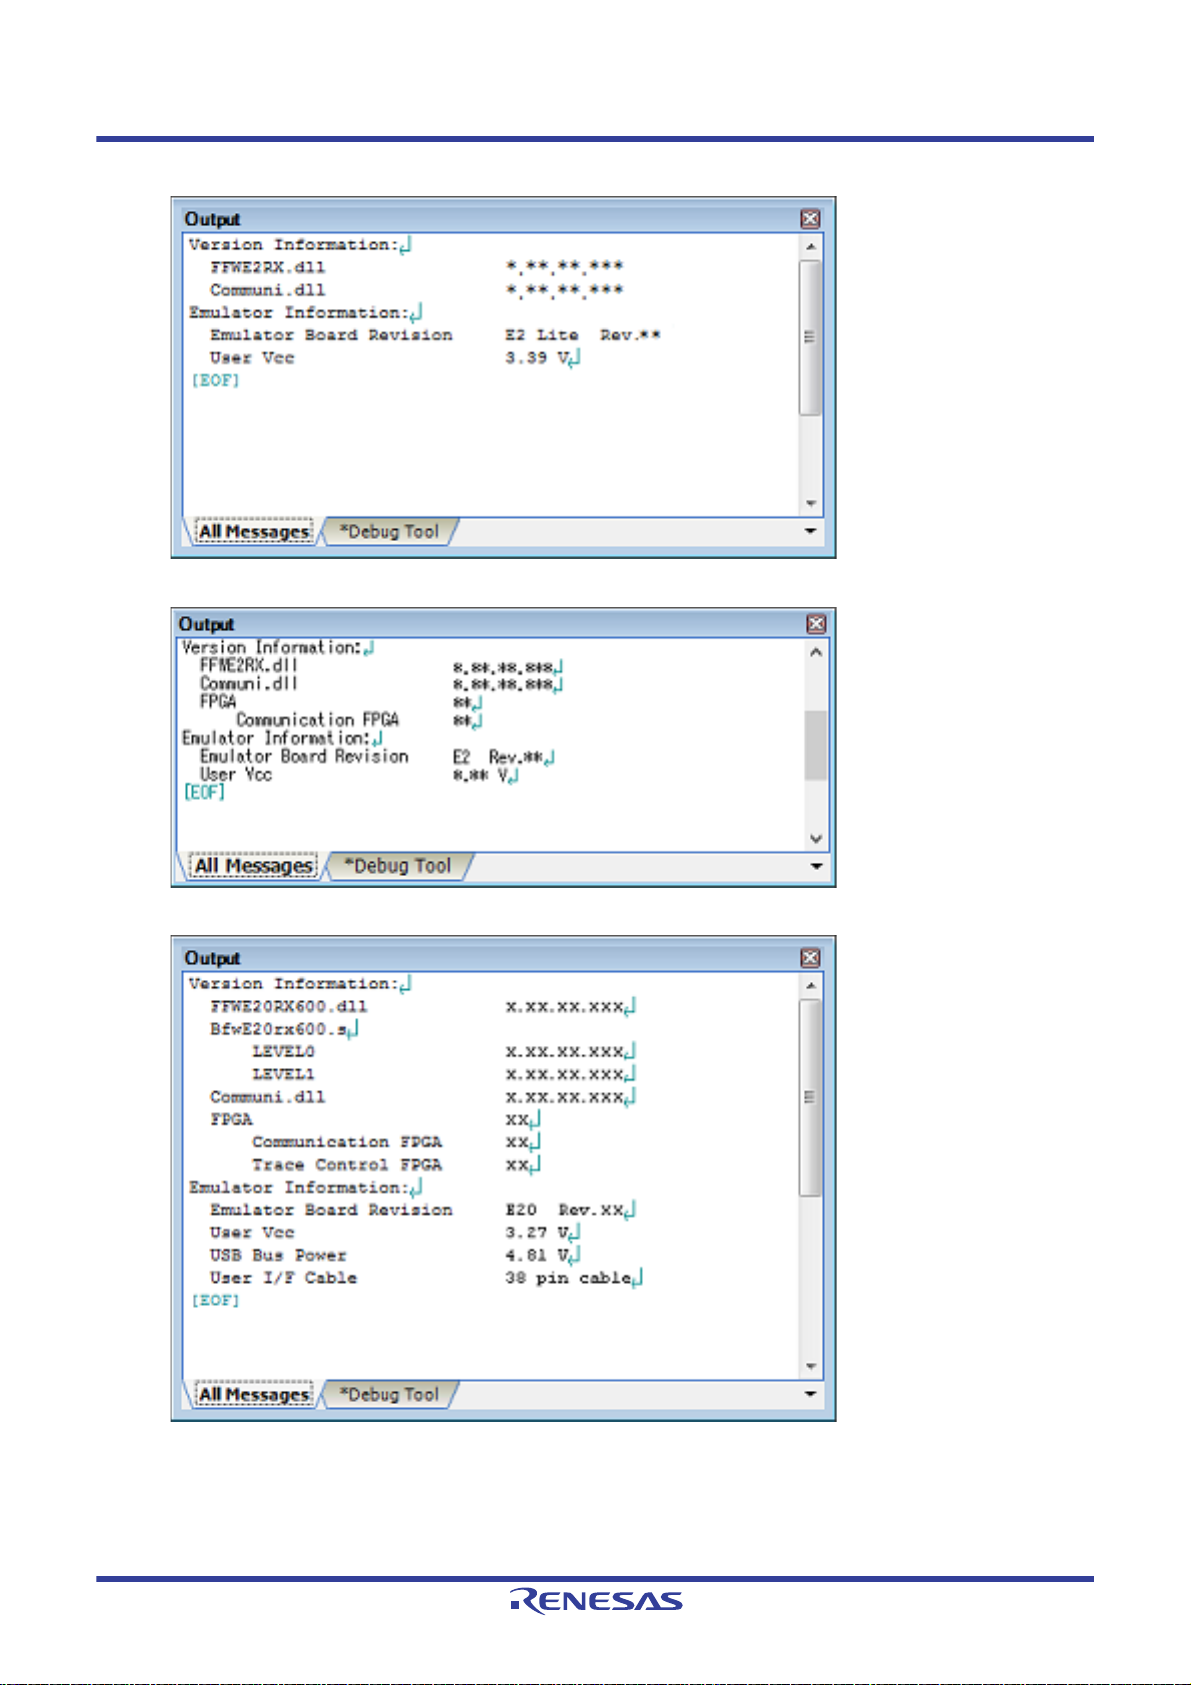
CS+ V8.03.00 2. FUNCTIONS
Figure 2.72 Output Panel after Connection [E2 Lite]
Figure 2.73 Output Panel after Connection [E2]
Figure 2.74 Output Panel after Connection [E20]
R20UT4588EJ0100 Rev.1.00 Page 62 of 423
Nov 01, 2019
Page 63
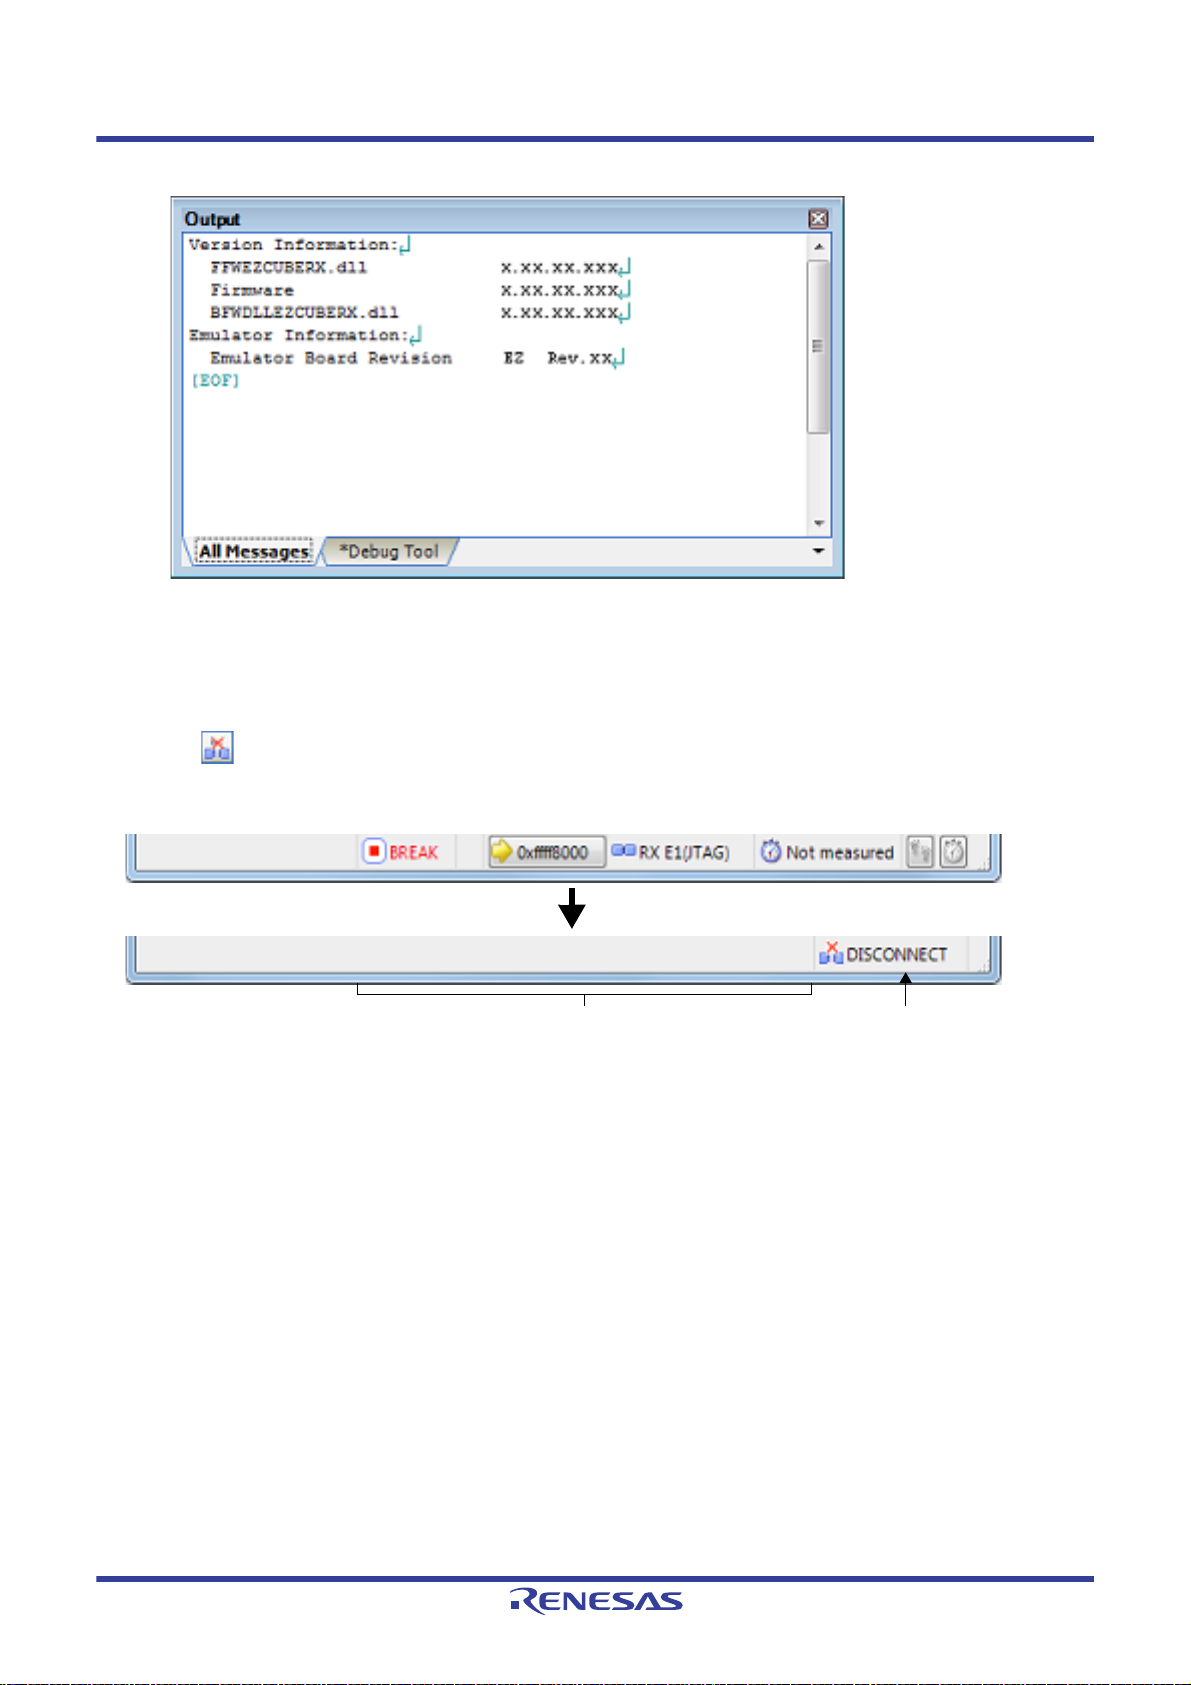
CS+ V8.03.00 2. FUNCTIONS
This area is left blank. "DISCONNECT" is displayed.
Figure 2.75 Output Panel after Connection [EZ Emulator]
Caution [E1] [E20]
When the emulator firmware should be updated, it is automatically updated. To ensure this update,
do not disconnect the USB or power supply until connection is established.
2.4.2 Disconnect the debug tool from CS+
Click the button on the Debug toolbar to cut off the communication with the connected debug tool.
After disconnecting from the debug tool, the Status bar on the Main window changes as follows:
Figure 2.76 Status Bar Indicating the Disconnection from the Debug Tool
Caution 1. The debug tool cannot be disconnected from CS+ while the program is running. If you wish to disconnect
the debug tool, stop the program in advance.
Caution 2. [E1] [E20] [EZ Emulator]
If you are using the E1, E20, or EZ Emulator, select the above or either of the following ways to disconnect the debug tool from CS+.
(1) Select [Disconnect from Debug Tool] from the [Debug] menu.
(2) Enter “debugger.Disconnect()” in the Python Console panel.
If you terminate the debugger, you will not be able to start up the debugger correctly next time. In such a
case, turn the power off and turn it on again (i.e. turn off the power switch on the E20 and turn it on or disconnect the USB interface cable from the E1 or EZ Emulator and re-connect it). When using EZ Emulator, also restart CS+.
Remark Disconnecting the debug tool will close all the panels and dialog boxes that can be displayed only during
the connection.
2.4.3 Connect the debug tool to CS+ using hot plug-in [E1(JTAG)] [E20(JTAG)]
With hot plug-in function, you can connect the debug tool to the CS+ and debug the program while it is in execution.
Follow the steps below to establish hot plug-in connection.
(1) Execute the program
Execute the program which has been downloaded onto the microcontroller on the target system without connecting to the emulator.
R20UT4588EJ0100 Rev.1.00 Page 63 of 423
Nov 01, 2019
Page 64

CS+ V8.03.00 2. FUNCTIONS
This area shows information on the currently active debug tool.
"RUN" indicates that the program is running.
(2) Specify the debug tool
In the active project, specify the debug tool which supports hot-plug in connection ([E1(JTAG)]/[E20(JTAG)]).
Remark [E1(Serial)] [E20(Serial)] [EZ Emulator]
Hot plug-in connection is not supported.
(3) Connect the debug tool to CS+ using hot plug-in
Select [Hot Plug-in] from [Debug] menu to initiate the preparation for hot plug-in connection.
(4) Connect to the target system
Following message will appear once you are ready to start hot plug-in connection. Connect the emulator to the target system and click [OK]. This will start the communication with the debug tool which is selected in the currently
active project.
Figure 2.77 Message Indicating that Hot Plug-in Connection Is Ready to be Started
Caution [E1(JTAG)]
To establish hot plug-in connection, you need to connect the emulator to the target system via "Hotplug Adapter" (R0E000010ACB00) which is optionally available.
(5) Hot plug-in connection completed
Once the connection to the debug tool is successfully completed, the Status bar on the Main window will change
as shown below. For details on each item displayed on the Status bar, see the section of the "Main window".
Figure 2.78 Status Bar Indicating the Successful Hot plug-in Connection to the Debug Tool
Caution 1. The trace function will not be available until the program breaks following the completion of hot plug-in
connection.
Caution 2. The real-time RAM monitor function (RRM function) will not be available until the program breaks follow-
ing the completion of hot plug-in connection. Do not select [Real-time RAM monitor] for the [Usage of
trace function] property under the[Trace] category.
Caution 3. Once the hot plug-in connection is established, all the events that have been set in the project as the user
information (excluding built-in event) will be deleted.
Caution 4. When conducting hot plug-in connection, do not use a project for which software break point is set as it
may result in unsuccessful connection. Check that all the software break points are deleted in the Events
panel of the active project before starting hot plug-in connection (see 2.17.5 Deleting events).
R20UT4588EJ0100 Rev.1.00 Page 64 of 423
Nov 01, 2019
Page 65

CS+ V8.03.00 2. FUNCTIONS
Caution 5. The emulator stops the program temporarily for approximately 800s to check the ID code at hot plug-in
connection (CPU clock: 100 MHz, JTAG clock: 16.5 MHz).
Caution 6. [RX630, RX631, RX63N, RX63T, and RX634 Groups]
Confirm that the endian settings of the endian select registers (MDEB, MDES) written on the microcontroller match the endian information of the project. See the hardware manual of the microcontroller for the
details of endian select registers.
Hot plug-ins cannot be used while a flash rewrite program is running.
R20UT4588EJ0100 Rev.1.00 Page 65 of 423
Nov 01, 2019
Page 66

CS+ V8.03.00 2. FUNCTIONS
2.5 Download and Upload
This section describes how to download the program to be debugged (e.g., load module files) into CS+, and how to
upload the memory content under debug from CS+ to files.
2.5.1 Execute downloading
Download the load module files to be debugged.
Following the procedure below, make the necessary settings for downloads on the Property panel's [Download File Set-
tings] tab before you execute a download.
(1) Setting the [Download] category
Figure 2.79 [Download] Category [E1(JTAG)] [E1(Serial)] [E20(JTAG)] [E20(Serial)] [EZ Emulator]
Figure 2.80 [Download] Category [Simulator]
(a) [Download files]
Displays the file names to be downloaded, as well as download conditions. (The numeric value in property value
"[ ]" indicates the number of files currently specified to be downloaded).
The files to be downloaded here are those files that have been specified as the subject to build in the main project and sub-projects. This means that the same files that were spec ified in the project are automatically deter-
Note
mined
However, the files to be downloaded and the download conditions can be manually changed. In this case, see
"2.5.2 An applied method of download".
Note To download the load module files created by an external build tool (e.g., compilers and assem-
(b) [CPU Reset after download]
Specify from the drop-down list whether or not to reset the CPU after a download is completed.
to be the download files.
blers other than the build tools supplied with CS+), a debug-dedicated project needs to be created.
If you use a debug-dedicated project as the subject to debug, add your download files to the
download file node on project tree. The files to be downloaded will be reflected in this property.
For details on how to use "external build tools" and details about "debug-dedicated projects," see
the separate edition, "CS+ Integrated Development Environment User's Manual: Project Operation".
R20UT4588EJ0100 Rev.1.00 Page 66 of 423
Nov 01, 2019
Page 67

CS+ V8.03.00 2. FUNCTIONS
To reset the CPU, select [Yes] (default).
(c) [Erase flash ROM before download] [E1] [E20] [EZ Emulator]
Specify from the drop-down list whether or not to erase the flash ROM (program ROM) before a download is
executed.
To erase the flash ROM, select [Yes].
(d) [Erase data flash ROM before download] [E1] [E20] [EZ Emulator]
Specify from the drop-down list whether or not to erase the data flash ROM before a download is executed.
To erase the data flash ROM, select [Yes]. (By default, [No] is selected).
(e) [Automatic change method of event setting position]
If, as debug work proceeds, a program which has had changes added is downloaded again, the position
(address) at which a currently set event is set may happen to be in the middle of an instruction. In such a case,
use this property to specify how the subject event should be handled.
Select one of choices from the drop-down list below.
Move to the head of
instruction
Suspend event Leaves th e subject event pending (default).
However, specification on this property applies to only the event set positions for which debug information is
nonexistent. For the event set positions that have debug information, the event is always moved to the beginning of the source text line.
(2) Setting the [Debug Information] category
Figure 2.81 [Debug information] Category
(a) [Execute to the specified symbol after CPU Reset]
Specify from the drop-down list whether or not to run the program up to a specified symbol position after the
CPU is reset, or after a download is completed (only when you specified [Yes] on the [CPU Reset after down-
load] property).
To run the program up to a specified symbol position, select [Yes] (default).
Remark If, while you specified [Y es] on the [CPU Reset after download] property, you specify [Yes] on this
property , the Editor panel opens automatically af ter a download is completed, with the source text
at the position you specified on [Specified symbol] property displayed on it.
Also, if you specify [No] here, this panel opens, with the reset address displayed on it. (If the
reset address has no source text mapped to it, the relevant place is displayed on the Disassem-
ble panel.)
(b) [Specified symbol]
This property is displayed only when you specified [Yes] on the [Execute to the specified symbol after CPU
Reset] property.
Specify a position at which you want the program being run after the CPU is reset to be halted.
Enter an address expression directly in the range 0 to "end address of address space" to specify the position.
(By default, [_main] is specified.)
However, if the specified address expression cannot be converted into an address, the program is not executed.
Remark Normally, specify the following.
For assembler source: Beginning label equivalent to the main function
For C source: Symbol given at the beginning of the main function name
(c) [Specify the debugged overlay section]
"Yes" is displayed when overlay sections (see "2.8 Setting Overlay Sections" for details) exist in the load module.
Otherwise "No" is displayed. This entry cannot be changed.
(d) [Overlay sections]
Address groups where overlay sections exist are displayed.
Resets the subject event at the beginning address of the instruction.
R20UT4588EJ0100 Rev.1.00 Page 67 of 423
Nov 01, 2019
Page 68

CS+ V8.03.00 2. FUNCTIONS
This property only appears when "Yes" is displayed on the [Specify the debugged overlay section] property.
(e) [The upper limit size of the memory usage[MBytes]]
Specify the maximum size [Mbytes] of memory to be used to read debug information.
Directly enter an integer between 100 and 1000 ([500] is specified by default).
When an insufficient memory error occurs, specifying a smaller value for this maximum size may reduce the
occurrence of the error. However, a smaller maximum size may degrade the response speed of the debug tool.
Caution By default, CPU reset automatically occurs after downloading the file, and then the program is exe-
cuted to the specified symbol position. If this operation above is not needed, specify [No] with both
of the [CPU Reset after download] and [Execute to the specified symbol after CPU Reset] property.
(3) Executing a download
Click the button in the Debug toolbar.
If this operation is performed while CS+ is disconnected from the debug tool, it is automatically connected to the
debug tool before a download is executed.
Remark To download a file which has had changes added in the course of debug work again, choose [Build
& Download to Debug Tool] from the [Debug] menu on the Main window, which will help you build
and download easily.
(4) Canceling a download
To cancel a download, click on the [Cancel] button on the Progress Status dialog box, which displays the progress
of downloading, or press the [Esc] key.
When the load module files have been successfully download, the Editor panel opens automatically, with the source text
of the downloaded files displayed on it.
Remark A process can be set that automatically rewrites I/O register or CPU register values with specified values
before or after a download (see Section "2.18 Setting Up the Hook Process").
2.5.2 An applied method of download
The files to download, as well as the download conditions applied at download time can be changed.
CS+ permits files in the following formats to be downloaded.
Table 2.2 Downloadable File Formats
File Format Extension Remark
Load module format abs
Intel Hex format
- Standard (offset address)
- 02 (segment address code)
- 04 (extension linear address code)
Motorola S format
- (S0, S1, S9-16 bits)
- (S0, S2, S8-24 bits)
- (S0, S3, S7-32 bits)
Binary data format bin
To change the downlo ad files, or set the download conditions applied at download time, use the Download Files dialog
box shown below.
The Download Files dialog box is opened by clicking the [...] button that is displayed at the right edg e in the column of
the [Download files] property when you select it in the [Download] category on the Property panel's [Download File Set-
tings] tab.
hex 03 (start segment address code) and 05 (start
linear address code) are ignored.
mot
R20UT4588EJ0100 Rev.1.00 Page 68 of 423
Nov 01, 2019
Page 69

CS+ V8.03.00 2. FUNCTIONS
[Download file list] area
[Download file property] area
Figure 2.82 Opening the Download Files Dialog Box
Figure 2.83 An Applied Method of Download (Download Files Dialog Box)
Here, a method on how to set in the Download Files dialog box shown above is described, using the following cases as
examples.
2.5.2.1 Changing the down lo ad conditions for load module files
2.5.2.2 Adding a download file (*.hex, *.mot, or *.bin)
2.5.2.3 Downloading multiple load module files
2.5.2.4 Performing source-level debug with hex format, Motorola S format, or binary data format files
2.5.2.5 Downloading files to exte rn a l fl a sh me mory [E1] [E20]
2.5.2.1 Changing the download conditions for load module files
To change the download conditions for load module files (whether to load object information or symbol information)
under which they are downloaded, follow the procedure described below as you fill in the Download Files dialog box
(1) Selection of a load module file
In the [Download file list] area, select the load module file to download.
(2) Alteration of downloa d co nd i t i o ns
In the [Download file list] area, you'll see the download conditions for the currently selected load module file displayed in it.
For each displayed item, change their setting.
.
R20UT4588EJ0100 Rev.1.00 Page 69 of 423
Nov 01, 2019
Page 70

CS+ V8.03.00 2. FUNCTIONS
Download object Specify whether or not to download object information from a specified file.
Default Yes
Download symbol
information
Specify the PIC/
PID offset
Method to
By selecting from drop-down list
change
Specifiable
value
Specify whether or not to download symbol information from a specified file
Yes Downloads object information.
No Does not download object information.
Note 1
.
Default Yes
Method to
By selecting from drop-down list
change
Specifiable
value
Yes Downloads symbol information.
No Does not download symbol information.
Specify whether or not to change the positions of PIC (Position Independent Code) and
PID (Position Independent Data) areas of the load module to be downloaded from those
at which they were when the load module was created. When this item is changed to
[Yes], "PIC Offset" and "PID Offset" are displayed in the sub-item.
Default No
Method to
By selecting from drop-down list
change
Specifiable
Yes Specifies PIC/PID offset
Note 2
.
value
No Does not specify PIC/PID offset.
PIC Offset Enter an offset value from an address that was in the load module when it was created.
For example, if the program section's start address begins with the address 0x1000, enter
"1000" for this item. The subject section is downloaded to the address 0x2000.
Default 0
Method to
By entering directly from the keyboard
change
Specifiable
Hexadecimal number in the range 0x0 to 0xFFFFFFFF
value
PID Offset Enter an offset value to be set in the PID register that was specified in the load module
when it was created.
For example, to set 0x200 in the PID register when the load module is executed, enter
"200" for this item.
Default 0
Method to
By entering directly from the keyboard
change
Specifiable
Hexadecimal number in the range 0x0 to 0xFFFFFFFF
value
R20UT4588EJ0100 Rev.1.00 Page 70 of 423
Nov 01, 2019
Page 71

CS+ V8.03.00 2. FUNCTIONS
Generate the information for input
completion
Note 1. Unless symbol information is downloaded, source-level debugging cannot be performed.
Note 2. If you select [Yes] for load modules created not using the PIC/PID functions (see Section “2.7
Usage of PIC/PID Function“), debug operation cannot be guaranteed.
(3) Clicking the [OK] button
Settings you've made in this dialog box are ena bled, with the download conditions changed.
This item is displayed only when the files to be downloaded are in the load-module format.
Specify whether or not to generate information for use by the auto-complete feature while
symbol information is being downloaded from a specified file.
If you use the symbol name completion function in "Watch panel", "Memory panel", select
is "Yes".
Download time is long in order to generate this information during the download.
Default Yes
How to
change
Specifiable
value
Select from the drop-down list.
Yes Generate information for use by the auto-complete fea-
ture
No Does not generate information for use by the auto-com-
plete feature
2.5.2.2 Adding a download file (*.hex, *.mot, or *.bin)
To add a file to download (hex format (*.hex), Motorola S format (*.mot), or binary data format (*.bin)), follow the proce-
dure described below as you fill in the Download Files dialog box.
(1) Clicking the [Add] button
When you click the [Add] button, a blank item ("-") is displayed on the last line in the [Download file list] area.
(2) Setting the properties of a download file to add
In the [Download file property] area, select a download file you want to add and set its download conditions.
For each displayed item, make the following setting.
When setting is completed, the file name you've specified here is reflected in the blank item in the [Download file
list] area.
File Specify a download file to add (hex format (*.hex), Motorola S format (*.mot), or binary
data format (*.bin)) (specifiable in up to 259 characters).
Default Blank
Method to
change
Specifiable
values
By entering directly from the keyboard, or specifying in the Select Download File dialog box that is opened by clicking the […] button displayed at
the right edge of this property when it is selected
See "Table 2.2 Downloadabl e File Formats".
R20UT4588EJ0100 Rev.1.00 Page 71 of 423
Nov 01, 2019
Page 72

CS+ V8.03.00 2. FUNCTIONS
File type Specify the file type of a download file to add.
Here, select [Hex File], [S Record File] or [Binary Data File].
Default Load module file
Method to
change
Specifiable
values
Offset This item is displayed only when the file to download is a hex format (*.hex) or Motorola S
format (*.mot).
Specify an offset value from the address at which a download of a specified file begins.
Default 0
Method to
change
Specifiable
values
Start address This item is displayed only when the file to download is a binary data format (*.bin). Spec-
ify the start address from which a specified file is downloaded.
Default 0
Method to
change
By selecting from drop-down list
Either one of the following
- Load module file
-Hex file
- S record file
- Binary data file
By entering directly from the keyboard
Hexadecimal number in the range 0x0 to 0xFFFFFFFF
By entering directly from the keyboard
Specifiable
values
Remark Specification of whether or not to download object information or symbol information is accepted
only when the type of file to download is a load module file.
(3) Confirming the order in which a download is executed
A download is executed in the order in which files are displayed in the [Download file list] area.
To change the order, use the [Up] or [Down] button to move any file up or down in the list.
(4) Clicking the [OK] button
Settings you've made in this dialog box are enabled, with the specified file added as a download file (T he added
file name and its download condition are displayed in the [Download] category on the Property panel's [Download
File Settings] tab).
Hexadecimal number in the range 0x0 to 0xFFFFFFFF
2.5.2.3 Downloading multiple load module files
To download multiple load module files, follow the procedure described below as you fill in the Download Files dialog
box.
Caution When debugging a program comprised of multiple load module files, be careful that location addresses
will not overlap.
Remark When multiple load module files are downloaded, the load module names are displayed as the detailed
information on the Events panel.
(1) Clicking the [Add] button
When you click the [Add] button, a blank item ("-") is displayed on the last line in the [Download file list] area.
(2) Setting the properties of a download file to add
In the [Download file property] area, select a download file you want to add and set its download conditions.
For each displayed item, make the following setting.
R20UT4588EJ0100 Rev.1.00 Page 72 of 423
Nov 01, 2019
Page 73

CS+ V8.03.00 2. FUNCTIONS
When setting is completed, the file name you've specified here is reflected in the blank item in the [Download file
list] area.
File Specify a file in load modul e format to add (sp ecifiable in up to 259 characters).
Default Blank
Method to
change
By entering directly from the keyboard, or specifying in the Select Download File dialog box that is opened by clicking the [...] button displayed at
the right edge of this property when it is selected
Specifiable
See "Table 2.2 Downloadabl e File Formats"
values
File type Specify the file type of a download file to add.
Here, select [Load module file].
Default Load module file
Download object Specify whether or not to download object information from a specified file.
Default Yes
Method to
By selecting from drop-down list
change
Download symbol
Specifiable
values
Specify whether or not to download symbol information from a specified file
Yes Downloads object information.
No Does not download object information.
information
Default Yes
Method to
By selecting from drop-down list
change
Note 1
.
Specify the PIC/
PID offset
Specifiable
values
Specify whether or not to change the positions of PIC (Position Independent Code) and
PID (Position Independent Data) areas of the load module to be downloaded from those
Yes Downloads symbol information.
No Does not download symbol information.
at which they were when the load module was created. When this item is changed to
[Yes], "PIC Offset" and "PID Offset" are displayed in the sub-item.
Default No
Method to
By selecting from drop-down list
change
Specifiable
values
Yes Specifies PIC/PID offset
No Does not specify PIC/PID offset.
Note 2
.
PIC Offset Enter an offset value from an address that was in the load module when it was created.
For example, if the program section's start address begins with the address 0x1000, enter
"1000" for this item. The subject section is downloaded to the address 0x2000.
Default 0
Method to
By entering directly from the keyboard
change
Specifiable
Hexadecimal number in the range 0x0 to 0xFFFFFFFF
values
R20UT4588EJ0100 Rev.1.00 Page 73 of 423
Nov 01, 2019
Page 74

CS+ V8.03.00 2. FUNCTIONS
PID Offset Enter an offset value to be set in the PID register that was specified in the load module
when it was created.
For example, to set 0x200 in the PID register when the load module is executed, enter
"200" for this item.
Default 0
Method to
change
Specifiable
values
Note 1. Unless symbol information is downloaded, source-level debugging cannot be performed.
Note 2. If you select [Yes] for load modules created not using the PIC/PID functions (see Section “2.7
Usage of PIC/PID Function“), debug operation cannot be guaranteed.
Remark For the load module files that do not require symbol information, you can set [No] for the [Download
symbol information] item to reduce the amount of memory used (However, this file cannot be
debugged at the source level.).
(3) Confirming the order in which a download is executed
A download is executed in the order in which files are displayed in the [Download file list] area.
To change the order, use the [Up] or [Down] button to move any file up or down in the list.
(4) Clicking the [OK] button
Settings you've made in this dialog box are enabled, with the specified load module file added as a download file.
(The added file is displayed in the [Download] category on the Property panel’s [Download File Settings] tab).
By entering directly from the keyboard
Hexadecimal number in the range 0x0 to 0xFFFFFFFF
2.5.2.4 Performing source-level debug with hex format, Motorola S format, or binary data format files
Even when a file in hex format (*.hex), Motorola S format (*.mot), or binary data format (*.bin) is specified to be the subject file to download, it is possible to do source-level debug by downloading symbol information for the load module file
from which the subject file was created, along with the subject file that you download.
In this case, follow the procedure described below as you fill in the Download Files dialog box.
(1) Clicking the [Add] button
When you click the [Add] button, a blank item ("-") is displayed on the last line in the [Download file list] area.
(2) Setting the properties of a load module file
In the [Download file property] area, specify for each item as shown below.
File Specify a load module file from which the file in hex format (*.hex), Motorola S format
(*.mot), or binary data format (*.bin) that you want to download was created.
Enter directly from the keyboard, or specify in the Select Download File dialog box that is
opened by clicking the […] button.
File type Specify [Load module file] (default).
Download object Specify [No].
Download symbol
information
Specify the PIC/
PID offset
Note For files in hex format, Motorola S format, or binary data format, be aware that the destination to
which they are downloaded cannot be discriminated between the PIC and PID areas. If you specify
PIC/PID offsets in a load module file, the result will be that the specified offsets do not agree with
the debug function and the file cannot be debugged.
(3) Clicking the [OK] button
Settings you've made in this dialog box are enabled, with the specified load module file added as a download file
(Only the symbol information included in the load module file becomes the subject to download.).
Specify [Yes] (default).
Specify [No] (default)
Note
.
R20UT4588EJ0100 Rev.1.00 Page 74 of 423
Nov 01, 2019
Page 75
CS+ V8.03.00 2. FUNCTIONS
2.5.2.5 Downloading files to external flash memory [E1] [E20]
The download files you've specified in the Download Files dialog box can be downloaded to the flash memory con-
nected to an external bus of the microcontroller used (i.e., the external flash memory).
In this case, follow the procedure described below.
(1) Setting up the Property panel
In the [External Flash] [E1] [E20] category on the Property panel's [Debug Tool Settings] tab, register an external
flash definition file (USD file).
External flash memory is recognized by registering a USD file in the [External Flash] [E1] [E20] category. Up to
four USD files can be registered.
By clicking the "+" mark of an external flash definition file, the definition file name, start and end addresses, and
whether to erase the external flash ROM before downloading are displayed for each index ([1] to [4]).
Figure 2.84 [External Flash] Category
(a) [External flash definition file]
Shows the maximum number of registrable USD files.
To register a USD file, specify a USD file name in the [File] property that is expanded on display as a sub-property.
Enter a file name directly (if specified by a relative path, it should be referenced to the project folder), or select a
file in the External flash memory dialog box [E1] [E20] that is opened by clicking the [...] button, which is displayed at the right edge in the setup column of this property when it is selected.
After a USD file is registered, the [Start address], [End address], and [Erase external flash ROM before download] sub-properties are added to the displayed information.
For the [Start address] and [End address] properties, the external flash memory area defined in the registered
USD file is displayed (this information cannot be modified).
For the [Erase external flash ROM before download] property, select [Yes] or [No] from the drop-down list.
To eras e the external flash ROM before downloading, select [Yes]. ([No] is selected by default.)
To delete registration of a USD file, move the caret to the file name on the relevant [File] property and then click
the [Delete] key.
For more information on USD files, visit Renesas website and see the user's manual for the External Flash Definition Editor.
Figure 2.85 Opening the External flash memory Dialo g Box
Caution 1. The endian information in USD files is not reflected on the [Memory mappings] property in the
[Memory] category on the Property panel's [Debug Tool Settings] tab. Therefore, the endian in the
external area to which they are downloaded should be changed to suit the endian information in
USD files.
Caution 2. When the address ranges of multiple registered USD file s overlap each other, connection with the
debug tool cannot be established.
Caution 3. For downloading in external flash memory, internal RAM or CS-area RAM can be used as a work
area. Note that SDRAM areas (SDCS) are not usable.
R20UT4588EJ0100 Rev.1.00 Page 75 of 423
Nov 01, 2019
Page 76

CS+ V8.03.00 2. FUNCTIONS
Caution 4. To allocate a device to multiple CS areas, set [Erase external flash ROM before download] to [No]
in the Property panel.
Caution 5. The work RAM area can also be used by the user program because the emulator saves and
restores data in this area. Note, however, that the work RAM area is not specifiable as:
- The destination or origin of a DMA or DTC transfer
- An address where a DTC vector table or transfer information is to be allocated
- The interr upt vector for a DMAC or DTC activation source
Remark If the manufacturer ID or device ID does not match, the read value and expected value are dis-
played in the Output panel.
Figure 2.86 Error Messages in the Output Panel
(2) Setting the CPU operation mode
For files to be downloaded to external flash memory, it is necessary to set the microcontroller's operation mode
when connecting with the debug tool. T o do this, change the [Register setting] property in the [Operating Modes of
CPU] [E1] [E20] [EZ Emulator] category on the Property panel's [Debug Tool Settings] tab by selecting [On-chip
ROM enabled extended mode] or [On-chip ROM disabled extended mode] from the pull down list, as shown
below.
Figure 2.87 Specifying the CPU Operation Mode
(3) Executing a download
Execute a download (see “(3) Executing a download").
Caution 1. External flash memory cannot be rewritten on the Memory panel.
Caution 2. When downloading to the external flash memory, if you are using external RAM as working RAM, set it to
the same endian as the CPU.
Caution 3. Only flash memory with 4096 or fewer sectors can be registered. If flash memory with more sectors is
connected, programming cannot be guaranteed.
R20UT4588EJ0100 Rev.1.00 Page 76 of 423
Nov 01, 2019
Page 77
CS+ V8.03.00 2. FUNCTIONS
Caution 4. To use a flash memory device that does not support the use of the Lock command, specify that the lock
bit be cleared when you generate USD files. This specification helps you omit an unnecessary process to
confirm the lock bit status.
Likewise set [Erase external flash ROM before download] to [No] in the Property panel.
* The lock command refers to a command to be executed in the following command sequence.
command sequence:
1st cycle 2nd cycle 3rd cycle 4th cycle
Address 555H 2AAH 555H Block address
Data AAH 55H 48H X1H / X0H
2.5.3 Executing an upload
The memory content of the currently connected debug tool can be saved (uploaded) to any file.
To do an upload, use th e Data Save dialog box that is opened by choosing [Upload...] from the [Debug] menu.
Follow the procedure described below to make the necessary setting in this dialog box.
Figure 2.88 Uploading Memory Contents (Data Save Dialog Box)
(1) Specifying the [File Name]
Specify a file name in which you save.
Enter directly in the text box (specifiable in up to 259 characters), or select an input history item from the dropdown list (up to 10 history entries).
Also, you can select a file from the Select Data Save File dialog box that is opened by clicking the [...] button.
(2) Specifying the [File Type]
Select the type of file in which you want to save from the drop-down list below.
The selectable file types are as follows:
Table 2.3 Uploadable File Formats
List display Format
Intel Hex format (*.hex) Hex format
Motorola S-format (*.mot) S Record format
Binary data (*.bin) Binary data format
Note In the Intel hex format, memory contents are always saved in "extension linear address code (32-bit
address)."
(3) Specifying the [Save Range Address/Symbol]
Specify the "start address" and "end address" to set a range of memory to be saved in a file.
Enter hexadecimal values or address expressions directly in the respective text boxes or select an input history
item from the drop-down list (up to 10 history entries).
Note
R20UT4588EJ0100 Rev.1.00 Page 77 of 423
Nov 01, 2019
Page 78

CS+ V8.03.00 2. FUNCTIONS
Remark By holding down [Ctrl]+[Space] keys in this text box, you can complete the symbol name at the
present caret position (see "2.21.2 Symbol name completion function").
(4) Clicking the [Save] button
Memory contents are saved in specified form to a specified file as upload data.
R20UT4588EJ0100 Rev.1.00 Page 78 of 423
Nov 01, 2019
Page 79
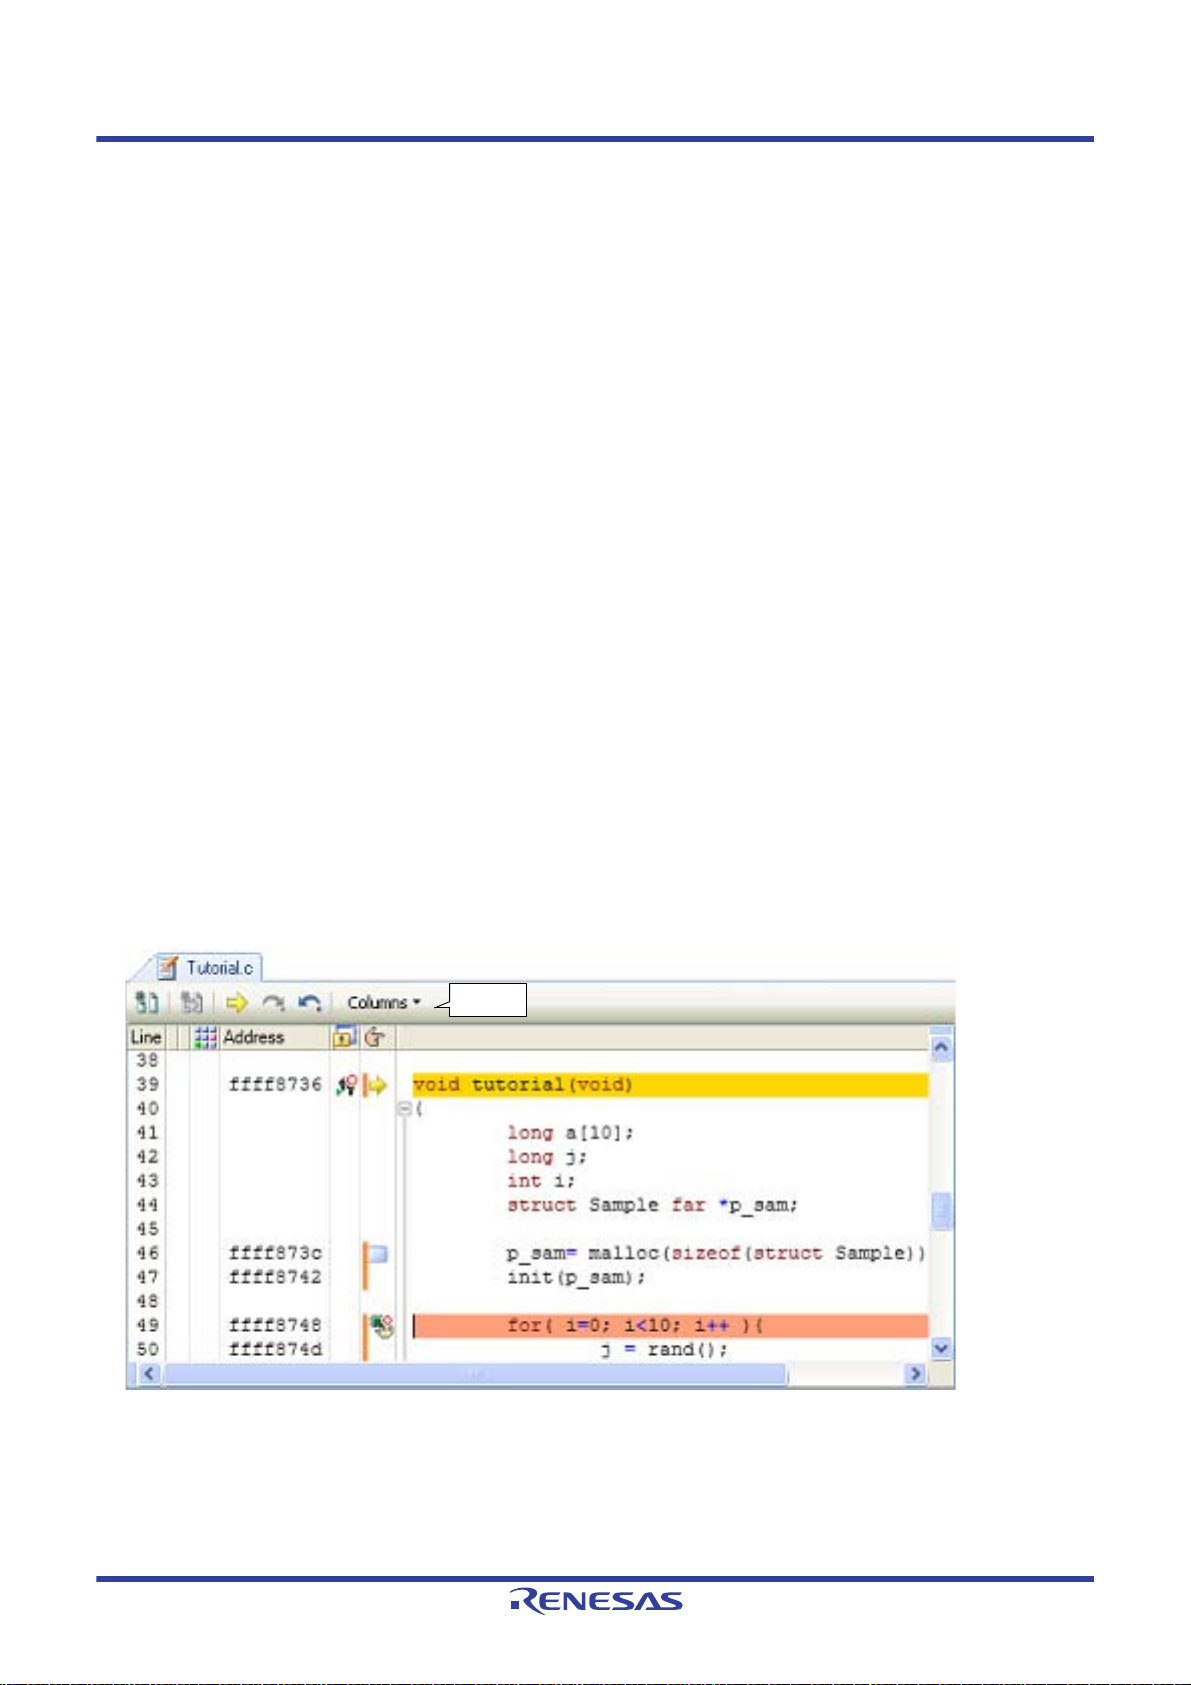
CS+ V8.03.00 2. FUNCTIONS
Toolbar
2.6 Displaying and Changing Programs
This section describes how to display and change programs when a load module file with the debug information is
downloaded to a debug tool.
Downloaded programs can be displayed in the following panels.
- Editor panel
The source file is displayed and can be edited.
Furthermore, the source level debugging (see "2.9.3 Execute programs in steps") and the display of the code coverage measurement result (see "2.15.2 Display coverage measurement results") can be performed in this panel.
- Disassemble panel
The result of disassembling the downloaded program (the memory contents) is displayed and can be edited (line
assemble).
Furthermore, the instruction level debugging (see "2.9.3 Execute prog rams in step s") and the display of the code coverage measurement result (see "2.15.2 Display coverage measurement results") can be performed in this panel. In
this panel, the disassembled results can be displayed with the corresponding source text (default).
Remark It is normally necessary to download a load module file with debugging information in order to perform
the source level debugging, but it is also possible to do so by downloading a hex format (*.hex), Motorola
S format (*.mot), or binary data format (*.bin) file (see "2.5.2.4 Performing source-level debug with hex
format, Motorola S format, or binary data format files").
2.6.1 Displaying source files
Use the Editor panel shown below to display the source file.
The Editor panel opens automatically after a load module file is successfully downloaded, with the source text at the
position you specified (see "2.5.1 Execute downloading") displayed on the panel.
If you want to open the Editor panel manually, double-click on the source file in the Project Tree panel.
For details on the contents and function in each area, see "CS+ Integrated Development Environment User's Manual:
Editor".
Figure 2.89 Displaying the Source File (Editor Panel)
R20UT4588EJ0100 Rev.1.00 Page 79 of 423
Nov 01, 2019
Page 80

CS+ V8.03.00 2. FUNCTIONS
Address area
Disassemble area
Event area
Toolbar
2.6.2 Displaying the disassembled result
To display the disassembled result (disassembled text) of a downloaded program (memory content), use the Disassem-
ble panel shown below.
Choose [Disassemble] from the [View] menu and then select [Disassemble1 - 4].
Up to four disassemble panels can be opened at a time, with each panel discriminated by the name in their title bar,
"Disassemble1," "Disassemble2," "Disassemble3," or "Disassemble4."
For details on how to read each area and details about their functionality, see the section in which the Disassemble
panel is described.
Figure 2.90 Displaying the Disassembled Result (Disassemble Panel)
Remark In the Scroll Range Settings dialog box which opens by clicking on [View] >> , in the toolbar, you can
set the scroll range of the vertical scroll bar on this panel.
Following methods of operation are described here.
2.6.2.1 Changing the display mo de
2.6.2.2 Changing the display fo rm
2.6.2.3 Moving to a specified address
2.6.2.4 Moving to a symbol definition part
2.6.2.5 Saving the displayed contents of disassembled results
2.6.2.1 Changing the display mode
You can change the display mode of the Disassemble panel by clicking the button (toggle) on the toolbar.
- Mixed display mode
In this display mode (default), the disassembled text is displayed combined with the source text.
R20UT4588EJ0100 Rev.1.00 Page 80 of 423
Nov 01, 2019
Page 81
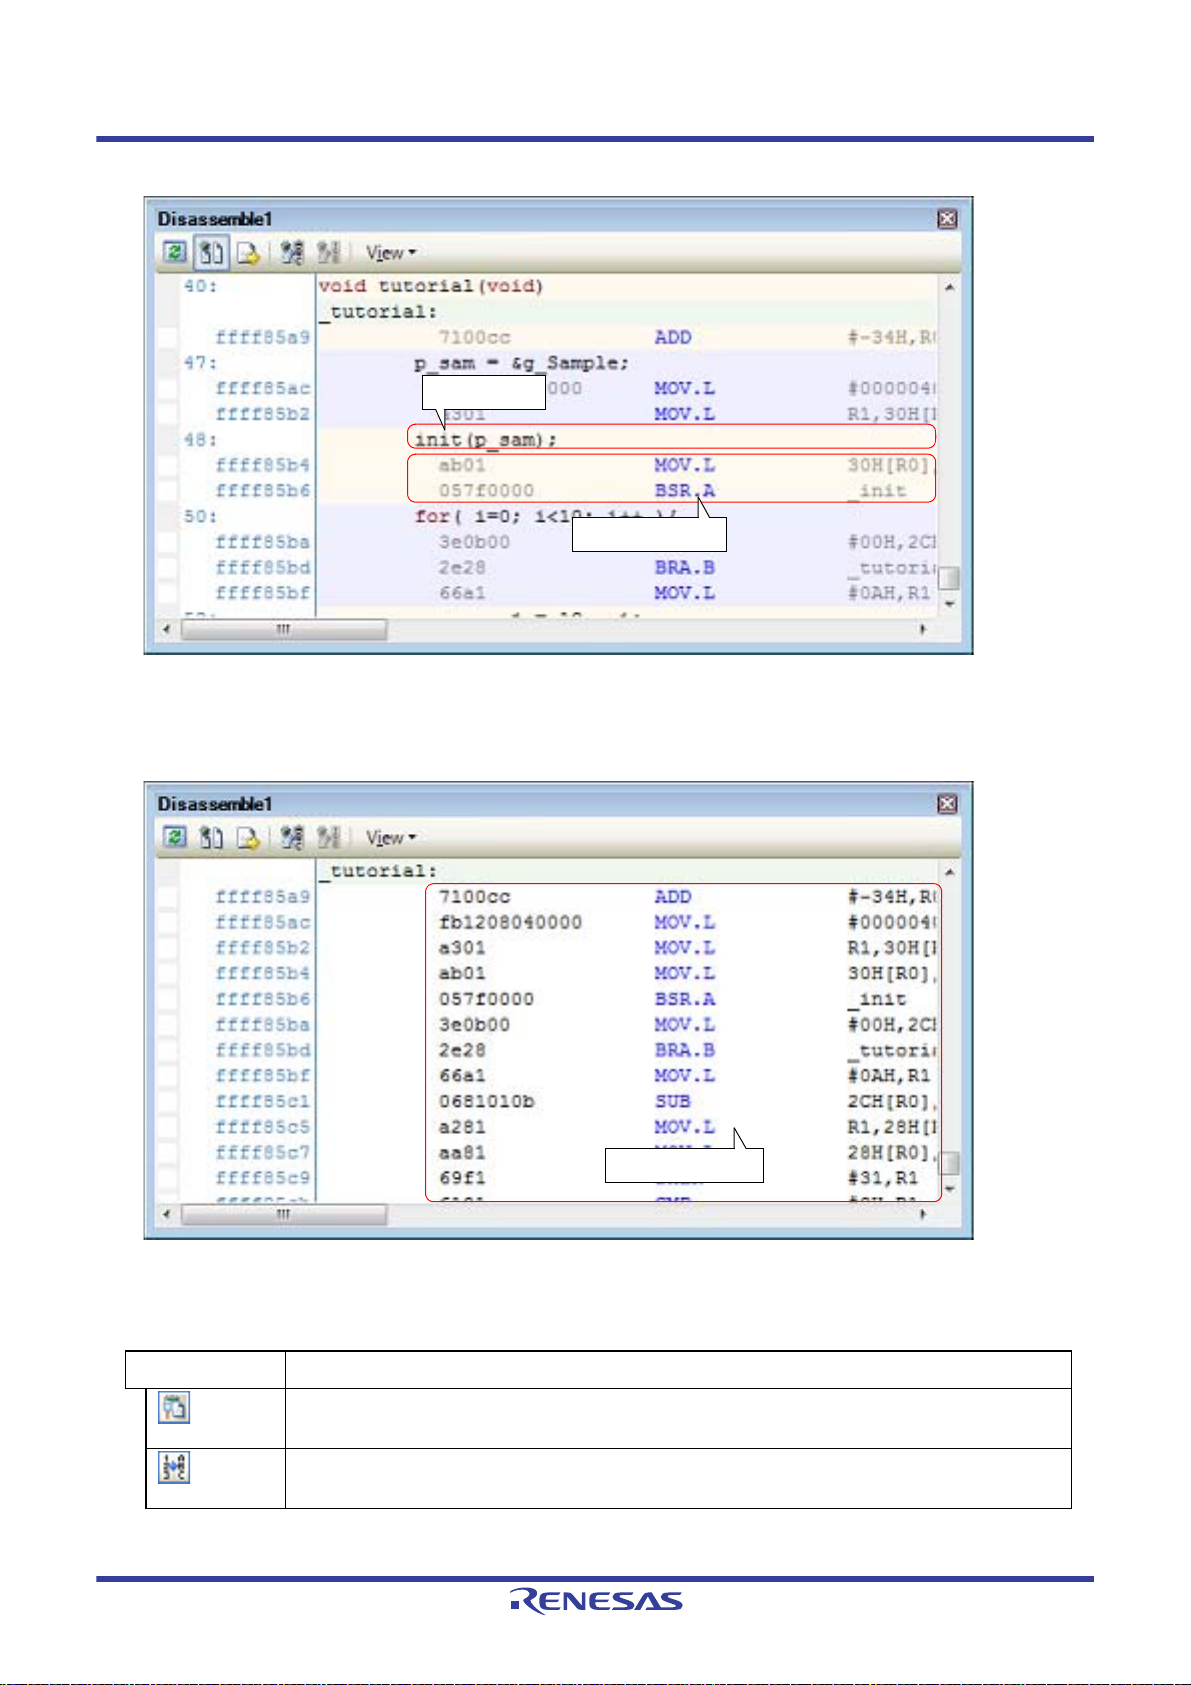
CS+ V8.03.00 2. FUNCTIONS
Source text
Disassembled text
Disassembled text
Figure 2.91 Mixed Display Mode (Disassemble Panel)
- Disassemble display mode
In this display mode, the source text is hidden and only the disassembled text is displayed.
Figure 2.92 Disassemble Display Mode (Disassemble Panel)
2.6.2.2 Changing the display form
The form in which disassembled results are displayed can be changed freely by using the toolbar buttons shown below.
View Shows the fol lowing buttons that change the display form.
Displays the offset values of labels. If the address has no labels defined, an offset value from the
closest label is displayed.
Displays address values in the form "symbol + offset value" (default).
However, if the address value has a symbol defined, only the symbol is displayed.
R20UT4588EJ0100 Rev.1.00 Page 81 of 423
Nov 01, 2019
Page 82

CS+ V8.03.00 2. FUNCTIONS
2.6.2.3 Moving to a specified address
To move to a specified address in the disassembled text, select [Go To...] from the context menu and use the Go to the
Location dialog box that is opened.
In this dialog box, follow the procedure described below to Move to a specified address.
Figure 2.93 Move to the Specified Address in Disassembled Result (Go to the Location Dialog Box)
(1) Specifying [Address/Symbol]
Specify an address to which you want to move the caret.
Enter an address expression directly in the text box (specifiable in up to 1024 characters) or select an input history
item from the drop-down list (up to 10 history entries).
Remark By holding down [Ctrl]+[Space] keys in this text box, you can complete the symbol name at the
present caret position (see "2.21.2 Symbol name completion function").
(2) Clicking the [OK] button
The caret moves to the specified address.
2.6.2.4 Moving to a symbol definition part
The caret position can be moved to the address at which a symbol is defined.
Move the caret to an instruction that is referencing the symbol an d then click the toolbar button .
Also, if, subsequently to the above operation, you click the toolbar button, the caret position is returned to the
instruction that was referencing the symbol before the caret was moved.
2.6.2.5 Saving the displayed contents of disassembled results
The contents of disassembled results can be saved to a text file (*.txt) or CSV file (*.csv).
When saving to a file, CS+ gets latest information from the debug tool and saves it in the form in which data are dis-
played on this panel.
Choose [Save Disassemble Data As...] from the [File] menu, and the Data Save dialog box shown below is opened. (At
this time, if you perform this operation while a range is selected on panel, it is possible to save only the selected range of
disassembled data.)
In this dialog box, follow the procedure described below to save the displayed contents of disassembled results.
Figure 2.94 Saving Disassembled Result (Data Save Dialog Box)
(1) Specifying the [File Name]
Specify a file name in which you want to save.
R20UT4588EJ0100 Rev.1.00 Page 82 of 423
Nov 01, 2019
Page 83

CS+ V8.03.00 2. FUNCTIONS
--------------------------------------------------------
Label (symbol name)
:
File name Line number C language source text
: : :
Address Offset Code Result of Disassembling
: : : :
Label (symbol) line
Source text line
Disassembling line
Enter it directly in the text box (specifiable in up to 259 characters) or select an input history item from the dropdown list (up to 10 history entries).
Also, you can select a file using the Select Data Save File dialog box that is opened by clicking the [...] button.
(2) Specifying the [File Type]
Select the type of file in which you want to save from the drop-down list below.
The selectable file types are as follows.
List display Format
Text files (*.txt) Text format (default)
CSV (Comma-Separated) (*.csv) CSV format
Note Each piece of data are separated with a comma (,) when saved.
To avoid the problem of an invalid file format in cases where any data includes a comma (,), each
piece of data are enclosed in double-quotes (" ") when they are output to a file.
(3) Specifying the [Save Range Address/ Symbol]
Specify the "start address" and "end address" to set a range of data to be saved in a file.
Directly enter hexadecimal values or address expressions in the respective text boxes or select an input history
item from the drop-down list (up to 10 history entries).
Note that if a range is selected on panel, this selected range is specified, by default, in the text boxes. If no range
is selected, the currently displayed range on panel is specified.
Remark By holding down [Ctrl]+[Space] keys in this text box, you can complete the symbol name at the
present caret position (see "2.21.2 Symbol name completion function").
(4) Clicking the [Save] button
Disassembled data is saved in specified format to a specified file.
Note
Figure 2.95 Disassembled Data Output Image when Saved
Remark 1. If panel contents are saved over an existing file by selecting [Save Disassemble Data] on [File]
menu, the respective Disassemble panels (Disassemble1-4) are handled individually.
Also, as to the save range, the previously specified address range is applied when data is saved.
Remark 2. By selecting [File] >> [Print...], you can print the image currently displayed on this panel.
2.6.3 Executing a build in parallel with other processes
CS+ provides a facility to automatically start a build in synchronism with the timing described below (rapid build func-
tion).
(1) For other than the debug-only project
- When any of the C source files, C++ source files, assembler source files, header files, link directive files, symbol
information files, object module files, relocatable module files or library files added to the project is updated
- When a file to build is added or removed from the project
- When the order in which object module files is linked is changed
- When the properties of the build tool or the file to build are changed
(2) For the debug-only project
- When a C source file, C++ source file, assembler source file, or header file added to the debug-only project is
R20UT4588EJ0100 Rev.1.00 Page 83 of 423
Nov 01, 2019
saved after editing
Page 84

CS+ V8.03.00 2. FUNCTIONS
- When a C source file, C++ source file, assembler source file, or header file is added or removed from the
debug-only project
- When properties of the debug-only project are changed
By enabling the rapid build function, it is possible to perform a build in parallel with the above operation.
To choose to enable or disable the rapid build function, click [Rapid Build] on the [Build] menu (This is a toggle switch,
which is, by default, enabled.).
Caution For this function to be enabled when you use an external editor, it is necessary to check the [Observe
registered files changing] check box in the [General - Build/Debug] category of the Option dialog box.
Remark 1. It is recommended that after editing the source file, you should always be sure to press the [Ctrl] + [S]
keys to save it each time.
Remark 2. When you've chosen to enable or disable the rapid build function, your selection is applied to the entire
project (main project and sub-projects).
Remark 3. If, while a rapid build is under execution, the rapid build function is switched off (disabled), execution of
the rapid build is aborted on the spot.
2.6.4 Performing line assembly
The instructions and instruction codes displayed on the Disassemble panel can be edited (line-assembled).
Following methods of operation are described here.
2.6.4.1 Editing instructions
2.6.4.2 Editing instruction code
2.6.4.1 Editing instructions
To edit instructions, follow th e procedure described below.
(1) Switching to the edit mode
Double-click an instruction you want to edit, or while the caret is moved to the subject instruction, select [Edit Dis-
assemble] from the context menu, and the subject you're going to edit is placed into the edit mode.
(2) Editing instructions
Edit the character string of the instruction directly from the keyboard.
(3) Writing into memory
Press the [Enter] key when you've finished editing, and the altered instruction is automatically line-assembled and
the resulting code is written into memory.
However, if this alteration results in an invalid instruction, the character string you've edited is displayed in red
color and not written into memory.
Note that if space is created in memory by overwriting the disassembled result being displayed on panel with another
instruction, bytes are automatically compensated for with nop instructions as in the example shown below.
Example 1. When the ADD instruction on third line (6-byte instruction) is overwritten with a BCLR instruction (4-byte
instruction)
Before editing 5020 AND [R2].UB,R0
99e0 MOV.W 0CH[R6],R0
700fb98a322a ADD #2A328AB9H,R0,R15
5327 AND R2,R7
After editing 5020 AND [R2].UB,R0
99e0 MOV.W 0CH[R6],R0
f22a45b2 BCLR #2,0B245H[R2]
03 NOP
03 NOP
5327 AND R2,R7
Example 2. When an MOV.W instruction on second line (2-byte instruction) is overwritten with a BCLR instruction (4-
byte instruction)
R20UT4588EJ0100 Rev.1.00 Page 84 of 423
Nov 01, 2019
Page 85

CS+ V8.03.00 2. FUNCTIONS
Before editing 5020 AND [R2].UB,R0
99e0 MOV.W 0CH[R6],R0
700fb98a322a ADD #2A328AB9H,R0,R15
5327 AND R2,R7
After editing 5020 AND [R2].UB,R0
99e0 MOV.W 0CH[R6],R0
f22a45b2 BCLR #2,0B245H[R2]
03 NOP
03 NOP
03 NOP
03 NOP
5327 AND R2,R7
2.6.4.2 Editing instruction code
To edit instructio n code, follow the procedure described below.
(1) Switching to the edit mode
Double-click instruction code you want to edit, or while the caret is moved to the subject instruction code, select
[Edit Code] from the context menu, and the subject you're going to edit is placed into the edit mode.
(2) Editing instruction code
Edit the character string of instruction code directly from the keyboard.
(3) Writing into memory
Press the [Enter] key when you've finished editing, and instruction code is written into memory.
However, if this alteration results in an invalid instruction, the character string you've edited is displayed in red
color and not written into memory.
When instruction code is written into memory, the disassembled result is updated at the same time.
R20UT4588EJ0100 Rev.1.00 Page 85 of 423
Nov 01, 2019
Page 86

CS+ V8.03.00 2. FUNCTIONS
2.7 Usage of PIC/PID Function
The PIC/PID function enables the code and data in the ROM to be reallocated to desired addresses without re-linkage
even when the allocation addresses have been determined through previously completed linkage.
To use the PIC/PID function, a "master" program and an "application " program must be prepared.
In the PIC/PID function, a program whose code or data in the ROM has been converted into PIC or PID is called an
application, and the program necessary to execute an application is called the master.
This section describes debugging of an application program (load module) whose code or data in the ROM has been
converted into PIC or PID and reallocated to different addresses.
-PIC
When the pic option is specified for compilation, the PIC function is enabled and the code in the code area (P section)
becomes PIC. The PIC always uses PC relative mode to acquire branch destination addresses or function addresses,
so it can be reallocated to any desired addresses even after linkage.
-PID
When the pid option is specified for compilation, the PID function is enabled and the data in ROM data areas (C, C_2,
C_1, W, W_2, W_1, and L sections) becomes PID. A program executes relative access to the PID by using the register (PID register) that indicates the start address of the PID. The user can move the PID to any desired addresses by
modifying the PID register value even after linkage.
Remark 1. For details on the PIC/PID function, see "CC-RX Compiler User's Manual".
Remark 2. For setting of the PIC/PID function by the build tool, see "CS+ Integrated Development Environment
User's Manual: CC-RX Build Tool Operation".
To start debugging after changing the allocation of a load module whose code or data in the ROM has been converted
into PIC or PID, take the following steps.
(1) Add a download file
Add the application load-module file as a download file for the master (see "2.7.1 Changing the allocation of a
load module using the PIC/PID function").
(2) Set conditions for downloading of the load module file
Specify two offset values for the application load module: [PIC Offset], which is an offset from the original address,
and [PID Offset], which is an offset to be set in the PID register selected at the time the load module was created.
(3) Download
Download the master and the application load-module file (see "2.5.1 Execute downloading").
Debugging of the code and data in the ROM allocated to new addresses is now possible.
2.7.1 Changing the allocation of a load module using the PIC/PID function
An application load-module file can be added to the master through the [Download files] property under the [Download]
category on the [Download File Settings] tab in the Property panel.
Figure 2.96 [Download] Category
- [Download files]
Click on the [...] button to open the Download Files dialog box.
Click on the [Add] button in the [Download file list] area of the Download Files dialog box and set up information on the
application load module in the [Download file property] area.
- [File]
Specify the application load-module file to be downloaded.
- [Specify the PIC/PID offset]
Select [Yes]. [PIC Offset] and [PID Offset] will appear.
- [ PIC Offset]
Specify an offset from the original address allocated at the time the load module was created.
R20UT4588EJ0100 Rev.1.00 Page 86 of 423
Nov 01, 2019
Page 87

CS+ V8.03.00 2. FUNCTIONS
- [ PID Offset]
Specify an offset to be set in the PID register selected at the time the load module was created.
Figure 2.97 Adding a Download File and Changing Conditions for Downloading (Download Files Dialog Box)
When the load module is downloaded after the values of [PIC Offset] and [PID Offset] have been changed, the alloca-
tion of addresses for the P section and external or static variables is changed as shown in the figure below.
The figure shows examples of downloading a load module; "4000" and "0" are specified for [PIC Offset], [PIROD Offset],
and [PID Offset] in the Download Files dialog box in the figures above and below, respectively.
In the figure above, "0x4000" is added to the base address.
R20UT4588EJ0100 Rev.1.00 Page 87 of 423
Nov 01, 2019
Page 88

CS+ V8.03.00 2. FUNCTIONS
Figure 2.98 Example of Downloading after the Offset Values of [PIC Offset] and [PID Offset] Have been Changed
R20UT4588EJ0100 Rev.1.00 Page 88 of 423
Nov 01, 2019
Page 89

CS+ V8.03.00 2. FUNCTIONS
Memory space
Psect01
Psect02
Psect03
0x0000
0x1000
0x2000
0x3000
0x5000
ram01
ram02
ram03
Overlay sections
or
or
Runtime section for Psect01
Runtime section for Psect02
Runtime section for Psect03
2.8 Setting Overlay Sections
The optimizing linkage editor (Optlnk) used by the CC-RX provides the start option, which allows two or more sections
defined in a program to be allocated to a single address. Sections that have been allocated in this way are called overlay
sections.
This section describes how to set up the "overlay-section selection facility" for overlay section s in a load modu le.
When the program is executed, only one of the sections allocated to the same address in the load module is executed.
The debug tool provides the "overlay-section selection facility" to select a particular overlay section to be debugged
preferentially (hereafter referred to as the priority section).
With the priority section selected before execution of the program, debugging of that section is simple because debugging information of other sections is hidden.
An example of using Optlnk's start option to define overlay sections is given below.
Example Defining overlay sections by Optlnk
start = Psect01/1000,Psect02/2000,Psect03/3000,ram01:ram02:ram03/5000
rom = Psect01=ram01,Psect02=ram02,Psect03=ram03
The rom option reserves section "ramXX", which is as large as the "PsectXX" section, and relocates the symbols
defined in the "PsectXX" section to the corresponding addresses in the "ramXX" section (XX: 01, 02, or 03 in this example).
Remark For setting of overlay sections by the build tool, see "CS+ Integrated Development Environment User's
Manual: CC-RX Build Tool Operation".
Figure 2.99 Allocation of Overlay Sections
2.8.1 Selecting the priority section
The priority section can be selected under the [Debug Information] category on the [Download File Settings] tab in the
Property panel.
Figure 2.100 [Debug Information] Category
(1) [Specify the debugged overlay section]
"Yes" is displayed when overlay sections exist in the load module (this cannot be changed).
(2) [Overlay sections]
Address groups where overlay sections exist are displayed.
R20UT4588EJ0100 Rev.1.00 Page 89 of 423
Nov 01, 2019
Page 90
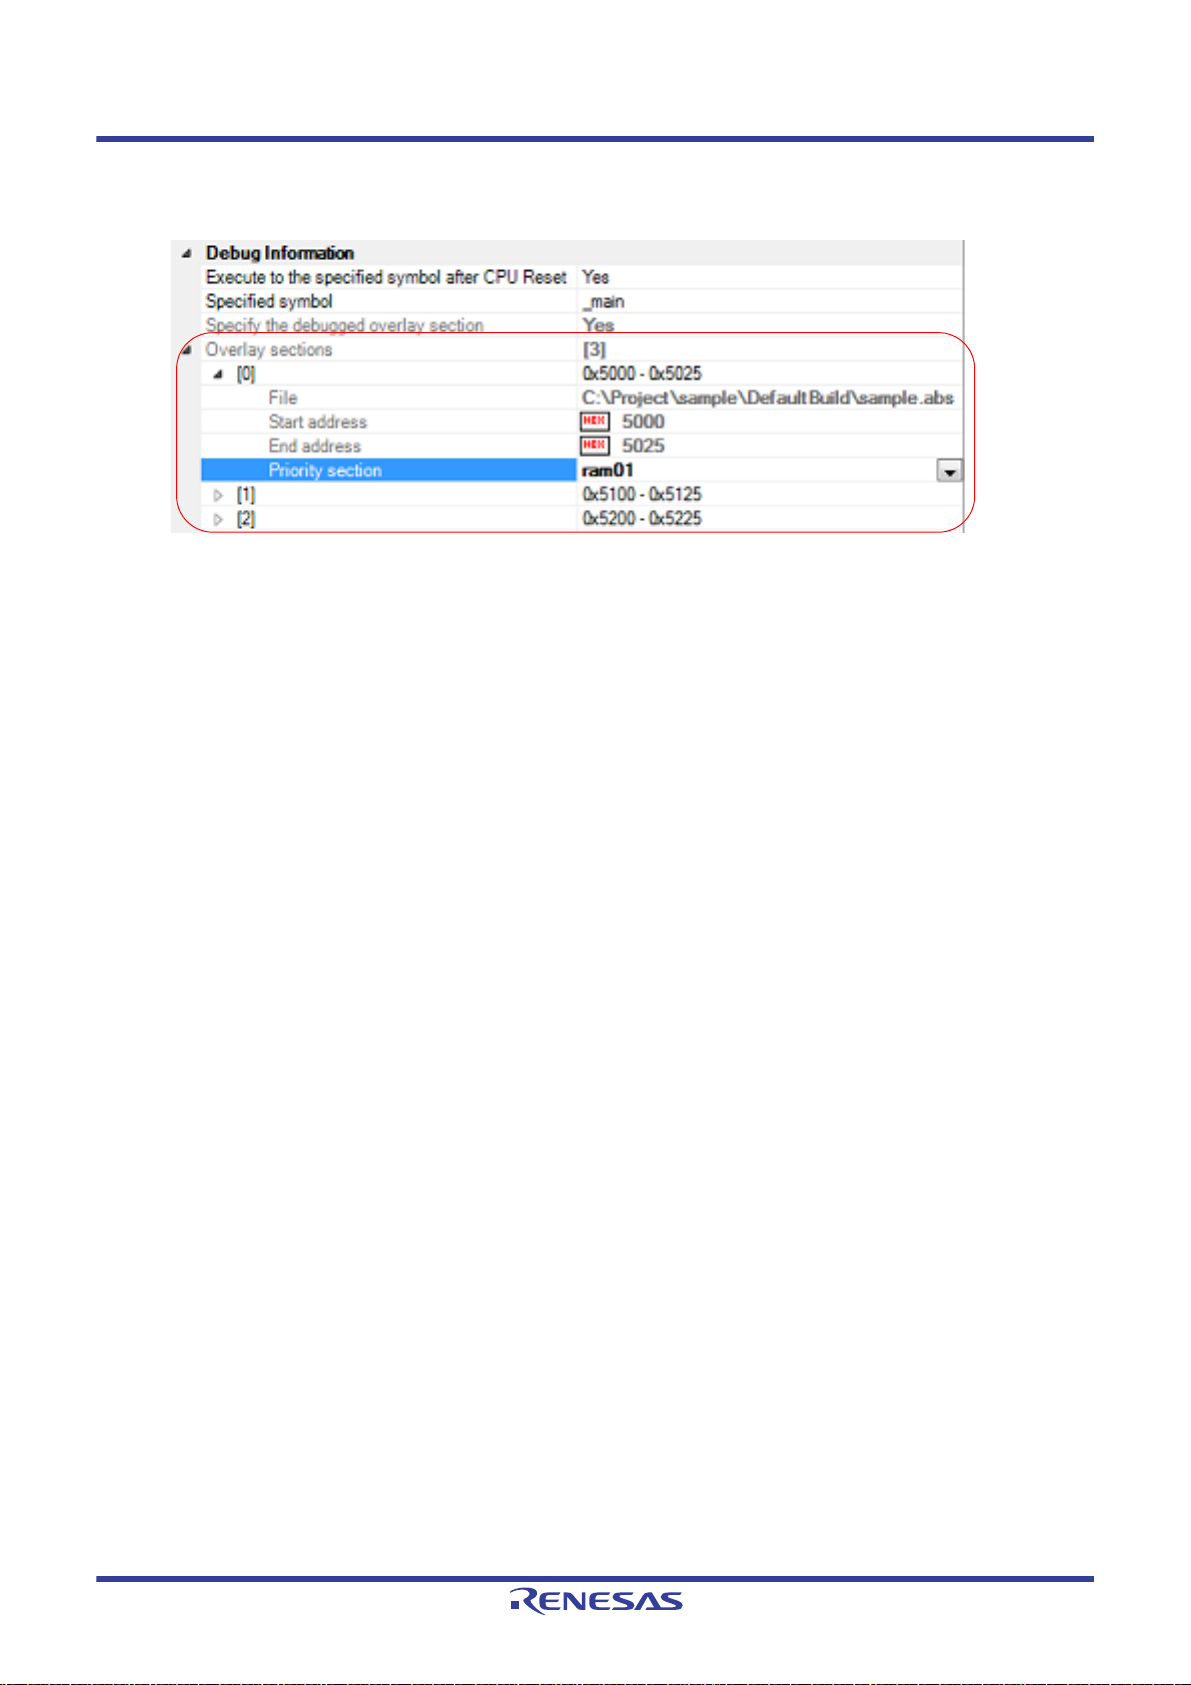
CS+ V8.03.00 2. FUNCTIONS
This property only appears when "Yes" is displayed on the [Specify the debugged overlay section] property.
Figure 2.101 [Overlay sections] Property
This property shows the current information of overlay sections per address group in detail. Only [Priority section]
can be changed.
- [File]
Name of the load module file in which the selected address group has been downloaded (this cannot be
changed).
- [Start address]
First address of the selected address group (this cannot be changed).
- [End address]
Last address of the selected address group (this cannot be changed).
- [Priority section]
List of sections defined in the selected address group. You can choose a section to be debugged (priority section) from this list.
Caution 1. Settings related to overlay sections are not saved in the project file.
After you have downloaded a load module, select the priority section again.
Caution 2. Only debugging information is switched when the selection for [Priority section] is chang ed.
The debug tool does not copy data of the target section.
The following figure shows an example where "ram01" is selected as the priority section (left pane) and then changed to
"ram02" (right pane) for the [Overlay sections] property in the case shown in Figure 2.99 Allocation of Overlay Sections.
R20UT4588EJ0100 Rev.1.00 Page 90 of 423
Nov 01, 2019
Page 91

CS+ V8.03.00 2. FUNCTIONS
Figure 2.102 Changing the Selection for [Priority section] from "ram01" to "ram02"
R20UT4588EJ0100 Rev.1.00 Page 91 of 423
Nov 01, 2019
Page 92

CS+ V8.03.00 2. FUNCTIONS
2.9 Execute Programs
This section describes how to execute programs.
The major operations discussed in this section can be conducted either from the debug toolbar or the [Debug] menu in
the Main window, where commands to control the execution of programs are included.
Caution Items in the debug toolbar and the [Debug] menu will be disabled once the connection with the debug
tool is lost.
Figure 2.103 Debug To olbar
Figure 2.104 [Debug] Menu
2.9.1 Reset microcontroller (CPU)
To reset CPU, click the button on the debug toolbar.
When CPU is reset, the current PC value is set to the reset address.
Remark Y ou can automatically overwrite the value of I/O register/CPU register with the specified values after CPU
reset (see "2.18 Setting Up the Hook Process" for details).
2.9.2 Execute programs
The following types of CS+ execution functions are provided.
Select any of the following operations according to the purpose of debugging.
See "2.10 Stop Programs (Break)" for details on how to stop the program in execution.
2.9.2.1 Execute after resetting microcontroller (CPU)
2.9.2.2 Execute from the current address
2.9.2.3 Execute after changing PC value
R20UT4588EJ0100 Rev.1.00 Page 92 of 423
Nov 01, 2019
Page 93

CS+ V8.03.00 2. FUNCTIONS
Remark 1. You can automatically overwrite the value of I/O register/CPU register with the specified values before
executing the program (see "2.18 Setting Up the Hook Process" for details).
Remark 2. The PC value can be displayed in the status bar at any update interval during program execution. (See
"(e) Current PC position".)
2.9.2.1 Execute after resetting microcontroller (CPU)
You can reset the CPU and start the execution of the program from the reset address.
Click the button on the debug toolbar.
When this operation is performed, the program continues to be executed until either of the following occurs:
- The button has been clicked (see "2.10.1 Stop the program manually").
- The PC has reached a breakpoint (see "2.10.2 Stop the program at the arbitrary position (breakpoint)").
- A break event condition has been met (see "2.10.3 Stop the program at the arbitrary position (break event) [E1] [E20]
[EZ Emulator]" and "2.10.4 Stop the program with the access to variables/I/O registers").
- Other break factors have occurred.
Remark This operation is the same as when the button is clicked after clicking the button.
2.9.2.2 Execute from the current address
Perform any of the following operations to start executing the program from the address at the current PC value.
(1) Normal execution
Click the button on the debug toolbar.
When this operation is performed, the program continues to be executed until either of the following occurs:
- The button has been clicked (see "2.10.1 Stop the program manually").
- The PC has reached a breakpoint (see "2.10.2 Stop the program at the arbitrary position (breakpoint)").
- A break event condition has been met (see "2.10.3 Stop the program at the arbitrary position (break event) [E1]
[E20] [EZ Emulator]" and "2.10.4 Stop the program with the access to variables/I/O registers").
- Other break factors have occurred.
(2) Execution ignoring break-relate d eve n ts
Click the button on the debug toolbar.
When this operation is performed, the program continues executing until either of the following occurs:
- The button has been clicked (see "2.10.1 Stop the program manually").
- Other break factors have occurred.
Remark If you have started the execution with this operation, the occurrence of Printf event will also be
ignored.
(3) Execution to the caret position
To start this operation, move the caret to the line/instru ction at which you wish to stop the program in the Editor
panel/Disassemble panel, then select [Go to Here] from the context menu.
When this operation is performed, the program continues to be executed until either of the following occurs:
- The PC has reached the address of the caret position.
- The button has been clicked (see "2.10.1 Stop the program manually").
- Other break factors have occurred.
Caution When the corresponding address of the line at the caret position does not exist, the program is exe-
cuted to the corresponding address of the lower valid line (if the corresponding address does not
exist, an error message will appear).
Remark If you have started the execution with this operation, the occurrence of Printf event will also be
ignored.
R20UT4588EJ0100 Rev.1.00 Page 93 of 423
Nov 01, 2019
Page 94

CS+ V8.03.00 2. FUNCTIONS
2.9.2.3 Execute after changing PC value
The program is executed after you have forcibly changed the current PC value to an arbitrary position.
To start this operation, move the caret to the line/instruction at which you wish to start the program in the Editor panel/
Disassemble panel, then select [Set PC to Here] from the context menu (the current PC value is set to the address of the
line/instruction where the caret currently exists).
Then execute either one of the execution method described in "2.9.2.2 Execute from the current address".
Caution If a program that has stopped at a software or hardware (pre-execution) breakpoint is restarted from the
same address, the realtime capability is lost because stepped execution of the instruction at that address
takes place before the program is restarted. Any events that are triggered by the stepped execution are
cleared next time the program is run. Even if a trace or time-measurement start event is triggered by the
stepped execution, tracing or time measurement does not start until the same event is triggered again.
Likewise any break or trace start events that are triggered by the stepped execution are not effective as
AND or sequential conditions.
2.9.3 Execute programs in steps
When either of the following operation has occurred, the program will stop automatically after conducting step execution
in the source level (1 line of source text) or in the instruction level (1 instruction).
Once the program is stopped, the contents of each panel will be updated automatically. As such, step execution is
suited for debugging the program execution in transition either in source or instruction level.
The unit in which the program is step-executed is determined by the setting of the Editor panel as follows:
- When the button on the toolbar is invalid (default):
Step execution is conducted in source level.
Note, however, that when the focus is in the Disassemble panel or the line information does not exist in the address
specified by the current PC value, the step execution is conducted in instruction level.
- When the button on the toolbar is valid:
Step execution is conducted in instruction level.
Remark The button is only enabled if the mixed display mode is selected on the Editor panel.
Step execution is divided into the following types:
2.9.3.1 Step into the function (Step In execution)
2.9.3.2 Step over the function (Step Over execution)
2.9.3.3 Execute until return is completed (Return Out execution)
Caution 1. Break points, break events, and Printf events that have been set do not occur during step execution.
Caution 2. [Simulator]
You may jump to an interrupt handler during step execution.
Caution 3. During source-level stepping, the debugger may appear to be executing instructions that are not sup-
posed to be executed.
However, the reason for these problems is a difference between the debugging information generated by
the compiler and the actual code. Th e result of executing the code generated by the compiler is correct.
Example In the program code shown below, it seems that the position indicated by the current PC
might be moved to position (*1) after the execution of (*2), although (*1) is never actually
executed in the generated code.
R20UT4588EJ0100 Rev.1.00 Page 94 of 423
Nov 01, 2019
Page 95
CS+ V8.03.00 2. FUNCTIONS
void main(void);
int x, y, z1, z2, z3;
void func(int i)
{
if (i == 0) {
++x; // <-(*1)
++z1;++z2;++z3;
} else {
++y; // <-(*2)
++z1;++z2;++z3;
}
}
int one = 1;
void main(void)
{
while (1)
{
func(one);
}
}
Note that this caution may be eliminated by setting the [Optimization level] property to [0 (-optimize=0)] in
the [Optimization] category on the [Compile Options] tab in the Property panel of the build tool.
2.9.3.1 Step into the function (Step In execution)
When the function is called, the program is sto pped at the top of the called function.
Click the button on the debug toolbar to perform Step in execution.
Caution 1. Step In execution cannot be performed for a function that has no debug information.
Caution 2. If Step in execution is performed for the longjmp function, program execution may not complete and may
wait for a time-out.
Caution 3. [E1] [E20] [EZ Emulator]
No interrupts are accepted during stepped execution. In JTAG communication, resetting is also prohibited during stepped execution.
2.9.3.2 Step over the function (Step Over execution)
In the case of a function call by a jump to subroutine instruction, all the source lines/instructions in the function are
treated as one step and the program will be executed until reaching the position to which it returns from the function (step
execution will continue until the same nest is formed as when a jump to subroutine instruction has been executed).
Click the
In the case of other than a jump to subroutine instruction, operation is the same as when the
Caution 1. If Step over execution is performed for the longjmp function, execution processing may not complete and
Caution 2. [E1] [E20] [EZ Emulator]
button on the debug toolbar to perform Step over execution.
button is clicked.
may wait for a time-out.
While stepping over a function or subroutine call, interrupts and resetting are allowed.
2.9.3.3 Execute until return is completed (Return Out execution)
Step-execute the program so that the program will stop when it returns from the current function to the calling function.
When the execution of source line/instruction that require checking has been completed, you can perform step execution
using this instruction so that you can make the program return to the calling function without step executing the remaining
instructions inside the function. This instruction can be performed by clicking the button on the debug toolbar.
Caution 1. If a program is returned out in the main function, it will break inside the start-up routine.
Caution 2. If a program is returned out in a function that has called the longjmp function, break may not occur.
Caution 3. Executing Return Out from the recursive function may cause the program to run in a free-run mode.
R20UT4588EJ0100 Rev.1.00 Page 95 of 423
Nov 01, 2019
Page 96

CS+ V8.03.00 2. FUNCTIONS
Caution 4. Executing Return Out from a function that uses a jump instruction (i.e. not an RTS (return from subrou-
tine) instruction) to return to the calling function is not possible.
Caution 5. [E1] [E20] [EZ Emulator]
While returning out in a function or subroutine, interrupts and resetting are allowed.
Caution 6. Executing a return-out command from a recursive function may lead to execution stopping at the address
of the return instruction in the called function instead of the correct line in the calling function.
2.9.4 Execute a specified routine [E1] [E20] [EZ Emulator]
You can execute a specified routine immediately before the start or stop of the program execution. Setting an arbitrary
routine allows you to control the target system in synchronization with the execution or stop of the program. See "2.10
Stop Programs (Break)" on how to stop a program in execution. This section describes the procedure for specifying a rou-
tine to be executed.
Y ou can specify a routine in the [System] [E1] [E20] [EZ Emulator] category on the [Debug Tool Settings] tab in the Prop-
erty panel.
- When executing immediately before the program execution
Select [Yes] in the [Execute the specified routine immediately before execution of the user program] property, and
enter the start address in the [Routine to run immediately before execution starts] property that is displayed. The
specified routine will be executed immediately before the program execution.
- When executing immediately after the break
Select [Yes] in the [Execute the specified routine immediately after the user program stops] property, and enter the
start address in the [Routine to run immediately after execution stops] property that is displayed. The specified routine
will be executed immediately after the stop of the program.
If [Yes] is selected either for the [Execute the specified routine immediately before execution of the user program] or
[Execute the specified routine immediately after the user program stops] property, the [W ork RAM start address for execut-
ing a specified routine] property is displayed. The amount of memory indicated by the [Work RAM size [bytes] for executing a specified routine] this property beginning with this address is to be used by the debugger firmware as a work RAM
area for the facility to execute a specified routine.
When you wish to use the facility to execute a specified routine, sele ct this work RAM area.
Figure 2.105 [System] category
Caution 1. In the [Routine to run immediately before execution starts] property, [Routine to run immediately after
execution stops] property, and [Work RAM start address for executing a specified routine] property, you
can also specify function name (when using C language) or label name (when using Assembly language)
as property values.
Caution 2. Use an interrupt stack when using a stack inside the specified routine.
Caution 3. Describe an RTS (return from subroutine) instruction for terminating the specified routine processing.
Caution 4. The processing time of one specified routine must not exceed 100ms. If a clock remains halted in the
specified routine, it may affect the control over the debug tool.
Caution 5. The register value for the start of the specified routine is not determined. As su ch, you need to perform
initial setting of the register value in the specified routine.
Caution 6. Immediately before execution or immediately after stop of the specified routine, execution enters a
stopped state under control of the debug tool. The stop period is determined as follows.
- User program execution starts about 100 cycles (about 1 s when CPU clock is 100 MHz) after the
specified routine is executed before execution of the user program.
R20UT4588EJ0100 Rev.1.00 Page 96 of 423
Nov 01, 2019
Page 97

CS+ V8.03.00 2. FUNCTIONS
- Execution of the specified routine starts about 100 cycles (about 1 s when CPU clock is 100 MHz)
after the stop of user program execution.
In on-chip ROM disabled extended mode, execution of the specified routine starts about 3 ms with a
CPU clock of 100 MHz, or about 8 ms with a CPU clock of 32 kHz, after the stop of user program execution. This also applies when the user program stops for the first time after the hot plug-in connection
is established.
Caution 7. Execution of a specified routine starts in the supervisor mode. Do not switch it to the user mode.
Caution 8. When executing a specified routine, do not perform memory access/download/break point settin g to the
program area of the specified routine.
Caution 9. While the facility to execute a specified routine is in use, 230h (560) bytes of RAM starting from [Work
RAM start address for executing a specified routine] is reserved for exclusive use by the emulator.
This area must not be used by the user program or routine.
Also be sure to allocate this area to the internal RAM area.
The value of [Work RAM start address for executing a specified routine] must be a multiple of four.
Caution 10. Following restrictions will apply to the general registers and flags used in the specified routine.
ISP Register Once the specified routine is executed, the value should be
returned to the one at the start of the execution.
U Flag Setting the user stack pointer (USP) is prohibited while the
specified routine is in execution.
I Flag Interrupt is prohibited while the specified routine is in execu-
tion.
PM Flag Swi tchi ng to the user mode is prohibited while the specified
routine is in execution.
Caution 11. While the specified routine is in execution, the trace, break, real-time RAM monitor and timer measure-
ment will be disabled.
Caution 12. Non-maskable interrupt is always prohibited while the specified routine is in execution.
Caution 13. When starting a program after executing the specified routine, the state of microcontroller will be as fol-
lows
General Register Remains in the state at which the program stopped or reflects
the user setting. The contents of the register following the
execution of the specified routine are not reflected.
Memory Reflects the memory access made after the execution of the
specified routine.
Peripheral Functions The operation of microcontroller peripheral functions after the
execution of the specified routine continues.
Caution 14. If a stack is to be used in the specified routine, the ISP register must be set up in the routine. When the
specified routine is started, the value of the ISP register is that of [Work RAM start address for executing
a specified routine].
Caution 15. Once the execution of the specified routine is completed, the value of the ISP register must be returned
to the value at the start of the execution.
Caution 16. While the facility to execute a specified routine is in use, do not input a reset signal through the reset pin
or allow the watchdog timer to reset the CPU.
Caution 17. While the facility to execute a specified routine is in use, do not disable the internal RAM area.
Caution 18. While the specified routine is running, do not set the U flag to 1 (i.e. setting the user stack pointer, or
USP).
Caution 19. While the specified routine is running, do not use RTFI (return from fast interrupt) instructions.
Caution 20. Do not set breakpoints or cause break events, trace start events, or trace end events in the specified rou-
tine.
If a break event occurs within the routine to run before execution of the user program, for example, the
program stops immediately after it has started running. If a trace start event occurs within the routine, no
R20UT4588EJ0100 Rev.1.00 Page 97 of 423
Nov 01, 2019
Page 98

CS+ V8.03.00 2. FUNCTIONS
trace data is acquired while the routine is running. Trace acquisition is not resumed until the user program starts running. The emulator will not behave as expected.
Caution 21. While the facility to execute a specified routine is in use, if the Start function does not shift to the user pro-
gram, or the Stop function does not stop, an error message "A timeout error has occurred in Start/Stop
function processing. The system was reset." is displayed. The emulator is initialized and the user program stops. After the system is reset, trace records are initialized too. You can continue with debugging.
R20UT4588EJ0100 Rev.1.00 Page 98 of 423
Nov 01, 2019
Page 99

CS+ V8.03.00 2. FUNCTIONS
2.10 Stop Programs (Break)
This section describes how to stop the program in execution.
Remark When the program in execution is stopped, a statement of the cause of the break appears on the Status
bar in the Main window.
2.10.1 Stop the program manually
The program in execution is forcibly stopped by clicking the button on the debug toolbar.
2.10.2 Stop the program at the arbitrary position (breakpoint)
The program in execution can be stopped at the arbitrary position by setting a breakpoint. A breakpoint can be set with
a single click of the mouse.
You need to configure the type of breakpoints to use before setting a breakpoint.
This section describes the following.
2.10.2.1 Set the type of breakpoints/break timing to use [E1] [E20] [EZ Emulator]
2.10.2.2 Set a breakpoint
2.10.2.3 Edit a hardware breakpoint
2.10.2.4 Delete a breakpoint
Caution [E1/E20/EZ Emulator [RX630, RX631, RX63N, RX63T, RX210, RX110, RX111, RX113, RX634, RX130,
and RX13T Groups]]
If a break is generated by an execution-related break that is set to the WAIT instruction or an instruction
immediately preceding it, an error may occur. To cause the target program to break at the WAIT instruction or an instruction immediately preceding it, use a breakpoint.
2.10.2.1 Set the type of breakpoints/break timing to use [E1] [E20] [EZ Emulator]
The type of breakpoints/break timing to use can be set in the [Break] [E1] [E20] [EZ Emulator] category on the [Debug
Tool Settings] tab of the Property panel.
Figure 2.106 [Break] Category [E1] [E20] [EZ Emulator]
Specify the type of preferential breakpoint (breakpoint that can be set with a single click of the mouse) in the [Type of
breakpoints to be preferentially used] property.
Note, however, that if the number of the set breakpoints of the specified type exceeds the limit settable (see "2.17.7.1
Allowable number of valid events"), a breakpoint of another type will be used.
Select the breakpoint type from the drop-down list according to their functions.
Software break Temporarily replaces instruction code for the specified address with break instruction
and stops the program when this instruction is executed. Once set, it is handled as a
software break event.
Hardware break The debug tool consecutively checks the break condition while the program is in exe-
cution and stops the program when th e condi ti o n i s met (default)
handled as a hardware break event.
Note
. Once set, it is
Note 1. Hardware break is a "before execution" (, or pre-exe cu ti on) break as the program will break before exe-
cuting instruction at the specified address. This function is implemented using the debug tool resources.
Note 2. Software break events cannot be set in external address spaces.
2.10.2.2 Set a breakpoint
Perform this operation in the Editor panel/Disassemble panel in which the source text/disassembled text is displayed.
R20UT4588EJ0100 Rev.1.00 Page 99 of 423
Nov 01, 2019
Page 100

CS+ V8.03.00 2. FUNCTIONS
Indicates that a software
breakpoint has been set.
Indicates that a hardware
breakpoint has been set.
Event area
In the main area of the Editor panel or the event area of the Disassemble panel, click on the location where you want to
set a breakpoint.
A breakpoint is set to the instruction at the start address corresponding to the clicked line.
When a breakpoint is set, the following event mark appears at the breakpoint location, and the source text line/
disassembled text line is highlighted.
It is interpreted as if a break event (software or hardware break event) has been set at the target address, and it is man-
aged in the Events panel (see "2.17 Event Management" for details).
Table 2.4 Event Marks of the Breakpoint
Event Type Event Mark
Software Break
([E1] [E20] [EZ Emulator])
Hardware Break
Figure 2.107 Breakpoint Setting Example (Disassemble Panel)
Caution 1. Since a breakpoint is set as a break event and managed as an event, restrictions apply to the number of
breakpoints that can be set. Also see "2.17.1 Changing states of setting (Enabled/Disabled)" for details
on breakpoint settings, including the allowable number of valid events.
Caution 2. Breakpoints cannot be set to lines with no address indication.
Caution 3. [E1] [E20] [EZ Emulator]
Software breakpoints replace the instructions at the corresponding addresses. They cannot be specified
in the area other than the internal ROM area and internal RAM area.
Remark 1. Event marks differ depending on the event state (see "2.17.1 Changing states of setting (Enabled/Dis-
abled)").
When an event is set at a point for which another event is already set, the event mark ( ) is displayed
to indicate that more than one event is set at the point.
Remark 2. [Simulator]
Only hardware breakpoints can be set.
Remark 3. [E1] [E20] [EZ Emulator]
Hardware/software breakpoints can be set regardless of the specification made in "2.10.2.1 Set the type
of breakpoints/break timing to use [E1] [E20] [EZ Emulator]" by the operation described below.
Type Operation1 Operation2
Hardware breakpoint [Ctrl] + mouse click Select [Break Settings] >> [Set Hardware Break]
from the context menu.
Software breakpoint [Shift] + mouse click Select [Break Settings] >> [Set Software Break]
from the context menu.
2.10.2.3 Edit a hardware breakpoint
When editing a hardware break point you have set, first open the Events panel by selecting [View] menu >> [Event].
After selecting the hardware break point you wish to edit on the Events panel, click [Edit Condition...] on the context menu.
This will open a dialog box in which you can edit the selected hardware break point. For details on editing in the dialog
box, see "2.17.4.1 Editing execution-related events".
R20UT4588EJ0100 Rev.1.00 Page 100 of 423
Nov 01, 2019
Caution Operation 1 is enabled only in the Disassemble panel.
 Loading...