

Raymarine RL80CRC PLUS, RL70CRC PLUS, RL70C PLUS, Combined Pathfinder Radar, RC530 PLUS User Manual
Page 1

Distributed by
Any reference to Raytheon or
RTN in this manual should be
interpreted as Raymarine.
The names Raytheon and RTN
are owned by the
Raytheon Company.
Page 2

Distributed by
Any reference to Raytheon or
RTN in this manual should be
interpreted as Raymarine.
The names Raytheon and RTN
are owned by the
Raytheon Company.
Page 3

hsb
2
PLUS Series
Color LCD Display
Owner’s
Handbook
Document number: 81188_2
Date:14th December 2 001
Page 4

Page 5

iii
hsb
Series Color LCD Display
Owner’s Handbook
December 2001
INTENDED USE
The display units detailed in this handbook may form part of navigational
radar systems intended for light marine use. These displays and radar
systems are only an aid to navigation.
SAFETY NOTICES
This radar equipment must be installed and operated in accordance with the
instructions contained in this manual. Failure to do so can result in personal
injury and/or navigational inaccuracies. In particular:
1. HIGH VOLTAGE. The LCD display unit and scanner unit contain
high voltages. Adjustments require specialized service procedures and
tools only available to qualified service technicians – there are no user
serviceable parts or adjustments. The operator should never remove the
display unit cover or attempt to service the equipment.
2
2. ELECTROMAGNETIC ENERGY. The radar scanner transmits
electromagnetic energy. It is important that the radar is turned off whenever
personnel are required to come close to the scanner to perform work on the
scanner assembly or associated equipment.
It is recommended that the radar scanner is mounted out of range of personnel
(above head height).
Avoid looking directly at the antenna as your eyes are the most sensitive part of
the body to electromagnetic energy.
When properly installed and operated, the use of this radar will conform to the
requirements of ANSI/IEEE C95.1-1992 Standard for Safety Levels with
Respect to Human Exposure to Radio Frequency Electromagnetic Fields, 3Hz
to 300 GHz and NRPB, Board Statement on Restrictions on Human Exposure
to Static and Time Varying Electromagnetic Fields and Radiation. Doc NRPB,
N0. 5 (1993).
4. NAVIGATION AID. This unit is only an aid to navigation. Its accuracy can
be affected by many factors, including equipment failure or defects,
environmental conditions, and improper handling or use. It is the user’s
responsibility to exercise common prudence and navigational judgements.
This radar unit should not be relied upon as a substitute for such prudence and
judgement.
Page 6

iv
2
hsb
PLUS Series Color LCD Display
Raymarine products are supported by a network of Authorized Service
Representatives. For information on our products and services, contact either
of the following:
UNITED STATES Raymarine Inc.
22 Cotton Road, Unit D
Nashua, NH 03063-4219
Telephone: +1 603 881 5200
+1 800 539 5539
Fax: +1 603 864 4756
EUROPE Raymarine Limited
Anchorage Park
Portsmouth
Hampshire PO3 5TD
England
Telephone: +44 (0) 23 9269 3611
Fax: +44 (0) 23 9269 4642
Copyright © Raymarine Ltd. 2001
The technical and graphical information contained in this handbook, to the
best of our knowledge, was correct as it went to press. However, our policy of
continuous improvement and updating may change product specifications
without prior notice. As a result, unavoidable differences between the product
and handbook may occur from time to time, for which liability cannot be
accepted by Raymarine.
Raymarine is a registered trademark of Raymarine Limited.
SeaTalk is a registered trademark of Raymarine Limited.
2
hsb
is a trademark of Raymarine Limited.
Pathfinder Plus is a trademark of Raymarine Limited.
This product contains technology provided under license by Acorn Group plc.
The copyright of this intellectual property is acknowledged by Raymarine
Ltd., as are Acorn’s trademarks and patents. Acorn’s world wide web address
is http://www.acorn.com.
Page 7

Preface
v
This handbook covers the radar and chart aspects of the following
hsb
2
(PLUS) series display systems from Raymarine:
System Display Scanner Chartplotter
Pathfinder Radar RL70C PLUS,
RL80C PLUS
Raychart Chartplotter RC530 PLUS,
RC631 PLUS
Combined Pathfinder Radar/Chartplotter RL70CRC PLUS,
RL80CRC PLUS
Yes N o
No Yes
Yes Ye s
This handbook also describes the use of multi-display systems.
Note: Radar systems are supplied with an appropriate Raymarine scanner
unit and inter-connecting cable. Details for installing the scanner are described in the Pathfinder Radar Scanner Owner’s Handbook.
The Raychart (RC) display units include a cartridge holder assembly which
contains two slots for C-MAP NT chart cards.
This handbook contains very important information on the installation and
operation of your new equipment. In order to obtain the best results in
operation and performance, please read this handbook thoroughly.
Raymarine’s Technical Services representatives or your local dealer will be
available to answer any questions you may have.
TFT LCD Displays
The colors of the display may seem to vary when viewed against a colored
background or in colored light. This is a perfectly normal effect that will be
seen with all color LCD displays.
In common with all Thin Film Transistor (TFT) LCD displays, the screen may
exhibit a few (less than 20) wrongly illuminated pixels. These may appear as
black pixels in a light portion of the screen, or as colored pixels in black areas.
CAUTION:
To provide protection against the damaging effects of UV light, it is
advisable to replace the sun cover provided when the color LCD display is
not in use.
Page 8

vi
Warranty
2
hsb
PLUS Series Color LCD Display
To register your
to fill out the warranty registration card found at the end of this handbook. It is
very important that you complete the owner information and return the card to
the factory in order to receive full warranty benefits.
EMC Conformance
All Raymarine equipment and accessories are designed to the best industry
standards for use in the recreational marine environment.
The design and manufacture of Raymarine equipment and accessories
conform to the appropriate Electromagnetic Compatibility (EMC) standards,
but correct installation is required to ensure that performance is not
compromised.
2
hsb
series display unit ownership, please take a few minutes
Page 9

Contents
Preface .............................................................................................................. v
Warranty ......................................................................................... vi
EMC Conformance ......................................................................... vi
Chapter 1: Overview ..........................................................................................1.1
How to Use This Handbook .......................................................... 1.1
1.1 General .......................................................................................... 1.4
Introduction to
PLUS Display Units ..................................................................... 1.5
Operating Modes .......................................................................... 1.6
Heading and Position Data ........................................................... 1.9
1.2 The Pathfinder Radar PLUS Display .......................................... 1.10
Pathfinder Radar PLUS Display Options ................................... 1.10
Radar Functions ......................................................................... 1.12
hsb2
Systems ........................................................ 1.4
vii
1.3 The Chartplotter Display ............................................................ 1.13
Chartplotter Display Options ...................................................... 1.14
Chartplotter Functions ................................................................ 1.15
1.4 Operating Controls ..................................................................... 1.16
Trackpad and Cursor ................................................................... 1.16
Dedicated Keys ........................................................................... 1.18
Soft Keys ..................................................................................... 1.18
Pop-Up Menus ............................................................................ 1.19
Database Lists ............................................................................. 1.20
Chapter 2: Getting Started & Adjusting the Display ....................................2.1
2.1 Introduction .................................................................................. 2.1
Conventions Used ......................................................................... 2.1
Simulator ...................................................................................... 2.1
2.2 Switching the Display On and Off ................................................ 2.2
Simulator Mode ............................................................................ 2.5
Changing the Brightness ............................................................... 2.6
2.3 Controlling the Display ................................................................. 2.7
Selecting the Mode of Operation .................................................. 2.7
Customizing the Screen Presentation Options ............................ 2.13
Page 10

viii
2
hsb
PLUS Series Color LCD Display
2.4 Radar Display Control Functions ............................................... 2.16
Using the Zoom Function ........................................................... 2.16
Offsetting the Center ................................................................... 2.17
Hiding the Ship’s Heading Marker (SHM) ................................. 2.18
2.5 Chart Display Control Functions ................................................ 2.19
Moving Around the Chart ........................................................... 2.19
Radar/Chart Overlay ................................................................... 2.23
2.6 Typical Chart Scenarios .............................................................. 2.25
Place and Goto a Waypoint ......................................................... 2.26
Make and Follow a Route ........................................................... 2.28
Review Your Passage Plan .......................................................... 2.30
Displaying the Radar and Synchronizing Radar & Chart ........... 2.32
Chapter 3: Standard Radar Operations ..........................................................3.1
3.1 Introduction .................................................................................. 3.1
3.2 Range Control ............................................................................... 3.2
Changing the Range ...................................................................... 3.2
Determining Actual Radar Range ................................................. 3.3
3.3 Interpreting and Adjusting the Radar Picture ............................... 3.4
Identifying False Echo Returns .................................................... 3.5
Adjusting Gain, Sea Clutter, Rain Clutter and Tune ..................... 3.7
Changing the Targets Display ......................................................3.11
3.4 Measuring Range and Bearing Using VRM/EBLs .................... 3.13
Measuring Range and Bearing to Target from Vessel ................. 3.14
Measuring Range and Bearing Between Targets (FLOAT) ........ 3.16
Controlling VRM/EBL Data Boxes ........................................... 3.18
3.5 Setting Guard Zones and Alarms ................................................ 3.19
Placing a Guard Zone .................................................................. 3.20
Moving, Reshaping or Deleting a Guard Zone ........................... 3.21
Controlling Guard Zone Alarms ................................................. 3.22
3.6 MARPA ...................................................................................... 3.23
Introduction to MARPA ............................................................. 3.23
Using MARPA ............................................................................ 3.25
Page 11

Chapter 4: Integrated Radar Operations ........................................................4.1
4.1 Introduction .................................................................................. 4.1
4.2 Changing the Heading Mode ........................................................ 4.2
True and Relative Motion ............................................................. 4.2
4.3 Using Marks .................................................................................. 4.4
4.4 Man Overboard (MOB) ................................................................ 4.5
4.5 Cursor Echo .................................................................................. 4.6
Chapter 5: Standard Chart Operations ...........................................................5.1
5.1 Introduction .................................................................................. 5.1
5.2 Using Chart Cards ......................................................................... 5.2
Inserting a Chart Card ................................................................... 5.2
Removing a Chart Card ................................................................ 5.3
Displaying the Chart Data ............................................................. 5.3
Displaying Object Information ..................................................... 5.4
ix
5.3 Working with Waypoints .............................................................. 5.8
Introduction .................................................................................. 5.8
Placing a Waypoint ....................................................................... 5.9
Selecting a Waypoint .................................................................. 5.12
Waypoint Data Display ............................................................... 5.12
Editing the Waypoint Details ...................................................... 5.13
Erasing a Waypoint ..................................................................... 5.14
Moving a Waypoint .................................................................... 5.14
Using the ST60 or ST80 Navigator Keypad ............................... 5.15
5.4 Working with Routes .................................................................. 5.18
Creating a New Route ................................................................. 5.19
Saving the Current Route ............................................................ 5.22
Clearing the Current Route ......................................................... 5.23
Retrieve a Route From the Database ........................................... 5.23
Displaying Route Information .................................................... 5.24
Using the Route List to Erase and Name a Route ....................... 5.26
Editing a Route ........................................................................... 5.27
5.5 Following Routes and Going to Points ....................................... 5.30
Follow a Route ............................................................................ 5.30
Target Point Arrival .................................................................... 5.32
Other Follow Route Options ....................................................... 5.32
Page 12

x
2
hsb
PLUS Series Color LCD Display
Going To an Individual Target Point ........................................... 5.33
Stop Follow or Stop Goto ............................................................ 5.34
5.6 Transferring Waypoints and Routes ........................................... 5.35
5.7 Using Tracks ............................................................................... 5.38
Setting Up a Track ...................................................................... 5.39
Clearing the Current Track ......................................................... 5.40
Managing Tracks ........................................................................ 5.41
SmartRoute ................................................................................. 5.42
Chapter 6: Further Chart Operations ..............................................................6.1
6.1 Introduction .................................................................................. 6.1
6.2 Measuring Distances Using the VRM/EBL Key .......................... 6.2
6.3 Alarms and Timers ........................................................................ 6.4
Alarm Reporting ........................................................................... 6.4
Setting Alarms and Timers ........................................................... 6.5
6.4 Man Overboard (MOB) ................................................................ 6.6
6.5 Cursor Echo .................................................................................. 6.7
6.6 GPS Setup ..................................................................................... 6.8
6.7 Data Log Mode ........................................................................... 6.10
Chapter 7: Setting Up the System Defaults ...................................................7.1
7.1 Introduction .................................................................................. 7.1
7.2 Changing the Set Up Parameters .................................................. 7.2
7.3 System Set Up Parameters ............................................................ 7.4
Data Boxes .................................................................................... 7.6
Bearing Mode ............................................................................... 7.6
Cursor Reference .......................................................................... 7.6
Cursor Readout ............................................................................. 7.6
Day/Night ..................................................................................... 7.7
Help ............................................................................................... 7.7
Soft Keys ....................................................................................... 7.7
Key Beep ...................................................................................... 7.7
MOB Data ..................................................................................... 7.7
Menu Timeout Period ................................................................... 7.7
Page 13

Units .............................................................................................. 7.7
Variation Source ........................................................................... 7.8
Bridge NMEA Heading ................................................................ 7.8
NMEA Out Set Up ........................................................................ 7.9
Cursor Echo .................................................................................. 7.9
Date and Time Settings ................................................................. 7.9
GPS SOG/COG Filter ................................................................. 7.10
Compass Set Up .......................................................................... 7.10
Language .................................................................................... 7.10
Simulator .................................................................................... 7.10
7.4 Radar Set Up Parameters .............................................................7.11
EBL Display ................................................................................7.11
Timed Transmission Option ....................................................... 7.12
Marks Options ............................................................................ 7.12
Custom Scale .............................................................................. 7.12
Bearing Alignment ..................................................................... 7.13
Antenna Size ............................................................................... 7.13
Send on HSB ............................................................................... 7.13
xi
7.5 MARPA Set Up Parameters ........................................................ 7.14
7.6 Advanced Settings ...................................................................... 7.15
Display Timing ........................................................................... 7.15
STC Preset .................................................................................. 7.16
Tune Preset .................................................................................. 7.16
7.7 Chart Set Up Parameters ............................................................. 7.17
Customize Chart ......................................................................... 7.17
Plotter Mode ............................................................................... 7.18
Chart Orientation ........................................................................ 7.18
Object Information ..................................................................... 7.19
Waypoint Options ....................................................................... 7.19
Vectors ........................................................................................ 7.19
Radar/Chart Synch ...................................................................... 7.19
Datum Selection ......................................................................... 7.19
Position Offset ............................................................................ 7.20
Chapter 8: Installation ......................................................................................8.1
8.1 Introduction .................................................................................. 8.1
Planning the Installation ............................................................... 8.2
EMC Installation Guidelines ........................................................ 8.2
Page 14

xii
2
hsb
PLUS Series Color LCD Display
8.2 Unpacking and Inspecting the Components ................................. 8.4
8.3 Selecting the Display Unit Location ............................................. 8.5
8.4 Cable Runs .................................................................................... 8.8
Power Cable .................................................................................. 8.8
Inter-Unit Scanner Cable .............................................................. 8.9
2
hsb
Cable ..................................................................................... 8.9
8.5 Mounting the Display Unit ......................................................... 8.10
8.6 System Connections ................................................................... 8.12
Display Unit Connection ............................................................ 8.13
8.7 Radar System Tests and Installation Alignment ......................... 8.16
System Check ............................................................................. 8.16
Switch On and Initial Setup ........................................................ 8.16
Radar System Checks and Adjustments ..................................... 8.17
EMC Conformance ..................................................................... 8.20
8.8 Integrated Systems ...................................................................... 8.21
2
hsb
™ (High Speed Bus) Multiple Display Systems .................. 8.21
SeaTalk® and NMEA In ............................................................. 8.24
Using the SeaTalk Auxiliary Junction Box ................................. 8.29
Data Output ................................................................................. 8.30
Data Conversion ......................................................................... 8.30
8.9 Integrated System Checks .......................................................... 8.31
Chart Display -RL70/80CRC PLUS, RC530 PLUS, RC631 PLUS ..
8.31
Received Data ............................................................................. 8.31
Transmitted Data ........................................................................ 8.31
Chapter 9: Maintenance and Problem Solving ..............................................9.1
9.1 Maintenance ................................................................................. 9.1
Routine Checks ............................................................................. 9.1
Cleaning Instructions .................................................................... 9.1
EMC Servicing and Safety Guidelines ......................................... 9.1
9.2 Resetting the System ..................................................................... 9.3
9.3 Problem Solving ........................................................................... 9.4
Technical Support: ........................................................................ 9.4
How to Contact Raymarine (US) .................................................. 9.5
How to Contact Raymarine (Europe) ........................................... 9.6
Worldwide Support ....................................................................... 9.6
Page 15

xiii
Appendix A: Specification ................................................................................... A.1
2
hsb
Series 7"and 10.4" LCD Color Displays ...............................A.1
Appendix B: Using the Auxiliary Junction Box ................................................. B.1
Raystar 112, 105, Apelco 182 and 182XT ....................................B.2
Raystar 120 WAAS Satellite Differential Receiver ......................B.6
Appendix C: C-MAP Chart Card Features .......................................................... C.1
Appendix D: SeaTalk and NMEA Data Received and Transmitted ................ D.1
Appendix E: Connecting a Raymarine Heading Sensor ...................................E.1
G-Series Course Computer ........................................................... E.1
Appendix F: Abbreviations ..................................................................................F.1
Index .............................................................................................. 1.xv
Page 16

xiv
2
hsb
PLUS Series Color LCD Display
Page 17

Chapter 1: Overview 1-1
Chapter 1: Overview
How to Use This Handbook
This handbook describes the following
display systems:
RL70C PLUS Pathfinder Radar, 7" Color LCD Display
RL70CRC PLUS Pathfinder Radar & Chartplotter, 7" Color LCD Display
RC530 PLUS Chartplotter, 7" Color LCD Display
RL80C PLUS Pathfinder Radar, 10.4" Color LCD Display
RL80CRC PLUS Pathfinder Radar & Chartplotter, 10.4" Color LCD Display
RC631 PLUS Chartplotter, 10.4" Color LCD Display
If you are installing the display system yourself, you should read Chapter 8
before you start the installation. This chapter also provides information that
will be useful if you are connecting your
equipment.
2
hsb
(PLUS) series displays and multi-
2
hsb
series system to other
How to Use This
How to Use This
Handbook
Handbook
2
hsb
For an overview of
(PLUS) display systems, the display unit controls and
the radar/chartplotter systems, read Chapter 1. Chapter 2 will help you start
using your system.
For detailed information on radar operations refer to Chapter 3:Standard
Radar Operations and Chapter 4:Integrated Radar Operations.
For chartplotter operating details, refer to Chapter 5 and Chapter 6.
To change the system set up defaults, read Chapter 7.
Details for installing a radar scanner are provided in the Radar Scanner User’s
Handbook supplied with your scanner.
Note: Many illustrations in this handbook show example screens. The screen
you see on your display depends on your system configuration and set up options, so it may differ from the illustration.
This handbook is organized as follows:
2
hsb
Chapter 1 provides an overview of an
features and functions of the
2
hsb
PLUS series LCD Color Display. This
multi-display system and the
chapter also provides an overview of the controls. You should read this chapter
to familiarize yourself with the system.
Chapter 2 explains how to start using the display and describes how to use
some of the basic radar and chart functions. Chapter 2 also provides operating
guidelines for typical chartplotter scenarios; these guidelines introduce you to
many of the chartplotter functions.
Page 18

1-2
2
hsb
PLUS Series Color LCD Display
How to Use This
How to Use This
Handbook
Handbook
Chapters 3 provides detailed operating information for the main radar
functions - adjusting the radar picture; measuring distances and bearings;
setting guard zones and alarms, using MARPA for target tracking.
Chapter 4 provides detailed operating information for integrated radar
system functions, including using marks, man overboard and cursor echo.
Chapter 5 provides detailed operating information for the standard
chartplotter functions - using chart cards, plotting waypoints and routes,
following routes and showing tracks.
Chapter 6 provides detailed operating information for further chart functions,
including measuring distances, man overboard and cursor echo. It includes
instructions for setting up a differential GPS.
Chapter 7 provides instructions for setting up your system to suit your
preferences. You should read this chapter to determine how to set up the radar
and chartplotter system defaults.
Chapter 8 provides planning considerations and detailed instructions for
installing the display unit(s). It should be referred to when you are ready to
install the system. Details to connect the display to other equipment are also
provided. To install a complete radar system, you will also need to read the
Owner’s Handbook supplied with the scanner.
Chapter 9 provides information on user maintenance, and what to do if you
experience problems.
The Appendices provide additional information that you may find useful:
Appendix A lists the technical specifications for the radar and chartplotter.
Appendix B provides details on connecting the display unit to specific GPS
systems.
Appendix C defines the chart features shown on the chart display.
Appendix D defines the SeaTalk and NMEA data that is transferred on
integrated systems.
Appendix E provides details on connectinga Raymarine heading sensor for
MARPA and radar/chart overlay.
Appendix F provides a list of abbreviations.
An Index and warranty information are included at the end of the handbook.
A summary of the radar and chartplotter controls are provided on the Quick
Reference Cards supplied with your system.
Page 19

Chapter 1: Overview 1-3
Terminology
The following terminology is used to describe radar and chartplotter systems:
Master A unit capable of sourcing specific data such as
fishfinder, chart or radar data.
Repeater A unit capable of displaying data, such as radar, from
2
hsb
.
Fishfinder Display Unit providing Fishfinder Master, Chart Repeater and
Radar Repeater functionality.
Radar Display Unit providing Radar Master, Fishfinder Repeater
and Chart Repeater functionality.
Chart Display Unit providing Chart Master, Fishfinder Repeater and
Radar Repeater functionality.
Combined DisplayUnit providing both Radar and Chart Master or Fishfinder
and Chart Master functionality.
2
hsb
Integrated System Additional instruments are connected via
Seatalk or NMEA interfaces.
,
How to Use This
How to Use This
Handbook
Handbook
2
hsb
™ High Speed Bus - links compatible display units.
It supersedes HSB and allows multiple display systems.
For full display and control between
units, the units must be connected via
hsb
hsb
2
series display
2
and SeaTalk.
Page 20

1-4
1.1 General
General
General
2
hsb
PLUS Series Color LCD Display
The
2
hsb
(PLUS) series Pathfinder Radar or Pathfinder Radar/Chartplotter
comprises the 7"or 10.4"Color LCD PLUS display unit, scanner unit and
associated cables. The RC530 PLUS and RC631 PLUS Chartplotters cannot
be connected to the scanner unit.
Display Unit
The
installed either above or below deck.
The unit includes:
• 7" or 10.4"color LCD PLUS display
• Trackpad
• Eleven dedicated (labeled) control keys
• Four soft keys (unlabeled) whose functionality changes
• Two slots for the C-MAP NT
2
hsb
(PLUS) series display unit is waterproof to CFR46 and can be
®
chart cards
The display and keys can be illuminated for night-time use.
Scanner
The
illuminates targets with microwave energy and then collects the returns from
those targets. The scanner includes a sensitive low-noise front end receiver,
and a variety of clutter attenuation controls to maintain target resolution.
Installation of the scanner is described separately in the Scanner Owner’s
Handbook. The scanner is adjusted and operated from the display unit, so
these details are provided in this Handbook.
The scanner can be switched between transmit and stand-by modes. It also has
a power-saving timed transmit mode which pauses between bursts of
transmissions.
2
hsb
series Pathfinder Radar is supplied with a scanner unit which
Introduction to
It is possible to connect up to ten
(dependent on cable lengths) and a scanner unit to provide an integrated
system. The system may include existing HSB display units that have been
suitably upgraded - contact your authorized Raymarine dealer for upgrade kit
details.
hsb
2
Systems
2
hsb
(PLUS) series LCD or CRT displays
The
2
hsb
(High Speed Bus) connection enables transfer of data between
compatible units. For example, radar data is transferred from the radar (the
Page 21
Chapter 1: Overview 1-5
master display) via the
any other
In particular, you can connect your Radar to a remote Chartplotter (or
Fishfinder/Chartplotter) to provide similar functionality to the combined
Radar/Chartplotter (or Fishfinder/Chartplotter). However, you should be
aware that if you change, say, radar range on one display, it affects all displays
showing radar (or radar/chart overlay on color displays).
hsb
The
cartridge slots. Each display can access two local and up to six remote chart
cartridges. Charts can be controlled independently on each display, even when
a remote chart cartridge is being used.
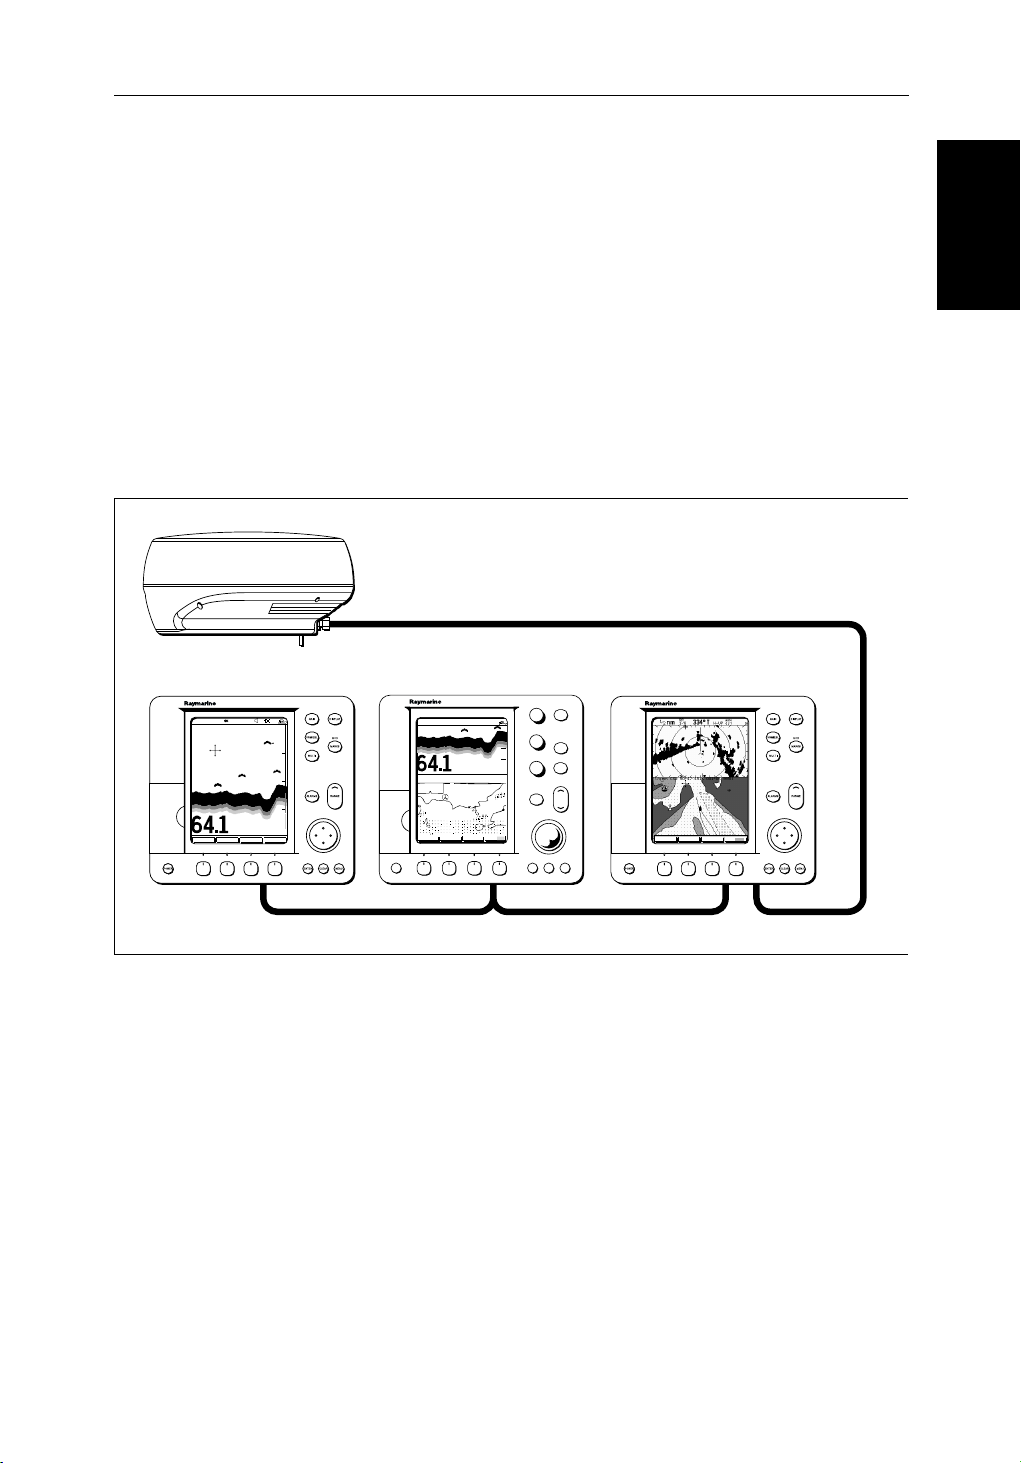
Pathfinder Scanner
hsb2 Fishfinder Display
AUTO GCRZFH
SD
50kHz
0
8
25
38
45
52
ft
ZOOMFREQUENCY
BTM.LOCK A-SCOPE
50
75
100
2
hsb
connection and can be displayed and controlled on
2
hsb
series LCD or CRT display (the repeater display).
2
system can include several chartplotter displays, each with two chart
hsb2 Radar/Chart Display
AUTO G RZ
50kHz
0
200
ft
ZOOM MORE¬FREQUENCY CHRT SNR
POWER
GAIN
SEA
MULTI
ALARMS
ENTER CLEAR MENU
DISPLAY
MOB
MARKS
VRM/EBL
RANGE
2
hsb
Radar Display
GOTO MORE!ROUTE RDR CHRT
PLUS Display Units
PLUS Display Units
Fishfinder, Chart, Radar transferred to all displays
Figure 1-1:
hsb
PLUS Display Units
Features
• Chartplotter – Displays chart information from the C-MAP NT® chart
cards (C-Cards)
• Uses position data from GPS, DGPS, WAAS or Loran-C technology
• Displays and transfers SeaTalk, NMEA and
• Provides full control of data from other
• Several full-screen operating modes including Radar, Chart, Data Log or
Sonar, if appropriate data is available.
2
Integrated System
hsb
2
hsb
instruments
2
data
D5569-1
Page 22

1-6
2
hsb
PLUS Series Color LCD Display
Operating Modes
Operating Modes
• View radar and chart simultaneously as radar/chart overlay or in half-
screen windows.
• Half-screen windows to display additional data: Course Deviation Indica-
tor (CDI), Bearing and Distance Indicator (BDI), navigation data.
• Cursor echo across SeaTalk, and between chart and radar windows
• Choice of orientation: Head Up, Course Up and North Up
• The system can be connected to an ST80 Navigator keypad for entry of
alpha-numeric data.
Set Up Options
Set up options allow you to choose what is displayed, how it is displayed
(including language and units), bearing mode and how the display operates
with other
from other equipment, e.g. speed, heading, depth, wind and tide information
in a set of user-selectable data boxes.
Display options are provided in System Set Up, described in Chapter 7.
Screen Presentation Options, described in Chapter 2 allow you to switch the
cursor and data boxes On/Off. The cursor box and user-selected data boxes
can be moved around the screen
2
hsb
units. You can view the cursor position and a variety of data
Operating Modes
On a single
combined unit, you can overlay the radar targets on to the full screen chart.You
can also set Windows On to split the display into two half-screen windows to
show supplementary data or, on a combined display unit, display radar and
chart simultaneously. The main operating mode (radar or chart) is displayed in
the upper window; you choose what is displayed in the lower window.
The following are available:
Table 1-1:
Display Full-screen mode Half-screen Window Options
RL70C PLUS,
RL80C PLUS
RC530 PLUS,
RC631 PLUS
RL70CRC PLUS,
RL80CRC PLUS
hsb
hsb
2
unit you can view a full screen radar or chart and, on a
2
Single Display Operating Modes and Window Options
Radar CDI, BDI or Nav Data
Chart CDI, BDI or Nav Data
Data Log Windows not available
Radar Mode CDI, BDI, Chart or Nav Data
Chart Mode CDI, BDI, Radar or Nav Data
Radar/Chart Overlay
Data Log Mode
Windows not available
Page 23
Chapter 1: Overview 1-7
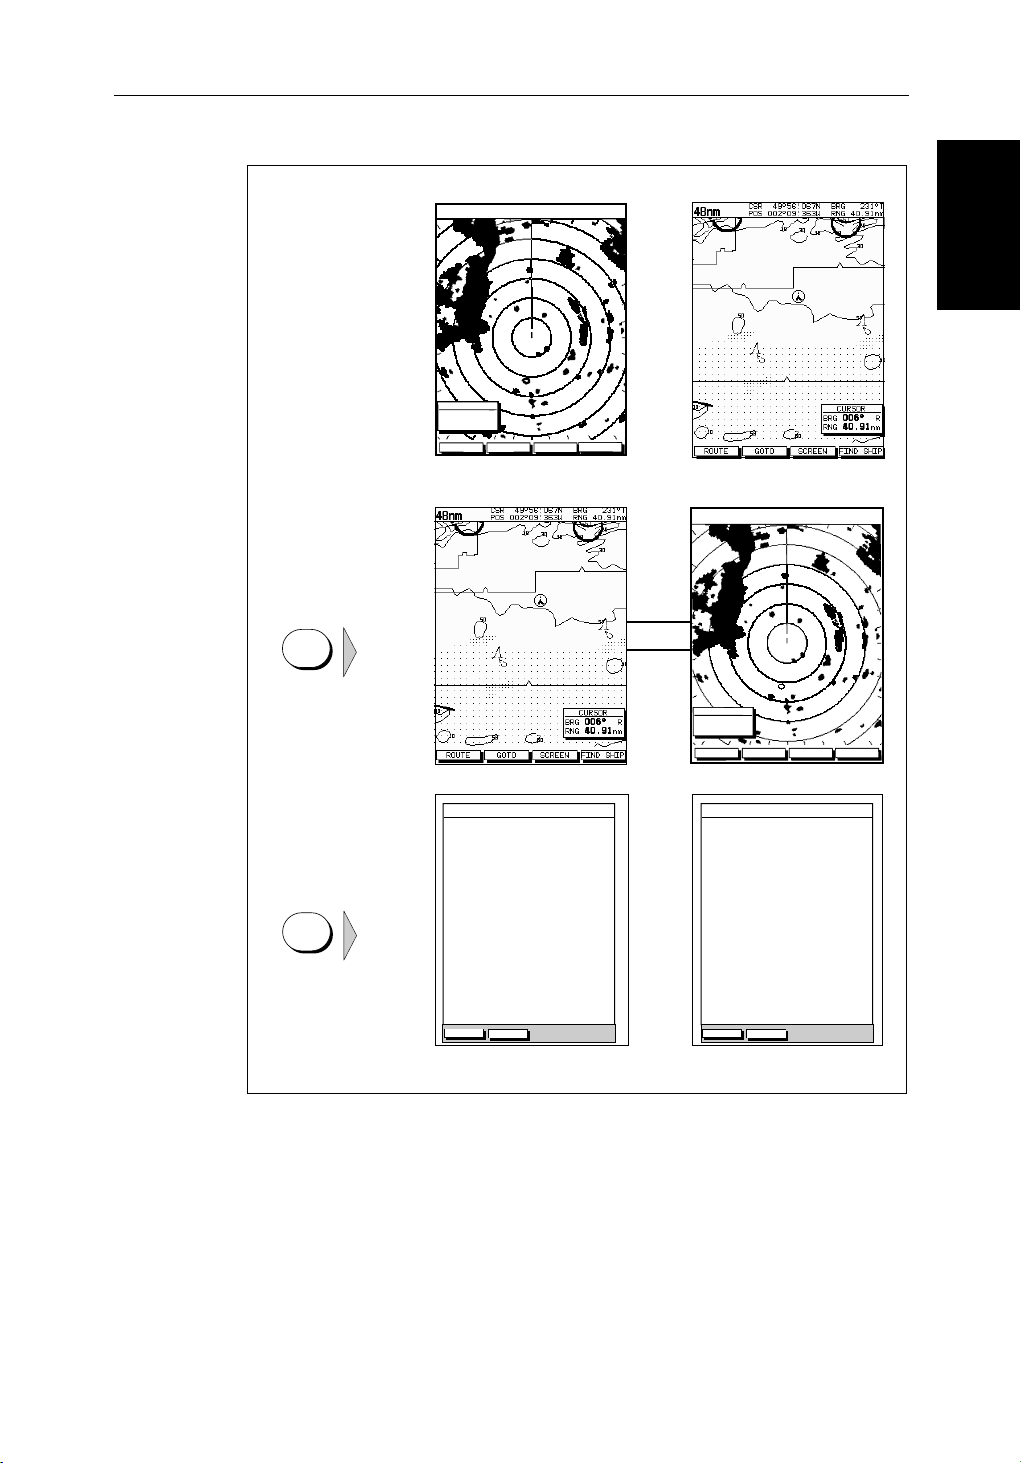
Radar Display Chartplotter Display
Operating Mode for
Stand Alone Units
RR
000°
0.220
1/2
HEAD UP
3nm
CURSOR
BRG
RNG nm
HDG MODE TARGETS SCREEN
MARPA
R
I
Operating Modes
Operating Modes
Additional Modes for
Linked Units
(or combined
Radar/Chartplotter)
DISPLAY
DISPLAY
TIME POSITION CMG DMG
15:30
16:00
16:30
17:00
17:30
18:00
18:30
19:00
19:30
STOP LOG
50°21^890N
001°20^610W
50°18^010N
001°20^070W
50°21^850N
001°19^290W
50°18^500N
001°21^300W
50°20^990N
001°18^280W
50°19^660N
001°21^960W
50°19^730N
001°18^030W
50°20^930N
001°21^750W
50°18^550N
001°18^650W
CLEAR LOG
346°
180°H
012°H
206°H
043°H
245°H
093°H
302°H
145°H
H
6.86
7.23KM
7.23KM
6.67KM
5.74KM
5.00KM
4.63KM
5.00KM
5.74KM
KM
HSB
SeaTalk
RR
000°
0.220
1/2
50°21^890N
001°20^610W
50°18^010N
001°20^070W
50°21^850N
001°19^290W
50°18^500N
001°21^300W
50°20^990N
001°18^280W
50°19^660N
001°21^960W
50°19^730N
001°18^030W
50°20^930N
001°21^750W
50°18^550N
001°18^650W
CLEAR LOG
HEAD UP
346°
180°H
012°H
206°H
043°H
245°H
093°H
302°H
145°H
H
3nm
CURSOR
BRG
RNG nm
HDG MODE TARGETS SCREEN
TIME POSITION CMG DMG
15:30
16:00
16:30
17:00
17:30
18:00
18:30
19:00
19:30
STOP LOG
MARPA
6.86
7.23KM
7.23KM
6.67KM
5.74KM
5.00KM
4.63KM
5.00KM
5.74KM
I
KM
R
D4285-1
Figure 1-2: Full Screen Operating Modes
Page 24

1-8
2
hsb
PLUS Series Color LCD Display
Operating Modes
Operating Modes
Half-Screen Window Options
• Chart display, Radar display: If data is available as a function of the
combined display unit it can be displayed full screen, as shown in
Figure 1-2, or in a half-screen window.
• CDI: This gives the Course Deviation Indicator graphical display, with
data relating to the target waypoint.
• BDI: This gives the Bearing and Distance Indicator graphical display, with
data relating to the target waypoint.
• Nav Data: This shows sixteendata boxes, providing navigational data in
the units specified in your set up. Note that up to 6 of these data boxes are
also available as a user-selectable group (see Section 7.3).
You select the operating mode and windows using the
DISPLAY key as
described in Chapter 2.
Multi-display systems
If you have several
operation is similar to a combined Pathfinder Radar/Chartplotter Unit:
threefour full-screen modes –radar, chart, radar/chart overlay and data log are
available on all displays.
In addition, if you have an
set any display to fishfinder mode; if the system includes a chartplotter, similar
functionality to a combined Fishfinder/Chartplotter is available on all
displays.
2
hsb
series Radar and Chartplotter displays connected
2
hsb
series Fishfinder display connected, you can
On an
2
hsb
system with Radar, Chart and Fishfinder available, the following
information can be shown on any display unit:
Table 1-2: Window Options for Integrated Systems
Full-screen mode Half-screen Window Options
Chart Mode, CDI, BDI, Nav Data, Fishfinder or Radar
Radar Mode CDI, BDI, Chart or Nav Data
Fishfinder Mode Depth/temp, Chart or CDI, BDI
Radar/Chart Overlay Windows not available
Data Log Mode Windows not available
For details on the fishfinder, refer to the
2
hsb
Series Display Owner’s
Handbook supplied with your fishfinder.
Page 25

Chapter 1: Overview 1-9
Heading and Position Data
Full functionality of the radar/chartplotter is achieved when it is part of an
integrated system with other equipment (in addition to another
connected via SeaTalk or NMEA 0183. Data from this equipment including
position and heading is shown on the display and is used in calculations.
Details on connecting other equipment are given in Chapter 8.
Providing Heading Data for Radar/Chart Overlay and MARPA
The performance of MARPA and Radar/Chart Overlay is dependent on the
quality of your heading sensor. It is important that both the heading sensor and
the radar scanner (bearing alignment) are correctly calibrated. Refer to the
appropriate heading sensor and radar scanner handbooks for calibration
details. The better the accuracy of your heading data, the better the
performance of MARPA and Radar/Chart Overlay.
A gyro compass provides the best performance in all conditions. Alternatively
you could use a fluxgate compass with rate gyro stabilization.
MARPA requires heading data to be frequently updated (we recommend a
data output rate of greater than 8 Hz); heading data must therefore be provided
on NMEA.
In multiple-display systems, heading must be connected, via NMEA, to each
display that will be used for MARPA.
hsb
2
unit)
Data
Data
Heading and Position
Heading and Position
We recommend the Raymarine Rate Gyro Compass system. Good results are
also obtained with a Raymarine autopilot system incorporating a 150G or
400G Course Computer with internal rate gyro.
Other heading sensors connected on NMEA may provide satisfactory results
in reasonable sea states. However, in unsettled conditions a rate gyro compass
is advisable.
Contact Raymarine Customer Services or your authorized Raymarine dealer
for additional information. For specific configuration details with the
Raymarine course computer refer to Appendix E. If you are using a suitable
third party heading sensor, refer to its documentation for installation and
calibration details.
Page 26

PLUS Display
PLUS Display
1-10
The Pathfinder Radar
The Pathfinder Radar
1.2 The Pathfinder Radar PLUS Display
When a scanner is connected and the radar is in Transmit mode, the radar
picture provides a map-like representation of the area in which the radar is
operating. Typically, your ship’s position is at the centre of the display, and its
dead ahead bearing is indicated by a vertical heading line, known as the Ship’s
Heading Marker (SHM).
The radar picture can be viewed with a variety of fixed or customised range
scales. The colour of the radar returns (echoes) indicates their intensity: the
strongest returns are shown in yellow and the weaker are shown in shades of
blue. A status bar at the top of the radar image displays range, current heading
and mode indicators for the various options you can set.
An example radar picture is shown on the next page, with example radar
returns (echoes) and default Pathfinder Radar information. The Status Bar is
also illustrated.
The radar display can show additional information, depending on your
currently selected options, set up selections and the data available from other
equipment. The example displays on the following pages show some of these
features.
2
hsb
PLUS Series Color LCD Display
Functions are available to control the display as follows:
• Zoom the Display
• Offset your vessel from the centre of the radar picture
Operation of these functions is described in Chapter 2.
Pathfinder Radar PLUS Display Options
In addition to the display set up options previously described, radar set up
options allow you to customise the radar image by selecting how radar marks
and Electronic Bearing Line (EBL) data are displayed. You can also specify
timed transmit mode and custom range scales.
The Screen Presentation Options, described in Chapter 2 allow you to switch
range rings on/off and waypoint display on/off.
Note: When you turn the display off and on again, the Screen Presentation settings are retained in memory.
Page 27
Chapter 1: Overview 1-11
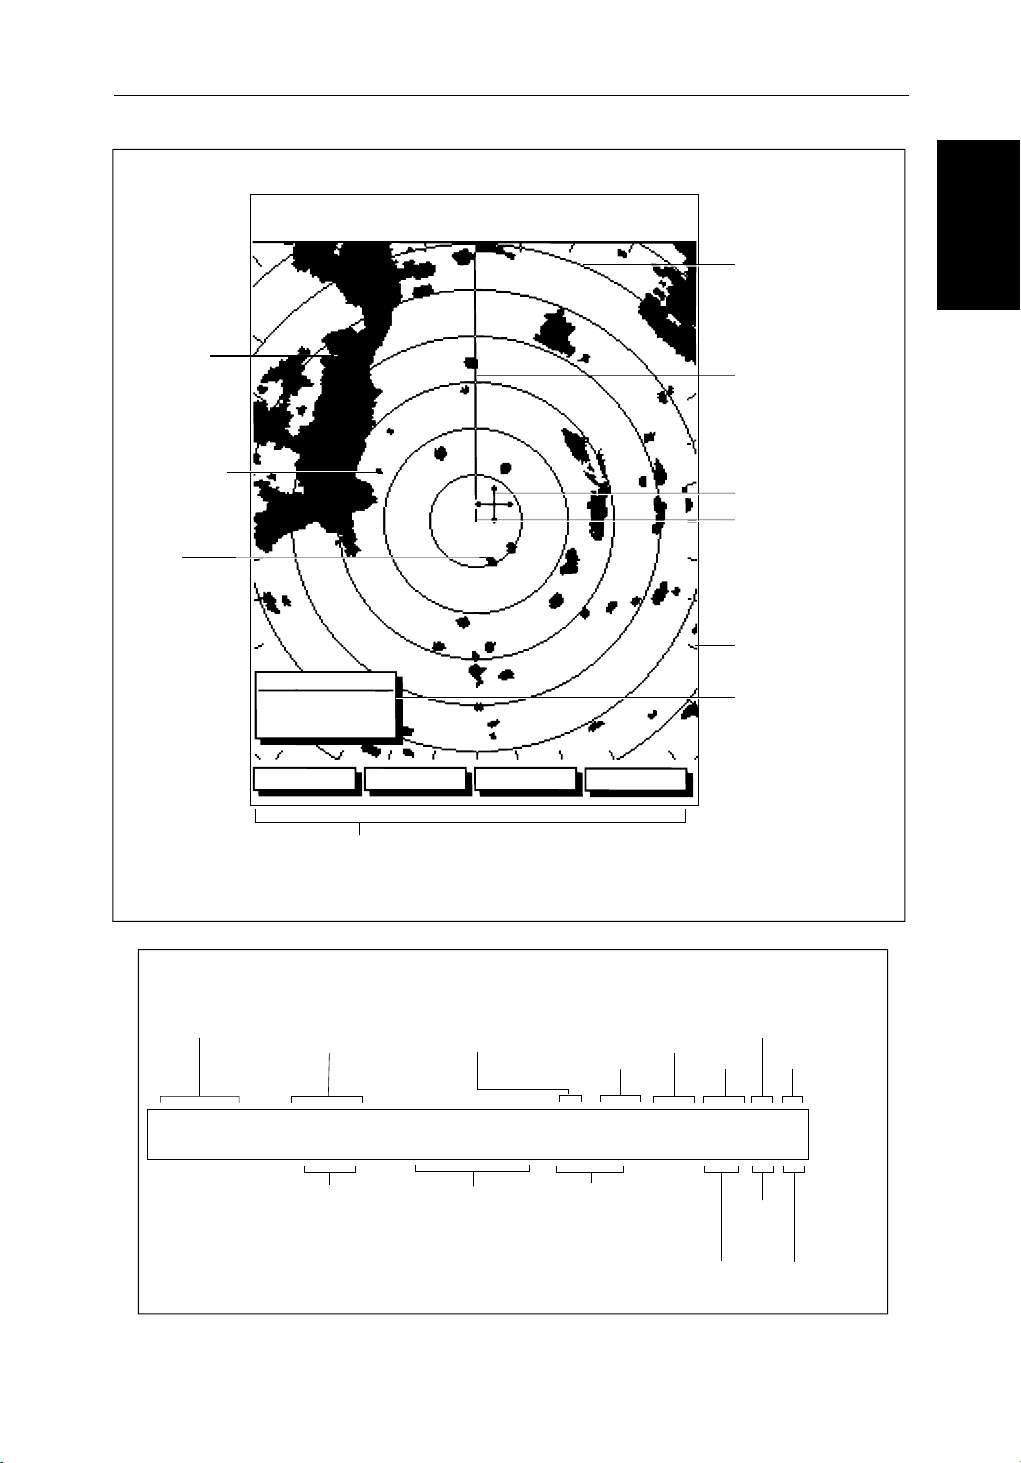
Default Display
Targets:
Landmass
Channel buoy
Surface
vessel
RM RV3
H-UP
AUTO
T
MARPA
045°
0.28
RINGS
1/2
R
126°T
3nm
CURSOR
BRG
RNG nm
HDG MODE TARGETS SCREEN
Default soft key labels
These can be turned off; press any soft key to re-display them.
Different labels are displayed when you press a key.
IR
Status Bar
Range rings
The number and
spacing depend on
the current range, or
you can turn them off
Ship's Heading
Marker (SHM)
You can hide this
temporarily
Cursor position,
controlled by the
trackpad
Ship's position
You can move this
off-centre if required
Bearing scale,
each tick indicating
o
of azimuth
2
Cursor position box
Shows the current
cursor position as
either Range/Bearing
or Lat/Long. You can
move this box to your
preferred position
on the screen, or
turn it off.
D3600-6
Pathfinder Radar
Pathfinder Radar
PLUS Display Options
PLUS Display Options
Status Bar
Selected range,
in nautical miles
3nm
Range rings
(displayed if
rings are on)
RINGS
1/2
Range ring interval
Not displayed if
range rings are off
Motion Mode
Relative Motion
True Motion
126°T
Current heading
if data available, or
Course Over Ground.
Displayed in degrees
Magnetic or True
displayed when function on:
Target Vectors
True Vector or
Relative Vector
and vector length
RM RV3
H-UP
Heading mode
Normally Head Up (H-UP);
Course Up (C-UP) or
North Up (N-UP) can be
selected if heading data
available
Auto mode
Gain, Sea,
Tune
AUTO
GST
(Remote rain)
Mode Indicators
Target
Expansion
Wakes
WKS
FTCEXRCGZIR
FTC
Guard Zone
Alarms
Rain
Clutter
Interference
Rejection
D3993-2
Page 28
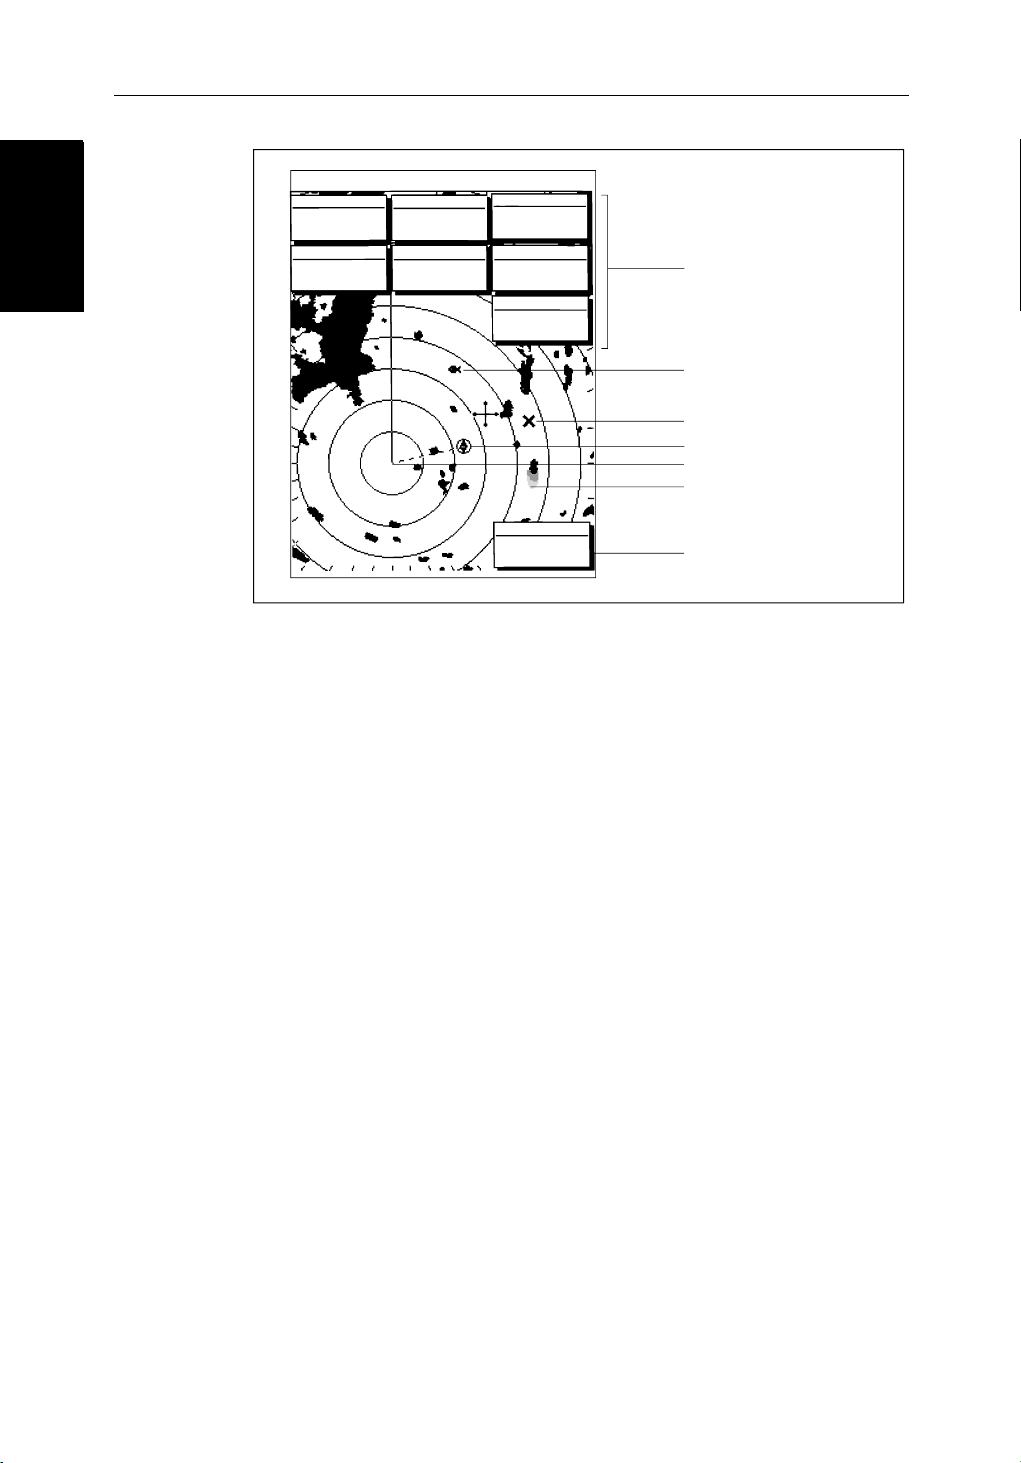
Radar Functions
Radar Functions
1-12
Radar Functions
2
hsb
PLUS Series Color LCD Display
3nm
CURSOR
BRG
RNG
120@T
063°
1.65
COG
RR
1/2
R
nm
001°12^09W
126°T
POSITION
50°49^13N
SOG
6.3kts
H-UP
13:48:06
FTC
AUTO
FTC
GST
TIME
SPEED
5.7kts
DEPTH
EX
RC
IR
Data boxes, showing data
(if available) in the selected
units
14.4m
Mark, symbol selected using
setup options
Mark, default symbol
Active waypoint - from Chartplotter
Offset centre
Long target wake (short,
medium or long wakes can
be selected)
Waypoint data box, showing
range, bearing and time to go
D3601-2
203°
01h:30m
WPT
T 1.20nm
The
• Choice of range scales from
2
hsb
(PLUS) series Pathfinder Radar includes the following functions:
1
/8 nm to 72nm (dependent on scanner type).
• Automatic and manual control of tuning, gain and sea clutter.
• Two Variable Range Markers (VRMs) and Electronic Bearing Lines
(EBLs), allowing target range and bearing measurements.
VRM/EBLs can be floated.
• Target wakes and target expansion mode.
• Two guard zones with alarms.
• Add marks to record important or dangerous locations.
• Man Overboard (MOB) to navigate back to a person or object.
• 10 Target MARPA
Operation of these radar functions is described in Chapter 3 and Chapter 4.
Page 29

Chapter 1: Overview 1-13
1.3 The Chartplotter Display
The
2
hsb
(PLUS) series LCD Display can include a Chartplotter. The
chartplotter includes a small-scale world map and detailed navigation
information is displayed when a cartographic chart card is installed. The
details displayed depend on the chart zoom level selected. A plotter mode is
provided to enable route plotting and tracking at large scales even when a chart
card is not installed, or when the chart is zoomed beyond the available
cartographic detail. A typical chartplotter screen is shown in Figure 1-3.
The chartplotter uses position information from a GPS, DGPS, WAAS or
Loran-C instrument. Once the position fix has been established, your vessel’s
position, if on screen, is shown as a boat shape pointing in the direction of the
current heading (or COG if heading data is not available). If no heading or
COG data is available, the vessel is shown as a circle.
The chartplotter screen includes a status bar that displays chart scale, with
either cursor position, range and bearing or, when the cursor is homed to the
vessel (by pressing
FIND SHIP), vessel position, Speed Over Ground (SOG),
Course Over Ground (COG) and fix type (VES POS, DIF FIX or SD FIX).
The status bar also indicates if radar/chart overlay is switched on.
Any waypoints you have placed are displayed (unless you turned them off in
Chart Set Up as described in Chapter 7) and the current route is shown.
Information can be viewed on-screen by positioning the cursor over a
waypoint, current route or chart object. The chartplotter screen can also show
additional information, depending on your currently selected options, set up
selections and data available from other equipment.
The Chartplotter
The Chartplotter
Display
Display
An example chart display, in its default configuration, with a chart card
installed, is shown in the following illustration.
Several functions are available to control the display as follows:
• Zoom in/out and Pan the Display
• Offset the Chart or Center the Chart around the Vessel
• Overlay Radar Targets onto the Chart Display
• Synchronize the Chart and Radar (if radar data is available)
Operation of these functions is described in Chapter 2.
Page 30

Chartplotter Display
Chartplotter Display
Options
Options
1-14
Chartplotter Display Options
In addition to the display set up options previously described, chart set up
options, described in Chapter 7, allow you to customize the chart by selecting:
• What cartographic features and level of detail are displayed.
• Chart orientation (north up, head up or course up), datums and position off-
set.
• How waypoints are displayed (symbols and numbers).
• Vectors for heading, COG and tide.
The Screen Presentation Options, described in Chapter 2 allow you to switch
the Chart Grid On/Off and Custom Chart Details On/Off.
Note: When you turn the display off and on again, the Screen Presentation settings are retained in memory.
Chart Range
2
hsb
PLUS Series Color LCD Display
Status Bar
Chart Boundary
Waypoint
Object data box -
for object selected
by cursor
Figure 1-3: Typical Chartplotter Display
Custom Chart Details
The chartplotter set up options include a sub-menu to customize the
cartographic features. This menu allows you to switch features On, Off, or
control them using the
Custom chart options are as follows:
Default soft key labels
These can be turned off: press any soft key to redisplay them.
Different labels are displayed when you press a key.
CUSTOM soft key. The factory default settings for the
Vessel Position
Cursor -
selecting chart object
Depth Area
Cursor position box
Shows the current
cursor position as
either Range/Bearing
or Lat/Long. You can
move this box to your
preferred position on
the screen or turn it off.
D4275-2
Page 31

Chapter 1: Overview 1-15
ON: Chart text, chart boundaries, depth contours, navigation marks
and land features.
OFF: Caution and routing data.
CUSTOM: Spot sounding, light sectors, marine features.
Note: The factory default for the
CUSTOM settings is ON.
Icons are displayed in detail, depth shading limit is 10 m and depth contour
display is 0-100 m.
A complete list of chart features is given in Appendix C.
Chartplotter Functions
Functions
Functions
Chartplotter
Chartplotter
The
2
hsb
(PLUS) series Chartplotter includes the following functions:
• Display C-MAP NT C-Card chart information including Ports and Tides
(if available)
• View chart information (if available) for the Nearest Port
• Place, Move, Erase and Edit a Waypoint
• Goto Waypoint or Cursor
• Create, Save, Name, Edit and Follow a Route
• Review Route and Waypoint Lists
• Display vessel’s track; Save and Name the Track for re-call to screen
• SmartRoute to make a track into a route
• Measure Chart Distances and Bearings on-screen
• Set Up Alarms and Timers
• Man OverBoard (MOB) to navigate back to a missing person or object
• Differential GPS set up page
Operation of these functions is described in Chapter 5 and Chapter 6.
Page 32

1-16
Operating Controls
Operating Controls
1.4 Operating Controls
You operate the radar and chart systems using a variety of controls:
• A trackpad providing up, down, left, right and diagonal control of an on-
screen cursor.
• Eleven dedicated (labeled) control keys.
• Four soft keys with labels displayed on the screen.
• Pop-up menus, displayed on-screen, from which you select options.
• Database lists, displayed on-screen, which enable you to edit items.
Note: The cursor is the cross-hair symbol (+) visible on the display. You move
the cursor using the trackpad and use it to select a position or item on the chart.
The control keys are shown in Figure 1-4. They are back-lit for night-time use.
When you use a control, a help message is displayed at the top of the screen
(unless you switch help off as described in Chapter 7). The following
paragraphs describe the controls and on-screen facilities.
2
hsb
PLUS Series Color LCD Display
Figure 1-4: LCD Display Control Keys
Trackpad and Cursor
The trackpad has several functions:
• To move the cursor around the screen
Dedicated
keys
Trackpad
Soft keys
Dedicated keys
D3596-3
• To select an item from a pop-up menu
• To adjust a variable soft key control
Page 33

Chapter 1: Overview 1-17
The cursor is used to:
• Select a position on the screen.
• Select an item, e.g.guard zone on the radar, chart object on the chartplotter.
• Select an area of the radar image to zoom into or pan the chart display.
Moving the Cursor
You can press on any of the four sections of the trackpad to move the cursor in
that direction (up, down, left or right), or press two sections at the same time to
move diagonally. The cursor moves faster as you continue to press the
trackpad. The current cursor position is shown in the cursor data box (if
selected).
Note: During many operations you cannot move the cursor around the
screen; if you cannot move the cursor using the trackpad, check the default soft
keys are displayed (unless they have been switched OFF in system set up). If
not, press
The cursor is normally displayed as a crosshair. However, if you have not
moved the cursor for more than five seconds, when you next move it the cursor
is outlined by a circle so it is easier to locate on the screen.
ENTER until they are displayed.
Trackpad and Cursor
Trackpad and Cursor
Context-Sensitive Cursor Control
The cursor is context-sensitive. When the cursor is positioned over special
features on the display a text label appears to identify the feature as follows:
Table 1-3: Context-Sensitive Cursor Text Labels
Text Label Feature Radar/Chart
BOX Data box (any type) Both
MOB Man Over Board marker Both
MRK Radar Mark Both
WPT Chart Waypoint Both
CTR Centre of radar Radar
FLT Floating EBL/VRM Radar
GRD Guard zone Radar
MARPA MARPA Target Radar
SHM Ships Heading Marker Radar
VRM/EBL VRM and EBL, 1 or 2 Radar
ZMB Zoom box Radar
A
➟B
Ruler line Chart
Page 34

1-18
2
hsb
PLUS Series Color LCD Display
Dedicated Keys
Dedicated Keys
Table 1-3: Context-Sensitive Cursor Text Labels
Text Label Feature Radar/Chart
COG Course Over Ground vector Chart
HDG Heading vector Chart
POS Vessel’s position Chart
RTE Route leg Chart
TIDE Tide vector Chart
Some items on the radar/chartplotter screen, such as the cursor have
information associated with them. Most information is displayed in a data
box. The context-sensitive cursor allows you to move databoxes.
Dedicated Keys
The dedicated keys: DISPLAY, MARK S, G AIN, VRM/EBL, MULTI,
ALARMS, RANGE, ENTER, CLEAR, MENU
functions; the functions are similar on all
ALARMS is used to set up the system alarms on both a chartplotter and a radar.
Some keys can be used in two ways:
and POWER have fixed
2
hsb
series displays. For example,
• Press: Press the key momentarily and then release it. This method is used
• Press and hold: Press the key and hold it down for the length of time stated
When you press a dedicated key, one of the following happens:
As you press a key, a single audio beep confirms the key action. If the keypress is not valid for the current screen or mode, three rapid beeps sound to
indicate that no response is available. If required, you can turn the key beeps
off as part of your set up procedure (see Chapter 7).
Soft Keys
The four keys below the screen are called soft keys because their functions
change according to the operation. The soft keys are grouped into related sets
and subsets providing access to the various functions. The soft key labels are
displayed on the screen just above the keys. The default soft keys are displayed
for most key operations.
(for example, 3 seconds), and then release it.
i. The associated operation is actioned, e.g. change chart scale (
ii. A pop-up menu is displayed, providing further options.
iii. A set of soft keys is displayed, providing further functions.
RANGE).
Page 35

Chapter 1: Overview 1-19
until you press a key, or select an item on the screen; the soft keys associated
with the action are then displayed.
TARGETS SCREENHDG MODE
RDR CHRT
D4152-2
The currently selected soft key option is shown by its green background. If the
key text is displayed in gray rather than in black, it is not currently available.
When you press a soft key one of the following happens:
Pop-Up Menus
Pop-Up Menus
i. The associated operation is actioned, e.g.
ii. A sub-set of soft keys is displayed, providing further functions.
iii. A pop-up menu is displayed, providing further options.
As with dedicated keys, when you press a soft key a single audio beep
confirms the key action. If the key-press is not valid for the current screen or
mode, three rapid beeps sound to indicate that no response is available. If
required, you can turn the key beeps off as part of your set up procedure (see
Chapter 7).
Pop-Up Menus
Pop-up menus usually provide set up options. When a pop-up menu is onscreen, a set of associated soft keys is also displayed as shown in Figure 1-5.
ARRIVAL ALARM
OFF TRACK ALARM
ANCHOR ALARM
COUNTDOWN TIMER
ALARM CLOCK
NORTH UP.
ALARMS SET UP
0.01nm
ON
OFF
00:33:00
OFF
SELECT ARRIVAL
ALARM RADIUS
D4265-1
Figure 1-5: Typical Pop-up Menu
You use the trackpad to select an option from the menu, then use the
appropriate soft key to set the option. For example, you can toggle the
TRACK ALARM
on/off.
OFF
Page 36

1-20
2
hsb
PLUS Series Color LCD Display
Database Lists
Database Lists
Database Lists
The waypoints, routes and tracks that you create on the chartplotter are stored
in database lists. You can view these lists and select items for editing.
POSITION
BRG _186°
TEMP
DATE
GOTO
WAYPOINT
Figure 1-6: Typical Database List
WAYPOINT LIST
SYMBOL NAME
WAYPOINT 001
WAYPOINT 002
WAYPOINT 003
WAYPOINT 004
WAYPOINT 005
50°21^966N
001°20^368W
BRG _21.0nm
DEPTH
C
---°
--/--/--
EDIT
WAYPOINT
TIME
MAKE NEW
WAYPOINT
m
---
--:--:--
WAYPOINT
TRANSFER
D4262-1
As with pop-up menus, when a database list is on-screen, a set of associated
soft keys is also displayed; you use the trackpad to select an item from the list,
then use the appropriate soft key to edit the item. For example, you can erase a
waypoint or a route.
Page 37

Chapter 2: Getting Started & Adjusting the Display 2-1
Chapter 2: Getting Started & Adjusting the
Display
2.1 Introduction
This chapter provides information and instructions to get you started using the
2
hsb
series LCD display. It will help you to become familiar with the display
and the functions of the controls before you start using the unit. More detailed
information on operating the radar display is provided in Chapter 3 and
Chapter 4. Chartplotter operating details are given in Chapter 5 and
Chapter 6.
Conventions Used
Throughout this handbook, the dedicated (labelled) keys are shown in bold
capitals; for example,
options are shown in normal capitals; for example,
Operating procedures, which may consist of a single key-press or a sequence
of numbered steps, are indicated by a
When the procedure requires you to press a soft key, the soft key icon is shown
in the margin.
MENU. The soft key functions, menu names and
SCREEN.
➤ symbol in the margin.
Introduction
Introduction
Simulator
The display unit includes a simulator function, that allows you to practice
operating your radar or Chartplotter without data from the scanner or GPS
system. You will need to use the set up options to switch the display to
simulator mode, as described in Section 2.2. You can use it in either of two
ways:
• Before the display unit has been installed on your vessel. In this case, you
• After the display has been installed on your vessel, but while in the marina
The following section, Section 2.2, includes instructions to view simulated
radar and chart images.
only need to connect the display to a 12V or 24V DC power supply, connecting the red core from the power lead to positive (+) and the black core
to negative (-). See Chapter 8 for full details.
or at anchor.
Page 38

2-2
2
hsb
PLUS Series Color LCD Display
2.2 Switching the Display On and Off
If you have a combined Radar/Chartplotter, the factory default power-up
Switching the Display
On and Off
mode is radar. Once you have used the display unit it powers-up in the last used
mode. The following sections describe the power-up sequence in radar and
chart modes, how to adjust the lighting and how to select simulator mode.
Radar Mode
This section explains how to switch the radar display and scanner on and off,
and how to switch the scanner between Transmit, Standby and Scanner Off
mode.
You normally operate your radar in transmit mode, but you can use the display
unit without the scanner operating as follows:
Standby mode: You should use this mode when you are not operating the
radar for short time periods. The scanner does not transmit and the antenna
does not rotate, so the radar uses less power. However, the scanner remains
powered so when you return to transmit mode, the magnetron does not need to
warm up.
Scanner off mode: You should use this mode when you do not require the
radar, but you are using the display unit say, for chart data or data from another
source. Scanner off mode removes power from the scanner.
➤ To switch the display on, press and hold the POWER key until the unit beeps.
If the unit was last used in Radar mode, the keys light up, the display shows the
Pathfinder graphic, followed by the start-up information illustrated below, and
the radar starts the magnetron warm-up sequence.
WARMING UP
Figure 2-1: Switching on the Radar Display
Page 39

Chapter 2: Getting Started & Adjusting the Display 2-3
After 70 seconds, when the magnetron warm-up sequence is complete, the
Standby screen is displayed, with the text
STANDBY and a prompt to press the
POWER key to enter Transmit mode.
➤ To switch the radar scanner from Stand-by mode to Transmit mode, press the
POWER key.
The scanner transmits pulsed energy while it rotates, and the antenna sweep
builds up the radar picture using echoes returned from targets.
On and Off
Switching the
Display On and Off
Switching the Display
Figure 2-2: Radar Transmit Mode
➤
You can switch on and adjust the display backlighting, if required, as
described later in this chapter.
➤ To switch to Stand-by mode, press the POWER key.
The display returns to the Stand-by screen, and the scanner transmission and
rotation stops.
➤ To use Scanner off mode:
1. Ensure that the radar is in Standby mode, warming up, or (if the unit is a
Repeater) displaying a message that radar data is not available.
2. Press the
CLEAR key. The message STANDBY. RADAR DATA NOT AVAILABLE
appears in the radar picture. The scanner is powered down and the timer, if
running, is cleared.
To return to radar operation, press the
is displayed and the radar goes into Standby mode. You press
POWER key. The warm-up countdown
POWER again to
switch to Transmit mode when required.
Page 40

2-4
2
hsb
PLUS Series Color LCD Display
Chart Mode
➤ To switch the display on, press and hold the POWER key until the unit beeps.
Switching the Display
On and Off
If the display was last used in chartplotter mode, the keys light up and the
Raychart graphic is displayed, followed by the caution:
CAUTION:
Raychart chart displays are based on cartographic data that
C-MAP believes to be accurate. However, you should not rely on these
displays as your primary source of navigation. Rather, your Raychart
should be used only as a backup to official government charts and
traditional methods of navigation.
When you have read and understood the caution, press the
CONTINUE soft key.
The chart is displayed.
If this is the first time the chartplotter has been turned on, and no chart card is
installed, the display shows the small-scale world map and the default soft
keys. Otherwise, the display shows the selected chart area and any data that
were displayed when the display was last used.
Until unit beeps
D4277-2
Figure 2-3: Switch On - Chart Mode
Switch Off
CAUTION:
To provide protection against the damaging effects of UV light, it is
advisable to replace the sun cover provided when the color LCD display is
not in use.
A reminder is displayed when you switch off the color LCD display.
➤ To switch the scanner and display unit off, press and hold the POWER key for
three seconds. A countdown timer is displayed as shown below:
Page 41

Chapter 2: Getting Started & Adjusting the Display 2-5
GAIN
DISPLAY
VRM/EBL
MARKS
MULTI
Countdown timer:
number of seconds
to power off
POWER OFF IN
3s
ALARMS
RANGE
Simulator Mode
Simulator Mode
SECONDS
Figure 2-4: Switch Off
When the counter reaches zero a beep sounds, and the display unit switches
off. Release the
Note: Switch the display unit off before you remove the power cord.
Note: You do not need to change to Standby mode before turning off the dis-
play: if you turn the radar display off while it is in Transmit mode, the scanner
is also de-activated.
Simulator Mode
When simulator mode is on a simulator data box is displayed.
When the display is switched off then on again, simulator mode is maintained.
It is recommended that you select the System Set Up Menu and switch off
simulator mode when you have finished.
➤ To view a simulated image:
MENU
SYSTEM
SET UP¬
1. Press
The set up menu pop-up is displayed.
2. Use the trackpad to move the selection bar over the option
simulator soft keys are displayed.
3. In the system set up menu, press
DATA to view the chart display with simulated position, or BOTH to view
simulated radar and chart data.
4. Press
POWER
3
POWER key.
MENU followed by the SYSTEM SET UP soft key.
RADAR to view a simulated radar image,
ENTER twice to return to the default display.
ENTER CLEAR MENU
D3599-1
SIMULATOR. The
Note: Any waypoints placed on the chartplotter in simulator mode are retained in the database list and are available for use in routes.
Page 42

Brightness
2-6
2
hsb
PLUS Series Color LCD Display
Changing the Brightness
The MULTI key on the color LCD display is used to adjust brightness. The
brightness of the screen can be adjusted over a wide range, suitable for
Changing the
viewing in daylight (high brightness level) or at night (low brightness level).
The key lighting is automatically adjusted as you alter the screen lighting, so
that you can always find the keys. If you set the backlight to a high level, the
key lighting is dimmed; if you set the backlight to a low level, the key lighting
level is increased.
Adjusting the Brightness
➤ To change the screen brightness:
MULTI
1. Press the
MULTI key to display the soft key controls (Radar mode soft keys
are illustrated):
ON
A
25%
75%
U
T
O
ALARM
LIGHT
TUNE
D5036_1
2. The LIGHT soft key indicates the brightness level, use the trackpad (up or
down) to increase or decrease the setting. You can press and hold the trackpad to change the setting more rapidly. The brightness level is adjusted as
you change the setting.
3. Press
ENTER to return to the default screen, with the new brightness level.
➤ To set the screen brightness to 100%:
Press and hold the
MULTI key for one second. The brightness is increased to
100%.
The brightness level is retained when you switch off the display.
Note: During night-time use, the brightness may be set very low, when subsequently operated during the day it may not be apparent that the display is on;
MULTI, followed by the second soft key from the left, then use the track-
press
pad to increase brightness. Alternatively, press and hold
MULTI for one sec-
ond to set the brightness to 100%.
Page 43

Chapter 2: Getting Started & Adjusting the Display 2-7
2.3 Controlling the Display
You control the display using the cursor and control keys. You start all
operations from the default screen, that is the default soft keys are displayed:
Chart
GOTO SCREENROUTE FIND SHIP
D4160-1
Radar
TARGETS SCREENHDG MODE
When you have completed an action using the soft keys, press ENTER or
CLEAR to return to the default screen; you may need to press ENTER or
CLEAR several times to back-track through the soft key hierarchy.
Note: If you have set up your system so that the default soft keys are not displayed all the time, press any soft key to display the labels.
The remainder of this section describes how to select the mode of operation
and switch half-screen windows on/off. The following sections describe how
to set up the display for the Radar and for the Chart.
MARPA
D4152-3
Display
Display
Controlling the
Controlling the
The controls are summarized in the fold-out illustration on pages 2-11
and 2-12.
Selecting the Mode of Operation
You use the DISPLAY key to select the full-screen mode. If the data is available
on your system, the following modes (described on Operating Modes on
page 1-6) can be selected:
•Radar
• Chart and Radar/Chart Overlay
• Data log
The
DISPLAY key also accesses the soft keys for the half-screen window
options.
2
hsb
Note: If your
Owner’s Handbook supplied with your Fishfinder for operating details.
display system includes a Fishfinder display, refer to the
Page 44

2-8
2
hsb
PLUS Series Color LCD Display
➤ To change the mode, press the DISPLAY key to show the DISPLAY pop-up, then
DISPLAY
Selecting the Mode of
Operation
press again to cycle through the modes available, shown in the Figure 2-5.
Figure 2-5: Using the DISPLAY Key
The selected mode is shown by an icon with a red border and the mode is
displayed on the screen. The associated half-screen window soft keys are also
displayed.
When the required mode is shown, press
ENTER or CLEAR. The default soft
keys are displayed. The selected mode is shown full-screen; in Radar and
Chart mode you can switch on half-screen windows for additional display, as
described in the following section.
If you press
DISPLAY again, the pop-up and soft keys for the current mode are
shown.
Selecting a Half-Screen Window for Display
Note: Windows can only be used with Radar or Chart screens, they are not
available on the data log screen.
➤ To select a window for display:
1. From the full-screen Radar or Chart mode, press the
The following soft keys are displayed with an image of each available window:
DISPLAY key.
Page 45

Chapter 2: Getting Started & Adjusting the Display 2-9
Radar:
DISPLAY
DISPLAY
Chart:
WINDOWS
OFF ON
WINDOWS
OFF ON
SELECT
WINDOWS
SELECT
WINDOWS
ZOOM...
D4208-2
OVERLAY
OFF ON
D5708_1
2. To select a different window, press either SELECT WINDOWS soft key until
the required window is highlighted. If necessary, this will toggle windows
on. Press
ENTER.
Selecting the Mode of
Selecting the Mode
Operation
of Operation
3. To toggle windows off, press the
WINDOWS OFF ON soft key.
Figure 2-6 shows the half-screen horizontal windows (in radar mode).
Switching Control Between Radar & Chart Screens
In a combined or an integrated system, to switch control between radar and
chart, you can change the full-screen mode using the
Alternatively, when you have both radar and chart displayed in half-screen
windows the soft key
RDR CHRT lets you toggle operating control between the
radar and the chart window.
If a window is active, i.e. control of the cursor via the trackpad is available in
that window, and you switch windows off, control automatically returns to the
full-screen (upper window) mode.
Radar:
Chart:
TARGETS MORE¬HDG MODE
GOTO MORE¬ROUTE
RDR CHRT
RDR CHRT
➤ To change the active window, press the RDR CHRT soft key to toggle control
between the radar and chart display. The current active display is highlighted
in red on the
RDR CHRT label and the cursor appears in that window.
DISPLAY key.
D5668_1
D4168-1
DISPLAY
Returning to the Full-Screen Display
To return to the full-screen display you can turn windows off, as previously
described. Alternatively, to return to full-screen display:
➤ Press and hold the DISPLAY key for 2 seconds to return to the currently
selected full-screen (upper window) display.
Page 46

2-10
CDI Window
BDI Window
2
hsb
PLUS Series Color LCD Display
Selecting the Mode of
Operation
WINDOWS
OFF ON
SELECT
WINDOW
ZOOM
OFF ON
WINDOWS
OFF ON
Navdata Window Chart Window
SELECT
WINDOW
ZOOM
OFF ON
RDR CHRT
WINDOWS
OFF ON
SELECT
WINDOW
ZOOM
OFF ON
Figure 2-6: Radar Half-Screen Window Options
WINDOWS
OFF ON
SELECT
WINDOW
ZOOM
OFF ON
D4150-1
Page 47

Chapter 2: Getting Started 2-11
GAIN
Controls the presentation of radar targets.
GAIN controls background noise (speckle).
SEA controls sea clutter.
RAIN controls rain clutter around the vessel.
FTC controls rain clutter at a distance.
- Press for soft keys display.
MANUAL MANUAL
O
F
F
RAIN SEA
75%
50%
GAIN
FTC
O
F
F
Select a slider using the soft key or trackpad.
Toggle between Auto/Man or off/on by pressing soft key again.
Adjust slider using trackpad, and press ENTER to finish.
VRM/EBL
Used to measure range and bearing to/between targets.
- Press to place VRM/EBL if one not already placed.
Adjust position using trackpad, and press ENTER to finish.
- Press to display soft keys if VRM/EBL already placed.
VRM/EBL1
OFF ON
VRM/EBL2
OFF ON
FLOAT¬
VRM/EBL
DATABOX
OFF ON
Use soft key to toggle VRM/EBL on or off.
Press FLOAT to access float options for existing VRM/EBL.
Press VRM/EBL DATABOX to toggle data box display off/on.
MULTI
Controls guard zone alarm sensitivity, and tuning the receiver.
Also controls display lighting and brightness.
- Press to display sliders.
Press and hold MULTI key to set brightness to 100%.
ON
25%
ALARM
75%
LIGHT
TUNE
A
U
T
O
Select a slider using the soft key or trackpad.
Toggle between Auto/Man or off/on by pressing key again.
Adjust slider using trackpad, and press ENTER to finish.
Soft Key Labels:
Change when you press a key.
Default soft key labels are shown.
MARPASCREENTARGETSHDG MODE
Soft keys
Press to select option, or highlight option or slider.
Labels change when you press soft/dedicated key.
Elipses (...) after the text indicate that pressing soft
key leads to a further display of soft key options.
ENTER
Confirms selection and (if appropriate) clears current
soft key labels. It performs the selected task,
accepts changes, or leads to display of more options.
When cursor text is displayed, takes cursor control
of the object.
When arrow-head cursor symbol is displayed, drops
the object under cursor control.
CLEAR
Cancels operation in progress and returns to the
previous display.
Deletes an object/function under cursor control.
Trackpad
Controls cursor position on the screen, and also the sliders
and setup options.
Hold the trackpad down to move the cursor faster.
DISPLAY
Controls display mode and windows.
- Press for display mode and soft keys display.
- Press again to toggle through display modes, and ENTER
- Press and hold for 2 seconds for full screen display of the upper
window.
WINDOWS
OFF ON
SELECT
WINDOW
ZOOM...
Press soft key to toggle window on/off, or return to full screen.
Zoom: Press ZOOM key to display zoom window option.
Move Zoom box using trackpad, press ENTER to finish.
MARKS / MOB
Controls placing marks, and Man Overboard function.
- Press to place mark at cursor position, and use trackpad
to move mark. Press ENTER to finish.
- Press and hold for 2 seconds to activate or cancel MOB.
RANGE
Controls range scale. Range scale and range rings are
shown in the Status Bar.
- Press top of key to increase the range scale.
- Press bottom of key to decrease the range scale.
- Press and hold to change the scale faster.
ALARMS
Used to control guard zones.
- Press to place guard zone if one not already placed.
Adjust size/shape using trackpad, press ENTER to finish.
- Press to display soft keys if guard zone already placed.
GUARD 1
OFF ON
GUARD 2
OFF ON
Use soft key to toggle zone on or off.
Adjust size/shape using trackpad, and press ENTER to finish.
MENU
Provides access to setup options.
- Press to display soft keys.
SYSTEM
SET UP¬
RADAR
SET UP¬
MARPA
SET UP¬
POWER
Press and hold until unit beeps to turn on display.
Press to toggle between Standby and Transmit.
Press for 3 seconds to turn off display.
Press soft key to display required setup menu, then use trackpad
to select option and soft key to change setting.
Press ENTER to close menu, and CLEAR to to finish.
D5665_1
Page 48

2-12 HSB Series Color LCD Display
GAIN
Not used in Chart mode.
VRM/EBL
Use to measure range and bearing to/between points.
- Position cursor at start point, and press VRM/EBL key to display the
Ruler data box. Select end point using trackpad, and press ENTER to fix
end position of ruler.
MULTI
Controls display lighting.
Press and hold MULTI key to set brightness to 100%.
- Press to display slider.
O
F
F
LIGHT
Select the slider using the soft key or trackpad.
Toggle between off/on by pressing the soft key again.
Adjust slider using trackpad, and press ENTER to finish.
ALARMS
Use to set up the chartplotter alarms.
- Press to display the Alarms set up menu and soft keys,
the soft keys correspond to the selected alarm.
ALARMS SET UP
ARRIVAL ALARM 0.01nm
OFF TRACK ALARM
ANCHOR ALARM
COUNTDOWN TIMER
ALARM CLOCK
OFF
OFF
00:33:00
OFF
Chartplotter
Soft Key Labels:
Change when you press a key.
Default soft key labels are shown.
ROUTE GOTO SCREEN
Soft keys
Press to select option, or slider.
Labels change when you press soft/dedicated key.
Elipses (...) after the text indicate that pressing soft key
leads to a further display of soft key options.
ENTER
Confirms selection and (if appropriate) clears current soft
key labels. It performs the selected task, accepts
changes, or displays more options.
When cursor text is displayed, takes cursor control
of the object.
When arrow-head cursor symbol is displayed, drops the
object under cursor control.
CLEAR
Cancels operation in progress and returns to the
previous display.
Deletes an object/function under cursor control.
FIND SHIP
DISPLAY
Controls display mode and windows.
- Press for display mode and soft keys display.
- Press again to toggle through display modes, then ENTER.
- Press and hold for 2 seconds for full screen display of the
upper window.
WINDOWS
OFF ON
SELECT
WINDOWS
OVERLAY
OFF ON
Press soft keys to toggle window on/off and to select
lower window.
Press ENTER to finish.
MARKS / MOB
Controls waypoints, and Man Overboard function.
- Press to display waypoint soft keys.
- Press and hold for 2 seconds to activate or cancel MOB.
PLACE WPT
AT CURSOR
PLACE WPT
AT VESSEL
WAYPOINT
LIST
LOAD/SAVE
USER CARD
Press soft key to place waypoint at cursor or vessel, or display the
waypoint list and asscociated soft keys.
Press ENTER to finish.
RANGE
Controls chart scale.
Displayed vertical distances are shown in the Status Bar.
- Press top of key to increase the chart distance.
- Press bottom of key to decrease the chart distance.
- Press and hold to change the scale faster.
MENU
des access to setup options.
Provi
- Press to display
SYSTEM
SET UP¬
soft keys.
SET UP¬
CHART
TRACK
SET UP¬
GPS
SET UP¬
Press soft key to display required setup menu, then use trackpad
to select option and soft key to change option.
Press ENTER to close menu, and CLEAR to to finish.
SELECT ARRIVAL
ALARM RADIUS
Use the trackball to select the alarm, then use the softkeys to adjust
parameters and/or toggle the alarm on/off.
Press ENTER to finish.
Trackpad
Controls cursor position and the slider values.
Hold the trackpad down to move the cursor faster.
POWER
Press and hold until unit beeps to turn on display.
Press for 3 seconds to turn off display.
D5570-1
Page 49

Chapter 2: Getting Started & Adjusting the Display 2-13
Customizing the Screen Presentation Options
The SCREEN soft key lets you set the following screen presentation options on
or off:
Radar:
SCREEN
CRSR BOX
OFF ON
Chart:
CRSR BOX
OFF ON
RNGE RNGS
OFF ON
CHRT GRID
OFF ON
DATABOXES
OFF ON
DATABOXES
OFF ON
WAYPOINT
OFF ON
D3643-2
CUSTOM
OFF ON
D4177-1
Switching the Cursor Data Box On and Off
The cursor data box provides the cursor’s position in latitude/longitude and/or
bearing/range. If you wish to see a full image, you can switch the data box off.
➤ To control the cursor data box:
Options
Options
Customizing the
Customizing the
Screen Presentation
Screen Presentation
SCREEN
CRSR BOX
OFF ON
SCREEN
RNGE RNGS
OFF ON
1. Press the
2. Press the
SCREEN soft key.
CRSR BOX soft key to toggle the setting from OFF to ON or from ON
to OFF.
3. To return to the default soft key display, press
ENTER.
➤ You can move the cursor data box using the context-sensitive cursor.
Switching Radar Range Rings or Chart Grid On and Off
The radar range rings can be turned on or off. They are normally left on, but
you may wish to turn them off if you are using VRM/EBLs or guard zones (see
Section 3.4 and Section 3.5) to make the display clearer.
The Chartplotter display includes grid lines of latitude and longitude which
you can use to help determine position on the chart. The grid lines can be
switched on if required.
If you are in Chart mode the
soft key.
➤ To turn the range rings or chart grid on or off:
1. Press the
2. Press the
SCREEN default soft key.
RANGE RINGS or the CHRT GRID soft key to toggle the setting from
OFF to ON or from ON to OFF.
RNGE RNGS soft key is replaced by the CHRT GRID
To return to the default soft key display, press
ENTER.
Page 50

Options
Screen Presentation
2-14
2
hsb
PLUS Series Color LCD Display
Data Boxes
A group of up to six data boxes can be displayed, if the information is available
on your system. You select which data is displayed in the boxes during
Customizing the
system set up as described in Chapter 7:Setting Up the System Defaults.
The default data box positions are along the bottom of the display. Each box
can be moved to the required position on the screen using the context-sensitive
cursor.
Note: If you select BDI, CDI or Nav Data for display in a half-screen window,
the data boxes are temporarily hidden.
SCREEN
SCREEN
DATABOXES
OFF ON
At any time, you can switch the group of data boxes on or off using the
soft key. When first installed, the boxes are all OFF. When the display unit is
switched off and on again, the data boxes return to their last-used states (
OFF) and positions.
Note: The
SCREEN soft key does not control the sixteen data boxes that can be
displayed in the half-screen window.
➤ To switch the group of data boxes on or off:
1. Press the
2. Press the
SCREEN default soft key.
DATABOXES soft key to toggle the setting from ON to OFF or from
OFF to ON.
To return to the default soft key display, press
ENTER.
If you turn the data boxes on and none are displayed, you need to select the
ones you require using the system set up menu, as described in Section 7.3,
System Set Up Parameters.
➤ To move any data box:
1. Use the trackpad to position the cursor over the box until the letters
displayed.
2. Press
ENTER to take control of the box, use the trackpad to move it to the
required position, and press
ENTER again.
SCREEN
ON or
BOX are
Waypoint Display - Radar mode
If you are currently going to a waypoint, you can display the active waypoint
on the radar picture. The waypoint may have been generated locally on the
chartplotter, or received via the SeaTalk or NMEA interface.
Note: If you use the
lollipop symbol on the radar.
GOTO CURSOR function, the active cursor is displayed as a
Page 51

Chapter 2: Getting Started & Adjusting the Display 2-15
SCREEN
WAYPOINT
OFF ON
➤ To display the active waypoint:
1. Press the
2. Press the
To return to the default soft key display, press
SCREEN soft key.
WAYPOINT soft key to toggle the setting ON.
ENTER.
The standard radar picture is displayed again, with the active waypoint joined
to your vessel’s position by a dotted line. If the waypoint is off-screen, the
dotted line is extended to the edge of the radar picture.
Active waypoint
Figure 2-7: Active Waypoint on a Radar Display
Custom Options - Chart mode
D3989-2
Options
Options
Customizing the
Customizing the
Screen Presentation
Screen Presentation
SCREEN
CUSTOM
OFF ON
When chart details have been customized in the Chart Set Up menu (as
described in Section 7.7) the
SCREEN soft key can be used to switch the custom
chart options off or on:
When set to
are displayed; when set to
The factory default for custom chart options is
ON, all chart options set to CUSTOM in the Customize Chart menu
OFF, options set to CUSTOM are not shown.
ON.
➤ To switch the customized options on or off:
1. Press the
2. Press the
SCREEN default soft key.
CUSTOM soft key to toggle the setting from OFF to ON or from ON
to OFF.
To return to the default soft key display, press
ENTER.
Page 52

2-16
2
hsb
PLUS Series Color LCD Display
2.4 Radar Display Control Functions
This section describes how to use the radar controls to:
Radar Disp lay Control
Functions
Using the Zoom Function
• Use the zoom function to enlarge a selected area.
• Offset the center of the radar display.
• Momentarily hide the ship’s heading marker (SHM).
If you wish to see a section of the radar picture in more detail, you can use the
Zoom function to magnify the selected area to twice its size. There are two
zoom options:
• Zoom Into - The enlarged area is displayed in a quarter-screen Zoom Win-
dow in the lower right corner of the screen. A box in the original radar picture indicates the enlarged area; you can move this using the contextsensitive cursor, thereby changing the image in the Zoom Window.
Note: If the area you wish to enlarge is in the quarter of the screen that will be
covered by the Zoom Window, you should offset the center (see the next section) to move the area to another part of the screen before selecting Zoom
mode.
• Zoom From - The enlarged area is displayed in the main window, with the
original radar picture in a quarter-screen window in the lower right corner
of the screen. A box in the original radar picture indicates the enlarged area;
you can move this using the context-sensitive cursor, thereby changing the
zoomed image.
Note: You cannot use Zoom and Windows at the same time: if you turn one on,
the other is turned off automatically, and restored when the latter is turned off
again.
➤ To enlarge an area:
1. Press the
DISPLAY
DISPLAY key. The soft keys are updated.
WINDOWS
OFF ON
SELECT
WINDOWS
ZOOM...
D4208-2
2. Press the ZOOM soft key to display the following soft keys
x4
x2
ZOOM OFFINTO WIN FROM WIN
D4188-2
Page 53

Chapter 2: Getting Started & Adjusting the Display 2-17
3. Press the required zoom option soft key, INTO WIN or FROM WIN.
The soft keys are cleared, and the cursor has control of the zoom box that
indicates the area to be enlarged. This is indicated by the letters
ZMB in
inverse video, and the four-headed cursor symbol. The zoom box defaults
to its last-used position since power-on.
4. Use the trackpad to move the zoom box to the required area, and press
ENTER.
The selected area is shown in an enlarged format, either in the quarterscreen Zoom window (
INTO WIN) or in the main window (FROM WIN).
➤ To move the enlarged area in view in the window:
1. Move the cursor over the edge of the zoom box in the original radar picture,
until the letters
ZMB appear under the cursor.
Center
Offsetting the
Offsetting the Center
2. Press
ENTER to take control of the zoom box. The cursor shape changes to
a four-way arrow.
3. Use the ltrackpad to move the zoom box over the required area.
4. Press
ENTER again to drop the zoom box, update the enlarged version, and
return the cursor to normal control.
3nm
BRG
RNG
CURSOR
033° R
1.78nm
RINGS
1/2
126°T
RM RV3
AUTO
H-UP
RADAR ZOOM ( x2 )
T
ZMB
IR
Zoom Box, indicating the
enlarged area. You can move this
using the context-sensitive cursor,
to change the image in the Zoom
Window
Zoom Box cursor text
Zoom Window, providing a
times 2 enlargement of the area
shown in the Zoom Box
Figure 2-8: Radar Display Zoom Window
D3972-2
Press DISPLAY then ENTER to exit the Zoom mode.
Alternatively, you can press and hold
Offsetting the Center
The radar picture is normally shown with your vessel at the center of the
display. However, you can move the center, so that your vessel is offset by up
to 66% of the radius, anywhere on the screen.
DISPLAY for 2 seconds.
Page 54

2-18
2
hsb
PLUS Series Color LCD Display
Note: You cannot offset the center when the radar display is set to the longest
range scale.
➤ To change the center:
Hiding the Ship’s
Heading Marker
(SHM)
CTR
1. Move the cursor over the center of the radar picture, until the letters
displayed.
2. Press
ENTER to take cursor control of the center point. The cursor changes
CTR are
to a four-headed arrow.
3. Move the cursor to the required off-center position.
4. Press
ENTER again to set the position and return to normal cursor control.
DEPTH
14.4m
Bearing scale markers
adjusted to point
towards the offset
centre position
Offset centre
Figure 2-9: Radar Display with an Offset Center
➤
To return the center of the radar picture to the center of the screen, repeat step 1
and then press the
CLEAR key. The center is always reset to the center of the
display when you turn on the Radar display.
Note: When the center is offset, additional range rings are displayed to the
edge of the radar picture, at the standard ring interval for the current range. If
you have selected the longest range scale, you cannot offset the center.
Hiding the Ship’s Heading Marker (SHM)
The radar picture includes the ship’s heading marker, which is a line from your
vessel’s position to the edge of the picture at the vessel’s current heading. In
the standard Head Up mode, the heading marker is always a vertical line.
If you wish to check for small targets that may be hidden under the heading
marker, you can hide it momentarily using the context-sensitive cursor.
➤ To hide the heading marker:
1. Position the cursor over the heading marker, so that the text
played.
203°
01h:30m
WPT
T 1.20nm
D3973-1
SHM is dis-
2. Press and hold
CLEAR key.
CLEAR. The heading marker is hidden until you release the
Page 55

Chapter 2: Getting Started & Adjusting the Display 2-19
2.5 Chart Display Control Functions
Moving Around the Chart
You will normally operate the chartplotter with the chart showing your
vessel’s current location. The default orientation is North-Up, and the vessel
moves across the screen. You will need to move the chart if your vessel moves
out of the area currently displayed, or if you wish to examine or place
waypoints in another area. Alternatively, you can home the cursor onto the
vessel using
There are four ways in which you can move the chart:
• Use the trackpad to move the cursor to the edge of the chart. The chart will
pan across. This method is useful if the area you wish to see is only just off
the screen.
• Use the context-sensitive cursor to change the chart center.
• Automatically re-center the vessel using the
• Change the chart scale to zoom out and in to a new area centered on the cur-
sor position. This method is useful if the area you wish to see is a long distance away.
FIND SHIP.
FIND SHIP soft key.
Functions
Chart Display
Control Functions
Chart Display Control
Changing the Chart Center
You can move the area of the chart displayed on the screen using the contextsensitive cursor. This allows you to center your vessel in the middle of the
screen, or to move the chart so that your vessel is displayed off-center
anywhere on the screen.
➤ To center the chart:
1. Use the trackpad to move the cursor to the vessel’s position. The cursor text
POS
POS
POS is displayed.
2. Press
CLEAR. The chart is moved so that your vessel’s position is in the
center of the screen.
➤ To move your vessel’s position off-center:
1. Move the cursor over your vessel’s position until the letters
played.
2. Press
ENTER to take control of the chart position. The letters POS are now
in inverse video, and the cursor symbol has changed to a four-way arrow.
This indicates that the cursor can be used to move the chart in any direction.
POS are dis-
Page 56

Chart
2-20
2
hsb
PLUS Series Color LCD Display
Moving Around the
D4278-1
Figure 2-10: Changing the Chart Center
3. Use the trackpad to move the cursor to the required position.
4. Press
ENTER to select the position and return to normal cursor control. The
chart is redrawn with the vessel position at the cursor.
Alternatively, you can press
CLEAR to abandon the move and leave the
chart (and vessel) in its former position.
Using FIND SHIP
FIND SHIP is used in chart mode to re-draw the chart with the vessel at the center
and the cursor homed onto the vessel.
GOTO SCREENROUTE FIND SHIP
D4160-1
When you press FIND SHIP the following occur:
• The chart is re-drawn with the vessel’s position in the center.
• The cursor is homed onto the vessel position and moves with it.
• When the vessel moves near the edge of the chart window, the chart is
redrawn to place the vessel and cursor at the center again.
• The status bar indicates vessel position, speed and course over ground.
➤ To release the cursor from homed mode press the trackpad to move the cursor
away from the vessel’s current position. The status bar shows the cursor
position, range and bearing.
Synchronize the Radar and Chart
If you have a combined radar/chartplotter display, with chart and radar
windows on and you have selected Radar/Chart Synch in Chart Set Up
(Section 7.7, Chart Set Up Parameters),
FIND SHIP can be used to synchronize
Page 57

Chapter 2: Getting Started & Adjusting the Display 2-21
the radar and chart images. It is recommended that you set the radar to True
motion to ensure the radar and chart images remain synchronised when the
vessel moves. When you press
FIND SHIP the following occur:
• The chart is redrawn so that its center position matches that of the radar dis-
play.
• The radar is redrawn to the scale and heading mode of the chart.
Note: Depending on the topology of the coastline, the radar returns may not
relate to the charted shoreline, the radar image will therefore be different to
the chart display. For example, a gently sloping beach with a cliff several hundred metres beyond the charted coastline, the cliff is not shown on the chart
but will be displayed on the radar image.
Changing the Chart Scale
The RANGE key allows you to change the chart scale so that you can see a
smaller or larger area on the screen.
Plotter mode is available to allow you to zoom into a smaller area, even when
no chart data is available for that scale. Section 7.7 describes how to set plotter
mode on/off.
Chart
Chart
Moving Around the
Moving Around the
You can change the chart scale for two purposes:
• To see either more detail (of a smaller area) or a larger area (in less detail)
on the screen.
• To move the display to another area of the chart, by zooming out to a small
scale chart, then zooming in on another position centered on the cursor.
The cartographic detail available on charts varies according to the chart scale
and some areas include detail at smaller scales than others. This can cause
blank areas on the display when adjacent areas with different levels of detail
are displayed. To reduce this affect you can use the Chart Set Up options (see
Section 7.7) to set chart display detail to simple. Then, as you zoom in, charted
areas are displayed but with less detail shown.
Each time you press the
RANGE key, the chart scale changes to the next
available setting. The status bar indicates the distance from top to bottom of
the screen, in nautical miles.
Vertical distance
displayed on chart
6nm
Status Bar
CSR 50 45'980N
POS 001 01'490W
D4175_1
RANGE
Increases the
chart distance
Decreases the
chart distance
Figure 2-11: Changing the Chart Scale
Page 58

2-22
2
hsb
PLUS Series Color LCD Display
➤ To change the scale quickly, press and hold the required arrow on the RANGE
key.
RANGE
Moving Around the
The distance indicator at the left-hand end of the status bar is updated
whenever you change the chart scale.
Chart
RANGE
➤ To zoom in to a larger-scale (more detailed) chart:
1. Use the trackpad to position the cursor in the area you wish to see in more
detail.
2. Press the lower part of the
RANGE key to zoom into the area.
The section of the chart around the cursor is enlarged to fill the screen with
a larger-scale chart showing more detail. The cursor is now positioned in
the center of the screen.
The distance indicated at the top left of the screen is updated.
3. If further chart enlargement is available using the current chart card you
can press the bottom of the
RANGE key to zoom in again, re-positioning
the cursor first if required.
An area of further chart detail is indicated by a box around the area as
shown in Figure 2-12.
Chart Boundary indicates further
detail is available inside
Figure 2-12: Chart Boundaries
4. When no further chart detail is available, as you press the bottom of the
RANGE key, the effect depends on whether Plotter Mode is on or off as
follows:
D4279-1
Page 59

Chapter 2: Getting Started & Adjusting the Display 2-23
• If Plotter Mode is Off, the chart scale remains unchanged, indicating
the smallest chart scale is displayed.
Note: If Plotter Mode is Off and the cursor is homed to the vessel (see
Using FIND SHIP on page 2-20), if the vessel moves outside an area of
available cartography, the chart will automatically re-scale to the next
range with cartography.
• If Plotter Mode is On, the scale is decreased and the message
DATA
played without cartography.
The chart information is restored when you return to a chart scale for which the
information is available.
RANGE
➤ To zoom out to a smaller-scale (less detailed) chart, simply press the upper part
of the
RANGE key as many times as required.
Radar/Chart Overlay
If radar data is available, as a function of the combined radar/chart display or
from another display connected on
the full-screen chartplotter display. The radar/chart overlay option helps you
to distinguish between fixed, charted objects and other objects that could be
moving vessels. Some radar controls are available in overlay mode.
The following criteria must be true for radar/chart overlay to function
correctly:
• Position and heading data are provided so that vessel position and orientation can be determined.See Heading and Position Data on page 1-9 for
further details.
NO CHART
is displayed. The vessel, waypoints, routes and tracklines are dis-
2
hsb
, the radar targets can be overlaid on to
Overlay
Radar/Chart
Radar/Chart Overlay
• The vessel must be displayed on screen.
• The chartplotter must be in North Up or Course Up mode (see Section 7.7).
• The chartplotter range must be between 1/4nm and 48nm (equivalent to a
radar range of 1/8nm to 24nm).
• Custom range scales are disabled on the radar.
• The radar must be transmitting.
To ensure the vessel remains on the screen, you could use Find Ship (see Using
FIND SHIP on page 2-20) to home the cursor onto the vessel.
When Radar/Chart overlay is switched on, the status bar indicates
OVL. If the
option is switched on but the overlay is not visible (because one of the above
criteria has failed), the status bar indication changes to
(OVL).
Page 60

2-24
2
hsb
PLUS Series Color LCD Display
When Radar/Chart overlay is switched on the soft key MORE... provides
access to the
The radar
Radar/Chart Overlay
Note: Radar/Chart overlay is displayed at the current chart range. You
SCREEN soft key and to the radar controls TARGETS and MARPA.
GAIN control is also active in overlay mode.
should be aware that if radar is shown on any other display, its range will
match that displayed on Radar/Chart overlay. Conversely, if you change the
radar range on any display, the Radar/Chart overlay image will change to the
new radar range.
➤ To select radar/chart overlay:
DISPLAY
1. Press the
DISPLAY key to show the DISPLAY pop-up, then if necessary press
again to select Chart mode.
2. Press the
OVERLAY OFF ON soft key to toggle the option on.
The two highest intensity radar returns are displayed in purple, over the chart
image. The radar image is translucent, so that chart text, contours and outlines
are visible beneath the radar targets.
Page 61

Chapter 2: Getting Started & Adjusting the Display 2-25
2.6 Typical Chart Scenarios
The following illustrations provide operating guidelines for typical navigation
scenarios. These scenarios can be used as a training guide; they show you how
to perform a particular operation and they introduce many of the chartplotter
functions.
Each scenario indicates the key presses required to perform particular tasks. A
typical chartplotter screen image is shown for each task.
The scenarios assume you have read the previous sections of this chapter and
that you are familiar with the Operating Controls. Full operating details for
each function are provided in Chapter 5 and Chapter 6.
Operating guidelines are provided for the following scenarios:
• Working with Waypoints
Place a Waypoint
Goto a Waypoint
• Make and Follow a Routes
Create a Route
Follow a Route
Typical Chart
Scenarios
Scenarios
Typical Chart
• Review the Passage Plan
View Route Information
Change the SOG, Hours and ETA.
• Displaying the Radar Image and Synchronizing Radar & Chart
Changing the Full-Screen Mode & Selecting Half-Screen Windows
Radar and Chart Synchronization (Find Ship)
Cursor Echo
Page 62

2-26
2
hsb
PLUS Series Color LCD Display
Place and Goto a Waypoint
1
Place and Goto a
Waypoint
1. Press MARKS
2. Position Cursor as required
2
Press the soft key
Press the soft key to go to the
waypoint selected by the cursor.
3
D4267-1
Page 63

Chapter 2: Getting Started & Adjusting the Display 2-27
4
The vessel navigates towards the target
waypoint
See:
5.3 Working wth Waypoints
Go to an individual Target Point,
page 5-26.
D4267-2a
Waypoint
Waypoint
Place and Goto a
Place and Goto a
Page 64

2-28
2
hsb
PLUS Series Color LCD Display
Make and Follow a Route
#
1
Make and Follow a
Route
GOTO SCREENROUTE FIND SHIP
MAKE
EDIT
ROUTE
ROUTE
CLEAR
ROUTE
MORE¬
Press the soft key
2
Press the soft key
3
1. Position Cursor - in this example
over an existing waypoint
2. Press the soft key
4
Position Cursor for next waypoint,
then press soft key.
Repeat to plot all waypoints in
sequence.
D4268-1
Page 65

Chapter 2: Getting Started & Adjusting the Display 2-29
5
Press the soft key. The route becomes
the current route.
6
GOTO SCREENROUTE FIND SHIP
Route
Route
Make and Follow a
Make and Follow a
GOTO
CURSOR
STOP
FOLLOW
GOTO
WAYPOINT
GOTO
CURSOR
FOLLOW
ROUTE
RESTART
XTE
WAYPOINT
ADVANCE
Press the soft key
7
Press the soft key
8
The vessel starts to navigate to the
first (target) waypoint in the route.
See:
5.4 Working wth routes,
Follow a route, page 5-24.
Other Follow Options, page 5-25.
D4268-2a
Page 66

2-30
2
hsb
PLUS Series Color LCD Display
Review Your Passage Plan
ROUTE
GOTO SCREEN
FIND SHIP
Review Your Passage
Press the soft key
Plan
EDIT
ROUTE
SAVE
ROUTE
CLEAR
ROUTE
ROUTE
LIST
MORE¬
MORE¬
Press the soft key
Press the soft key
MAKE
ROUTE
REVERSE
ROUTE
1
2
3
4
1. Use the trackpad to move
selection bar over required route.
2. Press the soft key
5
Time defaults to ETA - and assumes
the current time is the start time.
D4269-1
Page 67

Chapter 2: Getting Started & Adjusting the Display 2-31
6
See:
Displaying Route Information
page 5-18.
Change the TIME to HOURS - the display
indicates it will take 32 minutes to reach
the destination. You can change the
PLANNED SOG; the display updates to
indicate TIME required at the planned
speed.
D4269-2a
Plan
Review Your
Review Your Passage
Passage Plan
Page 68

2-32
2
hsb
PLUS Series Color LCD Display
Displaying the Radar and Synchronizing Radar & Chart
1
Displaying the Radar
and Synchronizing
Radar & Chart
1. Press DISPLAY -- then press
twice more to select RADAR.
2. Press the soft keys to set windows
ON. The Chart window is the default
selection.
3. Press ENTER.
2
ROUTE
SYSTEM
SET UP¬
GOTO MORE¬
CHART
SET UP¬
SET UP¬
TRACK
RDR CHRT
GPS
SETUP¬
Press the soft key. You can control
the chart cursor.
1. Press MENU.
2. Press the soft key
3
D4293-1
Page 69

Chapter 2: Getting Started & Adjusting the Display 2-33
4
Radar and
Radar & Chart
Synchronizing
Displaying the
and Synchronizing
Displaying the Radar
GOTO MORE¬ROUTE RDR CHRT
FIND SHIP MORE¬SCREEN RDR CHRT
1. Move selection bar over
Radar/Chart Synch.
2. Press the soft key.
3. Press ENTER twice.
5
Press the soft key.
6
Press the soft key to synchronise the
chart & radar images.
7
The radar and chart windows are
synchronised and the cursor is
'homed' on the vessel
Move the chart cursor -- you can see
chart cursor move on the radar
screen.
You can move the cursor over
a radar target to determine its
identity on the chart
See:
2.3 Controlling the Display
6.5 Cursor Echo
7.3 System Parameters
7.6 Chart Set Up
D4293-1a
Page 70

2-34
Displaying the Radar
and Synchronizing
Radar & Chart
2
hsb
PLUS Series Color LCD Display
Page 71

Chapter 3: Standard Radar Operations 3-1
Chapter 3: Standard Radar Operations
3.1 Introduction
This chapter provides detailed instructions for the standard radar operations of
your
integrated systems with appropriate data sources, are described in Chapter 4.
If you have a combined radar/chart display refer to Chapter 5 and Chapter 6
for information on charting operations.
2
hsb
series Pathfinder Radar. Additional functions, that are available on
You can use this chapter with the radar display set to simulator mode, or on the
water after you have installed and set up your
2
hsb
series Pathfinder Plus Radar
system.
This chapter covers the following topics:
• Range control.
• Interpreting and adjusting the radar picture, including adjusting the gain,
sea clutter and rain clutter, changing the targets display, and tuning the
radar.
• Measuring range (distances) and bearings using Variable Range Markers
(VRMs) and Electronic Bearing Lines (EBLs).
• Setting up guard zones and handling alarms.
• Using MARPA for target tracking and risk analysis.
Note: Until you are familiar with interpreting the radar display, you should
take every opportunity to compare the radar’s display patterns with visual
targets, such as other vessels, buoys and coastal structures. You should practice harbour and coastal navigation during daylight and in clear weather conditions.
If you have a combined radar/chartplotter, or have an
2
hsb
series Chartplotter
as part of an integrated system, you can identify objects using either the radar/
chart overlay (see Radar/Chart Overlay on page 2-23) or the cursor echo
feature: With cursor echo on (see Section 4.5 and Chapter 7) you can select an
object on the radar display, the cursor is repeated on the chart display so you
can check the object’s identity.
Introduction
Page 72

3-2
3.2 Range Control
The radar picture can be viewed at various scales. The shortest range scale
gives a maximum range of
to the top of the radar picture. The longest range scale gives a maximum range
of between 24 and 72 nautical miles depending on your scanner.
2
hsb
PLUS Series Color LCD Display
1
/8 nautical miles, measured from the default centre
Range Control
ship to land masses, weather fronts and large ship targets in or beyond
view.
•The short range scales provide greater detail of the radar echoes close to
your vessel, and should be used as you approach the coastline, harbour or
other vessels in the area.
The Pathfinder Plus Radar display includes concentric range rings, which you
can use to help you to judge distances on the radar picture. Their number and
spacing are adjusted automatically if you change the range scale. They can be
turned off (see Switching Radar Range Rings or Chart Grid On and Off on
page 2-13).
Changing the Range
•The long range scales provide the best overview of your vessel’s relation-
RANGE
AUTO MAN
Selected
range scale
6nm
RANGE
Increases
the range scale
Decreases
the range scale
Figure 3-1: Changing the Radar Range
Each time you press the RANGE key, the range changes to the next available
➤
setting. The system will beep three times if no further range scale is available.
Range ring
spacing
RR
1nm
Status Bar
343°T
D3939_1
➤ To change the range quickly, press and hold the required arrow on the RANGE
key.
The range scale and range ring interval indicators, at the left-hand end of the
status bar, are updated whenever you change the range.
The Standard Range Scale
Details of the standard ranges that can be selected are shown in the table
below. If you wish, you can customize the range scales by specifying different
ranges, as described in Section 7.4, Radar Set Up Parameters.
Page 73

Chapter 3: Standard Radar Operations 3-3
.
Table 3-1: Radar Range Scales
Maximum Range
(nm)
0.125
0.25
0.5
0.75
1.5
3
6
12
24*
48*
72*
Number of Range
Rings
2
2
4
3
6
6
6
6
6
6
6
* The maximum range depends on your scanner type, as detailed in the Pathfinder Plus Radar
Scanner Owner’s Handbook.
The number of range rings shown in the table is the number to the selected
range. Additional range rings are displayed to the edge of the radar picture, at
the standard ring interval for the current range, and are visible when the centre
is offset.
Determining Actual Radar Range
Range Ring Interval
(nm)
0.0625
0.125
0.125
0.25
0.25
0.5
1
2
4
8
12
Radar Range
Determining Actual
The actual maximum radar range is essentially line-of-sight, and is limited by
the height of the scanner and the height of the target as shown in Figure 3-1.
Table 3-2 lists some range examples:
R
max
a
1
h
Radar
R
max
h
H
R
= radar horizon of antenna (
max
Earth
R
= 2.23 ( h + H )
max
maximum radar range
radar antenna height
target height
a
) + radar horizon of target (
1
a
2
in nautical miles
in metres
in metres
a
Cliff
)
2
H
D1643-2
Figure 3-2: Determining Radar Range
Table 3-2: Radar Range
Antenna Height (m) Target Height (m) Maximum Range (nm)
3 3 7.8
3 10 10.9
5 3 8.9
5 10 12.0
Page 74

3-4
2
hsb
PLUS Series Color LCD Display
Note: The ranges shown in the table are theoretical maximum ranges. The radar horizon is greater than the optical horizon, but the radar can only detect
targets if a large enough target is above the radar horizon.
3.3 Interpreting and Adjusting the Radar Picture
Picture
Adjusting the Radar
Interpreting and
Navigational echoes may be large, small, bright or faint, depending not only
on the size of the object but also on its orientation and surface. Different
objects reflect the radar signals in different ways. For example, vertical
objects such as cliffs reflect signals better than sloping ones such as
sandbanks.
High coastlines and mountainous coastal regions can be observed at the
longest radar range. However, the first sight of land may be a mountain several
miles inland from the coastline. The actual coastline may not appear on the
radar until the vessel is close to the line of sight distance.
The radar indication may not be similar to your visual observation; a nearby
small object may appear to be the same size as a distant large object on the
radar. However, with experience the approximate size of different objects can
be determined by the relative size and brightness of the echoes.
Some targets, such as buoys and small boats, can be difficult to differentiate,
since they bob and toss about in the waves and do not present a consistent
reflecting surface. Consequently, these echoes have a tendency to fade and
brighten and, at times, to disappear momentarily. Buoys and small boats often
resemble each other, but boats can usually be distinguished by their motion.
Not all radar echoes are produced by hard navigational items. Some echoes
may be received from irregularities on the surface of the water, particularly at
close range (sea clutter), or from rain or snow either around the vessel or in the
distance. In addition, some echoes may be indirect returns to the radar scanner,
providing false echoes or multiple echoes.
The effects of many false echoes can be minimized, and the target presentation
clarified using the controls summarized below. This section explains how to
interpret the radar picture and how the controls affect the display. It provides
instructions for adjusting the settings, describes the circumstances in which
they should be adjusted, and how they interact with each other.
Page 75

Chapter 3: Standard Radar Operations 3-5
.t
Table 3-3: Controls to Adjust the Radar Picture
Control Option Function Default Setting
GAIN GAIN
SEA
RAIN
FTC
MULTI TUNE Fine tunes the receive AUTO
TARGETS
Soft Key
INT REJ
EXPANSION
WAKES
Controls the strength of the target returns
Reduces sea returns
Reduces close rain or snow returns
Reduces distant rain or snow returns
Turns interference rejection on/off
Turns target expansion on/off
Turns wakes on/off and selects wakes length
Identifying False Echo Returns
Not all echoes are direct returns to the radar antenna. Occasionally signals
appear at positions where there is no actual target. These are called false
echoes, and may be caused by side lobes, ghost images, indirect echoes or
multiple echoes.
This section briefly describes the echo patterns that can be produced by false
echoes and the likely cause. It should be noted that the radar operator, through
observation, practice, and experience, can generally detect these conditions
very quickly. These effects can usually be minimized using the radar controls.
Side Lobes
A small part of the RF energy from each transmitted pulse is radiated outside
the single narrow beam. This produces side lobe patterns, shown in
Figure 3-3.
AUTO
AUTO-HARBOUR
OFF
OFF
ON
OFF
OFF
Returns
Identifying False Echo
Side lobes have no effect on distant or small surface objects. However, the
echo from a large object at short range may produce an arc on the radar screen
similar to a range ring or a series of echoes forming a broken arc. Side-lobe
echoes normally occur at ranges below 3nm, and can be reduced by adjusting
the
SEA control.
Main lobe
Side lobe Side lobe
Antenna
True echo Side echoes
Arc
D1638-2
Figure 3-3: Side Lobes
Page 76

3-6
2
hsb
PLUS Series Color LCD Display
Indirect Echoes
There are several types of indirect echoes or ghost images - some examples are
shown in Figure 3-4. These sometimes have the appearance of true echoes,
but in general they are intermittent and poorly defined.
Identifying False Echo
Returns
Indirect (false) echoes
False echo
True echo
True echo
Passing
ship
Mast
or funnel
False echo
D1641-2
Figure 3-4: Indirect Echoes
Multiple Echoes
Multiple echoes appear if there is a large target with a wide vertical surface at
a comparatively short range. The transmitted signal will be reflected back and
forth between the target and your own ship. Multiple echoes therefore appear
beyond the true target’s echo on the same bearing, as shown in Figure 3-5.
This is not very common.
MULTIPLE ECHOES
Multiple echoes
Figure 3-5: Multiple Echoes
True echo
D1642-1
Blind Sectors or Shadow Effect
Funnels and masts located near the antenna, may cause shadows. In shadow
areas beyond the obstruction there will be a reduction of the beam intensity,
although not necessarily a complete cut-off. However, there will be a blind
sector if the subtended angle is more than a few degrees. There may also be
multiple echoes which extend behind the obstruction. This should be avoided
by careful selection of the scanner site prior to installation (Chapter 8).
Page 77

Chapter 3: Standard Radar Operations 3-7
Adjusting Gain, Sea Clutter, Rain Clutter and Tune
Automatic adjustment of Gain, Sea and Tune is available, alternatively you
can set any of these parameters to manual and use the trackpad to adjust its
GAIN
MULTI
value. Rain clutter is adjusted manually using the
SEA, RAIN
and FTC are accessed from the GAIN key; TUNE is accessed from the
MULTI key.
Note: Gain, Sea and Tune can only be adjusted if the control is set to Manual
adjustment.
MANUAL MANUAL
O
F
F
O
F
F
75%
RAIN or FTC control. GAIN,
50%
and Tune
Clutter, Rain Clutter
Adjusting Gain, Sea
GAIN
FTC GAIN
RAIN SEA
D3936-3
When you select manual GAIN, SEA or TUNE adjustment the soft key icon
shows a vertical slider bar. As you press the trackpad, the value is indicated in
the slider.
When you switch
FTC or RAIN On, the soft key icon shows a vertical slider bar.
As you press the trackpad, the value is indicated in the slider.
If you change the settings, the new
GAIN, SEA and TUNE modes (auto or
manual) and values remain set even when you turn the radar off and on again;
Rain and FTC are reset to Off at power-on. The status bar indicates which
controls are switched to Auto or On, as shown in Figure 3-6.
Status Bar
3nm
RINGS
1/2
126°T
Gain, Sea and/or Tune set to Auto
WKS
TM TV3
H-UP
FTC on
AUTO
GST
FTCEXRCGZIR
Rain on
Figure 3-6: Radar Status Bar
To adjust a parameter:
➤
1. Select a range appropriate to the adjustment you wish to make. The opti-
mum Tune setting varies slightly for different ranges, depending on the
pulse width used.
D3987-2
MULTI
2. Press
GAIN or MULTI. The slider soft keys are displayed. The last-used
slider is highlighted (displayed in inverse video) to show that it is selected.
3. Press the required soft key so that the slider box is highlighted.
The
TUNE and GAIN soft keys toggle the control between Auto and Manual
mode. The
SEA soft key toggles the control between Auto-Harbour, Auto-
Offshore and Manual mode. If you select Manual mode the last auto setting
is retained. You can only move the slider if the control is set to Manual.
Page 78

Clutter, Rain Clutter
3-8
2
hsb
PLUS Series Color LCD Display
4. Use the trackpad to move the slider up or down. You can press and hold the
control to move the slider quickly rather than in single steps.
The image on the screen changes as you move the slider, so that you can see
the effect of your adjustment.
If you select
MANUAL TUNE adjustment, an 8-step signal-strength indicator
bar is displayed above the slider. Adjust the slider to obtain the maximum
Adjusting Gain, Sea
reading on the indicator.
and Tune
Note: Because the changes to the settings are made immediately, you cannot
revert to the previous setting by pressing
5. When you have set all the controls to the levels you require, press
or
CLEAR to clear the slider display. The status bar is updated to indicate
CLEAR.
ENTER,
which controls are switched to Auto or On.
Gain Control and Sea Control
The GAIN control can be set to either Auto or Manual. In Auto mode, the
Pathfinder Plus radar optimizes the setting. The
Harbour (default), Auto-Offshore or Manual mode. In Auto-Offshore mode,
the Pathfinder Plus Radar optimizes its settings to account for the effects of sea
clutter. In harbours or close proximity to land different auto settings may
be necessary to cater for the effects of land clutter. To avoid losing small
targets it is therefore advisable to set the Sea control to Auto-Harbour
mode. Alternatively, set both Sea and Gain to Manual mode then adjust
the settings to ensure that all close small targets are visible.
The
GAIN control adjusts the level of the display of signals received from the
scanner; it is equivalent to a volume control on a radio.
Because the
SEA control affects the gain, you may need to manually readjust it
if you manually change the Gain setting.
SEA control can be set to Auto-
MANUAL
50%
GAIN
MANUAL
75%
SEA
Gain Control
When the GAIN control is set to Manual, you should check it every time you
change the range scale.
On long range settings, the gain should be set to give a slight speckle in the
background of the radar picture. Do not set the gain too low, or you may miss
small or weak targets.
On shorter ranges, you may wish to reduce the gain slightly to reduce the
speckle and therefore improve target definition.
Sea Clutter Control
Radar returns from waves around your vessel can clutter the centre of the radar
picture (see Figure 3-7, making it difficult to detect real targets. Such sea
clutter usually appears as multiple echoes on the display at short range scales,
Page 79

Chapter 3: Standard Radar Operations 3-9
and the echoes are not repetitive or consistent in position. With high winds and
extreme conditions, echoes from sea clutter may cause dense background
clutter in the shape of an almost solid disc.
D3968-1
Figure 3-7: Sea Clutter
The SEA control reduces the gain level in the areas near your vessel, extending
up to 3 to 5nm depending on the wave and sea conditions. This has the effect of
reducing the sea returns to intermittent small dots, while small targets are still
visible. Gain levels further from your vessel remain unchanged.
and Tune
Clutter, Rain Clutter
Adjusting Gain, Sea
A
U
T
O
TUNE
You can use the gain and Sea control to help minimize the effects of side lobes
(see Identifying False Echo Returns on page 3-5).
Note: On short range scales, do not set the Sea control so high that all clutter
is removed, since this could stop you seeing echoes from close targets.
Tuning the Receiver
The TUNE control is used to fine tune the receiver in the scanner for maximum
target returns on the display. In Auto mode, the radar tunes itself automatically
on all range scales. We recommend that you leave the
TUNE control in Auto
mode.
If you do set the
TUNE control to Manual, you will need to adjust it about 10
minutes after you have turned on the radar, since the required setting changes
once the magnetron has warmed up.
You should adjust the control to obtain the maximum signal strength, as
indicated in the 8-step bar above the slider. If you cannot tune the radar
successfully, refer to Section 7.6 for information on the Tune Preset function.
Rain Clutter Control, using RAIN and FTC
The radar can see echoes from rain or snow. Returns from storm areas and rain
squalls consist of countless small echoes that continuously change size,
intensity, and position. These returns, shown in Figure 3-8sometimes appear
Page 80

and Tune
Clutter, Rain Clutter
3-10
2
hsb
PLUS Series Color LCD Display
as large hazy areas, depending on the intensity of the rainfall or snow in the
storm cell.
RAIN and FTC controls are used to reduce this clutter, so that targets
The
O
F
F
Adjusting Gain, Sea
RAIN
masked by the clutter can be seen on the radar picture.
•The
RAIN control is used to reduce large clutter masses around your vessel
caused by rain or snow.
•The
FTC (Fast Time Constant) control is used to reduce rain clutter at a dis-
tance from your vessel, such as that shown below.
O
F
F
FTC
D3967-1
Figure 3-8: Rain Clutter
When the FTC control is turned up, only the leading edge of large (rain clutter)
echoes is displayed, while the effect on smaller (ship) echoes is only slight.
This means that you can also use the control on shorter ranges to distinguish
between two very close echoes on the same bearing, which may otherwise
merge and appear as one echo.
When the
FTC control is turned up, the receiver is less sensitive, and there is a
reduction of background noise and fill-in returns from land and large targets.
You should therefore turn the control down when its use is not required. Since
storm cells are usually visible for long distances due to their extreme altitude,
you may wish to leave them displayed so that you can observe the location of
bad weather.
If you turn the
RAIN or FTC control Off (equivalent to setting the level to 0%),
the actual setting is stored, and restored when you turn the control on again.
RAIN and FTC are reset to Off at power-on.
Note:
Page 81

Chapter 3: Standard Radar Operations 3-11
Changing the Targets Display
The Pathfinder Plus Radar allows you to improve target visibility by changing
the following:
• Interference rejection
• Target expansion
• Target wakes
TARGETS
These parameters are accessed from the default soft key
TARGETS.
This section explains how to change these modes and describes the effect of
each mode. The current settings are shown at the right-hand end of the status
bar as shown in Figure 3-9.
Status Bar
3nm
RINGS
1/2
126°T
Interference Rejection on
Wakes on Target Expansion on
WKS
TM TV3
H-UP
AUTO
GST
FTCEXRCGZIR
Figure 3-9: Status Bar
➤
To change the settings of the target modes:
1. Press the
TARGETS default soft key.
The target option soft keys are displayed, with the current selections highlighted.
INT REJ
OFF ON
EXPANSION
OFF ON
WAKES
OFF S M L
CLEAR
WAKES
D3642-2
2. Press the appropriate soft key to toggle the required setting between OFF
and ON.
Display
Changing the Targets
D3986-2
WAKES
OFF S M L
Note: If an option is not available for the current setting, its soft key label is
grey. When you press the key, the system beeps and the setting remains
For the Wakes mode, press the
WAKES soft key to step the highlighted
OFF.
selection through the wake options.
You can use the soft keys to change the settings of any or all the modes on
this display.
3. When the required options are highlighted, press
ENTER. The screen
returns to the default display with the new mode(s) in operation. The status
bar is updated to indicate which controls are switched on.
Page 82

Display
Changing the Targets
3-12
INT REJ
OFF ON
2
hsb
PLUS Series Color LCD Display
Interference Rejection
Mutual radar interference is likely when two or more radar-equipped vessels
are operating within range of each other. This usually appears as a series of
small dots moving to and from the display center in a straight line or a long,
sweeping curve. This type of interference is most noticeable at long ranges.
D1639-1
Figure 3-10: Interference Rejection
The Pathfinder Plus Radar includes a mechanism that automatically reduces
such interference. This mechanism is normally left switched on. However, if
you wish to detect the presence of other radars in the vicinity, you can turn off
the interference rejection.
EXPANSION
OFF ON
WAKES
OFF S M L
CLEAR
WAKES
Target Expansion
You can make targets easier to see by expanding them. The scanner type
determines the range at which target expansion is available. Target expansion
overrides the normal pulse length, thereby increasing the size of the target seen
on the screen. However, this is at the expense of range resolution.
Target Wakes
You can see the direction and speed with which targets are moving relative to
your vessel by selecting the target wakes display option.
When wakes are switched on, the target is displayed at the brightest level and
the previous positions of targets are retained at successively fainter levels on
the screen. You can select long, medium or short wakes, which retain
information from previous scans at a reduced video level.
You can clear existing wakes from the display by pressing the
soft key. The soft key is only available when wakes are switched on; the
display starts showing new wakes as soon as the old wakes have been cleared.
When wakes are switched off, no new wakes are displayed and existing wakes
are cleared.
CLEAR WAKES
Page 83

Chapter 3: Standard Radar Operations 3-13
3.4 Measuring Range and Bearing Using VRM/EBLs
The Pathfinder Plus Radar display allows you to specify up to two Electronic
Bearing Lines (EBLs), each with an associated Variable Range Marker
(VRM), using the
A standard VRM is displayed as a circle with its centre on your vessel’s
position, and it’s EBL is displayed as a line from the origin to the edge of the
radar picture display. However, each pair can be floated, so that the origin can
be moved.
3nm
VRM/EBL key.
RR
OFF
126°T
VRM
H-UP
AUTO
IR
T
Floated VRM2
(long-dashed line)
Floated EBL2
(long-dashed line)
VRM1 (short-dashed line)
EBLs
Bearing Using VRM/
Measuring Range and
EBL1 (short-dashed line)
VRM/EBL 2
015°
TBRG
096
RNG nm
CURSOR CURSOR
146°
1.70
RNG nm
50°47^72N
TBRG
001°10^58N
VRM/EBL 1
BRG
243°
0.98
RNG nm
T
VRM/EBL data boxes
Two cursor readout boxes
D3974-1
Figure 3-11: EBL and VRM Displays
Note: When using VRM/EBLs, you may wish to turn off the range rings to
make the VRMs clearer (see Section 2.4).
VRMs move if you change the range scale, so that the actual range you have
marked is maintained. VRM/EBLs also move if you offset the centre.
When a VRM/EBL pair is active, its bearing and range are displayed in its
associated data box, which can be moved, deleted or reinstated.
The bearing information is displayed as either the bearing relative to your
vessel’s heading or (if heading data is available from a position fixer or
compass) the actual bearing in degrees magnetic or degrees true. These are
controlled by the setup parameters (see Section 7.4).
The VRM/EBL functions allow you to perform the following tasks:
• Measure the range of a target or point from your vessel’s position, using a
VRM
Page 84

from Vessel
Bearing to Target
3-14
2
hsb
PLUS Series Color LCD Display
• Measure the bearing of a target or point from your vessel’s position, using
an EBL
• Measure the range and bearing between any two points on the radar, using
the
FLOAT function
Note: An alternative method of measuring range and bearing is to use the cur-
Measuring Range and
sor data box: If the cursor readout is set to display range and bearing (rather
than Lat/Long), you can determine the range and bearing by moving the cursor over the target and checking the cursor data box readings. You can also
estimate the range to a target by reference to the range rings.
Measuring Range and Bearing to Target from Vessel
To measure the range and/or bearing of a target or point from your vessel’s
position, you need to place a VRM/EBL and move it so that it crosses the
target or point for which you require the bearing or range.
When you turn on a VRM/EBL, it is displayed in its last-used position.
Note: If the VRM’s last-used position is outside the radar picture at the current range setting, it is placed at its default position instead. This is one third
of the range for VRM1, and two-thirds for VRM2.
VRM/EBL
VRM/EBL
Placing a VRM/EBL
Placing and positioning VRM/EBLs on the Pathfinder Plus Radar display is
quick and easy.
• If a VRM/EBL is not already displayed, you can place one with a single
press of the
• If you have already placed a VRM/EBL, pressing the
vides soft key control of additional functions.
➤ To place a VRM/EBL when one is not already displayed:
1. Press
The radar picture shows VRM/EBL1, together with its associated data
box in its last-used position.
As shown in Figure 3-12, the cursor is positioned over the intersection of
the VRM circle and the EBL line. It has control of the VRM/EBL as indicated by the four-way arrow, the solid VRM/EBL line, and the text VRM/
EBL.
VRM/EBL key.
VRM/EBL key pro-
VRM/EBL.
Page 85

Chapter 3: Standard Radar Operations 3-15
Ship's Heading Marker
VRM/EBL
EBL as solid line
Cursor symbol
as four-way arrow
Cursor text in
inverse video
VRM as solid line
Indicate cursor control
of VRM/EBL
Figure 3-12: Placing a VRM
2. If required, use the trackpad controls to change the radius (range) of the
VRM circle and the angle of the EBL until they cross the required target.
The range and bearing information in the VRM/EBL data box is updated
as you move the cursor.
3. Press
ENTER to drop the VRM/EBL. The radar shows this
VRM/EBL as a short-dashed line, and the cursor returns to normal control.
4. Read the range and bearing to the target or point, which is shown in the
VRM/EBL data box.
5. If required, you can move or delete the VRM/EBL data box using the con-
text-sensitive cursor.
➤ To place a VRM/EBL when one is already displayed:
D3970-1
from Vessel
Bearing to Target
Measuring Range and
VRM/EBL1
OFF ON
VRM/EBL
1. Press
VRM/EBL to display the VRM/EBL soft keys.
VRM/EBL1
OFF ON
VRM/EBL2
OFF ON
FLOAT¬
VRM/EBL
DATABOX
OFF ON
D3645-2
The labels for the two left-hand soft keys indicate the current status of the
two VRM/EBLs.
2. Press the soft key for the VRM/EBL you require, to toggle the setting from
OFF to ON.
The soft key labels are cleared, and the radar picture shows the VRM/EBL
and its associated data box.
3. Position the EBL/VRM using the trackpad, and press
ENTER to drop it.
The radar shows the VRM/EBL as a short-dashed line (VRM/EBL1) or a
long-dashed line (VRM/EBL2), and the cursor returns to normal control.
Moving an Existing VRM/EBL
You can move an existing VRM/EBL using the context-sensitive cursor. You
can control the VRM and EBL separately or both together.
Page 86

3-16
2
hsb
PLUS Series Color LCD Display
➤ To move the VRM and/or EBL:
1. Move the cursor over the VRM or EBL you wish to change. If you wish to
change the VRM and EBL together, move the cursor over the intersection
of VRM/EBL. The cursor text indicates the current object as VRM, EBL,
or VRM/EBL.
Measuring Range and
Bearing Between
Targ et s ( FLOAT)
2. Press
ENTER to take control of the object. The object(s) under control is
displayed as a solid line, and the cursor as a four-headed arrow.
3. Move the EBL to the new angle and/or change the VRM radius (range)
using the trackpad controls.
4. Press
ENTER again to drop the VRM/EBL in its new position, or CLEAR to
abandon the operation and return the VRM/EBL to its previous position.
The radar shows the VRM/EBL as a short-dashed line (VRM/EBL1) or a
long-dashed line (VRM/EBL2), and the cursor returns to normal control.
Deleting an Existing VRM/EBL
VRM/EBL
VRM/EBL1
OFF ON
➤ You can delete a VRM/EBL by using the VRM/EBL key to display the soft
keys, and pressing the required
VRM /EBL soft key to toggle the setting from ON
to OFF.
➤ Alternatively, you can delete an existing VRM/EBL using the context-
sensitive cursor. To do so:
1. Move the cursor over the VRM/EBL you wish to control, until the letters
VRM
VRM, EBL, or VRM/EBL are displayed.
2. Press
CLEAR.
This has the same effect as turning the VRM/EBL off using the
VRM/EBL soft keys. It turns off the VRM/EBL pair, irrespective of the
cursor text: you cannot turn off VRMs and EBLs independently.
Measuring Range and Bearing Between Targets (FLOAT)
You can measure the range and bearing between any two points on the radar,
such as two targets, using the Pathfinder Plus Radar’s Float function. This
allows you to move the origin of a VRM/EBL away from your vessel’s
position and onto a target. You can then change the angle of the EBL, relative
to its new origin, to obtain the bearing between two points. The radius of the
VRM can also be adjusted to determine the distance between two points.
Floating a VRM/EBL
Note: You can float a VRM/EBL pair using either the soft keys or the contextsensitive cursor. The procedure for using the cursor is the same as for moving
Page 87

Chapter 3: Standard Radar Operations 3-17
or unfloating a VRM/EBL pair, as described below; however, as it is more difficult to locate the VRM/EBL origin when it is over the centre, you will probably find it easier to use the keys in this case.
➤ To float a VRM/EBL pair using the keys:
1. If one is not already present, place a VRM/EBL pair as described in the pre-
vious section.
FLOAT...
FLOAT 1
VRM
2. Press
3. Press the
VRM/EBL to display the VRM/EBL soft keys.
FLOAT soft key. The soft keys are updated, with the relevant
options displayed.
FLOAT 1
FLOAT 2 UNFLOAT 1
UNFLOAT 2
D3646-2
4. Press the FLOAT 1 soft key to float VRM/EBL1, or the FLOAT 2 soft key to
float VRM/EBL2.
The soft keys are cleared. The cursor is positioned over the origin of the
VRM/EBL, over your vessel. The cursor has control of the VRM/EBL, as
indicated by the four-headed arrow, the text
FLT in inverse video, and the
solid VRM/EBL line.
5. Use the trackpad to move the origin of the VRM/EBL to the required posi-
tion (over the first target).
6. Press
ENTER to drop the VRM/EBL in its new position, or CLEAR to aban-
don the operation and return the VRM/EBL to its previous position.
The radar shows the VRM/EBL as a short-dashed line (VRM/EBL1) or a
long-dashed line (VRM/EBL2), and the cursor returns to normal control.
7. Use the context-sensitive cursor to take control of the VRM and/or EBL, to
obtain the range and/or bearing to a second target, as previously described.
Tar ge ts (FLOAT)
Bearing Between
Measuring Range and
8. Read the range and bearing information from the VRM/EBL data box.
Moving and Unfloating a Floating EBL
You can move or unfloat a VRM/EBL that has been floated. You can unfloat a
VRM/EBL either by using the context-sensitive cursor or by using the
soft key options.
➤ To move or unfloat a floating VRM/EBL using the cursor:
1. Move the cursor over the origin of the VRM/EBL you wish to control, until
FLT are displayed.
VRMFLT
the letters
2. If you wish to unfloat the VRM/EBL, press
VRM/EBL is reset to your vessel’s position.
FLOAT
CLEAR. The origin of the
Page 88

3-18
2
hsb
PLUS Series Color LCD Display
3. Alternatively, if you wish to move the floating VRM/EBL, press ENTER to
take control of it and move it using the trackpad.
Press
ENTER again to drop the VRM/EBL in its new position, or CLEAR
to abandon the operation and return the VRM/EBL to its previous position.
Data Boxes
Controlling VRM/EBL
➤ To unfloat a floating VRM/EBL using the keys:
VRM/EBL
FLOAT 1
UNFLOAT 1
1. Press
2. Press the
3. Press the
VRM/EBL to display the VRM/EBL soft keys.
FLOAT soft key.
UNF LOAT 1 soft key to unfloat VRM/EBL1, or the UNFLOAT 2 soft
key to unfloat VRM/EBL2.
The soft keys are cleared, and the VRM/EBL is repositioned with its origin at your vessel’s position.
Controlling VRM/EBL Data Boxes
➤ To move a VRM/EBL data box, using the context-sensitive cursor:
BOX
1. Move the cursor over the box until the letters
ENTER to take cursor control of the box.
2. Use the trackpad to move the box to its new location, and press
drop it and return to normal cursor operation.
Each VRM/EBL data box is switched on and off with its associated VRM/
EBL. However, when one or both VRM/EBLs are active, you can turn the data
box(es) off at any time, if required.
➤ To control the VRM/EBL data boxes:
BOX are displayed, and press
ENTER to
VRM/EBL
VRM/EBL
DATABOX
OFF ON
1. Press
2. Press the
Note: VRM/EBL data boxes are not affected by the setting of the
VRM/EBL to display the VRM/EBL soft keys.
VRM/EBL DATABOX soft key to toggle the setting from OFF to ON or
from
ON to OFF.
DATABOXES
soft key accessed using the SCREEN default soft key. This only controls the set
of data boxes available for integrated systems (see Chapter 2).
Page 89

Chapter 3: Standard Radar Operations 3-19
3.5 Setting Guard Zones and Alarms
The Pathfinder Plus Radar display allows you to set up one or two guard
zones, using the
zones as shown in Figure 3-13.
Note: You can only view and control guard zones if you are using the Master
display (that is, the display to which the scanner is connected).
ALARMS key. You can set up sector zones or 360° (circular)
3nm
CURSOR
BRG R
031°
RNG nm
2.24
RR
1/2
126°T
H-UP
GRD
AUTO
IR
T
Guard zone 1, sector zone
(short-dashed line)
Guard zone 2, circular zone
(long-dashed line)
D3975-1
Figure 3-13: Guard Zone Display
Guard zones are fixed with respect to the ship’s heading marker (SHM),
moving as the SHM moves. They also move if you offset the centre, or if you
change the range scale, so that the area you have marked is maintained.
The guard alarm sounds when a target enters a guard zone, exceeding the
target density threshold within the zone; the alarm also sounds on a repeater
display. The alarm sensitivity control allows you to set the threshold above
which a new target will trigger an alarm, and also to turn the alarm on or off.
and Alarms
Setting Guard Zones
Note: A guard zone only operates when the whole zone is displayed on the
screen, or could be displayed by offsetting the centre. In addition, a guard
zone is inactive for 10 seconds after it is placed or re-sized, to avoid inappropriate alarms during positioning.
This section covers the following topics:
• Placing a guard zone
• Moving, reshaping or deleting a guard zone
• Controlling guard zone alarms
Page 90

3-20
2
hsb
PLUS Series Color LCD Display
Placing a Guard Zone
Placing and positioning guard zones on the Pathfinder Plus Radar display is
quick and easy.
• If a guard zone is not already displayed, you can place one using the
ALARMS key.
Placing a Guard Zone
• If you have already placed a guard zone, pressing the
ALARMS key allows
you to toggle either guard zone on or off.
Note: When you turn on a guard zone, it is normally displayed in its last-used
position and shape. However, if this position is off-screen at the current range
setting, or within one quarter of the current range from your vessel, the guard
zone is placed at its default position and shape instead. This is at one third
(Zone 1) or two thirds (Zone 2) of the current range, as a sector zone occupying 30° either side of the ship’s heading marker.
➤ To place a guard zone:
GUARD 1
OFF ON
1. Press
u
ALARMS
ALARMS. The soft keys are displayed.
GUARD 1
OFF ON
GUARD 2
OFF ON
D3791-2
The soft keys indicate the current status of the two guard zones.
2. If necessary, press the soft key for the guard zone you require, to toggle the
setting between
OFF and ON. The soft keys are cleared. If you turned a
guard zone on, it is displayed in its last-used position with one corner under
cursor control.
The radar picture shows the guard zone as a four-sided shape bounded by
a solid line (or a circle if previously set as one).
The cursor is positioned over an outer corner of the zone as shown in
Figure 3-14. The cursor has control of this corner, as shown by the text
GRD in inverse video, the four-headed arrow, and the solid guard zone
boundary.
Sector Zone Circular Zone
Ship's Heading Marker
Cursor symbol as
four-way arrow
Cursor text in
inverse video
Zone as solid line
GRD GRD
Move
cursor
Indicate cursor control
of guard zone
Figure 3-14: Placing a Guard Zone
D3971-1
Page 91

Chapter 3: Standard Radar Operations 3-21
3. If necessary, use the trackpad to move the corner of the guard zone to the
required position. As you move the corner, the width and/or height of the
zone changes, but its general sector shape is retained.
Note: To create a 360° guard zone, rather than a sector guard zone, you can
either move the corner all the way round to form a circle, or move it back to
just the other side of the other outer corner.
4. Press
ENTER to drop the corner in its new position and redraw the zone, or
CLEAR to abandon the operation and return the corner to its previous posi-
tion.
The display shows this zone boundary as a short-dashed line (zone 1) or a
long dashed line (zone 2), and the cursor returns to normal control.
5. If required, use the context-sensitive cursor to reposition other corners/
sides of the zone in turn, as described below.
Moving, Reshaping or Deleting a Guard Zone
➤ You can move, reshape or delete an existing guard zone using the context-
sensitive cursor. To do so:
Zone
Deleting a Guard
Moving, Reshaping or
GRD
ALARM
OFF ON
1. Move the cursor over the guard zone corner or side that you wish to control,
until the letters
2. If you wish to delete the whole zone, press
3. Alternatively, if you wish to move the corner or side, press
GRD are displayed.
CLEAR.
ENTER to take
control of it. The zone boundary is displayed as a solid line, and the cursor
as a four-headed arrow.
4. Move the corner or side to the new position, as described on the previous
page.
Note: To convert a 360° guard zone back to a sector guard zone, take control
of any point on the circle, and move it to open up the circle.
5. Press
ENTER again to drop the corner or side in its new position, or CLEAR
to abandon the operation and return it to its previous position
The radar shows the zone boundary as a short-dashed line
(Zone 1) or a long-dashed line (Zone 2), and the cursor returns to normal
control.
6. If required, reposition the cursor and repeat steps 3 to 5 to move the other
corners or sides.
➤ You can also delete (turn off) a zone by pressing the ALARMS key, and then
pressing the appropriate guard zone soft key to toggle the setting from
ON to
OFF.
Page 92

3-22
Controlling Guard Zone Alarms
The guard alarm is triggered when a target enters a guard zone which exceeds
the target density threshold. You can set the threshold above which a new
target will trigger an alarm, and can also turn the alarm on or off.
When the alarm is triggered, the unit beeps and a text message is displayed.
2
hsb
PLUS Series Color LCD Display
Controlling Guard
Zone Alarms
➤ To clear the alarm, press any key (on the master or repeater display).
The alarm will sound again after 10 seconds, unless one or more of the
following happens:
• You turn the guard zone off
• You adjust the guard zone size/shape to reduce the number of targets in the
zone
• You turn the alarm off
• You decrease the alarm sensitivity
• The target leaves the guard zone
➤ To change the alarm sensitivity setting:
1. Press
MULTI to display the sliders.
ON
A
25%
75%
U
T
O
ALARM
LIGHT
TUNE
D5036_1
2. Press the ALARM soft key to highlight the Alarm slider.
3. If required, press the soft key again to toggle the setting between
OFF and
ON. You can only move the slider if the control is set to ON.
4. Use the trackpad to increase or decrease the alarm slider setting. You can
press and hold the trackpad to change the value more rapidly.
5. The higher the setting, the more sensitive the alarm, and the smaller the tar-
get density required to set it off.
6. Press
ENTER to clear the slider display.
Page 93

Chapter 3: Standard Radar Operations 3-23
3.6 MARPA
Introduction to MARPA
The
Aid) function for target tracking and risk analysis. This section gives an
introduction to the Pathfinder Plus Radar MARPA system and shows you how
to use the MARPA functions, you should also read Section 7.5.
MARPA improves the standard of collision avoidance by obtaining detailed
information for several automatically tracked targets. MARPA provides
continuous, accurate and rapid situation evaluation.
You can acquire up to ten targets, which are then automatically tracked by the
MARPA system. MARPA calculates target bearing and range, true speed and
course, CPA (Closest Point of Approach), and TCPA (Time to Closest Point of
Approach).
Each tracked target can be displayed with a vector depicting approximate
target speed (vector length) and course (vector direction). The calculated
target data can also be shown on the screen. Each target is continually assessed
and you are warned if one becomes dangerous or is lost.
Effective MARPA operation is dependent on accurate own ship’s heading,
plus SOG and COG. The better the quality of the heading data, the better
MARPA will perform. (MARPA functions without SOG and COG data but
only relative vector, CPA and TCPA are shown; target course and speed
cannot be calculated). For more information on heading sensors, and how to
connect them to your display, refer to Heading and Position Data on page 1-9
and Appendix E.
2
hsb
series displays include a MARPA (Mini Automatic Radar Plotting
MARPA
SAFTEY NOTICES
MARPA can improve collision avoidance when used wisely. It is the
user’s responsibility to exercise common prudence and navigational
judgements.
There are conditions where acquiring a target may become difficult. These
same conditions may be a factor in successfully tracking a target. Some of
the conditions are:
• The target echo is weak.
• The target is very close to land, buoys or other large targets.
• The target or your own ship is making rapid manoeuvres.
• Choppy sea state conditions exist and the target is buried in excessive
sea clutter or in deep swells.
Page 94

3-24
2
hsb
PLUS Series Color LCD Display
• Choppy sea state conditions exist yielding poor stability; own ship’s
heading data is very unstable.
• Inadequate heading data
Symptoms of such conditions are that acquisition is difficult and the
MARPA vectors are unstable; the symbol wanders away from the target,
locks onto another target or changes to a lost target symbol. If any of these
Introduction to
MARPA
conditions are present, acquisition and tracking may need to be re-initiated
or, in some cases be impossible to maintain. Improving the quality of the
heading data will reduce the effect of the other conditions.
Risk Assessment
Each target is monitored to see if it will be within a certain distance from your
own vessel within a certain time. If so, the target is designated as dangerous
and you are warned with an audible alarm in addition to a warning on the
screen. The target symbol changes and flashes to indicate that it is a dangerous
target. Pressing any key silences the alarm and removes the warning, but the
target symbol remains dangerous.
Both the distance (Own Vessel Safe Zone) and the time (Time to Safe Zone)
are selectable as described in Section 7.5.
If a target is lost, either because the MARPA software has lost contact with it,
or because it has moved out of range, you are warned, again with an audible
alarm and an on-screen warning. Pressing any key silences the alarm, removes
the warning and removes the lost target symbol from the screen.
Target Data
All MARPA targets are stored in a MARPA database list, which shows
bearing, range, course and speed of each tracked target.
For any one target a pop-up data box can be placed on the screen, this shows
bearing, range, course, speed, CPA (Closest Point of Approach) and TCPA
(Time to Closest Point of Approach). The target for which data is displayed is
indicated by a circle around its symbol.
Each target is displayed as a symbol to indicate its status:
Target is being acquired
Target is safe
Target is dangerous.
Target is Lost
The dangerous and lost symbols are shown flashing.
Page 95

Chapter 3: Standard Radar Operations 3-25
Target Vector and History
The MARPA targets can be displayed with a vector line showing where they
will be at a certain time in the future, (assuming present course and speed).
You can select a relative or true vector and the vector length. The vector type
(RV or TV) and length are shown in the status bar.
You can also select to view the target’s history, this appears as a series of dots
that are dropped by the target as it makes way. The interval between them is
selectable.
A relative vector indicates the target’s motion related to your own ship’s
motion. The target’s relative course and speed are calculated to produce a
vector that is displayed on the target only. This mode is used for collision
avoidance and threat assessment.
A true vector indicates the target’s motion over ground. In this mode true
vectors for the target and your own ship are displayed. MARPA measures the
direction in which the target and own ship are actually moving over the
ground. The result is the vessel’s true course, the rate of motion is the vessel’s
true speed. Consider this motion as if you were in a helicopter looking down
watching the targets move across the water. This mode can aid navigation.
Using MARPA
Section 7.5 describes how to set the target vector and history parameters.
Repeater Displays
On an integrated
software version) can access the MARPA functions, and targets are shown on
the repeater display. MARPA data is also sent on NMEA allowing any other
equipment, with the necessary functionality, to show the tracked targets’ data.
Radar Range Scales
MARPA target acquisition is only available at radar range scales of up to
12nm, although tracking continues at all ranges.
Note: If you change to a lower range scale, targets may be beyond the range
of the scanner and will be lost. In such cases an alarm pop-up indicates the
target is off-screen.
Using MARPA
The MARPA functions are accessed through the MARPA default soft key, and
some options are available with the context sensitive cursor, or through the
MARPA database list. Where there are two ways of performing a certain
function this section describes both ways. Information on how to set up the
MARPA system is in Section 7.5.
2
hsb
display system the repeater display (with the appropriate
Page 96

3-26
TARGETS SCREENHDG MODE
Acquire a Target
➤ To acquire a target:
2
hsb
PLUS Series Color LCD Display
MARPA
D4126_1
1. Press the
Using MARPA
ACQUIRE
TARGET
CANCEL
TARGET
2. Position the cursor over the required target and press the ACQUIRE TARGET
soft key.
MARPA soft key to display the ACQUIRE TARGET soft keys.
MARPA BOX
OFF ON
ACQUIRE
TARGET
MARPA
LIST
D4120_1
The symbol is placed at the cursor position and the radar searches for a
target at the cursor position. If a target is present for several scans the radar
locks onto it and the symbol indicates a safe target, the target vector is
also displayed. If the target is continuously lost, the lost target symbol is
displayed and a Lost Target alarm is generated; press any key to cancel the
alarm and remove the lost target symbol from the display.
3. Press
ENTER or CLEAR to return to the default display.
Cancel a Target
➤ To cancel a target using the context-sensitive cursor:
1. Move the cursor over the target, the following soft keys are displayed.
CANCEL
TARGET
MARPA BOX
OFF ON
CANCEL
TARGET
MARPA
LIST
CANCEL
TARGET
D4119_1
2. Press the CANCEL TARGET soft key to cancel target tracking and remove the
symbol from the display. The default soft keys are displayed.
➤ To cancel a target from the database list.
1. Press the default soft key
2. Press the
MARPA LIST soft key, the database list is displayed.
3. Use the trackpad to select a target, then press the
MARPA to display the MARPA soft keys.
CANCEL TARGET soft key
to remove the selected target.
4. Press
CLEAR to remove the database list.
View Target Data
You can toggle the MARPA data box on/off using the MARPA BOX ON/OFF soft
key. This box displays the data for one MARPA target. You can select the
Page 97

Chapter 3: Standard Radar Operations 3-27
target using the context sensitive cursor or the database list. Alternatively, if
you display the data box when no target is selected, data is displayed for the
last target that had the data box displayed – unless a new target has been
acquired, then the new target data is displayed.
➤ To view (or hide) target data using the context sensitive cursor:
1. Move the cursor over the target for which you require data. The letters
MARPA and the following soft keys are displayed.
CANCEL
TARGET
MARPA BOX
OFF ON
D4119_1
Using MARPA
MARPA BOX
OFF ON
MARPA BOX
OFF ON
2. Press the MARPA BOX ON/OFF soft key to toggle the data box on/off for the
selected target.The target data box is displayed and the associated target
symbol is identified by a circle drawn around it.
The default soft keys are displayed when you move the cursor away from
the target.
Note: When you select
ON, if the data box was already displayed for another
target, it is updated for the selected target.
BRG 84°M RNG 1.48nm
CRS 110°M SPD 0.0kts
CPA 1.48nm TCPA PASSED
MARPA 1
D4117_1
Figure 3-15: MARPA Target Data Box
➤
To view (or hide) target data using the default soft keys:
1. Press
MARPA to display the MARPA soft keys.
2. Press the MARPA BOX ON/OFF soft key to toggle the data box on. The target
data box is displayed and the associated target symbol is identified by a circle drawn around it. The default soft keys are displayed.
3. Press the
MARPA BOX ON/OFF soft key again to toggle the data box off.
MARPA
LIST
MARPA BOX
OFF ON
➤ To view the MARPA database list and a target data box:
1. Press
MARPA followed by the MARPA LIST soft key, the database list is dis-
played.
2. Use the trackpad to select a target, then press the
MARPA BOX ON/OFF soft
key to toggle the data box on/off.
3. Press
CLEAR to remove the database list.
Page 98

3-28
2
hsb
PLUS Series Color LCD Display
MARPA
ID BRG RANGE COURSE SPEED
o
0 327
1 537
Using MARPA
T 0.63nm 256oT 3.0kts
o
T 1.70nm 256oT 2.0kts
MARPA BOX
OFF ON
CANCEL
ALL
CANCEL
TARGET
MARPA BOX
OFF ON
CANCEL
ALL
Figure 3-16: MARPA Database List
➤
To cancel all targets:
1. Press
2. Press the
MARPA followed by MARPA LIST to display the database list.
CANCEL ALL soft key. You are prompted to confirm.
Press
YES to continue, all the MARPA targets are cleared from the screen,
and the data is removed from the MARPA database list.
Press
NO to cancel the operation.
D4121-1
Page 99

Chapter 4: Integrated Radar Operations 4-1
Chapter 4: Integrated Radar Operations
4.1 Introduction
This chapter explains how to use and display non-radar information that may
be available from other units connected to your system. It also explains how to
use the man overboard (MOB) function. You can use this chapter with the
radar display set to simulator mode, or on the water after you have installed
and set up your
In order to use these functions, you need the following additional data from
equipment connected to your system via a SeaTalk, NMEA or
2
hsb
(PLUS) series Pathfinder Radar system.
hsb
2
link:
Table 4-1: Function of External Data
Data Example source Integrated functions available
Heading Compass*
Autopilot
Rate Gyro Compass on NMEA
*If heading data is available via both NMEA and SeaTalk, NMEA data takes priority. For all other
data, SeaTalk data takes priority (see ).
Waypoint data Chartplotter - Waypoint display and data
Position GPS system - Marks
Other data Transducers - Data Box and Nav Window data displays including
Chart display Chartplotter, either
combined or via
2
hsb
connection
- Heading value in status bar
- North Up or Course Up heading modes (as
alternatives to Head Up
- MOB (if speed data also available)
- MARPA
- Radar/Chart Overlay
- Position data in Data Box and Nav Window
- MOB
- COG, SOG and time
- Radar/Chart Overlay
speed, depth, wind
- Chart display as full-screen or half-window display
Introduction
This chapter covers the following topics:
• Changing the heading mode of the radar picture
• Using marks
• Man Overboard (MOB)
• Cursor echo
Note: Until you are familiar with interpreting the radar display, you should take
every opportunity to compare the radar’s display patterns with visual targets,
such as other vessels, buoys and coastal structures. You should practice harbour and coastal navigation during daylight and in clear weather conditions.
Page 100

4-2
4.2 Changing the Heading Mode
The radar picture is normally shown with your vessel’s dead ahead bearing
straight up, as indicated by the Ship’s Heading Marker at 0° relative bearing.
This is the Head Up orientation.
If heading information is available via a SeaTalk or NMEA connection, you
can choose a different heading mode. In Course Up and North Up mode you
can also select relative or true motion.
2
hsb
PLUS Series Color LCD Display
Heading Mode
Changing the
Relative motion is the default for the radar display. In relative motion your
own ship’s position remains fixed on the radar screen and all radar targets
move relative to your own ship.
In true motion, fixed radar targets maintain a constant position on the screen,
whilst your own ship moves across the radar image at the appropriate speed
and heading. A map-like image is thus displayed, with all moving vessels
travelling in true perspective to each other and to fixed land masses.
As your ship’s position approaches the edge of the screen, the radar display is
automatically reset to reveal the area ahead of your ship. You can manually
reset your ship’s position at any time by pressing the
TRUE REL soft key twice.
Heading Modes
The heading modes are as follows:
True and Relative Motion
Head Up
North Up Course Up
D3988-1
Figure 4-1: Radar Heading Modes
• Head Up: The radar picture is displayed with the vessel’s current heading
upwards. As the heading changes the picture will rotate.
• North Up: The radar picture is stabilized and displayed with north
upwards. As you change heading, the ship’s heading marker moves.
• Course Up: The radar picture is stabilized and displayed with the currently selected course upwards. As you change heading, the ship’s heading
marker moves. If you select a new course, the picture resets to display the
new course upwards.
 Loading...