

Page 1

hsb
2
PLUS Series
Fishfinders
Owner’s
Handbook
Document number: 81195_2
Date: August 2002
Page 2

Page 3

2
hsb
Plus Series Fishfinders iii
hsb
2
Plus Series Fishfinders
Owner’s Handbook
August 2002
Intended Use
Raymarine
fishfinding. The combined Fishfinder/Chartplotter devices are intended for
recreational fishfinding and course chartplotting. The optional chartplotter
function is intended as an aid to navigation and should not be relied upon as a
substitute for official navigation charts.
SAFETY NOTICES
This equipment must be installed and operated in accordance with the
instructions contained in this manual. Failure to do so can result in personal
injury and/or navigational inaccuracies. In particular:
1. HIGH VOLTAGE. The LCD display unit contains high voltages.
Adjustments require specialized service procedures and tools only available
to qualified service technicians – there are no user serviceable parts or
adjustments. The operator should never remove the display unit cover or
attempt to service the equipment.
2
hsb
Plus Series Fishfinders are intended for recreational
2. NAVIGATION AID. The chartplotter unit is only an aid to navigation. Its
accuracy can be affected by many factors, including equipment failure or
defects, environmental conditions, and improper handling or use. It is the
user’s responsibility to exercise common prudence and navigational
judgements. This unit should not be relied upon as a substitute for such
prudence and judgement.
EMC Conformance
All Raymarine equipment and accessories are designed to the best industry
standards for use in the recreational marine environment.
The design and manufacture of Raymarine equipment and accessories
conform to the appropriate Electromagnetic Compatibility (EMC) standards,
but correct installation is required to ensure that performance is not
compromised.
Page 4

iv
Preface
2
hsb
Plus Series Fishfinders
This handbook describes the following Raymarine
2
hsb
Plus Series Fishfinder
Displays:
• L755RC Plus 7" Monochrome LCD Fishfinder Display with Chartplotter
• L760 Plus 7" Color LCD Fishfinder Display
• L760RC Plus 7" Color LCD Fishfinder Display with Chartplotter
• L1250 Plus 10.4" Color LCD Fishfinder Display
• L1250RC Plus 10.4" Color LCD Fishfinder Display with Chartplotter
The combined Fishfinder/Chartplotter display units include a cartridge holder
assembly that contains two slots for C-MAP NT or NT+ chart cards.
Fishfinder systems require an appropriate Raymarine transducer unit and
inter-connecting cable. Details for selecting and installing the transducer are
described in document number 81196, Transducers for Fishfinders Owner’s
Handbook.
This handbook contains very important information on the installation and
operation of your new fishfinder. In order to obtain the best results in operation
and performance, please read this handbook thoroughly.
Raymarine’s Technical Services representatives or your local dealer will be
available to answer any questions you may have.
TFT LCD Displays
The colors of the display may seem to vary when viewed against a colored
background or in colored light. This is a perfectly normal effect that will be
seen with all color LCD displays.
In common with all Thin Film Transistor (TFT) LCD displays, the screen may
exhibit a few (less than 20) wrongly illuminated pixels. These may appear as
black pixels in a light portion of the screen, or as colored pixels in black areas.
CAUTION:
To provide protection against the damaging effects of UV light, it is
advisable to replace the sun cover provided when the color LCD display is
not in use.
Page 5

2
hsb
Plus Series Fishfinders v
Raymarine Products and Services
Raymarine products are supported by a network of Authorized Service
Representatives. For information on Raymarine products and services,
contact either of the following:
United States Raymarine, Inc.
22 Cotton Road, Unit D
Nashua, NH 03063-4219
USA
Telephone: 1-603-881-5200
1-800-539-5539
Fax: 1-603-864-4756
Europe Raymarine Ltd
Anchorage Park
Portsmouth, Hampshire
England PO3 5TD
Telephone: +44 (0) 23 9269 3611
Fax: +44 (0) 23 9269 4642
Or, you may contact us on the World Wide Web at www.raymarine.com.
Warranty
To register your
minutes to fill out the warranty registration card found at the end of this
handbook. It is very important that you complete the owner information and
return the card to the factory in order to receive full warranty benefits.
Technical Accuracy
The technical and graphical information contained in this handbook, to the
best of our knowledge, was correct as it went to press. However, the
Raymarine policy of continuous improvement and updating may change
product specifications without prior notice. As a result, unavoidable
differences between the product and handbook may occur from time to time,
for which liability cannot be accepted by Raymarine.
2
hsb
Plus Series display unit ownership, please take a few
Page 6

vi
2
hsb
Plus Series Fishfinders
Raymarine is a registered trademark of Raymarine Limited.
SeaTalk is a registered trademark of Raymarine Limited.
2
hsb
is a trademark of Raymarine Limited.
Pathfinder Plus is a trademark of Raymarine Limited.
This product contains technology provided under license by Acorn Group plc.
The copyright of this intellectual property is acknowledged by Raymarine,
Inc. as are Acorn’s trademarks and patents. Acorn’s world wide web address is
http://www.acorn.com.
© Raymarine, Inc. 2002
Page 7

Contents vii
Contents
EMC Conformance ......................................................................... iii
Warranty .......................................................................................... v
Chapter 1: Overview ......................................................................................... 1-1
1.1 Introduction .................................................................................. 1-1
General ..........................................................................................1-4
Introduction to
Display Unit Features ................................................................... 1-5
Operating Modes ..........................................................................1-6
1.2 The Fishfinder Display .................................................................1-8
Fishfinder Options ........................................................................ 1-9
Fishfinder Functions ................................................................... 1-10
2
hsb
Systems ......................................................... 1-5
1.3 The Chartplotter Display ............................................................ 1-12
Chartplotter Display Options ...................................................... 1-13
Chartplotter Functions ................................................................ 1-15
1.4 Operating Controls .....................................................................1-16
Trackpad and Cursor ...................................................................1-17
Dedicated Keys ...........................................................................1-19
Soft Keys .....................................................................................1-19
Pop-Up Menus ............................................................................1-20
Database Lists ............................................................................. 1-21
Chapter 2: Installation ..................................................................................... 2-1
2.1 Introduction .................................................................................. 2-1
Planning the Installation ............................................................... 2-3
EMC Installation Guidelines ........................................................ 2-3
2.2 Unpacking and Inspecting the Components ................................. 2-5
2.3 Selecting the Equipment Location ................................................ 2-7
2.4 Cable Runs .................................................................................. 2-11
Display Unit Mounting Location .................................................. 2-7
Power Cable ................................................................................ 2-11
Transducer Cable ........................................................................ 2-11
Page 8

viii
2
hsb
Plus Series Fishfinders
2.5 Mounting the Display Unit ......................................................... 2-12
2.6 System Connections ...................................................................2-14
Display Unit Connection ............................................................ 2-15
EMC Conformance ..................................................................... 2-18
2.7 Integrated Systems ......................................................................2-18
High Speed Bus (
2
hsb
) ................................................................2-19
SeaTalk and NMEA In ................................................................ 2-22
Using the SeaTalk Auxiliary Junction Box .................................2-26
Data Output ................................................................................. 2-28
Data Conversion ......................................................................... 2-28
2.8 Integrated System Checks .......................................................... 2-29
Chart Display .............................................................................. 2-29
Received Data ............................................................................. 2-29
Transmitted Data ........................................................................2-29
Chapter 3: Getting Started & Adjusting the Display ................................... 3-1
3.1 Introduction .................................................................................. 3-1
Conventions Used ......................................................................... 3-1
Simulator ......................................................................................3-1
3.2 Switching the Display On and Off ................................................ 3-2
Simulator Mode ............................................................................ 3-5
Changing the Lighting & Contrast (Monochrome LCD) ............. 3-6
Changing the Brightness & Color Settings (Color LCD) ............. 3-6
3.3 Controlling the Display .................................................................3-9
Selecting the Mode of Operation .................................................. 3-9
3.4 Fishfinder Display Control Functions ........................................ 3-15
Viewing Data Boxes ...................................................................3-15
Changing the Scroll Speed ..........................................................3-15
Selecting the Power Setting ........................................................3-17
Changing the Fishfinder Range .................................................. 3-17
Selecting the Frequency .............................................................. 3-20
3.5 Chart Display Control Functions (Raychart Models) ................. 3-26
Using Bottom Lock .....................................................................3-21
Using A-Scope ............................................................................3-23
Using Zoom ................................................................................ 3-24
Customizing the Screen Presentation Options ............................ 3-26
Page 9

Contents ix
Moving Around the Chart ........................................................... 3-28
Chapter 4: Fishfinder Operations ................................................................... 4-1
4.1 Introduction .................................................................................. 4-1
4.2 Interpreting and Adjusting the Fishfinder Image ..........................4-1
Fish Indications ............................................................................. 4-2
Bottom Indications .......................................................................4-3
Using White Line .......................................................................... 4-4
Adjusting Display Gain (Sensitivity) ........................................... 4-4
4.3 Fishfinder Data Window ...............................................................4-7
4.4 Using Alarms ................................................................................ 4-8
4.5 Using VRM to Determine Depth & Distance from Boat .............. 4-9
4.6 Waypoints ................................................................................... 4-11
Placing a Waypoint ..................................................................... 4-11
4.7 MOB ........................................................................................... 4-13
Chapter 5: Standard Chart Operations .......................................................... 5-1
5.1 Introduction .................................................................................. 5-1
5.2 Using Chart Cards ......................................................................... 5-2
Inserting a Chart Card ................................................................... 5-2
Removing a Chart Card ................................................................ 5-3
Displaying the Chart Data .............................................................5-3
Displaying Chart Object and Source Information ........................5-4
5.3 Working with Waypoints .............................................................. 5-8
Introduction ..................................................................................5-8
Placing a Waypoint ....................................................................... 5-9
Selecting a Waypoint ..................................................................5-12
Waypoint Data Display ............................................................... 5-13
Editing the Waypoint Details ......................................................5-13
5.4 Working with Routes .................................................................. 5-18
Erasing a Waypoint ..................................................................... 5-15
Moving a Waypoint .................................................................... 5-15
Using the ST60 or ST80 Navigator Keypad ...............................5-16
Creating a New Route .................................................................5-19
Saving the Current Route ............................................................5-22
Page 10

x
2
hsb
Plus Series Fishfinders
Clearing the Current Route ......................................................... 5-24
Retrieve a Route From the Database ........................................... 5-24
Displaying Route Information .................................................... 5-25
Using the Route List to Erase and Name a Route ....................... 5-27
Editing a Route ...........................................................................5-28
5.5 Following Routes and Going to Points ....................................... 5-30
Follow a Route ............................................................................ 5-30
Target Point Arrival .................................................................... 5-31
Other Follow Route Options .......................................................5-32
Going To an Individual Target Point ........................................... 5-33
Stop Follow or Stop Goto ............................................................ 5-34
5.6 Transferring Waypoints and Routes ...........................................5-35
5.7 Using Tracks ............................................................................... 5-39
Setting Up a Track ...................................................................... 5-40
Clearing the Current Track ......................................................... 5-40
Managing Tracks ........................................................................5-40
SmartRoute .................................................................................5-42
5.8 Typical Chart Scenarios ..............................................................5-43
Place and Goto a Waypoint ......................................................... 5-44
Make and Follow a Route ...........................................................5-46
Review Your Passage Plan .......................................................... 5-48
Chapter 6: Further Chart Operations ............................................................. 6-1
6.1 Introduction .................................................................................. 6-1
6.2 Measuring Distances Using the VRM/EBL Key .......................... 6-2
6.3 Alarms and Timers ........................................................................ 6-4
Alarm Reporting ........................................................................... 6-4
Setting Alarms and Timers ........................................................... 6-5
6.4 Man Overboard (MOB) ................................................................ 6-6
6.5 Cursor Echo .................................................................................. 6-7
6.6 Radar Overlay ............................................................................... 6-7
6.7 GPS Setup ..................................................................................... 6-9
6.8 Data Log Mode ........................................................................... 6-10
Page 11

Contents xi
Chapter 7: Setting Up the System Defaults .................................................. 7-1
7.1 Introduction .................................................................................. 7-1
7.2 Changing the Set Up Parameters .................................................. 7-2
7.3 System Set Up Parameters ............................................................ 7-4
Data Boxes .................................................................................... 7-6
Bearing Mode ............................................................................... 7-6
Cursor Reference ..........................................................................7-6
Cursor Readout ............................................................................. 7-7
Day/Night (Monochrome Display only) ...................................... 7-7
Help ...............................................................................................7-7
Soft Keys .......................................................................................7-7
Key Beep ...................................................................................... 7-7
MOB Data ..................................................................................... 7-8
Autopilot Pop Up .......................................................................... 7-8
Menu Timeout Period ................................................................... 7-8
Units ..............................................................................................7-8
Variation Source ........................................................................... 7-8
Bridge NMEA Heading ................................................................ 7-9
NMEA-Out Set Up .......................................................................7-9
Cursor Echo (Systems with Radar Display) ............................... 7-11
Date and Time Settings ............................................................... 7-11
GPS SOG/COG Filter ................................................................. 7-11
Compass Set Up .......................................................................... 7-12
Language ....................................................................................7-12
Simulator ....................................................................................7-12
7.4 Fishfinder Set Up Parameters ..................................................... 7-13
Target Depth ID ..........................................................................7-13
Color Bar .....................................................................................7-13
Depth Digit Size ..........................................................................7-14
Sonar HSB Mode ........................................................................ 7-14
Depth Offset ................................................................................7-14
Speed Calibrate ........................................................................... 7-14
Temperature Calibrate ................................................................ 7-14
Sonar History ..............................................................................7-14
Depth Range (L1250 Plus and L1250RC Plus only) .................. 7-15
Sonar Simulator ..........................................................................7-15
Page 12

xii
2
hsb
Plus Series Fishfinders
7.5 Chart Set Up Parameters (Raychart Models) ..............................7-16
Customize Chart .........................................................................7-16
Plotter Mode ...............................................................................7-17
Chart Orientation ........................................................................ 7-17
Object Information ..................................................................... 7-18
Palette (Color LCDs only) .......................................................... 7-18
Waypoint Options ....................................................................... 7-18
Vectors ........................................................................................ 7-18
Radar/Chart Synch (Systems with Radar Display) ..................... 7-19
Datum Selection ......................................................................... 7-19
Position Offset ............................................................................7-19
Chapter 8: Maintenance and Problem Solving ............................................. 8-1
8.1 Maintenance ................................................................................. 8-1
Routine Checks ............................................................................. 8-1
Cleaning Instructions .................................................................... 8-1
EMC Servicing and Safety Guidelines .........................................8-2
8.2 Resetting the System ..................................................................... 8-3
8.3 Problem Solving ........................................................................... 8-4
How to Contact Raymarine ..........................................................8-5
Worldwide Support ....................................................................... 8-7
Appendix A: Specifications ...............................................................................A-1
2
hsb
Plus Series Fishfinder Displays ............................................ A-1
Appendix B: Using the Auxiliary Junction Box ................................................B-1
Raystar 112, 105, Apelco 182 and 182XT ................................... B-2
Autohelm GPS, Z260 and Z273 .................................................. B-3
Raystar 112LP (SeaTalk version) ................................................ B-4
Raystar 114 Combined GPS and Differential Beacon Receiver .. B-5
Raystar 120 WAAS Satellite Differential Receiver ..................... B-6
Appendix C: C-MAP Chart Card Features ........................................................C-1
Appendix D: SeaTalk and NMEA Data ..............................................................D-1
Appendix E: Abbreviations ............................................................................... E-1
Page 13

Chapter 1: Overview 1-1
Chapter 1: Overview
1.1 Introduction
This handbook describes the following
2
hsb
(High Speed Bus) Plus Series
Fishfinder displays:
Fishfinder Display Type Display Size Chartplotter
L755RC Plus Monochrome LCD 7 inch Yes
L760 Plus
L760RC Plus
L1250 Plus
L1250RC Plus
Raymarine
hsb
Color LCD
Color LCD
Color LCD
Color LCD
2
Plus Series Fishfinders use the latest processor and sonar
7 inch
7 inch
10.4 inch
10.4 inch
No
Ye s
No
Ye s
technology for accurate performance and echo detection. Units feature 7" or
10.4" daylight viewable monochrome or color LCD displays and the
Raychart (RC) models include a full C-Map NT/NT+ Chartplotter. With up to
600 watts output power and dual frequency operation,
2
hsb
Plus Series
Fishfinders provide performance from 1 up to 3000 ft. In fact, the L1250 Plus
and L1250RC Plus units offer 1000 watts power and a depth range up to 5000
ft.
Introduction
Use the High Speed Bus (
2
hsb
), SeaTalk and NMEA interfaces to provide an
integrated system with additional devices, such as Pathfinder Plus Radar,
Raymarine Autopilot and Raystar Wide Area Augmentation System (WAAS)
GPS products.
Connecting an
Radar and to an
2
hsb
Series Plus Fishfinder to an
2
hsb
Series Plus Chartplotter enables fishfinder, radar, and
2
hsb
Series Pathfinder Plus
chart data to be displayed on all three units. Similarly, chart data can be
repeated on a fishfinder-only device from any via
2
hsb
from any other
hsb
2
device with chart capabilities.
This handbook describes the display unit controls and details both fishfinder
and chart operations. Controls that are specific to either fishfinder or
chartplotter are described in fishfinder or chart sections/chapters.
Note: Many illustrations in this handbook show example screens. The screen
you see on your display depends on your system configuration and set up options, so it may differ from the illustration.
Page 14

1-2
2
hsb
Plus Series Fishfinders
Introduction
How to Use This Handbook
If you are installing the display system yourself, you should read Chapter 2
before you start the installation. This chapter also provides information that
will be useful if you are connecting your
equipment.
For an overview of the display unit controls, the fishfinder and the chartplotter
systems, read Chapter 1. Chapter 3 will help you start using your system.
For detailed information on fishfinder operations refer to Chapter 4.
For chartplotter operating details, refer to Chapter 5 and Chapter 6.
To change the system set up defaults, read Chapter 7.
Chapter 2 provides planning considerations and detailed instructions for
installing the fishfinder display unit. It should be referred to when you are
ready to install the system. Details to connect the display to other equipment
2
hsb
via
, NMEA and SeaTalk are also provided.
Chapter 3 explains how to start using the display and describes how to use
some of the basic fishfinder and chart functions. Chapter 3 also provides
operating guidelines for typical chartplotter scenarios; these guidelines
introduce you to many of the chartplotter functions.
2
hsb
Plus Series system to other
Chapters 4 provides detailed operating information for the fishfinder
functions - selecting depth range limits, adjusting gain, color and STC, setting
alarms, using the VRM marker, marks and man overboard.
Chapter 5 provides detailed operating information for the standard
chartplotter functions - using chart cards, plotting waypoints and routes,
following routes and showing tracks.
Chapter 6 provides detailed operating information for further chart functions,
including measuring distances, man overboard and cursor echo. It includes
instructions for setting up a differential GPS.
Chapter 7 provides instructions for setting up your system to suit your
preferences. You should read this chapter to determine how to set up the
fishfinder and chartplotter system defaults.
Chapter 8 provides information on user maintenance, and what to do if you
experience problems.
The Appendices provide additional information that you may find useful:
Appendix A lists the technical specifications for the fishfinder and for the
chartplotter.
Appendix B provides details on connecting the display unit to specific GPS
systems.
Page 15

Chapter 1: Overview 1-3
Appendix C defines the chart features shown on the chart display.
Appendix D defines the SeaTalk and NMEA data that is transferred on
integrated systems.
A List of Abbreviations, Index and warranty information are included at the
end of the handbook.
A summary of the fishfinder and chartplotter controls are provided on the
Quick Reference Cards supplied with your system.
Terminology
The following terminology is used to describe the various display unit
configurations:
Master A unit capable of sourcing specific data such as
fishfinder, chart, or radar data.
Repeater A unit capable of displaying data, such as radar,
from the High Speed Bus.
Fishfinder Display Unit providing Fishfinder Master and Radar
Repeater functionality. The L755RC, L760RC,
and L1250RC Plus displays also provide Chart
Master functionality.
Radar Display Unit providing Radar Master, Fishfinder
Repeater and Chart Reader functionality.
Introduction
Chart Display Unit providing Chart Master, Fishfinder
Repeater and Radar Repeater functionality.
Combined Display Unit providing both Fishfinder and Chart or
Radar and Radar Repeater functionality.
Integrated System Additional instruments are connected via
hsb
SeaTalk or NMEA interfaces.
hsb
2
High Speed Bus- links up to ten compatible display units. For full display and control between
2
hsb
Plus Series display units, the units must be
connected via
2
hsb
and SeaTalk.
2
,
Page 16
General
1-4
General
2
hsb
Plus Series Fishfinders
The
2
hsb
Plus Series Fishfinder system, illustrated below, is comprised of the
7" or 10.4" LCD display unit, fishfinder transducer, and associated cables.
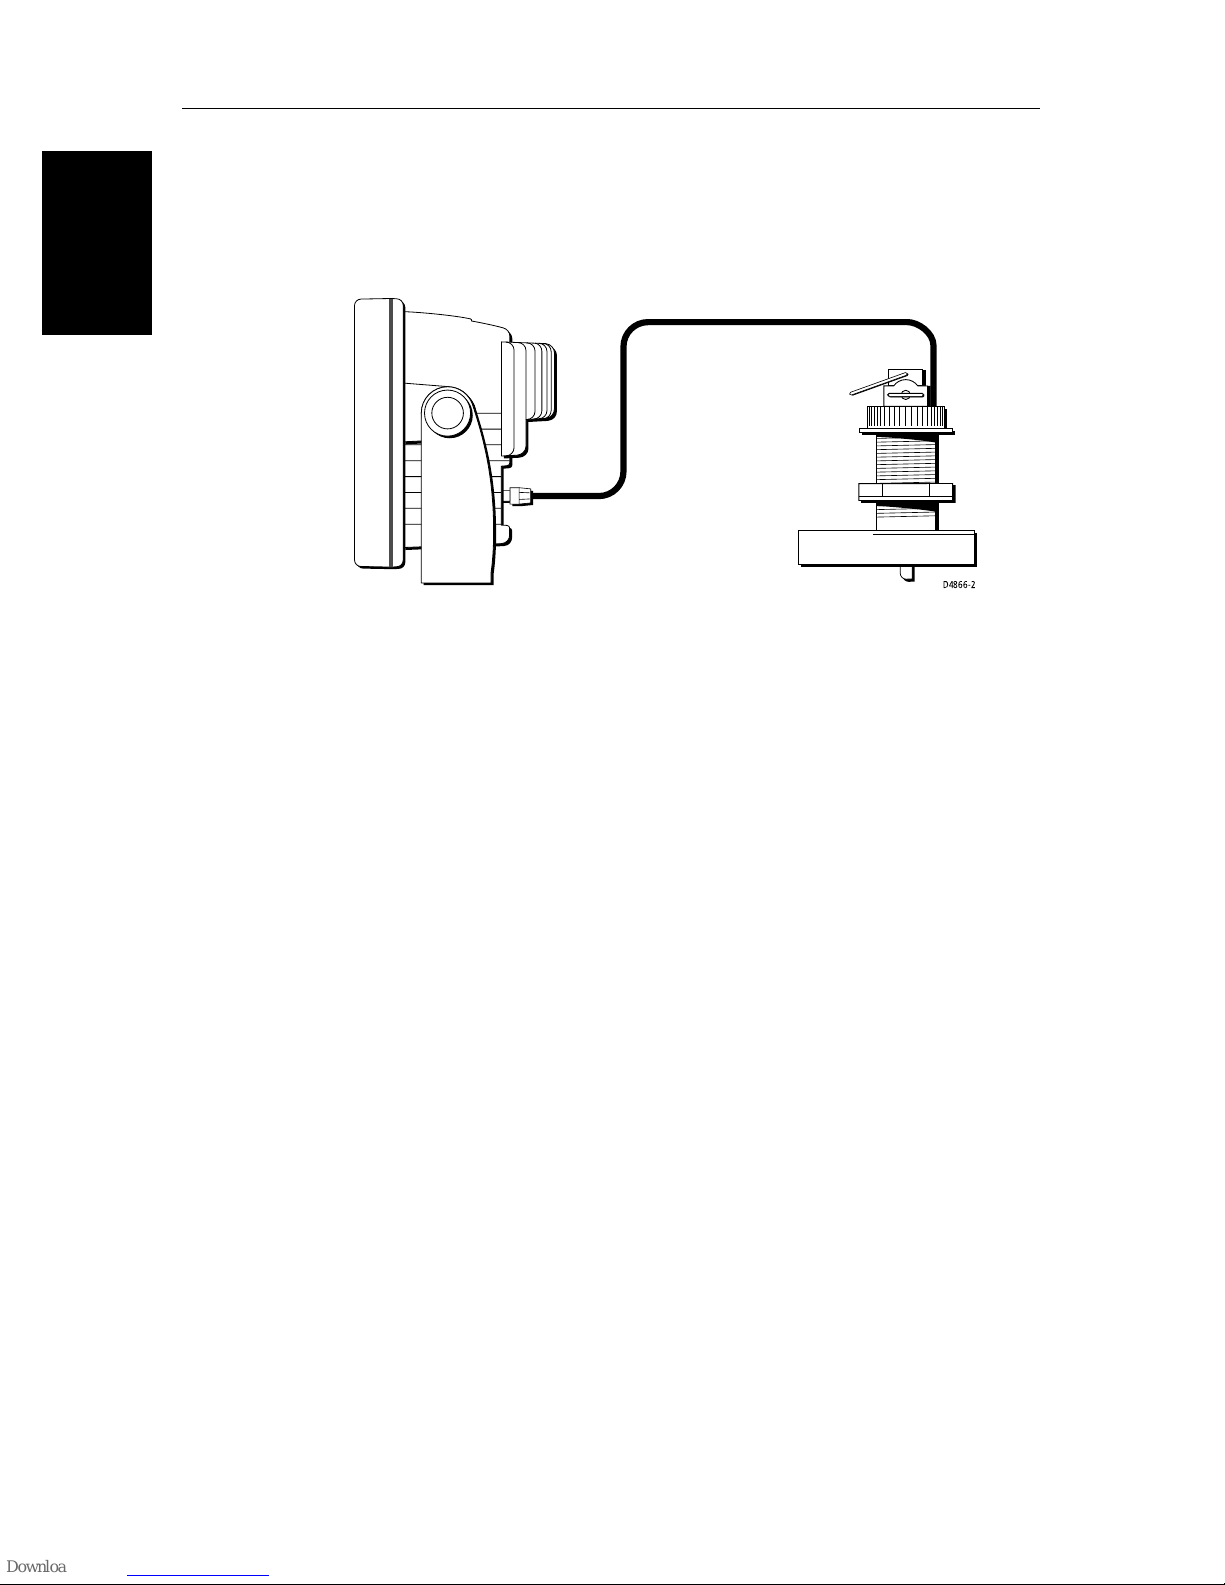
D4866-2
Figure 1-1: Basic Fishfinder System
Display Unit
The
installed either above or below deck.
The unit includes:
• 7" or 10.4" LCD display
• Trackpad
• Eleven dedicated (labeled) control keys
• Four soft keys (unlabeled) whose functionality changes
• Two slots for the C-MAP NT
The display and keys can be illuminated for night-time use.
2
hsb
Plus Series LCD display unit is waterproof to CFR46 and can be
®
or NT+ chart cards (Raychart models only)
Transducer
The
or transom-mount.
Transducers can measure water depth, temperature, distance traveled, and/or
speed. It is important to position your transducer correctly. For details on
transducers, including location and installation instructions, see document
number 81196, Transducers for Fishfinders Owner’s Handbook.
2
hsb
Plus Series Fishfinders require a transducer, either thru-hull, in-hull,
Note: If speed and temperature are being input via SeaTalk, these values are
displayed instead of the speed and temperature inputs from the transducer.
Page 17

Chapter 1: Overview 1-5
Introduction to
The
compatible units. For example, fishfinder data is transferred from the
fishfinder (the master display) via the
and controlled on any other
display). However, if you change, say, depth range on one display, it affects all
displays showing fishfinder or fishfinder/chart overlay.
In particular, you can connect your
Series Pathfinder Plus Radar and then to a remote
to provide fishfinder, chart, and radar functionality on all three displays.
Full functionality of the fishfinder is achieved when it is part of an integrated
system, with other equipment (in addition to other
via SeaTalk or NMEA 0183. Data from this equipment including position and
heading is displayed on the display and is used in calculations.
It is possible to connect up to ten
provide an integrated system. Earlier HSB (non-Plus) Display units can be
upgraded to provide
Displays on page 2-20 for details.
2
hsb
(High Speed Bus) connection enables transfer of data among
hsb
2
Systems
2
hsb
connection and can be displayed
2
hsb
Plus Series LCD or CRT display (the repeater
2
hsb
Series Plus Fishfinder to a remote
2
hsb
Series Plus Chartplotter
2
hsb
Plus units) connected
2
hsb
Plus Series LCD or CRT displays to
2
hsb
compatibility. See Connecting hsb2 Plus Series
hsb
hsb2 Systems
Introduction to
2
Note: Please contact Raymarine Customer Service or your authorized Raymarine dealer about upgrading your existing HSB (non-Plus) display units to
provide full
2
hsb
The
2
hsb
Plus functionality.
system can include several chartplotter displays, each with two chart
cartridge slots. Each display can access two local and up to six remote chart
cartridges. Charts can be controlled independently on each display, even when
a remote chart cartridge is being used. Details on connecting the equipment
are given in Chapter 2.
Display Unit Features
Fishfinder
• Displays depth, speed, and temperature, if the transducer is so equipped
• Dual or split frequency fishfinder display – 50 kHz, 200 kHz
• Display options – fishfinder window, zoom, bottom lock and A-Scope
• Uses position data from GPS, DGPS, WAAS or Loran-C technology
• Displays and transfers
• Provides full control of data from other
2
hsb
, SeaTalk and NMEA data
2
hsb
instruments
• Half-screen windows to display additional data: depth/temperature graph,
Course Deviation Indicator (CDI), Bearing and Distance Indicator (BDI),
navigation data
Page 18

1-6
2
hsb
Plus Series Fishfinders
Operating Modes
Chartplotter
• Displays information from the C-MAP NT® and NT+ chart cards
(C-Cards)
• Three full-screen operating modes: Fishfinder, Chart, Data Log (if appro-
priate data is available)
• View fishfinder and chart simultaneously
• Choice of chart orientation: Head Up, Course Up and North Up
Operating Modes
If you have a combined Fishfinder/Chartplotter unit, or have an
Series Chartplotter connected to a Fishfinder, three full-screen modes –
fishfinder, chart and data log are available; you select the operating mode
using the DISPLAY key as described in Chapter 3.
You can also set Windows On to split the display into two half-screen windows
to show supplementary data, or to display fishfinder and chart simultaneously.
The main operating mode (fishfinder or chart) is displayed in the upper
window; you choose what is displayed in the lower window.
In addition, if you have an
connected, you can set the display to radar mode; this provides similar
functionality to a combined Pathfinder Radar/Chartplotter.
2
hsb
Series Pathfinder Plus Radar display
hsb
2
Plus
If you only have an L760 Plus or L1250 Plus fishfinder-only unit connected,
only fishfinder mode is available.
Page 19

Chapter 1: Overview 1-7
Half -Screen Window Options
The following information, if available on your system, can be shown:
Table 1-1: Window Options for Combined/Integrated Systems
Full-screen
mode
Fishfinder Mode Depth/temp, Chart, CDI, BDI, or Data Depth/temp, Chart or CDI, BDI
Chart Mode CDI, BDI, Nav Data or Fishfinder CDI, BDI, Nav Data, Fishfinder or
Radar Mode Not Available CDI, BDI, Chart or Nav Data
Data Log Mode Half-screen Windows not available Windows not available
Half-screen Window Options Fishfinder/Chart Display only
Half-screen Window Options Fish/Chart + Radar Displays
Radar
• Chart display (when in Fishfinder or Radar mode)
Fishfinder display (when in Chart mode):
Radar display (when in Chart mode):
If data is available, either as a function of the combined display unit or via
the
2
hsb
link, it can be displayed.
• Depth/temp graph (Fishfinder mode): This shows a plot water tempera-
ture and depth against time.
• Data (Fishfinder mode): This option splits the fishfinder vertically. The
left hand window displays data boxes; there are three different sets of data
(A, B and C) that you can select for display.
Operating Modes
• CDI: This gives the Course Deviation Indicator graphical display, with
data relating to the target waypoint.
• BDI: This gives the Bearing and Distance Indicator graphical display, with
data relating to the target waypoint.
• Nav Data (Chart mode): This shows sixteen data boxes, providing navi-
gational data in the units specified in your set up. Note that up to 6 of these
data boxes are also available as a user-selectable group (see Section 7.3).
For details on the radar, refer to the Owner’s Handbook supplied with your
radar.
Note: MARPA functionality is available on the fishfinder display if you have
an integrated system with a Pathfinder radar master display that includes
MARPA as a primary function.
Details on selecting windows are given in Chapter 3.
Page 20

1-8
1.2 The Fishfinder Display
The Fishfinder
Display
When you first turn the display unit on and select fishfinder mode, the
2
hsb
Plus Series Fishfinders
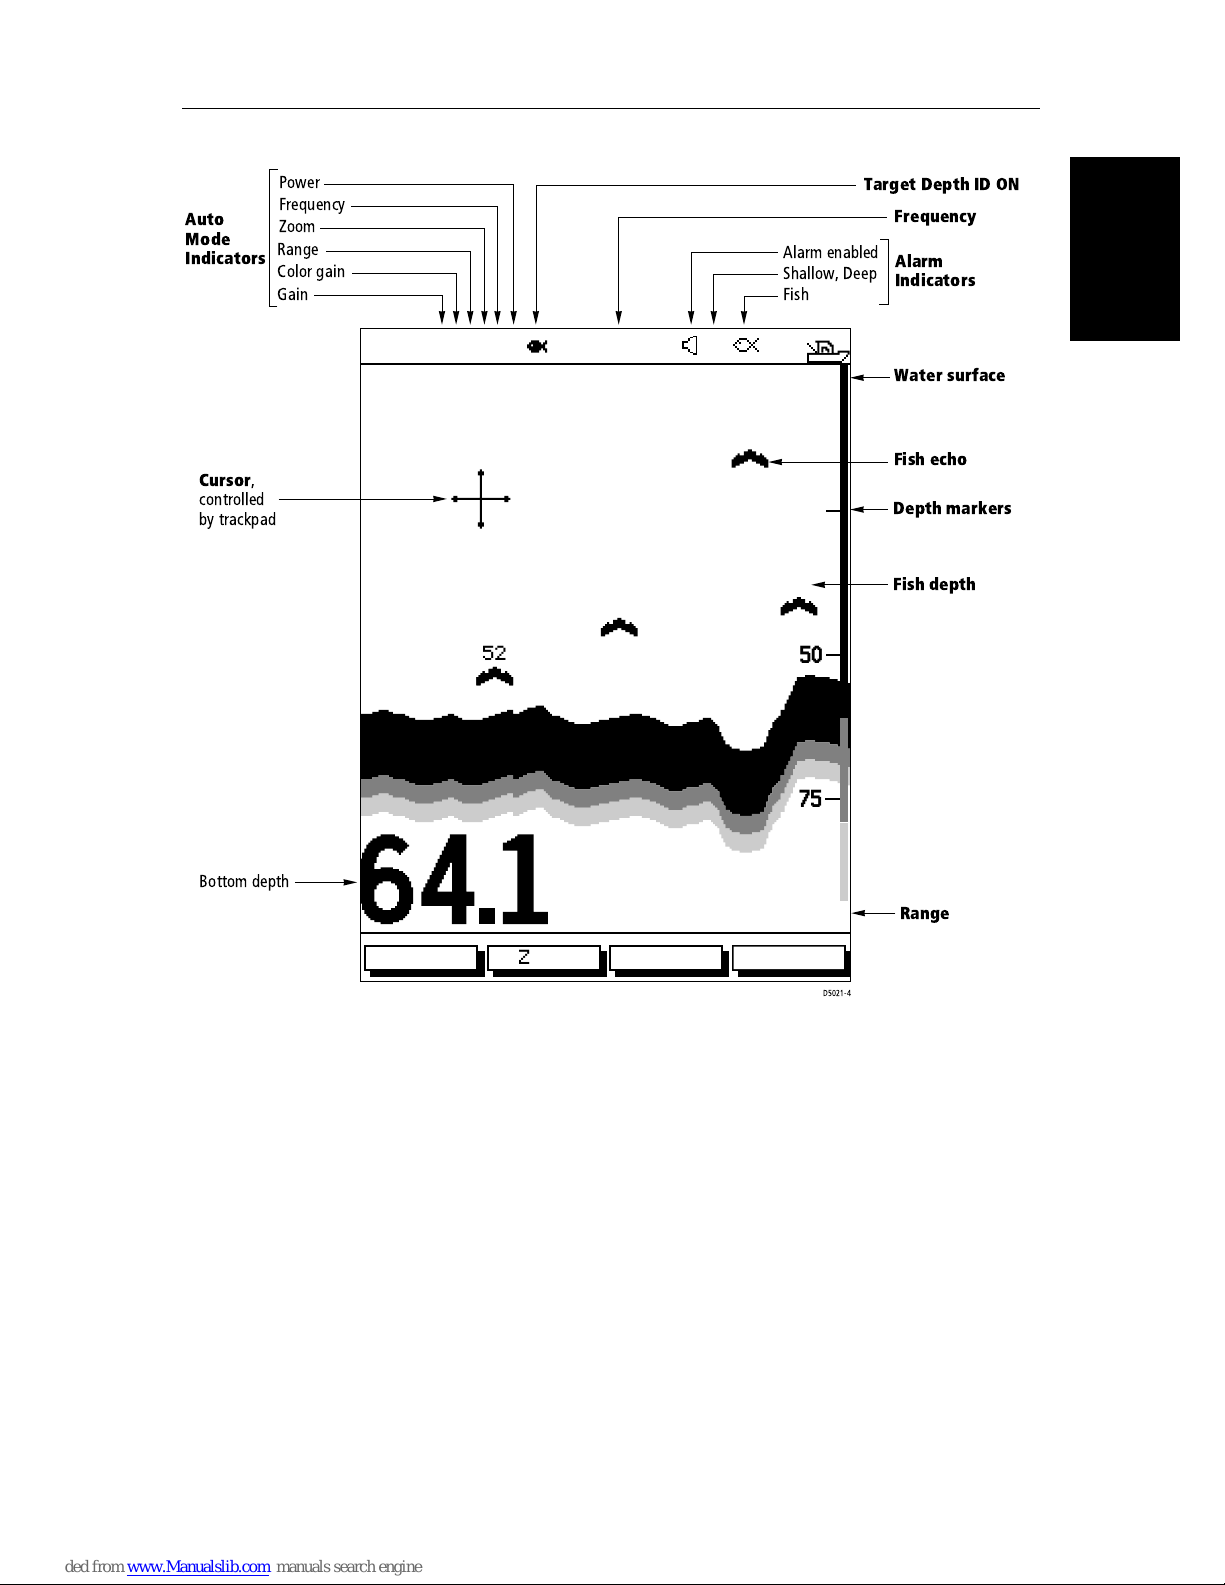
scrolling bottom graph is displayed. This is a graphical representation of the
echoes seen by the Fishfinder. As time passes, this display scrolls from right to
left and becomes a record of the echoes seen. A typical display is shown in
Figure 1-2.
The images at the right hand side of the display are the most recent echoes.
Some echoes indicate fish, and others show the bottom. It can also indicate
bottom structures, such as a reef or shipwreck. The upper and lower depth
range limits are shown.
The fishfinder screen includes a status bar that displays transducer frequency
and indicates which auto settings are enabled (Gain, Color Gain, Range,
Zoom and Frequency), and alarm status (fish and shallow/deep water depths).
You can customize the fishfinder by choosing what is displayed and how it is
displayed (including language and units). For example, you can set the scroll
speed of the bottom graph display, and you can select the range to adjust the
amount of detail displayed.
You can view the cursor position and a variety of data (such as speed, heading
and depth) from the transducer and other equipment in user-selectable data
boxes. These data boxes can be moved around the screen and they can be
switched on or off.
Chapter 3 includes details on adjusting the display, other set up options are
described in Section 7.3 and Section 7.4.
Page 21
Chapter 1: Overview 1-9
"#
!
$
AUTO GCRZFH
50kHz
%#
&
SD
8
25
0
Fishfinder Options
Figure 1-2: Typical Fishfinder Display
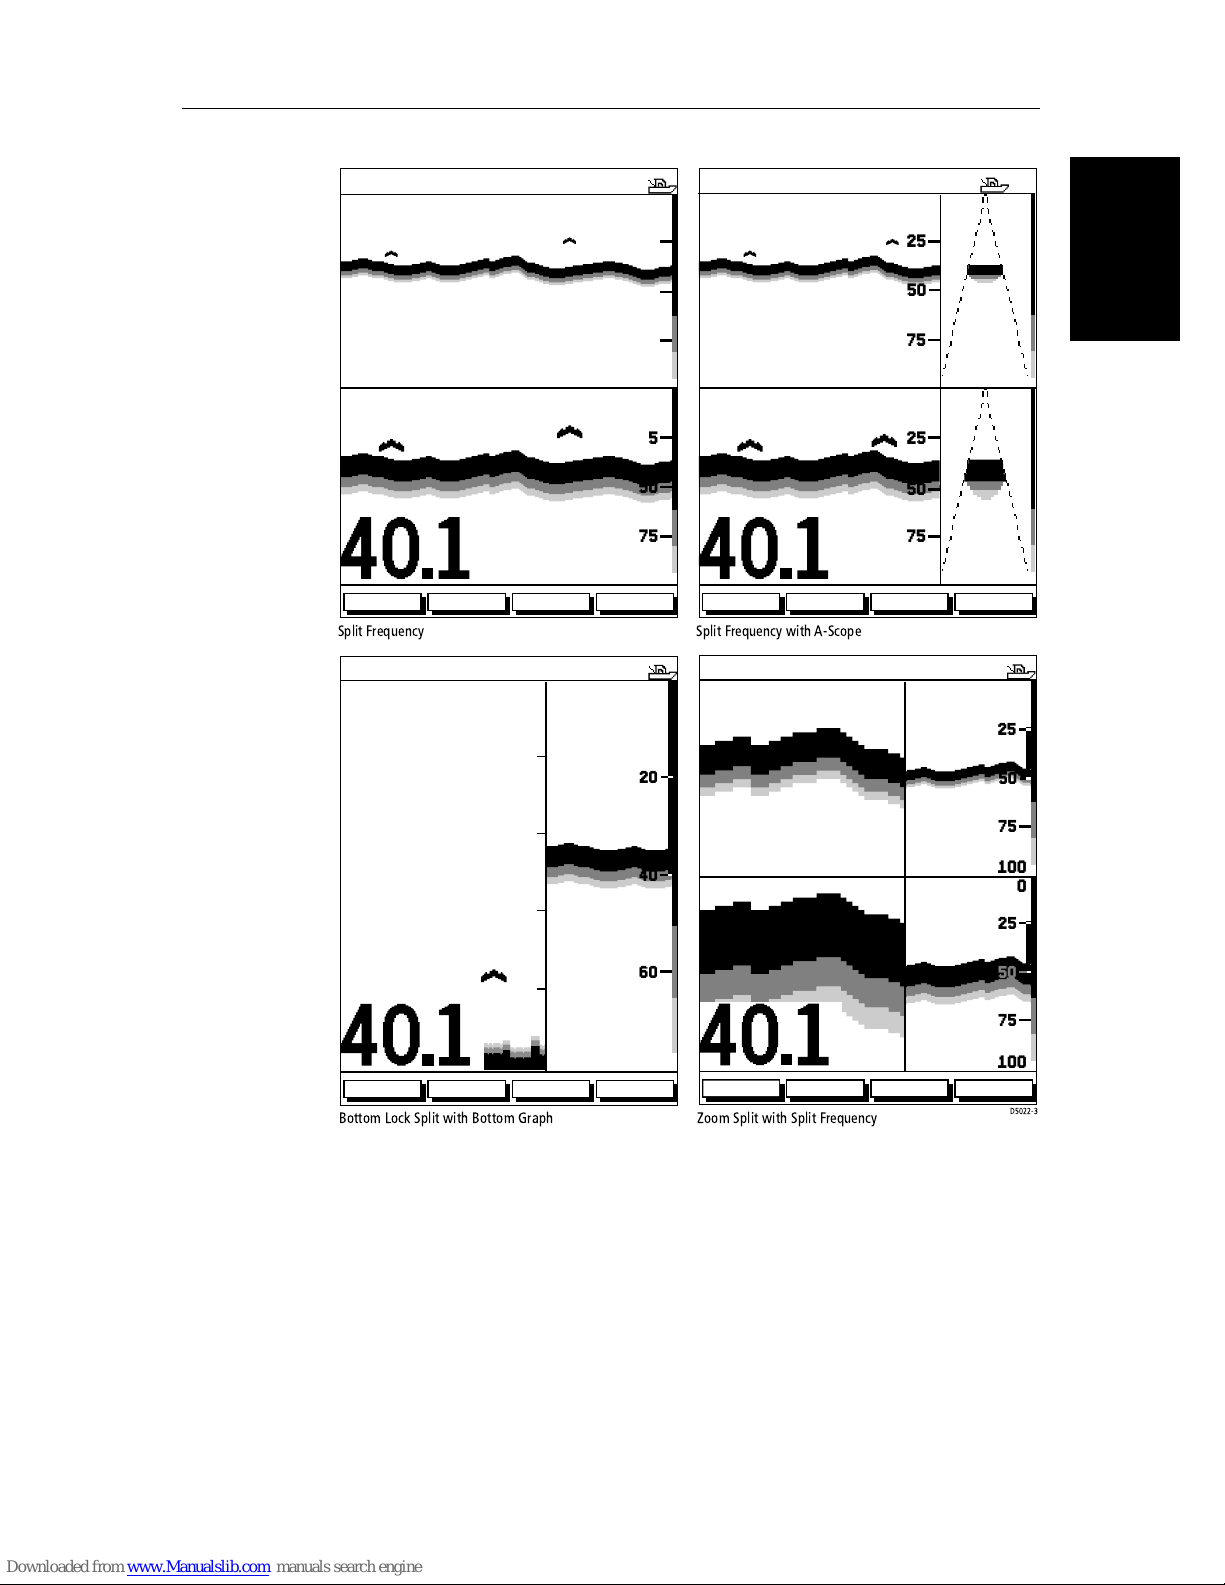
Fishfinder Options
The fishfinder provides controls to select additional modes:
52
38
45
50
75
ft
ZOOMFREQUENCY
BTM.LOCK A-SCOPE
100
• Frequency – you can select the transducer frequency, 50 kHz for wide cov-
erage and deep water, 200 kHz for a detailed view, both frequencies simultaneously or auto-frequency. The default setting is auto-frequency, which
determines the optimum frequency of operation based on the current
depth.
• Bottom Lock – changes the operating mode to re-set the bottom. It pro-
vides a bottom-up view: the bottom is used as the reference, its image is
flattened and depths are displayed here. Bottom lock mode is used primarily to filter-out the bottom structure and display fish details only.
Page 22

1-10
2
hsb
Plus Series Fishfinders
• A-Scope – displays a real-time image of the bottom structure and fish
Fishfinder
Functions
directly below the transducer. The A-Scope window also displays the patented Bottom Coverage width indication.
• Zoom – enlarges all or part of the bottom graph display. You can select x2,
x4 or x6 magnification and the zoom area can be automatically or manually adjusted.
You can select Zoom, Bottom Lock or A-Scope to be vertically split with the
bottom graph display. Alternatively, Zoom or Bottom Lock can be displayed
in place of the bottom graph display.
If you choose dual frequency, the scrolling bottom graph is displayed in both
frequencies, split horizontally. Zoom, Bottom Lock or A-Scope can be
displayed with the dual frequency graph.
All of these options are available when the fishfinder is displayed in a halfscreen window.
Fishfinder Functions
The
• Automatic or manual selection of scroll speed for bottom graph display
• Automatic or manual selection of transducer frequency
• Automatic or manual selection of upper and lower depth range limits
• Adjustment of foreground/background color and image color threshold
• Adjustment of Gain, Color Gain and STC
• Set up alarms for Fish, Shallow water and Deep water
• VRM marker to determine depth and distance
• Add marks to record important or dangerous locations
• Man Overboard (MOB) to navigate back to a person or object
Operation of these fishfinder functions is described in Chapter 3 and
Chapter 4.
2
hsb
Plus Series Fishfinder includes the following functions:
(contrast control on the L755RC Plus monochrome display)
Page 23
Chapter 1: Overview 1-11
AUTO G Z
35
SPLIT
25
25
50
0
AUTO G Z
35
SPLIT
25
0
25
50
Functions
Fishfinder
75
200kHz
50kHz
35
25
100
25
0
200kHz
50kHz
35
50
75
ft
ZOOMFREQUENCY
AUTO G Z
BTM.LOCK A-SCOPE
200kHz
100
AUTO G
ft
ZOOMFREQUENCY
SPLIT
0
20
20
15
200kHz
40
50kHz
10
75
100 7.9
0
25
25
50
75
100
BTM.LOCK A-SCOPE
52.3
25
50
75
100
25
0
0
6
5
ft
ZOOMFREQUENCY
BTM.LOCK A-SCOPE
60
80
X4BL
ft
ZOOMFREQUENCY
Figure 1-3: Fishfinder Display Options
50
75
100
BTM.LOCK A-SCOPE
Page 24

1-12
The Chartplotter
1.3 The Chartplotter Display
Display
The L755RC, L760RC and L1250RC Plus Fishfinders include a Chartplotter.
2
hsb
Plus Series Fishfinders
The chartplotter includes a small-scale world map and detailed navigation
information is displayed when a cartographic chart card is installed. The
details displayed depend on the chart zoom level selected. A plotter mode is
provided to enable route plotting and tracking at large scales even when a chart
card is not installed A typical chartplotter screen is shown in Figure 1-4.
Note: For an L760 Plus or L1250 Plus fishfinder-only unit to have access to
chartplotter functionality, it must be connected to an
2
hsb
Plus Series Chart-
plotter device. This is discussed fully in the section Integrated Systems on
page 2-18.
The chartplotter uses position information from a GPS, DGPS, WAAS, or
Loran-C instrument. Once the position fix has been established, your vessel’s
position, if on screen, is shown as a boat shape pointing in the direction of the
current heading (or COG if heading data is not available). If no heading or
COG data is available, the vessel is shown as a circle.
The chartplotter screen includes a status bar that displays chart scale, with
either cursor position, range and bearing or, when the cursor is homed to the
vessel (by pressing FIND SHIP), vessel position, Speed Over Ground (SOG),
Course Over Ground (COG) and fix type (VES POS, DIF FIX or SD FIX).
The status bar also indicates if radar/chart overlay is switched on.
Any waypoints you have placed are displayed (unless you turned them off in
Chart Set Up as described in Chapter 7) and the current route is shown.
Information can be viewed on-screen by positioning the cursor over a
waypoint, current route or chart object. The chartplotter screen can also show
additional information, depending on your currently selected options, set up
selections and data available from other equipment.
An example chart display, in its default configuration, with a chart card
installed, is shown in the following illustration.
Several functions are available to control the display as follows:
• Zoom in/out and Pan the Display
• Offset the Chart or Center the Chart around the Vessel
• Overlay Radar Targets onto the Chart Display
• Synchronize the Chart and Radar (if radar data is available)
Operation of these functions is described in Chapter 3.
Page 25

Chapter 1: Overview 1-13
Chartplotter Display Options
Set up options allow you to customize the chart by choosing what is displayed
(including cartographic features), how it is displayed (including language and
units), heading mode and how the chartplotter operates with other
You can also view the cursor position and a variety of data from other
equipment (for example, speed, heading, depth, wind, and tide information) in
a set of user-selectable data boxes. The cursor box and user-selected data
boxes can be moved around the screen and they can be turned on or off. You
can also obtain autopilot status and locked heading information.
Display options are provided in System Set Up and Chart Set Up as described
in Chapter 7. Chart set up options allow you to customize the chart by
selecting:
• What cartographic features and level of detail are displayed
• The chart color palette (shade or sunlight)
• Chart orientation (north up, head up or course up), datums and position off-
set
hsb
2
units.
Chartplotter
Display Options
• How waypoints are displayed (symbols and numbers) and how chart
object information is displayed
• Vectors for heading, COG and tide
In addition Screen Presentation Options, described in Chapter 3 are provided
to switch:
• Cursor Box and Databoxes On/Off
• Chart Grid On/Off
• Custom Chart Details On/Off
Note: When you turn the display off and on again, these settings are retained
in memory.
Page 26
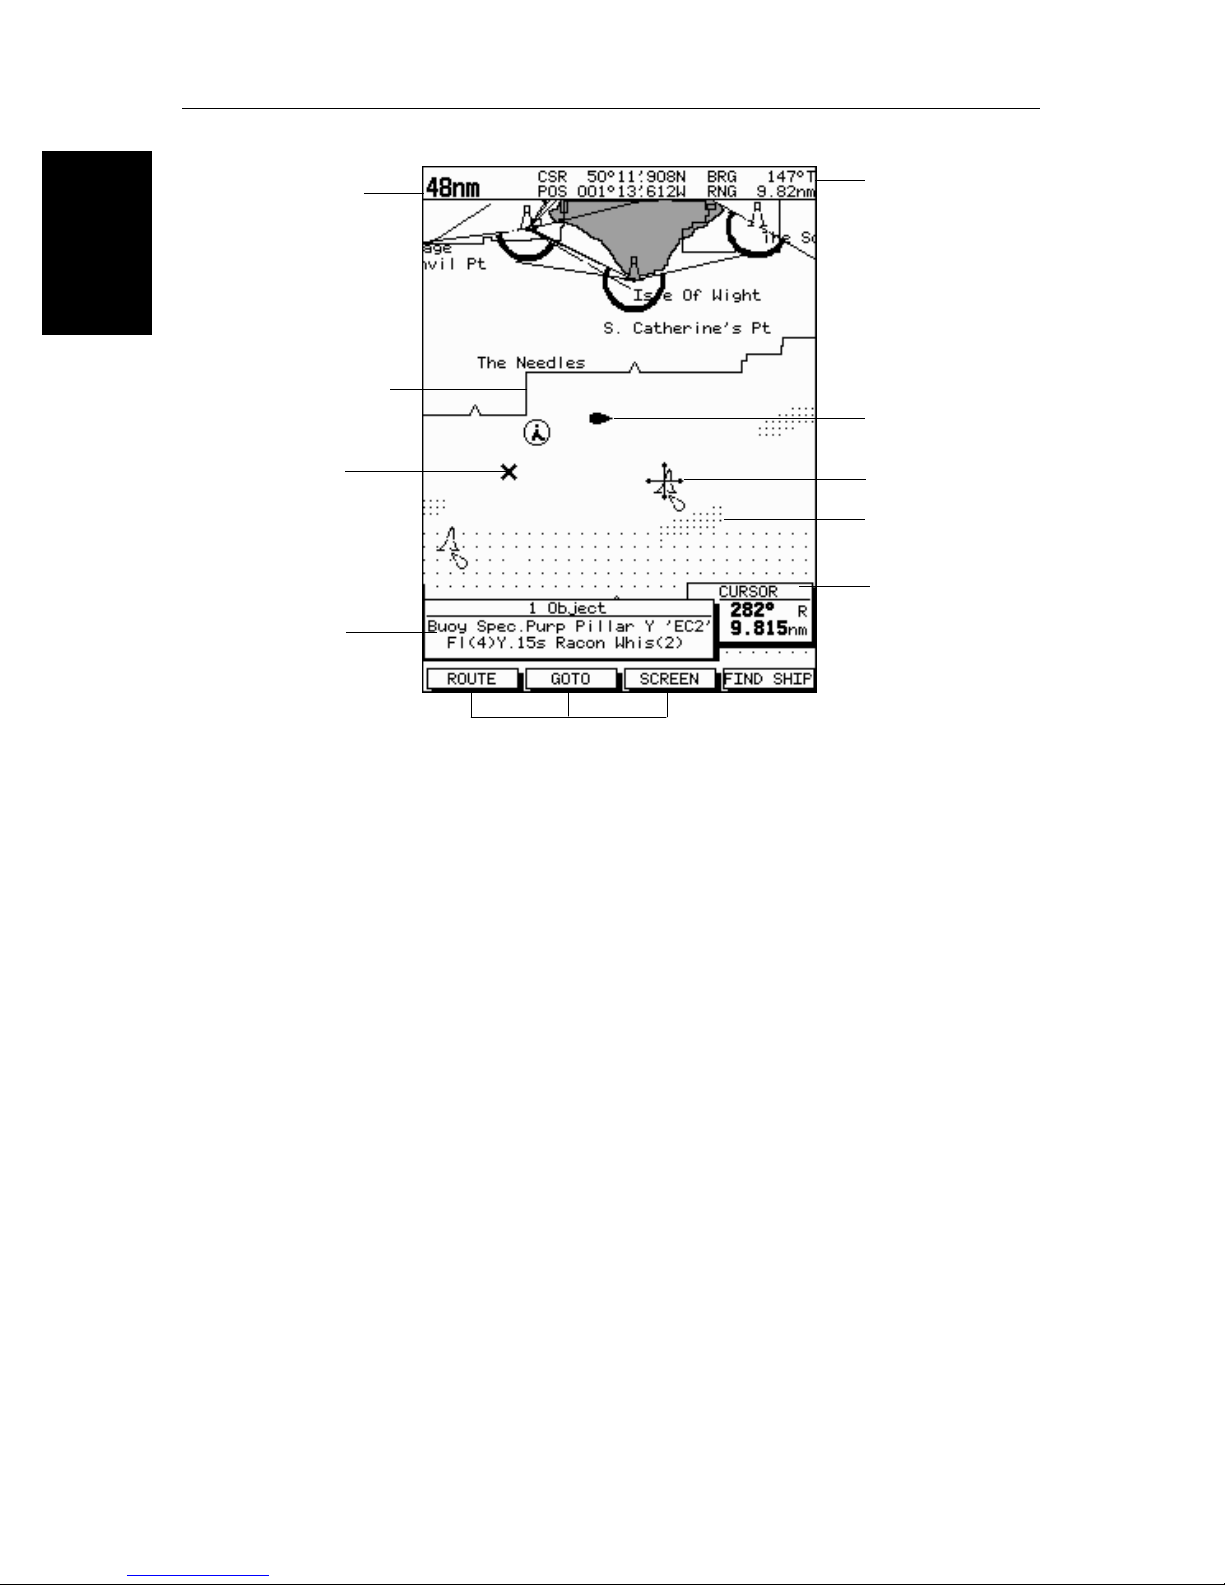
1-14
2
hsb
Plus Series Fishfinders
Display Options
Chartplotter
Chart Range
Chart Boundary
Waypoint
Object data box -
for object selected
by cursor
Default soft key labels
These can be turned off: press any soft key to redisplay them.
Different labels are displayed when you press a key.
Status Bar
Vessel Position
Cursor -
selecting chart object
Depth Area
Cursor position box
Shows the current
cursor position as
either Range/Bearing
or Lat/Long. You can
move this box to your
preferred position on
the screen or turn it off.
D4275-3
Figure 1-4: Typical Chartplotter Display
Custom Chart Details
The chartplotter set up options include a sub-menu to customize the
cartographic features. This menu allows you to switch features On, Off, or
control them using the CUSTOM soft key. The factory default settings for the
Custom chart options are as follows:
ON: Chart text, chart boundaries, depth contours, navigation marks
and land features.
OFF: Caution and routing data.
CUSTOM: Spot sounding, light sectors, marine features.
Note: The factory default for the
Icons are displayed in detail, depth shading limit is 10 m and depth contour
display is 0-100 m.
A complete list of chart features is given in Appendix C.
CUSTOM settings is ON
.
Page 27

Chapter 1: Overview 1-15
Chartplotter Functions
The
2
hsb
Plus Series Chartplotter includes the following functions:
• Display C-MAP NT and NT+ C-Card chart information including Ports
and Tides (if available)
• View chart information (if available) for the Nearest Port
• Place, Move, Erase and Edit a Waypoint
• Goto Waypoint or Cursor
• Create, Save, Name, Edit and Follow a Route
• Review Route and Waypoint Lists
• Display vessel’s track; Save and Name the Track for re-call to screen
• Measure Chart Distances and Bearings on-screen
• Set Up Alarms and Timers
• Man OverBoard (MOB) to navigate back to a missing person or object
• Differential GPS set up page
Operation of these functions is described in Chapter 5 and Chapter 6.
Functions
Chartplotter
Page 28
1-16
Operating Controls
1.4 Operating Controls
You operate the fishfinder and chart systems using a variety of controls:
• A trackpad providing up, down, left, right and diagonal control of an on
screen cursor
• Eleven dedicated (labeled) control keys
• Four soft keys with labels displayed on the screen
• Pop-up menus, displayed on-screen, from which you select options
• Database lists, displayed on-screen, which enable you to edit items
Note: The cursor is the cross-hair symbol (+) visible on the display. You move
the cursor using the trackpad and use it to select a position or item on the
chart.
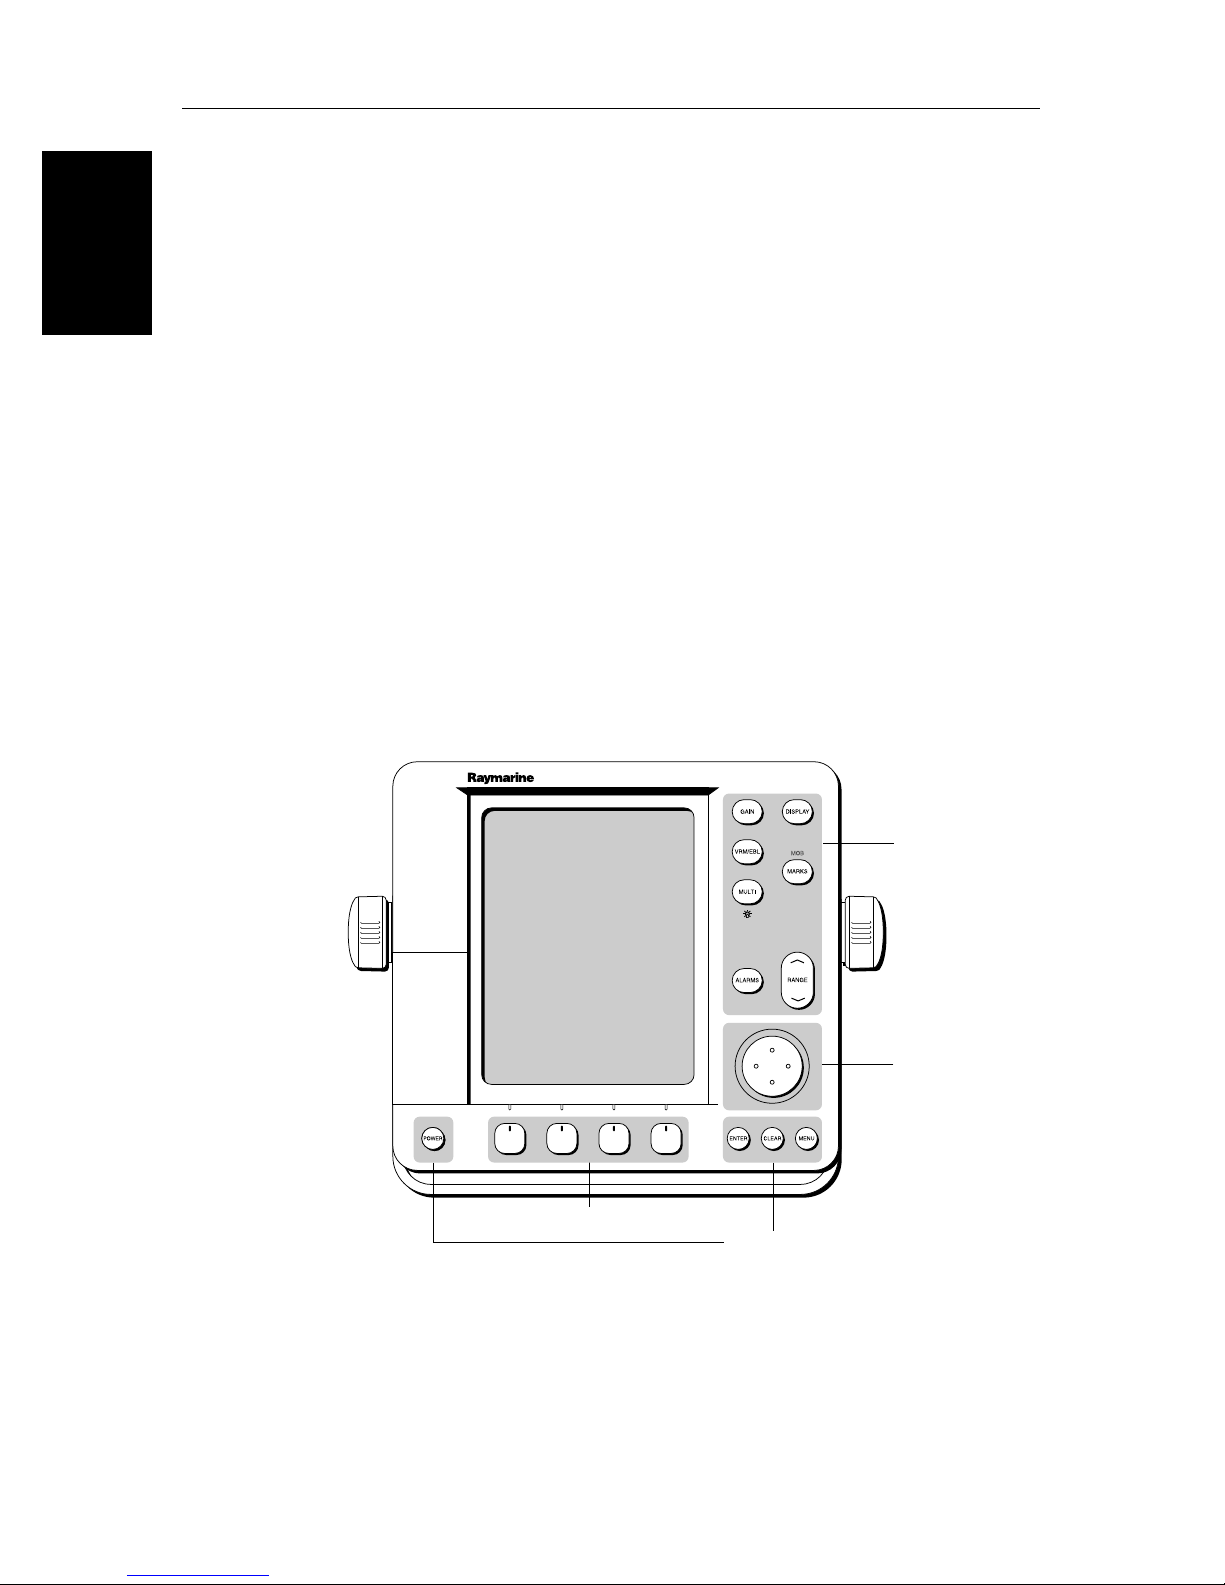
The control keys are shown in Figure 1-6. They are back-lit for night-time use
when the display brightness is dimmed. When you use a control, a help
message is displayed at the top of the screen (unless you switch help off as
described in Chapter 7). The following paragraphs describe the controls and
on-screen facilities.
2
hsb
Plus Series Fishfinders
Soft keys
Figure 1-5: 7" LCD Display Control Keys
Dedicated
keys
Trackpad
D3596-4
Dedicated keys
Page 29
Chapter 1: Overview 1-17
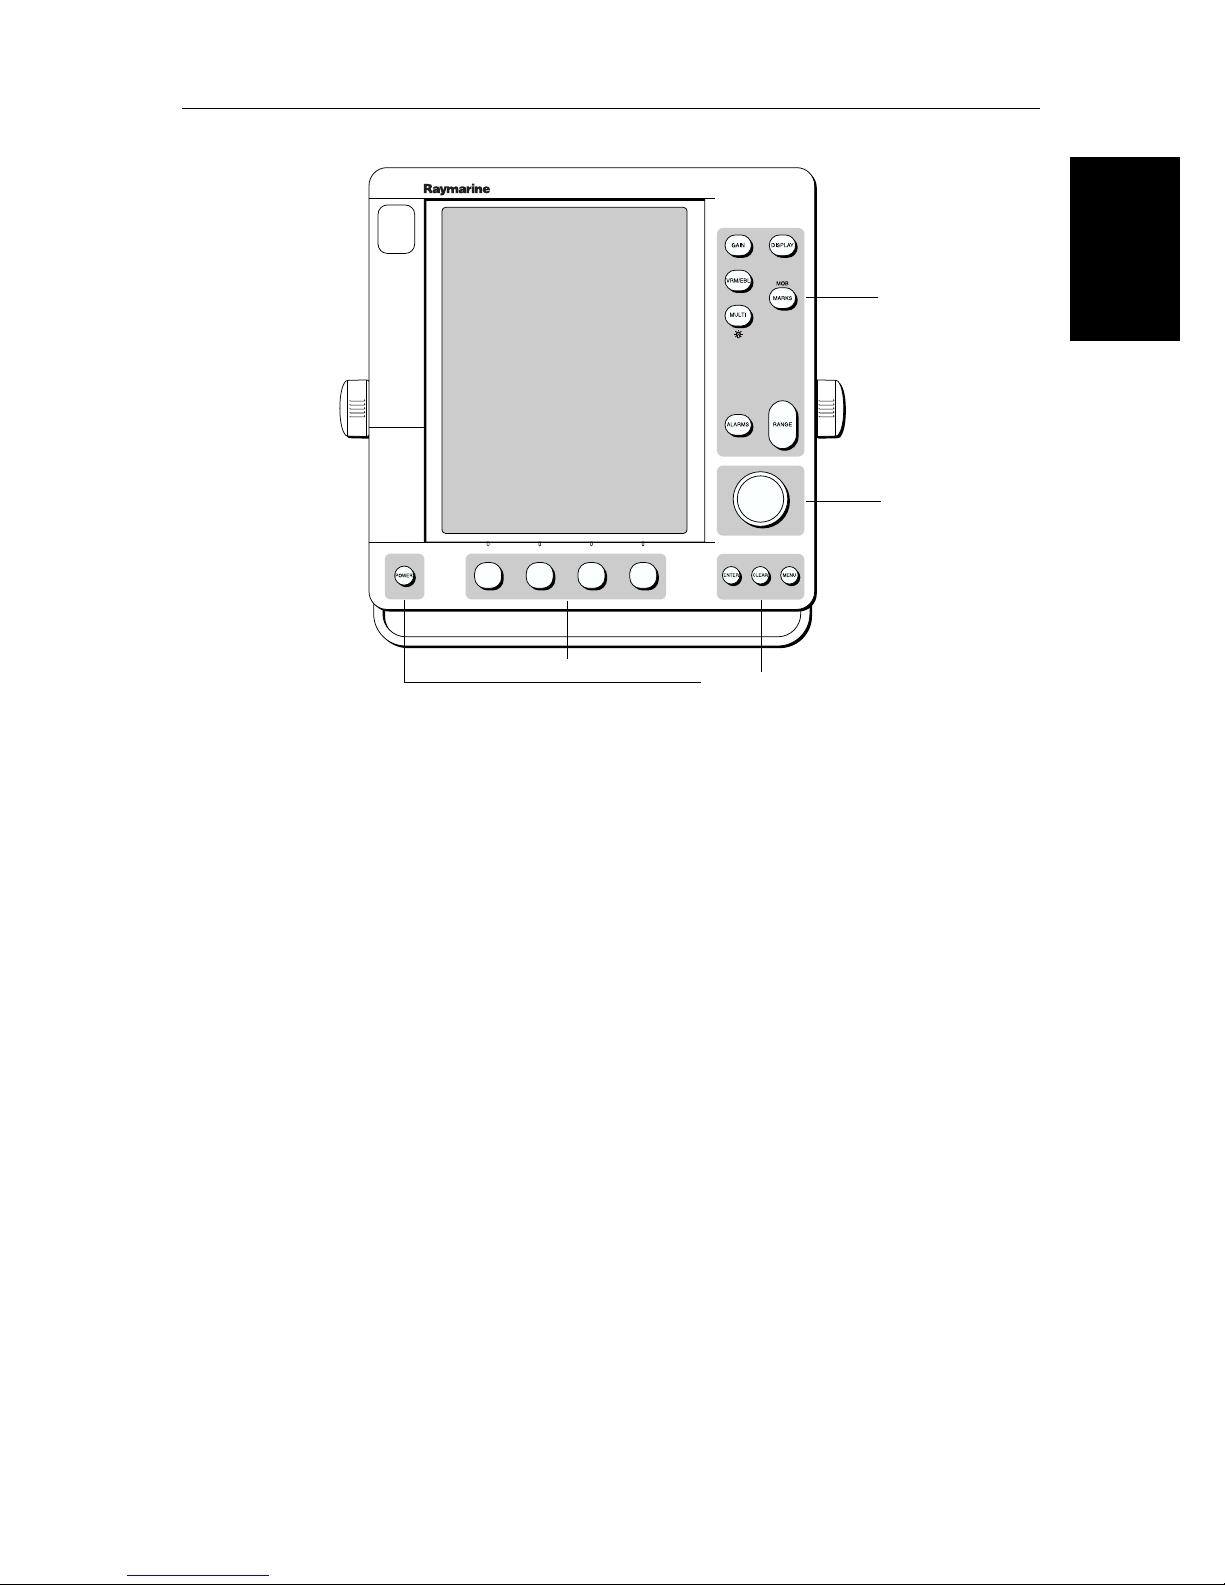
Figure 1-6: 10.4" LCD Display Control Keys
Trackpad and Cursor
The trackpad has several functions:
Soft keys
Dedicated keys
D5440-1
Dedicated
keys
Trackpad
Cursor
Trackpad and
• To move the cursor around the screen
• To select an item from a pop-up menu
• To adjust a variable soft key control
The cursor is used to:
• Select a position on the screen
• Select an item, for example, chart object on the chartplotter
• Pan the chart display
Moving the Cursor
You can press on any of the four sections of the trackpad to move the cursor in
that direction (up, down, left or right), or press two sections at the same time to
move diagonally. The cursor moves faster as you continue to press the
trackpad. The current cursor position is shown in the cursor data box (if
selected).
Page 30

1-18
2
hsb
Plus Series Fishfinders
Trackpad and
Cursor
Note: During many operations you cannot move the cursor around the
screen; if you cannot move the cursor using the trackpad, check the default
soft keys are displayed (unless they have been switched OFF in system set up).
If not, press ENTER
until they are displayed.
The cursor is normally displayed as a crosshair. However, in chart mode, if
you have not moved the cursor for more than five seconds, when you next
move it the cursor is outlined by a circle so it is easier to locate on the screen.
Context-Sensitive Cursor Control
The cursor is context-sensitive. When the cursor is positioned over special
features on the display a text label appears to identify the feature as follows:
Table 1-2: Context-Sensitive Cursor Text Labels
Text Label Feature Fishfinder/Chart
BOX Data box (any type) Both
MOB Man Over Board marker Both
WPT Waypoint Both
BL Bottom Lock Fishfinder
VRM Variable Range Marker Fishfinder
ZOOM Zoom Fishfinder
A➟B
COG Course Over Ground vector Chart
HDG Heading vector Chart
POS Vessel’s position Chart
RTE Route leg Chart
TIDE Tide vector Chart
Chart Icons Various Chart
Ruler line Chart
Some items on the fishfinder/chartplotter screen, such as the cursor have
information associated with them. Most information is displayed in a data
box. The context-sensitive cursor allows you to move databoxes. In the case of
Fishfinder VRM data, depth is displayed on the right hand side of the
horizontal indicator, and distance is displayed at the top of the vertical
indicator.
Page 31

Chapter 1: Overview 1-19
Dedicated Keys
The dedicated keys: DISPLAY, MARKS, GAIN, VRM/EBL, MULTI,
ALARMS, RANGE, ENTER, CLEAR, MENU and POWER have fixed
functions; the functions are similar on all
example, ALARMS is used to set up the system alarms on both a fishfinder and
a chartplotter.
Some keys can be used in two ways:
• Press: Press the key momentarily and then release it. This method is used
for most key operations.
• Press and hold: Press the key and hold it down for the length of time stated
(for example, 3 seconds), and then release it.
When you press a dedicated key, one of the following happens:
i. The associated operation is performed, e.g., change chart scale
(RANGE).
2
hsb
Plus Series displays. For
Dedicated Keys
As you press a key, a single audio beep confirms the key action. If the keypress is not valid for the current screen or mode, three rapid beeps sound to
indicate that no response is available. If required, you can turn the key beeps
off as part of your set up procedure (see Chapter 7).
Soft Keys
The four keys below the screen are called soft keys because their functions
change according to the operation. The soft keys are grouped into related sets
and subsets providing access to the various functions. The soft key labels are
displayed on the screen just above the keys. The default soft keys are displayed
until you press a key, or select an item on the screen; the soft keys associated
with the action are then displayed.
The currently-selected soft key option is shown by its green background (gray
for the L755RC Plus monochrome display). If the key text is displayed in gray
rather than in black, it is not currently available.
ii. A pop-up menu is displayed, providing further options.
iii. A set of soft keys is displayed, providing further functions.
ZOOM MORE¬FREQUENCY
CHRT SNR
D5013-1
When you press a soft key one of the following happens:
i. The associated operation is performed, e.g., 50 kHz.
ii. A sub-set of soft keys is displayed, providing further functions.
Page 32

1-20
2
hsb
Plus Series Fishfinders
Pop-Up Menus
iii. A pop-up menu is displayed, providing further options.
As with dedicated keys, when you press a soft key a single audio beep
confirms the key action. If the key-press is not valid for the current screen or
mode, three rapid beeps sound to indicate that no response is available. If
required, you can turn the key beeps off as part of your set up procedure (see
Chapter 7).
Pop-Up Menus
Pop-up menus usually provide set up options. When a pop-up menu is onscreen, a set of associated soft keys is also displayed as shown in Figure 1-7.
ARRIVAL ALARM
OFF TRACK ALARM
ANCHOR ALARM
GROUNDING ALARM
COUNTDOWN TIMER
ALARM CLOCK
ALARMS SET UP
0.01nm
ON
OFF
5M/1.0nm
00:33:00
OFF
SELECT ARRIVAL
ALARM RADIUS
D4265-4
Figure 1-7: Typical Pop-up Menu
You use the trackpad to select an option from the menu, then use the
appropriate soft key to set the option. For example, you can toggle the OFF
TRACK ALARM on/off.
Page 33

Chapter 1: Overview 1-21
Database Lists
The waypoints, routes and tracks that you create on the chartplotter are stored
in database lists. You can view these lists and select items for editing.
WAYPOINT LIST
SYMBOL NAME
WAYPOINT 001
WAYPOINT 002
WAYPOINT 003
WAYPOINT 004
WAYPOINT 005
POSITION
BRG _186°
TEMP
---°
DATE
--/--/--
C
50°21^966N
001°20^368W
RNG _21.0nm
DEPTH
TIME
m
---
--:--:--
Database Lists
GOTO
WAYPOINT
EDIT
WAYPOINT
MAKE NEW
WAYPOINT
WAYPOINT
TRANSFER
D4262-2
Figure 1-8: Typical Database List
As with pop-up menus, when a database list is on-screen, a set of associated
soft keys is also displayed; you use the trackpad to select an item from the list,
then use the appropriate soft key to edit the item. For example, you can erase a
waypoint or a route.
Page 34

Database Lists
1-22
2
hsb
Plus Series Fishfinders
Page 35

Chapter 2: Installation 2-1
Chapter 2: Installation
2.1 Introduction
Compass
Transducer
This chapter provides installation instructions for the
2
hsb
Plus Series
Fishfinders. Simple systems such as that in Figure 2-1 below, or integrated
systems such as that in Figure 2-2 are explained (see Section 2.7). Details for
mounting the
2
hsb
Plus Series LCD Display and connecting the equipment are
included.
Fishfinder Display
GPS
Junction
SeaTalk
Distribution Panel
Box
Introduction
NMEA
12/24V Supply
12V Supply
Figure 2-1: Typical Fishfinder System
D5441-3
12V Supply
Page 36

Introduction
2-2
Transducer
2
hsb
Plus Series Fishfinders
2
hsb
Series Master Display
GPS
2
hsb
Series Repeater Display
Compass
HSB
SeaTalk
Distribution Panel
Junction
Box
NMEA
12/24V Supply
12V Supply
D5442-3
12V Supply
Figure 2-2: Fishfinder in an Integrated System
Note: If you wish to practice using the display before installation, use the simulator mode, as described in Chapter 3. For power, connect a 12V or 24V DC
power supply, attaching the red wire via a quick blow fuse (6A for 12V or 4A
for 24V) to positive and the black wire to negative.
If you are connecting your display to other equipment (including another
hsb
Plus Series display unit) install then test the fishfinder display and transducer
as described in this chapter. Once the display is operating correctly, you can
connect it to other equipment as described in Section 2.7Integrated Systems
on page 2-18, taking particular care to ensure the correct polarity of the
SeaTalk supply. Section 2.7 describes the
2
hsb
, SeaTalk and NMEA
interfaces.
2
For the Fishfinder to display depth, water temperature and speed, you must
install the Depth/Speed/Temp transducer supplied with your system.
For full functionality of the radar and chartplotter you need to provide position
and heading data.
• Heading data enables the chart to operate in North Up and Course Up
modes. If speed data is also available the MOB function operates.
• Position data is required for full functionality of the chart display.
Page 37

Chapter 2: Installation 2-3
Full details of heading, position and other data are given in Section 2.7.
Planning the Installation
Before you install your system, plan the installation, considering:
• Correct transducer for your application. See document number 81196,
Transducers for Fishfinders Owner’s Handbook.
• Location of the display unit, as described in Section 2.3
• Cable Runs, including cables for an integrated system (to provide heading
and position data, etc.), as described in Section 2.4.
EMC Installation Guidelines
All Raymarine equipment and accessories are designed to the best industry
standards for use in the recreational marine environment.
Their design and manufacture conforms to the appropriate Electromagnetic
Compatibility (EMC) standards, but correct installation is required to ensure
that performance is not compromised. Although every effort has been taken to
ensure that they will perform under all conditions, it is important to understand
what factors could affect the operation of the product.
The guidelines given here describe the conditions for optimum EMC
performance, but it is recognized that it may not be possible to meet all of these
conditions in all situations. To ensure the best possible conditions for EMC
performance within the constraints imposed by any location, always ensure
the maximum separation possible between different items of electrical
equipment.
Installation
Planning the
For optimum EMC performance, it is recommended that wherever possible:
• Raymarine equipment and cables connected to it are:
• At least 3 ft (1 m) from any equipment transmitting or cables carrying
radio signals, e.g., VHF radios, cables and antennas. In the case of SSB
radios, the distance should be increased to 7 ft (2 m).
• More than 7 ft (2 m) from the path of a radar beam. A radar beam can
normally be assumed to spread 20 degrees above and below the radiating element.
• The equipment is supplied from a separate battery from that used for
engine start. Voltage drops below 10 V, and starter motor transients, can
cause the equipment to reset. This will not damage the equipment, but may
cause the loss of some information and may change the operating mode.
• Raymarine specified cables are used. Cutting and rejoining these cables
can compromise EMC performance and must be avoided unless doing so
is detailed in the installation manual.
Page 38

2-4
2
hsb
Plus Series Fishfinders
• If a suppression ferrite is attached to a cable, this ferrite should not be
removed. If the ferrite needs to be removed during installation it must be
reassembled in the same position.
EMC Installation
Guidelines
Suppression Ferrites
The following illustration shows typical cable suppression ferrites used with
Raymarine equipment. Always use the ferrites supplied by Raymarine.
D3548-3
Figure 2-3: Typical Suppression Ferrites
Connections to Other Equipment
If your Raymarine equipment is to be connected to other equipment using a
cable not supplied by Raymarine, a suppression ferrite MUST always be
attached to the cable near to the Raymarine unit.
Page 39

Chapter 2: Installation 2-5
2.2 Unpacking and Inspecting the Components
Unpack your system carefully, to prevent damage to the equipment. Save the
carton and packing, in case you need to return a unit for service.
Check that you have all the correct system components. These depend on your
system package, as follows:
Table 2-1: Parts and Accessories
Item Part No. Supplied with: Option for:
Components
Inspecting the
Unpacking and
7” Monochrome Fishfinder/Chartplotter
7” Color LCD Fishfinder
7” Color LCD Fishfinder/ChartplotterS
10.4” Color LCD Fishfinder
10.4” Color LCD Fishfinder/Chartplotter
7” LCD Display Sun cover
10.4” LCD Display Sun cover
Handbook, Fishfinder/Chart
Quick Reference Card, Fishfinder
Quick Reference Card, Chart
Mounting bracket knobs (x2)
7” Display Mounting bracket assy
10.4” Display Mounting bracket assy
7” Display Flush Mount Kit
10.4” DIsplay Flush Mount Kit
Power cable
SeaTalk cable assembly Flat moulded plugs both ends:
3 ft 3 in (1 m) long
9 ft 9 in (3 m) long
16 ft 3 in (5 m) long
29 ft 3 in (9 m)) long
Flat to male round connector:
12 in (0.3 m) long
Flat to female round connector:
12 in (0.3 m) long
Flat moulded plug one end only:
3 ft 3 in (1 m) long
SeaTalk auxiliary junction box
E63007
E63019
E63010
E63013
E63014
D331
E55031
81195
86066
86067
W145
W143
E55032
M92708
E55033
W144
D284
D285
D286
D287
D187
D188
D229
R55006
L755RC Plus
L760 Plus
L760RC Plus
L1250 Plus
L1250RC Plus
L755RC, L760, L760RC
L1250, L1250RC
All
All
L755RC, L760RC,
L1250RC
All
L755RC, L760, L760RC
L1250, L1250RC
—
—
All
—
—
—
—
—
—
—
All
—
—
—
—
—
—
—
—
—
—
—
—
—
L755RC, L760, L760RC
L1250, L1250RC
—
All
All
All
All
All
All
All
—
Page 40

2-6
2
hsb
Plus Series Fishfinders
Table 2-1: Parts and Accessories
Item Part No. Supplied with: Option for:
2
hsb
Unpacking and
Inspecting the
Components
cable assy
3 ft 3 in (1 m)
10 ft (3 m)
20 ft (6 m)
30 ft (10 m)
60 ft (20m)
2
hsb
In Line Terminator
2
hsb
Splitter Cable
NMEA OUT cable assy
4 ft 11 in (1.5m)
R55001
R55002
R55003
R55004
E55010
R58117
E55040
R55005
—
—
—
—
—
All
—
All
All
All
All
All
All
—
All
—
Transducer and Cables (See
81196
Transducers for Fishfinders Handbook
—— —
)
Page 41

Chapter 2: Installation 2-7
2.3 Selecting the Equipment Location
Display Unit Mounting Location
The display unit can be mounted using the mounting bracket supplied, or
console mounted using the optional flush-mounting kit. The dimensions of the
display units, including the bracket, are shown below in Figure 2-4,
Figure 2-5 and Figure 2-6.
When planning the display installation, the following should be considered to
ensure reliable and trouble free operation:
• Convenience: The contrast and colors seen on all LCD displays vary
slightly with viewing angle; this is more noticeable on the left hand side.
Power the unit and select a suitable mounting location prior to installing
the display. The mounting location should be easily accessible to allow
operation of the front panel controls.
• Access: There must be sufficient space behind the display to allow cable
connections to the rear panel connectors, avoiding tight bends in the cable.
Location
Equipment
Selecting the
• Interference: The selected location should be far enough away from
devices that may cause interference, such as motors, generators and radio
transmitter/receivers (see the EMC guidelines earlier in this section).
• Magnetic compass: Mount the display unit at least 3 ft (1m) away from a
magnetic compass.
• Cable runs: The display unit must be located near a DC power source. The
power cable supplied is 4.9 ft (1.5m), but a longer cable can be used if
required: refer to Section 2.4.
The maximum length of cable between a master display and the transducer unit should not normally exceed 30 ft (10 m). If you need to use a
longer cable, refer to Section 2.4.
• Environment: Do not restrict airflow at the rear of the display unit;
the display incorporates Cold Cathode Florescent Lamps (CCFL),
which have a reduced light output when the unit is very hot. Ventilation is required to prevent the unit from overheating.
The display should be protected from physical damage and excessive
vibration. Mount the display in a protected area away from prolonged and
direct exposure to rain and salt spray.
Page 42

2-8
2
hsb
Plus Series Fishfinders
Mounting Location
*
0.95 in
(24.3 mm)
Display Unit
10.51 in (267 mm)
6.89 in (175 mm)
0.4 in
(10 mm)
7.3 in (185 mm)
8.1 in (205.2 mm)
8.8 in (223.6 mm)
GAIN
DISPLAY
VRM/EBL
MARKS
MULTI
RANGE
ALARMS
8.5 in (217 mm)
POWER
ENTER CLEAR MENU
1.42 in (36 mm)
4.53 in (115 mm)
6.9 in (176 mm)
1.3 in
(33.5 mm)
2.1 in
(53.5 mm)
cable cleareance
3.15 in
(80 mm)
Weight: 8.1 lbs (3.7 Kg)
6.3 in (160 mm) 1.28 in (32.5 mm)
8.85 in (225 mm)
Compass Safe Distance: 39 in (1 m)
Figure 2-4: 7” Color LCD Fishfinder Display Unit Dimensions
(L760 Plus and L760RC Plus)
D4847-4
Page 43

Chapter 2: Installation 2-9
10.54 in (267.7 mm)
0.95 in
(24 mm)
6.89 in (175 mm)
0.95 in
(24 mm)
0.4 in
7.3 in (185 mm)
(9.5 mm)
8 in (204 mm)
Display Unit
Mounting Location
8.76 in (222.5 mm)
GAIN
DISPLAY
VRM/EBL
MARKS
MULTI
RANGE
ALARMS
POWER
ENTER CLEAR MENU
1.45 in (37 mm)
3.2 in (81 mm)
6.9 in (176 mm)
cable cleareance
3.15 in
(80 mm)
3.15 in
(80 mm)
1.3 in
(33.5 mm)
2.16 in
(55 mm)
Weight: 7.5 lbs (3.415 Kg)
6.3 in (160 mm)
8.85 in (225 mm)
Compass Safe Distance: 39 in (1 m)
Figure 2-5: 7” Monochrome LCD Fishfinder Display Unit Dimensions
(L755RC Plus)
0.4 in
(9.5 mm)
8.5 in (216 mm)
D5071-2
Page 44

Mounting Location
2-10
11.5 in (292 mm)
2
hsb
Plus Series Fishfinders
3.82 in (97 mm)
Display Unit
11.4 in (289 mm)
12.3 in (313 mm)
6.38 in (162 mm)
cable clearance
12.9 in (328 mm)
10.83 in (275 mm)
0.28 in
9.7 in (246 mm) 0.87 in (22.1 mm)
3.15 in
(80 mm)
1.65 in
(42 mm)
(7.1 mm)
3.94 in (100 mm)
Figure 2-6: 10.4” Color LCD Fishfinder Display Dimensions
7.88 in (200 mm) 1.7 in (43 mm)
11.26 in (286 mm)
(L1250 and L1250RC Plus)
Compass Safe Distance: 39 in (1 m)
D5066-3
Page 45

Chapter 2: Installation 2-11
2.4 Cable Runs
Consider the following before installing the system cables:
• You need to attach the power cable and the transducer cable. Additional
cables will be required if you are installing an integrated system.
• All cables should be adequately secured, protected from physical damage
and protected from exposure to heat. Avoid running cables through bilges
or doorways, or close to moving or hot objects.
• Acute bends must be avoided
• Where a cable passes through an exposed bulkhead or deckhead, a watertight feed-through should be used.
• Secure cables in place using tie-wraps or lacing twine. Coil any extra cable
and tie it out of the way.
You need to run the following cables:
• Power/NMEA Input cable, supplied with the display unit. This has a connector plug at one end for connecting the display unit, and 7 wires at the
other end for connecting the power supply and optional NMEA inputs (see
Integrated Systems on page 2-18).
Cable Runs
• Transducer cable, supplied with the transducer. This 30 ft (10 m) cable
has a connector plug (with an outer nut that you must attach) at one end for
the display unit or extension cable.
• SeaTalk cable, optional, with SeaTalk connector(s) at one or both ends.
• HSB cable, optional.
• NMEA Output cable, optional, with an NMEA OUT connector at one
end only.
Power Cable
The
systems rated from 10.7 V to 32 V.
A 5 ft (1.5 m) power cable is supplied for connecting the ship’s DC power to
the display unit. The power cable may be extended by up to 60 ft (20 m) using
a wire gauge of AWG 12 (3.5 mm
2
hsb
Plus Series Fishfinder is intended for use on ships’ DC power
Transducer Cable
A 30 ft (10m) cable is supplied with the transducer. The transducer cable may
be extended up to a maximum of 60 ft (20 m) using optional extension cables.
For details, see document number 81196, Transducers for Fishfinders
Owner’s Handbook.
2
) or greater.
Page 46

2-12
2.5 Mounting the Display Unit
2
hsb
Plus Series Fishfinders
The
2
hsb
Plus Series LCD display unit is waterproof to CFR46 and can be
installed either above or below deck. The display unit can be mounted using
Mounting the
Display Unit
the mounting bracket supplied, or console mounted using the optional flushmounting kit (see Section 2.2).
Mounting Bracket
The display unit can be mounted on a dash, chart table, bulkhead, or deckhead.
D4848-1
Figure 2-7: LCD Display Mounting
1. Loosen the knobs and remove the mounting bracket from the display unit.
2. Mark the locations of the mounting bracket screw holes on the mounting
surface.
3. Use the screws supplied to attach the mounting bracket at the marked locations.
4. Attach the display unit to the mounting bracket, adjust the display angle,
and tighten the knobs.
Page 47

Chapter 2: Installation 2-13
Console Mounting
The display unit can be console mounted if required, using the optional flushmounting kit (Raymarine part number M92708 for 7” Fishfinder displays and
E55033 for 10.4” Fishfinder displays).
CAUTION:
Make sure there are no hidden electrical wires or other items behind the
location before proceeding. Make sure there is sufficient rear access for
mounting and cabling.
1. Check the selected location for the unit. A clear, flat area at least 9 in (230
mm) wide by 8¼ in (210 mm) high, with at least 6.9 in (176 mm) of clearance behind the panel, is required.
2. Unpack the flush-mounting kit.
3. Using the supplied template, trace out the display unit opening.
4. Drill a ½ in (12.7 mm) pilot hole in each corner of the cut-out area.
5. Using a suitable saw, cut along the inside edge of the cut-out line.
Display Unit
Mounting the
6. Remove the mounting bracket knobs and bracket from the display unit.
Make sure that the unit fits in the cut-out area.
If the optional screw fitting is required, drill four 3/16 in (5 mm) holes as
indicated on the template.
Screw the studs into the holes provided at the rear of the display.
7. Connect the DC power cable, transducer cable, and any other accessory
cables to the display. Avoid tight bends in the cables.
8. Place the gasket on the unit and slide the unit into the panel cut-out.
9. Use the flush-mounting kit to secure the unit to the console.
Alternatively, place a spacer over each of the four studs and secure with
the thumb nuts.
Page 48

2-14
2.6 System Connections
Grounding the System
2
hsb
Plus Series Fishfinders
Connections
It is important that an effective RF ground is connected to the system. You
System
must ground the display by connecting the drain wire (shield) of the Power/
NMEA Input cable to the ship’s RF ground; a single ground point should be
used for all equipment.
If you need to extend the wire, the extension wire should be an 8 mm braid or
AWG 10 (6.0 mm
2
) multi-stranded cable.
If your vessel does not have an RF system, connect the drain wire to the
negative battery terminal.
DC Power Connection
The
systems rated from 10.7 V to 32 V.
The power connection to the display should be made at either the output
of the battery isolator switch, or at a DC power distribution panel.
Raymarine recommends that power is fed directly to the display via its
own dedicated cable system and MUST be protected by a thermal circuit
breaker or fuse, installed close to the power connection.
2
hsb
Plus Series Fishfinder is intended for use on ships’ DC power
Use a 6 amp fuse for 12V systems or 4 amp fuse for 24/32V systems.
The DC system should be either:
• Negative grounded, with the negative battery terminal connected to the
ships ground.
• Floating, with neither battery terminal connected to the ships ground.
CAUTION:
This system is not intended for use on “positive” ground vessels.
The power cable Ground (earth) connections must be connected to the
ship’s ground as described above.
Power for External Equipment
External equipment cannot be powered from the display’s SeaTalk
interface.
It must be powered from the ship’s supply or via a SeaTalk bus.
Refer to Section 2.7 for further details.
Page 49

Chapter 2: Installation 2-15
Display Unit Connection
The rear of the
2
hsb
Plus Series LCD display provides the following
connection sockets:
• Transducer connection.
• HSB, in/out connector for connecting to another
2
hsb
Plus Series display
(such as a chartplotter, radar, or second fishfinder display).
• SeaTalk, for SeaTalk data input and output and connecting to another
hsb
Plus Series display (such as a chartplotter, radar, or second fishfinder display).
• NMEA Output, for NMEA data output in an integrated system.
• Power/NMEA Input, for 12 V, 24 V or 32 V DC power connection, two
NMEA 0183 inputs and one RF ground (screen) connection.
TRANSDUCER
SeaTalk
GRY
POWER/NMEA
HSB
NMEA OUT
2
Connection
Display Unit
D4849-2
Figure 2-8: Fishfinder Display Connector Panel
The following sections detail the display unit connectors used when installing
2
hsb
a single
Plus Series LCD Display. The remaining connector details are
provided in Section 2.7.
Transducer Connection (master displays)
The transducer cable connector (and Y-shaped connector, if supplied) has a
nut that has been removed to aid installation. To allow you to complete the
installation without cutting the cable, ensure that any holes you drill are large
enough to accept the connector, with the nut removed (approximately 13/16"
or 21 mm).
Before attaching the transducer cable, you will need to attach the connector
nut and split ring. These items, plus a wedge tool, are included in the
transducer packaging.
The transducer cable is attached to the 7 pin male connector marked
TRANSDUCER on the rear of the display unit. How you connect the cable to the
display unit depends on the type of transducer you have installed:
Page 50

Connection
2-16
2
hsb
Plus Series Fishfinders
• Combined depth/speed/temp transducers have a 7 pin female connector.
Attach the transducer cable connector directly to the display unit.
• Combined speed/temperature transducers have a 3 pin female connector
that requires the use of an additional Y-shaped cable (Raymarine part num-
Display Unit
ber E66022) to attach to the 7 pin connector on the display. This Y-cable is
included with your speed/temperature transducer.
Attach the 7 pin female connector on the Y-cable to the display unit then
attach the transducer cable to the 3 pin male connector on the Y-cable.
• Depth-only transducers have a 7 pin female connector.
Attach the transducer cable connector directly to the display unit.
or
If being installed in conjunction with a speed/temperature transducer,
attach the 7 pin female connector on theY-cable to the display then attach
the transducer cable to the 7 pin male connector on the Y-cable.
Note: If your system requires both a Y-cable and a transducer extension cable, ensure that you connect the Y-cable to the display unit and the extension
cable to the transducer.
The connector pins are shown in the following diagram, together with the
connections and wire colors; this is information is provided as an aid to fault
diagnosis.
CAUTION:
Do not cut the transducer cable or remove the connector. Do not try to
shorten or splice the cable. If the cable is cut, it cannot be repaired.
Cutting the cable will also void the warranty.
5
2
1
4
3
Pin No. Function Color Pin No. Function Color
1 Speed Red 5 Speed/Temp Ground Brown
7
6
D4850-2
2TempWhite6+ Depth Blue
3 Shield Drain 7 - Depth Black
4SenseGreen
Figure 2-9: Fishfinder Transducer Connector
Page 51

Chapter 2: Installation 2-17
Power and NMEA Input Connection
The DC power and NMEA input should be connected at the rear Power/
NMEA seven-pin connector. The connector (viewed from the outside) and pin
functions are shown in the following diagram and table. The NMEA Input is
detailed in Section 2.7.
f
2
5
Connection
Display Unit
1
4
3
Pin No. Function Color
1 Channel 1 NMEA data input (+ve) Orange
2 Channel 1 NMEA return (-ve) Yellow
3 Battery negative Black
4 Shield (drain wire) No insulation
5 Battery positive (12/24/32 V systems) Red
6 Channel 2 NMEA data input (+ve) Green
7 Channel 2 NMEA return (-ve) Blue
Figure 2-10: Power and NMEA Connector
7
6
D3231-2
Power Connection
CAUTION:
If the power connections are accidentally reversed the system will not
work. Use a multimeter to ensure that the input power leads are
connected for correct polarity.
Switch off the display unit before you remove the power cord.
The RED wire must be connected to the feed from the positive (+) battery
terminal and the BLACK wire to the feed from the negative (–) battery
terminal. The shielded wire (screen) should be connected to the ship’s RF
ground as previously described in Grounding the System on page 2-14.Any
unused wires should be insulated and taped back.
Page 52

2-18
EMC Conformance
Always check the installation before going to sea to make sure that it is not
EMC Conformance
affected by radio transmissions, engine starting, etc.
2.7 Integrated Systems
2
hsb
Plus Series Fishfinders
The
2
hsb
Plus Series displays can be linked to other equipment to transfer data
as follows:
2
hsb
• A second display, either CRT or LCD, can be connected via
(and
SeaTalk) to repeat fishfinder, chart and/or radar information at a remote
location.
Note: If you have an integrated system with a Pathfinder Plus radar master
display that includes MARPA as a primary function, MARPA functionality is
available on the LCD repeater display.
• Data can be received via SeaTalk or NMEA, some of which will increase
the functionality of the display. Other data can be viewed on the display.
• Data can be transmitted via SeaTalk and NMEA to enhance other equipment.
• Some incoming data can be converted across the communication link and
re-transmitted.
Power for External Equipment
External equipment cannot be powered from the display’s SeaTalk
interface. It must be powered from the ship’s supply or via a SeaTalk bus.
Ensure correct polarity of the SeaTalk connection.
For systems where the ship’s power source is 24 V only, you may need to
install a 24 V to 12 V DC converter. This is only necessary if the products
being connected to the display are:
• SeaTalk compatible (for example, compass, GPS and instruments), and
there is no existing SeaTalk bus
• NMEA compatible, but operate only from 12 V (for example, compass,
GPS and some navigators)
The DC-DC converter must conform to the following specification:
Table 2-2: DC-DC Converter for External Equipment
Input 21 to 32 V DC
Output 13.6 V DC, isolated
Load Continuous current rating, in excess of required load
Page 53

Chapter 2: Installation 2-19
High Speed Bus (
The High Speed Bus (
master and repeater displays. With an
data available can be controlled and displayed by any unit.
Master functionality is provided by the display with the appropriate
transducer/scanner connected as defined in Table 2-3 . You can have a master
fishfinder and a master radar in the same system. Data on master units are
displayed on all connected repeater units.
Note: If the master display is an L1250 Plus or L1250RC Plus, repeater displays can take advantage of these units’ extended power (1000 watts vs. 600
watts RMS) and depth range (5000 feet vs. 3000 feet).
Up to ten
functionalities. For example, you can connect your
to a remote
Plus Chartplotter to provide fishfinder, chart, and radar functionality on all
three displays. You can display some combinations, such as fishfinder/chart or
radar/chart, in half-screen windows.
hsb
hsb
2
hsb
)
2
hsb
) provides extremely rapid transfer of data between
2
hsb
and a SeaTalk connection, most
2
Plus Series displays can be combined to create a variety of
2
hsb
Series Plus Fishfinder
2
Series Pathfinder Plus Radar and then to a remote
hsb
2
(hsb2)
High Speed Bus
Series
Note: Fishfinder STC cannot be adjusted on a repeater display, nor can depth
offset, speed and temperature calibration be set. Frequency can be selected on
either master or repeater, but the same frequency is used on all displays.
The
2
hsb
system can include several chartplotter displays, each with two chart
cartridge slots. Each display can access two local and up to six remote chart
cartridges. Charts can be controlled independently on each display, even when
a remote chart cartridge is being used.
Table 2-3:
Master Function Plus Series Display Type Transducer/Scanner
Radar R70, RL70, RL70C, RL70RC, RL70CRC,
Chart RC520, RC530, RC631
Fishfinder L755RC, L760, L760RC, L1250,
2
hsb
Plus Series Master Displays
R80, RL80, RL80C, RL80RC, RL80CRC
RL70RC, RL70CRC, RL80RC, RL80CRC,
L755RC, L760RC, L1250RC
L1250RC
Any Pathfinder Series
Scanner
Display includes a two-slot
chart cartridge
Fishfinder transducer
Note: Earlier HSB (non-Plus) Display units with can be upgraded to provide
2
hsb
Plus compatibility. Please contact your authorized Raymarine dealer for
details.
Page 54

2-20
2
hsb
Plus Series Fishfinders
L1250 PLUS Fishfinder
RL80C PLUS Radar
L760 PLUS Fishfinder
RC530 PLUS Chartplotter
High Speed Bus
(hsb2)
HSB
TRANSDUCER
GRY
NMEA OUT
2
hsb
Inline
Terminator
HSB cable HSB cable HSB cable
Power Power
HSB
TRANSDUCER
POWER/NMEA
SeaTalk
Figure 2-11: Fishfinder Integrated System with Multiple
GRY
POWER/NMEA
SeaTalk
NMEA OUT
hsb
Splitter
2
2
hsb
Splitter
NMEA OUT
HSB
POWER/NMEA
Power
TRANSDUCER
GRY
SeaTalk
hsb
Inline
Terminator
hsb
NMEA OUT
HSB
2
Power
2
Plus Connections
SeaTalk
POWER/NMEA
TRANSDUCER
GRY
D5655-3
Upgrading Existing HSB Series Displays
Earlier HSB (non-PLUS) display units can be upgraded to provide
compatibility. Two types of upgrades are available:
hsb
2
Plus
1. A full hardware and software upgrade (Plus upgrade) provides full com-
patibility with the
hsb
2
system.
This configuration supports up to eight true Plus (or Plus upgraded) displays with a cable limit of 60 meters, or up to ten true Plus (or Plus
upgraded) displays at a maximum of 40 meters cable length.
2. A software-only upgrade enables the display to be used with a Plus (or Plus
upgraded) unit in the
hsb
2
system.
However, like the old HSB (non-Plus) system, this configuration only supports two displays: two software-only upgraded units, or one softwareonly upgraded with one true Plus (or Plus upgraded) display.
Connecting
Figure 2-11 illustrates how to inter-connect various
When connecting your
2
hsb
Plus Series Displays
2
hsb
Plus Series displays, there are several important
2
hsb
Plus Series Displays.
points to keep in mind:
2
hsb
1. If more than two
2
hsb
Splitter Cable, Raymarine part number E55040.
displays at the end of the chain must be terminated using the Inline
2.
use an
2
hsb
Terminator plug (Raymarine part number R58117) included with your
Plus Series displays are to be connected, you must
hsb
Plus Series display unit.
2
Page 55

Chapter 2: Installation 2-21
3. The total cable length for an
2
hsb
network containing the maximum 10 display units (both Plus and Plus upgrades) must not exceed 40 meters. A network comprised of only 8 displays can extend up to 60 meters.
4. Earlier HSB (non-Plus) Display units can be enhanced with a hardware
and software upgrade to provide full
2
hsb
Plus functionality.
5. Earlier non-Plus displays can also be outfitted with a software-only
upgrade, which enables
2
hsb
compatibility. However, these software-only
upgraded displays are not true Plus units. They must not use the Inline Terminator plug because they are already terminated internally.
Like the old HSB system, this configuration only supports two displays:
two software-only upgraded units, or one software-only upgraded with
one true Plus (or Plus upgraded) display.
An In/Out connector cable is provided for connecting to another
hsb
2
Plus
Series display.
Note: The HSB cables have ferrite clamps attached at each end to ensure
EMC conformance. The cables are available in lengths of 1, 3, 6, 10 and 20 m.
HSB connector
HSB connector
Pin Pin name Function
1 CGND Screen
2 HSVB_POS SeaTalk HSB
Pin 1, screen
Pin 3, blue
Pin 2, white
3 HSVB_NEG SeaTalk HSB
(hsb2)
High Speed Bus
Rear of Display Unit
1
2 3
HSB
D4253-3
Figure 2-12: HSB Connector
The display unit is supplied with a blanking plug. This should be attached to
the HSB cable port if the HSB port is not used. If the display unit is installed in
an exposed position, seal the blanking plate with silicon compound.
Page 56

2-22
SeaTalk and NMEA In
2
hsb
Plus Series Fishfinders
In
The
SeaTalk and NMEA
primary data is described below:
2
hsb
Plus Series display can receive a comprehensive range of data. The
Table 2-4: Function of SeaTalk and NMEA Data
Data Primary Uses Suggested Source
Heading Chart: modes/ vectors Compass connected to SeaTalk bus,
NMEA Compass
Position Chart: own vessel position
MOB (also requires speed and HD G
data)
Waypoint Chart: Waypoint and route transfer Existing GPS Navigator via SeaTalk bus
SeaTalk GPS connected via Auxiliary JB
Existing GPS Navigator via SeaTalk bus
Existing GPS (or Loran-C) navigator with
NMEA output
Existing GPS (or Loran-C) navigator with
NMEA output
Heading data should ideally contain both magnetic and true heading. If only
one is available then a source of magnetic variation should be connected.
Radars and chartplotters can exchange their cursors via SeaTalk. Locked
heading should be used for Course Up if available via SeaTalk. Other data
connected via a SeaTalk bus or via NMEA is generally displayed in data
boxes, e.g., depth, apparent wind angle and speed, time.
Note: The Fishfinder uses its own depth data, rather than any other depth data
on SeaTalk. If there is no other depth data on SeaTalk, Fishfinder depth is
transmitted. If speed and temperature data are available on SeaTalk the Fishfinder uses this data; if this data is not on SeaTalk from other instruments, it is
transmitted by the Fishfinder.
For details of received data refer to the table in Appendix D: SeaTalk and
NMEA Data. Examples of SeaTalk and NMEA systems are shown in
Figure 2-13 and Figure 2-14.
Page 57

Chapter 2: Installation 2-23
GPS
SeaTalk
SeaTalk SeaTalk
HSB HSB
12/24V Supply
Scanner
12/24V Supply
hsb
2
Series Radarhsb2 Series Chartplotterhsb2 Series Fishfinder
In
SeaTalk and NMEA
SeaTalk
Course Computer
SeaTalk
Distribution Panel
12/24V
Supply
Transducer
SeaTalk
SeaTalk
12/24V Supply
12/24V Supply
Figure 2-13: Integrated System with Repeater Displays and SeaTalk Instruments
12/24V
Supply
D5578-2
Page 58

2-24
2
hsb
Plus Series Fishfinders
In
2
hsb
Series Fishfinder Display
2
Series Repeater Display
hsb
SeaTalk and NMEA
Transducer
HSB
Compass
GPS
NMEA
NMEA
SeaTalk
NMEA Out
Non SeaTalk
Pilot
12/24V Supply
Distribution
Panel
12V Supply
D4868-3
Figure 2-14: Integrated System with Repeater Display and NMEA Instruments
SeaTalk
The SeaTalk standard was originally developed by Autohelm (part of the
Raymarine group), and allows compatible instruments to be connected by a
single cable carrying power and data in/out. This means that additional
instruments and functions can be added to a SeaTalk system, simply by
plugging them into the network.
SeaTalk is a precise, high-speed, bi-directional protocol which is flexible
enough to adapt to any number of instruments, without a central processor.
SeaTalk equipment can also communicate with non-SeaTalk equipment via
the NMEA standard.
SeaTalk Connection
SeaTalk data, if present, is the primary source for all navigational data except
heading.
This connection is necessary for full functionality between
displays.
2
hsb
Plus Series
Page 59

Chapter 2: Installation 2-25
The SeaTalk input/output should be connected at the rear SeaTalk 3-pin
connector. This appears as follows, when viewed from outside:
SeaTalk In/Out
1. Red (No internal connection)
2. Screen (0V)
3. Yellow (Data)
D3232-4
Figure 2-15: SeaTalk Connector
Table 2-5: Sea Talk Connections
Pin No. Function Color
1+12 VRed
20 V Shield
3 Data Yellow
Note:
1. The display does not supply 12 V via the SeaTalk connector, nor does the
SeaTalk connector require 12 V to operate.
12 V is required for other SeaTalk units (except where SeaTalk is connected only between two
2
hsb
displays).
2. If you are connecting an active compass to the fishfinder, the NMEA input
has priority. You should, therefore, use an NMEA input channel (see Power
and NMEA Input Connection) rather than the SeaTalk interface, unless the
compass only has a SeaTalk output.
In
SeaTalk and NMEA
To connect the display unit to the SeaTalk bus, connect a standard SeaTalk
cable between the SeaTalk connector on the rear of the display and a SeaTalk
instrument or the SeaTalk bus.
Standard SeaTalk cables are available in a range of lengths (part numbers
D284 to D287), and cables for connecting to SeaTalk units with round
connectors are also available (part numbers D187 or D188), see Section 2.2
for further details.
NMEA 0183
The NMEA 0183 Data Interface Standard was developed by the National
Marine Electronics Association of America. It is an international standard that
enables equipment from many different manufacturers to be connected
together and to share information.
Page 60

2-26
2
hsb
Plus Series Fishfinders
The information is passed in “sentences”, each of which has a three-letter
sentence identifier. When you check to see if one item will “talk” to another,
make sure that the two items both use the same sentence identifiers. For
Auxiliary Junction
Using the SeaTalk
example: VTG carries Course and Speed Over Ground data; GLL carries
latitude and longitude; DBT carries water depth; MWV carries relative wind
Box
angle and wind speed data.
The NMEA 0183 standard carries similar information to SeaTalk. However, it
has the important difference that one cable will only carry information in one
direction. For this reason NMEA 0183 is generally used to connect a data
receiver and a transmitter together: for example, a compass sensor
transmitting heading to a radar, or a GPS sensor (or Chartplotter) transmitting
position and navigation data to a radar.
NMEA Input Connection
The two NMEA/Power input connectors are normally used for non-SeaTalk
Compass (heading) data or GPS. It can also be used for additional navigation
data (if not provided via SeaTalk).
Connect the input(s) to the orange and yellow wires (Channel 1) and/or the
green and blue wires (Channel 2). Refer to Power and NMEA Input
Connection on page 2-17 for further details.
For example, to connect a Raymarine Heading Sensor to the NMEA Channel
1 input, connect the cables and power supply using a suitable connector block,
as shown in the diagram below. If installed, it may be convenient to connect
the power to the SeaTalk auxiliary junction box described in the following
section.
Red
Yellow
Black
+12 V
+ NMEA Data (orange)
-- NMEA Data (yellow)
0V
D3604-1
Figure 2-16: NMEA Input Connection
Using the SeaTalk Auxiliary Junction Box
A junction box is used to connect the SeaTalk system to the
display unit. This junction box enables the SeaTalk bus, power and GPS to be
connected.
2
hsb
Plus Series
Page 61

Chapter 2: Installation 2-27
If power is not already available (via another SeaTalk instrument), the
junction box can be used to apply power to the SeaTalk bus for other
applications. The junction box may also be used for other purposes, e.g.,
supplying power to a flux gate compass and routing the compass data to the
2
hsb
Plus Series display NMEA In connection, or alternatively, for connecting
a NMEA GPS system.
The junction box includes:
Box
• SeaTalk cable and connector to attach to display unit
• Power cable to connect to 12 V power (if required)
• Input connections to connect SeaTalk cable from external equipment
• Spare connections for another instrument
CAUTION:
Ensure correct polarity of the 12 V supply before applying SeaTalk
power. Use a multimeter to check the connections.
Figure 2-17 shows how to connect the junction box; Appendix B provides
connection details for specific Raymarine, Apelco and Autohelm GPS and
Beacon Receiver systems.
To Display Unit
SeaTalk Socket
12V
Power
Supply
To GPS
Power Out: 1 & 2
Power In: 1 & 3
Spare
Input
Using the SeaTalk
Auxiliary Junction
Fused
Figure 2-17: Using the Auxiliary Junction Box
Cable
SeaTalk
Power
GPS
Core
Black (screen)
Red
Yellow
Black (screen)
Red
Black (screen)
Red
Yellow
Terminal
1
2
3
1
2
1
2
3
Function
0V
+12v
SeaTalk
0V
+12V
0V
+12V
SeaTalk
D4291-1
Page 62

2-28
Data Output
Data is transmitted in SeaTalk and NMEA formats as detailed in Appendix D
and can be used to enhance other equipment as required.
2
hsb
Plus Series Fishfinders
Data Output
The SeaTalk input/output connection is detailed in SeaTalk Connection on
page 2-24.
The NMEA output connector is a 4-pin connector as illustrated below. The
1.5 m NMEA OUT cable has a ferrite clamp attached to ensure EMC
conformance.
NMEA OUT connector
Pin 2, white
Pin 5, screen
Rear of display
3
4
Pin 3, blue
Pin 4, not connected
2
NMEA out
5
NMEA OUT connector
Pin Pin name Function
2 NMEA_GND NMEA ground
3 NMEA_SIG NMEA data output
4 N/C N/C
5 CGND Screen
*Pin 1 does not exist on this connector
D4254-2
Figure 2-18: NMEA Output Connector
Data Conversion
The
communications links as follows:
This enables data received by the display to be passed to other instruments. For
example, if you have a master and a repeater display, you only need to connect
NMEA In to the master display, which will pass the data to the repeater via
SeaTalk.
You can prevent NMEA heading data being bridged onto the SeaTalk bus refer to Bridge NMEA Heading on page 7-9.
Note: To transfer NMEA data, or to convert the data, the display must be powered On.
2
hsb
Plus Series displays convert some information across the
NMEA In to NMEA Out and SeaTalk
SeaTalk to NMEA Out
Page 63

Chapter 2: Installation 2-29
2.8 Integrated System Checks
Chart Display
When you have connected your display unit to the required equipment ensure
that position data is available at the display via NMEA or SeaTalk.
To confirm your chartplotter is operating correctly, perform the following
checks:
1. Without a chart card installed, select the Chart display mode and select a
suitable range scale. Verify that the world map is visible.
Use the trackpad to check cursor movement and normal scrolling action.
2. To ensure that the display is responding to position data:
Press FIND SHIP, check the cursor is fixed on the vessel symbol which is cor-
rectly positioned at the center of the chart display.
3. Insert a chart cartridge for the area of your vessel.
Use the RANGE key to zoom-in to check that the chart data is being dis-
played.
Received Data
If either SeaTalk or NMEA In is connected, verify that the expected data is
displayed.
1. Press DISPLAY and select the NAV DATA WINDOW ON.
Check that the expected data is displayed.
2. If heading data is connected, select Chart mode and check it is displayed in
the heading data box, or select Radar mode and check heading is displayed
in the Status Bar.
Checks
Integrated System
Transmitted Data
If SeaTalk or NMEA Out is being transmitted to other equipment, check that
the data is being received correctly.
An NMEA Out connector is used to transmit navigation data. The NMEA
Output cable should be connected to the upper, left connector on the rear of the
display unit.
Note: The NMEA Output cable has a ferrite clamp attached to ensure EMC
conformance.
Page 64

Transmitted Data
2-30
2
hsb
Plus Series Fishfinders
Page 65

Chapter 3: Getting Started & Adjusting the Display 3-1
Chapter 3: Getting Started & Adjusting the
Display
3.1 Introduction
This chapter provides information, instructions to get you started using the
2
hsb
Plus Series Fishfinder displays. It will help you to become familiar with
the display and the functions of the controls before you start using the unit.
More detailed information on operating the Fishfinder display is provided in
Chapter 4. Chartplotter operating details are given in Chapter 5 and
Chapter 6.
Conventions Used
Throughout this handbook, the dedicated (labelled) keys are shown in bold
capitals; for example, MENU. The soft key functions, menu names and
options are shown in normal capitals; for example, SCREEN.
Introduction
Operating procedures, which may consist of a single key-press or a sequence
of numbered steps, are indicated by a ➤ symbol in the margin.
When the procedure requires you to press a soft key, the soft key icon is shown
in the margin.
Simulator
The display unit includes a simulator function, that allows you to practice
operating your Fishfinder or Chartplotter (Raychart models only) without data
from the transducer or GPS system. You will need to use the set up options to
switch the display to simulator mode, as described in Section 3.2.
You need to connect the display to a 12V or 24V DC power supply, connecting
the red wire from the power lead to positive (+) and the black wire to negative
(-). See Chapter 2 for full details.
The following section, Section 3.2, includes instructions to view simulated
fishfinder and chart images.
Page 66

3-2
3.2 Switching the Display On and Off
The factory default power-up mode is full-screen fishfinder. Once you have
used the display unit it powers-up in the last used mode. The following
sections describe the power-up sequence in fishfinder and chart modes, how to
adjust the lighting and color controls, and how to select simulator mode.
2
hsb
Plus Series Fishfinders
Display On and Off
Switching the
➤ To switch the display on in fishfinder mode:
Press and hold the POWER key until the unit beeps. The keys light up and after
a few moments the display shows the fishfinder screen.
AUTO GCRZFH
52
ft
ZOOMFREQUENCY
50kHz
45
BTM.LOCK A-SCOPE
SD
0
8
38
100
Figure 3-1: Switching On in Fishfinder Mode
You can adjust the display brightness and contrast/colors, as described later in
this chapter.
Setting the Fishfinder as Master/Repeater
You need to set your display as a fishfinder master or repeater. If the display is
connected to a sonar transducer it is a master display. If your display is part of
an integrated system, connected to another fishfinder master it is a repeater
display. Fishfinder functionality is the same on both master and repeater
displays, with the following limitations:
• Automatic Gain cannot be adjusted on the repeater display, but Manual
Gain can be.
• STC cannot be adjusted on the repeater display.
• Depth offset, speed and temperature calibration (see Section 7.4) cannot be
set on the repeater display.
• Frequency can be selected on either master or repeater display, but the
same frequency is used on both displays.
Page 67

Chapter 3: Getting Started & Adjusting the Display 3-3
• Range adjustment can be made on either master or repeater display, but any
changes made are used on both displays.
• Simulator mode is repeated from the master, but cannot be selected on the
repeater display.
AUTO G RZ
50kHz
0
8
25
38
45
52
ft
ZOOMFREQUENCY
BTM.LOCK A-SCOPE
50
75
100
Figure 3-2: Typical Fishfinder Display at Switch On
➤ To set the fishfinder display as a master or repeater:
Switching the
Display On and Off
D5008-2
1. Press the MENU key, then press the SONAR SET UP soft key. The sonar set
up pop-up window is displayed.
2. Use the trackpad to move the selection bar over the option SONAR HSB
MODE. The HSB mode soft keys are displayed.
3. Press the appropriate soft key to set the display as a MASTER or REPEATER.
Press ENTER twice to return to the default display.
Page 68

3-4
2
hsb
Plus Series Fishfinders
Chart Mode (Raychart Models only)
If the display was last used in chart mode before being powered off, it will
return to chart mode the next time it is switched on.
➤ To switch the display on in chartplotter mode, press and hold the POWER key
until the unit beeps. The keys light up, the Raychart graphic is displayed,
Display On and Off
Switching the
followed by the caution:
CAUTION:
Raychart chart displays are based on cartographic data that C-MAP
believes to be accurate. However, you should not rely on these displays as
your primary source of navigation. Rather, your Raychart should be used
only as a backup to official government charts and traditional methods of
navigation.
When you have read and understood the caution, press the CONTINUE soft key.
The chart is displayed.
If this is the first time the chartplotter has been turned on, and no chart card is
installed, the display shows the small-scale world map and the default soft
keys. Otherwise, the display shows the selected chart area and any data that
were displayed when the display was last used.
Until unit beeps
Figure 3-3: Switch On - Chart Mode
Switch Off
CAUTION:
To provide protection against the damaging effects of UV light, it is
advisable to replace the sun cover provided when the color LCD display is
not in use.
A reminder is displayed when you switch off the color LCD display.
D4277-3
Page 69

Chapter 3: Getting Started & Adjusting the Display 3-5
➤ To switch the display unit off, press and hold the POWER key for three
seconds. A countdown timer is displayed as shown below:
GAIN
DISPLAY
VRM/EBL
MARKS
MULTI
Countdown timer:
number of seconds
to power off
POWER OFF IN
3s
ALARMS
RANGE
Simulator Mode
Figure 3-4: Switch Off
When the counter reaches zero a beep sounds, and the display unit switches
off. Release the POWER key.
Note: Switch the display unit off before you remove either the power or transducer cords.
Simulator Mode
When simulator mode is on a simulator database box is displayed.
When the display is switched off then on again, simulator mode is maintained.
It is recommended that you select the System Set Up Menu and switch off
simulator mode when you have finished.
➤ To view simulated image:
MENU
SYSTEM
SET UP¬
1. Press MENU followed by either:
the SYSTEM SET UP soft key for simulated data or
the SONAR SET UP soft key for a simulated fishfinder image.
The set up menu pop-up is displayed.
3
SECONDS
POWER
ENTER CLEAR MENU
D3599-2
SONAR
SET UP¬
2. Use the trackpad to move the selection bar over the option SIMULATOR/
SONAR SIMULATOR. The simulator soft keys are displayed.
3. In the system set up menu, press DATA to view the chart display with simulated position.
In the sonar set up menu, press the ON soft key to switch on the sonar simulator.
4. Press ENTER twice to return to the default display.
Note: Any waypoints placed on the chartplotter in simulator mode are retained in the database list and are available for use in routes.
Page 70

3-6
2
hsb
Plus Series Fishfinders
Changing the Lighting & Contrast (Monochrome LCD)
On the L755RC Plus, you can change the level of backlighting and contrast for
the screen and keys. The key lighting is set the same as the screen lighting,
except that it remains switched on at its lowest level even when the screen
lighting is turned off, so that you can always find the keys.
(Monochrome LCD)
Lighting & Contrast
Changing the
➤ To change the lighting and contrast:
1. Press the MULTI key to display the soft key controls:
The last-used soft key is highlighted in inverse video (white text on a black
background).
37%70%
50%
CONTRAST
POWER
AUTO LO HI
LIGHT CONTRAST
WHT LINE
OFF ON
D4895-2
2. Press the LIGHT soft key if it is not already highlighted.
3. The LIGHT soft key toggles lighting ON/OFF.
4. Use the trackpad (up or down) to increase or decrease the setting. You can
press and hold the trackpad to change the setting more rapidly. The lighting
level is adjusted as you change the setting.
5. Press the CONTRAST soft key. Adjust the setting in the same way as for the
lighting. There are 64 different contrast levels.
6. Press ENTER to return to the default screen, with the new lighting and con-
trast levels retained, or press CLEAR to discard the changes and return to
the default screen.
If lights are left ON when you switch off the display, the next time the display
is switched on, the lights will be ON, but at the default setting of 42%. The new
contrast level is retained until you reset it, unless you set the control very low
or very high; in this case, the contrast will be restored as follows:
Contrast set < 30% restored to 30%
Contrast set > 70% restored to 70%
Changing the Brightness & Color Settings (Color LCD)
The MULTI key on the color LCD Fishfinder provides controls to set up the
display colors and brightness. You can choose the background color and the
color threshold; color threshold lets you determine which echoes are
displayed, by selecting the minimum color strength the fishfinder uses. You
can also select the color set, for a bold or soft color palette. The brightness of
the screen can be adjusted over a wide range, suitable for viewing in daylight
(high brightness level) or at night (low brightness level).
Page 71

Chapter 3: Getting Started & Adjusting the Display 3-7
The key lighting is automatically adjusted as you alter the screen lighting, so
that you can always find the keys. If you set the backlight to a high level, the
key lighting is dimmed; if you set the backlight to a low level, the key lighting
level is increased.
Adjusting the Brightness
➤ To change the screen brightness:
1. Press the MULTI key to display the soft key controls:
70%
Changing the
Brightness & Color
Settings (Color LCD)
MULTI
POWER
AUTO LO HI
LIGHT
COLOR
SETTINGS
WHT LINE
OFF ON
D4896-2
2. The LIGHT soft key indicates the brightness level, use the trackpad (up or
down) to increase or decrease the setting. You can press and hold the trackpad to change the setting more rapidly. The brightness level is adjusted as
you change the setting.
3. Press ENTER to return to the default screen, with the new brightness level.
➤ To set the screen brightness to 100%:
Press and hold the MULTI key for one second. The brightness is increased to
100%.
The brightness level is retained when you switch off the display.
Note: During night-time use, the brightness may be set very low, when subsequently operated during the day it may not be apparent that the display is on;
press MULTI then use the trackpad to increase brightness. Alternatively, press
and hold MULTI for one second to set the brightness to 100%.
Selecting the Background Color
Five colors are available for the fishfinder display background – black, dark
gray, light gray, white and dark blue. The color you select is used on all the
fishfinder windows (scrolling bottom, Zoom, Bottom Lock and A-Scope).
You will probably find that you need to change the background color in
different light conditions. For example, a white background is probably
easiest to see in bright sunlight, but a black background may be preferable at
night.
Page 72

Settings (Color LCD)
Brightness & Color
3-8
2
hsb
Plus Series Fishfinders
➤ To change the background color:
MULTI
COLOR
SETTINGS
B'GROUND
COLOR
Changing the
1. Press the MULTI key to display the soft key controls, then press COLOR SET-
TINGS.
2. Press the BGROUND COLOR soft key. The background color soft keys are
displayed below a pallet of available colors. The selected color is highlighted.
3. Press the left or right BACKGROUND COLOR soft key until the required color
is highlighted.
The fishfinder display changes, so you can see the effect as you change the
background color.
4. Press ENTER or CLEAR twice to return to the MULTI soft keys.
Selecting the Color Threshold
You use the color threshold control to determine the minimum echo strength
that is displayed. Each range of echo strengths is displayed in a color as shown
in the color bar; you select the minimum strength that is displayed by blanking
echo colors below the required minimum.
MULTI
COLOR
SETTINGS
COLOR
THRESH
If you blank a color, the corresponding echoes are displayed in the background
color. You can remove up to six colors, but you cannot remove the strongest
color.
The color threshold you select is used on all the fishfinder windows (scrolling
bottom, Zoom, Bottom Lock and A-Scope).
➤ To change the color threshold:
1. Press the MULTI key to display the soft key controls, then press COLOR SET-
TINGS.
2. Press the COLOR THRESH soft key. The color threshold soft keys are displayed below color indicator showing the available echo colors.
The weakest color is at the bottom of the indicator, the strongest color at the
top; you can remove colors from the bottom up.
3. Press the left or right ADJUST COLOR THRESHOLD soft key to change the
color threshold.
Pressing the left key removes out the next color up, it increases the minimum strength displayed.
Pressing the right key displays the next color down, it decreases the minimum strength displayed.
4. Press ENTER or CLEAR twice to return to the MULTI soft keys.
Page 73

Chapter 3: Getting Started & Adjusting the Display 3-9
Selecting the Color Set
➤ To change the color palette:
MULTI
COLOR
SETTINGS
1. Press the MULTI key to display the soft key controls, then press COLOR SET-
TINGS.
2. Press the COLOR SET soft key; this toggles between color set 1, bolder colors and color set 2, softer colors.
3. Press ENTER or CLEAR twice to return to the default screen.
3.3 Controlling the Display
You control the display using the cursor and control keys. You start all
operations from the default screen, that is the default soft keys are displayed:
Fishfinder
Chart
When you have completed an action using the soft keys, press ENTER or
CLEAR to return to the default screen; you may need to press ENTER or
CLEAR several times to back-track through the soft key hierarchy.
Note: If you have set up your system so that the default soft keys are not displayed all the time, press any soft key to display the labels.
The remainder of this section describes how to select the mode of operation
and switch half-screen windows on/off. The following sections describe how
to set up the display for the Fishfinder and for the Chart (for fishfinder displays
with chartplotter functionality).
ZOOM BTM.LOCKFREQUENCY
GOTO SCREENROUTE FIND SHIP
A-SCOPE
D5010-1
D4160-1
Display
Controlling the
The controls are summarized in the laminated Quick Reference cards
that accompany this handbook.
Selecting the Mode of Operation
You use the DISPLAY key to select the full-screen mode. If the data is available
on your system, the following modes (described in Operating Modes on
page 1-6) can be selected:
•Chart
Page 74

3-10
2
hsb
Plus Series Fishfinders
• Fishfinder (Sonar)
• Data Log
The DISPLAY key also accesses the soft keys for the half-screen window
options.
➤ To change the mode, press the DISPLAY key to show the DISPLAY pop-up, then
Selecting the Mode
of Operation
DISPLAY
press again to cycle through the modes available, shown in Figure 3-5.
"DISPLAY" TO SELECT FULL SCREEN OPTION
SOFTKEYS TO SELECT WINDOW OPTION
CURSOR
BRG 099
RNG 2.410nm
o
R
CHART SONAR LOG
WINDOWS
OFF ON
ft
SELECT
WINDOWS
SPLIT
HOR VER
40
D5012-1
Figure 3-5: Using the DISPLAY Key
The selected mode is shown by an icon with a black (monochrome LCD) or
red (color LCD) border and the mode is displayed on the screen. The
associated half-screen window soft keys are also displayed.
When the required mode is shown, press ENTER or CLEAR. The default soft
keys are displayed. The selected mode is shown full-screen; in Fishfinder and
Chart mode you can switch on half-screen windows for additional display, as
described in the following section.
If you press DISPLAY again, the pop-up and soft keys for the current mode are
shown.
Using the Dedicated Keys in Different Display Modes
When certain dedicated (hard) keys are pressed on a unit with the Raychart
feature, the sets of soft keys that appear can vary depending on whether the
currently selected mode is fishfinder or chart. The following describes the soft
keys that appear in the Fishfinder and Chart modes.
Page 75

Chapter 3: Getting Started & Adjusting the Display 3-11
MULTI key
In Fishfinder mode on the L755RC Plus Monochrome display:
37%70%
ALARMS
POWER
AUTO LO HI
LIGHT CONTRAST
WHT LINE
OFF ON
In Fishfinder mode on all color displays:
70%
POWER
AUTO LO HI
LIGHT
COLOR
SETTINGS
WHT LINE
OFF ON
In Chartplotter mode on all displays:
70%
LIGHT
ALARMS key
In Fishfinder mode on all displays:
FISH
ALARM
OFF ON
SHALLOW
ALARM
DEEP
ALARM
D4895-2
of Operation
Selecting the Mode
D4896-2
In Chartplotter mode on all displays:
ALARMS
ARRIVAL ALARM
OFF TRACK ALARM
ANCHOR ALARM
GROUNDING ALARM
COUNTDOWN TIMER
ALARM CLOCK
ALARMS SET UP
SELECT ARRIVAL
ALARM RADIUS
D5031-1
0.01nm
ON
OFF
5M/1.0nm
00:33:00
OFF
D4265-4
Page 76

3-12
2
hsb
Plus Series Fishfinders
Selecting a Half-Screen Window for Display
Note: Windows can only be used with Fishfinder or Chart screens, they are
not available on the data log screen.
➤ To select a window for display:
Selecting the Mode
of Operation
The following soft keys are displayed with an image of each available window:
Fishfinder
1. From the full-screen Fishfinder or Chart mode, press the DISPLAY key.
DISPLAY
WINDOWS
OFF ON
SELECT
WINDOWS
SPLIT
HOR VER
D5011-1
Chart
DISPLAY
WINDOWS
OFF ON
SELECT
WINDOW
D4156-2
2. In fishfinder mode check that SPLIT is set to HOR. To select a different window, press either SELECT WINDOWS soft key until the required window is
highlighted. If necessary, this will toggle windows on. Press ENTER.
3. To toggle windows off, press the WINDOWS OFF ON soft key.
If any data boxes were displayed at the bottom of the full-screen image, they
are switched off until you return to full-screen mode. However, you can use
the SCREEN soft key in chart mode to switch the data boxes on - they are
displayed in the upper window.
Figure 3-6 shows the half-screen horizontal windows (in fishfinder mode).
Switching Control Between Fishfinder & Chart Screens
In a combined or an integrated system, to switch control between fishfinder,
radar and chart, you can change the full-screen mode using the DISPLAY key.
Alternatively, when you have both fishfinder and chart displayed in halfscreen windows the soft key CHRT SNR lets you toggle operating control
between the fishfinder and the chart window.
If a window is active, i.e., control of the cursor via the trackpad is available in
that window, and you switch windows off, control automatically returns to the
full-screen (upper window) mode.
Page 77

Chapter 3: Getting Started & Adjusting the Display 3-13
Fishfinder:
DISPLAY
ZOOM MORE¬FREQUENCY
CHRT SNR
D5013-1
Chart:
GOTO MORE¬ROUTE
CHRT SNR
D5025-1
➤ To change the active window, press the CHRT SNR soft key to toggle control
between the fishfinder and chart display. The current active display is
highlighted in gray (monochrome LCD) or red (color LCD) on the CHRT SNR
label and the cursor appears in that window.
Returning to the Full-Screen Display
To return to the full-screen display you can turn windows off, as previously
described. Alternatively, to return to full-screen display:
➤ Press and hold the DISPLAY key for 2 seconds to return to the currently
selected full-screen (upper window) display.
of Operation
Selecting the Mode
Page 78

3-14
CDI Window
AUTO G RZ
50kHz
2
hsb
Plus Series Fishfinders
BDI Window
AUTO G RZ
0
50kHz
0
100
Selecting the Mode
of Operation
ft
XTE
150
200
ft
225°T
0.28nm
WINDOWS
WINDOWS
OFF ON
OFF ON
STEER PORT
WAYPOINT 001
ZOOMFREQUENCY
SELECT
SELECT
WINDOWS
WINDOWS
WPT BRG
351°T
WPT RNG
26.8nm
TTG
03
h:59m
BTM.LOCK A-SCOPE
SPLIT
SPLIT
HOR VER
HOR VER
40
30
20 20
nm nm
10 10
STEER STARBOARD
WAYPOINT 001
BTM.LOCK A-SCOPE
SELECT
WINDOWS
WINDOWS
OFF ON
ZOOMFREQUENCY
100
150
200
XTE
1.45nm
WPT BRG
351°T
WPT RNG
23.1nm
TTG
01
h:13m
SPLIT
HOR VER
Depth/Temperature Window Chart Window
AUTO G RZ
50kHz
0
AUTO G RZ
50kHz
0
TEMPERATURE (°C)
26.4
26.0
25.6
25.2
24.8
24.4
24.0
23.6
23.2
WINDOWS
OFF ON
100
150
200
0102030405060
SPLIT
HOR VER
12.8
50
91
131
170
200
WINDOWS
OFF ON
ZOOM MORE¬FREQUENCY CHRT SNR
ZOOMFREQUENCY
ft
MINUTES
BTM.LOCK A-SCOPE
SELECT
WINDOWS
DEPTH (ft)
Figure 3-6: Fishfinder Half-Screen Window Options
ft
SELECT
WINDOWS
100
150
200
SPLIT
HOR VER
D5023-2
Page 79

Chapter 3: Getting Started & Adjusting the Display 3-15
3.4 Fishfinder Display Control Functions
The Fishfinder automatically locates the bottom and displays the information
using an appropriate scroll speed and range. However, controls are provided
so you can adjust scroll speed and range. You can also select the transducer
frequency and select certain data for display. This section describes how to use
the controls to set-up your fishfinder display:
• Viewing databoxes
• Changing the scroll speed
• Changing the range
• Selecting the power setting
• Selecting the frequency
In addition this section describes how to select the fishfinder display options.
• Display Bottom Lock
• Display A-Scope
• Zoom an area of the image.
Viewing Data Boxes
The cursor data box and a group of up to six data boxes can be displayed, if the
information is available on your system. You select which data is displayed
in the boxes during system set up as described in Chapter 7. The default
data box positions are along the bottom of the display. Each box can be moved
to the required position on the screen using the context-sensitive cursor.
To switch the data boxes on and off you need to go to Chart mode – see
Customizing the Screen Presentation Options on page 3-26. Switching the
databoxes on/off in Chart mode also affects their display in Fishfinder Mode.
Fishfinder Display
Control Functions
Changing the Scroll Speed
The standard fishfinder display is the scrolling bottom image; this is a
graphical representation of the echoes seen by the Fishfinder. New
information appears at the right hand side of the display and scrolls to the left.
The speed at which the display scrolls is adjustable, but the same section of the
bottom is displayed regardless of scrolling speed. As illustrated in Figure 3-7,
if you select a faster speed, more detail is displayed and is useful when you are
looking for fish; if you select a slower speed the information remains on the
display for longer.
Page 80

3-16
2
hsb
Plus Series Fishfinders
Changing the Scroll
Speed
Figure 3-7: Effect of the Scroll Speed
The Fishfinder automatically adjusts the scroll speed, based on depth.
Alternatively you can manually adjust the speed. If you select automatic
adjustment, the scroll speed is related to boat speed as follows:
• Less than, or equal to 0.5 kn, scroll speed is constant at 10%
• Between 0.5–15 kn, scroll speed varies linearly with boat speed
• Greater than 15 kn, scroll speed is constant at 100%
MENU
SCROLL
SPEED
MENU
PAUSE
If you select manual adjustment, the scroll speed is not related to the speed of
the boat over the bottom. You can also pause the display (the depth indication
continues to be updated).
➤ To change the scrolling speed:
1. Press MENU, then press the SCROLL SPEED soft key.
2. If necessary, press the SCROLL AUTO MAN soft key to toggle the setting
between AUTO and MAN.
3. For manual adjustment, use the trackpad to increase the scroll speed. You
can press and hold the trackpad to change the value more rapidly.
4. Press ENTER to return to the Menu soft keys, then ENTER again to return to
the default display.
➤ To pause the scrolling display:
1. Press MENU, then press the SCROLL SPEED soft key.
2. Press the PAUSE soft key. The display stops scrolling and the key is relabeled RESUME.
Page 81

Chapter 3: Getting Started & Adjusting the Display 3-17
3. To resume scrolling, press the RESUME soft key. The key is relabeled
PAUSE.
4. Press ENTER to return to the Menu soft keys, then ENTER again to return to
the default display.
Selecting the Power Setting
The POWER soft key provides adjustment of the transducer signal. When AUTO
is selected (default), the Fishfinder automatically determines the power
setting based on the current depth. LO power (100 W) is used in depth ranges
less than 8 ft (2.4 m) and HI power (600 or 1000 W, depending on your
transducer) is selected for depths greater than 12 ft (3.7 m). When AUTO is
selected the current automatic power setting is indicated in the top status line
by an L (low) or H (high).
Note: When AUTO POWER has been selected, and you manually adjust the
RANGE to 30 ft (10 m) or greater, the Fishfinder switches to HI power, regard-
less of what the digital depth is calculated to be.
Setting
Selecting the Power
If, however, you wish to manually adjust the power to suit current conditions,
you can select either LO or HI power.
The power setting is retained when the unit is powered off.
➤ To change the power setting:
MULTI
1. Press the MULTI key to display the soft key controls.
POWER
AUTO
LO
2. Press the POWER soft key to toggle between AUTO, LO, or HI power. The
HI
selected setting is highlighted.
3. Press ENTER or CLEAR to return to the default screen.
Changing the Fishfinder Range
The Fishfinder automatically adjusts the display range. Alternatively, the
RANGE key lets you select the maximum depth displayed on the scrolling
bottom and A-Scope displays. You can also set the shift value to move the
image window up or down within the current range.
If you select automatic range adjustment, the Fishfinder selects the shallowest
range that keeps the bottom in the lower half of the display window. Shift is
disabled (the value is ignored) when auto-range is selected.
Page 82

Fishfinder Range
3-18
2
hsb
Plus Series Fishfinders
The following range/shift values are available:
Table 3-1: Range and Shift Values
Feet Fathoms Meters
Range Shift Range Shift Range Shift
511121
Changing the
10 2 2 1 4 1
15 5 3 1 6 2
20 5 4 1 8 2
30 10 5 1 10 2
40 10 8 2 15 5
50 10 10 2 20 5
60 20 15 5 25 5
80 20 20 5 30 10
100 25 25 5 40 10
150 50 30 10 50 10
200 50 40 10 60 20
250 50 50 10 80 20
300 100 60 20 100 25
400 100 80 20 150 50
600 200 100 25 200 50
800 200 150 50 300 100
1000 250 200 50 400 100
1500 500 250 50 500 100
2000 500 300 100 600 200
2500 500 400 100 800 200
3000 1000 500 100 1000 250
3500 875 600 150 1200 300
4000 1000 700 175 1400 350
4500 1500 750 250 1500 500
5000 1250 850 170 1700 425
Note:
1. Range detection below 3000 ft (1000 m) is only available with the L1250
Plus and L1250RC Plus displays after you have fixed the Depth Range setting to 5000 ft. See Depth Range (L1250 Plus and L1250RC Plus only) on
page 7-15 for details.
2. All other
range of 3000 ft (1000 m), unless repeating data from an L1250 Plus or
L1250RC Plus via the High Speed Bus.
2
hsb
Plus Series Fishfinders are limited to a maximum depth
Page 83

Chapter 3: Getting Started & Adjusting the Display 3-19
➤ To adjust the range and shift values:
1. Press RANGE, this sets adjustment to manual and the range soft keys are
RANGE
displayed. The range adjusts up or down depending on the direction
pressed.
2. Use the RANGE key to adjust the range: press the up arrow to select a shal-
lower range, press the down arrow to select a deeper range.
RANGE
AUTO MAN
3. If necessary, press the RANGE AUTO MAN soft key to select AUTO range.
AUTO range is indicated by the letter R in the status bar.
4. To adjust the shift, press the appropriate SHIFT soft key: use the up soft key
to select a shallower shift, use the down soft key to select a deeper shift.
The image window is shifted up by the selected amount
5. Press ENTER to return to the default display.
When AUTO POWER has been selected, and you manually adjust the RANGE to
30 ft (10 m) or greater, the Fishfinder switches to HI power, regardless of what
the digital depth is calculated to be.
Manually Adjusting RANGE to Ignore Surface Clutter
There may be a time when clutter near the water’s surface is so thick it returns
an echo that is stronger than the return from the bottom. In this a case, it is
possible the fishfinder may determine the clutter to be the seabed rather than
the bottom itself. You can use the RANGE setting to force the fishfinder to
ignore any interference in the upper boundaries of the water that may be giving
false bottom readings.
If you manually adjust the RANGE to 400 ft (150 m) or greater, the Fishfinder
ignores the first 25% of the range for the purpose of determining the digital
depth. If the RANGE is set to 400 ft (150 m), the first 100 ft (37.5 m) is ignored
for determining the depth. If the RANGE is set to 3000 ft (1000 m), the first 750
ft (250 m) is ignored, etc.
Changing the
Fishfinder Range
As an example, let’s say the RANGE is set to 400 ft but there is some clutter at
126 ft that is returning a stronger signal than the bottom. Because its return is
stronger, the fishfinder determines the clutter to be bottom and displays it as
the bottom depth (126 ft). See Figure 3-8.
The upper 25% (400 x 0.25 = 100 ft) of the range is ignored but because the
clutter is deeper than this (126 > 100 ft), the clutter is still detected as bottom.
If you then manually adjust the RANGE to 600 ft, the value that is ignored now
increases to 150 ft (600 x 0.25 = 150). The clutter is now within the excluded
range (126 < 150) and so is ignored. The correct bottom of 302 ft is now
displayed.
Page 84

3-20
AUTO G RZ H
50kHz
100
2
hsb
Plus Series Fishfinders
AUTO G Z H
0
50kHz
0
200
Selecting the
Frequency
ft
ZOOMFREQUENCY
Signal from surface clutter is stronger than
from bottom. When RANGE is set to 400 ft,
clutter is below top 25% of range (100 ft),
so is incorrectly determined to be bottom.
BTM.LOCK A-SCOPE
200
300
400
400
ft
ZOOMFREQUENCY
Manually adjusting RANGE to 600 ft, clutter
is now within top 25% of the range (150 ft),
so it is ignored and the correct bottom is
detected.
BTM.LOCK A-SCOPE
600
D6061-1
Figure 3-8: Manually Adjusting RANGE to Ignore Surface Clutter
Selecting the Frequency
The
frequencies used are 50 kHz and 200 kHz. The Fishfinder automatically
selects the appropriate frequency. Alternatively, you can manually select
either frequency, or both frequencies simultaneously. Each is suitable for a
particular purpose:
2
hsb
Plus Series Fishfinders use dual frequency sonar. The two
50 kHz Frequency
When using this frequency, the transducer scans a wide area. The 50 kHz
signal penetrates water well, so is good for use in deep water.
200 kHz Frequency
When using this frequency, the transducer scans a narrower area, but produces
a more detailed view. The 200 kHz signal is good for finding fish near the
bottom or close together. It is better for use in shallow water.
Split Frequency
The transducer can operate in both 50 kHz and 200 kHz frequencies at the
same time. If you choose split frequency operation, the scrolling bottom
display is split horizontally; the upper half shows the 200 kHz detailed view
and the lower half shows the 50 kHz image.
Page 85

Chapter 3: Getting Started & Adjusting the Display 3-21
➤ To change the frequency:
FREQUENCY
1. Press the FREQUENCY soft key. The frequency selection soft keys are dis-
played.
2. Press the appropriate soft key – 50 KHZ, 200 KHZ or SPLIT. The scrolling bot-
tom is displayed in the selected frequency. If you choose split, the scrolling
bottom is displayed in both frequencies with 200 kHz in the upper window
and 50 kHz in the lower window.
3. If necessary, press the AUTO FREQ OFF ON soft key to select AUTO fre-
quency. AUTO frequency is indicated by the letter F in the status bar.
4. Press ENTER or CLEAR to return to the default display.
You can choose the split frequency display with the fishfinder display options,
Bottom Lock, A-Scope, or Zoom.
When the RANGE has been manually set to 400 ft (150 m) or greater, the digital
depth calculation will be made at 50kHz, regardless of the FREQUENCY setting
used. 200kHz can still be displayed, but will not be used in determining the
depth.
Using Bottom Lock
The scrolling bottom display provides a top-down view, referenced from the
surface of the water. Bottom Lock shows a water column of fixed height,
referenced from the bottom, that appears flat. It removes bottom detail to
provide an image of objects directly above the bottom, and is useful when you
are looking for fish that feed close to the bottom.
Using Bottom Lock
You can select the Bottom Lock image to be vertically split with the scrolling
bottom display, or it can replace the scrolling bottom display.
As illustrated in Figure 3-9, the bottom is shown as a straight line. Notice that
some bottom features may extend above this line. The actual depth reading is
given in the bottom left hand corner of the Bottom Lock display.
Range intervals on Bottom Lock are measured up from the bottom (rather than
down from the surface). Thus, the bottom is shown as zero and the top number
indicates the maximum distance above the bottom being displayed. You can
adjust the Bottom Lock range.
If the A-Scope or Zoom image was displayed, selecting Bottom Lock
automatically switches OFF A-Scope or Zoom.
If you have split frequency selected, the Bottom Lock image is displayed in
both frequency windows.
If Target Depth ID is ON (see Target Depth ID on page 7-13), the target depth
is displayed as distance from the bottom.
Page 86

3-22
➤ To display the Bottom Lock image:
2
hsb
Plus Series Fishfinders
BTM.LOCK
played.
2. Press the BTM. LOCK OFF ON soft key to toggle the function ON.
1. Press the BTM. LOCK soft key. The Bottom Lock selection soft keys are dis-
Using Bottom Lock
AUTO G Z
200kHz
20
15
10
5
0
ft
ZOOMFREQUENCY
Figure 3-9: Bottom Lock Display
3. Press the BTM. LOCK FULL SPLIT soft key to toggle between a full window
bottom lock image or split windows. The bottom lock image is displayed.
If you select split windows, the fishfinder display is split vertically, with
the bottom lock image in the left hand window and the scrolling bottom
display in the right hand window.
In a split window display, a vertical bar appears (along the right hand edge
of the scrolling bottom image) that references the range being displayed in
the bottom lock window. This bar varies in height as the bottom lock range
is changed.
4. To adjust the range, press the appropriate BTM LOCK RANGE soft key: press
the up arrow to select a larger range, press the down arrow to select a
smaller range.
BTM.LOCK A-SCOPE
D5015-2
5. Press ENTER or CLEAR to return to the default display.
Page 87

Chapter 3: Getting Started & Adjusting the Display 3-23
➤ To reposition the bottom lock image:
1. Use the trackpad to move the cursor to the bottom image until the text BL is
BL
displayed near the cursor.
2. Press ENTER, a horizontal line appears, indicating the cursor is active. Use
the trackpad to move the line to the required bottom lock image position.
3. Press ENTER to reposition the bottom lock image, or CLEAR to cancel the
operation.
Using A-Scope
A-SCOPE
A-SCOPE
MODE
1 2 3
The scrolling bottom display provides a historical record of sonar echoes. Use
the A-Scope screen to show raw sonar data directly from the transducer beam.
This gives you a “real time” image of fish and bottom structure directly below
the transducer. This function is very useful in showing the strength of the echo
returned from a fish. At the lower end of the window, A-Scope also displays
the patented Bottom Coverage width indication.
➤ To display the A-Scope image:
1. Press the A-SCOPE soft key. The display is split vertically, with the A-Scope
image in the right hand window and the scrolling bottom image in the left
hand window.
2. Press the A-SCOPE MODE soft key to select one of the three modes for
A-Scope, as demonstrated in Figure 3-10:
i. Mode 1, in which the A-Scope image is angled outward as the signal
width (indicated with dotted lines) increases with depth.
ii. Mode 2, in which the image expands to take up the entire A-Scope win-
dow, providing greater resolution.
iii. Mode 3, in which only the left hand side of the image displayed in Mode
2 expands to the entire A-Scope window. This mode provides the greatest resolution.
Using A-Scope
3. Press ENTER to accept your selection.
Note: If the Bottom Lock or Zoom image is displayed, selecting A-Scope automatically switches
If you have split frequency selected, the A-Scope image is displayed in both
frequency windows.
➤ To remove the A-Scope image:
1. Press the A-SCOPE soft key.
A-SCOPE
OFF ON
2. Press the A-SCOPE ON OFF soft key to toggle off A-Scope.
3. Press ENTER.
OFF
Bottom Lock or Zoom.
Page 88

Using Zoom
3-24
AUTO G Z
50kHz
0
25
25
35
50
65
75
2
hsb
Plus Series Fishfinders
Figure 3-10: The Three Modes of A-Scope
Using Zoom
Zoom enlarges all or part of the scrolling bottom display. You can select
automatic zoom so the fishfinder selects a zoom level that keeps the bottom in
the lower half of the display window. Alternatively, you can manually pick the
area to be zoomed.
➤ To select zoom:
ZOOM
1. Press the ZOOM soft key, if necessary press the ZOOM ON OFF soft key to
2. Press the ZOOM FULL SPLT soft key to toggle between a full window zoom
ft
ZOOMFREQUENCY
100
BTM.LOCK A-SCOPE
BTM.LOCK A-SCOPE
52.3
52.3
52.3
A-SCOPE
52.3
A-SCOPE
toggle zoom on.
image or split windows.
If you select split windows, the display is split vertically, with the zoom
image in the left hand window and the scrolling bottom display in the right
hand window.
In a split window display, a vertical bar appears (along the right hand edge
of the scrolling bottom image) that references the range being displayed in
the zoom window. This bar varies in height with the selected zoom level.
3. If necessary, press the ZOOM AUTO MAN soft key to toggle the setting
between AUTO and MAN. The manual setting allows you to reposition the
zoomed image.
4. For zoom level selection, press the ZOOM X 2 4 6 soft key until the required
zoom level is selected.
5. Press ENTER or CLEAR to return to the default display.
Page 89

Chapter 3: Getting Started & Adjusting the Display 3-25
➤ To reposition the zoom window:
If manual zoom is selected, you can reposition the area of the image that is
zoomed.
1. Use the trackpad to place the cursor in the zoom window, the text ZOOM is
displayed near the cursor.
2. Press ENTER, a horizontal line appears, indicating the cursor is active. Use
the trackpad to select the new position.
3. Press ENTER to reposition the zoom image, or CLEAR to cancel the operation.
If the Bottom Lock or A-Scope image was displayed, selecting Zoom
automatically switches OFF Bottom Lock or A-Scope.
If you have split frequency selected, the selected Zoom image is displayed in
both frequency windows.
Using Zoom
Page 90

3-26
2
hsb
Plus Series Fishfinders
3.5 Chart Display Control Functions (Raychart Models)
Customizing the Screen Presentation Options
The SCREEN soft key lets you set the following screen presentation options on
or off:
(Raychart Models)
Control Functions
Chart Display
CRSR BOX
OFF ON
CHRT GRID
OFF ON
DATABOXES
OFF ON
CUSTOM
OFF ON
D4177-1
Switching the Cursor Data Box On and Off
The cursor data box provides the cursor’s position in latitude/longitude and/or
bearing/range. If you wish to see a full image, you can switch the data box off.
➤ To control the cursor data box:
SCREEN
CRSR BOX
OFF ON
SCREEN
CRSR BOX
CHRT GRID
OFF ON
OFF ON
1. Press the SCREEN soft key.
2. Press the CRSR BOX soft key to toggle the setting from OFF to ON or from ON
to OFF.
3. To return to the default soft key display, press ENTER.
➤ You can move the cursor data box using the context-sensitive cursor.
Switching Chart Grid On and Off
The Chartplotter display includes grid lines of latitude and longitude, which
you can use to help determine position on the chart. The grid lines can be
switched on if required.
➤ To turn the chart grid on or off:
1. Press the SCREEN default soft key.
2. Press the CHRT GRID soft key to toggle the setting from OFF to ON or from
ON to OFF.
To return to the default soft key display, press ENTER.
Data Boxes
A group of up to six data boxes can be displayed, if the information is available
on your system. You select which data is displayed in the boxes during
system set up as described in Chapter 7.
The default data box positions are along the bottom of the display. Each box
can be moved to the required position on the screen using the context-sensitive
cursor.
Note: If you select fishfinder, BDI, CDI or Nav Data for display in a halfscreen window, the data boxes are temporarily hidden.
Page 91

Chapter 3: Getting Started & Adjusting the Display 3-27
At any time, you can switch the group of data boxes on or off using the SCREEN
soft key. When first installed, the boxes are all OFF. When the display unit is
switched off and on again, the data boxes return to their last-used states (ON or
OFF) and positions.
Note: The SCREEN soft key does not control the sixteen data boxes that can be
displayed in the half-screen window.
➤ To switch the group of data boxes on or off:
SCREEN
CHRT GRID
CRSR BOX
DATABOXES
OFF ON
OFF ON
OFF ON
BOX
1. Press the SCREEN default soft key.
2. Press the DATABOXES soft key to toggle the setting from ON to OFF or from
OFF to ON.
To return to the default soft key display, press ENTER.
If you turn the data boxes on and none are displayed, you need to select the
ones you require using the system set up menu, as described in Section 7.3.
➤ To move any data box:
1. Use the trackpad to position the cursor over the box until the letters BOX are
displayed.
2. Press ENTER to take control of the box, use the trackpad to move it to the
required position, and press ENTER again.
Custom Options - Chart Mode
When chart details have been customized in the Chart Set Up menu (as
described in Section 7.5) the SCREEN soft key can be used to switch the custom
chart options off or on:
When set to ON, all chart options set to CUSTOM in the Customize Chart menu
are displayed; when set to OFF, options set to CUSTOM are not shown.
Options
Customizing the
Screen Presentation
The factory default for custom chart options is ON.
➤ To switch the customized options on or off:
SCREEN
CHRT GRID
CUSTOM
CRSR BOX
DATABOXES
OFF ON
OFF ON
OFF ON
OFF ON
1. Press the SCREEN default soft key.
2. Press the CUSTOM soft key to toggle the setting from OFF to ON or from ON
to OFF.
To return to the default soft key display, press ENTER.
Page 92

3-28
2
hsb
Plus Series Fishfinders
Moving Around the Chart
You will normally operate the chartplotter with the chart showing your
vessel’s current location. The default orientation is North-Up, and the vessel
moves across the screen. You will need to move the chart if your vessel moves
out of the area currently displayed, or if you wish to examine or place
Moving Around the
waypoints in another area. Alternatively, you can home the cursor onto the
vessel using FIND SHIP.
Chart
There are four ways in which you can move the chart:
• Use the trackpad to move the cursor to the edge of the chart. The chart will
pan across. This method is useful if the area you wish to see is only just off
the screen.
• Use the context-sensitive cursor to change the chart center.
• Automatically re-center the vessel using the FIND SHIP soft key.
• Change the chart scale to zoom out and in to a new area centered on the cursor position. This method is useful if the area you wish to see is a long distance away.
Changing the Chart Center
You can move the area of the chart displayed on the screen using the contextsensitive cursor. This allows you to center your vessel in the middle of the
screen, or to move the chart so that your vessel is displayed off-center
anywhere on the screen.
➤ To center the chart:
1. Use the trackpad to move the cursor to the vessel’s position. The cursor text
POS
POS is displayed.
2. Press CLEAR. The chart is moved so that your vessel’s position is in the
center of the screen.
3. Use FIND SHIP, as described in the following section.
➤ To move your vessel’s position off-center:
1. Move the cursor over your vessel’s position until the letters POS are dis-
POS
played.
2. Press ENTER to take control of the chart position. The letters POS are now
in inverse video, and the cursor symbol has changed to a four-way arrow.
This indicates that the cursor can be used to move the chart in any direction.
Page 93

Chapter 3: Getting Started & Adjusting the Display 3-29
D4278-1
Figure 3-11: Changing the Chart Center
Chart
Moving Around the
3. Use the trackpad to move the cursor to the required position.
4. Press ENTER to select the position and return to normal cursor control. The
chart is redrawn with the vessel position at the cursor.
Alternatively, you can press CLEAR to abandon the move and leave the
chart (and vessel) in its former position.
Using FIND SHIP
FIND SHIP is used in chart mode to re-draw the chart with the vessel at the center
and the cursor homed onto the vessel.
GOTO SCREENROUTE FIND SHIP
D4160-1
When you press FIND SHIP the following occur:
• The chart is re-drawn with the vessel’s position in the center.
• The cursor is homed onto the vessel position and moves with it.
• When the vessel moves near the edge of the chart window, the chart is
redrawn to place the vessel and cursor at the center again.
• The status bar indicates vessel position, speed and course over ground.
➤ To release the cursor from homed mode press the trackpad to move the cursor
away from the vessel’s current position. The status bar shows the cursor
position, range and bearing.
Page 94

3-30
2
hsb
Plus Series Fishfinders
Changing the Chart Scale
The RANGE key allows you to change the chart scale so that you can see a
smaller or larger area on the screen.
Plotter mode is available to allow you to zoom into a smaller area, even when
no chart data is available for that scale. Section 7.5 describes how to set plotter
Moving Around the
mode on/off.
Chart
The cartographic detail available on charts varies according to the chart scale
and some areas include detail at smaller scales than others. This can cause
blank areas on the display when adjacent areas with different levels of detail
are displayed. To reduce this effect you can use the Chart Set Up options (see
Section 7.5) to set chart display detail to simple. Then, as you zoom in, charted
areas are displayed but with less detail shown.
You can change the chart scale for two purposes:
• To see either more detail (of a smaller area) or a larger area (in less detail)
on the screen.
• To move the display to another area of the chart, by zooming out to a small
scale chart, then zooming in on another position centered on the cursor.
Each time you press the RANGE key, the chart scale changes to the next
available setting. The status bar indicates the distance from top to bottom of
the screen, in nautical miles.
Vertical distance
displayed on chart
6nm
CSR 50 45'980N
POS 001 01'490W
Status Bar
D4175-3
RANGE
Increases the
chart distance
Decreases the
chart distance
➤ To change the scale quickly, press and hold the required arrow on the RANGE
key.
RANGE
The distance indicator at the left-hand end of the status bar is updated
whenever you change the chart scale.
➤ To zoom in to a larger-scale (more detailed) chart:
1. Use the trackpad to position the cursor in the area you wish to see in more
detail.
2. Press the lower part of the RANGE key to zoom into the area.
The section of the chart around the cursor is enlarged to fill the screen with
RANGE
a larger-scale chart showing more detail. The cursor is now positioned in
the center of the screen.
The distance indicated at the top left of the screen is updated.
Page 95

Chapter 3: Getting Started & Adjusting the Display 3-31
3. If further chart enlargement is available using the current chart card you
can press the bottom of the RANGE key to zoom in again, re-positioning
the cursor first if required.
An area of further chart detail is indicated by a box around the area as
shown in Figure 3-12.
Chart Boundary indicates further
detail is available inside
D4279-2
Figure 3-12: Chart Boundaries
4. When no further chart detail is available, as you press the bottom of the
RANGE key, the effect depends on whether Plotter Mode is on or off as
follows:
Chart
Moving Around the
• If Plotter Mode is Off, the chart scale remains unchanged, indicating
the smallest chart scale is displayed.
• If Plotter Mode is On, the scale is decreased and the message NO CHART
DATA is displayed. The vessel, waypoints, routes and tracklines are displayed without cartography.
The chart information is restored when you return to a chart scale for which the
information is available.
➤ To zoom out to a smaller-scale (less detailed) chart, simply press the upper part
RANGE
of the RANGE key as many times as required.
Page 96

3-32
Radar/Chart Overlay
2
hsb
Plus Series Fishfinders
Chart
If radar data is available from another display connected on
2
hsb
, the radar
targets can be overlaid onto the full-screen chartplotter display. The radar/
chart overlay option helps you to distinguish between fixed, charted objects
and other objects that could be moving vessels. Some radar controls are
Moving Around the
available in overlay mode.
The following criteria must be true for radar/chart overlay to function
correctly:
• Position and heading data are provided so that vessel position and orienta-
tion can be determined.
• The vessel must be displayed on screen.
• The chartplotter must be in North Up or Course Up mode (see Section 7.7).
• The chartplotter range must be between 1/4nm and 48nm (equivalent to a
radar range of 1/8nm to 24nm).
• Custom range scales are disabled on the radar.
• The radar must be transmitting.
To ensure the vessel remains on the screen, you could use Find Ship (see Using
FIND SHIP on page 3-29) to home the cursor onto the vessel.
When Radar/Chart overlay is switched on, the status bar indicates OVL. If the
option is switched on but the overlay is not visible (because one of the above
criteria has failed), the status bar indication changes to (OVL).
When Radar/Chart overlay is switched on the soft key MORE... provides
access to the SCREEN soft key and to the radar controls TARGETS and MARPA.
The radar GAIN control is also active in overlay mode.
Note: Radar/Chart overlay is displayed at the current chart range. You
should be aware that if radar is shown on any other display, its range will
match that displayed on Radar/Chart overlay. Conversely, if you change the
radar range on any display, the Radar/Chart overlay image will change to the
new radar range.
➤ To select radar/chart overlay:
1. Press the DISPLAY key to show the DISPLAY pop-up, then if necessary
press again to select Chart mode.
2. Press the OVERLAY OFF ON soft key to toggle the option on.
The two highest intensity radar returns are displayed in purple, over the chart
image. The radar image is translucent, so that chart text, contours and outlines
are visible beneath the radar targets.
Page 97

Chapter 4: Fishfinder Operations 4-1
Chapter 4: Fishfinder Operations
4.1 Introduction
Basic Fishfinder operation, including a description of the different display
options, was given in Chapter 3. This chapter helps you the get the most from
your Fishfinder. It describes how to fine-tune the image and use the controls to
get additional information.
This chapter covers the following topics:
• Interpreting and Adjusting the Fishfinder Image, including fish and bot-
tom indications, using the white line feature and adjusting gain (sensitivity)
• Viewing Data Windows
• Setting up and Using Alarms for fish, shallow water and deep water
• Using a VRM to Determine Depth and Distance from Boat of a particular
spot
Introduction
• Placing Waypoints
• Using the Man Overboard (MOB) function
4.2 Interpreting and Adjusting the Fishfinder Image
The
the bottom of a lake or sea. The transducer sends high-frequency sound waves
down into the water; these sound waves strike fish, the bottom, or other objects
in the water and return as echoes. The fishfinder interprets these echoes to
present an image of the fish and bottom.
The strength of echoes is indicated by different colors (or shades of gray in the
monochrome L755RC Plus). You can use this information to determine the
size of fish and the bottom structure. Other objects in the water, such as debris
and air bubbles, also return echoes; these echoes are generally weaker than the
fish or bottom echoes and produce background noise or clutter on the
Fishfinder display.
The Fishfinder provides controls to reduce the background noise and to adjust
the way in which echoes of different strengths are displayed. The color
Fishfinders also let you select the background color and remove the display
colors for weaker echoes. Refer to Changing the Brightness & Color Settings
(Color LCD) on page 3-6 for details on these two functions.
2
hsb
Plus Series Fishfinders use sound waves (sonar) to find fish and show
Page 98

Fish Indications
4-2
The Fishfinder provides a White Line feature which helps to distinguish
between the bottom and fish (or other items such as weed) that are close to the
bottom.
Fish Indications
When the Fishfinder detects a fish, it displays an arch-shaped mark. In
general, a larger arch indicates a larger fish, though this rule is not always true.
Let’s say that there are two fish of the same size: one is close to the surface, the
other is near the bottom. The fish which is close to the surface has a larger arch
because, being closer, more sound waves get returned to the Fishfinder.
To display the depth of the fish, switch on the TARGET DEPTH ID from the
SONAR SET UP menu, as described in Section 7.4, Fishfinder Set Up
Parameters.
The sound waves are actually reflected by the swim bladder near the center of
the fish, not by the body of the fish. The size of this swim bladder is different
for different kinds of fish and this can affect the size of fish arches on the
image. A fish with a large swim bladder produces a large fish arch, while a fish
with a small one produces a small arch. Several arches together show a school
of fish. Figure Figure 4-1 illustrates some typical fish indications.
hsb
An arch-shaped image indicates a fish.
2
Plus Series Fishfinders
50 kHz
200 kHz
Figure 4-1: Fish Indications
The same fish appears differently when shown by the
50 kHz or 200 kHz transducer beams.
A shallow arch is generated when the the boat is
moving slowly.
This indicates a group of small fish.
A fish moving under a stopped boat shows as a line.
When the boat is moving very fast, a fish appears as
two parallel lines.
D5017-2
Page 99

Chapter 4: Fishfinder Operations 4-3
Effect of Frequency and Boat Speed
The return from a fish has a different appearance depending on the frequency
used: 50kHz produces a wide beam, so a fish spotted by this frequency gives a
broad arch; the 200 kHz beam is narrower so the same fish produces a
narrower arch.
The shape of the arch is also affected by the speed of the boat. If the boat is
moving slowly, the arches tend to be longer; if the boat is moving more
quickly, the arches are short and peaked. If the boat is moving very fast, a fish
may be indicated by a single vertical line.
In Bottom lock mode the fish arches may appear distorted as the bottom
topography is removed from the image.
Bottom Indications
The bottom usually produces a strong echo, so it is easy for the Fishfinder to
see a lot of detail. The Fishfinder can indicate many different kinds of bottom
conditions.
Bottom Indications
As illustrated in Figure 4-2, a hard bottom appears as a thin line.
A
B
C
D
Hard bottom (sand)
Soft bottom (mud)
Rocky bottom
White line feature on:
Figure 4-2: Fishfinder Bottom Indications
D5016-2
Page 100

Using White Line
4-4
An uneven bottom which is covered with rocks or coral produces a complex
display; the bottom image is irregular, with long tails pointing upward. A
wreck produces a similar image.
A softer bottom or a bottom covered with seaweed produces a wide line, as the
sound waves reflect from different layers of the bottom. In Figure 4.2b, the
Fishfinder is getting a good echo from the bottom, so the upper layer of the
bottom is shown as dark gray.
Notice that the lower layer of the bottom is shown as a lighter gray, this
indicates a weaker echo. This could mean that the upper layer is soft; some
sound waves may get through this layer and be reflected as a more solid layer
below.
It is also possible that the sound waves are making two complete trips – hitting
the bottom, bouncing off the boat, then reflecting off the bottom again; this can
happen if the water is shallow, the bottom is hard, or gain is set high.
Using White Line
2
hsb
Plus Series Fishfinders
The White Line feature separates echoes from fish near the bottom and the
bottom itself. When the White Line is switched on, the Fishfinder displays the
echoes differently.
With color LCDs, the strongest echoes are displayed in the background color
with a thin line on top. All other echoes remain unchanged.
In the L755RC Plus monochrome LCD, the weakest echoes continue to be
displayed in the background color white, but colors for the other signal are
reversed. Thus, from the strongest to the second weakest the colors are: light
gray with a thin black line on top, dark gray, black.
➤ To switch the white line feature on and off:
MULTI
1. Press the MULTI key, the WHT LINE soft key is displayed.
WHT LINE
OFF ON
2. Press the WHT LINE soft key to toggle the white line feature ON or OFF.
Adjusting Display Gain (Sensitivity)
The fishfinder provides controls for GAIN, COLOR GAIN, and STC. These
controls, accessed from the GAIN key, are used to reduce background noise
and determine how different strength echoes are shown. Automatic
adjustment of GAIN or COLOR GAIN is available, alternatively you can
manually adjust any of these parameters using the trackpad and you can finetune the auto-gain setting. You adjust gain for each transducer frequency
independently.
 Loading...