

Page 1

Mean Tr ophic Rank: A User’s Manual
R&D Technical Report E38
NTH Holmes3, JR Newman2, S Chadd4, KJ Rouen4, L Saint4 and FH Dawson
1
_
_
_
_
_
_
_
_
Research contractors:
NERC Institute of Freshwater Ecology
1
with IACR Centre for Aquatic Plant Management
2
and Alconbury Environmental Consultants
3
Environment Agency
4
Rio House
Waterside Drive
Aztec West
Almondsbury
BRISTOL
BS32 4UD
Page 2

Page 3

R&D Technical Report E38
Publishing Organisation
Environment Agency
Rio House
Waterside Drive
Aztec West
Almondsbury
Bristol BS32 4UD
Tel: 01454 624400 Fax: 01454 624409
ISBN: 1 85705 092 4
© Environment Agency 1999
All rights reserved. No parts of this document may be produced, stored in a retrieval system, or
transmitted, in any form or by any means, electronic, mechanical, photocopying, recording or
otherwise without the prior permission of the Environment Agency.
The views expressed in this document are not necessarily those of the Environment Agency. Its
Officers, servants or agents accept no liability whatsoever for any loss or damage arising from the
interpretation or use of the information, or reliance on the views contained herein.
Dissemination stat us
Internal: Released to Regions
External: Public Domain
Statement of Use
This report sets out procedural guidance on how to carry out Mean Trophic Rank (MTR)
macrophyte surveys to assess the trophic status of rivers, and on the use of the method for the
purposes of the EC Urban Waste Water Treatment Directive. The methodology can also be used
for other applications. The guidance supersedes and replaces earlier, internal guidance issued to
Environment Agency staff. It is intended as ‘best practice’ standard methodology for all MTR
surveys and is applicable throughout the UK.
Research Contractor
This document was produced under R&D Project E1-i694 by:
NERC Institute of Freshwater Ecology IACR Centre for Aquatic Plant Management
The Rivers Laboratory, East Stoke Broadmoor Lane, Sonning, Reading
Wareham, Dorset, BH20 6BB Reading, Berkshire, RG4 0TH
Te l: 01929 462314 Fax: -462180 Te l: 0118 969 0072
Institute of Freshwater Ecology - disclaimer IFE report reference RL/T4073Q7/7. In
accordance with the normal practice of the NERC Institute of Freshwater Ecology, this report was
prepared for use by the party to whom it is addressed (Environment Agency) and no responsibility
is accepted for the interpretation by any third party for the whole or any part of its contents.
Environment Agency' s Project Manag er
The Environment Agency' s Project Manager for R&D Project E1-i694:
Karen J Rouen, North West Region
Page 4

R&D Technical Report E38 i
ACKNOWLEDGEMENT S
This docum ent is intended as a description of a standard methodology for the assessment
of the trophic status of rivers using macrophytes applicable throughout the United Kingdom.
Its production would not have been possible without the cooperation and assistance of Dr
Nigel Holmes, English Nature, Scottish Natural Heritage, The Countryside Commission
for Wales, the Industrial Research and Technology Unit (Northern Ireland) and the
Scottish and Northern Ireland Forum for Environmental Research (SNIFFER).
Page 5

R&D Technical Report E38 ii
This page has been left blank intentionally
Page 6

R&D Technical Report E38 iii
CONTENTS
List of Figures v
List of Tables v
Glossary vi
Executive Summar y ix
Key Words ix
1 Foreword 1
1.1 About this manual 1
1.2 Summary of the method 3
2 Intr oduction to MTR 5
2.1 What is MTR? 5
2.2 Uses of MTR 8
2.3 Principal application: Urban Waste Water Treatment Directive 9
2.4 Other applications 11
3 Survey Planning 15
3.1 Alternative methods to consider 15
3.2 Sampling strategy 20
3.3 Logistics of sampling 22
3.4 Ancillary data collection 29
3.5 Limitations of the method 31
4 How to Car ry Out an MTR Survey 33
4.1 Overview of the methodology 33
4.2 Preparation and pre-survey checks 33
4.3 Site and survey details 33
4.5 Carrying out the macrophyte survey 38
4.6 Assessing and recording physical variables 49
4.7 Laboratory Analysis 58
5 MTR Data Analysis 61
5.1 Calculating Mean Trophic Ranks 61
5.2 Assigning a measure of confidence to the MTR 62
5.3 Assessment of confidence in the data 63
5.4 Data storage 64
6 Interpretation of MTR Results 65
6.1 Interpretation for the purposes of the UWWTD 65
Page 7

R&D Technical Report E38 iv
6.2 Interpretation for other purposes 72
6.3 Interpretation of species diversity 74
6.4 Interpretation of overall percentage cover values 76
7 Quality Assur ance 77
7.1 Introduction 77
7.2 Training 80
7.3 Audit surveys 82
7.4 Inter-calibration exercise 88
7.5 Database verification 89
7.6 Survey length selection 90
8 MTR Best Practice Checklist 91
8.1 Uses of MTR 91
8.2 Survey planning 91
8.3 Survey methodology 92
8.4 Data analysis 92
8.5 Interpretation of results 93
8.6 Quality assurance 93
9 References 95
Appendices 99
Appendix 1 Rare plants 100
Appendix 2 Foreign invasive plant species 101
Appendix 3 Identification guides and preservation manuals 102
Appendix 4 Equipment suppliers 104
Appendix 5 Standard record sheets 105
Appendix 6 Example sketch maps 121
Appendix 7 Summary of methodology, definitions and equipment checklist 125
Index 131
Page 8

R&D Technical Report E38 v
Page 9

R&D Technical Report E38 vi
LIST OF FIGURES
1 Diagram matic representation of survey method 38
2 Illustration of shading 53
3 Macrophyte survey flow chart 60
4 Interpretation of MTR results, Stage I ‘decision tree’:
Is the site impacted by eutrophication? 70
5 Interpretation of MTR results, Stage II ‘decision tree’:
Is there a significant downstream impact from the qualifying discharge? 71
LIST OF TABLES
1 MTR scores summarised according to river community type 68
2 Reasons for mismatch between audit and primary surveys, with suggested actions 87
A1 List of Mean Trophic Rank scoring taxa, with recent synonyms 111
A2 Cover (m2) for 100m Survey Lengths 119
LIST OF TEXT BOXES
1 Factors to consider when deciding whether to use MTR or DQI/TDI 18
2 Factors to consider when selecting MTR sites and survey lengths 24
3 Conditions when surveys should not be undertaken 26
4 Non-standard survey lengths 36
5 Exceptions to surveying the full channel width 37
6 Methods of estimating overall percentage cover 43
7 Estimating percentage cover of individual species: width method 45
8 Estimating percentage cover of individual species: square metre method 46
9 Audit procedure 85
Page 10

R&D Technical Report E38 vii
GLOSSARY
Audit survey Repeat survey undertaken for quality assurance purposes.
CCW Countryside Council for Wales.
Channel area The part of the river channel where macrophytes are seen submerged or
partly submerged at low flow levels. At the sides of the channel this
includes all macrophytes attached or rooted on parts of the substrata
which are likely to be submerged for more than 85% of the year.
Comparability A measure of confidence in the physical
comparability of a pair of sites
based upon the similarity of width, depth, substrata, habitat, shading,
water clarity and bed stability.
CVS
Cover Value Score
. The score allocated to a species resulting from the
multiplication of the Species Trophic Rank and the Species Cover Value .
DoE The Department of the Environment.
d/s Downstream.
EN English Nature.
DQI The Diatom Quality Index. A transformation of the
Trophic Diatom Index
for use when comparing TDI and MTR results.
Highlighted species Refers to a plant species within MTR which is believed to be a particularly
reliable indicator of trophic status.
IFE The Institute of Freshwater Ecology.
IRTU Industrial Research & Technology Unit, Northern Ireland.
LEAP Local Environment Agency Plan.
Macrophyte Larger alga or higher aquatic plant (including bryophytes), observable to
the naked eye and nearly always identifiable when observed.
MTR Mean Trophic Rank. A numerical score assigned to a survey length based
on its macrophyte presence and abundance characteristics.
Nitrate Dissolved or soluble or non-particulate nitrate.
Non-QD Non-qualifying discharge under the UWWTD, with a population
equivalent of less than 10,000.
Page 11

R&D Technical Report E38 viii
NRA The National Rivers Authority. A predecessor to
the Environment
Agency.
pe Population equivalent.
Phosphate Dissolved or non-particulate phosphate, normally analysed as soluble
reactive (SRP) or by the molybdenum-blue method.
Pool Either a discrete area of slow flowing water, usually relatively deeper than
surrounding water, or between faster flowing stretches, as in a sequence
of riffle-pool-riffle. Pools are deep and often turbulent, and scoured
during spate flows.
Primary survey
When a survey is repeated for quality assurance purposes, the initial survey
is termed the ‘primary survey’ and the repeat survey the ‘audit survey’.
PSP
Potential source of pollution. A term describing potential, non-QD-derived
sources of eutrophication in riverine habitats.
QD Qualifying discharge (usually from a WWTW) under the UWWTD, with
a population equivalent of greater than 10,000.
RHS River Habitat Survey. A method for assessing the physical character and
quality of river habitats and impacts upon them.
Riffle Fast flowing, shallow water whose surface is distinctly disturbed. This
does not include water whose surface is disturbed by macrophyte
growth only.
Run Fast or moderate flowing, often deeper water whose surface is rarely
broken or disturbed except for occasional swirls and eddies.
SA(E) Sensitive Area (Eutrophic). An area of water which is considered to be
eutrophic or which in the near future may become eutrophic if protective
action is not taken, and recognised as such by designation under the
Urban Waste Water Treatment Directive.
SCV Species Cover Value. A value assigned to a species according to the
percentage of the survey area it covers.
Site This is the broad location where the survey is to take place, eg xkm
downstream of a waste water treatment works.
Slack Deep, slow flowing water, uniform in character.
SNH Scottish Natural Heritage.
SNIFFER Scottish and Northern Ireland Forum for Environmental Research.
Page 12

R&D Technical Report E38 ix
STR Species Trophic Rank. A value assigned to a species on a scale of 1 to 10,
designed to reflect the tolerance of that species to eutrophication. Low
scores indicate tolerance or cosmopolitan distribution (ie no preference).
High scores indicate preference for less enriched conditions or intolerance
of eutrophic conditions.
Survey The collection of data at one site according to the prescribed methodology.
Survey length
This is the sample area — the actual river channel area surveyed, between
two fixed points on the bank. The survey length is 100m long for
standard MTR surveys.
Survey season The MTR survey season is mid-June to mid-September inclusive.
TDI The Trophic Diatom Index. A method for assessing the trophic status of
rivers using benthic diatoms.
u/s Upstream.
UWWTD The European Community Urban Waste Water Treatment Directive
(UWWTD, 91/271/EEC).
WWTW Waste water treatment works.
Page 13

R&D Technical Report E38 x
EXECUTIVE SUMMARY
1 The principal purpose of this manual is to provide comprehensive procedural guidance
on
how to carry out Mean Trophic Rank (MTR) ma crophyte surveys to assess the
trophic status of rivers, and on the use of the method for the designation of sensitive
areas (eutrophic) (SA(E)) under the requirements of the EC Urban Waste Water
Treatment Directive (UWWTD).
2 The guidance is a practical output from R&D project E1-i694 ‘Assessment of the Trophic
Status of Rivers Using Macrophytes’. The project assessed the MTR for the purposes
required of it under the UWWTD, made recommendations for improvements in the
system and compared the MTR with other methods for the biological assessment of
trophic status in rivers.
3 The manual describes what the MTR system is, for what purposes it can be used and how
to use it. It gives guidance on where and when to undertake MTR surveys, how to carry
out the macrophyte survey in the field, how use the information gained to calculate an
MTR, how to interpret results for the purposes of the UWWTD and how to maximise that
the quality of the information gathered. Uses of the method for purposes other than the
requirements of the UWWTD are also considered.
4
The procedures described are intended as the standard method for undertaking MTR
surveys, and as the standard macrophyte survey method to be used by the Environment
Agency for the purposes of the UWWTD. The methodology is applicable throughout the
UK and so the manual will be of use not only to Environment Agency staff but also to
regulatory agencies in Scotland and Northern Ireland, statutory and non-statutory
conservation bodies, and others interested in the trophic status of rivers.
KEY WORDS
Macrophyte survey, Urban Waste Water Treatment Directive, UWWTD, Sensitive Areas,
phosphorus, nutrient, eutrophication, monitoring.
Page 14

R&D Technical Report E38 xi
This page has been left blank intentionally
Page 15

R&D Technical Report E38 1
1 FOREWORD
1.1 About this manual
1.1.1 Pur pose of the manual
The principal purpose of this manual is to provide procedural guidance on how to carry out
Mean Trophic Rank (MTR) macrophyte surveys to assess the trophic status of rivers, and
on the use of the method for the desig nation of Sensitive Areas (Eutrophic) (SA(E)) under
the requirements of the EC Urban Waste Water Treatment Directive (UWWTD,
91/271/EEC).
The manual describes what the MTR system is, for what purposes it can be used and how to use
it. It gives guidance on where and when to undertake MTR surveys, how to carry out the
macrophyte survey in the field, how to use the information gained to calculate an MTR, how to
interpret results for the purposes of the UWWTD and how to maximise the quality of the
information gathered. Uses of the method for purposes other than the requirements of the
UWWTD are also considered. The manual provides a standard methodology and hence allows
data to be collected in the same manner by all surveyors, eliminating differing interpretations of
the method.
The method described is based on the survey methodology produced by the National Rivers
Authority (NRA 1994a). It incorporates subsequent developments in the survey methodology and
calculation of Mean Trophic Rank values (Holmes 1995, 1996), and takes account of
recommendations made at a national R&D workshop to discuss methods used to assess trophic
status (Newman et al 1997a, b – also in Dawson et al 1999a). Furthermore, it is based on a
comprehensive evaluation of the MTR which used a dataset of more than 5000 surveys (Dawson
et al 1999b). It is thus based on considerable experience and represents the best current practice.
1.1.2 Statement of use
The procedures described are intended as the standard method for undertaking MTR surveys, and
as the standard macrophyte survey method to be used by the Environment Agency for the
purposes of the UWWTD. The guidelines provided should be followed in all MTR surveys, to
ensure that the data produced are of acceptable quality and are comparable on a national basis.
The methodology is applicable throughout the UK. This manual is therefore of use not only to
Environment Agency staff but also to regulatory agencies in Scotland and Northern Ireland,
statutory and non-statutory conservation bodies, and others interested in the trophic status of
rivers.
The protocol and guidance given in this document supersede and replace those previously
published in relation to macrophyte surveys for UWWTD monitoring purposes and to the MTR
system (NRA 1994a; Holmes 1995, 1996; Newman & Dawson 1996; Environment Agency
1996a).
Page 16

R&D Technical Report E38 2
1.1.3 Format of the manual
A tabulated summary of the MTR method is provided below to give a broad overview of the
methodology (1.2). This is then followed in Chapters 2–8 by detailed guidance on all the sections
listed in the summary. The guidance is organised so that it progresses from general introductory
information on the MTR system and its uses, to detailed survey procedures, interpretation of the
results and quality assurance. Quality assurance measures which are integral to the survey
method itself are shown in shaded boxes throughout. Key words are underlined in the tabulated
summary and listed in an index at the back of the manual, to assist cross-referencing.
The manual should be read in full to gain a comprehensive understanding of the method and its
application. Surveyors should familiarise themselves with the definitions given in the glossary,
particularly the terms ‘site’ (the broad location of the survey), ‘survey length’ (the sample area)
and ‘survey’ (the collection of data at one site according to the prescribed methodology).
1.1.4 Other outputs from this project
This is one of four outputs from the Agency’s national R&D Project E1-i694 Assessment of the
trophic status of rivers using macrophytes. The other three outputs are:
·
R&D Technical Summary ES35 —
Assessment of the trophic status of rivers using
macrophytes: evaluation of the Mean Trophic Rank. This summarises the project findings.
· R&D Technical Report E39 — Assessment of the trophic status of rivers using macr ophytes:
evaluation of the Mean Trophic Rank (Dawson et al 1999b). This presents the main research
findings and will be of interest to those involved with the development, management or
implementation of biological methods to assess trophic status.
·
R&D Project Record E1/i694/01 —
Assessment of the trophic status of rivers using
macrophytes: supporting documentation for the evaluation of the Mean Trophic Rank
(Dawson et al 1999a). This presents supporting information and is intended for use by those
involved with future development of the MTR and related methodologies.
Page 17

R&D Technical Report E38 3
1.2 Summary of the method
A summary of the MTR method is given below (cf DoE Standing Committee of Analysts 1987).
Key words are underlined and are included in the index at the back of this manual.
WHAT IS MTR?
1. Purpose Assessment of trophic status and eutrophication impact.
2. Biota sampled Macrophytes (plants identifiable with the naked eye).
3. Watercourses
sampled
Rivers and streams. The method is not suitable for standing waters, canals
(unless water flow is constant in one direction) or tidal rivers.
4. Underlying
principles
Within the aquatic macrophyte flora there is a spectrum of tolerances to
nutrient enrichment which can be expressed by assigning scores to species
on a scale of 1–10: the higher the score (the Species Trophic Rank or
STR), the lower the tolerance to nutrient enrichment. The response of the
macrophyte community to nutrient status can be expressed by integrating
the scores of the species present as a mean value, weighted according to
the relative percentage cover of the individual species. The resulting value
(the Mean Trophic Rank or MTR) increases with decreasing eutrophy.
5. Basis of
operation
The macrophyte flora and physical character of defined lengths (100m) of
watercourse are surveyed using a standard checklist. The presence,
absence and % area covered by each macrophyte are recorded and used to
calculate the MTR score. Physical parameters are recorded to aid
interpretation.
FOR WHAT PURPOSES CAN THE MTR SYSTEM BE USED?
6. Uses The method can be used to give a qualitative assessment of whether a site
is impacted by eutrophication and (for physically similar sites) downstream
changes in trophic status. The method should not be used to compare the
trophic status of physically dissimilar sites, nor should it be used to make
comparisons between the trophic status of different rivers unless the rivers
are the same type.
7. Applications The principal application for which the method has been developed and
tested is to assist in the designation of identified reaches as ‘Sensitive
Areas (Eutrophic)’ under the EC Urban Waste Water Treatment Directive.
The method should be equally applicable to the assessment of other pointsources of nutrients, but is not yet proven for other applications.
SURVEY PLANNING
8. Alternative
methods
A Diatom Quality Index (DQI) survey should be undertaken at the same
time as the MTR survey if possible.
9. Sampling
strategy
The location of survey sites varies according to the purpose of the survey.
Less impacted ‘control’ sites may help determine eutrophication impact.
10. Logistics of
sampling
A minimum of one survey per year for three years is recommended, each
being undertaken at the same time within the survey season (mid-June to
mid-September) and after several days of low or low–normal flow.
Page 18

R&D Technical Report E38 4
Operator safety, shade, river flow and water clarity need to be considered
when selecting a survey length. continued....
10. ....continued Survey equipment includes sampling aids, camera and protective
clothing/equipment. Surveyors should be familiar with the provisions of
the Wildlife and Countryside Act and should follow appropriate health and
safety guidance. Surveys can be undertaken by one operator, although
multiple-staffing is recommended: surveyors should allow one person-day
per survey although this may vary considerably.
11. Ancillary data
collection
Background information on site geomorphology, pollution incidents and
river management can be useful when planning and interpreting surveys.
HOW TO CARRY OUT AN MTR SURVEY
12. Pre-survey
preparation
An equipment checklist is provided. Surveyors should be familiar with the
necessary health and safety guidance.
13. Field survey The stretch to be surveyed (the survey length, 100m) is selected or located
and if suitable for survey it is measured out and marked. Standard field
sheets are used to record site and survey details. The macrophyte flora and
physical character of the survey length are then surveyed by wading, boat,
or walking along the bank. Sampling aids are used where necessary. All
macrophytes present are recorded, together with the estimated percentage
cover of each taxon (recorded as abundance classes: the species cover
value or SCV) and the estimated percentage cover of overall macrophyte
growth. Representative samples are taken for laboratory analysis if
identification is uncertain. Physical parameters of the survey length are
estimated, a sketch map drawn and a photograph taken.
13. Laboratory
analysis
Samples taken on the field survey are identified shortly afterwards and
representative specimens retained in a ‘herbarium’ for future reference.
DATA ANALYSIS AND INTERPR ETATION OF RESULTS
14. Data analysis Survey data are in the form of qualitative (presence/absence) and semi-
quantitative (estimates of % cover) records of macrophytes and physical
characteristics. MTR = (SCVS/SSCV) ´ 10, where CVS = SCV ´ STR.
MTR scores lie in the range 10–100.
15. Interpretation
of results
Results are interpreted using standard ‘decision trees’ and general
guidance on MTR scores found in a range of different rivers. Results are
expressed qualitatively in terms of nine standard descriptors relating to the
eutrophication status of the site and downstream impact.
QUALITY ASSURANCE
16. Error and
variability
Variability between surveyors in data recorded in the field can be reduced
by correct application of the method and adoption of quality assurance.
The impact of natural background variation in MTR within the survey
season and between physically dissimilar sites, can be reduced by careful
timing of surveys and selection of survey lengths. Three measures of
confidence are assigned relating to the survey, the comparability of sites
and the MTR score.
Page 19

R&D Technical Report E38 5
17. Quality
assurance
procedures
Quality assurance comprises measures integral to the survey method itself
(eg on-site checks and multiple-staffing), training requirements and audit
surveys. Two alternative audit protocols are provided.
2 INTRODUCTION TO MTR
This chapter describes the purpose of the MTR methodology, the biota used, the watercourses
for which the method is suitable, the principles on which the method is based and a summary of
how it operates. It then provides guidance on the applications for which the method can be used.
2.1 What is MTR?
2.1.1 Purpose
The MTR system is a biological method to assess the trophic status of rivers in the UK and the
impact of eutrophication.
The definition of eutrophication according to the UWWTD (91/271/EEC, Article 2(11)) is:
“Enrichment of water by nutrients, especially compounds of nitrogen and/or phosphorus,
causing an accelera ted growth of algae and higher forms of plant life to produce an undesira ble
disturbance to the balance of organisms present in the water and to the quality of the water
concerned.”
The definition of eutrophication adopted by the Agency in its proposed Eutrophication Strategy
(Environment Agency 1998a) is:
“The enrichment of waters by inorga nic plant nutrients, which results in the stimulation of an
array of symptomatic changes. These include the increased production of algae a nd/or other
aqua tic plants affecting the quality of the water and disturbing the balance of orga nisms within
it. Such changes may be undesirable a nd interfere with water uses.”
2.1.2 Biota sampled
The MTR system is based on the presence and abundance of species of aquatic macrophyte. A
macrophyte is defined as ‘any plant observable with the naked eye and nearly always identifiable
when observed’ (Holmes & Whitton 1977). This definition includes all higher aquatic plants,
vascular cryptograms and bryophytes, together with groups of algae which can be seen to be
composed predominantly of a single species.
Macrophytes were selected for this method for several reasons.
· Species composition can change with increased nutrient concentration (2.1.4) and so can be
used as a water quality monitoring tool to determine and monitor areas affected by nutrient
enrichment.
·
These changes in the macrophyte community can be highly visible and may be deemed
‘undesirable’ in terms of the definitions of eutrophication cited above (2.1.1). For example,
they may result in the loss of conservation and amenity value, in addition to problems for
abstraction licence holders and other water users (NRA 1994a).
Page 20

R&D Technical Report E38 6
· The macrophyte species recorded for these surveys are large and readily identifiable with the
naked eye. There are relatively few species in a particular river area (approximately 20), so
it is normally possible to identify all to species level when the necessary seasonal attributes
are present.
· The rooted nature of many species means that absence of species is significant and this, as
well as the presence of a species, can be used in the interpretation of survey data.
2.1.3 Water cour ses sampled
The MTR methodology is designed for use in rivers and streams. The method is not suitable for
assessing standing (lentic) waters, canals (unless the water flow is constant in one direction) or
rivers with a tidal influence.
2.1.4 Underlying principles
The Mean Trophic Rank methodology uses a simple scoring system to derive a single index
describing the trophic status of a site. The system works by allocating a Species Trophic Rank
(STR) score to 128 aquatic plant species (Appendix 5 – Table A1). The scores range from
1 to 10. High scoring plants are associated with water bodies which are low in nutrients. Low
scoring plants are either tolerant of eutrophication or are cosmopolitan in their requirements, ie
have no preference. The response of the macrophyte community to nutrient status can be
expressed by integrating the STRs of the species present at a site as a mean value, weighted
according to the relative percentage cover of the individual species. The resulting value, the
MTR, increases with decreasing eutrophy, with a theoretical maximum of 100 and a minimum
of 10 (there is no score when scoring species are absent).
In undisturbed or un-degraded ecosystems, the plant community often contains many species,
none of which tend to dominate to the detriment of any other, ie the system is in balance. Species
with high STRs should be present and a theoretical maximum MTR score should be achieved
based on the limits imposed by floristic diversity, flow regime (altitude), river size, catchment
geology and water chemistry at a particular site. In degraded or disturbed ecosystems, the plant
community may contain fewer species and one or two species with low STRs may be dominant.
In these instances, a score somewhat less than the perfect score will be achieved. There is a
scale of degradation and in between these two extremes lie the majority of riverine ecosystems
in Britain.
The change from the perfect score can be used as a measurement of the impact or damage caused
to the ecosystem by the disturbance. A predictive element to the MTR, allowing predictions of
what MTR can be expected given a certain set of physical conditions (the ‘perfect score’), is still
only in the early stages of development. Never-the-less, the MTR system can be used to make
an estimate of how degraded the ecosystem is from the expected norm (taking into account all
other factors), and give an indication of the change in the macrophyte community from that norm
using the guidance on the interpretation of MTR results given in this manual.
The development and testing of the MTR has focussed particularly on its use as a tool to assess
eutrophication impact due to phosphate enrichment. Although eutrophication may arise from
enrichment by compounds of either phosphorous and/or nitrogen, phosphorus is usually
Page 21

R&D Technical Report E38 7
considered to be the element which limits aquatic plant growth in fresh waters because of its low
availability in relation to plant requirements. Where it is limiting, an increase in the level of
phosphate in the water should cause accelerated growth of those plants present or a change in the
species composition of the plant community to reflect the change in phosphate concentration.
At very high concentrations of phosphate, the plant community is usually species poor because
of the excessive growth of filamentous and unicellular algae and some high phosphate tolerant
macrophytes. In these cases where the biological symptoms of nutrient enrichment are manifest,
eutrophication as defined in the UWWTD and the Agency’s proposed Eutrophication Strategy
can be deemed to be taking place. In contrast, where the availability of a nutrient is sufficient so
as not to limit plant growth, such as is usually considered to be the case for compounds of
nitrogen, any increase in the concentration of that nutrient will not lead to changes in the plant
community and thus eutrophication cannot be deemed to be taking place.
Evidence suggests that the MTR is particularly responsive to change in nutrient status at
concentrations less than 1.0 mg l-1 P or 10 mg l-1 N, and even more so at less than 0.5 mg l-1 P or
5 mg l
-1
N (Dawson et al 1999b). This implies that the MTR system may be most useful at
detecting eutrophication impacts when the nutrient concentration upstream of (or prior to) the
nutrient input, is less than 1.0 mg l-1 or 10 mg l-1 N, particularly when supported by other
biological and/or chemical evidence. The level of eutrophication attributable to nitrate rather
than phosphate at any one site cannot be established using MTR at this stage of method
development. In many cases, however, the nitrate concentration is unlikely by itself to be limiting
to plant growth, and phosphate is likely to be the limiting factor (Dawson et al 1999b).
2.1.5 Basis of operation
The method involves the survey of the macrophyte flora and physical character of defined lengths
(100m) of watercourse using a standard checklist. The presence, absence and percentage area
covered by each macrophyte are recorded and the data relating to scoring species (those assigned
an STR) are then used to calculate the MTR score. Physical parameters are recorded to aid
interpretation of results. Detailed procedural guidance is given in Chapters 3–8.
Page 22

R&D Technical Report E38 8
2.2 Uses of MTR
The MTR method can be used to give a qualitative assessment of whether a river site is impacted
by eutrophication and (for physically similar sites) downstream changes in trophic status. It
should not be used to compare the trophic status of physically dissimilar sites, nor should it be
used to make comparisons between the trophic status of different rivers unless the rivers are the
same type.
The principal application for which the method has been developed and tested is to assist in the
designation of identified reaches as SA(E)s under the UWWTD (2.3). The methodology has
been used extensively by the Environment Agency for this purpose.
The method should be equally applicable to the assessment of other point-sources of nutrients,
but is not yet fully proven for other applications (2.4). Use of the system to date, however, is
encouraging. For example, macrophyte surveys using MTR and the method of Haslam (DoE
Standing Committee of Analysts 1987) have been used in Northern Ireland to indicate the
location of eutrophication problems and to monitor trends in the trophic status of rivers (Oliver
& Hale 1996). A combined approach using macrophyte, invertebrate and ecotoxicological work
upstream and downstream of key discharges has been found to be useful, with the potential
addition of the Trophic Diatom Index (TDI, 3.1.2). English Nature have used the MTR together
with the Nature Conservancy Council macrophyte classification to examine the impact of
discharges from small- and moderate-sized sewage works on small rivers (eg Southey 1995).
Although there was no clear relationship between the two sets of results and percentage
reductions in MTR score downstream of discharges were not great, possibly due to high
phosphate-loading upstream, it is felt that the MTR shows much potential and that it is useful to
use both systems when analysing changes of macrophyte floras over time.
Page 23

R&D Technical Report E38 9
2.3 Principal application: Urban Waste Water Treatment Directive
This is the principal application for which the Mean Trophic Rank has been developed and
tested. The survey methodology and calculation of MTR are described in detail in Chapters 3–5
of this procedural manual and guidance given in Chapter 6 on interpretation of results. Before
commencing surveys, Environment Agency staff should also refer to current internal guidance
on information gathering for future reviews of SA(E)s for the rationale behind UWWTD
monitoring (Environment Agency 1998b: supersedes NRA 1994b).
In brief, the MTR is used to provide evidence of eutrophication impact on riverine macrophyte
communities, in order to support designation of identified reaches as SA(E)s under the Directive
and to provide evidence of the specific impact of ‘qualifying’ discharges on such reaches.
2.3.1 Designation of Sensitive Ar eas
Sensitive Areas (Eutrophic) (SA(E)s) are water bodies which are considered eutrophic, or
which in the near future may become eutrophic if protective action is not taken. They are
identified using the criteria listed in Annex II of the Directive, with the definition of
eutrophication as given in Article 2(11) (see 2.1.1 above). The size of discharges and type of
receiving water are taken into account. Once SA(E)s are designated, discharge requirements can
be set for ‘qualifying discharges’ (QDs) in terms of nutrient levels or a percentage reduction in
nutrients. ‘Qualifying discharges’ are those with a loading of greater than 10,000 population
equivalent (pe): they
may discharge either directly into the SA(E), or indirectly into the
relevant upstream catchm ent areas of SA(E)s, contributing to the pollution/eutrophication
of these areas. However, no action needs to be taken (ie consents do not need to be
determined) if it can be demonstrated that nutrient-removal will have no significant effect
upon the level of eutrophication. In the case of most freshwaters, nutrient removal would
usually be of phosphorus, the principal limiting nutrient in freshwaters.
A Government consultative paper was published in Ma rch 1992 (DoE et al 1992), proposing
criteria for identifying SA(E)s and subsequent procedures. This guidance was finalised in
March 1993, in Annex B of the paper published on the methodology for identifying SA(E)s
(DoE et al 1993). Under this methodology, waters are only identified if affected by QDs. For
rivers, the upstream limit of a SA(E) is either a QD or the point at which the symptoms of
eutrophication become manifest. The downstream limit is where the effects are reduced to
‘typical’. For riverine environments, the criteria relate to orthophosphate, chlorophyll a
, algal
biomass, water retention time, dissolved oxygen, fauna (fish/invertebrates), macroflora and
microflora. The MTR provides information on the macroflora by providing an estimate of the
degradation to aquatic macrophyte communities in these areas.
2.3.2 Assessment of eutrophication and the impact of qualifying dischar ges
The main pollutant causing eutrophication arising from QDs will usually be phosphorus. This
phosphorus will usually be in the form of soluble reactive phosphate (SRP) and therefore be
available immediately to submerged macrophytes downstream of the discharge. Given the
relationship between MTR and phosphate concentration (Dawson et al 1999b), the MTR can be
used to answer the two key questions required for evidence in support of SA(E) designation:
Page 24

R&D Technical Report E38 10
· is the river eutrophic, or shortly at risk of becoming eutrophic?
· what is the impact of the QD?
Guidance on sampling strategy and interpretation of MTR results to answer these questions is
given in Sections 3.2.1 and 6.1. The latter includes flow-charts to enable decisions to be made
in a consistent and structured manner. Results are expressed qualitatively in terms of two
standard descriptors, one for trophic status and one for the downstream impacts of the QD.
2.3.3 Post phosphate-removal monitoring
It is anticipated that macrophyte communities previously affected by phosphate eutrophication
will attain higher MTR scores after phosphate removal (phosphate-stripping) is installed at QDs.
Although this response, or the speed at which it occurs, has yet to be demonstrated due to the
early stage of method development, the MTR system should be used to monitor improvements
in the macrophyte community after phosphate-removal has commenced. The information gained
from this monitoring will not only provide direct operational information on the impact of the
P
-removal, but will also provide much needed information for the further refinement of the
method. The latter includes information on the speed at which macrophyte communities respond
to a reduction in P concentration; how recovery takes place (which species come back first); and
the effect of P in sediments (how long it takes for phosphate-enriched sediments to cease to have
an effect on the macrophyte community).
The success of biological methods at demonstrating an improvement in the trophic status
of a system is dependent on the availability of a reliable and consistent historical data set.
Lack of such a data set may limit the application of the methods to demonstrate an
improvement in a historical context. For those SA(E)s desig nated under the 1997 review,
however, post-phosphate-removal monitoring may be able to show measured improvements
using data from the 1996 MT R surveys as the baseline for improvement.
In order to separate the effects of phosphate-removal from natural background variation in
the MTR it may be necessary to carry out an examination of the time series of chang e to
establish baseline variation in MTR scores. These data may be available by comparison with
MTR scores from previous seasons, but care should be taken to ensure that all factors
relating to the accuracy and comparability of MTR surveys prior to 1996 are satisfactory
before undertaking such comparisons. If you are sure that any change in MTR score prior
to phosphate-removal cannot be accounted for by chang es in nutrient concentrations or
other conditions then this variability can be used as a measure of natural background
variation. It is anticipated that any changes due to phosphate-reductions will be
superimposed on this natural chang e.
Page 25

R&D Technical Report E38 11
2.4 Other applications
2.4.1 Non-qualifying point-source discharges
In many river systems in the UK, a significant proportion of the phosphate-loading comes from
WWTWs of less than 10,000 pe although surface water run-off and storm sewer overflow may
also be significant sources of phosphorus in urban areas. These discharges do not qualify under
the UWWTD for statutory improvement works to remove P from the effluent discharge. This
means that eutrophication can be primarily caused by phosphate-loading from sources other than
QDs and hence outside the legislative framework of the UWWTD. It also means that rivers are
frequently degraded upstream of the QD, making the demonstration of an impact of a QD
difficult to achieve in absolute terms. The MTR can be used to identify non-QDs which are
having a significant impact on the macrophyte community in order to target these for future
nutrient control measures where possible. Sampling protocol and interpretation of results is as
for assessment of QDs (3.2.1 and 6.2.1).
2.4.2 Non-point source discharges
The phosphate-loading of many agricultural catchments may arise mainly from non-point
sources, such as soil run-off and diluted slurry effluent. The use of the MTR is these
circumstances is largely untried, but provisional guidance on sampling strategy and interpretation
of result is given in 3.2.2 and 6.2.2. The information gained from such studies will help
determine if the MTR system is capable of detecting the effects of non-point source discharges.
2.4.3 Catchment studies
Studies of the MTR over a whole catchment or sub-catchment may be considered for three
purposes.
To improve the interpretation of MTR values, by placing them in a catchment context
The main inherent limitation of the MTR is that it is influenced to some extent by factors other
than nutrient levels; in particular, by the substrate, underlying geology of the river and to some
extent the flow regime. This means that to interpret the MTR in terms of trophic status it is
necessary to compare results with values expected in a relatively un-impacted reach of a similar
type. Such reaches, or at least similar reaches with less nutrient enrichment, may be found
elsewhere in the catchment being surveyed.
A second limitation relates to the sensitivity of the MTR in detecting the impact of individual
nutrient sources. In a complex environment, the impact of a nutrient discharge may not be
manifest by the MTR for some distance downstream due to impact by other polluting factor(s)
in the same discharge or by another discharge close by. In either case, interpretation of MTR
results may be improved if the sampling programme includes surveys at regular intervals down
the catchment to assess the varying influences on the macrophyte community (3.2.3).
Page 26

R&D Technical Report E38 12
To undertake a ‘eutrophication audit’ of an individual catchment to determine where
nutr ient control measur es would be targeted most effectively
The MTR is recommended for this purpose provided its inherent limitations in terms of other
influencing factors, as outlined above, are taken into account in the sampling regime and
interpretation of data. Best practice will be to undertake surveys at intervals over the whole
catchment (3.2.3). Reference should also be considered to the requirements of the Nitrates
Directive (91/676/EEC).
To provide an overview of the tr ophic status of a catchment to compare with other
catchments on an area, regional or national basis
The cross-comparison of actual MTR values between catchments is NOT recommended at the
current time, except where catchments are of the same physical type. Even then, the validity of
comparing MTR scores from similar sites in different river catchments has not yet been
confirmed and so comparisons should be interpreted with caution.
Broad comparisons can be made between physically dissimilar catchments by interpreting the
results on a site-by-site basis, taking into account all the potential influencing factors and using
very broad standard descriptors of trophic status. In addition, where demonstrable and significant
downstream changes in MTR can be observed, catchments may be compared on the basis of the
relative degree of downstream degradation as demonstrated by changes in the MTR. This may
help to prioritise those catchments which would benefit most by nutrient control measures.
Specific guidance is given in 3.2.3 and 6.2.3.
2.4.4 Eutr ophication management strategies
The MTR can assist delivery of eutrophication management strategies (eg Environment Agency
1998a) and of catchment or river-basin management plans in two ways.
Assessment and pr ioritisation of problems
The MTR can make a valuable contribution to the assessment of the nature and extent of
eutrophication problems, which can then be prioritised and managed via action plans. The
efficiency of these plans will be enhanced if they are formulated and progressed under the
umbrella of either catchment or wider environmental management plans such as the Agency’s
Local Environment Agency Plans (LEAPs).
Data from all MTR surveys, whatever the primary application, will be useful for this purpose,
although to a greater or lesser degree depending on the sampling strategy (3.2.4). Guidance on
the interpretation of data is as for catchment studies (6.2.3). Emphasis should be placed on the
balance of information available, including evidence from MTR, diatom (3.1.2) and chemical
monitoring.
Whereas LEAPs will require only local collation of MTR data to identify problems within the
catchment, national collation of data is required for eutrophication management strategy
purposes.
Page 27

R&D Technical Report E38 13
Compliance monitoring
The MTR may potentially be used to assess the efficacy of eutrophication control measures and
hence monitor compliance with targets. The capacity of the macrophyte community to respond
to nutrient reduction measures, however, is poorly understood (2.3.3). Until such time as this
understanding is increased, best practice will be to continue MTR surveys after nutrient control
measures are in place. Guidance on sampling strategy is given in 3.2.4. All such post-nutrient
reduction survey data should be collated nationally to allow further method development.
2.4.5 Tempora l changes in trophic status
The MTR methodology is recommended for use to monitor temporal change in trophic status at
a site over a number of years. Temporal change may be either a deterioration due to a nutrient
input or an improvement in response to nutrient control measures. Although this application is
largely untried, due to insufficient data, it is assumed for the interim that the MTR will respond
to temporal changes in nutrient status in a similar fashion to changes on a spatial scale. The
timescale of response can only be established once sufficient adequate data are available.
The general principles of post phosphorus-removal monitoring, as outlined in 2.3.3, apply to
applications beyond the UWWTD.
Page 28

R&D Technical Report E38 14
This page has been left blank intentionally
Page 29

R&D Technical Report E38 15
3 SURVEY PLANNING
This chapter describes the steps which should be taken when planning MTR surveys and should
be read before the surveys are undertaken. The first step is to check that the MTR method is
appropriate for the use required (see 2.3 and 2.4). The next steps are to consider alternative
methods, devise a suitable sampling strategy, plan the logistics of the surveys (when and where
to survey and what resources are required) and collect ancillary data. These steps are described
below.
3.1 Alternative methods to consider
When planning biological surveys to assess river trophic status, it is important to choose the most
appropriate methodology. Method selection requires recognition of the various options available
and an understanding of their comparative strengths and deficiencies under a range of
circumstances. This section outlines the available options and lists criteria to consider when
choosing which option(s) to adopt.
3.1.1 Options
There are two biological methods recommended for the assessment of the trophic status of rivers:
the macrophyte-based Mean Trophic Rank and the diatom-based Diatom Quality Index (a
transformation of the Trophic Diatom Index). An introduction to the MTR is given in Section
2.1 and an outline of the DQI/TDI is given below. Although experienced biologists may also
glean information on trophic status from other riverine biota, for example the benthic macroinvertebrate community, there is no validated standard method to do this. Use of such
information should thus be used with caution and only to support evidence gained from one or
both of the recommended methods below.
3.1.2 Trophic Diatom Index (TDI) & Diatom Quality Index (DQI)
The Trophic Diatom Index (TDI) was developed by Kelly and Whitton (1995a & b) for the NRA
as part of an investigation into the use of plants to monitor rivers and in response to the needs of
the UWWTD. It was further refined by Kelly (1996a, b & c), following testing by practitioners
in Agency regions.
The method is designed for monitoring the trophic status of rivers and streams, and uses benthic
diatom communities rather than the macrophyte assemblages used in the MTR system. Diatoms
are widely used for monitoring water quality on the continent (Whitton & Kelly 1995), for
palaeoecological studies of lake acidification in the UK (Battarbee 1984) and, more recently, lake
eutrophication. In one instance (Anderson & Rippey 1994), a change from eutrophic to
mesotrophic conditions following diversion of a nutrient input from a lake in N. Ireland was
observed in a single season. As diatoms derive their nutrients directly from the water column and
have generation times measured in days rather than months or years, it was thought that these
might constitute a reliable tool for assessment of eutrophication in rivers.
Page 30

R&D Technical Report E38 16
Comprehensive procedural guidance on the TDI methodology is given in the TDI User’s Manual
(Kelly 1996b). Briefly, the method involves the collection of benthic diatom films from natural
or artificial substrates within a 10m reach of river. Sampling of natural substrates is quick and
easy, although sampling of artificial substrates requires two visits to a site. Permanent slides of
the material collected are prepared and analysed in the laboratory. Taxa present on the slide are
identified and the relative proportion of each taxon estimated. These data are then used to
calculate an index showing the degree of eutrophication (the ‘trophic diatom index’ or TDI) and
a second value indicating the contribution of organic pollution at a site. When used together,
these enable nutrient-rich waters to be separated from those which are organically polluted.
Organic pollution is frequently associated with high nutrients, but these nutrients are not
necessarily the only factor determining success of a txaon in organically polluted water (Kelly
et al 1996).
The index is based on 86 taxa and is derived from the weighted average equation of Zelinka and
Marvan (1961), using taxon sensitivity to nutrient status, indicator value (spread around the
mean) and abundance. Taxon sensitivity values assigned to individual taxa range from 1
(favoured by very low nutrient conecntrations) to 5 (favoured by very high concentrations of
nutrients). TDI values can range from 0 (indicating very low low nutrient concentrations) to 100
(indicating very high nutrient concentrations). To facilitate comparisons with MTR assessment,
the scale of the TDI is inverted so that low scores correspond to high nutrients and high scores
to low nutrients (Kelly 1996b). Rather than run the risk of confusion by having two quite
different versions of the TDI working in opposite directions, the ‘new’ diatom index (ie 100 TDI) is referred to as the ‘Diatom Quality Index’ or DQI.
For the purposes of assessing trophic status, the applications of the MTR described in 2.3 and 2.4
apply equally to TDI/DQI. Macrophyte surveys have been traditionally used for conservation
assessments of rivers, while diatoms have been linked with water quality assessments: both can
now be used for trophic status assessment. Further information on the applications of the
TDI/DQI is available in Kelly (1996a & b).
3.1.3 Criteria for deciding which method to use - MTR or DQI/TDI?
Given the two recommended methods for biological assessment of the trophic status of rivers,
the next step is to consider their comparative merits and decide; (a) whether either method is
suitable, (b) if so, which is the most appropriate or (c) whether both methods are required.
Factors influencing this decision may include: the specific purpose and objectives of the survey;
the survey/site conditions; the resources; and/or, expertise available.
It is recommended that for comparison with MTR results, diatom data is presented as the DQI
rather than the TDI. This allows maximum compatibility between the data presented and thus
assists communication of results to non-biologists.
Wherever possible when assessing the trophic status of rivers, both the MTR and DQI should
be used. This includes monitoring both for UWWTD purposes and for other applications,
guidance for which is given in Section 2.3 and 2.4. The two methods complement each other and
produce results which are broadly in agreement in terms of relative values. Where results differ,
this can often be related to poor site/sampling conditions affecting one of the indices (Dawson
Page 31

R&D Technical Report E38 17
et al 1999b), although in some situations it may reflect a real difference in the response of the
diatom and macrophyte communities to the prevailing trophic conditions, such as a difference
in the time taken to respond to nutrient reduction measures (Box 1). The use of both methods
has the advantage that a broader spectrum of the flora can be examined for the impact of nutrient
inputs in sensitive areas, allowing judgements to be made on more comprehensive environmental
information. However, the information gained from either method should not be used in isolation
and should be put into context in the light of all information gathered at a site. It is likely that
chemical data and physical habitat description will add valuable information to assist
interpretation. The points listed in Box 1 should also be borne in mind.
Page 32

R&D Technical Report E38 18
Box 1 Factor s to consider when deciding whether to use MTR or DQI/TDI
1.
River type
MTR may be more applicable to slow-flowing lowland silty rivers than the DQI
because of lack of suitable substrates for diatom growth. Use of artificial substrates
extends the range of situations where DQI is applicable, although suitable positions to
leave the artificial substrates are still required (Kelly 1996b). Water depth may limit
the use of both methods.
2.
Shade
Both macrophyte and diatom communities, and particularly their biomass, may be
influenced by shading, such as that caused by bankside trees, suspended sediments or
surface floating vegetation.
3.
Flow
Neither method should be used after spates. For both methods, careful consideration
should be given before undertaking surveys in circumstances where the flow from a
point-discharge maintains river flows greater than would be expected (Boxes 2 & 3).
4.
Or ganic pollution
If the effect of organic pollution is suspected then it is strongly recommended that the
DQI method be used (in addition to the MTR, if appropriate), as this has a component
to establish the extent of pollution integral within the method. If it is not possible to
use the DQI method but an MTR macrophyte survey can be used, it may be necessary
to do an invertebrate survey in conjunction with the MTR to establish the extent of
pollution. The most comprehensive assessment could be provided if all three methods
can be used: diatom, macrophyte and invertebrate. It should be noted that the effects
of organic pollution on the MTR are unquantified at this time and information from
invertebrate surveys carried out at the same time will be useful for refining the MTR
method in future. Gross indications of organic pollution, such as the presence of
sewage fungus, should be noted when using any of these methods.
5.
River management
Macrophyte communities may be affected by weed cutting and other associated
maintenance activities.
6.
Navigation
The impact of navigation on the applicability of survey methods is varied. MTR
surveys rely on clear water, but watercourses with boat traffic tend to more turbid than
un-navigable reaches. Water clarity does not affect the DQI (TDI) to such an extent
but makes finding suitable substrates difficult (Kelly 1996c).
7.
Nuisance value
In some circumstances both diatoms and/or macrophytes can cause a nuisance with
respect to intended water use. Diatom scums are particularly prevalent in spring and
excessive growth of macrophytic algae late in summer may require management to
eliminate the nuisance. In circumstances where there is a recognised nuisance from
either diatom and/or macrophyte growths, it may be prudent to ensure that the
assessment method(s) chosen includes the ‘nuisance’ element of the biota (ie DQI
and/or MTR respectively). continued.....
Page 33

R&D Technical Report E38 19
Box 1 Factor s to consider when deciding whether to use MTR or DQI/TDI
.....continued
8.
Distur bance
Neither method should be carried out if conditions at the survey length are not typical
of the survey site (see Box 2).
9.
Season
MTR surveys are restricted to the period between mid-June and mid-September
(3.3.1). The DQI method is applicable throughout the year, access permitting,
although it is recommended that studies are performed between spring and autumn
(Kelly 1996b). For comparison purposes it will be necessary to carry out DQI surveys
at roughly the same time of year as MTR surveys.
10.
Recovery period
When nutrient control measures such as P-stripping are put in place and an assessment
of the subsequent recovery of the biota is required, the relative performance of the
MTR and DQI in detecting improvements in trophic status over time must be
considered. The speed of response of diatom and macrophyte communities to
improvements in trophic status caused by P-stripping, however, is largely unknown at
the present time and more data are required. It is likely that diatom communities will
respond faster as they are entirely dependant on water column nutrients for growth.
The influence of sediment nutrient characteristics on macrophyte recolonisation are as
yet unknown*. The best practice would be to undertake both methods at sites where
nutrient removal is in place, or is likely to be introduced.
11.
Har monisation with other surveys
The DQI is easier and quicker to carry out in the field and, as a result of sample
preservation, allows a greater degree of flexibility in the organisation of survey
programmes than does the MTR. It may thus be more easily added onto an existing
sampling programme, especially invertebrate surveys as the survey area used is
comparable. MTR surveys may, however, be more valuable for comparison with
historic data sets of the same site where only macrophyte data are available. MTR
surveys are also more appropriate if wishing to harmonise with surveys for
classification of river types for conservation purposes.
12.
Resources
The method used will be dependent on the expertise and equipment available and the
cost of the survey. More time is spent in the field for MTR, but less in the laboratory.
* This is the subject of an ongoing Environment Agency funded PhD project.
Page 34

R&D Technical Report E38 20
3.2 Sampling strategy
3.2.1 Assessing the impact of point-sources of nutr ients
The general sampling strategy for assessing all point-sources of nutrients, whether UWWTD
qualifying discharges or not, is very similar to other biological assessment methods. An MTR
survey should be undertaken from a site upstream of the discharge and compared with an MTR
survey downstream of the discharge. More than one survey downstream will be required to
assess the geographical extent of any impact. More than one survey upstream of the discharge,
or in other physically-similar parts of the catchment, may be required to help determine whether
the MTR is suppressed by factors other than nutrient enrichment. In cases where it is suspected
that the downstream change in MTR is being influenced by factors other than trophic status (by
increased turbidity, for example), there is justification for using information from other biological
assessment methods, such as the DQI and the River Invertebrate Prediction and Classification
System (RIVPACS), to give a more refined picture of the impact of the discharge.
3.2.2 Non-point source discharges
It may be difficult to pinpoint specific areas where degradation of the aquatic macrophyte
community structure occurs unless a comprehensive study of the whole catchment is undertaken.
However, surveys may be targeted around the areas where the potential for non-point source
pollution is highest. Examples include: areas where the nature of the land use means that there
is a high potential for sediment erosion; areas where the potential for farm effluents entering the
river system is highest; and areas where run-off from hard surfaces in urban areas is occurring.
3.2.3 Catchment studies
To improve the interpretation of MTR values by placing them in a catchment context (2.4.3),
surveys should be undertaken at regular intervals down the catchment to assess the varying
influences on the macrophyte community.
To undertake a ‘eutrophication audit’ of an individual catchment, to determine where nutrient
control measures would be targeted most effectively, surveys should be undertaken at intervals
over the whole catchment. However, the inherent limitations of the method must be taken into
account when selecting sites and interpreting data. Results must only be compared between
physically similar sites (6.2.3).
To provide an overview of the trophic status of a catchment to compare with other catchments
on an area, regional or national basis, the survey strategy is as outlined in the paragraph above.
However, the limitations on comparison between catchments (2.4.3 and 6.2.3) must be taken into
account when planning the surveys and interpreting results.
3.2.4 Eutr ophication management str ategies
To assess and prioritise problems on a large (eg national) scale, surveys of whole catchments or
sub-catchments will be of most use. More restrictive surveys targeted at specific discharges (eg
Page 35

R&D Technical Report E38 21
for UWWTD purposes or assessment of non-qualifying discharges) may provide a ‘coarse’ focus
for initial prioritisation of areas worthy of more attention, but should then be followed up by more
intensive surveys on a whole catchment or sub-catchment basis before recommendations are
made regarding nutrient reduction measures. However, the limitations on comparison between
catchments (2.4.3 and 6.2.3) must be taken into account when planning the surveys and
interpreting results.
To monitor compliance with water quality targets after installation of nutrient reduction
measures, MTR sites up- and downstream of the discharges in question should continue to be
monitored after the nutrient reduction measures are in place. Control sites further upstream and
perhaps also on physically similar rivers, should also be monitored to establish the baseline
variation. Any changes due to the nutrient reduction measures will be superimposed on this
natural variation.
Page 36

R&D Technical Report E38 22
3.3 Logistics of sampling
3.3.1 Timing of surveys
Macrophyte surveys should be carried out between mid-June and mid-September (the ‘survey
season’) after several days of low flow or low–normal flow as opposed to high flow/spate.
Although some macrophytes are visible outside this survey season, others are not and hence the
MTR score will not be an accurate representation of the trophic status because of the missing
species. Even within the survey season, differences in the growth patterns of individual species
may result in changes in their relative abundance during the season, with consequent variation
in the MTR score. To minimise such within-season differences in MTR score, surveys should
be undertaken in close succession when comparing different sites on the same river within the
same year, and at the same time of the survey season each year when comparing the same site in
different years.
Rivers should not be surveyed at times of high flow as access is dangerous and turbid conditions
mean complete and/or accurate data are unlikely to be obtained. Once spate water levels have
dropped to, and remained at, more normal flow levels for several days, surveys can be resumed
but the survey results may be affected and this will need to be taken into account when
interpreting the data. The timing of the spate flow will determine which macrophyte species are
able to grow back to their original abundance levels and which will be under represented for the
remainder of the season.
Where surveys being compared cannot be undertaken at the same time of the survey season,
caution should be applied when comparing results and allowance made for natural within-season
variation. Macrophyte species have different seasonal growth patterns, some species exhibiting
accelerated growth rates early in the season and others not attaining maximum size until late
summer. This can result in changes in the MTR and the overall percentage cover from early to
late summer.
3.3.2 Number of sur veys per year
To assess a site for trophic status, it is recommended that a minimum of one survey per year for
three years should be undertaken, with the surveys being carried out at the same time of the
season each year.
A useful way to organise a survey programme to ensure that surveys are undertaken at the same
time of the season each year, is to survey sites in the same order each year.
If a second survey is undertaken at a site within the same year, then there should be a minimum
of seven weeks between surveys and allowance for within-season differences in growth must be
made when interpreting results. It is recommended that such surveys are undertaken only for
calibration purposes, to provide an indication of the within-season variation and to help when
placing overall results into a wider context.
Page 37

R&D Technical Report E38 23
Although a minimum of three once-a-year surveys is recommended, to enable any inter-year
variation to be taken into account, assessments of trophic status using MTR may be undertaken
on the basis of a single survey in a single year. This may be particularly appropriate for
catchment studies, where the aim is to gain an overview of the trophic status of a catchment in
order to identify those areas which would most benefit from further investigation and/or
eutrophication control measures.
The above guidance is consistent with that previously issued by the NRA and the Agency for
UWWTD macrophyte surveying (NRA 1994b, Environment Agency 1998b). The NRA/Agency
guidance is to carry out 4 surveys over three years (eg 1994, 1995 and 1996 for the 1997 review),
with each site surveyed twice in one of the years, once in the earlier part of the season and again
in the latter part, to obtain a better idea of seasonal growth.
The number of surveys per year is also subject to the following quality assurance
recommendation (see also 7.2.2). Each year, each surveyor must either undertake a set minimum
of MTR or other macrophyte surveys (the suggested minimum is five surveys per year), or attend
a training course at which MTR surveys are undertaken. At the beginning of the survey season,
surveyors who did not achieve the minimum requirement of [five] surveys in the previous year
should not undertake further surveys until they have received MTR training.
(Note that this is referring to the number of individual surveys not the number of pairs/sets of
surveys up- and downstream QDs. Refer to the glossary for definition of survey.)
3.3.3 Site and sur vey length selection
The site is the broad location where the survey is to take place, eg xkm downstream of a waste
water treatment works.
The survey length is the sample area — the actual area of river channel surveyed, between two
fixed points on the bank. The survey length is 100m long for standard MTR surveys (with an
option to survey a 500m length in addition: see Box 4).
Factors which need to be considered when selecting a survey site/length and assessing its
suitability are listed in Box 2.
A map of the location of the site and survey length should be retained on file so that the survey
length can be accurately located on return or audit visits. This map may be the sketch map
completed on a survey (see 4.6.9) and/or a more general map (eg showing details of access,
parking and other features outside the scope of the 100m sketch map).
On the first survey at a site, the reason(s) for the selection of the survey length location should
be noted in the ‘Comments’ section of the field sheet and a record of these comments retained
on file.
3.3.4 Conditions under which surveys should not be undertaken
Page 38

R&D Technical Report E38 24
Surveys should not be undertaken when survey conditions are atypical for the site or prevent an
adequate survey, or when the suitability of the site has otherwise been compromised. Some
examples of unsuitable survey conditions are listed in Box 3.
Box 2 Factor s to consider when selecting MTR sites and sur vey lengths
1.
Operator health and safety
Follow health and safety guidelines in selecting the location of survey lengths.
2.
General physical character
The survey lengths chosen should be typical of the river, within the other constraints
listed. If local knowledge is not available look further upstream and downstream of the
proposed survey length to determine this.
3.
Water clarity
Try to avoid locating survey lengths where the visibility of the river bed is significantly
impaired either because the water is deep or turbid. If the survey length is usually
turbid or too deep to see the bottom of the channel then a ‘best attempt’ at surveying
for macrophytes can be made (see guidance on sampling aids, 4.5.3).
4.
Shade
Although the degree of shade does not appear to influence the performance of the MTR
at assessing trophic status (Dawson et al 1999b), it is advisable to avoid heavily shaded
areas when selecting survey lengths.
5.
Water flow and velocity
Survey lengths should not be situated where water flows and/or current velocity
compromise operator safety (refer to health and safety guidelines). Careful
consideration should be given before undertaking surveys in circumstances where the
flow from a point-discharge maintains river flows greater than would be expected, ie
significantly more flow downstream of the discharge than upstream. In this situation,
the physical conditions may affect the MTR score more than water chemistry.
6.
River management
Weed cutting and other associated maintenance activities including dredging will often
have a major effect on the cover and biomass of plant communities. Over time, this
may alter and maintain the dominance of different plant species from those naturally
present. The frequency and timing of river maintenance should be considered when
selecting sites and survey lengths, and the effects of the maintenance taken into
account when interpreting results.
7.
Artificial structur es
Survey lengths are often located in the vicinity of bridges for ease of access. It is
preferable, however, if the length selected is situated so that it does not include
structures such as bridges, gauging/syphon weirs, locks and concrete-lined channels
within the survey length itself as these may affect the substrate type, marginal area type
and flow pattern. Local trampling effects may also occur near such structures so an
atypical vegetation pattern may be observed. Any structure is potentially dangerous to
the surveyor(s). Where structures cause change in the flow regime of the river the
survey length should be situated at a location most typical of the rest of the river.
8.
Location of the survey length in relation to a dischar ge being assessed
Page 39

R&D Technical Report E38 25
Where an assessment is being made of the impact of individual point discharges into a
river (eg UWWTD surveys, non-qualifying discharges), site selection is also based
upon a need to determine the effect, if any, of discharges and to avoid as far as possible
other factors which influence macrophyte communities. continued....
Box 2 Factor s to consider when selecting MTR sites and sur vey lengths
8. Location in relation to a dischar ge (....continued)
Standard 100m survey lengths should be as close to the discharge point which is being
investigated as possible, within the constraints of the other factors listed. They should
not be more than 500m from the discharge unless other over-riding factors determine
otherwise, such as an additional effluent, storm overflow or tributary. The priority is to
find 100m stretches with comparable physical characteristics upstream and
downstream of the discharge. If sites of comparable physical character are not present
within 500m of the discharge point but are present within 1000m, these should be
chosen in preference to contrasting sites closer together. Sites so far apart should not
be selected if there are other inflows. It is important that this modification from the
norm is clearly documented. See also Box 5 on exceptions to surveying the full
channel width.
The first survey length downstream of the discharge should be far enough away from
the discharge to avoid very localised effects of the effluent. It may be advisable to
survey more than one length downstream of a discharge, to ensure that any impact is
detected.
Take into account the position of any stormwater/emergency overflows, and position
the survey length accordingly.
9.
Compar ability with other sites
The MTR is influenced not only by trophic status but also to some extent by the
physical character of the survey length. Therefore, if a series of sites are to be surveyed
along a river in order to assess downstream changes in trophic status, the sites to be
compared should be as physically similar as possible. Assessment of site comparability
is based upon degree of shading, substrate type, channel width, water depth, water
velocity, water clarity and bed stability. If in doubt, use the suffix of confidence
described in 4.6.12 as a guide as to whether survey lengths chosen are comparable,
noting that if the suffix is likely to be ‘c’ then this survey length is not suitable for
survey and a new more comparable survey length should be found if possible. When
surveying new sites, time is saved by looking for similar suitable survey areas before
commencing any surveying.
If physically comparable sites are available, the downstream length in any consecutive
pair of sites should be situated to reflect any observed change in vegetation. To assess
if a noticeable downstream difference in the flora can be observed, the surveyor should
walk along the bank or use a boat to carry out a fairly extensive assessment of at least
500m of river both upstream and downstream of the discharge. Note the position of
any distinct observed change and describe briefly the difference in the downstream
community as compared with the upstream macrophyte community.
If an effect is noticed but there is no similar upstream survey length then the effect
should be photographed and commented on. If no downstream effect is noticed, survey
Page 40

R&D Technical Report E38 26
lengths typical of the river should be selected.
When back channels and main navigation channels are present, survey lengths being
compared should be positioned either all/both on a back channel or all/both on the main
channel so the survey results are comparable.
Page 41

R&D Technical Report E38 27
Box 3 Conditions when surveys should not be under taken
1. Do not carry out macrophyte surveys during steady/heavy rain and windy conditions
as the disturbance of the water surface leads to reduced visibility and could affect
operator safety.
2. Surveys should not be undertaken after spates because of dangerous conditions for
wading and the probable loss of plant material and disturbance of habitat caused by
high flows. Do not underestimate the potentially serious effects of flooding, as even
minor flooding will cause temporary changes in the relative composition of species
at a site. It is very important to either avoid surveying after flooding or at least to
reflect the flooding in the suffix of confidence for the survey. It is always best to
survey after a period of low flow as the water is usually clear and macrophytes are
easily visible.
3. Where surveys are undertaken over a number of consecutive years, to gain an overall
picture of the ‘typical’ trophic status over the period, periods of unusual flow should
be avoided as they will not reflect the ‘typical’ situation.
4. Try to avoid surveying navigated rivers at holiday periods or peak of summer as high
boat activity leads to increased turbidity and a more dangerous situation for the
surveyors.
5. Do not survey macrophytes immediately after a weed-cutting operation or other
management activity which may adversely affect the macrophyte community.
6. Do not carry out a survey if conditions are atypical for the survey site. Atypical
conditions may relate to large floating masses of filamentous algae, excessive
turbidity, or recent weed-cutting/dredging. If floating masses of algae or high
turbidity are normal for the site then consideration should be given to using an
underwater camera during surveys (see 4.5.3).
3.3.5 Survey equipment
The following is a list of equipment required to carry out an MTR survey; it is reproduced as a
checklist in Appendix 7.
· Safety equipment - refer to safety manuals and advice available from your manager or safety
advisor
· Maps - Ordnance Survey 1:50 000
· Location and/or sketch map to enable accurate location of the survey length (if surveyed
before)
· Standard record sheets + sketch map sheet (on waterproof paper if necessary)
· Summary of the MTR methodology and definitions reference sheets (optional) - Appendix
7
· Substrate reference and % cover reference sheets (optional)
· Pencil and pen
Page 42

R&D Technical Report E38 28
· Clipboard with waterproof shield/cover or a large clear plastic bag (to protect record sheet
and make writing possible in damp conditions)
· Grapnel with depth markings on the rope
· Bank stick with depth markings
· Plastic bags, labels and tubes for small specimens
· Tape measure or measuring rope, stakes and mallet (to mark start and end of survey length)
· Identification and field guides (Appendix 3)
· Camera with a polarising lens and 200 ISO daylight film speed
· Hand lens (x10)
· Blackboard & chalk or wipe-clean board, non permanent pen and cloth (small, to include site
details in the photographs)
· Underwater viewing aid (eg glass-bottom bucket or underwater TV camera, see Appendix
4 for details)
· Polarising sunglasses (optional)
· Optical range finder (optional) - Appendix 4
· Boat and additional safety equipment as required
· Copies of previous survey sheet(s) for site(s) to be surveyed (optional).
3.3.6 Wildlife and Countr yside Act 1981
Macrophytes are protected under the Wildlife and Countryside Act, 1981. Whole plants should
never be uprooted, and portions of scarce macrophytes should only be removed when absolutely
necessary (under no circumstances must those rare species listed in Schedule 8 of the Act have
any parts whatsoever collected). A list of relevant ‘rare’ species is given in Appendix 1.
Material collected should be confined to the minimum required for identification. If a rare plant
is found, make records of it by photography, noting any distinguishing features of the plant in the
field.
3.3.7 Health and safety
Surveyors should refer to health and safety guidelines before undertaking MTR surveys. Please
note that the surveys always involve working in water, could involve contact with polluted water,
could be undertaken by a lone worker (although this is not recommended, see 3.3.8) and/or could
involve use of a boat.
3.3.8 Staffing level
Where resources allow, surveys should be carried out by a team rather than a single surveyor.
A minimum of double-staffing is to be encouraged as contributing towards good practice, for the
following reasons:
· it reduces inter-surveyor variation and thus improves the quality of the survey data collected;
· it improves the efficiency of the survey.
One of the most significant causes of inter-surveyor variation, and thus of reduced quality of
results, lies in the estimation of percentage cover. The accuracy and consistency of these rather
Page 43

R&D Technical Report E38 29
subjective estimates may often be improved by achieving consensus from a ‘group decision’
rather than relying on a single surveyor. Such group-conferring may also help resolve difficulties
of macrophyte identification and survey length relocation.
Efficiency may be improved by allowing different tasks to be shared simultaneously. When
assessing and recording the presence and abundance of macrophytes within the survey length,
there are a number of items of equipment the surveyor is required to carry, and a number of tasks
the surveyor is required to achieve. The surveyor must use a clip-board, glass-bottomed bucket
and plastic bags/vials for specimens, whilst retaining a free hand to record items on the clip-board
and another free hand to collect specimens. This can make the survey difficult and timeconsuming, and as a result may also impair the quality of the results obtained. When two
surveyors are present, the equipment and tasks can be shared. Other tasks may also be shared
simultaneously in this way: for example, the sketch map, the assessment of the physical
characteristics of the site, taking a photograph and taking a diatom sample (when a DQI survey
is undertaken in conjunction with the MTR).
Minimal extra time accrues from double-staffing compared to single-staffing. For sites which are
double-staffed for safety reasons, it may not represent any additional resource investment.
In cases where surveys are undertaken by teams of two or more surveyors, one member of the
team should be charged with overall responsibility for the survey. The initials of this ‘principal
surveyor’ should always be listed first on the survey sheet, before those of the co-surveyor(s).
The ‘principal surveyor’ should be fully trained in all aspects of the method. Co-surveyors
should be similarly trained, but exceptions are allowed as outlined in 7.2.4. When undertaking
the survey, surveyors in a team should confer regarding definition of the survey length, definition
of the channel, identification of macrophytes, abundance categories and overall percentage cover,
and reach a consensus ‘group’ decision. This minimises problems of relocating the survey length
and provides an immediate ‘spot-check’ on identification and cover estimation. Differences
between surveyors can be discussed, and resolved if possible, on the spot. The ‘principal
surveyor’ has the final decision in case of dispute.
3.3.9 Time required to carry out a sur vey
Assuming a survey team of two operators, the total time spent per survey (including preparation,
travel to site, field survey, laboratory analysis and data analysis) is likely to take one person-day,
although this may vary considerably depending on travel distance, ease of access to the site, the
nature of the macrophyte community, the weather and the experience of the surveyors.
Page 44

R&D Technical Report E38 30
3.4 Ancillar y data collection
Background information is needed about the macrophyte survey sites. The geological information
will only need to be researched once for each site. The pollution and channel management
information will need to be researched for each survey of a particular site. Find out what the
geological type and operational management plan is for the area to be surveyed, and the nature
of any known pollution incidents, before planning macrophyte surveys.
3.4.1 Geological and geographical informat ion
The background data that should be researched from maps is rock type, altitude and slope.
Under lying geology/rock type: the geology of a site may influence the macrophyte community
both through lithology and baseflow.
Research the rock types in the areas proposed for survey, by referring to geological maps, so the
geology of the area can be taken into account. If survey sites on a river are situated on the same
drift and solid types, it is probable that neither the lithology nor the groundwater contribution to
base flow, are causing any observed downstream change in vegetation. If the sites are on different
geological types it may be that any observed change in vegetation pattern is related in some way
to the geology of each site.
Record both drift and solid rock types. The cross-section given on the bottom of each map can
be of use in deciding on the underlying solid rock type, if it is not labelled on the map.
Altitude
: site altitudes should be taken from 1:50,000 maps. It is recommended that estimates
be made to the nearest 5m.
Slope
: A mean slope between the two contours either side of a site should be measured. The
slope is expressed by the following equation:-
Slope = c / x m/km
where c = the difference in altitude (m) between contours on either side of the
site, and x = the distance (km) between the two contours as measured along the
course of the river. Use a map wheel to obtain this value.
3.4.2 Management work
Operational management work such as dredging and weed cutting have obvious effects on the
results of macrophyte surveys. Before planning macrophyte surveys it is useful to find out if any
work is planned or has been completed since the last survey. Surveying a site after extensive
weed cutting or dredging will reflect the damage done to the macrophyte community by the
activity. The timing of weed cutting is also important as different species grow at different rates
and reach maximum size at different times of the growing season. Thus a weed cut early in the
season will have a different effect than a later one and change the macrophyte community pattern.
Page 45

R&D Technical Report E38 31
Note the timing of any management work undertaken before the survey on the standard sheet.
In subsequent years note any management work which has been carried out since the last survey
as well as any planned work.
Types of management work:
· Dredging
· Piling: reinforcement of river banks with (usually) metal sheets, driven
into the bank by a pile-driver
· Other types of bank reinforcement
· Bridge repairs
· Weed cutting
Source of information
: Catchment Engineers and Flood Defence Engineers of the relevant
authority. Work is planned in advance but is weather dependant.
3.4.3 Pollution incidents
Determine if any pollution incidents have occurred which may have affected the macrophyte
community at a site. Note any pollution incidents that may have effected the macrophyte
community on the standard sheet. Give details of date and nature of pollution.
Sources of information: Water Quality staff of the relevant authority.
Page 46

R&D Technical Report E38 32
3.5 Limitations of the method
3.5.1 Uses and app lications
The MTR score is influenced to some extent by the physical character of the river as well as the
nutrient status. This means that the method cannot be used to make a quantitative assessment of
the trophic status of an individual site — only a qualitative assessment — and should not be used
to compare the trophic status of physically dissimilar sites. At the present stage of method
development the MTR system can only show change in trophic status reliably over a relatively
short physical distance, such as upstream and downstream of a discharge, without other
complicating factors coming into play.
3.5.2 Operator health and safety
The method is limited to sites where operators can safely undertake a survey. For example, deep
water, high current velocity and bed instability may render a site unsuitable for survey (refer to
health and safety guidelines).
3.5.3 Site and survey conditions
The method is limited to sites and occasions where the conditions are suitable. Conditions which
may reduce the efficiency and accuracy of the survey include:
· adverse weather conditions
· high flows, spates and flooding
· poor water clarity
· heavy shading
· presence of artificial structures
· river maintenance such as weed cutting or dredging
· navigation activity
· atypical conditions.
These factors should be considered when selecting site and survey lengths (Box 2).
3.5.4 Plant growth stages
Macrophyte survey methods can only be utilised during the summer months (mid-June to midSeptember) due to the growth and dieback cycle of certain species (3.3.1). Differences in
seasonal growth patterns between species may also result in variation in the MTR score within
the survey season. Surveys undertaken at a site over a number of consecutive years can thus be
compared with confidence only if taken at the same time of the survey season every year.
Surveyors should also be aware of natural fluctuations in the occurrence of certain species in
rivers (eg Ranunculus). Care should be taken when interpreting absence of particular species
that it is not a temporary absence. Detailed site knowledge and consultation with riparian owners
may be necessary to determine this.
Page 47

R&D Technical Report E38 33
3.5.5 Difficulties resulting in surveyor err or and/or inter -surveyor differ ences
The most common sources of surveyor error and variation between surveyors are: differences in
estimates of macrophyte cover; mis-identification of macrophytes; missing species that are
present only in isolated small patches; differences in judging whether specimens are ‘in’ and
‘out’ of the channel; and errors in accurately locating the survey length. All can be reduced by
provision of adequate training, correct application of the method and adoption of quality
assurance measures (see Chapter 7).
Page 48

R&D Technical Report E38 34
4 HOW TO CARRY OUT AN MTR SURVEY
This chapter describes the survey methodology, starting with an overview (4.1), then progressing
to detailed procedural guidance on preparation (4.2), the field survey itself (4.3–4.6) and
laboratory analysis (4.7). The method is summarised in Figure 3 in the form of a flow chart and
in Appendix 7 as a checklist, either of which can be used as a field ‘prompt sheet’.
4.1 Overview of the methodology
The macrophyte survey method chosen is based on the ‘Blue Book’ Method B (DoE Standing
Committee of Analysts 1987). It can be summarised as follows.
1. A standard length of watercourse (100m) is selected or located and assessed to confirm
its suitability for survey. If suitable it is measured out and the ends marked (the ‘survey
length’). Standard field sheets are used to record site and survey details.
2. The macrophyte flora and physical character of the survey length are then surveyed by
wading, boat, or walking along the bank. Sampling aids are used where necessary.
3. All macrophytes present are recorded, together with the estimated percentage cover of
each taxon (recorded as abundance classes: the Species Cover Value or SCV) and the
estimated percentage cover of overall macrophyte growth. Representative samples are
taken for laboratory analysis if identification is uncertain.
4. The physical character of the survey length is recorded by estimating physical parameters,
drawing a sketch map and taking a photograph.
4.2 Prepar ation and pre-survey checks
Before going out on survey, surveyors should ensure that they have all the equipment they need,
that they know the precise location of the survey lengths to be surveyed and that they are familiar
with the necessary health and safety guidance. An equipment checklist is provided (Appendix
7).
Upon arrival at the survey site, the surveyor should confirm that the site and/or survey conditions
are suitable for an MTR survey (see Boxes 2 and 3). Think again if:
· the suffixes of confidence for the survey and comparability are C and/or III
· there has been a recent temporal perturbation (eg spate or weed-cutting)
· flows are high and/or the water is turbid
· there is heavy/steady rain and/or windy conditions
· an alternative method is more appropriate.
4.3 Site and survey details
The appropriate site details such as name, river, date, time and surveyor’s initials are recorded
on the standard survey record sheet (see Appendix 5). In cases where surveys are undertaken by
teams of two or more surveyors, one member of the team should be charged with overall
responsibility for the survey. The initials of this ‘principal surveyor’ should always be listed first
on the survey sheet, before those of the co-surveyor(s), to help the auditing process (see 7.3.6).
Page 49

R&D Technical Report E38 35
4.4 Mar king the survey length
4.4.1 Length of river to be surveyed
For all applications, the standard survey length should be 100m, with macrophyte abundance
recorded on the 9-point abundance scale C (see 4.5.5 for abundance scales). One exception is
allowed for wide and deep rivers (Box 4). Where extra information would assist in the
interpretation of data, the surveyor also has the option to undertake a 500m survey (Box 4).
When surveying a survey length for the first time, measure the actual length accurately using a
tape measure. Mark each end of the survey length with a short stake or ranging pole which is
clearly visible from the river channel.
If suitable details for relocation are included on the sketch map for subsequent surveys of the
same length at the same site, then the length may be measured out using the system of pacing
described below in conjunction with the sketch map, instead of using a tape measure. As an
alternative to pacing, a 10m rope can be used, but this requires at least two people on site to make
it an efficient method. If in any doubt, use a tape measure on each visit.
Regularly check on the number of paces needed to measure out the required survey length. This
will vary for each surveyor and should be calculated before the beginning of field work. Mark
out on the ground a 10m length and count the number of paces it takes to complete this distance.
Repeat the exercise until confident that only a small variation occurs. Multiply up the figure
obtained to determine the required number of paces for each survey length. If the error in pacing
out the survey length is more than ± 10% then the actual length should be measured with a tape
measure. This also applies where irregular pacing is anticipated due to obstructions or where
pacing could only be undertaken in the channel.
4.4.2 Width of channel to be surveyed
The survey method covers those ‘river’ macrophytes contained within the ‘channel area’.
Records of ‘bank’ species are not made unless the survey is also for conservation purposes. Nonnative and ‘weed’ species (Appendix 2) should be recorded.
Channel area definition:
All macrophytes seen submerged or partly submerged in the river, at low flow
levels, within the survey length. These are considered to be ‘river’ plants. At the
sides of the river all macrophytes attached or rooted on parts of the substrata
which are likely to be submerged for more than 85% of the year are included.
Bank area definition:
The ‘bank’ is defined as that part of the side of the river (or islands) which is
submerged for more than 50% but less than 85% of the time.
Page 50

R&D Technical Report E38 36
As it is best to survey macrophytes when the river has been at low flow for several days, the
definition of channel area is fairly easy to interpret in a consistent manner. Obviously some
degree of judgement and common sense is required to decide whether a macrophyte species is
in the channel. Macrophytes overhanging the channel but not rooted in the defined channel area
should not be counted. In general, records will be for those macrophytes which occur in the
region of the river which is rarely uncovered, and those shallow sections which have an upper
limit that may be exposed for a maximum of 50 days in any one year.
‘Bank’ macrophytes are those plants that occur above the limit of the river plants, and are thus
out of the water for more than 50 days in any one year, yet will be submerged or partly so, during
average flow periods.
4.4.3 Location of the survey length
If having completed a survey the results appear to have been affected by the physical constraints
of the survey-length location, then consideration should be given to moving the location of the
survey length within the guidance given in Box 2.
Quality assura nce
If using the pacing system, each surveyor charged with determining the upstream and
downstream limits of the survey length must check, at the beginning of each survey day, the
number of their paces required to measure out the survey length. Do this for 10m as
suggested above.
The survey length should agree with the relocation features marked on the sketch map.
Decisions regarding channel definition — which specimens are ‘in’ and which ‘out’ of the
channel — are a common cause for inter-surveyor differences. Application of strict discipline
is thus required: always check whether the roots of an overhanging specimen are in the
channel or not, and do not be tempted to record specimens which are not rooted in the
channel just because they ‘score’. If a species is only recorded from the waterline, mark this
on the field sheet (this will help clarify disputes between primary surveyor and auditor).
Page 51

R&D Technical Report E38 37
Box 4 Non-standard sur vey lengths
1.
Exceptions to the standard 100m survey length
If it is absolutely impossible, in a large river, to find two 100m sites of comparable
character within close proximity of a discharge being assessed then choose 50m
reaches of similar character, provided that the river is at least 10m wide (so that the
survey area will be >500m2).
2.
Optional surveying of 500m survey lengths, in addition to the 100m length
Where extra information would assist in the interpretation of data, the surveyor has
the option to undertake a 500m survey in addition to the standard 100m length survey.
The 500m (which must include the original 100m survey length) is surveyed in its
entirety as a separate survey, using a 5-point scale for recording macrophyte
abundance rather than the 9-point scale used for 100m surveys (see 4.5.5 for
abundance scales). It is not possible to convert the data collected from the initial 100m
to the 5-point scale and combine this with data collected for an additional 400m. The
MTR is not affected by the use of the 5-point scale in place of the 9-point scale but
more information and more resolution of abundance changes can be gained by using
the 9-point scale.
The additional 400m can be placed at either end of the initial 100m or split either side
of it according to site circumstances to give a continuous 500m survey length. Gaps
between the survey lengths are not allowed.
The aim of carrying out the 500m survey is to obtain a fuller species list in order to
verify the interpretation of trophic status from the 100m survey. In many cases the
500m survey will act as a ‘quality check’ on the location of the 100m survey length. In
such cases, a ‘working’ MTR may be calculated from the 500m survey data, but this
must only be used to compare with other 500m ‘working’ MTRs (eg upstreamdownstream pairs) and to verify that the interpretation of trophic status from the 100m
survey(s) is correct. In most cases, the MTR calculated from a 500m survey will not
be significantly different from that derived from a 100m survey. As a precautionary
measure, however, ‘working’ MTRs from 500m surveys SHOULD NOT BE USED
for reporting purposes.
If a 500m survey is carried out, this does not need to be re-surveyed every year but
may be repeated every 5 years for comparative purposes IF great changes in the 100m
survey data occur.
Page 52

R&D Technical Report E38 38
Box 5 Exceptions to surveying the full channel width
In all cases every reasonable attempt must be made to survey the full survey-length. There
are a few exceptional cases where it is acceptable to modify the approach.
1.
Wide and deep rivers
In some very wide and deep rivers it may be impractical to carry out a survey of the
full channel width on all surveying occasions. In such rivers, where the central channel
may be devoid of vegetation or cannot be accurately recorded due to depth/turbidity
even using an underwater camera, a 5m wide (minimum) strip down one side of the
channel (ideally with little tree shading) can be surveyed. Where the impact of a
discharge is being assessed, the downstream survey length must always be on the side
into which the effluent discharges. In watercourses where an effluent tracks along one
bank only for at least 500m downstream it may not be suitable to carry out a full width
survey on all occasions either and, therefore, a 5m (minimum) strip can be surveyed.
In such circumstances the whole river width must be surveyed initially so that results
from the whole channel can be compared with the selected 500m2 .
2.
Mature islands
Where the impact of a discharge is being assessed and a mature island is located
within the survey length, only the side on which the discharge enters should be
surveyed.
3.
‘Black holes’
No gaps/‘black holes’ must be left in a survey length except under the following
circumstances. If the majority (>80%) of a site can be surveyed by wading but the
remainder is deep or rapid and it is not practical to survey using a boat and
camera/glass-bottomed-bucket then this may have to be left as a ‘black hole’. This
must be clearly mapped and discounted in all future surveys. The ‘black hole’ should
be totally excluded from the survey: it should not be included in estimations of plant
cover or physical attributes (except for width).
Page 53

R&D Technical Report E38 39
4.5 Carrying out the macrophyte survey
Assess the presence and abundance (in terms of percentage cover) of macrophytes within the
survey length and record this information using the standard field sheet (Appendix 5). In terms
of survey technique, the majority of survey sites can be divided into two basic types: those that
are wadeable and those requiring a boat to allow access to all areas of the site.
4.5.1 Survey technique: wadeable survey sites
At sites where it is assessed to be safe to do so, the full survey length and channel width is
surveyed by wading. At the majority of sites a second operator will be required for safety reasons
(but see 3.3.8).
Wading should be in an upstream direction so that any substrate disturbed does not obscure the
visibility of the survey length both for ease of observation and safety reasons.
Where all but a small proportion (< 20%) of the survey length is accessible by wading it is
acceptable to walk for a short distance along both banks observing the macrophytes and to
investigate for submerged macrophytes using a grapnel.
The operator should wade in a zigzag manner across the channel, frequently investigating all
habitat types present. The operator should cross the channel a minimum of 4 times in each 10m
of the survey length as shown in Figure 1. Obviously this has to relate to visibility and is not
prescriptive. For example, on wide but wadeable rivers with clear water it will not be necessary
to cross the channel as frequently.
During wading, record the species present and think about the percentage of the survey areas
covered by each species. Use sampling aids as appropriate (4.5.3). Include both MTR-scoring
species and non-scoring species. Although only scoring species contribute to the MTR score, it
is difficult to ignore non-scoring species and all species contribute to the overall percentage
cover.
Take particular care to examine all small niches within the survey site to look for small (£25cm2)
patches of species. Such patches are easy to miss but their non-recording can result not only in
Page 54

R&D Technical Report E38 40
inter-surveyor differences but also an erroneous MTR.
Detached macrophyte material, except for actual floating macrophyte species such as Lemna sp
and Azolla , should be disregarded. If a macrophyte is stranded above the water, eg in low flow
conditions, then it should not be recorded on the standard checklist. A note of the species, should
however, be made in the ‘Comments’ section along with observations of the amount stranded and
any obvious reasons for stranding.
Where sites are being compared, as in UWWTD monitoring, specimens attached to artificial
structures should only be recorded if a similar structure is present in both/all sites included in the
comparison. A note should always be made of recorded specimens which were attached to
artificial structures.
Once all macrophyte species in the survey length have been recorded wade/walk back along the
survey length, specifically observing the amount of each species present and the overall
percentage of the channel covered by macrophyte growth (4.5.5). On the standard field sheet
(Appendix 5), enter the appropriate Species Cover Value (SCV, see 4.5.5) next to each
macrophyte species and the estimate of the overall percentage cover of macrophytes.
4.5.2 Survey technique: non-wadeable survey sites
At sites where the channel is narrow (about 5m or less wide) but the water is too deep to wade,
if the channel macrophytes can be clearly seen by walking along both banks and using a grapnel
to retrieve macrophyte species for identification then this is sufficient. In narrow channels it may
be impractical to use a boat.
At sites where the water depth is too great to wade and flow is slow, a small boat should be used.
Safety guidelines should be followed.
The boat used should ideally be light and very stable for ease of transport and operator safety.
Rowing or paddling is the most useful form of propulsion while surveying as this causes minimal
damage to the macrophytes and allows greater manoeuvrability throughout the survey length.
Traverse the river in a zigzag manner inspecting all the habitat areas frequently. A minimum of
4 angled crosses of the channel in each 10m should be undertaken so that the maximum distance
from the surveyor to the channel surveyed is 2.5m (Figure 1). On wide rivers it may not be
necessary to cross the channel as frequently.
While traversing the channel, record the species present and think about the percentage of the
survey area covered by each species. As for wadeable sites, include both MTR-scoring species
and non-scoring species, take particular care to examine all small niches within the survey site
to look for small (£25cm2) patches of species, but disregard detached material except for floating
species. Record specimens attached to artificial structures only if a similar structure is present
in other survey lengths with which the results will be compared and make a note of recorded
specimens which were attached to artificial structures. Use sampling aids as appropriate (4.5.3).
After recording all macrophyte species present in the survey length, return along the length
specifically observing the cover provided by each macrophyte species and considering the overall
Page 55

R&D Technical Report E38 41
cover (4.5.5). On the standard sheet (Appendix 5), enter the appropriate Species Cover Value
(SCV) next to each macrophyte species and the overall percentage cover estimate.
4.5.3 Sampling aids
It is important that the bed of channel is clearly visible, to enable accurate assessment of the
species present and their abundance. In circumstances where the bed is not clearly visible due
to deep or turbid water, or due to reflections from the water surface, observation of submerged
species can be aided and errors reduced by the use of a glass-bottom bucket, an underwater TV
camera and/or a grapnel (Appendix 4), as described below.
General guidance
For wadeable surveys, it is strongly recommended that a glass-bottom bucket is used to aid
observation of macrophytes. A grapnel may be used to retrieve submerged macrophytes for
identification from small areas of deep water, if necessary.
At deep-water sites where it is not possible to see the river bed unaided and for surveys by boat,
an underwater TV camera or a glass-bottom bucket must be used to locate the position and assess
the abundance of any macrophytes which cannot be seen from the surface. Use a grapnel to
retrieve submerged macrophytes for identification. Binoculars can also be useful to scan the
margins so that species present in small quantities, particularly if amongst a large stand of other
macrophytes, will not be missed.
In deep and or turbid water the estimates of percentage cover for submerged species may have
to be based entirely on observations from a underwater camera and/or glass-bottom bucket.
Submerged species present in very small amounts may still be missed if the water is turbid.
If the underwater camera and/or glass-bottom bucket is used for a survey at a particular site, then
it must also be used at any other site with which this is being compared.
Where visibility is severely impaired, use an alternative site or survey length if possible.
Otherwise use the same surveyor for sites which are to be compared. If clarity is poor, direct
comparisons of overall percentage cover and submerged species percentage cover should be
treated with extreme caution if used at all.
Underwater TV camera
When using an underwater camera it is possible to see an area of approximately 1–2m wide with
reasonable clarity in very turbid water. During the survey the camera should be used every few
metres across the deep section of the river channel, as necessary. The boat must be rowed very
slowly to ensure stability of the camera and accurate identification of submerged species. It is
recommended that an estimate of the abundance of each species is made for each traverse of the
river and the abundance estimates for that area combined to give a total estimate of percentage
cover in the whole survey area.
The camera unit incorporates a light source which can help visibility in deep/turbid sites, but this
should be used with care as it uses much more power so the battery time is greatly reduced. The
Page 56

R&D Technical Report E38 42
clarity of the water will determine the number of times it is necessary to lower and rotate the
camera lens so that 360 degrees can be observed. If necessary a small weight (see manufacturers
guidelines) can be attached to the base of the camera to ensure greater stability and upright
orientation. In silty/muddy sites avoid contact with the base of the river channel so no
disturbance of the bed occurs leading to reduced visibility.
Grapnel
A grapnel may be used to retrieve submerged macrophytes for identification from areas of deep
water. It is recommended, however, that the grapnel is NOT used to ‘search’ for macrophytes
as a substitute for visual observation, due to the following problems:
· fine-leaved and deeply rooted macrophytes will not be found unless a direct hit is made,
and therefore will either be missed entirely or under-represented;
· ‘bushy’ species such as Elodea will easily be collected by grapnel and their abundance
may therefore be over-estimated.
Use of a grapnel alone will lead to high levels of inaccuracy in both the records of submerged
species and the estimation of overall percentage cover.
Grapnel hauls should only be used when necessary, to retrieve macrophytes for identification or
determine if macrophytes are present, as they can damage or uproot macrophytes. Particular care
should be taken in an area with high conservation or aesthetic value.
4.5.4 Identification of macroph yte species
Identification should be to species level where possible. Take a field identification guide, which
gives distinguishing features and shows which species are easily confused, into the field. Recent
synonyms are listed in Appendix 5 (Table A1). It may also be useful to take into the field a copy
of the survey sheets/results from the previous survey(s), as this may minimise gross identification
errors and help ensure sparely-distributed plants are not overlooked. Previous results must be
used with care, however, as the macrophyte community may have changed and/or the results may
contain errors — they should only be used in a final check, and not as a first point of reference.
Certain species can only be identified when fruiting bodies or flowering parts are present; and
even then only with difficulty. If identification to species cannot be achieved, for example due
to absence of seasonal diagnostic features, and all other routes to identification fail (see below),
then record only to the level to which you are confident (eg genus), even if this then renders the
specimen ‘non-scoring’.
Macrophyte species identified in the field should be checked for positive identification features.
This takes an experienced surveyor very little time, ensures that rarer species are not overlooked
and recorded as their more common counterparts, and reduces the likelihood of macrophyte
species with superficially similar features being incorrectly identified.
Macrophyte species positively identified in the field should be recorded on the standard record
sheet. When a species unfamiliar to a surveyor is found it should be identified in the field if
possible but a representative sample should also be taken back to the laboratory for confirmation
of the identification. A small, representative sample should be taken and placed in a plastic bag
Page 57

R&D Technical Report E38 43
or tube without any additional water, together with a waterproof label. Normally a slip of
waterproof paper or semi-opaque matt film, labelled in pencil is sufficient; alternatively premarked consecutively-numbered strips can be used with the number recorded on the MTR field
form. When using plastic bags, blowing air into the bag before sealing it also helps to maintain
the specimen in a healthy condition. On the label, record site, survey number, date, sampler’s
initials and unidentified specimen name, eg ‘unident. 1’. On the standard record sheet, the
unidentified species should be recorded in the ‘other species’ section, using the same name for
the labelled sample so there can be no confusion on return to the laboratory. This is particularly
important when more than one macrophyte from the same survey needs further investigation.
Particular care should be taken over the identification of Ranunculus
species, as testing of the
methodology has shown mis-identification of
Ranunculus
species to be a common cause of
surveyor error, and thus of error in the MTR (Dawson et al 1999b). If in doubt, a representative
sample should be taken back to the laboratory for confirmation of identification, or identification
confirmed by an expert. Remember that if still in doubt, only record to the genus: ‘ Ranunculus
species indeterminate’. Where you are confident that two or even more species or apparently
differing forms of Ranunculus are present, but you cannot be confident about the precise species,
then it is allowable (or probably preferable) to record each species separately as ‘
Ranunculus
species indeterminate #1’, ‘Ranunculus species indeterminate #2’ etc, provided identification
notes are made in the ‘Comments’ space and representative specimens are preserved in a
herbarium for future identification/comparison.
Representative samples of algae and bryophytes should be taken to the laboratory for closer
examination so that their that identification can be confirmed.
If the species identified is unfamiliar to all members of staff, is an unusual find for the river
sampled or identification is not 100% positive, send the specimen to an expert for confirmation.
If there is sufficient expertise in-house then an internal expert can be consulted. If such expertise
is not available an external specialist must be contacted. BSBI county recorders are a useful
source of local expertise. [Surveyors who have been on a training course run by Dr Nigel Holmes
can currently send difficult specimens to him (Alconbury Environmental Consultants, The
Almonds, 57 Ramsey Road, Warboys, Huntingdon, PE17 2RW) for verification, provided every
effort has been made to identify the species beforehand.]
If possible, representative material of all species regularly encountered in surveys should be
collected and maintained in a herbarium (see 4.7.2). This will make accurate identification of
difficult material easier and will aid in the training of new staff.
Quality assura nce
Page 58

R&D Technical Report E38 44
4.5.5 Estimating macrophyte abundance
Macrophyte abundance is expressed in terms of the percentage of the survey length covered.
This should be estimated by imagining a bird’s eye view of the channel. For estimates of
individual species, it is necessary to imagine the abundance cover of each, regardless of whether
several species are intermingled or overlap.
Percentage cover estimation of filamentous algae can be particularly difficult. Determine whether
the algae are forming a continuous or broken covering of the substrate.
For both overall percentage cover and individual species cover estimation it is useful to calculate
what a one metre square patch of macrophyte represents for each survey length, eg 0.01%, 0.5%
etc, before commencing surveying.
Overall percentage cover estimate
This is an estimate of the total percentage of the channel area covered by macrophytes, including
both MTR-scoring and non-scoring species. Picture the survey area from above in two
dimensions, ie length and breadth, and then use one of the methods in Box 6 to estimate the
percentage cover.
Box 6 Methods of estimating overall percentage cover
Option 1
Imagine moving all the macrophytes to the one end of the survey length. The area covered
will correspond to the overall percentage cover, for example in a 100m survey length an
area of macrophytes completely covering a section which is 25m long ´ channel width will
have 25% cover. If 500m was used then 25m ´ channel width would correspond to only
5% cover.
Option 2
If the majority of the vegetation is confined to strips along the margins of the river, the
overall percentage cover may be estimated in the following manner:
marginal area covered, m2= length of marginal ´ width of
vegetation cover marginal vegetation
If possible, confer with survey colleagues to confirm identification. Preserve representative
samples of ‘difficult’ specimens and place in a herbarium for future reference if necessary.
Annotate the field sheet to indicate those taxa for which specimens have been placed in the
herbarium.
Page 59

R&D Technical Report E38 45
total area covered, m2= marginal area + other areas
Total percentage cover = [(total area covered)/(total area of survey length)] ´ 100
Page 60

R&D Technical Report E38 46
Individua l species percenta ge cover estimates
For all percentage cover estimates of scoring and non-scoring species, the whole survey area
surveyed equals 100%, ie the individual species percentage cover estimates are a percentage of
the whole survey area and NOT of the overall percentage cover estimated.
Estimate the percentage cover of each macrophyte species, then, depending on the percentage
cover scale chosen, allocate each macrophyte a Species Cover Value. Use the C scale for surveys
of 100m length and the A scale for surveys of 500m length.
The alternative Species Covers Value class scales are:-
Scale A Scale C
(for 500m survey) (for 100m survey length)
A1 <0.1% C1 <0.1%
A2 0.1–1% C2 0.1–1%
A3 1–5% C3 1–2.5%
C4 2.5–5%
A4 5–10% C5 5–10%
A5 >10% C6 10–25%
C7 25–50%
C8 50–75%
C9 >75%
In the rare event that a percentage cover is estimated as being precisely on the border between
two categories and a judgement cannot be made than a value for the upper category should be
recorded, thus for example if exactly 1% then C3 is recorded.
When all species have been allocated a Species Cover Value add up the percentages, in the field,
to check that they correspond to the overall percentage cover estimated for that survey length
(however, see Quality Assurance note).
When assigning percentage cover to macrophyte species it is strongly recommended that a
systematic approach is adopted to make the process easier and more accurate. Use one of the
methods described in Boxes 7 and 8. As a double-check when estimating small areas of cover,
it may be useful to work out beforehand the area of pieces of survey equipment, and use these for
reference: for example, an A4 recording sheet (0.06 m2) or the base of a glass-bottom bucket.
Survey areas choked with vegetation
At sites where macrophytes are very abundant the site may become choked with vegetation. For
surveys at these sites it is difficult to estimate percentage cover for individual species. The birdseye view method of recording cover should be taken. It may be necessary to use a grapnel and
underwater TV camera/glass-bottom bucket to search for submerged species which may be
surviving under other macrophytes. Record any species found from such searches and estimate
their abundance based on observations using the underwater camera or glass-bottom bucket.
Grapnel hauls should NOT be used as a means of estimating abundance (4.5.3) .
Page 61

R&D Technical Report E38 47
Box 7 Estimating per centage cover of individual species: width method
1. Stand on one bank facing across the river channel to the opposite bank. Imagine a
rectangle made between the banks and channel width, as illustrated below:
2. The whole survey length multiplied by the channel width equals 100%. Work out
how long the bank length needs to be to illustrate an actual area of channel
corresponding to a particular percentage cover. Visualise dividing up the bank length
so that rectangles of area represent the range of percentage covers described by the
SCV classes, and use this to allocate the appropriate SCV for each species.
3. Using Scale C for the survey length a macrophyte must cover the following bank
length ´ channel width areas:
Scale point
(SCV)
Percentage
cover
Corresponding
length on bank for
100m survey length
Corresponding
length on bank for
500m survey length
C1
C2
C3
C4
C5
C6
C7
C8
C9
< 0.1
0.1 - 1
1 - 2.5
2.5 - 5
5 - 10
10 - 25
25 - 50
50 - 75
> 75
< 0.1
0.1 - 1
1 - 2.5
2.5 - 5
5 - 10
10 - 25
25 - 50
50 - 75
> 75
< 0.5
0.5 - 5
5 - 12.5
12.5 - 25
25 - 50
50 - 125
125 - 250
250 - 375
> 375
This method has the advantage that the lengths on the bank are constant for a particular
survey length and cover scale used, regardless of channel width. The bank lengths MUST,
however, be calculated for each combination of survey length and cover scale used. If the
width varies considerable along the survey length, take this into account.
Example
For a 100m survey length using Scale C, a macrophyte covering an equivalent area of 6m ´
Page 62

R&D Technical Report E38 48
channel-width will be allocated an SCV of C5.
Box 8 Estimating per centage cover of individual species: square metre method
1. Estimate the approximate average width of the channel.
2. Calculate the equivalent square metre areas that need to be covered in order for a
macrophyte to be awarded a particular SCV.
For 100m surveys using Scale C, refer to Table A2 in Appendix 5, highlight the most
appropriate width column and use this as a guide.
3. Estimate the number of square metres covered by each species within the survey
length and allocate the appropriate SCV.
Example
For a 100m survey length, channel width 5m, using Scale C, a macrophyte must cover the
following areas:
Scale point
(SCV)
Percentage
cover
Equivalent area
(m2)
C1
C2
C3
C4
C5
C6
C7
C8
C9
< 0.1
0.1 - 1
1 - 2.5
2.5 - 5
5 - 10
10 - 25
25 - 50
50 - 75
> 75
< 0.5
0.5 - 5
5 - 12.5
12.5 - 25
25 - 50
50 - 125
125 - 250
250 - 375
> 375
A macrophyte covering 6m2 would be recorded as C3.
NB These figures need to be recalculated for ANY DIFFERENCE in survey length,
channel width or abundance scale.
Page 63

R&D Technical Report E38 49
4.5.6 Biomass of macroph yte taxa
It is recommended that quantitative or semi-quantitative assessment of biomass is NOT
included in routine (eg UWWTD) MTR monitoring. If a situation arises, however, whereby
a particular species has the same Species Cover Value at two sites being compared, but its
biomass is obviously greater at one because the depth of the stand is greater, then a comment
should be made in the ‘Comments’ section and suitable photographs taken if possible.
4.5.7 Assigning a measure of confidence in the sur vey
Having completed the recording of macrophytes the surveyors should assess, on a scale of
A to C, how accurately they feel the results reflect the prevailing situation at the site. This is
an assessment of the typicality of the results given the constraints of water chemistry,
weather, together with impacts such as the effects of weed cutting or site management. For
example, the survey may have been hampered and perhaps rendered meaningless by:
· temporal perturbations such as recent river manag ement (dredging, weed cutting,
herbicide application, disturbance due to flood defence works such as bank
reinforcements) or extreme flooding events, which may have influenced the
macrophytes;
and/or
· survey conditions which reduce the accuracy of the survey, eg poor survey conditions
(turbidity, high discharge due to recent rain or very wet or windy conditions) or
Quality assura nce
Check the overall percentage cover estimate by estimating the percentage of bare substrate
and adding this to the overall percentage macrophyte cover: the total should be 100%.
Check the SCV estimates of individual species, by adding up the individual percentage cover
estimates to make certain that they at least equal the overall percentage cover estimate. If they
differ check the estimations to discover where the under- or over-estimation has occurred.
This MUST only be done at the survey site: NEVER re-evaluate estimates after departing
from a site.
NB It is possible for the sum of the individual percentages to be legitimately greater than
the overall percentage cover where macrophytes overlie each other. Indeed, it is possible to
have more than 100% cover of macrophytes in terms of SCVs, where the channel is choked
with vegetation (see above). It is recommended that all taxa (scoring and non-scoring) are
recorded and their cover assessed; this will allow an assessment of the total percentage cover
of species, to compare with the overall percentage cover.
Difference in percentage cover values is the most common source of difference between
primary and audit surveys of the same survey length. It is very important that training is given
in the estimation of percentage cover values and that all surveyors are familiarised with the
training on an annual basis. Do not guess the percentage cover: make reasoned estimates
consistent with observation.
Page 64

R&D Technical Report E38 50
excessive blanketing algae or floating vegetation growth obscuring the view or
smothering other vegetation.
Note that confidence in the results of a survey may be restricted by either one or both of the
above factors.
Surveyors should score on a scale of A to C the deg ree to which the above may have distorted
their findings:
· A - data not affected or any effect limited to less than 25% of the site
· B -
the accuracy of records in 25–50% of the site influenced to a considerable
degree
· C -
the accuracy of records in >50% of the site influenced to a considerable degree
This should be recorded on the record sheet (see Appendix 5). The factors which potentially
distorted the accuracy of the survey should be identified in the ‘Comments’ section.
The importance of objective interpretation cannot be over-emphasised here. Decisions are
based on an individua l’s interpretation of what are typica l conditions, to what extent those
conditions have been deviated from and whether this has had an effect.
It is strongly recommended that surveys with a suffix of confidence of ‘C’ should not be used for
interpretation of trophic status, ie there is sufficient cause for concern tha t the MTR results do
not represent the prevailing trophic status at the site.
Page 65

R&D Technical Report E38 51
4.6 Assessing and recording physical variables
4.6.1 General method
After recording the macrophyte information re-traverse the survey length, observing and entering
details of the physical variables on the form provided in Appendix 5. The grapnel, bank
stick/ranging pole and/or underwater camera/glass-bottom bucket can be used to give an
indication of the substrate type at sites where the channel bed cannot be directly observed. Mark
the grapnel rope with 0.5m divisions and use it to determine the depth of the water, or use the
bank stick/ranging pole. It should be obvious, from grapnel throws to retrieve macrophytes, if a
change in depth has occurred within the channel.
The assessment of physical variables is NOT expected to be as precise as the macrophyte
assessments, but merely an important element which should be used to help in:
i) assessment of how comparable sites are;
ii)
providing information which in the future may help in more rigorously assessing the
relationship between macrophytes and physical variables.
Orientation of the left and right banks is determined by the direction of flow. When facing
downstream, the left bank is on your left hand side and the right bank on your right hand side.
In order to ensure that data are consistent, all variables should be recorded in a manner so that
they relate to estimates in previous years. This may mean that the following categories/classes are
recorded for some physical characteristics: 1 = <5%; 2 = 5–25%; 3 = >25% as well as actual
percentages (actual percentages MUST be recorded). It is preferable to record percentages to the
nearest integer value (ie no decimal places). If a particular feature is absent, then record this as
0% (category 0): do not leave data entry spaces/boxes un-filled.
Recording of features which are present in less than 0.5% of the survey area will not usually be
required unless that particular habitat type contains the only occurrence of a scoring species.
Such recording may also be required if TDI/DQI surveys are being carried out at the same
site and the particular type of habitat is cobbles or boulders in amongst gravel or sand and
that is the only suitable substrate for sampling diatoms. In either case, a note should be
made under ‘Comments’ on the field sheet and care should be taken to mark the position
of such small habitat patches on the accompanying sketch map.
Quality assurance
Check, before leaving the site, that all data entry spaces/boxes have been completed as
required.
Page 66

R&D Technical Report E38 52
4.6.2 Width
The width is the channel width for which macrophyte species have been recorded, as defined
in section 4.4.2, including any area of substratum above the actual water level that has been
surveyed.
The first time a survey length is surveyed the width of the channel should be measured using
a tape measure/rope with 0.5m divisions or an optical range finder (Appendix 4). If the
width varies noticeably
along the survey length then several width measurements should be
made.
Record varying widths by entering the actual percentage in the appropriate boxes on the standard
sheet. More than one category may be recorded. For repeat surveys it should be sufficient to
estimate the width by one of the methods described below.
i) Use of a calibrated optical range-finder.
ii) If the survey length is easily/safely wadeable or a convenient bridge is present at a deep
water survey length, pace out the width.
iii) If (i) or (ii) are not practical, determine channel width using the following method. Place
a reference point on the ground, estimate by eye the distance across the channel then pace
a greater distance than the estimate of channel width from the reference point along the
riverbank. Turn and face the reference point, compare the distance to the reference point
with the channel width and decrease the distance to the reference point until it matches
the channel width.
4.6.3 Depth
Quality assurance
Optical range finders are designed to measure certain ranges so check that the one used
is suitable for the width being estima ted. Check the calibration regularly.
If the width estimates vary greatly from the original width measurements it is necessary
to use a measuring device to check the data recorded for present and future surveys.
If a bridge is used to pace out channel width make sure that the channel under the bridge
is the same width as the channel in the length surveyed.
Pace-to-metre ratios should be calculated as under section 4.4.1 and regularly checked.
Ratios when wading in water should be calculated separately from ratios determined on
the bank, but pacing in water should be avoided if at all possible. All ratios are personspecific (non-transferable!).
Page 67

R&D Technical Report E38 53
Record the depth by entering actual percentages in the appropriate boxes on the standard sheet
(and categories if required for comparison with historical data). Measure the depth at various
points along the survey length — the number and exact location of the measurement points
should depend on the variability of depths encountered when surveying for macrophytes.
Measure the depth to the nearest centimetre by using a marked bank stick, ranging pole, metre
rule or a grapnel with depth divisions marked on the rope. When recording depth, face the
narrow edge of the measuring equipment into the current. In deeper water a grapnel rope with
depth divisions at 0.1m intervals should be used to measure depth by lowering it vertically.
When marking the grapnel rope the height of the grapnel must be included: for example, if the
grapnel is 0.2m tall then the first mark on the grapnel rope should be 0.3m above that,
representing a total depth of 0.5m.
4.6.4 Substrata
Estimates should be based on a birds-eye view and should only include particles which are visible
and the equivalent superficial layer under macrophytes. If shapes of underlying larger particles
are distinct under a layer of fine particles such as silt or clay then the larger particles should be
recorded. When the shapes of underlying particles are not distinct then the fine particles should
be recorded. If the surveyor feels this is not sufficient then extra information can be recorded in
the ‘Comments’ section.
The combination of substrata is recorded by placing the actual percentage cover in the
appropriate box. As many substrata as are present should be recorded, although see 4.6.1
regarding features present at less than 1% cover. The percentage of each substrata category
should be rounded to the nearest percentage point. No decimal points should be calculated. This
ensures satisfactory consideration of experimental and observational error in recording.
Percentage classes/categories may be recorded in addition to actual percentage values, if required
for comparison with historical data.
The substrata classes are:
Bedrock - exposure of underlying rock not covered by alluvial deposits
Boulders/Cobbles - > 64mm (half-fist size or larger)
Pebbles/Gravel - > 2–64 mm (half fist to coffee granule size)
Sand - > 0.0625–2mm (smaller than coffee granules and unlike silt/clay,
abrasive to the hands)
Silt/Clay - < 0.0625mm (have a soft texture)
Quality assura nce
Ensure that depth markings on bank stick, ranging pole, metre rule or grapnel rope are clear
and accurate before commencing the survey day.
Page 68

R&D Technical Report E38 54
Peat - dead vegetation undergoing bacterial decay in stagnant deoxygenated
water – strictly pure peat, not fine peaty deposits over more
substantial substrate.
The actual measurements given relate to the longest axis of each particle. Any rock with one or
more sides greater than 256mm long is classed as a boulder.
The particle size categories follow an adapted Udden-Wentworth system. When irregular shaped
particles are observed the longest axis length determines category assignment.
4.6.5 Habitats
Allocate a percentage to the appropriate habitat types. Percentage categories may be recorded in
addition if required for comparison with historical data. The habitat types are POOL, RUN,
RIFFLE and SLACK, as defined below. Note that although these definitions are similar to those
used for many other biological surveys, they are NOT the definitions used for the River Habitat
Survey methodology (Environment Agency 1997).
Pool -
Either a discrete area of slow flowing water, usually relatively deeper than
surrounding water, or between faster flowing stretches, as in a sequence of
riffle-pool- riffle. Pools are deep and often turbulent, and scoured during
spate flows.
Riffle - Fast flowing, shallow water whose surface is distinctly disturbed. This does
not include water whose surface is disturbed by macrophyte growth only.
Run - Fa st or moderate flowing, often deeper water whose surface is rarely broken
or disturbed except for occasional swirls and eddies.
Slack - Deep, slow flowing water, uniform in character.
Quality assura nce
Take a copy of the reference sheet provided in Appendix 5 to each site.
Check that the total of classes estimated is possible. Total up the substrata percentage cover
which should equal 100%. Check that changes in substrate composition have not occurred
due to management or flooding events.
Quality assurance
Page 69

R&D Technical Report E38 55
4.6.6 Shading
This is the percentage of the channel area affected by shading, NOT the percentag e of the
bank on which vegetation causing shade stands. The shading for each bank is recorded
separately.
For the left bank, estimate the percentage of the whole channel area surveyed that is shaded
by vegetation/structures from the left bank when the sun is directly overhead (ie at 12 noon).
In a similar manner, estimate the percentage of the whole channel shaded from the right bank.
If the total shading of the channel is needed then the two figures can be added together
(theoretically this can be more than 100%). Refer to Figure 2.
When estimating the amount of shading, refer also the sketch map (4.6.9).
Three shade categories are defined: none, broken and dense.
None - no shading
Broken - some direct sunlight hits the water surface in the shade-affected area when the
sun is directly overhead.
Dense - 5% or less of the shade-affected area receives direct sunlight when the sun is
directly overhead.
Record the actual percentage in the relevant shade box. Percentage categories may be recorded
in addition if required for comparison with historical data.
LHB
0 m 20 m 40 m 60 m 80 m 100 m Bank
À¤¤¤¤¤¤¤¤¤¤ДДДДДДДДДБДД¤¤¤¤¤¤¤¤¤ДДДДДДБДДДДЫЫДДДЩ
¤¤¤¤¤¤¤¤¤¤ ¤¤
River Ø
flow
ЪДДДДДДДДДВДДДДДДДДДВ¤¤¤¤¤¤¤¤¤¤¤¤¤¤¤¤¤¤ДДДДДДДДД¿
0 m 20 m 40 m 60 m 80 m 100 m Bank
RHB
¤¤¤¤ broken ÛÛÛÛ dense
Figure 2 Illustration of shading
(Only shading affecting the channel is counted, therefore in Figure 2, where shading blocks
cross the channel definition line they are counted as a half block)
The channel illustrated in Figure 2 would be recorded as:-
Shading Left bank None 91 Broken 8 Dense 1
Right bank None 97 Broken 3 Dense 0
Surveyors should regularly familiarise themselves with habitat variable definitions by
consultation with other surveyors and by measurement of selected substrate types.
Page 70

R&D Technical Report E38 56
Quality assura nce
Carefully follow the method for estimating shade described and refer to the sketch map. If you
are not sure about actual measurements, record the shading of the channel on the sketch map
very carefully and on return to the office check with a colleague.
Page 71

R&D Technical Report E38 57
4.6.7 Water clarity
Record the actual percentage of the channel in each water clarity category. More than one
category may be present as a survey length may be clear in the shallow margins and progress
through cloudy to turbid as the water depth increases. Percentage categories may be
recorded in addition, if required for comparison with historical data.
Clear -
Channel substrate is clearly visible at all depths, as are macrophyte
species.
Cloudy -
Slightly discoloured with a moderate load of suspended solids and partially
reduced light penetration. All clumps of macrophyte species can be
located on the substrate of the river channel but the view of them is
partially distorted. A small piece/single shoot of a macrophyte species
may be missed.
Turbid - Strongly discoloured, carrying a heavy load of suspended solids and having
greatly restricted light penetration. The channel bed is obscured and
submerged macrophyte species are indistinguishable from substrate and
water. This will lead to a reduction in accuracy and efficiency of the method.
4.6.8 Bed stability
The following 4 classes are used to define bed stability:
Solid/firmly bedded - eg bedrock/compacted clay, increased flow has little effect
Stable - eg boulders/pebbles/gravel, unlikely to be significantly altered by
increased flows
Unstable - eg gravel/sand/silt/mud, likely to be dislodged by increased flows
Soft/sinking - eg deep silt/mud, makes channel unwadeable, bank stick penetrates
easily into substrate.
Record the actual percentage of the channel in each of the above bed stability categories.
Percentage classes/categories may be recorded in addition, if required for comparison with
historical data.
4.6.9 Sketch map
The purpose of the sketch map is to enable future relocation of the survey length and is not a
record of individual surveys. It is not necessary to make detailed plans of each survey.
Quality assura nce
Consider the clarity throughout the length while surveying and assign percentages
accordingly. It is likely that the same category will apply throughout a 100m survey length.
Page 72

R&D Technical Report E38 58
Fill in required details on standard sketch-map record sheet (Appendix 5), eg river name, site
name, date etc.
Draw a sketch of the survey length, showing only in the broadest terms the general physical
character of the site. This should include important vegetation stands and permanent reference
features (such as a distance from a bridge or footpath sign) which would enable anyone else to
find the survey length with great precision in the future. In addition, mark on any unusual
features such as ‘islands’ of substrate supporting vegetation. In deep water, depth can be easily
measured using a grapnel.
The distance markings on the standard sketch sheet do not indicate which direction the
macrophyte survey should be undertaken. If starting at the upstream end of the survey length and
moving in a downstream direction, the left side of the paper will correspond to the left bank and
the direction of flow will be from the bottom to the top of the paper. If starting from the
downstream end and moving in a upstream direction (this may be preferable for safety reasons
- follow health and safety guidance), then turn the map upside down. It may be helpful to draw
in ‘landmark’ features before starting the sketch map, or to mark on the bank the mid-point of the
survey length, for reference.
Main features to mark on sketch map:
Location of river and its pathway
NGR for the start and end of the survey length
Width of channel - the width included in the survey
Relocation features - for both ends of the survey length if possible
Shading position and type - broken or dense
Grid north (found from OS map)
Dominant macrophyte stands
Extent of riverbanks - riverbank (for the sketch map) is defined as the area before an
adjacent land use starts
Adjacent land use - for example arable, pasture, factory, waste, set aside,
houses/gardens
Depth of water - in m across the channel width
Broken shade should be indicated by:
Dense shade should be indicated by: · · · · · · · · · · · · · · · · · ·
Macrophyte stands should be indicated by:
Label clearly.
Appendix 6 gives examples of sketch maps which are more than adequate.
Page 73

R&D Technical Report E38 59
4.6.10 Photograph
A colour photograph should be taken of the survey length to visually record its general character
and should include a feature (eg ranging pole) for scale. The use of a polarising filter to reduce
surface reflection and a date facility on the camera are recommended.
Write the date and an identifying code or site name and river name on a small blackboard or
wipe-clean board and place this, unobtrusively, in the photograph. Depending on the direction
of the sun stand at one end of the survey length and take a photograph along the length of the
river to gain a representative impression. Record the identifying code on the record sheet.
Additional photographs may also be taken to illustrate a change in vegetation between sites.
When photographing channel vegetation, it is useful to include a reference object to indicate
scale.
Quality assura nce
Pace out 10m lengths and check that the relevant features are marked on the sketch map in
the correct location. Check that the orientation is correct.
It may be necessary to redraw the sketch map on return to the office to ensure labels etc are
legible. Do not use personal shorthand in the final map as others will not be able to correctly
translate this.
File all sketch maps with their corresponding field records. It is recommended that a short
description of each survey length location is appended to a map (preferably 1:10 000)
showing the location of the survey lengths. It is useful if this includes notes on access.
When using sketch maps to relocate survey lengths take photocopies into the field and leave
the original in the file.
Quality assura nce
Note any distinguishing features of the photograph (it is NOT sufficient to rely on these type
of features alone - use the suggested labelling method). Label films and have each film
developed as soon as it is finished. On return of developed film, refer to the relevant survey
sheets and label each photograph with river, site name, date and surveyors’ initials. Catalogue
all photographs: file in groups under (for example) river name or catchment name, in an
album or index type box file so they can be easily retrieved.
If using a box file, place each photograph in an envelope which has previously had the river
and site name, date and surveyors’ initial marked on it. Include the unique database site
reference number on the envelope.
Make sure it is simple to cross reference with survey sheets and any computer based data.
Page 74

R&D Technical Report E38 60
4.6.11 Comments
In this section report any unusual features of the survey length, eg excessive growth of a
particular macrophyte or a lack of macrophytes with no obvious cause. Record any problems
encountered while surveying. Note distinguishing features of the survey length so that it can be
relocated on subsequent occasions.
4.6.12 Assigning a measur e of confidence in the compa rability of survey length s
When undertaking surveys to assess downstream changes in trophic status, it is necessary to
assess how physically comparable are the sites being compared. Having undertaken both the
sketch map and the physical inventory, identify on a scale of 1 to 3 how comparable the sites are
and record this on the standard record sheet (Appendix 5). This assessment should be recorded
at the time of survey or shortly afterwards.
The factors under consideration for comparison are Width, Depth, Substrata, Habitats, Shading,
Water Clarity and Bed Stability.
· If 5 or more of these characteristics are similar for more than 75% of the site for each pair
of survey lengths then assign category I.
· If 3 or 4 of these characteristics are similar for more than 75% of the site for each pair of
survey lengths then assign category II.
· If 2 or less of these characteristics are similar for more than 75% of the site for each pair
of survey lengths then assign category III.
It is strongly recommended that surveys with a suffix of confidence of III should not be used for
interpretation of trophic status — ie there is sufficient cause for concern that any differences in
MTR between sites may be due to factors other than nutrient enrichment.
4.7 Laboratory Analysis
4.7.1 Equipment
Binocular microscope, microscope slides
Hand lens ´ 10
White tray, forceps, dissecting needle
Identification keys
Plant press
Mounting paper and glue
Refrigerator
4.7.2 Reference collection (herbarium )
A reference collection of dried/pressed macrophyte specimens should be compiled and added to
as new species are found in the area. Fruiting and flowering parts should be included. Verify
Page 75

R&D Technical Report E38 61
identification of the fresh specimen with other experienced members of staff. Once pressed, label
each specimen and list its key identification features. Do not include rare species in the
collection but use photographs and annotated field drawings instead. The reference collection
would be best kept in a cabinet with many shallow draws to avoid crushing of the dried
specimens. As dried specimens are fairly brittle care should be taken when handling them.
Slides of macrophytes can also be useful as part of a reference collection. Index the reference
collection using an index card box file. Group the cards, but have a separate card for each
species, detailing identification features and information available.
A collection of ‘difficult’ specimens, to which reference may need to be made for quality
assurance purposes, should be compiled either as an integral part of the reference collection or
as a supplementary collection in its own right.
4.7.3 Preservation of macr ophytes
Refer to Bridson and Forman (1992) and Moore (1986) for full details of equipment and
methods.
The majority of macrophytes are suitable for pressing. The identified macrophyte specimen
should be floated in a shallow tray containing water. A piece of smooth, shiny, drying paper or
good quality cartridge paper should be placed under the macrophyte and then lifted from the tray.
Fine adjustments of the macrophyte position are then made, so that all attributes can be seen.
A pipette and brush may facilitate such adjustments. A second piece of labelled (use a
waterproof marker/pencil) drying paper is placed on top of the macrophyte. Layers of
newspaper/other absorbent paper are placed either side of the macrophyte and paper sandwich,
and the whole thing is placed in a flower press, which is then shut. Use a corrugate between
layers if available to add air circulation and hence aid drying — keep the press size small if no
corrugates are available. Pressure should be evenly applied. The press should be stored in a dry
atmosphere. The absorbent paper should initially be changed after 24 hours and then after a
further 48 hours. Regularly change the absorbent paper until the macrophyte specimen is
completely dry.
Charophytes can be kept by preserving them in 4% formalin or by drying (Moore 1986, pp. 26–
28). For mucilaginous species, the drying sheet should be covered with a piece of waxed paper
or polythene so the specimen does not stick to the drying paper in the plant press.
4.7.4 Storage and identification
Macrophyte specimens collected in the field will persist in good condition for several days if
placed in plastic bags or lidded tubes without additional water. Blowing into the bag before it
is sealed prevents crushing and may help to preserve samples. The sealed bag/tube stops the
specimen drying out; adding no extra water means the specimen does not turn into an
unidentifiable soggy mass. On return to the laboratory store the samples in a refrigerator.
The exception to this is filamentous algae. A sample should be placed with a small amount of
water into a labelled tube, ensuring that there is a large air space above the water. As above, the
tube should be stored in a refrigerator on return to the laboratory. A few drops of ethanol may
Page 76

R&D Technical Report E38 62
extend the period for identification but may extract the chlorophyll (formalin should not be used).
Alternatively, Lugol’s iodine may be used to preserve the sample (Jones 1979).
Identify specimens one at a time as it is extremely important that the correct macrophyte is
recorded under the correct survey and abundance class.
In a filamentous algae sample the dominant species should be recorded. For example, a
filamentous algae mass consisting mainly of Cladophora will also contain small amounts of other
species, but only the Cladophora needs to be recorded.
Page 77

R&D Technical Report E38 63
START HERE
Ñ
Preliminary selection of
survey area
Look for similar physical
variables.
Think about relocation features.
For UWWTD:
observe site u/s to d/s
for change in flora
Fill out site and survey length
details on standard sheet
Measure out survey length and
mark
Survey length, identify and
record macrophytes
on standard sheet
Sample unidentified
macrophytes
Confirm identification
in the laboratory
Estimate overall percentage
cover and record
on standard sheet
Estimate Species Cover Value
(abundance) and record
on standard sheet
Total up to ensure agrees with
overall percentage cover
estimation; assign measure of
confidence for survey
Estimation
difficulties: re-observe
survey length
Observe, estimate and record
physical variables; assign
measure of confidence for
comparability; record on
standard sheet.
If measure of confidence is ‘c’
DO NOT proceed, return to
start
Measure width,
check estimates
Draw sketch map
Use standard sheet.
Include relocation features.
Annotate.
Take photograph
Board with identification
details
Figure 3 Summar y Macrophyte Survey Flow Chart
Page 78

R&D Technical Report E38 64
5 MTR DATA ANALYSIS
This Chapter describes how to use the macrophyte data collected to calculate a Mean Trophic
Rank score for the survey and how to express the confidence in that score. It also provides
guidance on data storage.
5.1 Calculating Mean Trophic Ranks
Selected, usually common, aquatic macrophytes have been assigned a number from 1 to 10
according to their tolerance/preference for enriched or un-enriched waters; this is the Species
Trophic Rank (STR). The STR for each selected species can be found on the standard record
sheet and the species checklist in Appendix 5.
Mean Trophic Ranks (MTR) are to be calculated for 100m survey lengths only. All scoring
species should be included in the calculation of the MTR, but
non-scoring species should be
excluded. MTR scores are calculated as follows:
1. For all scoring species recorded, multiply the Species Trophic Rank (STR) by the Species
Cover Value (SCV) to give a Cover Value Score (CVS) for each scoring species.
Example: Scoring species STR SCV CVS
Enteromorpha sp(p) 1 ´ 1 = 1
Cladophora agg. 1 ´ 1 = 1
Nuphar lutea 3 ´ 1 = 3
Lemna minor 4 ´ 7 = 28
Potamogeton pectinatus 1 ´ 1 = 1
Mentha aqua tica - ´ (2) = -
Zannichellia palustris 2 ´ 1 = 2
Amblystegium ripar ium 1 ´ 1 = 1
Ranunculus fluitans 7 ´ 7 = 49
TOTAL 20 86
2. Add up all the numbers in the CVS column.
3.
Add up the numbers in the SCV column associated with scoring species only. Do not
include non-scoring species in this calculation.
4. Divide the total score for the CVS by the total for the SCV and multiply by 10 to give the
Mean Trophic Rank (MTR): MTR = (sum of CVS ¸ sum of SCV) ´ 10
In the above example: MTR = (86 ¸ 20) ´ 10 = 43.0
5. Present MTR to ONE decimal place only.
Page 79

R&D Technical Report E38 65
NB Where no scor ing species are present in the survey length, there is no MTR score for the
survey. An MTR value of zero may be recorded for da ta ar chiving purposes but this value must
not be used to indicate trophic status.
Page 80

R&D Technical Report E38 66
5.2 Assigning a measur e of confidence to the MTR
A selected number of scoring taxa on the species checklist (Appendix 5) are highlighted in bold
type (and prefixed with a ‘
Ø’ symbol). The number of these ‘highlighted’ or ‘bold’ species
present in a survey length is used to assign a measure of confidence in the MTR score
(Environment Agency 1996a, Holmes 1996).
To determine the confidence with which the MTR score can be considered, assign one of the
following suffixes:
· a - > 8 highlighted (bold) taxa are present
· b - 5–8 highlighted (bold) taxa are present
· c - < 5 highlighted (bold) taxa are present.
Record this in the space provided on the species checklist (Appendix 5).
The rationale behind this suffix of confidence is that (i) these ‘highlighted’ species are
particularly reliable indicators of trophic status and (ii) the greater the number of reliable
indicator species present, the greater the reliability of the resulting MTR. Although evaluation
of the MTR methodology has found no conclusive evidence to support the first premise, there is
evidence that the MTR score may be more reliable when more highlighted species are present
(Dawson at al 1999b). It is therefore recommended that the use of this suffix of confidence be
continued as an interim measure. Achievement of a suffix of ‘a’ or ‘b’ will certainly lend
confidence in the results; but achievement of a ‘c’ suffix may not necessarily mean that the result
is inaccurate. In all cases, emphasis should be placed on obtaining information from as many
sources as possible and on drawing conclusions using the balance of evidence.
Page 81

R&D Technical Report E38 67
5.3 Assessment of confidence in the data
The MTR score is suffixed by the three measures of confidence assigned based on site
comparability (I, II, III: see 4.6.12), survey conditions/typicality (A, B, C: see 4.5.7) and the
number of highlighted taxa (a, b, c: see 5.2), to enable an immediate interpretation of likely
confidence in the data.
For example: U/S MTR = 43.0 (I, B, b)
D/S MTR = 14.7 (I, A, b)
Thus, it is clear that both sites are physically comparable; that site survey accuracy at the
upstream site was affected to a moderate degree by some management, adverse turbidity or the
like, but not at the downstream site; and that 5–8 highlighted taxa were recorded.
It is strongly recommended that surveys with a suffix of confidence of ‘III’ and/or ‘C’ should not
be used for interpretation of trophic status, as there is sufficient cause for concern that either the
MTR does not represent the prevailing trophic status at the site and/or any differences in MTR
between sites may be due to factors other than a difference in trophic status. In such cases, effort
should be made to look for and survey an alternative site or pair of sites. To minimise this
circumstance, care should be taken both in the initial selection of the survey lengths, to avoid
selection of unsuitable lengths (see Box 2), but also upon arrival at site for established survey
lengths, to confirm that MTR is an appropriate method to use (see Box 3).
Page 82

R&D Technical Report E38 68
5.4 Data storage
Data should be stored on a standard computer database. All data should be handled in a standard
meticulous manner. Remember your entry may be checked at random by someone else at any
time. Accuracy of data entry is of prime importance. It is recommended that the initials of the
data-archiver and the date of archive are entered onto the field sheet, to provide an ‘audit trail’
for quality assurance purposes.
Quality assura nce
Enter macrophyte data regularly — mistakes are less likely to be made if there is not too much
data to be entered at once so the operator does not become desensitised to the process.
Check each data entry is correct before starting the next entry.
Establish a system of filing and keep to it, so if a discrepancy is discovered at a later time it
can be easily checked (for example, file the original survey sheets in site order u/s to d/s for
each river). Retaining field sheets after archiving on the database also allows the hard copy to
be presented as evidence if required in the future.
Page 83

R&D Technical Report E38 69
6 INTERPRETATION OF MTR RESULTS
This chapter provides guidance on presenting and interpreting results from MTR surveys. It
focuses mainly on interpretation for UWWTD purposes but also considers other applications.
6.1 Interpr etation for the pur poses of the UWWTD
6.1.1 General
The aim of using the MTR in the context of UWWTD monitoring should be borne in mind at all
times when interpreting MTR results and preparing these results for presentation. This aim is
to provide evidence of:
i)
eutrophication impact on macrophyte communities in order to support designation of
reaches as SA(E); and
ii) the specific impact of qualifying discharges on such reaches.
MTR assessments are only one aspect of the considerations needed to identify SA(E)s and all
other supporting data should be evaluated before final recommendations are made regarding
potential candidates. These data can include overall percentage macrophyte cover, other
biological data (such as TDI/DQI), chlorophyll data and chemical data. Account should be taken
of known management practices and impacts on the site(s).
6.1.2 Pr esentat ion of Results
Results from MTR monitoring undertaken for UWWTD purposes will comprise a number of
surveys over a period of years at each site (usually 3 or 4 surveys over 4 years) and a minimum
of two sites per QD, one upstream and one downstream. Each group of surveys carried out at the
same time, ie within a few days but at different sites, is termed a ‘set’ of surveys, for the purposes
of this guidance.
Information from MTR surveys should be presented in a concise, accurate and consistent format.
To achieve this, a standard approach to data presentation and interpretation should be adopted.
For UWWTD purposes, this approach should comprise the following elements.
1. Present results as actual MTR scores (to one decimal place), together with the percentage
downstream change in MTR downstream of a qualifying discharge. Present results for
each set of surveys; do not average results to obtain a mean for the period monitored.
Page 84

R&D Technical Report E38 70
2. Interpret each set of results in terms both of trophic status and of the significance of
impact from the QD, by use of a standard set of ‘rules’, a set of standard descriptors being
used to describe the resulting conclusions. The ‘rules’ and descriptors are given below
in Section 6.1.3.
3.
Assess the consistency of results in the same reach on different sampling occasions to
verify that any eutrophication impact observed is ongoing and consistent, and that
anomalous data are not due to anomalous weather conditions or conditions of atypical
flow. Do not, however, compare individual scores between different years.
6.1.3 Standard Approach to Interpretation of MTR Results
Underlying Principles
This approach is based upon a standard set of decisions with the following underlying principles:
i) Sites with MTR scores of more than 65 are unlikely to be eutrophic. However, these sites
could be at risk of becoming eutrophic and the MTR should be compared with that
expected in an un-impacted, physically similar reach.
ii)
Sites with MTR scores of le
ss than 25 are badly damaged by either eutrophication,
organic pollution, toxicity or are physically damaged.
iii) Sites with MTR scores between 25 and 65 are likely to be either eutrophic or at risk of
becoming eutrophic. However, as the MTR may be limited purely by the physical nature
of the site, the MTR should be compared with that expected in an un-impacted, physically
similar reach. This is probably most relevant to those sites with MTRs between 45 and
65 (see Table 1); below an MTR of 45, it is likely that the site is impacted by
eutrophication. Sites with a high number of species which are unimpacted may often
have MTR scores in the range 45–65. This is due to the large number of species with
STRs of 4–6 which biases the MTR to 40–60. Sites which are obviously unimpacted (eg
>20 species present) should be recognised as such within this category.
iv) A downstream change in MTR is deemed to be significant if the difference is at least 4
MTR units or 15%.
A predictive framework of the MTRs to be expected in un-impacted rivers of different physical
types, although currently in the early stages of development, is currently not yet available. To
assist operational decisions until such a framework is available, reference may be made to two
sources of information.
Firstly, broad comparisons can be made using MTR data from other local sites with similar
altitude, geology and flow characteristics but lower nutrient concentrations. The importance of
undertaking more comprehensive catchment surveys in this respect is emphasised in 2.4.3 and
such sampling strategies are to be encouraged as good practice.
Page 85

R&D Technical Report E38 71
Secondly, reference may be made either to the provisional MTR values mapped by Holmes
(1995) and/or to the top 10% of MTR values recorded for each of the River Community Types
used by English Nature (EN), Scottish Natural Heritage (SNH) and the Countryside Council for
Wales (CCW) to classify rivers for SSSI designation on the basis of their macrophyte
communities (Table 1). Both the MTRs mapped by Holmes (1995) and those summarised in
Table 1 are derived from the same set of macrophyte surveys, using data courtesy of EN, SNH
and CCW. Although they are not directly comparable with MTR values from standard MTR
surveys, being derived using a different survey methodology and (in the case of those mapped
by Holmes 1995) an earlier version of the MTR, they can give useful information to put MTR
scores into broad context. It should be emphasised, however, that they should
not
be used to
predict the expected MTR in an un-degraded system. This is for two reasons. Firstly, the River
Community Types represent characteristic assemblages of species not of physical river habitat
parameters. The ‘general description’ does, however, give an indication of the type of river in
which each assemblage typically occurs, given in terms not only of the physical characteristics
of the river (eg altitude, flow and geology) but also in some cases in terms of the trophic status.
Thus, trophic status is integral to the River Community Type classification. Secondly, although
Holmes’ MTR data set may be biased towards rivers of high conservation value with relatively
low pollution impact, it does cover a broad spectrum of trophic states. Table 1 should not,
therefore, be used as a template of the expected norm in an un-degraded system, but rather as a
‘pointer’ towards what may be un-impacted by eutrophication for a particular River Community
Type. Two examples may illustrate this. If the MTR recorded at an upland site is significantly
lower than the mean or upper 10% of MTR values shown for comparable River Community
Types in Table 1 (eg the MTR for a Type VIII site is 25, compared to the mean value of 70.6 or
the upper 10% value of 86.4 shown in Table 1), then this would indicate that the MTR is lower
than expected for an un-degraded reach of the same physical type. If, however, the MTR
recorded at a lowland site of Type IV is comparable with the mean shown for this type in Table
1 (eg the MTR for the site is 41, compared to the ‘typical’ mean value of 40.0), then this only
indicates that it is typical for Type IV communities, not that the site is un-impacted by
eutrophication nor that the MTR is un-repressed especially as the mean of the upper 10% of
values for this site is 61.0.
To be deemed significant, a downstream change must exceed that which may arise from either
natural variation in the MTR, the inherent variability in the methodology, and/or human error.
Analysis of MTR results from throughout the UK indicates that 4 MTR units or 15% is an
appropriate threshold, this being twice the mean variation in MTR during the survey season and
greater than the median difference due to variation between surveyors (Dawson et al 1999b).
Hence, a reduction in the MTR of greater than 4 units or 15% downstream of a QD means that
there is a significant detrimental impact. Reductions of less than 4 units or 15% may mean that
there has been a significant impact but that it cannot be demonstrated by the use of the MTR.
However, it is also important to consider the actual MTR scores impacted. A 15% change at the
higher end of the scale (> 65) will indicate communities likely to become eutrophic, whereas
a 15% change at the lower end (< 25) of the scale will usually represent a change from
eutrophic to hyper-eutrophic. In general, it can be assumed that a change at the higher end of
the scale represents a tendency to become eutrophic while a change at the lower end of the scale
is simply a measure of increased eutrophication.
Page 86

R&D Technical Report E38 72
Table 1 MTR scores summa rised according to river community types (DO NOT USE THIS TABLE TO PREDICT MTRs)
RIVER
COMMUNITY
TYPE
1.
GENERAL DESCRIPTION
1.
Mean
MTR
2.
Mean
of top
10%
No. of
samples
2.
I Lowland rivers with minimal gradients. Predominantly in south and east England, but may occur
wherever substrates are soft and chemistry enriched
34.0 40.8 49
II Rivers flowing in catchments dominated by clay 32.9 42.9 429
III Rivers flowing in catchments dominated by soft limestone such as Chalk and Oolite 40.2 47.3 136
IV Rivers with impoverished floras, confined to lowlands or eutrophic systems 39.5 58.2 361
V Rivers of sandstone, mudstone and hard limestone catchments in England and Wales, with similar features
to those of Type VI
47.6 65.3 559
VI Rivers predominantly in Scotland and northern England in catchments dominated by sandstone, mudstone
and hard limestone; substrates usually mixed coarse gravels, sands and silts mixed with cobbles and
boulders
46.2 59.6 258
VII Mesotrophic rivers where fine sediments occur with boulders and cobbles, so a mix of bryophytes and
higher plants is typical; often downstream from Type VIII communities
52.9 75.0 97
VIII Oligo-mesotrophic, fast-flowing, rivers, where boulders are common and bryophytes typify the plant
assemblages; intermediate, and often between, Types IX and VII
68.1 82.0 537
IX Oligotrophic rivers of mountains and moorlands where nutrient and base levels low; bedrock, boulders and
coarse substrates dominate
68.8 86.2 70
X Ultra-oligotrophic rivers in mountains, or streams flowing off acid sands; substrates similar to Type IX but
often more bedrock
83.0 95.5 327
1. Revised classification of Holmes et al (1998) from the version previously published in the SSSI selection guidelines (Nature Conservancy Council, 1989).
Page 87

R&D Technical Report E38 73
2. MTRs calculated from 1km sites, each split into consecutive 500m lengths, using a 5-point abundance scale, in England, Scotland and Wales. Data are unpublished but were
prepared initially for the purposes of Holmes (1995). Macrophyte data are courtesy of Scottish Natural Heritage, English Nature and Countryside Council for Wales.
Page 88

R&D Technical Report E38 74
Standard ‘r ules’: use of flowchart ‘decision tr ees’
The trophic status of each site and the magnitude of impact of QDs should be assessed by
following the steps below, these steps referring to the flowcharts shown in Figures 4 and 5. The
flowcharts must only be used in conjunction with the information contained within this manual
and not used in isolation.
The flow charts are devised for use where there is one site upstream of a qualifying discharge and
one site downstream. If there is more than one site upstream or downstream, then the same
overall principles and descriptors of trophic status and significance of impact apply.
The steps are as follows.
1. Determine the standard ‘descriptor’ for the trophic status of each site, using the Stage I
‘decision tree’ flowchart (Figure 4). These descriptors are in given in the shaded boxes
and are each assigned a reference number. This descriptor is intended to determine
whether a reach is a suitable case for submission as a potential candidate for SA(E)
designation.
2. a) If the final descriptor is 1 or 2 there is no significant evidence for eutrophication and
the MTR cannot be used to support the designation of a SA(E).
b)
If the final descriptor is 3–5 then the evidence can be used to support the
designation of a SA(E) and the Stage II flow chart should be used to assess the
impact of the qualifying discharge (proceed to 3 below).
c) If the final descriptor is 6 then there is little evidence from the MTR which can be
used to support the designation of a SA(E) but other evidence may prove useful in
supporting the designation.
3. For reaches including sites with standard descriptors 3–5:
For each pair of sites upstream and downstream a qualifying
discharge calculate the percentage change in MTR downstream
compared to upstream of the discharge.
NB % change = (Y - X)/X ´ 100, where X and Y are the MTR
values at the upstream and downstream sites respectively.
Downstream reductions in MTR will thus always be denoted
by a negative value.
Determine whether the discharge is having a significant
impact by using the Stage II ‘decision tree’ flow chart
(Figure 5) to determine the standard descriptor for the
significance of the impact, these descriptors again being
given in the shaded boxes with a reference number.
For each QD/potential candidate SA(E) there will be a number of
sets of results (3–4 over 3 years for most). The above steps
should be followed separately for each set of survey results
Page 89

R&D Technical Report E38 75
thereby producing a descriptor of trophic status for each survey
and a descriptor of the significance of the QD impact for each
set of surveys.
Page 90
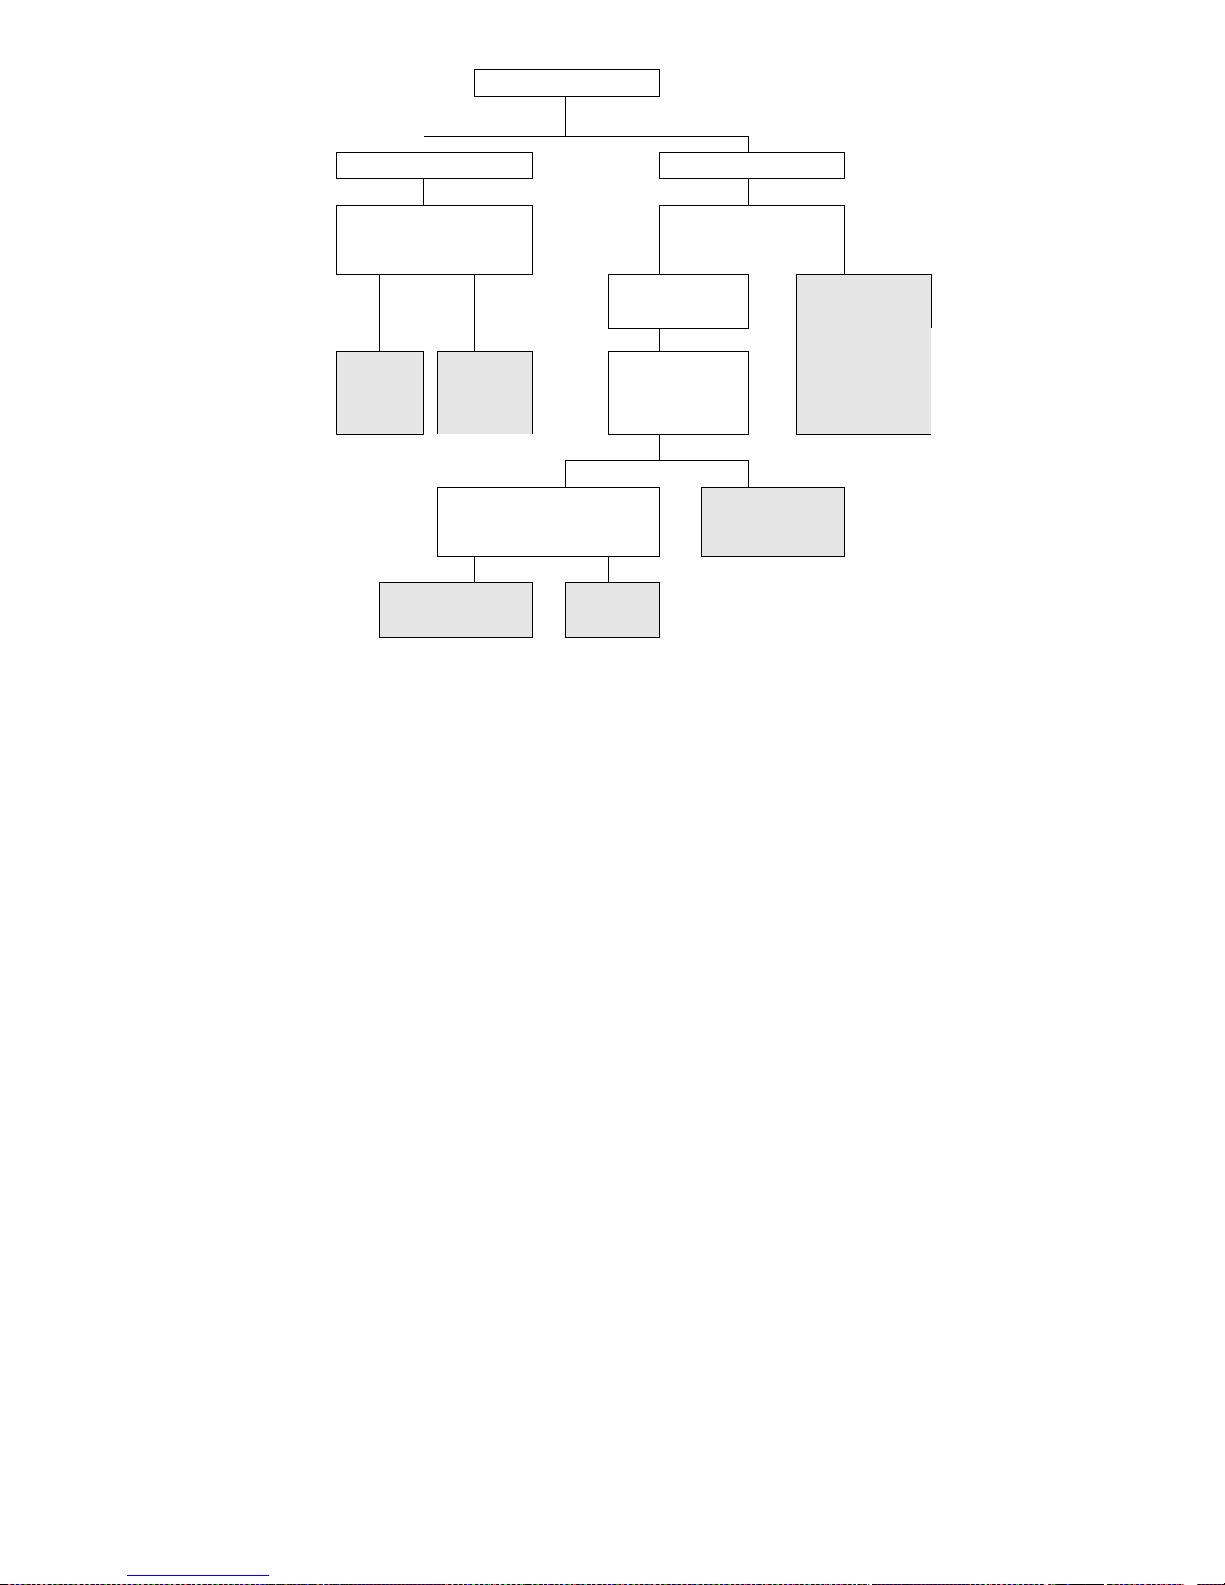
R&D Technical Report E38 76
Is the MTR > 65?
Yes No
Unlikely to be eutrophic Is the MTR < 25?
Is the score less than might be
expected for a site of this physical
type?
(refer to Table 1 or other data)
No Yes
This site is likely to be
either eutrophic or at risk
of becoming eutrophic
No Yes
This site is not
unduly
impacted by
eutrophication
(1)
This site may be
at risk of
becoming
eutrophic
(3)
Is the score less than
might be expected for a
site of this physical type?
(refer to Table 1 or other
data)
This site is badly
damaged by
eutrophication, organic
pollution, toxicity or is
physically damaged.
Use other evidence to
determine cause of
damage
(5)
No Yes
Is there any other evidence of
eutrophication?
This site is eutrophic or at
risk of becoming
eutrophic
(4)
No Yes
This site is not unduly
impacted by eutrophication
(2)
Use other
evidence
(6)
Figure 4 Interpretation of MTR results, Stage I ‘decision tree’: Is the site impacted by
eutrophication?
Page 91

R&D Technical Report E38 77
Do the sites have acceptable suffixes of confidence for
comparability?
Yes No
Is the d/s MTR ³ 4 units
less or 15% less than the
u/s MTR ?
Use other evidence
and/or collect more
data
(7)
Yes No
QD is having
a significant
impact
(8)
QD unlikely
to be having
a significant
impact
(9)
Figure 5 Interpretation of MTR r esults, Stage II ‘decision tree’: Is there a significant
downstream impact from the qualifying discharge?
Caveat
On some rivers, MTR scores are inherently low. This does not necessarily mean that the site is
eutrophic. If the baseline MTR for these rivers is low and other biological monitoring
programmes do not show that eutrophication is occurring, then a change within the rules set out
above may indicate a tendency to eutrophication. Loss of species with high STR values may
indicate that the site is not yet eutrophic but is about to become so.
Page 92

R&D Technical Report E38 78
6.2 Interpretation for other pur poses
Interpretation of the MTR for other purposes follows the same essential principles as outlined in
section 6.1. This is important as it ensures that a standard approach is taken to the assessment
of riverine habitats on a national basis.
Please also refer to Section 2.4, for an outline of the applications listed below.
6.2.1 Non-qualifying point-source discharges
Although not yet proven for this application, it can reasonably be assumed that the MTR will
perform in a similar manner to nutrient inputs from non-qualifying point-sources as it does to
inputs from QDs.
The aim is to look for change in the MTR score downstream of a potential impact. Interpretation
of data is as for the UWWTD, the main difference being that there is unlikely to be a QD in the
vicinity of the survey. The term QD is thus replaced by ‘potential source of pollution’ or PSP for
non-UWWTD purposes.
If a significant change cannot be demonstrated then it does not mean that the potential impact is
not having an effect. It may be that the change is at an early stage and may not be detectable by
the MTR system, or it may be that other physical and chemical factors are masking the impact of
increased nutrient-loading on the macrophyte community.
6.2.2 Non-point source nutr ient inputs
Interpretation of data is as for non-qualifying point-source discharges, except the PSP can be a
wide area. This application is largely untried (2.4.2, 3.2.2).
6.2.3 Catchment studies
This refers to studies undertaken to gain an overview of the trophic status of catchments, in order
to prioritise those areas which would benefit most from further investigation or nutrient reduction
effort. This includes studies undertaken for the purposes of eutrophication management strategies
and catchment/river-basin management plans.
When interpreting MTR data, the following broad principles should be adopted.
· Actual scores must not be compared between sites unless they are physically (confidence in
survey of I or II) and chemically similar.
· Trophic status should be interpreted on a site-by-site basis, using the flow-chart given in
Figure 4 to determine the standard descriptor for each site. Results may be mapped by
assigning a number, symbol or colour to the standard descriptors.
· Similarly, the significant impacts can be mapped using the 3 standard descriptors in the flow-
chart given in Figure 5. The magnitude of downstream changes in MTR can be compared.
· Although MTR scores may be placed into arbitrary groups for mapping purposes, such maps
must only be used to illustrate MTR scores: no inference should be made to trophic status,
Page 93

R&D Technical Report E38 79
which should be based on a site-by-site interpretation as specified above. To avoid misinterpretation of such maps, their use is discouraged.
6.2.4 Tempora l changes in trophic status
Although this application is untried, it is recommended that in the interim, the same essential
principles for interpretation of data be adopted as for spatial changes in trophic status. Thus, the
trophic status of a site should be determined by means of the standard descriptors provided in
Figure 4, and a change in MTR over time must be at least 4 units or 15% for it to be deemed
significant in terms of trophic status. This should mean that the change is greater than that which
may be expected from natural background variation and from sampler error. When assessing the
response of a river to nutrient-reduction measures, however, it is important to also interpret
temporal changes against the baseline variation for that river, as established over a number of
years prior to the commencement of nutrient reduction.
6.2.5 Futur e development
The limitations of the MTR, in terms of the complexity of interacting factors by which it may be
influenced, are recognised (Dawson et al 1999b). The guidance given above regarding
interpretation of data is thus the best available at the current time, given these limitations. Further
research and development to assess the effect of geology, altitude, flow type and other
environmental variables, is necessary before further refinement of the method can be made. This
may lead to the establishment of benchmark MTR values for river types which could be used to
assess the extent of deterioration from the typical value. Nationwide comparisons of
eutrophication impact may then be made.
Page 94

R&D Technical Report E38 80
6.3 Interpretation of species diversity
Species diversity (the number of scoring species) should not be used by itself as an indicator of
trophic status. The relationship between species number and phosphate concentration is not
linear (Figure 6). Although phosphate concentration may determine, to some extent, the
maximum diversity possible at a site, this potential may not be realised in many cases due to other
factors.
In certain circumstances, however, species diversity may prove helpful as a supplementary
measure of the community response to trophic status, in addition to the MTR, but should only be
used with extreme caution. Although no prescriptive ‘rules’ can be given, refer to Figure 6 and
bear the following indicative guidance in mind:
· a low or intermediate diversity may be recorded at any phosphate concentration;
· a high diversity is unlikely to be recorded at either very high concentrations of phosphate or
very low concentrations;
·
at any phosphate concentration, the ‘envelope’ shape of the relationship between diversity
and phosphate concentration means that a wide range of diversities may be recorded;
· diversity should only be used to support the interpretation of MTR results in those situations
where both a downstream change in diversity, or a temporal change at the same site, is very
marked and
the influence of factors other than a change in trophic status is deemed
insignificant.
Page 95

R&D Technical Report E38 81
Figure 6 Relationship between the number of scoring species and the phosphate
concentration. (Figure 39, R&D Technical Report E39, Dawson et al 1999b).
6.4 Interpr etation of overall percentage cover values
Overall percentage cover is, by itself, of little use in terms of assessing trophic status. There is
no relationship between overall percentage cover and phosphate concentration. It is still a useful
parameter to record, however, for the following three reasons.
· In many cases it acts as a double check on the percentage covers given to individual scoring
species.
·
In some cases, eutrophication may cause a change in overall percentage cover, and if so is
worthy of note.
· Excessive growth of macrophytes, resulting in very high overall percentage cover values, can
in itself result in problems to users of rivers, giving rise to complaints, and may impact on
river management functions. Where such complaints or impacts arise, it is important to
establish whether the excessive growth is due to eutrophication, or to other factors. Where
it is due to eutrophication, then this clearly constitutes an ‘undesirable disturbance’ in
UWWTD terms.
Where a marked change is recorded, determine whether this is a result of a change in trophic
status by establishing to which key species the change in overall cover and the change in MTR
can be attributed. If the key species is/are the same, then the change in overall cover is likely to
be due to a change in trophic status. If so, then this is worthy of mention when reporting results.
Where the change is a very marked increase in overall percentage cover, such that it may give
rise to complaints from river users (either on aesthetic grounds or as a result of physical
disturbance to use of the river), then this clearly constitutes an ‘undesirable disturbance’ in terms
of the definition of eutrophication given in the UWWTD.
Perhaps the most notable example of this relates to situations where the key species is
Cladophora. If an increase in overall percentage cover and a decrease in MTR is due mainly to
an increase in percentage cover of
Cladophora
, then it may be deduced that the increase in
overall percentage cover is a manifestation of eutrophication.
Page 96

R&D Technical Report E38 82
7 QUALITY ASSURANCE
This chapter highlights the main sources of error and variation in MTR survey results, and the
need for a quality assurance procedure to reduce these. It then gives detailed guidance on quality
assurance for MTR surveys, including training requirements and protocols for audit surveys.
7.1 Introduction
7.1.1 Sources of error and variability
Surveyor err or and differences between surveyors
The most common sources of surveyor error and variation between surveyors are:
· differences in estimates of macrophyte cover;
· incorrect identification of macrophytes, especially of Ranunculus species and some species
of bryophytes;
· missed species, where present only in isolated small (£25cm2) patches;
· differences in interpretation of which specimens are ‘in’ and ‘out’ of the channel;
· errors in accurately locating the survey length.
All can be reduced by provision of adequate training, correct application of the method and
adoption of quality assurance measures.
At the survey stage, particular attention should be paid to strict adherence of the survey
methodology, taking adequate time to estimate percentage cover values, retaining representative
samples of ‘difficult’ specimens for subsequent confirmation of identification, looking out for
small patches of macrophytes, ensuring that the sketch map is accurate, and ensuring that the
survey length is located correctly.
At the data interpretation stage, allowance for surveyor variation is made in the guidance given
in Chapter 6: the MTR score must change by at least 4 units or 15% for it to be deemed
significant in terms of trophic status, this being greater than the median difference which may be
expected from inter-surveyor variation (6.1.3). Individual species percentage cover estimates
should be approached with care due to their semi-quantitative nature. Only gross changes in
percentage cover should be considered worthy of note and it should be remembered that the
estimation of SCVs can vary between surveyors by up to 2 units (abundance classes) for the
majority of the time.
Background variation in MTR
The MTR score varies within the survey season, with a mean difference of 7.5% between surveys
undertaken at the same site but at different times within the season (Dawson et al 1999b).
Allowance for within-season variation is made in the guidance on survey timing and interpreting
results: surveys in consecutive years at the same site should be undertaken at the same time of
the survey season every year (3.3.1), and MTR must change by at least 4 units or 15% for it to
Page 97

R&D Technical Report E38 83
be deemed significant, this being twice the mean difference to be expected from within-season
variation (6.1.3).
Other temporal changes in the MTR score which may arise, for example due to natural cycles of
plant growth, river conditions or river management works, are allowed for by use of the suffix
of confidence in the survey (4.5.7).
The MTR may also be influenced by the size of the river, its slope, substrate size, underlying
geology and the altitude of its source, as well as by nutrient status or other chemical
determinands. Allowance for this source of variation is made in the guidance provided on
selecting survey lengths and interpreting results: site comparability is one of the factors to be
taken into account when selecting survey lengths (Box 2) and survey lengths should only be
compared if they are physically similar (as expressed by the suffix of confidence, 4.6.12).
7.1.2 The need for quality assurance
It is important that the sources of variation outlined above are reduced so that maximum possible
confidence can be placed in the accuracy, or ‘quality’ of survey results. This is normally
achieved by application of a quality control procedure, the aim of which is to minimise
unavoidable errors in carrying out the survey methodology; set quality targets and determine
whether these are being met; and provide a means for restoring quality if targets are not met.
Most standard quality control systems which are used for other biological surveys and chemical
analyses, such as control charts, ring sorts and resorting of samples, are not appropriate for
macrophytes. Macrophyte surveys produce data directly from a field survey. No samples are
taken, except for those required for identification or confirmation purposes. Re-surveys alone
are probably not sufficient, as they occur after the surveys have been undertaken and real changes
may have occurred in the interim. In addition, the de-limitation of the ‘sample unit’ available to
the re-surveyor (the upstream and downstream limits of the survey length and the definition of
the ‘channel’) is itself integral to the methodology and open to error.
The requirement for MTR surveys is therefore for a system of quality assurance, aimed at
minimising errors. Several aspects of MTR surveys can undergo quality assurance to a greater
or lesser degree. These include:
· operation of the method
· number of species
· abundance categories
· overall percentage cover
· identification
· database entry accuracy
In addition, relocation of survey lengths can be audited if required. This is recommended where
survey results at any one site are to be analysed from more than one visit (such as for UWWTD
monitoring) and the surveys undertaken by different a surveyor(s) on each occasion.
Page 98

R&D Technical Report E38 84
Quality assurance measures relating to many of the above are described as an integral part of the
implementation of the survey and the calculation of the MTR (shaded boxes in chapters 4 and
5). These MUST be adhered to as a very minimum. It is strongly recommended, however, that
the following additional measures are also implemented to ensure the highest possible quality of
data is maintained throughout the application of the method. These include:
· training (7.2)
· audit surveys (7.3)
· inter-calibration exercise (7.4)
· data storage (7.5).
Page 99

R&D Technical Report E38 85
7.2 Training
Each member of staff must have a personal training record with details of all courses and on-thejob training received.
All surveyors should receive basic safety training. This may also include boat handling courses
and First Aid training if appropriate.
In addition to this basic training, training must be provided in the specific areas of MTR survey
methodology, MTR calculation, database entry and interpretation of results.
7.2.1 New staff
The areas in which new staff must be trained are:
Identification
A basic macrophyte identification course is needed before any surveys are undertaken. This
course should cover all the commonly occurring macrophytes found in the locality. The new staff
member, or a surveyor transferred from another geographical region, should look through, and
become familiar with, the reference collection and identification guides.
Method
New staff members must read this manual and accompany an experienced surveyor for field
training. Resulting data and identification should be checked by another surveyor. Until the
supervisor is confident of the proficiency of the new surveyor, the surveyor should accompany
other surveyors for on-the-job training. All new members of staff should attend the annual
method training and quality assurance exercises.
It is very important that new members of staff are made aware of the importance of the accuracy
required when making estimates of percentage cover values for individual species. Regular
training exercises should be carried out throughout the season.
Data handling
This should take the form of in-house training by an experienced member of staff.
7.2.2 Maint aining skills
Minimum requirements
Macrophyte surveys can only be carried out during the summer months, resulting in a lengthy gap
between consecutive survey seasons. To improve and maintain survey quality, each surveyor
must undergo the following essential training:
Page 100

R&D Technical Report E38 86
(i) each surveyor must read (or be trained in) this manual at the start of each survey season;
and
(ii) each yea
r, each surveyor must either undertake a set minimum number of MTR or other
macrophyte surveys (the suggested minimum is five surveys per year), or attend a training
course at which MTR surveys are undertaken (this may be the ‘refresher’ course described
below).
At the beginning of the survey season, surveyors who did not achieve the minimum requirement
of (five) surveys in the previous year should not undertake further surveys until they have
received MTR training. (Note that this is referring to the number of surveys not the number of
pairs/sets of surveys up- and downstream QDs. Refer to the glossary for the definition of survey.)
Annual ‘refresher’ course
It is recommended that all surveyors attend an annual ‘refresher’ course in survey techniques and
identification skills each year. This course may contribute to the minimum training requirement
cited above. The course should be held at the start of, or early in, the survey season and should
encompass all aspects of the survey method with particular attention to the subjective estimates.
The course should include:
· an overview of how to carry out an MTR survey;
· at least one standard MTR field survey with discussions at each stage, including the
identification features of macrophytes found in the survey length;
·
a exercise designed to estimate percentage cover of macrophyte species in the field and to
compare estimates between surveyors;
· an identification exercise whereby each surveyor individually identifies a set of specimens
provided and the identifications are then discussed so everyone learns from the exercise.
7.2.3 On-going tr aining
It is recommended that more experienced staff from each area office should attend an advanced
macrophyte identification course(s). This should cover macrophytes which are ‘difficult’ to
identify to species level, such as some
Ranunculus
, fine-leaved
Potamogeton, Callitriche and
Bryophyte species. These staff will then be able to help with identification confirmation.
7.2.4 Exceptions
The only exceptions to the above recommendations regarding training are where, in a team of
three or more, a member of the team is assigned tasks not requiring macrophyte identification
skills, ie assigned to neither the assessment of macrophyte presence/cover nor the drawing of the
sketch map. Tasks to which this team member may be assigned include, for example, the
recording of macrophyte presence/cover (not the assessment), the assessment of the physical
characteristics of the site and/or handling of the boat. In such a case, there is no requirement for
this team member to be trained in macrophyte identification. This is subject, however, to at least
two members of the team being fully trained in all aspects of the methodology. All members of
the team should be trained in the general operation of the method.
 Loading...