Planet NMS-1000V User Guide
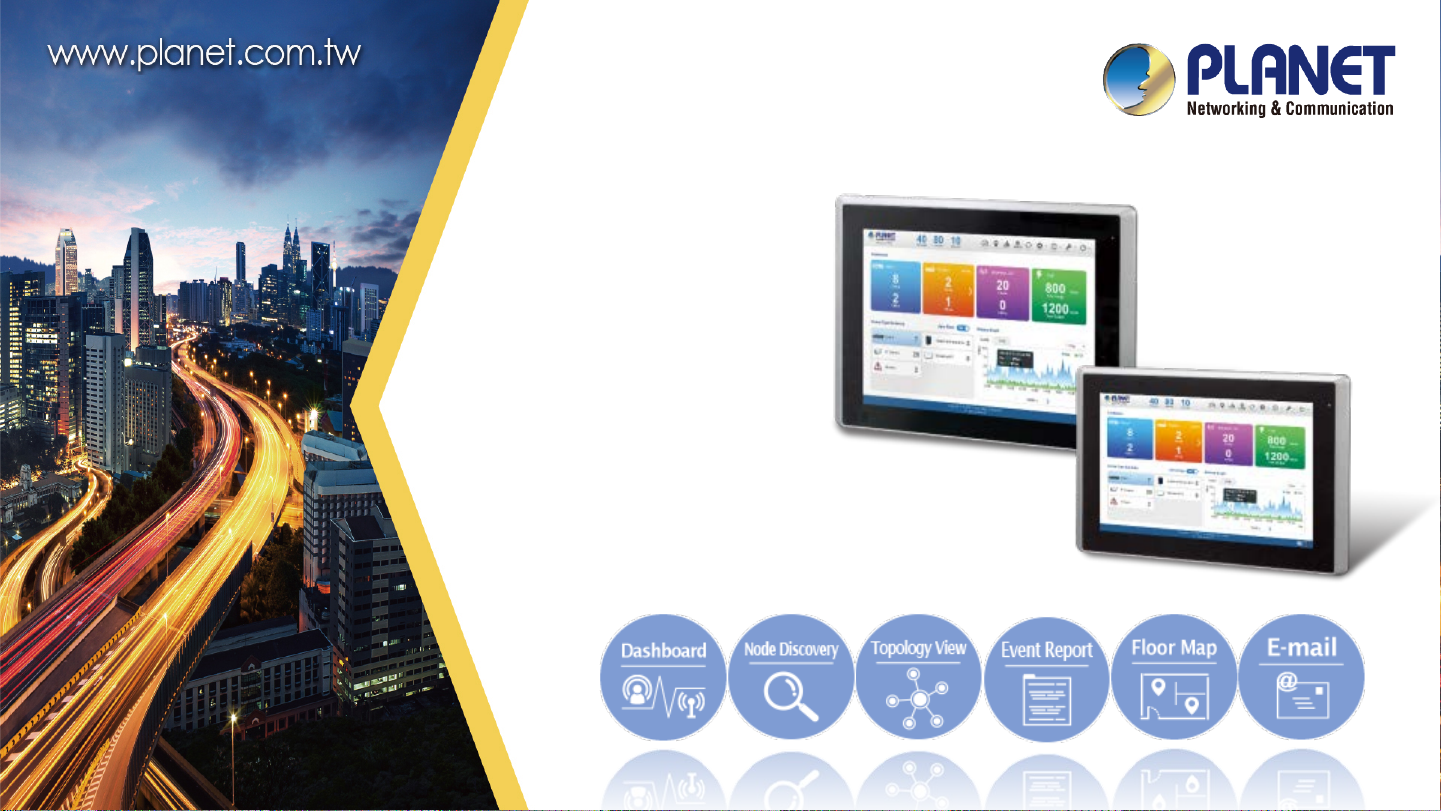
Quick User Guide
NMS-1000V
1

Sections
a) Overview………………………………………………………………………………........................ 3~5
b) Application………………………………………………………………………………………………..… 6~7
c) Before First Login….………………………………………………………………………….………… 8~16
d) Setup Wizard.……………………………………………………………………………..……………… 17~21
e) Main UI Introduction……………………………………………………………………………....... 22~24
f) Dashboard Introduction…………………………………………………………………………….. 25~29
g) Footer Introduction……………………………………………………………………………………. 30~31
h) System Menu - Domain….……………………………………………………………….......….. 32~40
i) System Menu - AP Control……………………………………………………...................... 41~58
j) System Menu - Refresh…………………………………………………………………………….. 59~60
k) System Menu - System Configuration……….……………………………………….……. 61~68
l) System Menu - Network Services …………………………………………………………... 69~80
m) System Menu - Maintenance…………………………………………..…..…………………. 81~86
n) System Menu - Exit…………………………………………………………………………………. 87~89
o) HDMI Output……………………………………………………………………………………………. 90~91
p) Appendix…………………………………………………………………………………………………… 92~93
2

OVERVIEW
3
Overview
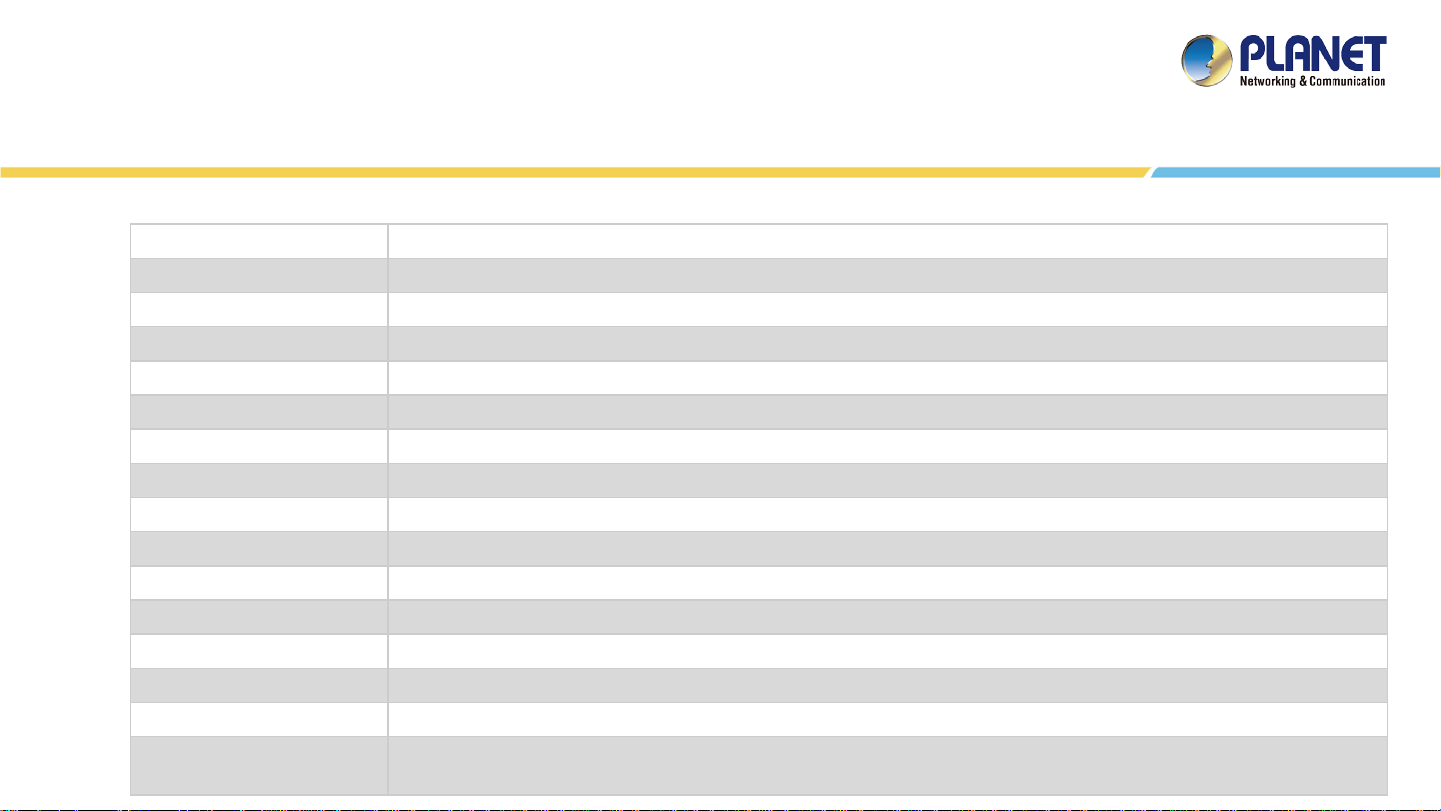
Main Features:
Dashboard Providing the at-a-glance view of system, device summary, traffic , PoE network status
Wizard setup Easy to use step-by-step guidanc e
Node Discovery To detect PLANET managed devi c es available and allow AP groupi ng to accelerate AP m anagement
Topology Viewer A topology of network devices compliant with SNMP, ONVIF, Smart Discovery and LLTD Protocol
Event Reports The status of a network c an be report ed via network alarm and system log
Alarm System Popup alerts and email alerts for the administrator via the SMTP server
Batch Provisioning Enabling multiple APs to be configured and upgraded at one t im e by using the designated profile
Coverage Heat Map Real-time signal coverage of APs on the user-defined floor map to optimize Wi-Fi field deployment
Customized Profile Allowing the creation and maintenance of m ul tiple wireless profiles
Auto Provisioning Multi-AP provisioning with one click
Cluster Management Simplifying high-density AP management
Zone Plan Optimizing AP deployment with actual signal coverage
Authentication Built-in RADIUS server seamless l y integrated i nto the enterprise network
User Control Allowing on-demand account creation and user -defined access policy
Scalability Free system upgrade and AP firmware bulk upgrade capability
Maximum Scalability
50 floor maps, 1024 nodes, 128 AP groups, 128 SSID profiles, 1024 managed A Ps , 20,000 client s, 20,000 RADIUS user accounts, 50
RADIUS user groups and 1024 RADIUS clients
4
Overview
Network Management Characteristics
Built-in DHCP server
Built-in RADIUS server
SSL secure access
Web-based GUI management interface
SNMP v1, v2c, and v3 management
Supports PLANET DDNS/Easy DDNS
Industrial-grade Physical Hardware
2 10/100/1000BASE-T Gigabit Ethernet RJ45 ports
2 USB 3.0 ports for configuration backup and restoration
1 audio line out (reserve)
1 HDMI interface
2 DB-9 COM1,COM2 (reserved)
1 3-pin DC power input terminal
1 2-pin connector for power on/off button (reserve)
VESA (100 x 100) panel mount
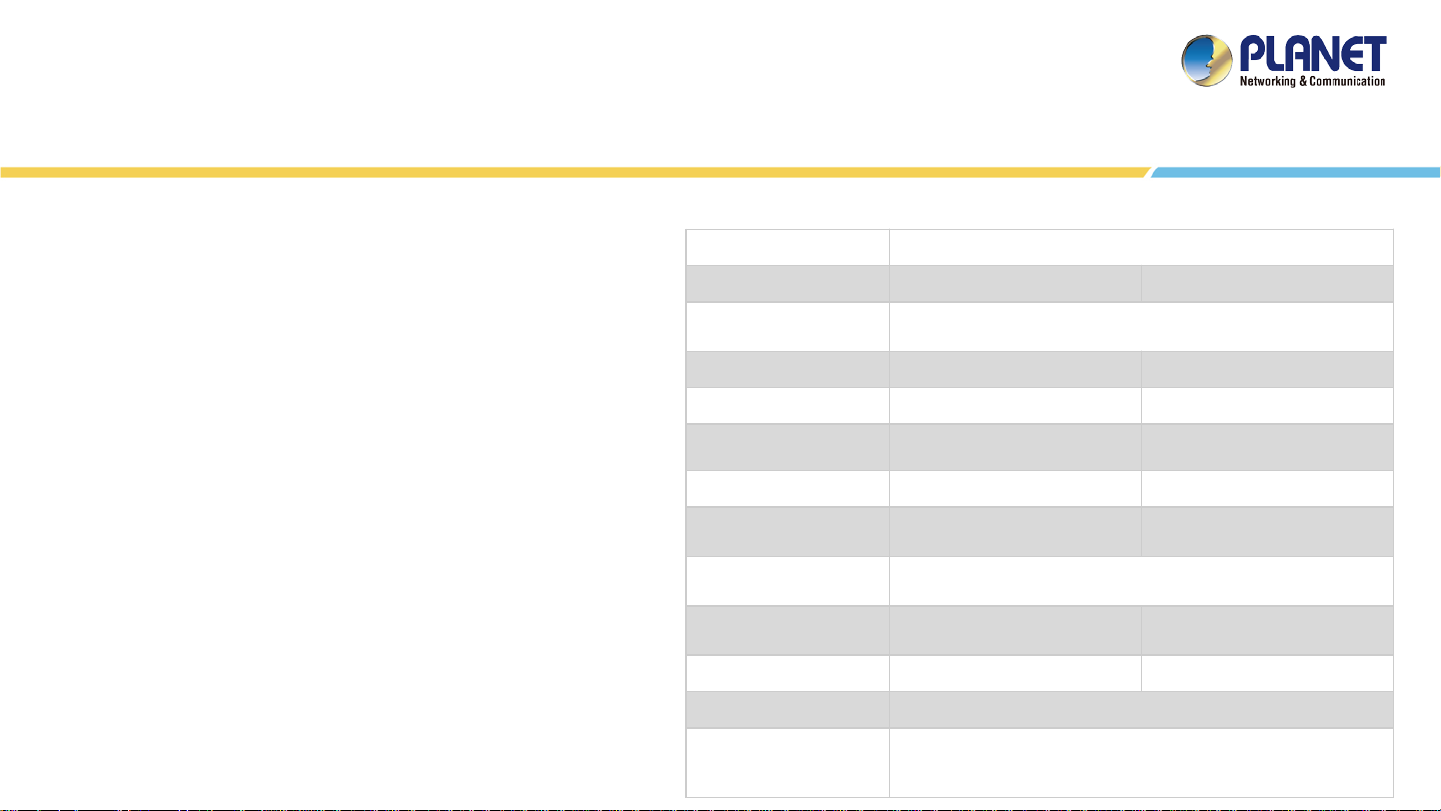
Physical Specifications
Storage 2.5" 32G SATA3 HDD
Touch LCD Size NMS-1000V-12: 12.1” TFT-LCD NMS-1000V-10: 10.1” TFT-LCD
Touch Type
Display Resolution NMS-1000V-12: 1024 x 768 NMS-1000V-10: 1280 x 800
Display Luminance (cd/m²) NMS-1000V-12: 500 NMS-1000V-10: 350
Display Viewing Angle
(H°/V°)
Display Contrast NMS-1000V-12: 700:1 NMS-1000V-10: 800:1
Display Backlight Lifetime
(hrs.)
Light Transmission (%)
Dimensions (W x D x H)
Weight NMS-1000V-12: 2.9 kg NMS-1000V-10: 2 kg
Enclosure Aluminum Die-casting Chassis
Power Requirements
Resistive Touch Window
Projected Capacitive Touch
NMS-1000V-12: 160(H)/140(V) NMS-1000V-10: 160(H)/160(V)
NMS-1000V-12: 30,000 hrs. NMS-1000V-10: 40,000 hrs.
Resistive Touch Window: over 80%
Projected Capacitive Touch: over 90%
NMS-1000V-12:
319 x 51.7 x 245 mm
DC IN 9~36V
60W adapter 12V 5A with terminal block
AC 100~240V, 2.0A, 60~50Hz.
NMS-1000V-10:
285 x 49 x 189 mm
5

APPLICATIONS
6
Applications
7

BEFORE FIRST LOGIN
8
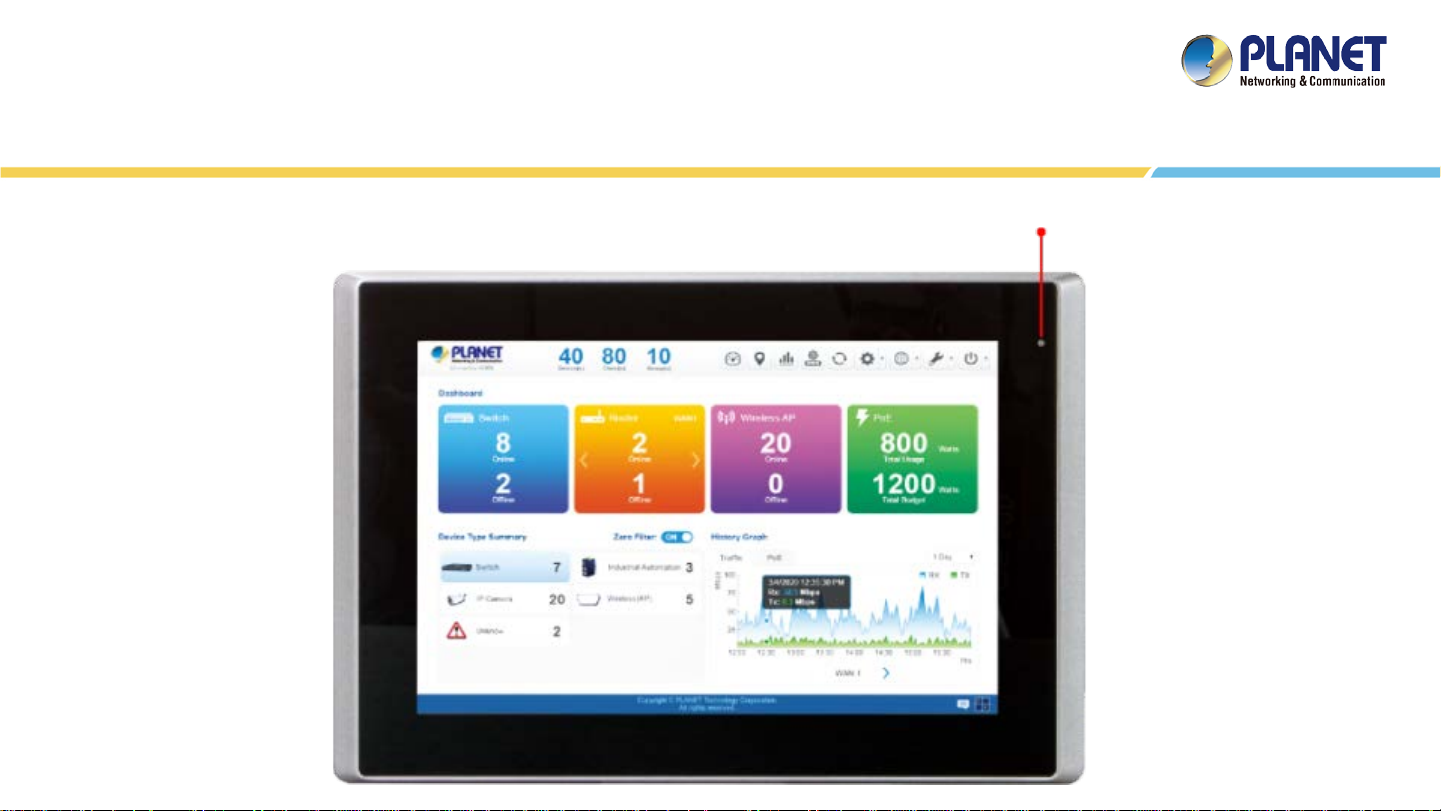
Front & Rear Panels
Front Panel
Power LED(Green)
9
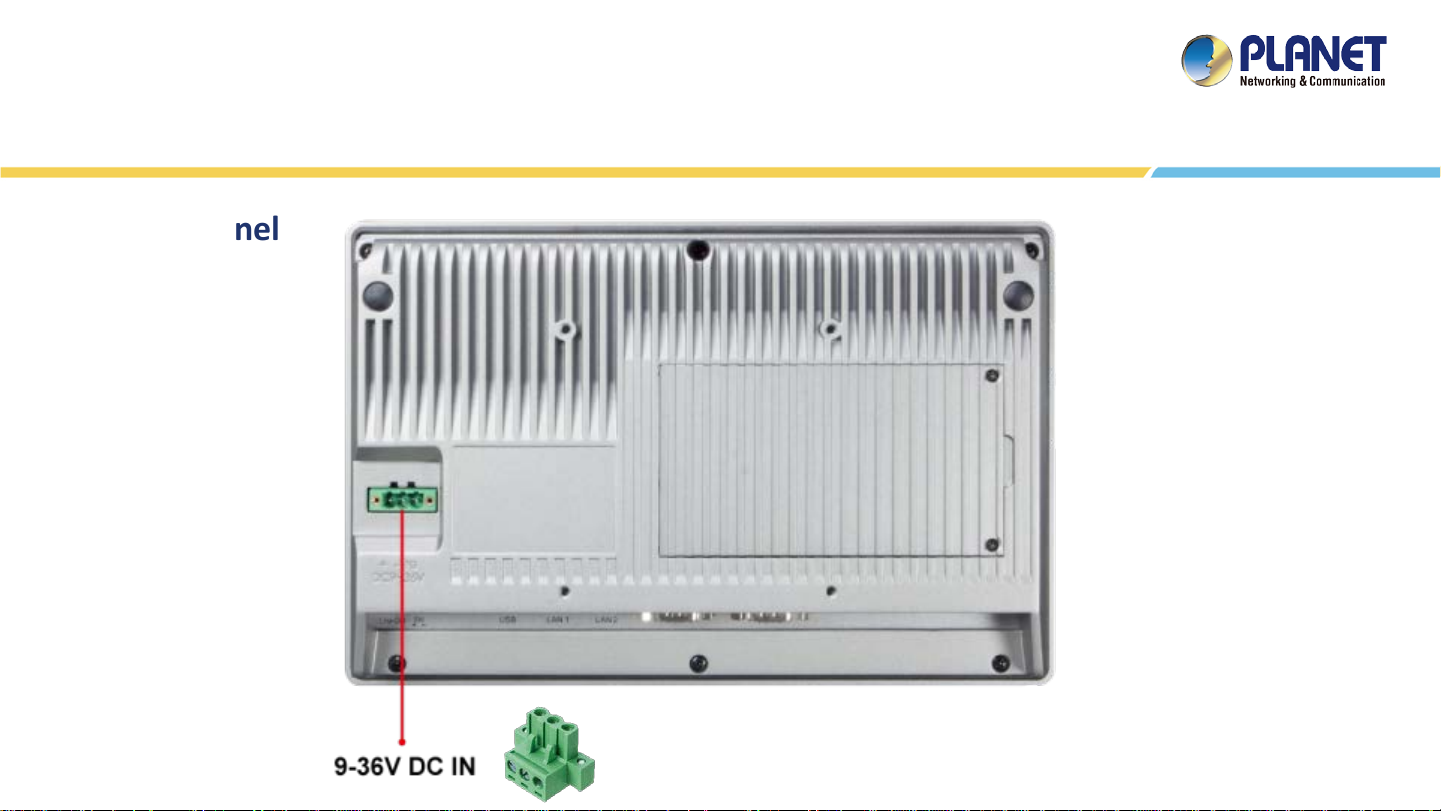
Back Panel
Front & Rear Panels
*Just connect NMS-1000V DC IN to turn on system.
10
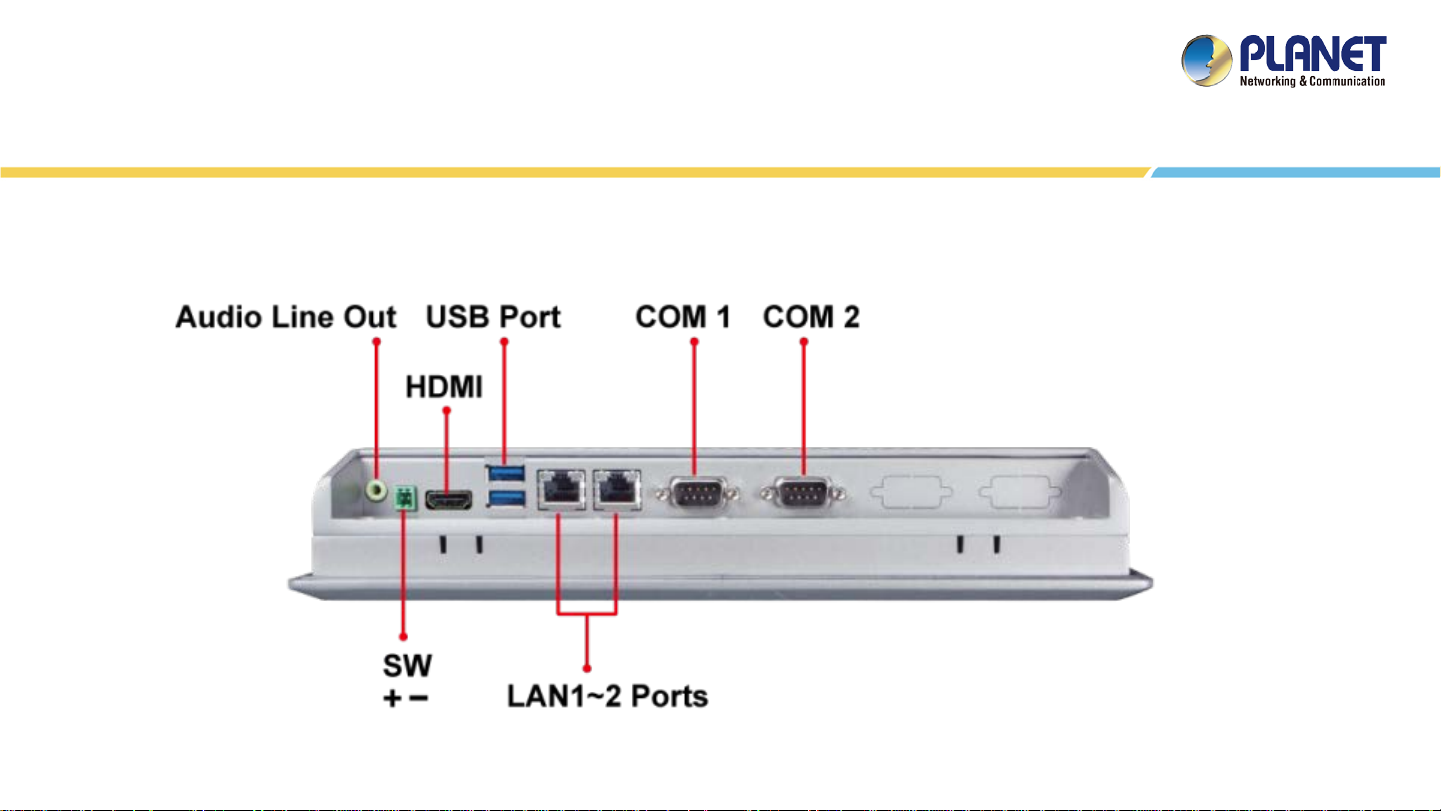
Bottom Panel
Front & Rear Panels
*
*
*
*
*.Function reserved
11
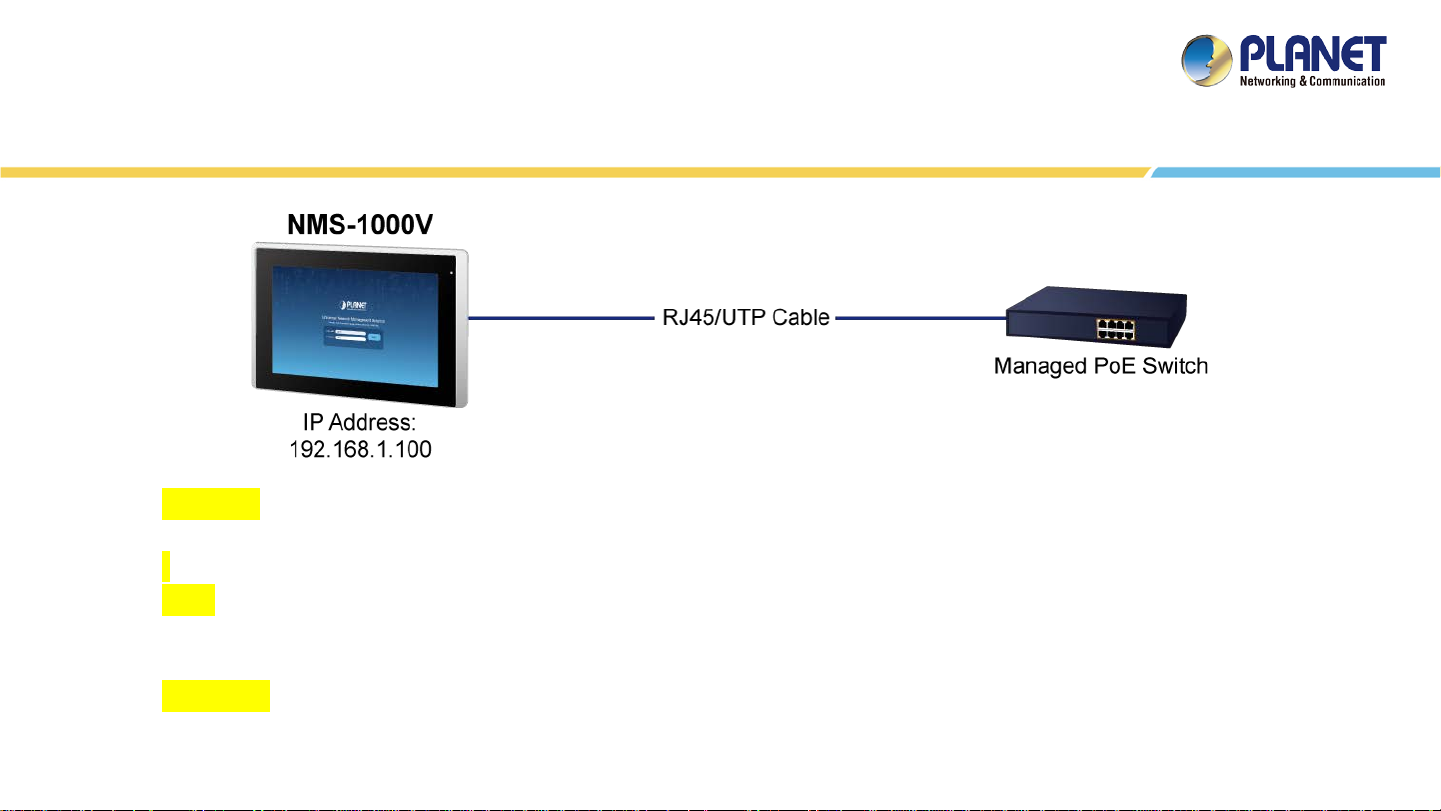
Device Setting
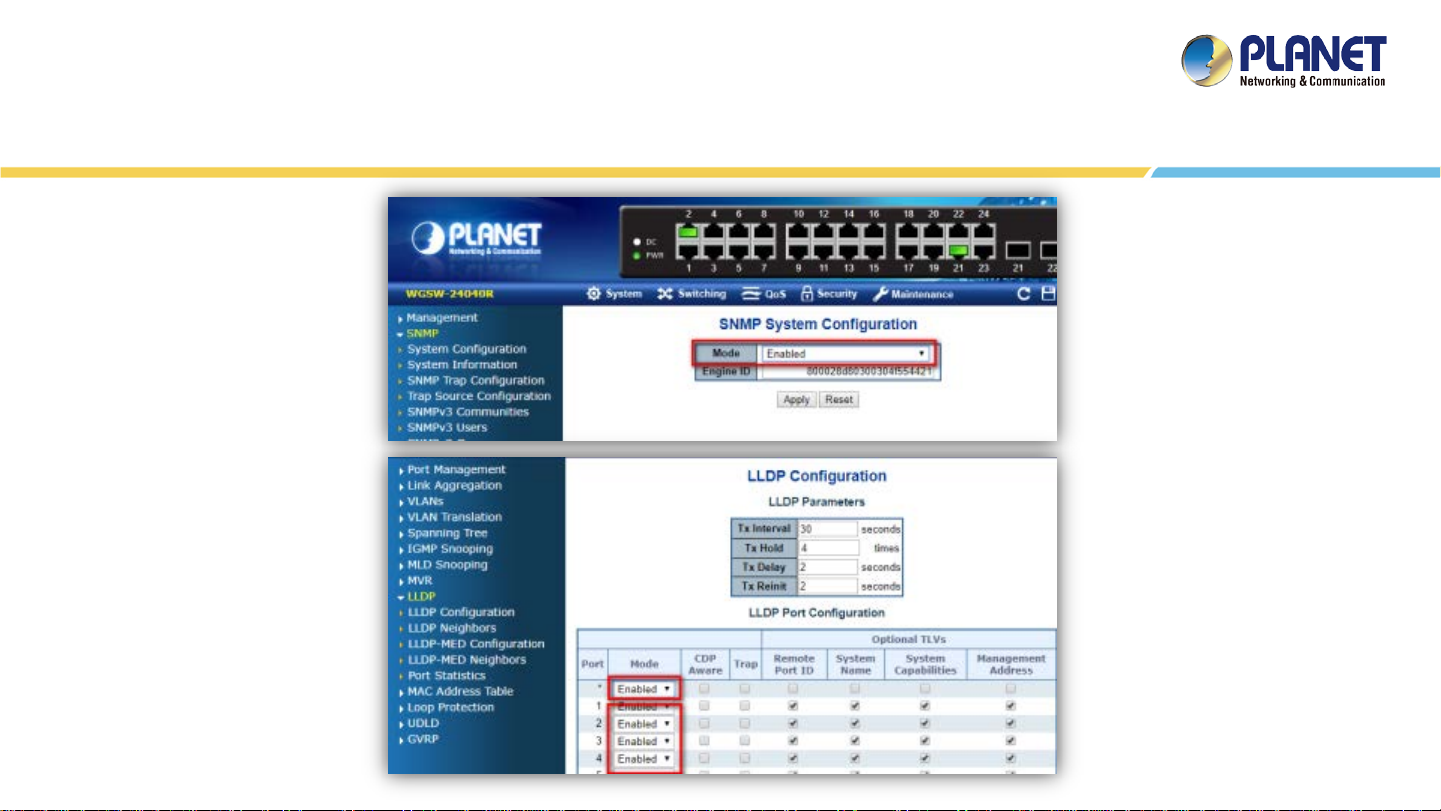
Switch: Log in to the Switch’s Web User Interface and refer to the picture below to enable the SNM P and
LLDP function as shown i n Figures 1 and 2.
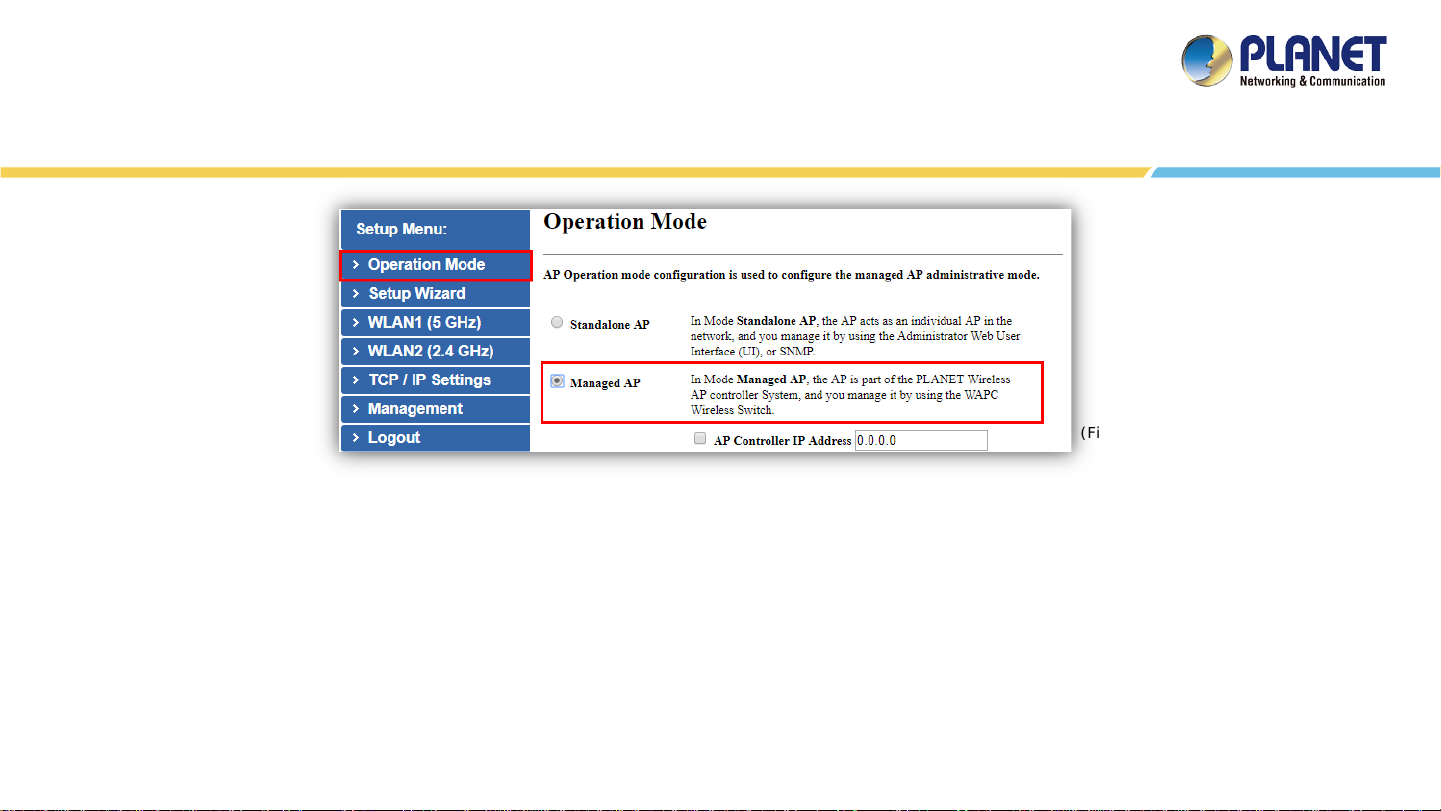
AP: Log in to the AP’ s Web User Interface and refer to Figure 3 below to configure the AP to “Managed AP".
Then, click “Apply Change”. To support SNMP AP, enable the SNMP function.
IP Cam: The ONVIF function is enabled by default.
12
Device Setting
(Figure 1)
(Figure 2)
13
Device Setting
(Figure 3)
14
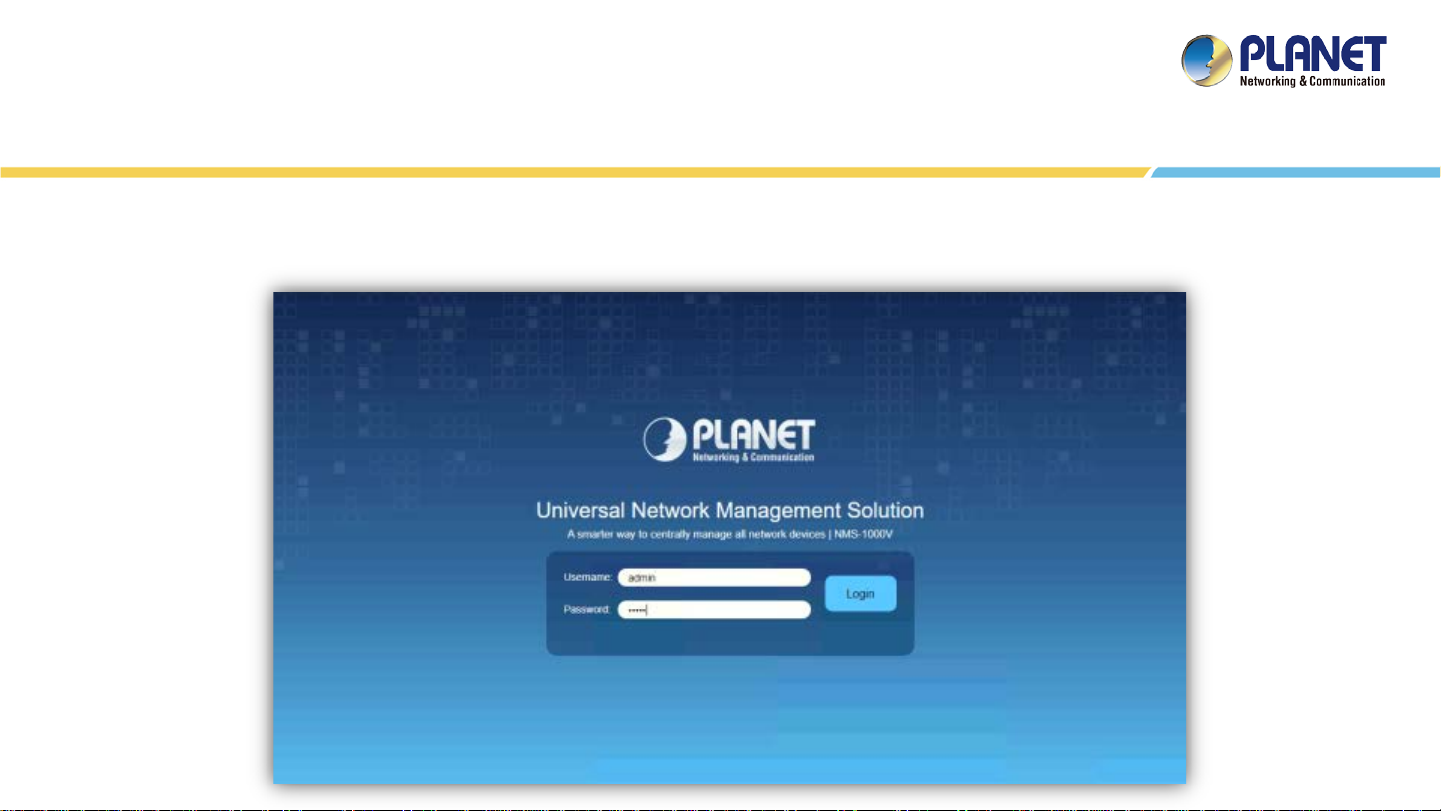
Username: admin
Password: admin
Logging in NMS
15
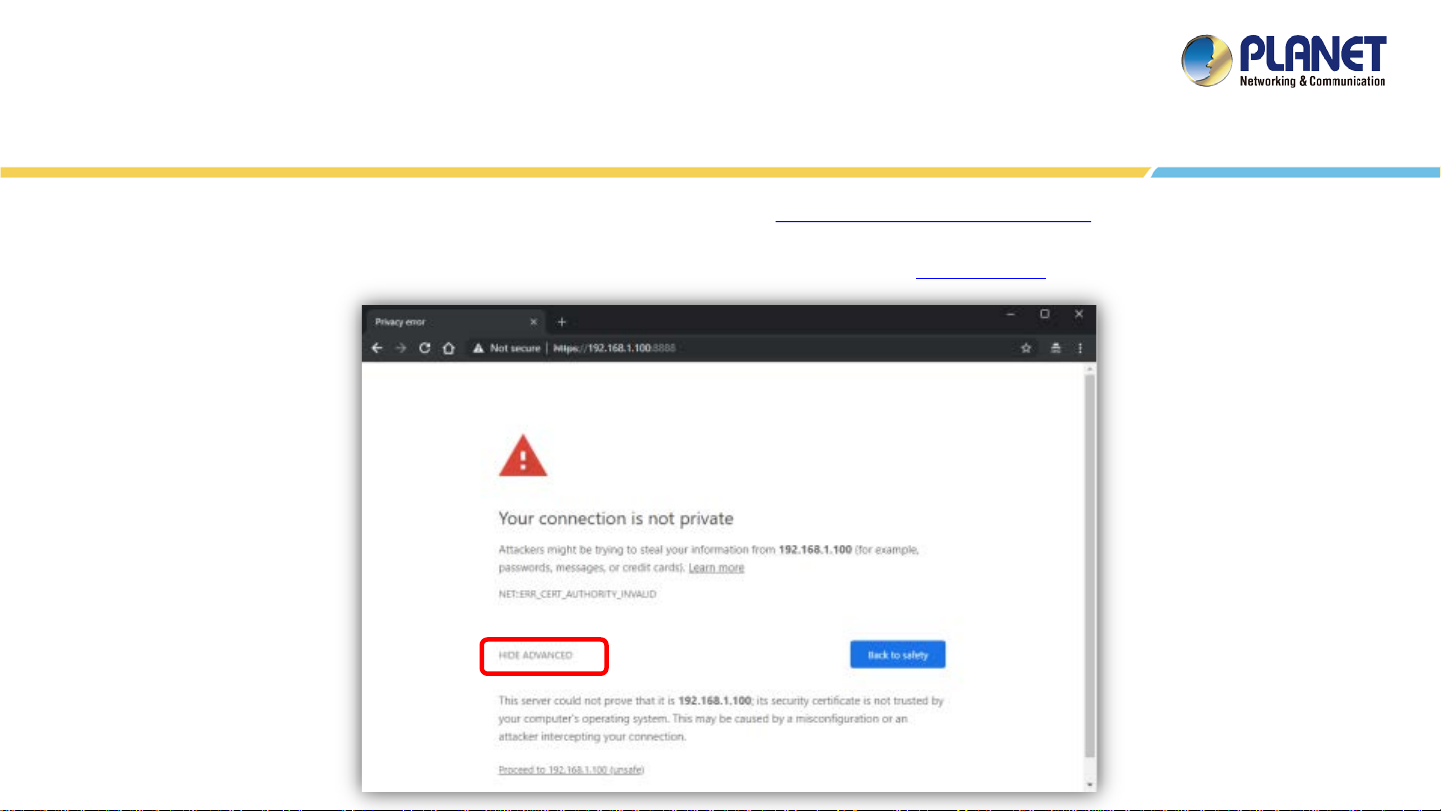
Remote Logging in NMS
Open Chrome/Firefox to log in the NMS.( Default IP: https://192.168.1.100:8888)
Please use Chrome/Firefox to get fully supported. (UI Resolution 1280 x 768)
1. Press the “ADV A N CED” button
2. Press “Proceed to…”
16

SETUP WIZARD
17
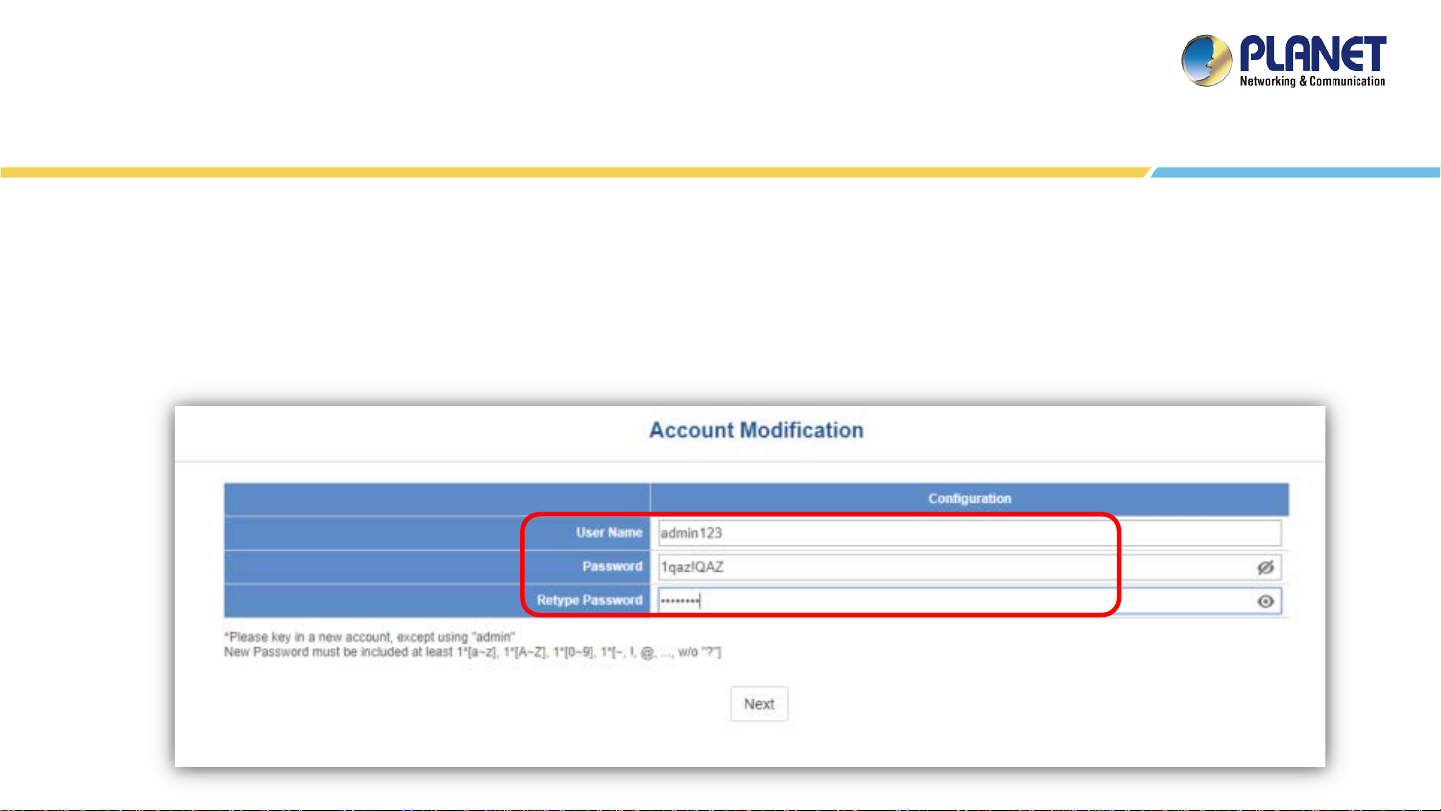
Account Modification
Steps to modifying account:
1. Please key in a new account, except using "admin"
2. New Password must include at least 1*[a~z], 1*[A~Z], 1*[0~9], 1*[~, !, @, ..., w/o "?"] and must
contain at least 8 characters.
18
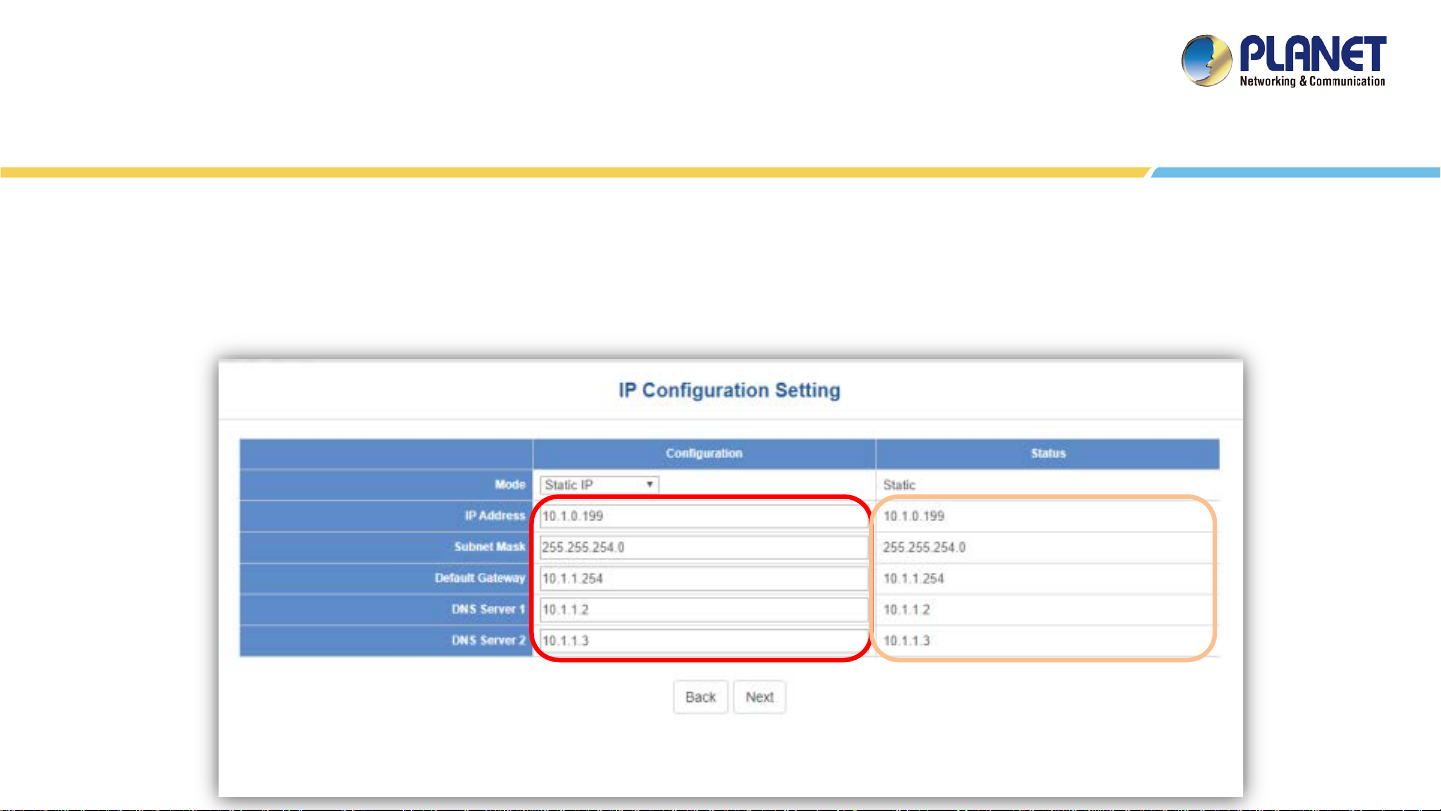
IP Configuration Setting
1. Select “Static IP” or ” DHCP Client” for IP configuration setting.
2. IP status is shown in real time.
*If you want to use the SMTP Alarm function, you must at least enter one DNS server.
19
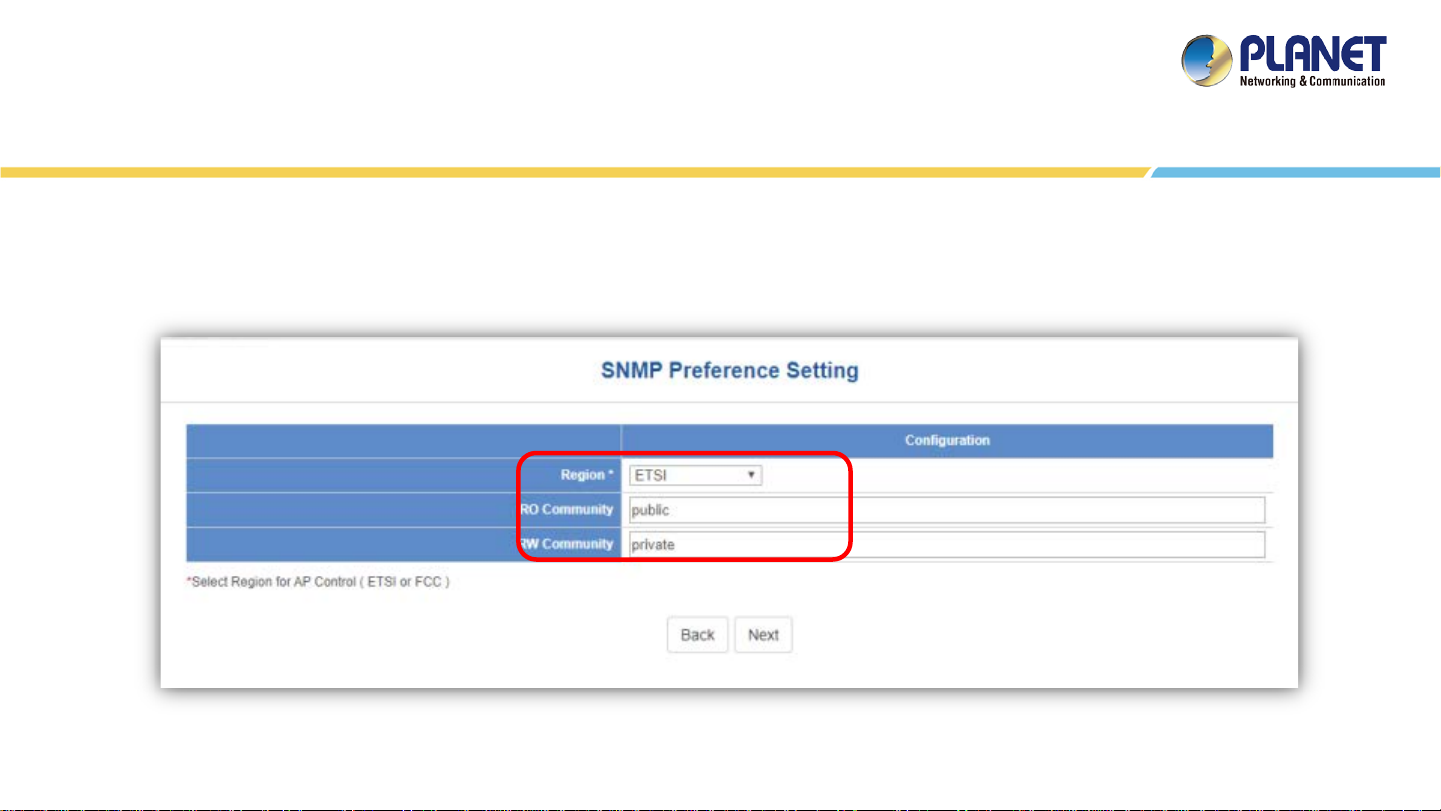
SNMP Preference Setting
1. Select Region for AP Control ( ETSI or FCC ).
2. And enter the RO/RW Community for AP’s SNMP.
20
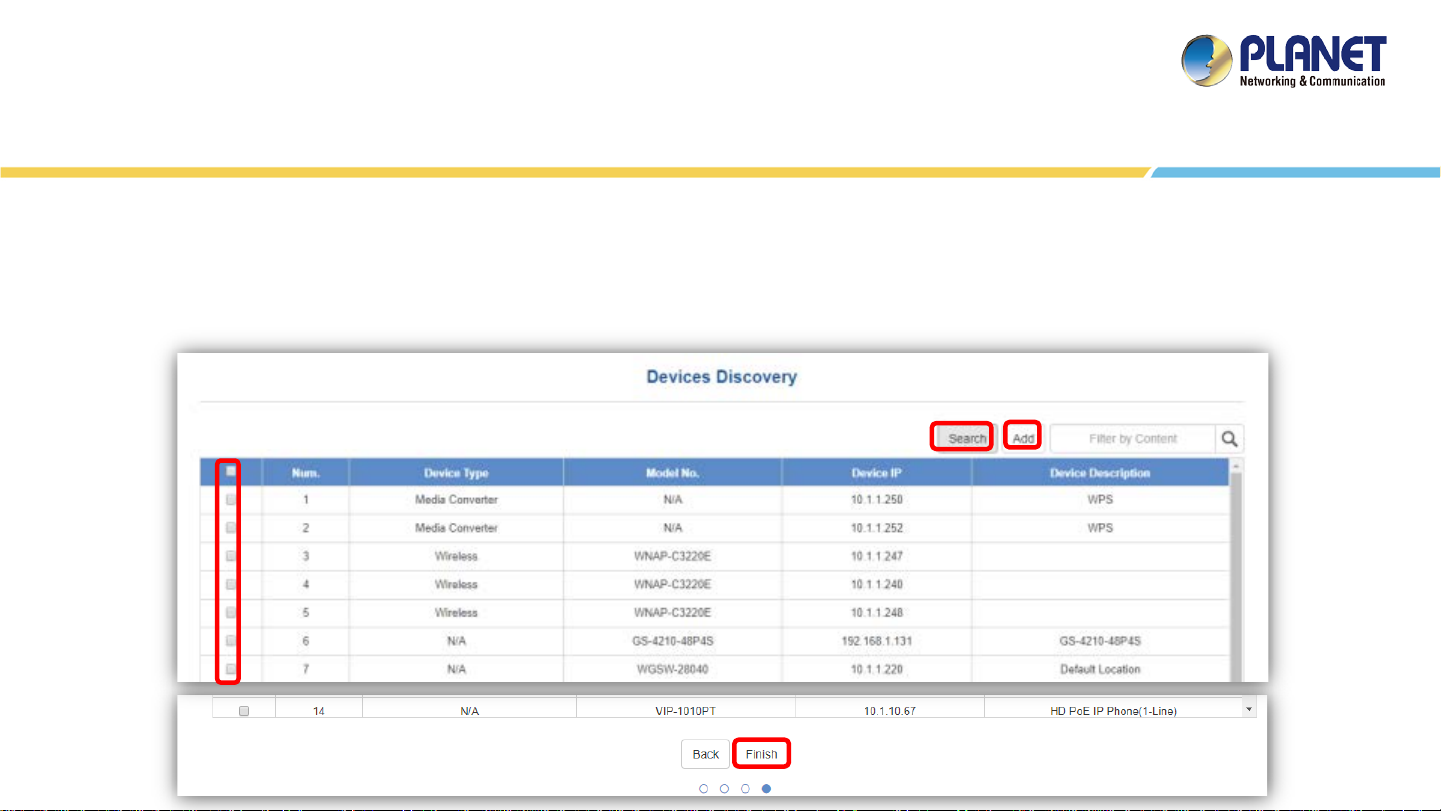
Devices Discovery
1. Press the Search button to discover PLANET devices.
2. Give a check to a box and press the “Add” button to add a device to the NMS system.
3. Press the Finish button to leave the Wizard mode and finish the start-up setting.
2.
4.
1.
3.
21

MAIN UI INTRODUCTION
22
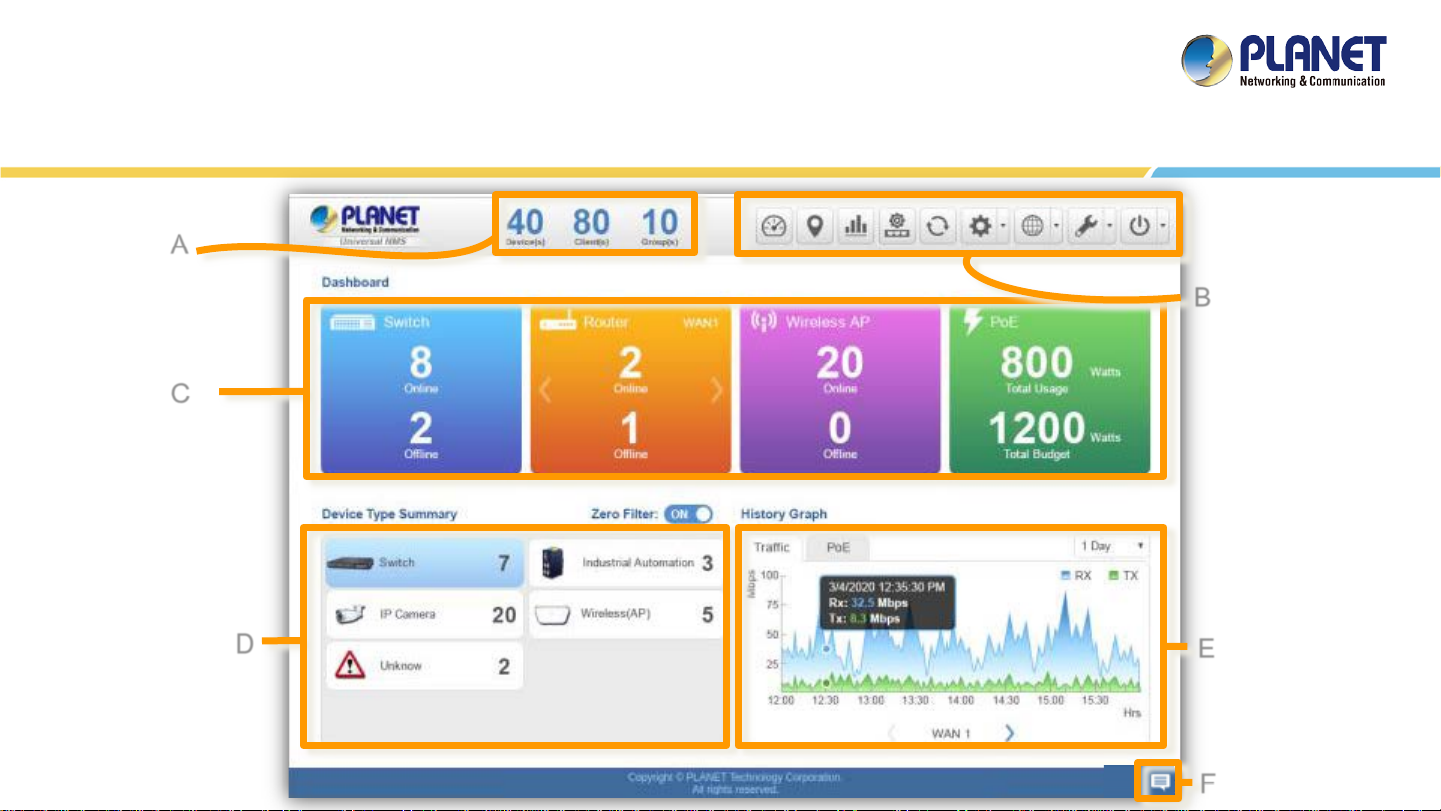
A
C
Home Page - Dashboard UI Structure
B
D
E
F
23
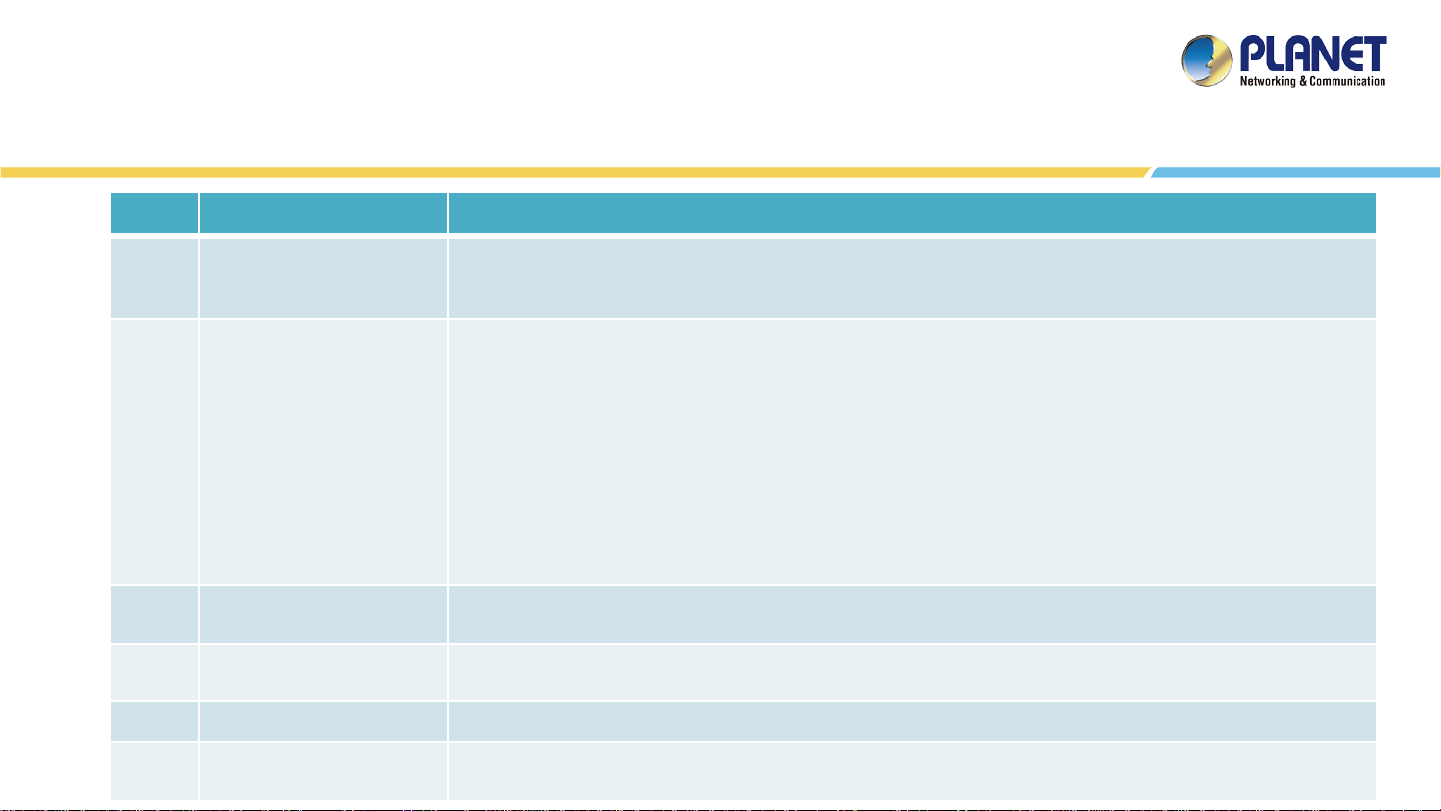
Main Dashboard - Description
Item Description Remarks
1. Roughly shows the system status:
A Device Status Summary
B System Menu
Current devices online (total online), clients (total active clients), device groups (total groups)
2. Click the PLANET Logo to connect to PLANET Web site.
From left to right:
1. Dashboard: Provides the whole system view and wireless network status
2. Domain: Discovery / Device List / Topology View / Event / syslog page
3. Advanced Graph: future feature
4. AP Control: 1. Preference, 2. Profiles, 3. Control, 4. Map It and 5. Statistics
5. Refresh
6. System Configuration: Alert configuration, Date and Time, Interface, IP, Account, Wizard setting
7. Network Services: 1. Planet DDNS, 2. DHCP Server, 3. SMPT, 4. SNMP Agent, and 5. RADIUS Service,
8. Maintenance: System upgrade, backup and restoration, factory default, system setting.
9. Exit: Click to opt for the logout, reboot or shutting down of the system
C Local Site Information
D
E History Graph
F
Device Type Summary Show the real-time total quantity of devices under different types
Popup Alert Message
Window
1. Switch status, 2. Router status, 3. Access Point status and 4. Total PoE status,
*Click Device type button to filter each type of device via device list.
Show the history graph of WAN traffic / total PoE usage and budget
Open to show the system event instantly
24

DASHBOARD INTRODUCTION
25
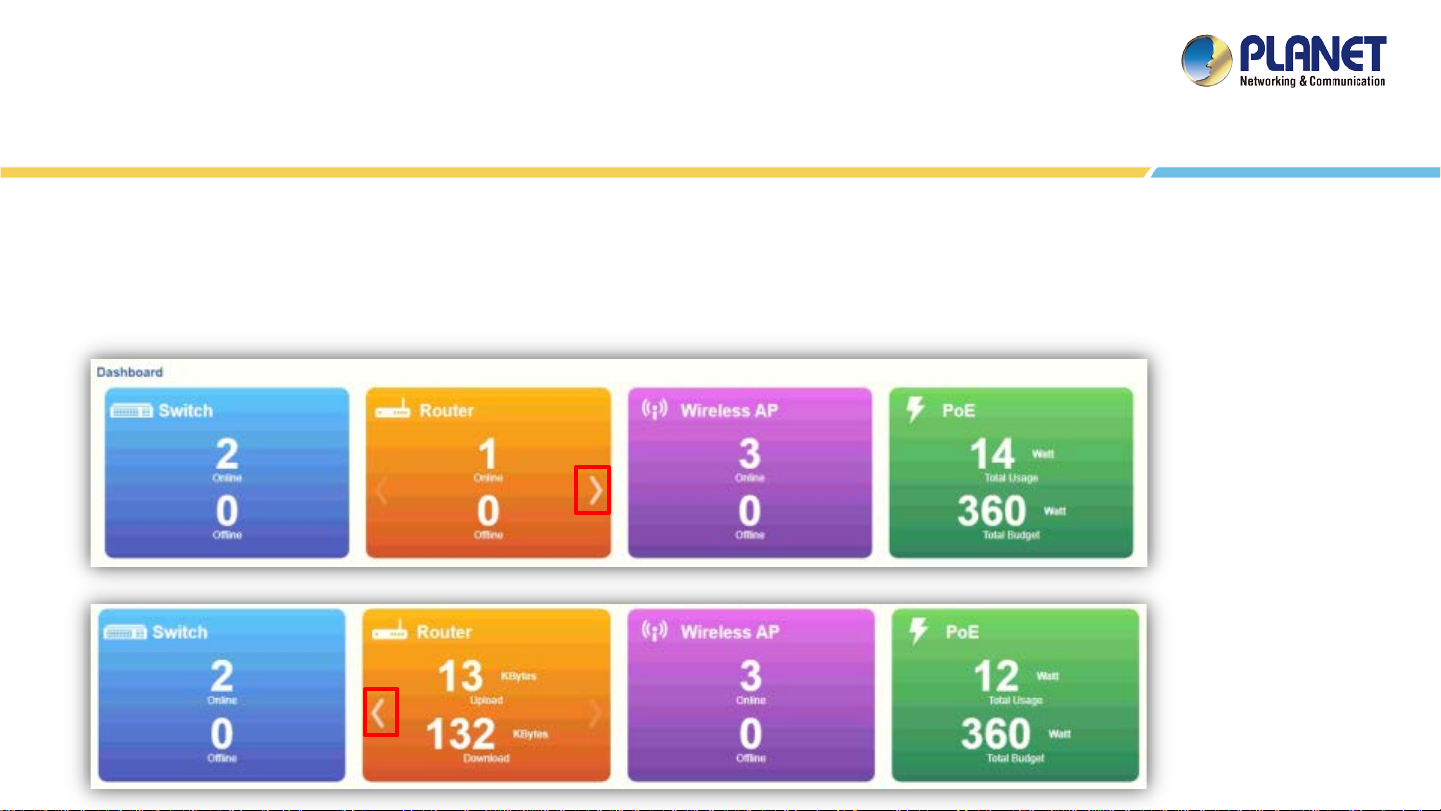
Dashboard - Local Site Information
Local Site Information: In this area, you can view 1. Switch, 2. Router , 3. Access Point online/off status and 4. Total PoE usage and
budget status.
Click Router “>” button to see the WAN real-time traffic throughput of Mbps, Kbps… . Click Router “<” button to go back to status.
26
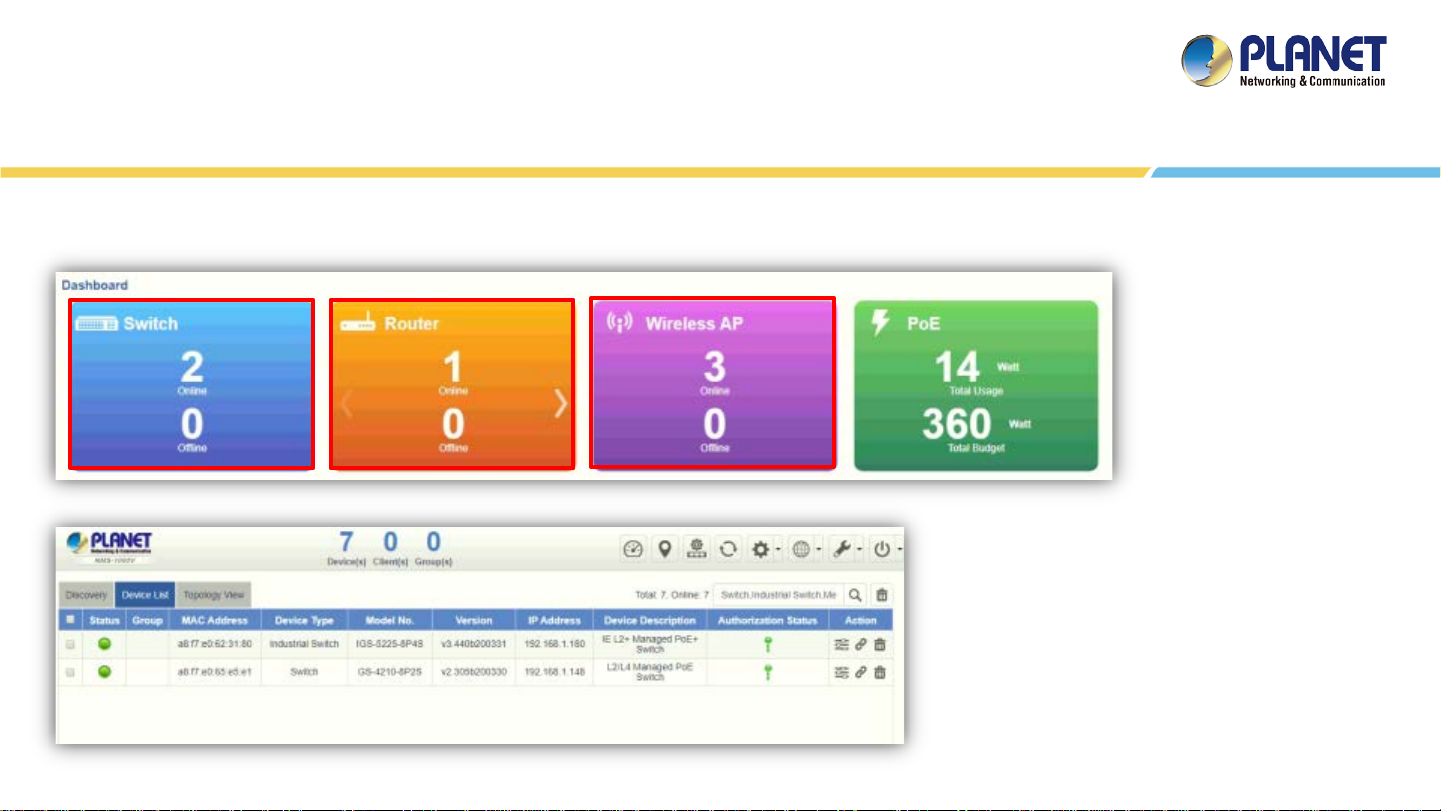
Dashboard (Home)
Click the Device type button to filter each type device via device list.
Switch: Click the “Switch Button” to filter
the type of Switch, Industrial Switch, and
Media Converter.
Router: Click to “Router Button” to filter
the type of Router.
Wireless AP: Click the “Wireless AP Button”
filter the type of Wireless (AP).
27
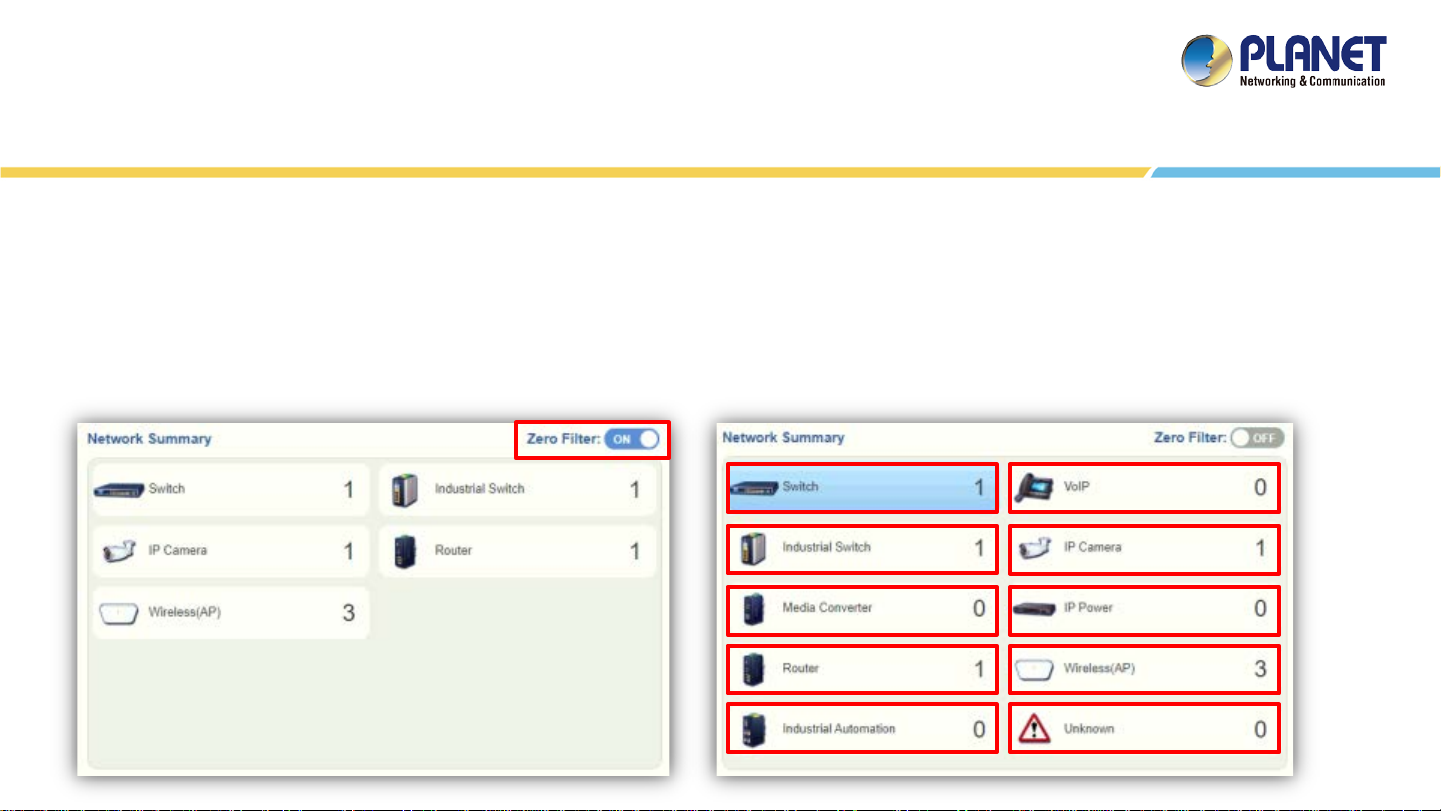
Dashboard - Device Type Summary
Device Type Summary : Show the real-time total quantity of devices under different types.
Open the “Zero Filter Button” to filter the 0 quantity of devices type not shown. If this function is closed, you can see all types that
NMS can manage.
Click the Device type button to filter each type of device via device list.
28

Dashboard - History Graph
History Graph: Show the history graph of WAN traffic / total PoE usage and budget.
Press the “WAN” or “PoE” sheet button to change the type of history graph. Press the “Interval Button” to change the interval for
day, week, or month. Then you can see the WAN traffic / total PoE usage and budget.
*Moving finger or mouse cursor on graph can let you see the detailed information.
29
 Loading...