

Page 1

Users’ Guide
• Using the Xplorer GLX
Standalone
• Using the Xplorer GLX
with a Computer
• Sample Activities
New Features:
• File storage on USB flash drive, p. 83
• Update firmware from flash drive, p. 93
• Instant data monitoring in Digits and
Meter displays, pp. 37 & 38
• Voice and Text Data Annotation, p. 25
(more on page ii)
012-08950F
Page 2
ii
About this Guide
The Xplorer GLX Users’ Guide is divided into two parts.
Part 1 contains detailed information about operating the GLX, includi ng descriptions of every screen, window and menu within the GLX environm ent, and instructions for common procedures.
Part 2 contains step-by-step instructions for science activities and experiments that can be done with the
GLX, its standard included equipment, and commo nly available supplies.
This is revision F of the User’s Guide, for version 1.4x of the GLX firmware. Vis it
www.PASCO.com/glx/ for downloa dable updates to the Users’s Guide and firmware. If you have update d
your GLX from a previous version, be sure to check out these new features:
New for Version 1.4x Update firmware from USB flash drive, p. 93
Cell-se lective manual sampling with Table display, p. 60
Instant data monitoring in Digits and Meter displays, pp. 37 & 38
Automati c calculation creation from Linear Fit, p. 22
Export data to text fil e, p. 32
New for Version 1.3x Swap Cursors, p. 21
Toggle Active Data, p. 21
Zoom Tool, p. 25
New for Version 1.2x Voice and Text Data Annotation, p. 25
USB flash drive support, p. 83
GLX-to- GLX data transfer, p, 84
New for Version 1.1x Scope Mode, p. 22
Output-control Calculations, p . 50
Built-in Sound S ensor , p. 58
Data Collecti on with
ScienceWorkshop
Sensors pp. 59, 67
Technical Support
For assistance with the Xplorer GLX and other PASCO products, contact PAS CO Technical Su pport at:
Address: PASCO scientifi c
10101 Foothills Blvd.
Rosevill e, CA, 95747-7100 USA
Phone: (800) 772-8700 (in the U.S.)
(916) 786-3800 (worldwide)
Fax: (916) 786-7565
Web: www.pasco.com/support/
Email: support@pasco.com
Copyright
The PASCO scientific Xplorer GLX Users’ Guide is copyrighted with all rights reserved. Permission is granted to non-profit educational institutions for reproduction
of any part of this manual, providing the reproductions are used only in their laboratories and classrooms, and are not sold for profit. Reproduction under any other
circumstances, without the written consent of PASCO scientific, is prohibited.
Trademarks
PASCO , PASCO scientific, DataS tu dio, PASPORT, ScienceWorks hop, Xplorer, and Xplorer GLX are tra demarks or registe red trademar ks of PAS CO scientific, i n the
United States and/or in other countries. All other br ands, produ cts, or service name s are or may be trademar ks or service marks of, and ar e used to identif y products
or services of, their respective owners. For more information visit www.pasco.com/legal.
Windows is a registered trademark of Microsoft Corporation in the United States and/or other countries.
Macintosh, Mac, and Mac OS are trademarks of Apple Computer, Inc., registered in the U.S. and other countries.
PASCO Manual Number 012-08950 F
Page 3
ä
How to Store the
Even when the screen is blank, the GLX is active: it powers its memory, it periodically checks its battery, and it
monitors its keypad. Like other hand-held computers, the GLX never turns off—it just goes to sleep.
Before you put your GLX away, read these instructions.
With proper care, you can ensure that your GLX will be ready for use whenever you need it.
Storage Time What You Should Do
WHENEVER
POSSIBLE
Unplugged for
MORE THAN
A FEW DAYS
Unplugged for
MORE THAN
A MONTH
Leave the GLX Plugged In
Leave the GLX connected to AC power so it can keep its battery charged and store data
file s i n defin itely. This is th e
best
way to store the GLX for any length of time.
Backup Your Data
Data files stored in RAM are temporary. If you want to keep your data files, transfer them to
the GLX's internal Flash memory , a USB Flash drive, or a computer. See pages 78–84 and
100 of the Users' Guide for more information.
Fully Charge the Battery
Put the GLX away with a full battery to keep the RAM active (for up to two weeks) and
ensure that the battery has power the next time you use it.
Any time within two weeks, simply press and hold the power button to turn it on. Data
saved in RAM will still be there.
After two weeks, plug in the AC adapter to turn on the GLX (or press the reset button on
the back) and retrieve data files from your backup location.
Put the GLX into Deep Sleep*
In deep sleep mode, an internal switch opens to disconnect the battery. To put the GLX
into deep sleep: backup your data; allow the battery to fully charge; unplug the AC adapter;
go to the settings screen, press , and press ; follow the on-screen instructions.
F3
Why is deep sleep important?
Nickel metal hydride batteries last longer when they are kept as fully charged as possible.
Deep sleep mode prevents unnecessary dischargin g.
What if I forget to put it into deep sleep?
Don't worry. If the GLX is left unplugged and unused from more than two weeks, it puts
itself into deep sleep.
How do I wake up the GLX from deep sleep?
When you're ready to use it again, just plug in the AC adapter (or press the reset button on
the back) and retrieve data files from your backup location.
*Note for early hardware versions: Early versions of the GLX do not support deep sleep mode. If you have one of these GLXs, leave it
plugge d in
Users' Guid e for mo re info rma ti on .
or
remove the battery for long-term storage. (But don't plug in the AC adapter when the battery in not installed.) See page 95 of the
TAPE THIS SHEET TO THE INSIDE LID OF THE GLX STORAGE BOX OR POST IT WHERE THE GLX WILL BE STORED.
®
Visit www.pasco.com/glx to download the latest GLX firmware update and Users’ Guide.012-08950F
Page 4

Page 5

Contents
Part 1:
Users’ Guide
Introduction . . . . . . . . . . . . . . . . . . . . . . . 3
Included Equipment . . . . . . . . . . . . . . . . 4
Quick Start . . . . . . . . . . . . . . . . . . . . . . . 5
Overview of the GLX . . . . . . . . . . . . . . . . 6
Chapter 1: Displays
Graph . . . . . . . . . . . . . . . . . . . . . . . . . . 13
Table . . . . . . . . . . . . . . . . . . . . . . . . . . . 28
Digits Display . . . . . . . . . . . . . . . . . . . . 3 7
Meter . . . . . . . . . . . . . . . . . . . . . . . . . . . 38
Chapter 2: Utility Screens
Output . . . . . . . . . . . . . . . . . . . . . . . . . . 39
Calculator . . . . . . . . . . . . . . . . . . . . . . . 41
Notes Screen . . . . . . . . . . . . . . . . . . . . 53
Stopwatch . . . . . . . . . . . . . . . . . . . . . . . 54
Chapter 3: Settings and Files
Sensors Screen . . . . . . . . . . . . . . . . . . 55
Timing Screen . . . . . . . . . . . . . . . . . . . . 62
Data Properties . . . . . . . . . . . . . . . . . . . 69
Calibration . . . . . . . . . . . . . . . . . . . . . . . 71
Data Files Screen . . . . . . . . . . . . . . . . . 78
Settings Screen . . . . . . . . . . . . . . . . . . . 8 5
Chapter 5: Hardware Maintenance and
Operation
Firmware Update . . . . . . . . . . . . . . . . . 93
Battery and Power . . . . . . . . . . . . . . . . 93
Resetting . . . . . . . . . . . . . . . . . . . . . . . 96
Operating Te mperature . . . . . . . . . . . . 97
Chapter 6: Using the Xplorer GLX
with a Computer
GLX with DataStudio . . . . . . . . . . . . . . 99
GLX Simulator . . . . . . . . . . . . . . . . . . 103
Part 2:
Sample Activities
Activity 1: Calorimetry . . . . . . . . . . . . . 107
Activity 2: Melting Point Depressio n. . . 111
Activity 3: Heat Transfer by Radiation . 113
Activity 4: Newto n’s L aw of Cooling . . . 115
Activity 5: Microclimate Temperature
Variation. . . . . . . . . . . . . . . . 1 21
Activity 6: Voltage versus Resistance . 123
Activity 7: Induced Electromotive Force 127
Activity 8: Capacitor Discharge . . . . . . 131
Activity 9: Constructive and Destructive
Interference . . . . . . . . . . . . . 135
Activity 10: B eat Frequency . . . . . . . . . . 137
Chapter 4: Navigation and Input
Data Source Menus . . . . . . . . . . . . . . . 89
Multipress Text Input Mod e . . . . . . . . . . 90
Using a USB Keyboard . . . . . . . . . . . . . 90
Scientific Notation . . . . . . . . . . . . . . . . . 91
Printing . . . . . . . . . . . . . . . . . . . . . . . . . 91
Index 141
Shortcut Summary 143
Page 6

Page 7

Part 1: Users’ Guide
Page 8

Page 9

Xplorer GLX Users’ Guide 3
Introduction
The Xplorer GLX is a data collection, graphing, and analysis tool designed for scie nce students and educators. The Xplorer
GLX supports up to four PASPORT sensors simultaneously, in addition to two temperature probes and a volta ge probe connected directly to specialized ports.
An optional mouse, keyboard, or printer can be connect ed to the Xplorer GLX’s USB port s. The Xplorer GLX contains an
integrate d speaker for sound generation and a stereo signal output port for option al headphones or amplified speakers.
The Xplorer GLX is fully functional stand-alone handheld computing dev ice for science. It also operates as PASPORT sensor
interface when connected to a desktop or laptop computer running DataStudio software.
Page 10

4 Included Equipment
Included Equipment
A) GLX Users’ Guide
B) Xplorer GLX
A
B
C
D
EFGH
F) Two Fast-response Temperature Probes
(-10 to 70 °C)
C) AC Power Adapter
D) Registration Card
E) Getting Started with the Xplorer GLX CD-ROM
G) Voltage Probe (-10 to +10 V)
H) USB Host-connection Cable
I) Poster (not pictured)
Page 11
Xplorer GLX Users’ Guide 5
F1
Quick Start
Getting started with the GLX is easy —simply plug in the AC adapte r, connec t
one of the included se nsors, and collec t data. In the example below, you will start
the GLX and collect te mperature data.
1. Plug In the AC Adapter
Connect the AC adapter to the power port on the right side of the GLX and plug
the adapter into a power outlet (100 to 240 VAC, depending on your location).
When you connect the AC adapter, the GLX turns on automatically.
The first time you use the GLX, leave it plugged in overnight (at least 14 hours)
to allow th e b a t te r y to f ul ly charge.
If the battery has al ready been charged, you can use the GLX without the AC
adapter. To turn it on using battery power, push the power button at the lowerright corner of the keypad ( ) and hold it for about one second.
2. Connect a Sensor
Connect a temperature probe to one of the temperature ports on the left side of
the GLX.
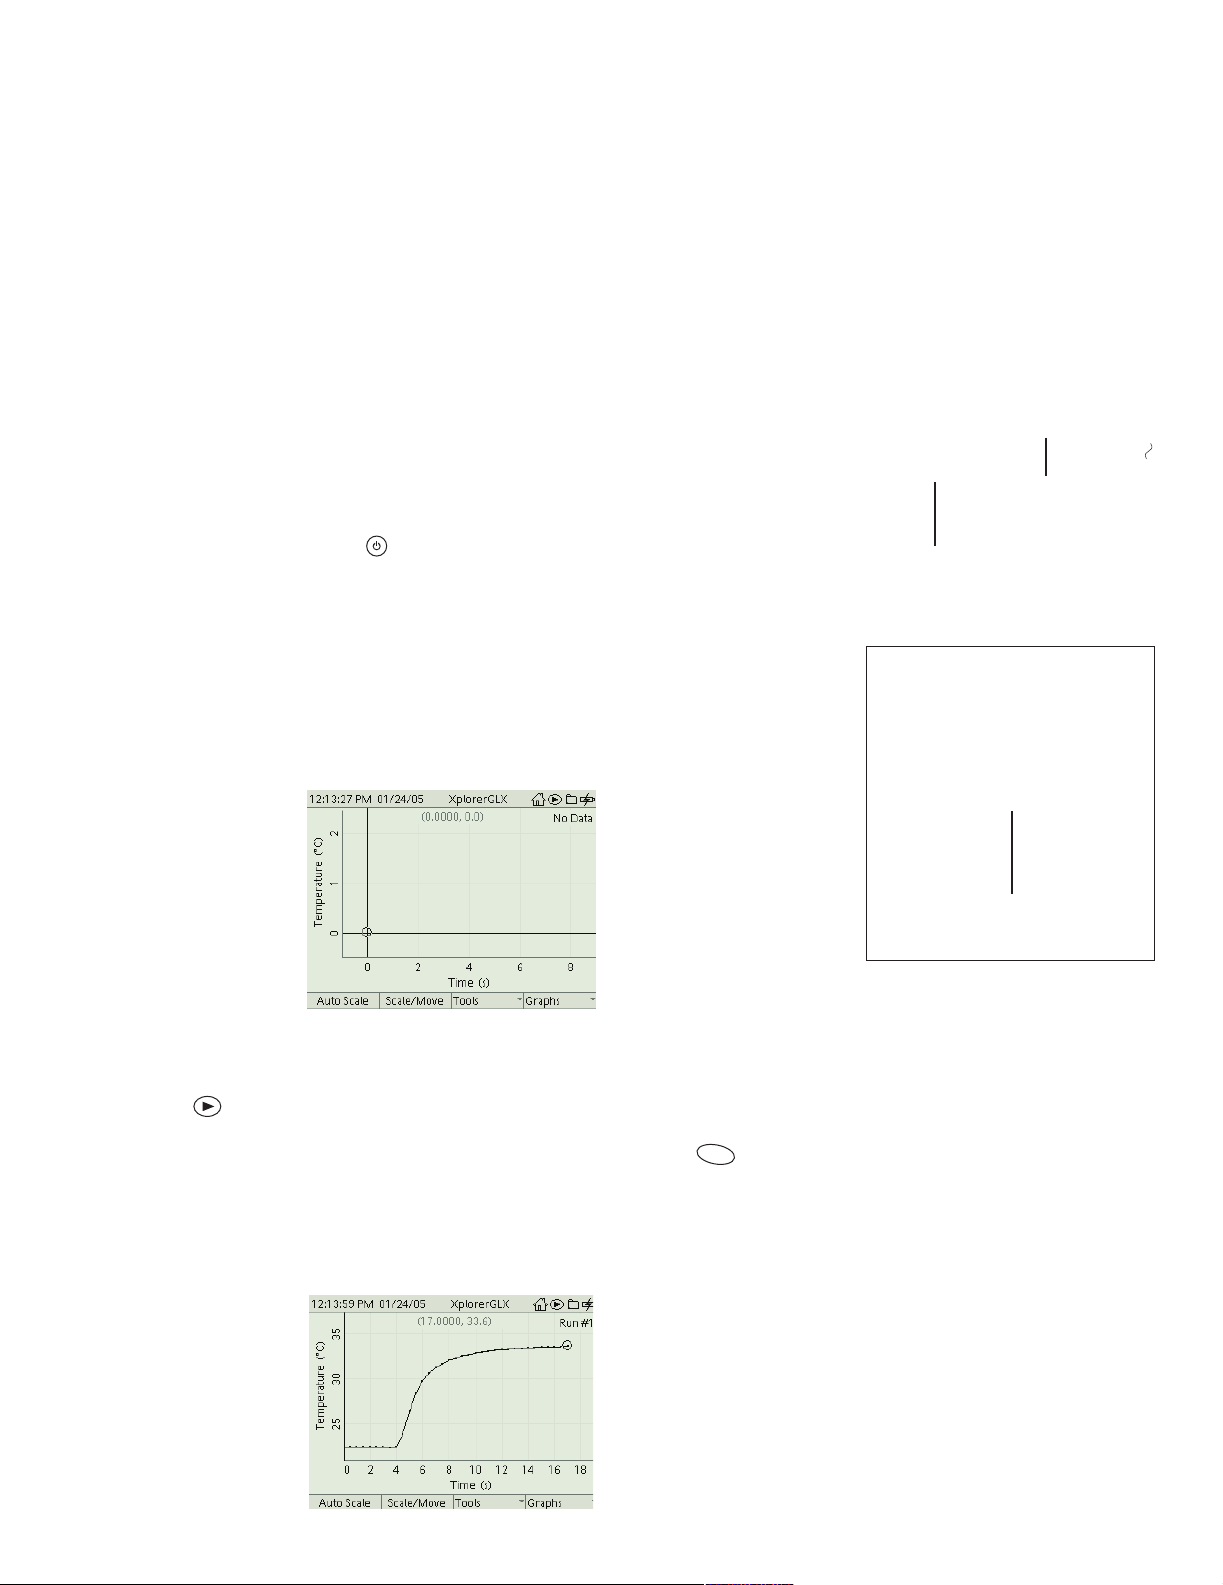
In most cases, the Gr ap h display will launch automatic ally with the axes labeled
“Temperatur e (° C ) ” an d “ Time (s ). ”
3. Collect Data
Connect the AC
power adapter
If running on
battery power,
press the
power button
Connect a
temperature probe
Press .
The GLX is now recording and graphi ng data from the sensor. Press to
automatically scale the gr ap h .
Hold the end of the temper ature probe in your hand and observe how the data
plotted on the Graph reac t.
Page 12
6 Overview of the GLX
To stop data recording, press again.
You have just collected and graphed a run of temperature data. To collect additional data runs, pres s again.
There are several different ways to collect data with the GLX. This is the simplest and most comm on. See “F1 Mode” on page57 for other options. You
can find a complete description of the Graph display starting on page 13.
Overview of the GLX
The exam p l e above represents j u st a small part of the GLX’s capabilities. Thi s
overview will outline so me of the set-up options to customize your GLX and pr epare it for an activit y; then (starting on page 9) survey the GLX’s Home Screen
as a gateway to th e entire GLX environm ent.
Equipment Set-up Options
Power Sourc e Whenever possible, it is a good idea to use the GLX connected
to the AC power supply. For maximum operating time on battery power, first
connect the GLX to AC power for at least 14 hours, or until the Batte r y Gauge
indicates a full charge.
1
1
See “Battery Gauge” on page 11.
Power On The power turns on au tomatically when you plug in th e AC adapter.
If the GLX is running on batter ies, or if the AC adapter is already connected,
push and hold the power b utton ( ) for about 1 second to turn it on.
By default , the GLX is set to start with a new dat a file; however, if the Startup
Action of the GLX has been s et to “Open Las t Experiment,” it will automatically
open the most recently saved file. See page 86 for more information.
Back Light To turn on the screen’s back light, press and hold while you
press .
2
Screen Contrast There are 21 levels of screen contrast. Push and hold ,
then use the up and down arrow keys ( ) to adjust the c ontrast to a comf ortable
level.
Language In its factory configuration, the GLX is set up to operate in English.
If you would like to change the language, refer to “Settings Screen” on page 85.
PASPORT Sensors Connect up to four PASP ORT sensors to the main ports
on top of the GLX.
In some cases, the GLX may automat ica lly launch the Graph or other displa y
when you plug in a sensor. See “Sensor Auto-Dis play” on page 86 for more
information about this feature.
Temperature Probe s Connect the included fast-response probes or other
PASCO temperature probes to the two temperature ports on the left side of the
GLX. The range is -10 to +70 °C with fast-response probes, or -10 to +135 °C
with stainless steel probes .
2
The backlight and other aspects of the
Xplorer GLX can also be adjusted in the
Settings Screen. See page 85.
Temperature
Probes
PASPORT
Sensor Ports
Signal
Output
Security Cable
Connection Slot
Voltage
Probe
Voltage Probe Connect the included voltage probe to the voltage port on the
left side of the GLX to measure voltages between -10 and +10 V. The voltage
probe should be connected to voltage sources only when it is also connected to
Page 13
Xplorer GLX Users’ Guide 7
the GLX. Do not connec t a vo ltage sourc e until af ter the pro be is connec ted t o th e
GLX; remove any voltage s ources before disconnect ing the probe.
Sound Sens o r To configure the GLX’s microphone as a sound sensor , press
F4
and together to enter the Sens ors screen; then press to open the
F3
Microphone menu. From the menu, select Sound Sensor to record the sound
waveforms, or select Sound Level to measure sound level in decibels. See “F3
Microphone” on page 58 for more information.
Computer If you will be using the GLX with a computer , use the incl uded USB
host-connection cable to connect the GLX to the USB port of the c omp uter.
Refer to page 99 for instructions on setting up the computer.
Mouse If you will be using an optional mouse (PS-25 39), conne ct it to the USB
port on the right si de of the GLX.
A mouse can be convenient, but it is never required; anything that you can do
with the mouse can also be done through the GLX’s keypad. New users often
find that operating the GLX is easier with a mouse. For experienc ed users, using
the keypad rather than a mouse is usually faster.
Keyboard If you plan to do a lot of text entry , connect a USB keyboard
(PS-2541) to the port on the right side of the GLX.
To connect a mous e and a keyboa rd simultaneously, use the optional
PS-2536 Peripheral Cable.
Sign al Output If you have headphones or a pair of amplified stereo speakers
that you wis h to use for sound generation, connect them t o the signal output port.
You also have the option of using the GLX’s built-in sp eaker for sound output.
See “Output” on page 39 for more information.
Computer via USB
host-connection cable
or
Mouse, keyboard or
printer through optional
peripheral cable
USB mouse,
keyboard, printer,
storage device,
or 2nd GLX
AC power
adapter
USB Storage Device If you have a USB storage device (such as a flash drive)
you can connect it to the GLX’s USB port for extra file -stora ge capaci ty and data
backup. See page 83 for more information.
GLX-to-GLX Transfer If you have two GLXs that you would like to transfer
files between, connect them using the included host-connection cable. See
page 84 for more information.
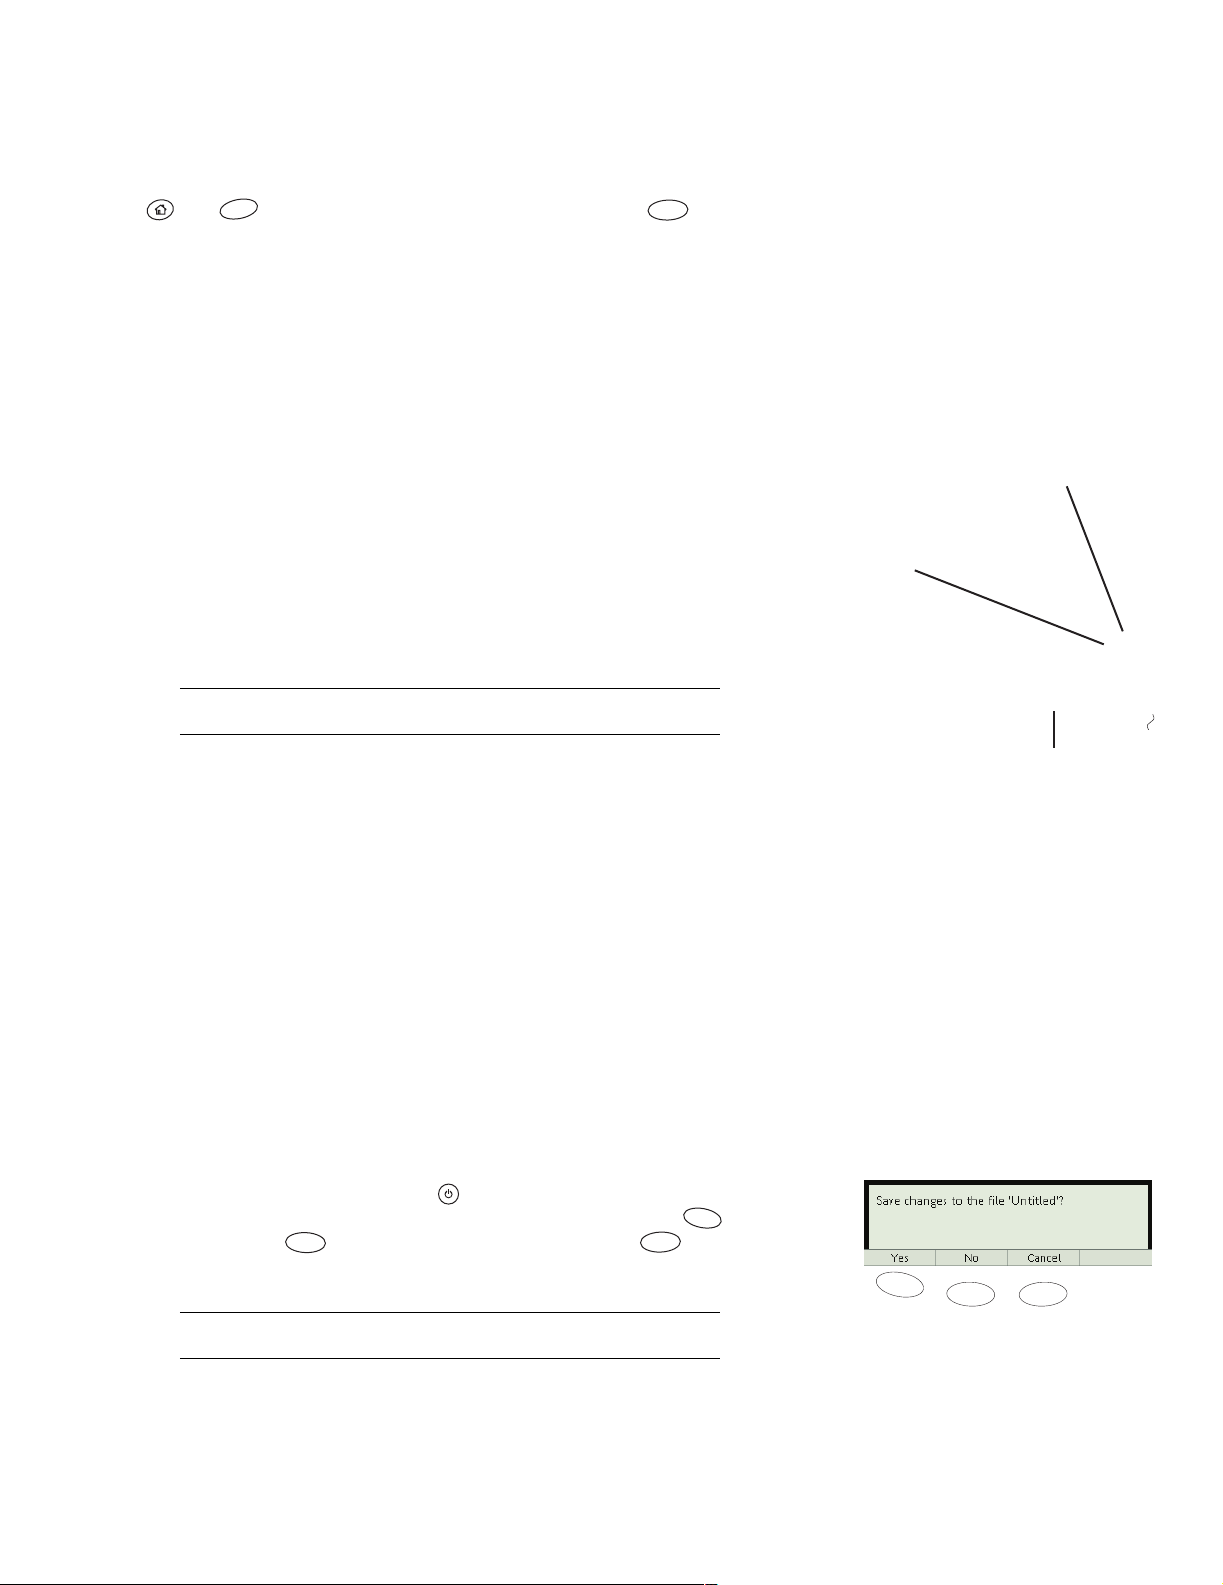
Shutting Down
Manual Shut Down
To turn off the GLX, pres s and hold for 1 second. The GLX will prompt you
to save your data and experiment setup before it shuts down. Press to save
your work, press to shut down without savin g, or press to not shut
F2
down. See page 80 for instructions on opening the saved file.
If you hold the power button for 5 seconds, the GLX will shut down without
saving your data.
The GLX cannot shut down while the ba ttery is charging; if you try to turn it off,
a message will appear informing you that charging is in progress. When the battery is fully charged, and the GLX h as been idle fo r 60 minutes, i t will shut do wn
automatically (see below).
F1
F3
F1
F3F2
Page 14
8 Overview of the GLX
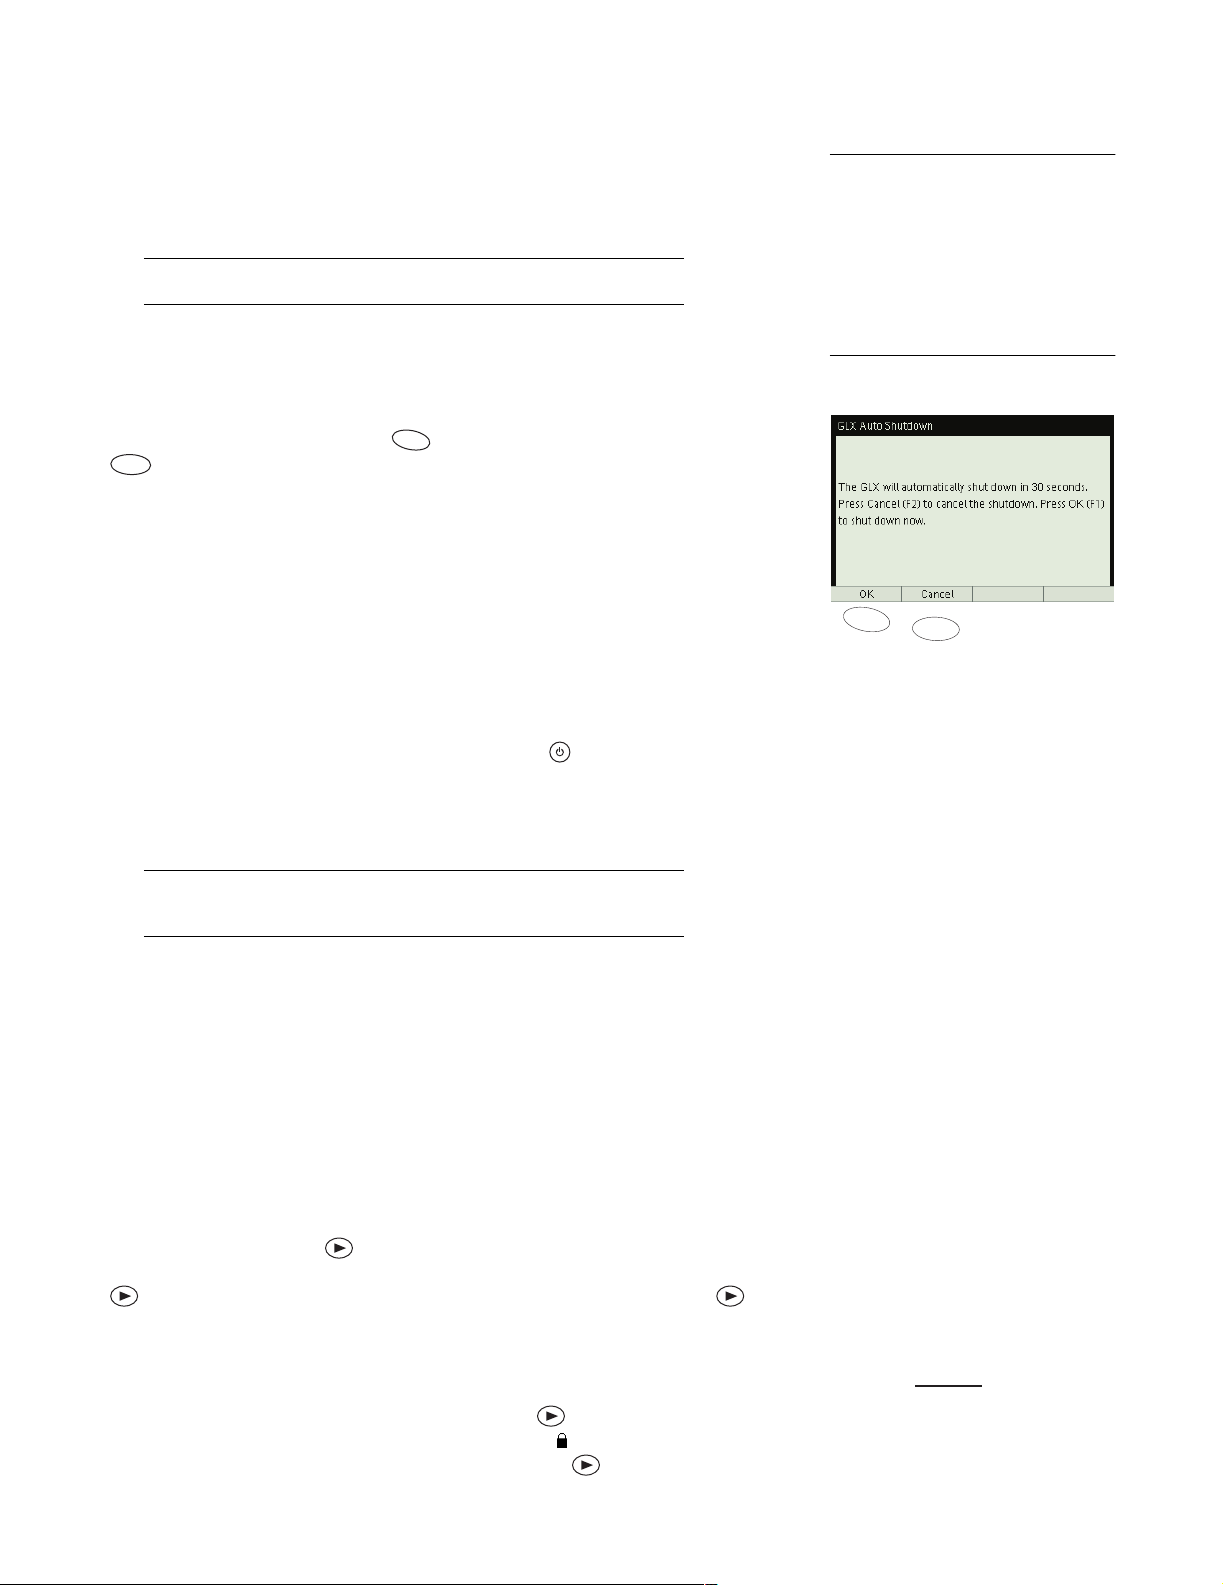
Auto Power Off
Timed Auto Power Off If it is running on battery power, the GLX will auto-
matically save your data and shut down after a certain a mount of continuous idle
time (5 minutes by default).
To set the idle time that must elapse before auto shut down on battery
power, see “Auto Power Off” on page 85.
3
If the GLX is running on AC power and the batte r y is fully charged, it will automatically shut down after 60 minutes of idle time .
The GLX will warn you t hat it i s abou t to shu t down 3 0 seconds before i t act ually
does. If you see the warnin g, pre ss to procee d with the shutdown, or press
F2
to keep t h e G LX tu rned on.
F1
Battery Auto Power Off The GLX wi ll also save data and shut down automatically if the batteries drain to a critical level. Connect AC power before turning
the GLX back on.
Auto Data Save Just before the GLX shuts down, it will save the open file
(which include s all data, displays, calculations and set-up information). If you
have named the file, it will be saved under that name. If you have not named the
file, it will be saved with the filename “Untitled.”
Res umin g after Auto Power Off To resume your work after the GLX automatically shut s down, push and hold the p ower bu tton ( ) for about 1 se cond to
turn it on. If the automatically saved file does not open automatically, go to the
Data Files screen ( see page 78) and open the file . (See pa ge 80 for instructions on
opening a file.)
3
The GLX is considered idle when
not
•the GLX is
• the Stopwatch is
•the GLX is
puter running Da taStudio, and
•the GLX is
its keypad, a mouse, or a USB keyboard.
F1
collec tin g data,
not
running,
not
connec te d t o a co m-
not
receiving input through
F2
If you have set the Startup Action of the GLX to “Open Last Experiment,” the
file will auto matically open when you tur n on the GL X. See pa ge86 for more
information.
Sleep Between Samples If the GLX is running on battery power and collecting data at a rate of once eve r y 30 s or slower, and it has been otherwise idle for
the set auto-power-off time (see page 85), it will “sleep ” between sam p les. When
the GLX is sleeping, the scre en a nd any co nnected sensors are turned off to save
power , and the green LED on the front of the unit blinks onc e every two sec onds.
When it is time to collect a data point, the GLX wakes up briefly, records data,
and goes back to sleep. Press any key to wake up the GLX.
The Record Button
Default Recording Mode Whenever you have one or more sens ors connected
to the GLX, you can press to start data col lection. In its default mode, the
GLX will begin recording data continuously from all connected sensors. Press
again to stop data collection. To start recording another data run, press
yet again.
Sticky Start Use the Sticky Start feature to prevent data collection from being
unintentionally stopped when you take the GLX on an amuseme nt park ride. To
start data collection with Sticky Start, press and hold for about 5 seconds.
You will hear three beeps and see the St icky Start icon ( ) appear at the top of
the screen. Data recording will continue after you release . To stop dat a
Record Button
Page 15
Xplorer GLX Users’ Guide 9
recording, you mus t pres s and hold until you hear three beeps again. Data
recording will stop when you release .
Alternative Recording Modes If you have put the GLX into Manual Sampling mode (see page 57), it will not start r ecordin g when you press ; rather it
will stand by to record a data point whenever you press . If you have turned
on the Trigger in the Graph display (see page 20), then the GLX will delay the
start of recording after you press until the specified trigger condition is
reached.
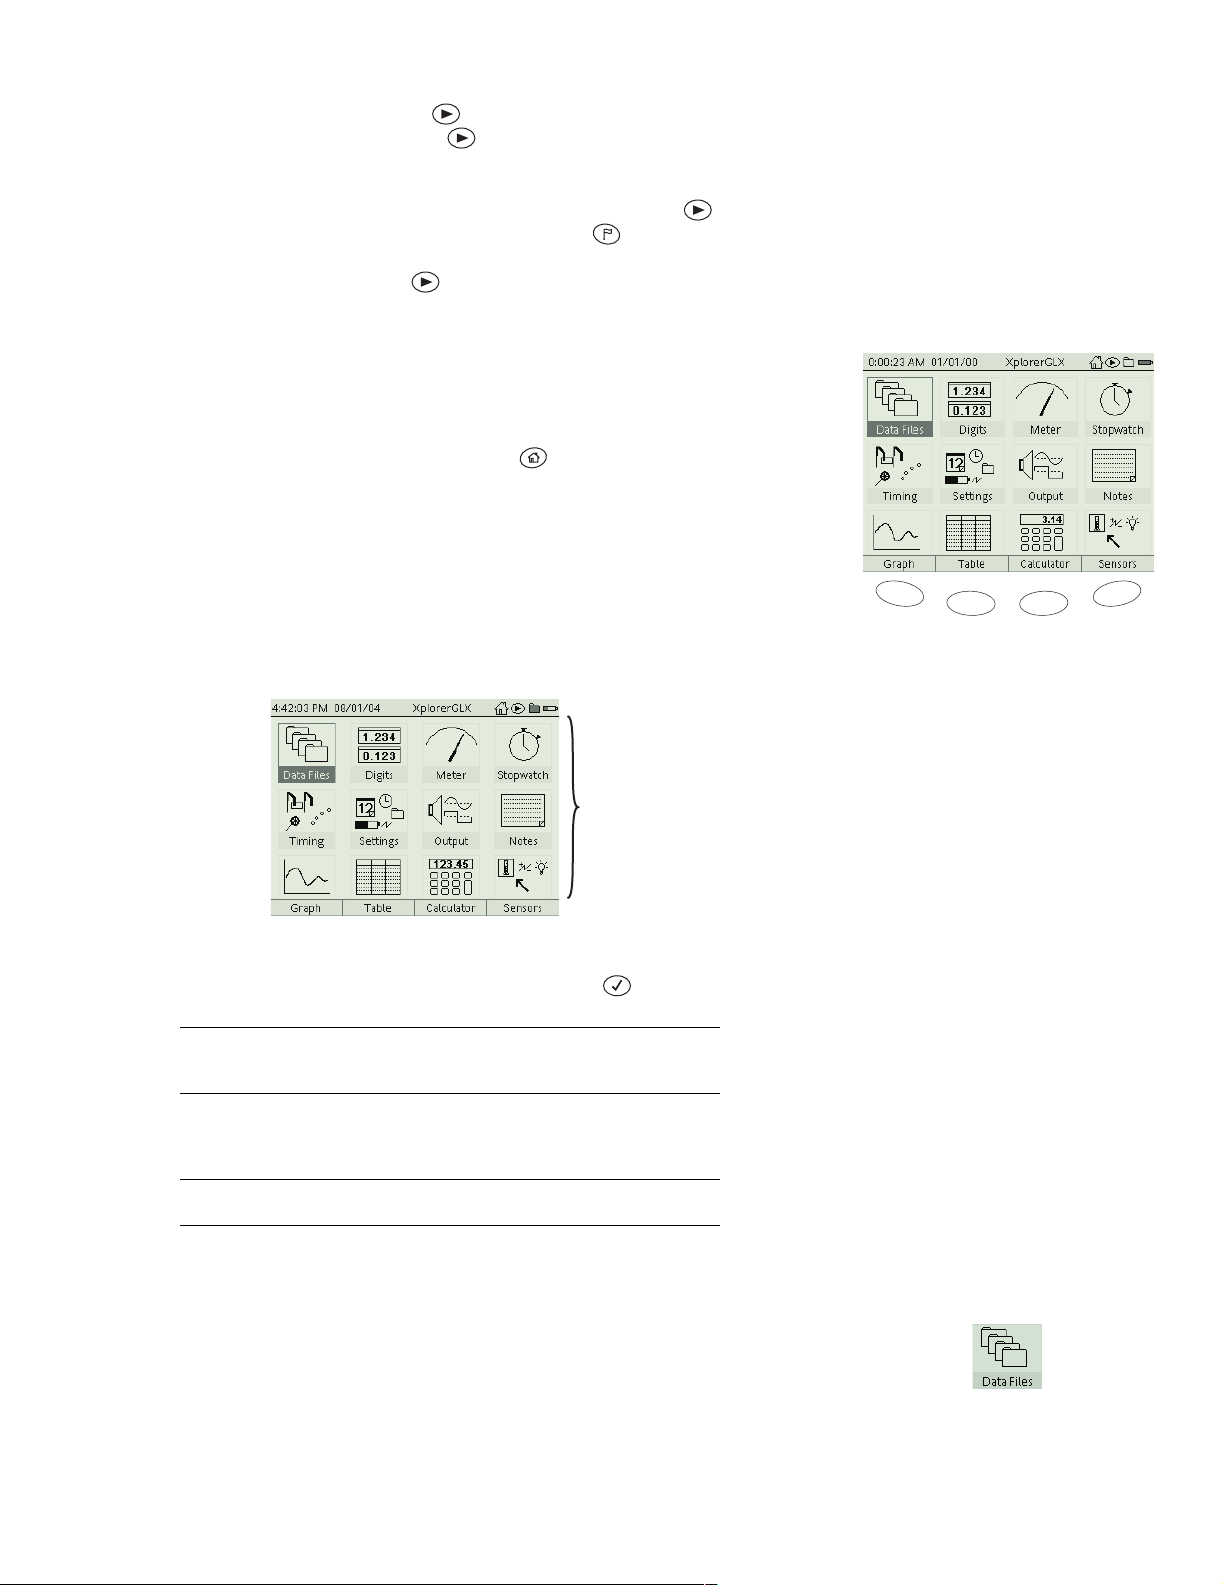
Home Screen
The Home Screen is the center of the GLX environment. All other screens are
just one step away from th e Home Scree n. From any other screen, you can
always return to the Home Screen by pressing .
The Home Screen consists of three sections: the Mai n Icons , the Bottom Row,
and the Top Bar.
Main Icons
The main icons on the Home Screen lead to the other screens of the GLX environment.
Main
Icons
To open another screen via one of the main icons, use the up, down, left, and
right arrow keys to highlight the desired icon, then press .
The highlight wraps around, so you can move it to any icon within three key
presses. For instance, if the highlight is in the first column, and you want to
move it to the fourth column, press the left arrow key once.
Alternative ly, if you are using a mouse, simply cli ck on the desired icon.
F1
The Hom e Scr e en
F3F2
F4
Y o u ca n a ls o acce ss t h e fou r ico ns in th e bot t om ro w us in g t he fu nc ti on ke ys .
See “Bottom Row” on page 10 for more information.
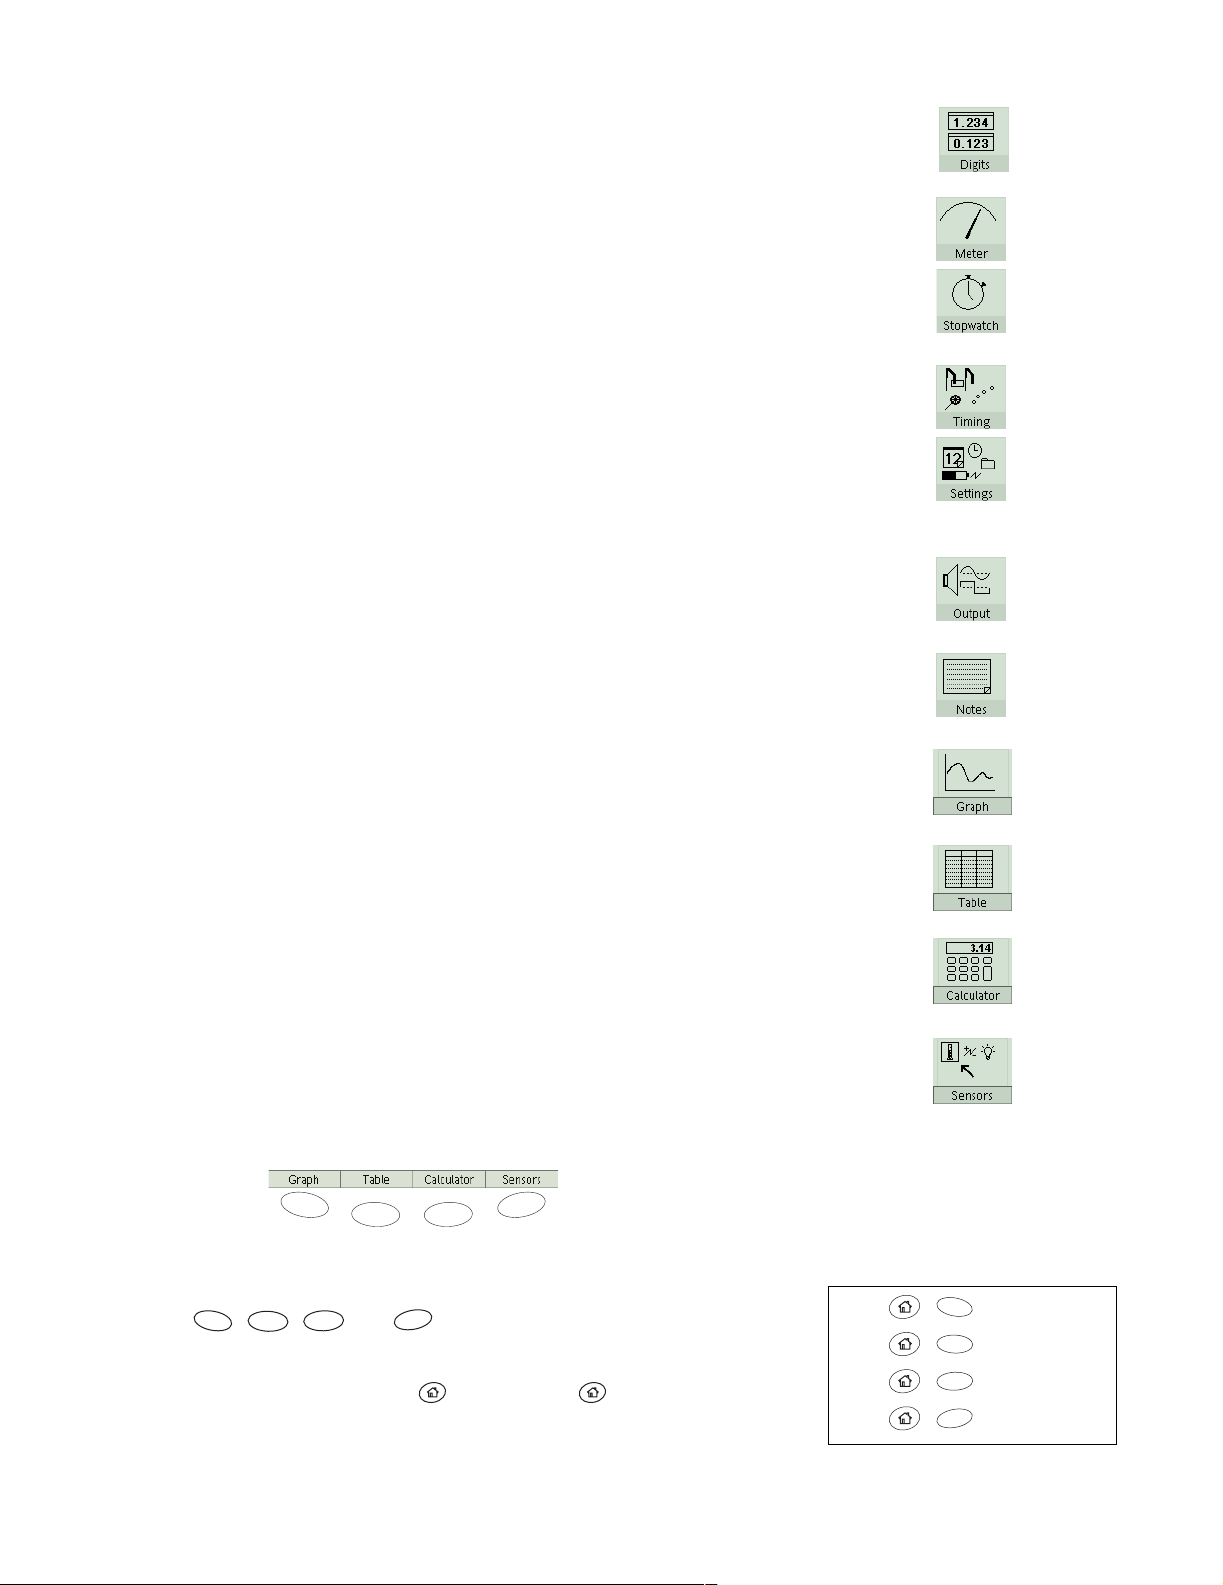
The icons and the screens they le ad to are descri bed briefly here, and i n more
detail elsewhere in the following chapters.
Data Files Once you have collected data or configured the GLX for an experiment, you can go to the Data Fil es sc ree n to save your work. You can also open
or delete save d file s and mana ge the dis plays , se nsors, calc ulati ons, and manuall y
entered data sets that are part of a data file. See page78 for more information.
Page 16
10 Overview of the GLX
Digits This screen is useful for displ aying live data as they are collected from
sensors and calculat ion s. Up to six data sourc es can be display ed simult aneously.
See page 37 for more information.
Meter This display simulates an analog meter with a ne edle that deflects in proportion to a measur ement made by a sensor. See page 38 for more information.
Stopwatch With this screen, th e GLX can be used like a regular stopwatch to
time events. T he stopwatch is started a nd stopped by the user t hrough the GLX’s
keypad, so no sensors are necessary. See page 54 for more information.
Timing Use the Timing scre en to conf igure photoga tes, Super Pulleys , and ot her
switch-type or counting-type digita l sensors. See page 62 for more information.
Settings Go to the Settings screen to cha nge the GLX’s name, time and date,
and screen sett ing s, set how lon g the GLX wai ts be fore aut omati call y tur ning of f,
and control how the GLX behaves when you turn it on or connect a sensor. See
page 85 for more information.
Output The Output screen contains the controls for the signal that the GLX generates and outputs through the built-in speaker, or through the signal output port
to headphones or amplified speakers. See page 39 for more information.
Notes In the Notes screen, you can create, read, and edit pages of text notes to
be saved along with an experiment configuration or collected data. See page 53
for more information.
Graph Use the Graph to plot and analyze data. In many cases, the Graph is the
best way to view data as they are being collected. See page 13 for more information.
Table The Table displa ys data numerical ly in colum ns. It can be used for edi tin g
and entering data and for statistical analysis. See page 28 for more information.
Calculator You can use the calculator like a regular ca lculator for finding the
result of a simple expression and like a graphing calculator for plot ting equation s.
The calculator can also perform operations on streams of data collected from sensors and on sets of manually ent ered data. See page 41 for more information.
Sensors Us e the Sensors screen to cus tom ize the way sensors colle ct data. The
screen shows which sensors are connected to the GLX and contains controls for
how each sensor operates. See page 85 for more information.
Bottom Row
F1
F3F2
F4
Bottom Row
The icons in the bott om row of the Home Screen are selectable via the four function keys: , , , and . Graph, Ta ble, Calculator, and Sensors
F1
F3
F2
F4
are th e mos t c om mon ly us e d scr een s, and t he refo r e t he mo st e as il y ac ce ss ibl e. To
make the bottom row of the Home Scr ee n appear temporarily from anywhere in
the GLX environment, press and hold ; while holding , press one of the
function keys to open the corresponding screen.
In other screens, yo u will usu ally see four choices at the bottom of the scre en that
can be accessed with the function keys.
F1
+
+
+
+
Shortcuts from anywhere in the GLX
environment
F2
F3
F4
Graph
Table
Calculator
Sensors
Page 17
Xplorer GLX Users’ Guide 11
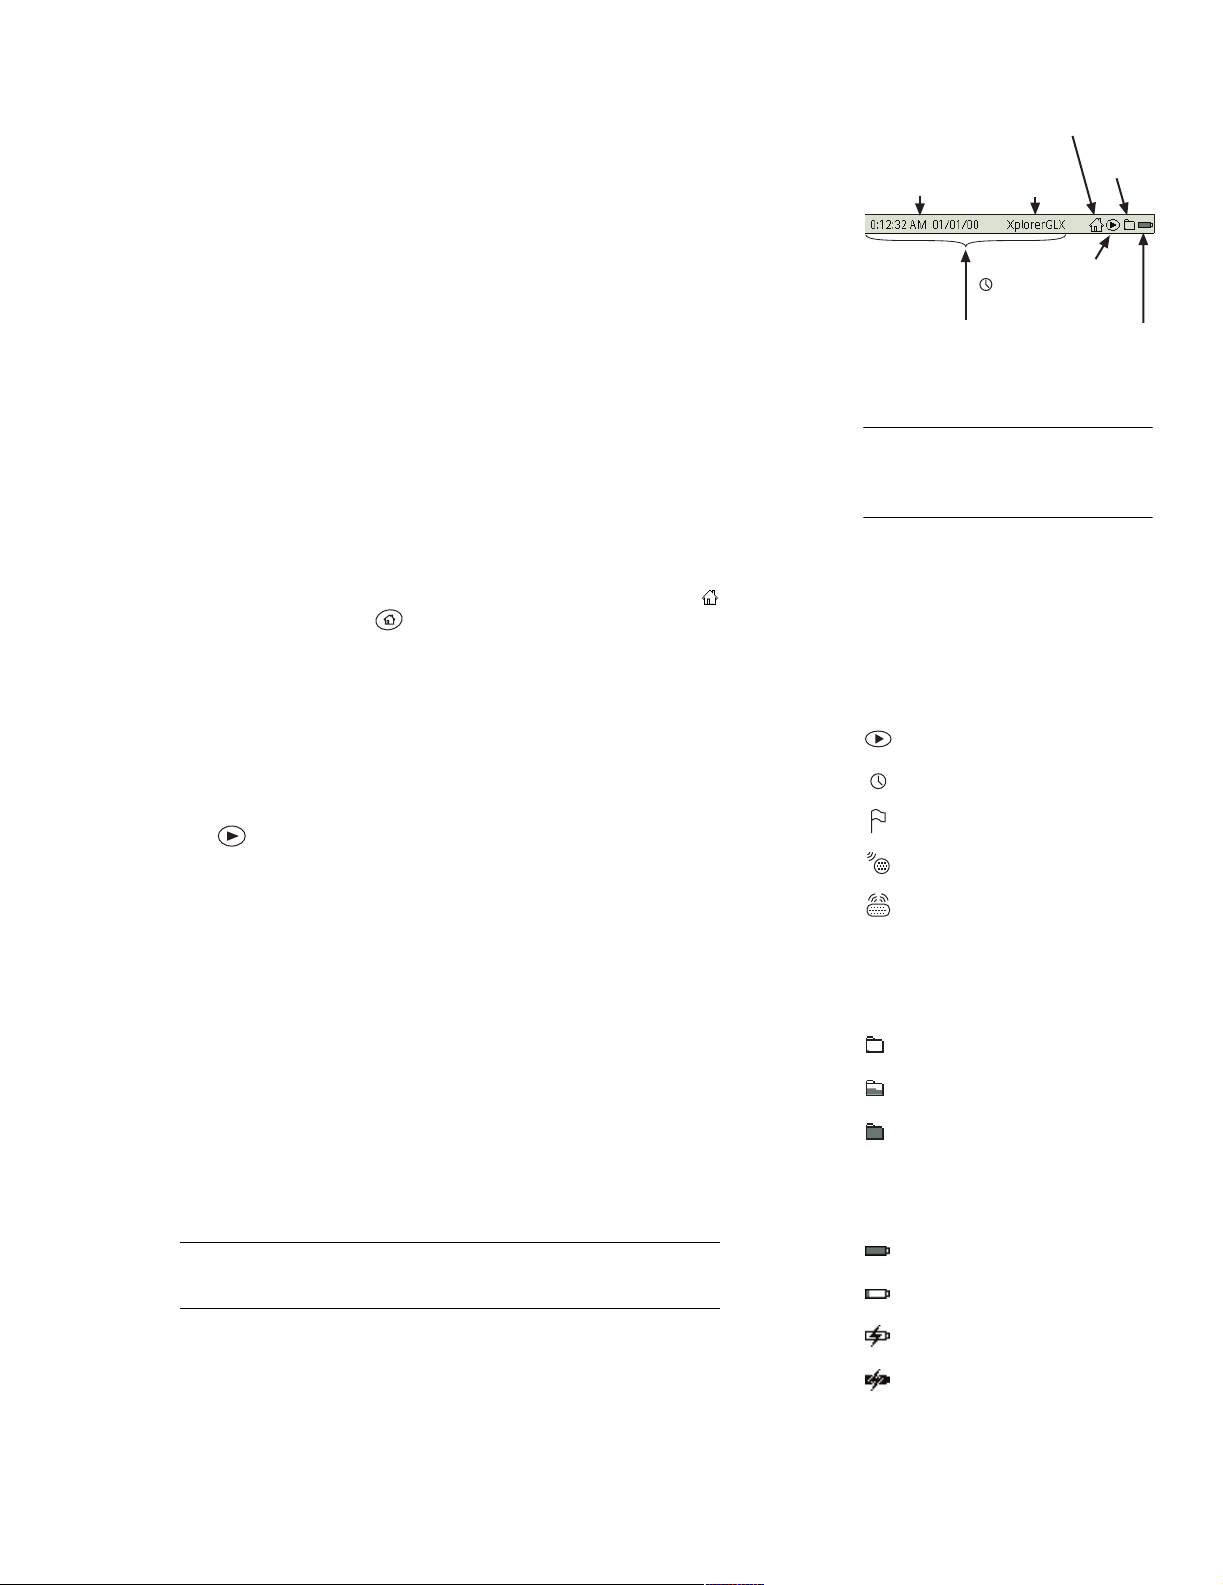
Top Bar
The Top Bar is the part of the Home Screen that is a lways visible from anywhere
in the GLX envi ronm ent. It shows the tim e and date and the na me of the GLX or
the name of the open file. It also indicates the recording status, battery level and
memory usage.
Tim e and Date The time and date displayed in the Top Bar are set automatically when you connect the GLX to a computer running DataStudio (see
page 99). You can also go to the Setti ngs screen (see page 85) to set the time and
date manually and change the format in which they are displayed.
GLX Name By default, the name displayed in the Top Bar is “XplorerGLX.” If
you are usin g more t han one GLX in yo ur cl assroom or lab , you ma y wish t o give
each one a unique name. See “Settings Screen” on page 85 for instructions.
When a previously saved filed is open, the name of that file appears in place of
the GLX Name. See page 78 for more information about s aving and opening
files.
Home Icon If you are using a mouse, you can click the Home Icon ( ) in the
Top Bar, instead of pressing on the keypad, to return to the Home Screen
from any other screen in the GLX environment.
Recording Status The Recording Stat us icon changes to indicate when the
GLX is collecting data, and in what sampling mode it is operating (see page 57
for more information about the sampling modes). It also indicates when an audio
note is being recorded or played (see “Data Annotation” on page 25).
If you are using a mouse, you can click the Recording Status icon, instead of
pressing on the keypad, to start and stop data collection.
Memory Ga uge The Mem o ry Gauge indicates the G LX ’s availabl e memory.
As data are stored in random acces s memory (RAM), the icon becomes shaded
from the bott om up. An enti rely sh ade d ico n means tha t the re is li tt le or no ca pacity remaining for recording data. See “Data Files Screen” on page 78 for instructions on deleting files or data runs to make more memor y available.
If you are usi ng a mouse , you ca n clic k th e Memory Gaug e to open the Data Fil es
screen, start a new file, or save the file that you are working with. (Without a
mouse, the Data File s scree n, which include s the Ne w File and Save File opti ons,
is accessed through the Home Screen; see page 78.)
Battery Gauge When the GLX is running on battery power, the Battery Gauge
indicates the level of charge of the battery. It is fully charged when the entire
gauge is shaded.
4
Home
Icon
Memory
Time and Date
4
The time c an b e di sp laye d i n 12 -ho ur or
24-hour format; the date can be displayed as month/d ay/year or
day/month/year.
Recording Status Icons
Not Collecting Data
Sampling in Continuous Mode
Sampling in Manual Mode
Recording Audio Note
Playing Audio Note
Memory Gauge Icons
Most RAM free
RAM about half free
RAM almost full
Battery Gauge Icons
GLX Name
or File Name
Recording Indicator
when recording
(click to start and stop)
Click to
access Settings
Top Bar
Gauge
Battery
Gauge
Each GL X learns the particular charge and discha rge characteristics of its
battery as it is used. To make the gauge more accurate, allow the battery to
fully charge, then fully discharge at least once.
The Battery Gauge al so indicates when the GLX is connected to AC power and
charging the battery.
Battery fully charged
Battery nearly empty
AC power connected; battery
charging
AC power connected; battery
fully charged
Page 18

12 Overview of the GLX
Page 19
Xplorer GLX Users’ Guide 13
Chapter 1: Displays
The GLX has four screens for displaying data: Graph, Table, Digits, and Meter.
This chapter will describe the structure and use of each display.
Open any of the displ ays t o monito r liv e data as it i s col lecte d. Open t he Graph or
Table to view previously recorded measurements or manually entered data.
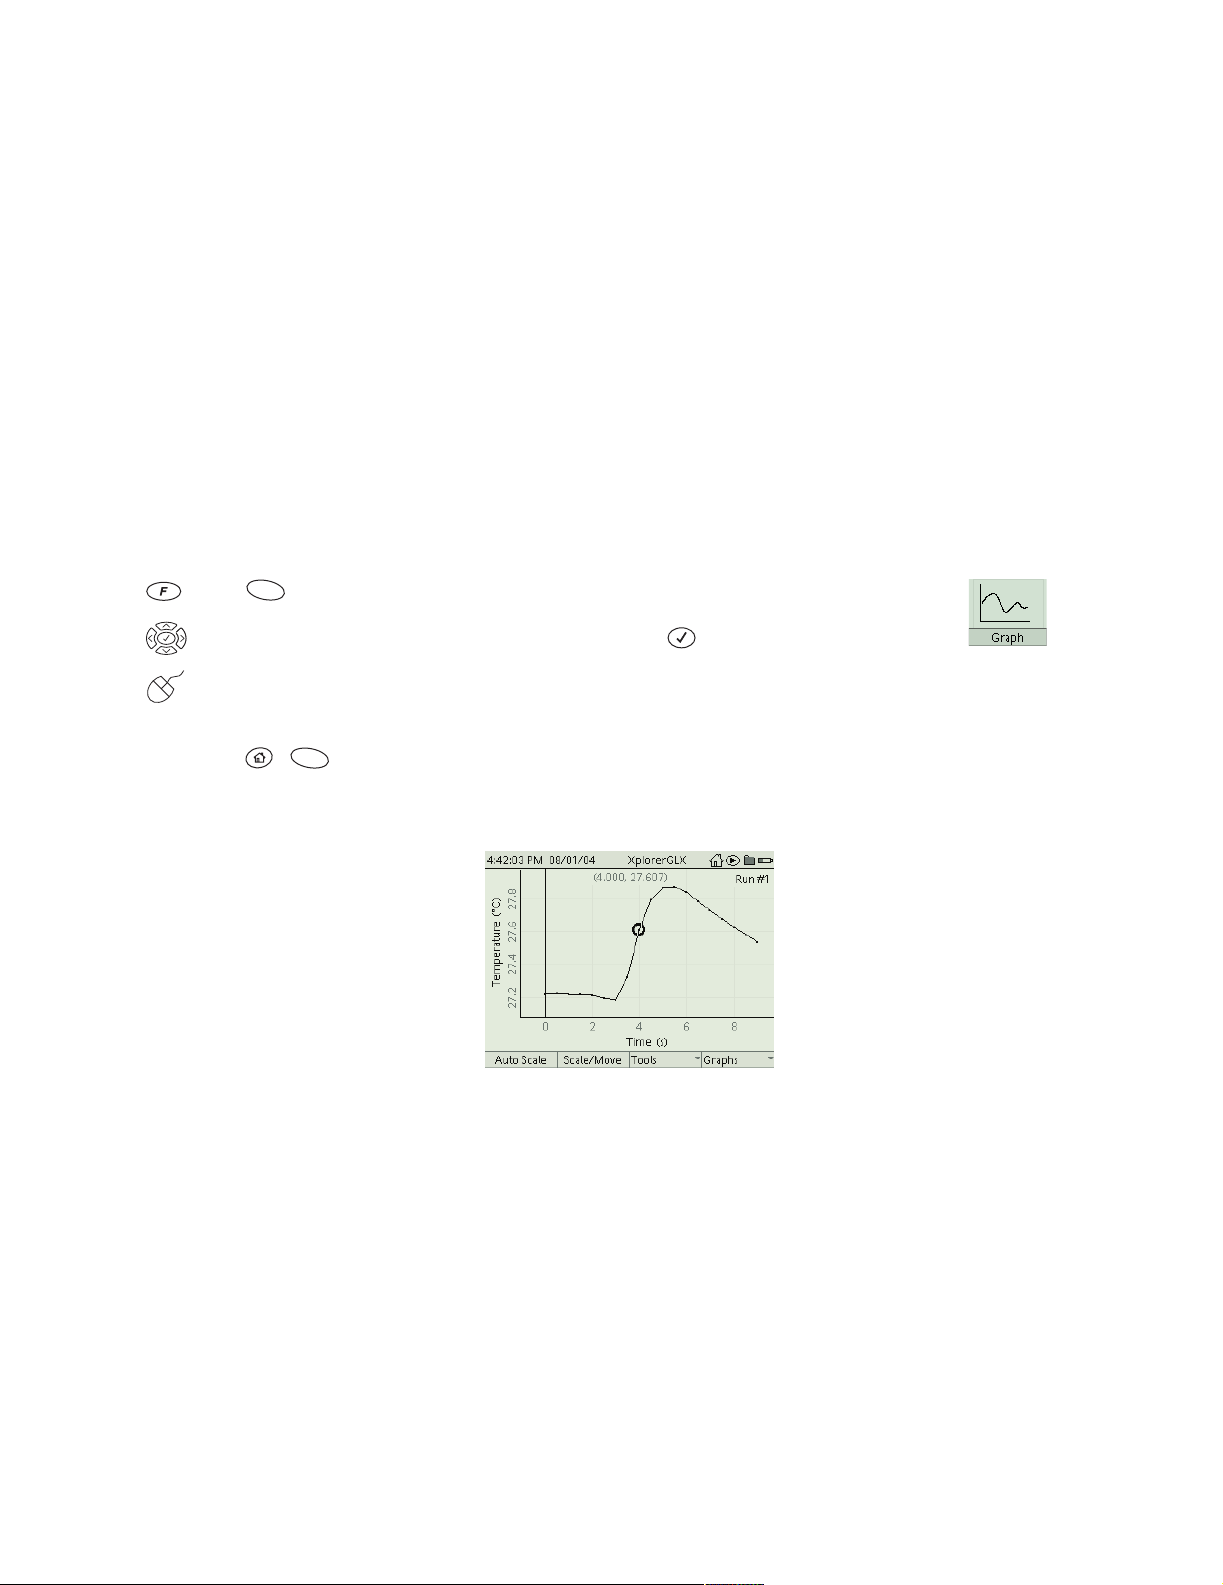
Graph
The Graph plot s da ta on a pair of axes. Use the Graph to view, compare, and analyze da ta sets.
To Open the Graph
From the Home Screen, do one of the following:
press , the function key below the Graph icon;
use the arrow keys to highlight the Graph icon, then press ; or
click the Graph icon.
From anywhere in the GLX environment, you can always open the Graph with
the shortcut + .
In some cases, the Graph opens automatically when you connect a sensor.
F1
F1
The Graph Display
The Graph icon on
the Home Screen
Page 20
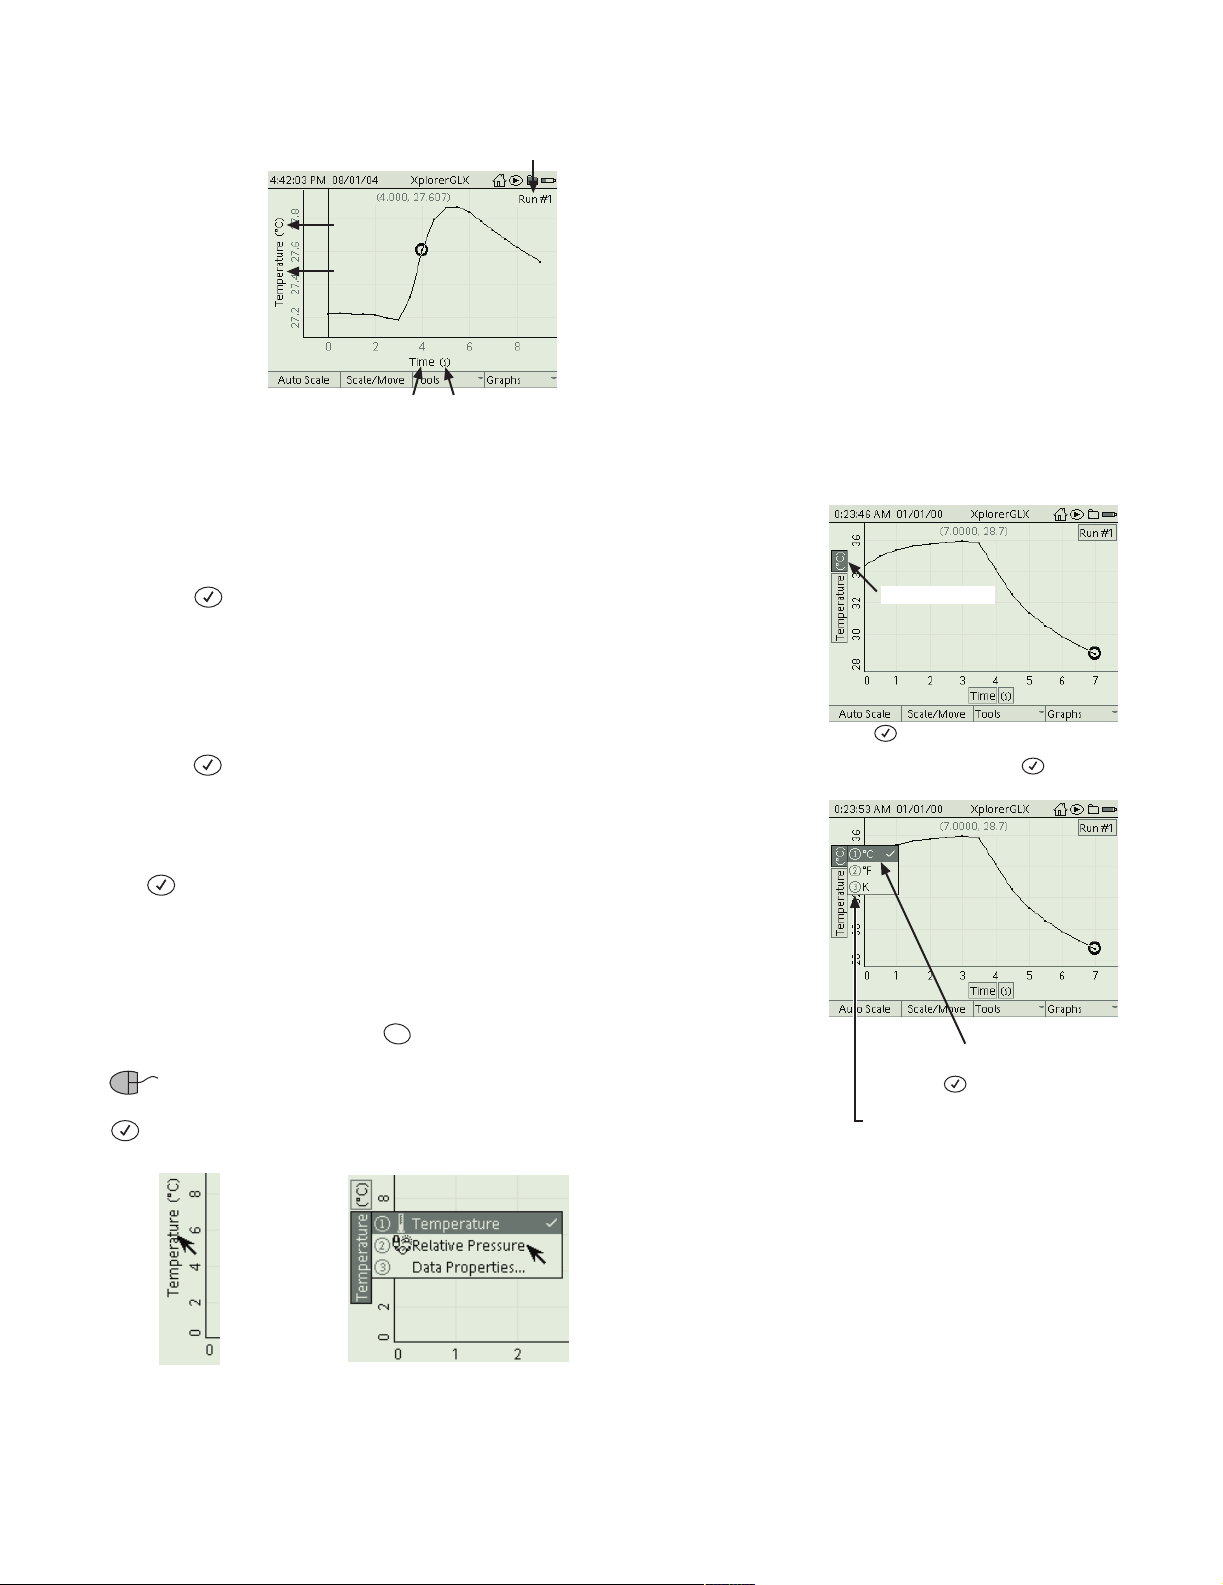
14 Graph
Active Fields
Run Number
Units
Data
Source
Data Source Units
Active fields of the Graph
Active fields are the areas on the Graph (and other display screens) through
which you control wha t data are shown. When you select an active field, a menu
opens containing choices of data source, units, or run number. Follow the steps
below to select an active field using the keypad.
1. Press to “light up” the active fields—shaded boxes appear around the
active fields.
2. One of the shaded boxes is darker than the others, designating the highlighted field. Use the arrow keys to move the highlight to the field that you
would like to select.
3. Press aga in to s elec t the hi ghli ghted fi eld, whic h causes a menu to open .
To select an option from the menu:
• use the up and down keys to highlight the desired menu option, then press
;
or
• press the number on the keypad corresponding to the desired menu option.
To turn off the highlight without selecti ng one of the fields, or to close a menu
without selecting an option, press .
Esc
If you are using a mouse, you can left- click an active field to s elect it and
open the menu, then c lick one of the menu options. (It is not necessary to press
first.)
Selecting a field with the keypad
Highlighted field
Press to light up the active fields.
Use the arrows to move the highlight to
the desired field and press to open
the menu.
Use the arrow keys to move the
highlight to the desired menu option,
then press ;
or
on the keypad, press the number
corresponding to the desired option.
Left-click
one of the
active fields.
Selecting a field with the mouse
Left-click the
desired
menu option.
Page 21
Xplorer GLX Users’ Guide 15
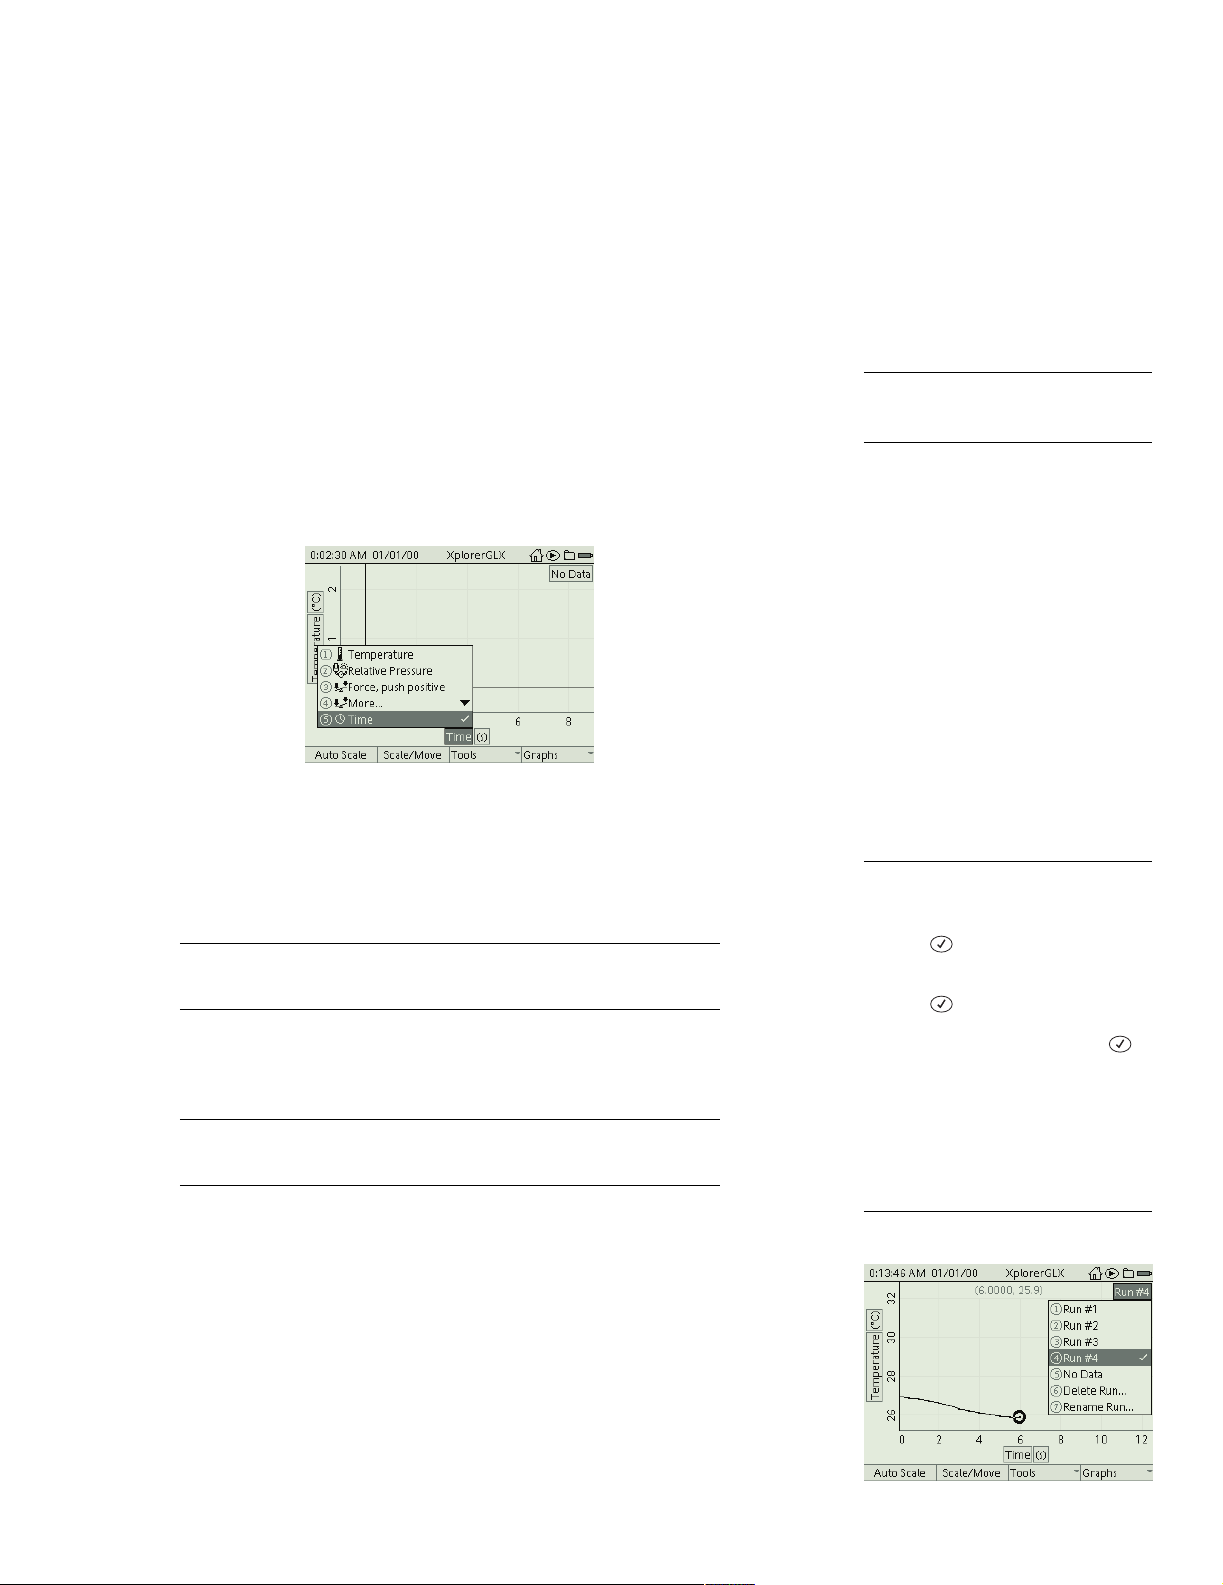
Choosing Data to Display
Data Source A graph is generated from two data sources: one on the vertical
axis and one on the horizontal axis. The possible types of data source are
• a sensor measurement,
• time (horizontal axis only),
•a calculation,
• manually entered numeric da ta, and
• manually entered text data (horizontal axis only).
If you configure the Graph with data sources that already c ontain data, the data
will appear immediately. If the selected data sources have not yet collected data,
the Graph will initially be blank; when
data collection starts, each data point will
be plotted as it is acquired.
1
1
For mor e information on calculations,
see page 41 . For more information on
manual ly entered data see page 32.
Data source menu for the horizontal axis
If th ere is at least one sensor connected to the GLX, the Graph will automatically
set one of the sensor measurements as the vertical data so u r ce, with time as the
horizontal da ta source. Select the verti cal or horizontal data source field
2
to
choose a different source.
When you chose a data source, it replaces the previously displayed one.
See “Two Measurements” on page 23 and “Two Graphs” on page 24 for
instructions on displaying two vertical data sources simultaneously.
If you do not see the s ensor measurement that you want in the data source men u,
select More to expand the menu.
For more information on selecting data from the Data Source menu when
you are working with more than one sensor, or with a multiple-measurement
sensor, see “Data Source Menus” on page 89.
Also from the Data Source menu, you can select Properties to edit the name and
other properties of the currently displayed data set. See “Data Properties” on
page 69 for more information.
Units Select the units field
2
to choose dif ferent units (i f avail able) for the chosen
data source.
2
T o select a data source, units, or run
number field
Keypad
1. Press to light up the active fields.
2. Use the arrow keys to move the high-
light to the desired field.
3. Press again to open the menu.
4. Us e th e ar ro w key s to hi gh lig ht the
desired menu option and press ;
or
press the number on the keypad
corres ponding to the des ir e d me nu
option.
Mouse
1. Click the desired field to open the
menu.
2. Click the desired menu option.
Run Number Sele ct th e r un number fiel d
can also choose to display no data.
2
to choose a different data run. You
Run number menu
Page 22
16 Graph
In normal mode, one data set is displayed at a time. See “Two Runs” on
page 24 for instructions on displaying two runs simultaneously.
The next-to-las t option in the run number menu is Delete Run, which deletes the
currently displayed run. That run will be deleted from all measurements, not just
the one displayed in the Graph.
The last option in the run number menu is Rename Run. By default, data runs are
names “Run #1,” “Run #2,” etc. When you select Rename Run, the GLX
prompts you for a new run name. Enter the new name us ing multipress text entry
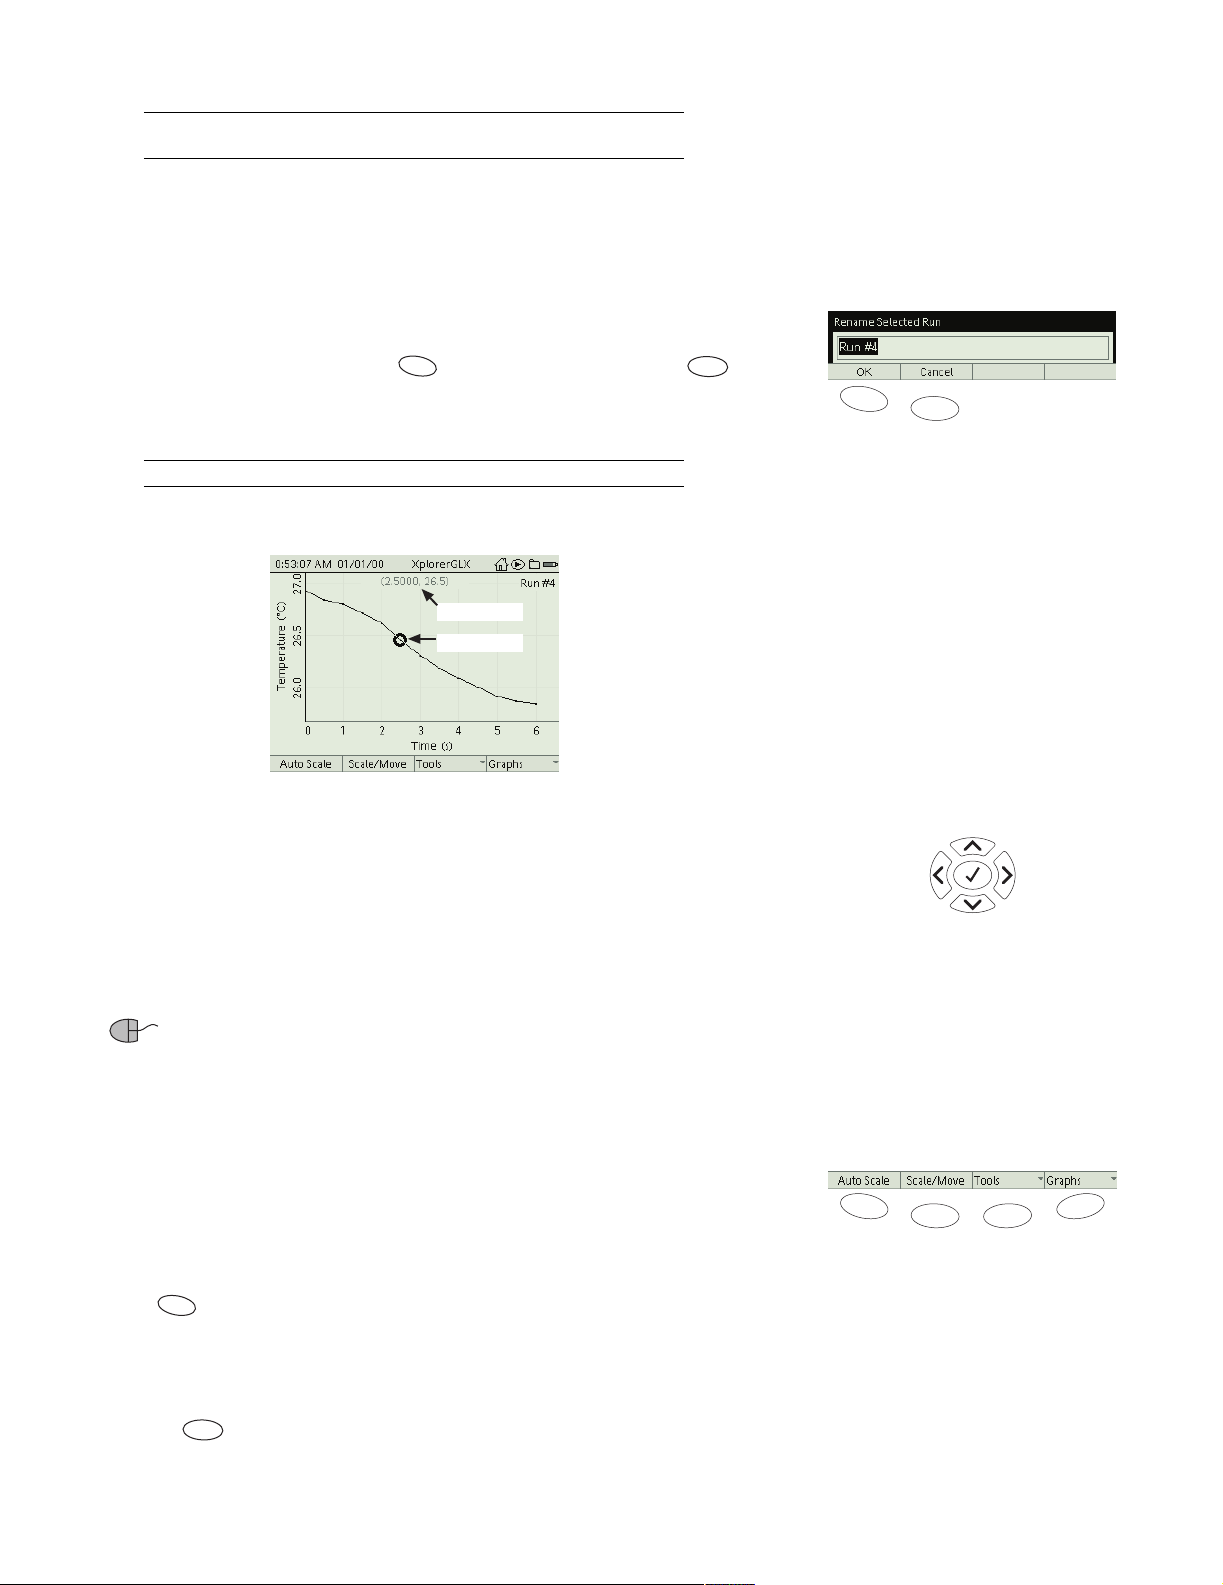
(or an atta che d keyboard) and press to accept the change (or press to
F1
cancel the change). The new name wil l be a pplied to that run from all mea surements, not just the one displayed in the Graph.
For more info r m ati on on multipr e s s tex t entry, see page 90.
Data Cursor and Coordinates
Coordinates
Data Cursor
F2
F1
The GLX prompts you to enter a new
F2
data run name
The circle around one of the data point s is th e Data Cursor. Use the arrow keys to
move the Data Cursor; the left and right arrow keys step the Data Cursor to adjacent data points, the up and down arrow keys make the cursor jump to the first
and last visible data points. Press and hold the left and right arrow keys to move
the cur sor quickly.
The coordinate pai r near th e to p of the Gra ph in dicat es the “X” and “Y” v alues of
the Data Cursor.
If you have a mouse, you can move the Data Cursor by draggin g it: click
on the Data Cursor, hold down the mouse button, and move the mouse left and
right to move the Data Cursor along the data plot.
Graph Function Keys
In the Graph, the func tio n keys a re used to c hange the scale and to open the Tools
and Graphs menus.
F1 Autoscale
Press to ma k e th e s c al e of th e Graph ad ju st automa t ically so that all dat a
are visible.
F2 Scale/Move
F1
Jump to
first point
Step left to
adjacent point
Jump to
last point
Use the arrow keys to move the
Data Cursor
F1
Step right to
adjacent point
F3F2
F4
Pressing cycles the graph through S cale mod e (first press ) and Move mode
F2
(second press).
Page 23
Xplorer GLX Users’ Guide 17
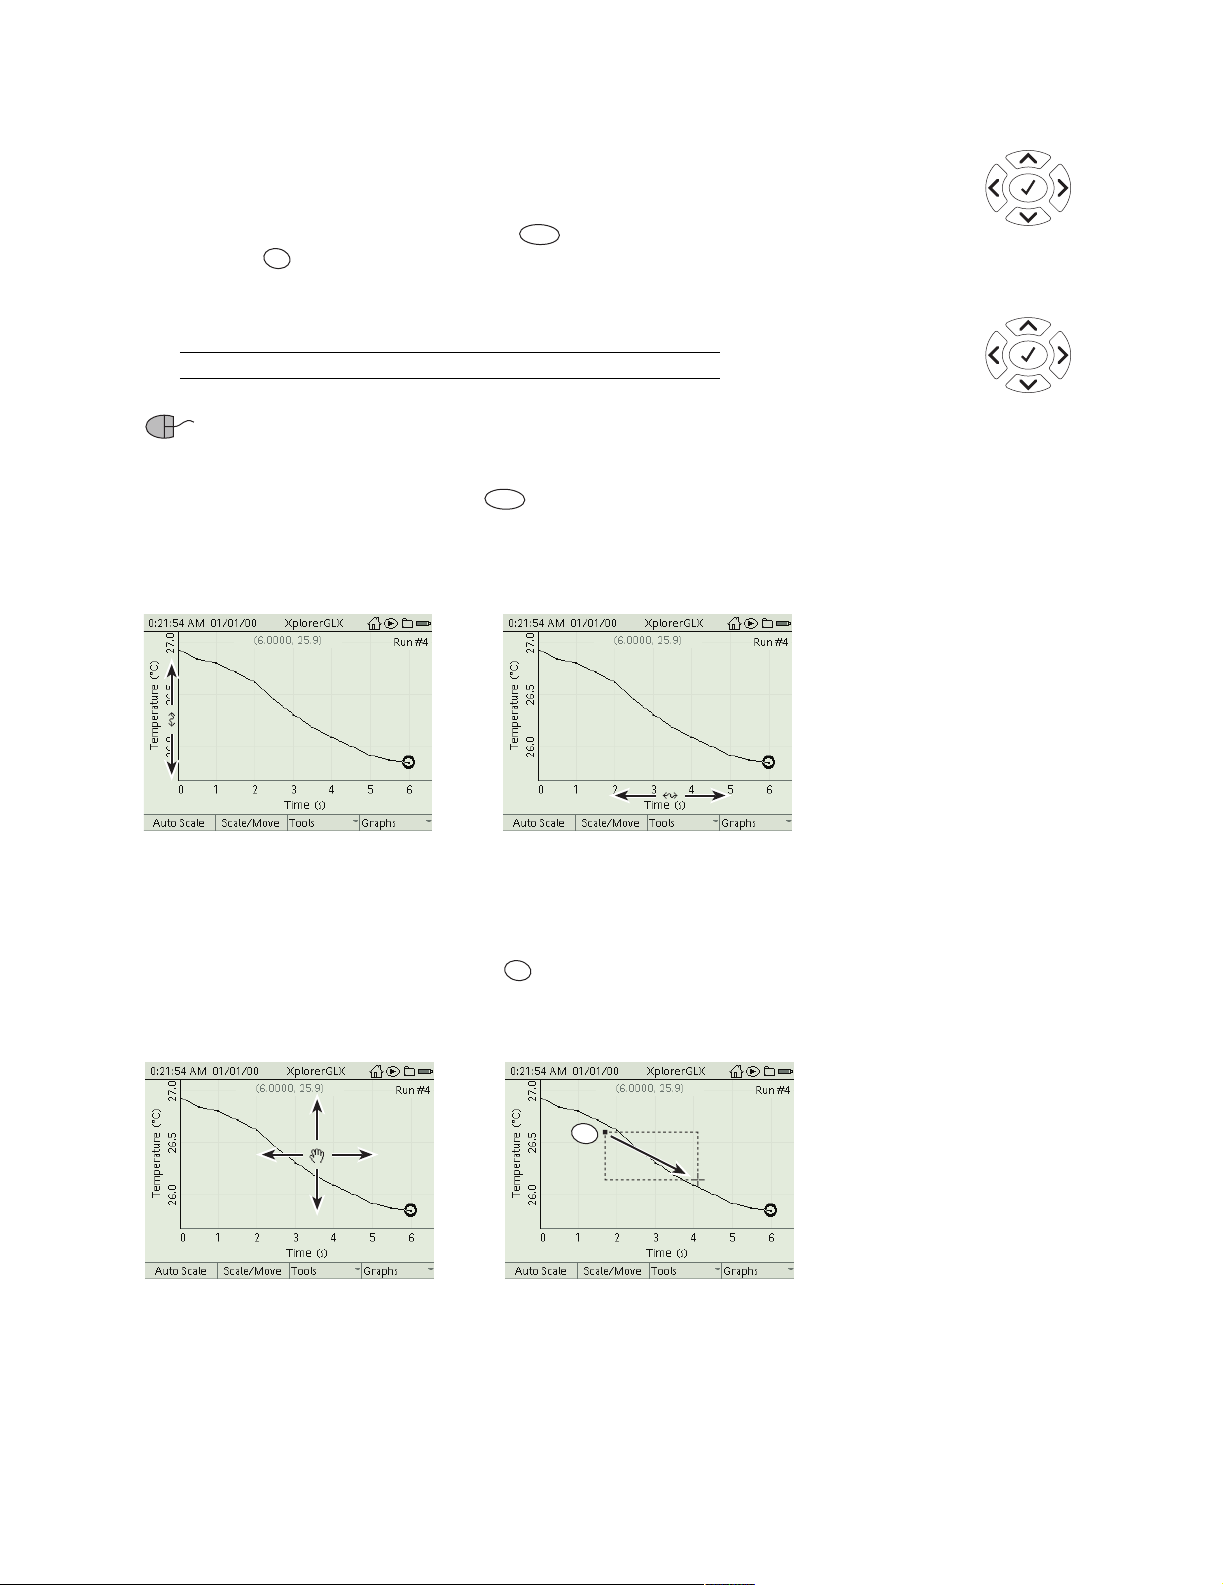
In Scale mode, the left an d r ight arrow keys compress and stretch the Graph horizontally; the up and down arrow keys stretch and compress the Graph vertically.
In Move mode, the arrow keys make the graph move left, right, up, and down.
To return to normal mode (indicated when the function reads “Scale/
Move”), press . If the Graph is in S cale or Move mode and the arr ow keys a re
Esc
F2
not pressed for several seconds, the Graph will return to normal mode automatically.
See “Zoom” on page 21 for another way to rescale the Graph.
Scale and Move with a Mouse
If you have a mouse, you can scale and move the Graph by dragging it with the
mouse cursor. (It is not nece ssary to press first.)
To change the scale, click and drag on (or between) the numeric labels on the
edges of the Graph to change the vertical and horizontal ranges.
F2
Scale
Mode
Compress
horizontally
Move
Mode
Move
Arrow key functions in Move and
Stretch
vertically
Compress
vertically
Move up
left
Move down
Scale modes
Stretch
horizontally
Move
right
Vertical Scale Horizontal Scale
To move the plot up, down, left, and right, click and drag anywhere in the “background” of the Graph.
To zoom in on part of the Graph, hold down while you click and drag to
Esc
draw a rectangle. The area en closed by t h e rectangle will enl arge to fill the
screen.
Esc
Move Zoom
F3 Tools Menu
Use the analysis tools contained in the Tools menu to obtain numerical info rma tion from the Graph (such as coordinates and statistics), to visualize different
properties of the plotted data (such as slo pe and area), and to enlarge a selected
area. This menu also contains an options to configure the Trigger (see page 20).
Page 24
18 Graph
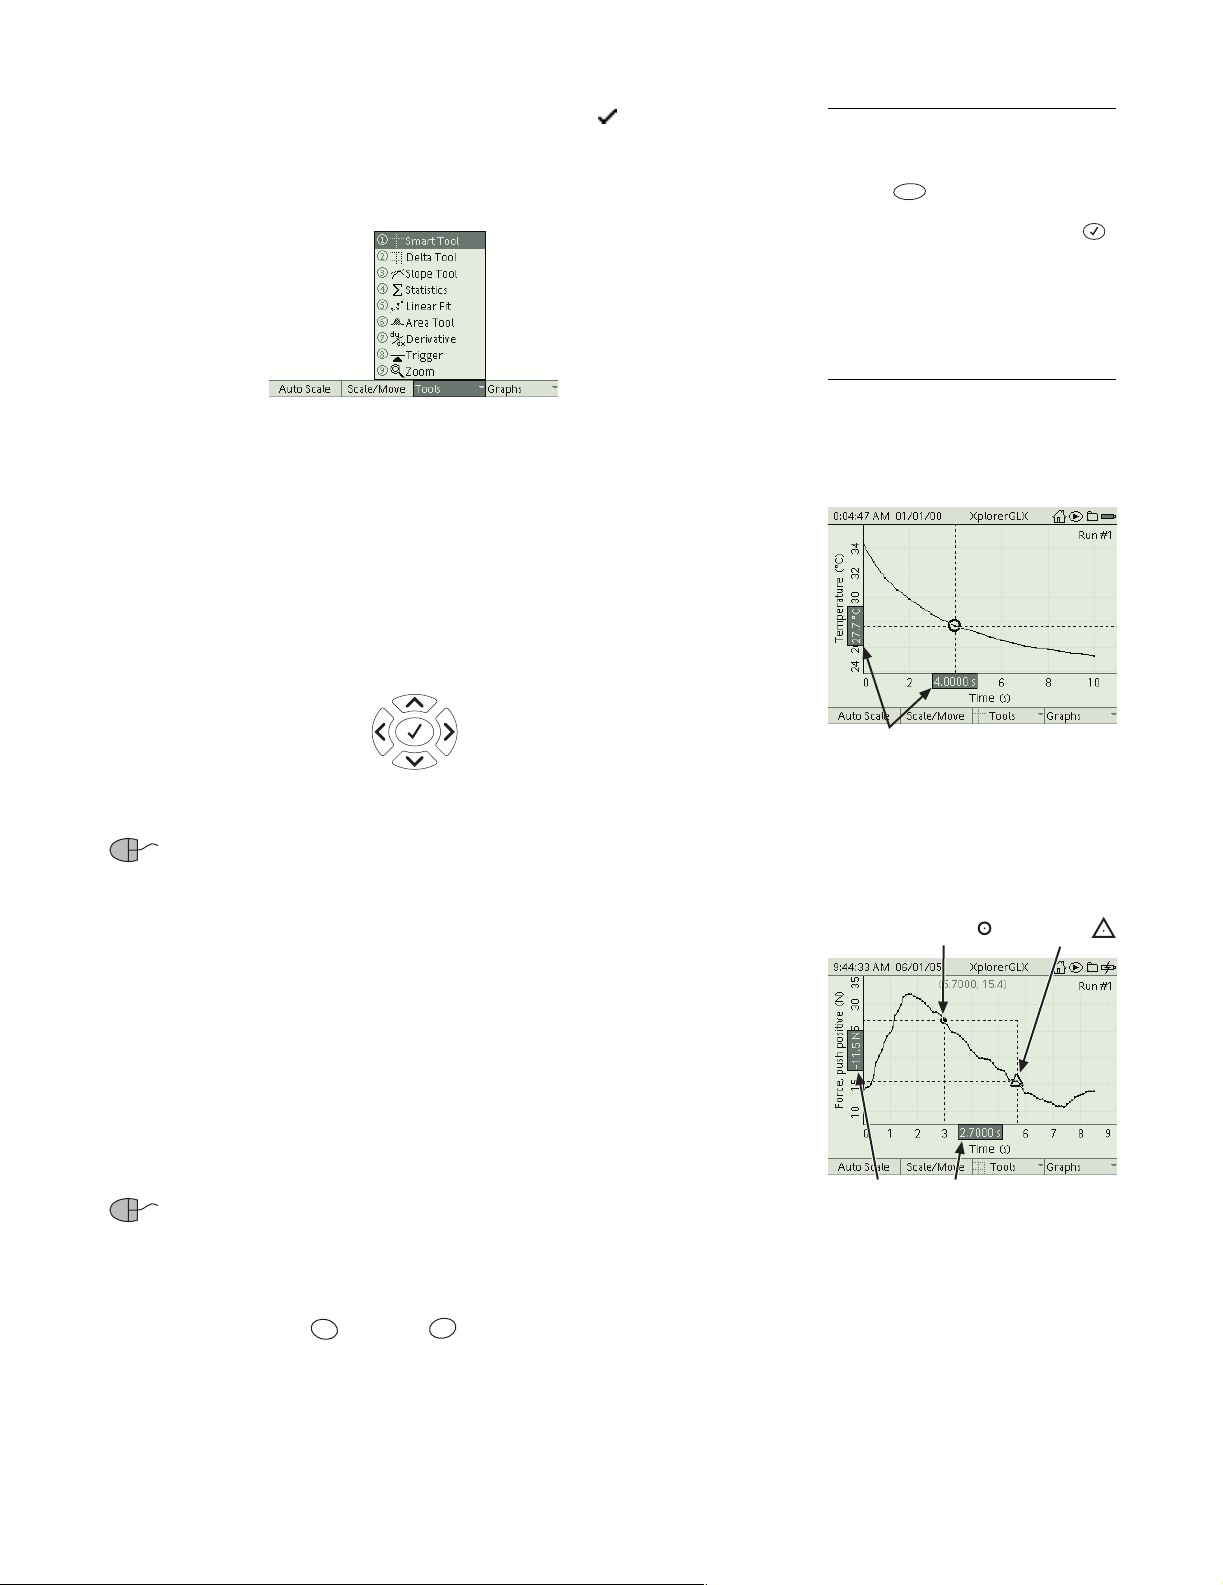
When you select a tool from the Tools menu,3 a check mark ( ) appears next to
it. To turn off a too l, select it from the menu again , which removes the check
mark and returns th e Graph to normal mode. If you have a tool tu rned on and you
choose a different tool, the previous tool will automatically turn off.
The Tools menu
The options in the Tools menu are described belo w.
Smart Tool When the Smart Tool is selected from the Tools menu, a pair of
crosshairs appe ars on the Graph with labels indic ating its coordinates. Use the
left and right arrow keys to move the Smart Tool to adjacent data points. Use the
up and down arrow keys to send it to the first and last visible data points. Press
and hold the left or right arrow key to move the Smart Tool quickly.
Jump to
first point
3
To select a tool from the Tools
menu:
Keypad
1. Press to open the Tools menu.
2. Use the arrow keys to move the high-
Mouse
1. Cl ic k “ Tools” at the bo tt o m of the
2. Cl ic k the desired tool.
F3
light to the desired tool and press ;
or
press the number on the keypad
corres po nding to the des ired tool.
scree n to open the Tools menu.
Step left to
adjacent point
Jump to
last point
Step right to
adjacent point
If you have a mouse, you can move the Smart Tool by dragging the cir-
cle at the intersection of the cross hairs left and right.
Delta Tool When the Delta Tool is selected from the Tools menu, a dashed rectangle app ears on the G r ap h. One corner is marked with a circle, the other is
marked with a triangle. Labels on the edges of the Graph indicate the width (∆X)
and height (∆Y) of the rectangle, measured from the circle to the triangle.
When you first turn on the Delta Tool, the circle and triangle appear at the same
point. Press the left or right arrow a few times to separate them.
The left and right arrow keys move the triangle to adj acent data points; the up
and down arrow keys send the tr iangle to the first and last visible data points.
Press and hold the left or right arrow key to move the triangle quickly.
If you have a mouse, you can move the triangle by dragging it left or
right.
The triangle designates the active corner of the Delta Tool, which is the corner
that moves when you pre ss th e arrow keys or dr ag it with the mouse. To make the
other corner active, hold and press . The triangle and circle will swap
Esc
Õ
places when you release both keys.
Coordinates
Stationary
Corner
Smart Tool
Active
Corner
DXDY
Delta Tool
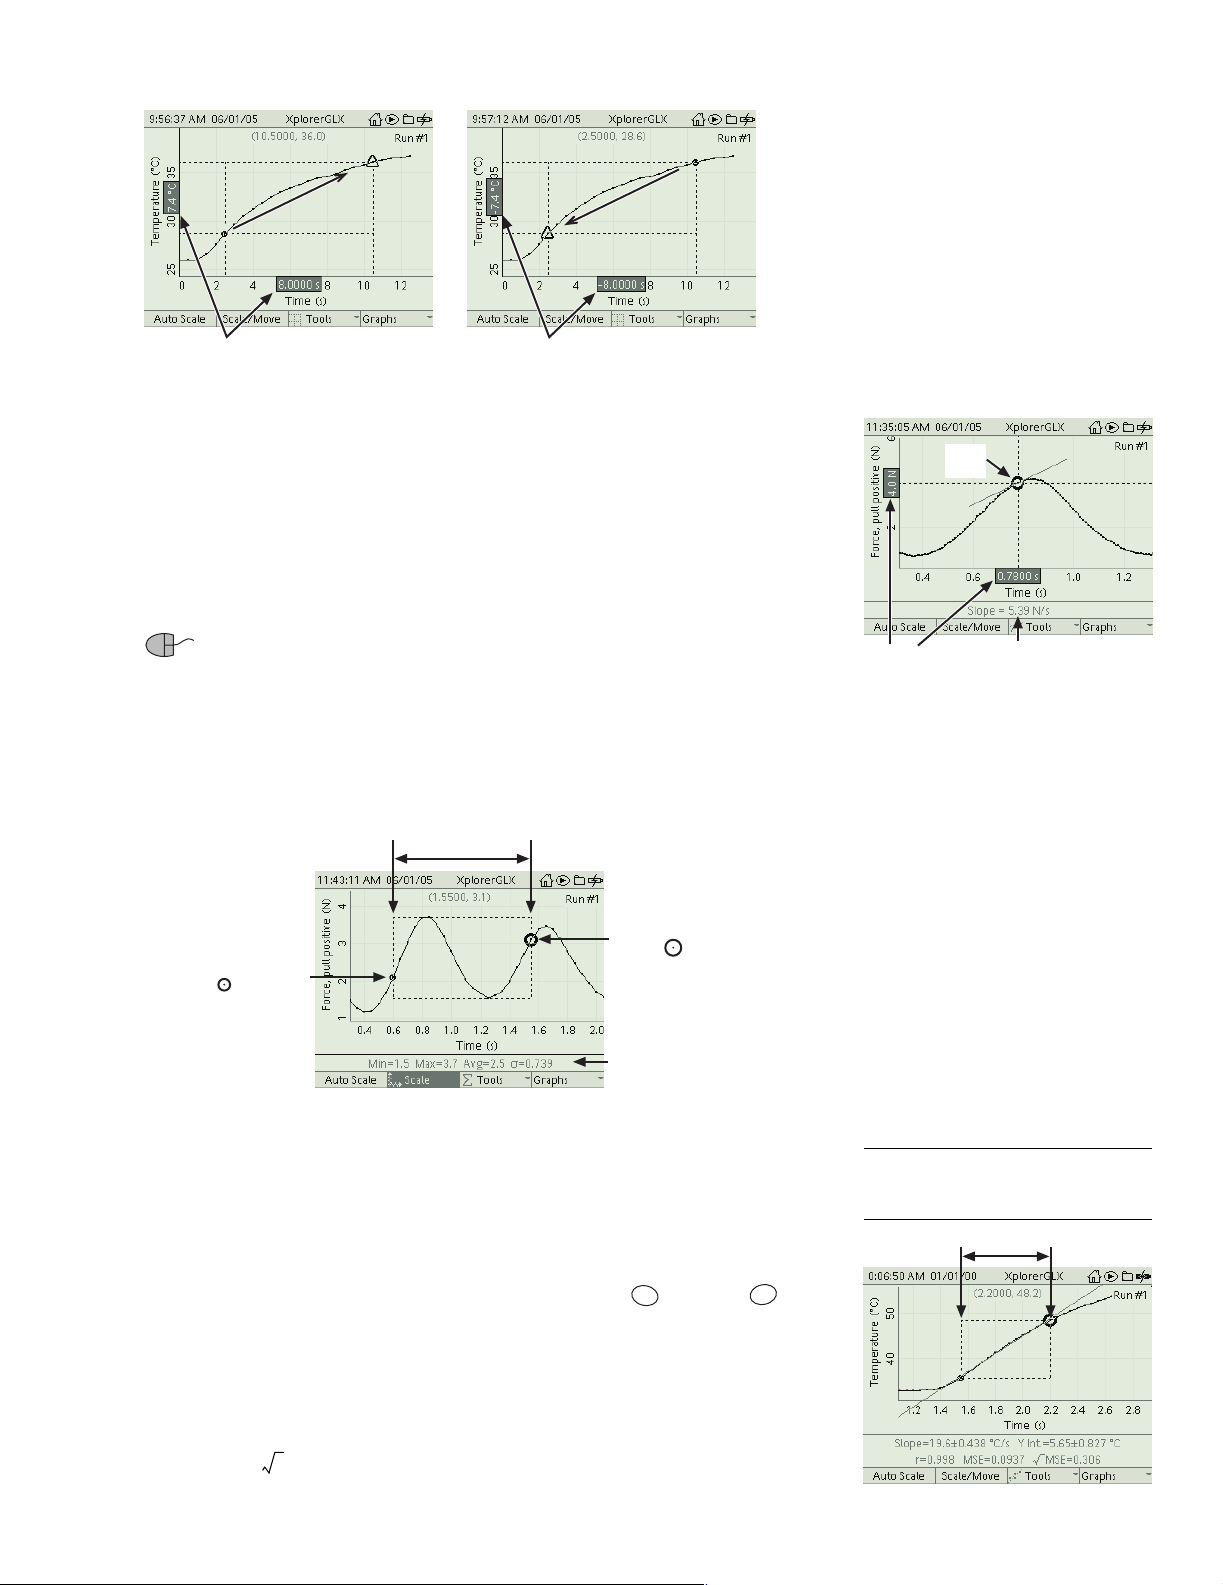
Note th at wh en th e curs o r s sw ap pl ac es, the signs o f ∆X and ∆Y change. These
values are always measured from the circle to the tr iangle; ∆X is the triangle’s X
coordinate minus the circle’ s X coordinate, ∆Y is the triangl e’s Y coordinate
minus the circl e’s Y coordinate. You would most typically be interest ed in the
values reported when the triangle is to the right of the circle.
Page 25
Xplorer GLX Users’ Guide 19
Positive DX and DY
When the cursors swap places, the sign s of ∆X and ∆Y change
Negative DX and DY
Slope Tool Select the Slope Tool from the T ools menu to measure the slope of
a tangent line at one point on t he data plot. A pair of crosshairs mark s the point at
which the slope is meas ured. Labels on the Graph’s edges show the coordinates
of the point, and the slope is displayed at the bottom of the screen.
Use the left and right arrow keys to move the Slope Tool to adjacent point s. Use
the up and down arrow keys to send it to the first and last points . P res s and hold
the left or right arrow key to move the Slope Tool quickly.
If you have a mouse, you can move the Slope Tool by dragging the circle
at the intersection of the cross hairs left and right .
Statistics Select Statistics from the Tools menu to put the Graph into Statistics
mode. The Graph displays the minimum, maximum, average, and standard deviation (σ) of the data inside the re gion of interest (ROI), which is indicated by a
dashed box.
Region of interest
XY
Slope
Tool
Slope
Slop e Tool
Active
Cursor
Stationary
Cursor
Statistics
Statistics mode
Two cursors desi gnate the left and right sides of the ROI. The larger cursor is the
active one and can be moved with the arrow keys or mouse .
4
As the acti ve cursor
moves, one side of the box moves with it.
The smaller cursor indicates the side of the ROI that doe s not move.
To switch the active cursor to the other side of the box, hold and press .
Esc
Õ
Linear Fit When Li near Fit is sel ec ted from the Tools m en u , a be st -f i t li n e is
applied to the data in the ROI. (See “Statistics” above for instructions on setting
the ROI.)
The slope, the Y-intercept, the mean squared error (MS E), and the roo t mean
squared error of the linear fit are disp layed at the bottom of the screen
MSE()
along with the correlation coefficient (r) of the data in the ROI.
4
See page 16 for detailed instructions on
moving the cursor with the keyp ad or
mouse.
Region of interest
Linear Fit
Page 26
20 Graph
When the Linear F it is turned on, the special option Create Ca lculation from Linear Fit appears in the Tools menu (see page 22).
Linea r Fit can be useful even when the graphed data are not linear (quadratic or exponential, for instance). See “Graph Linearization” on page 47.
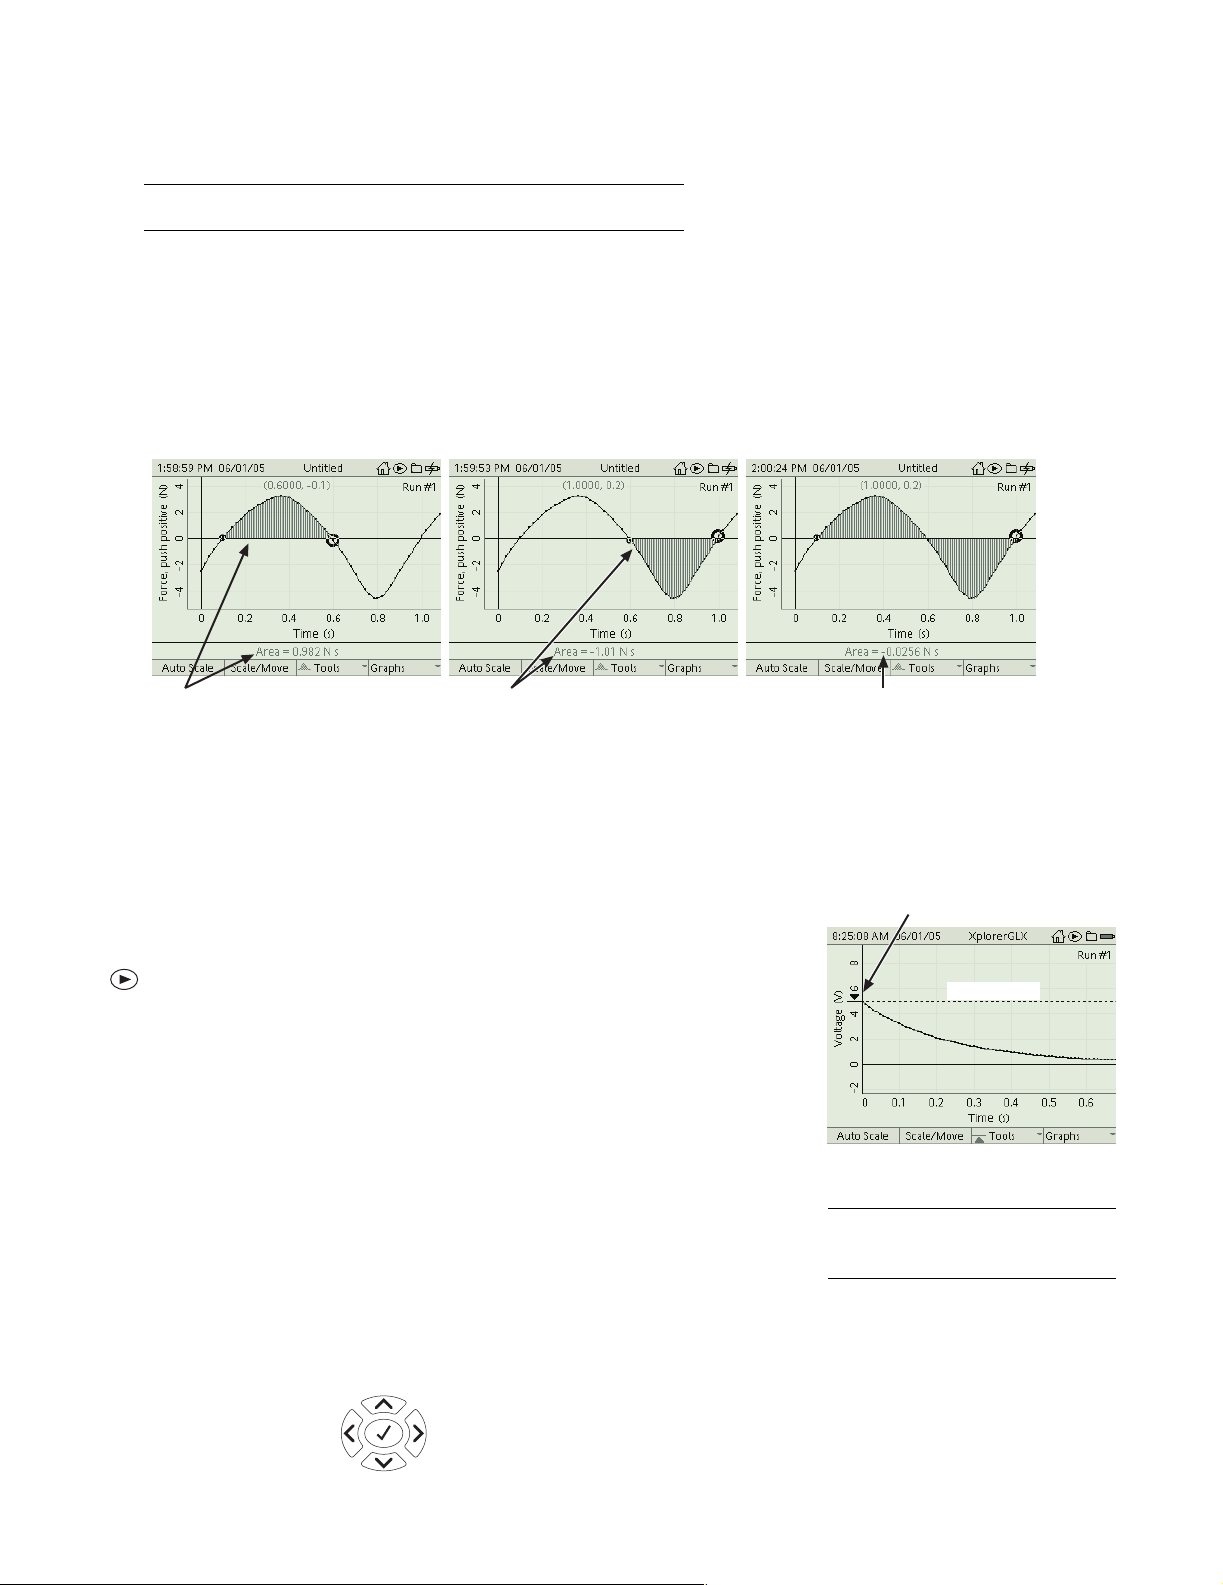
Area Tool Select the Area Tool from the Tools menu to measure the area
between the data plot and the X-axis in the ROI. (See “S tatistics” above for
instructions on setting the ROI.)
For data plotted below the X-axis , the area is measure d as negative. The value of
area dis pl ay ed a t th e bot tom o f t he sc ree n is th e t ota l ar ea abo v e th e X-a xis minus
the total area below the X-axis.
Positive
Area
Negative
Area
Area Tool
Derivative This tool overlays a graphical representation of the derivative (or
rate of change) of the data. In some cases, the Graph may need to be rescaled in
order to see the overlaid derivative. The Deriva tive Tool is designed for titrati on
experiments in which it is necessary to identify a point in a data set at which the
maximum rate of change occurs.
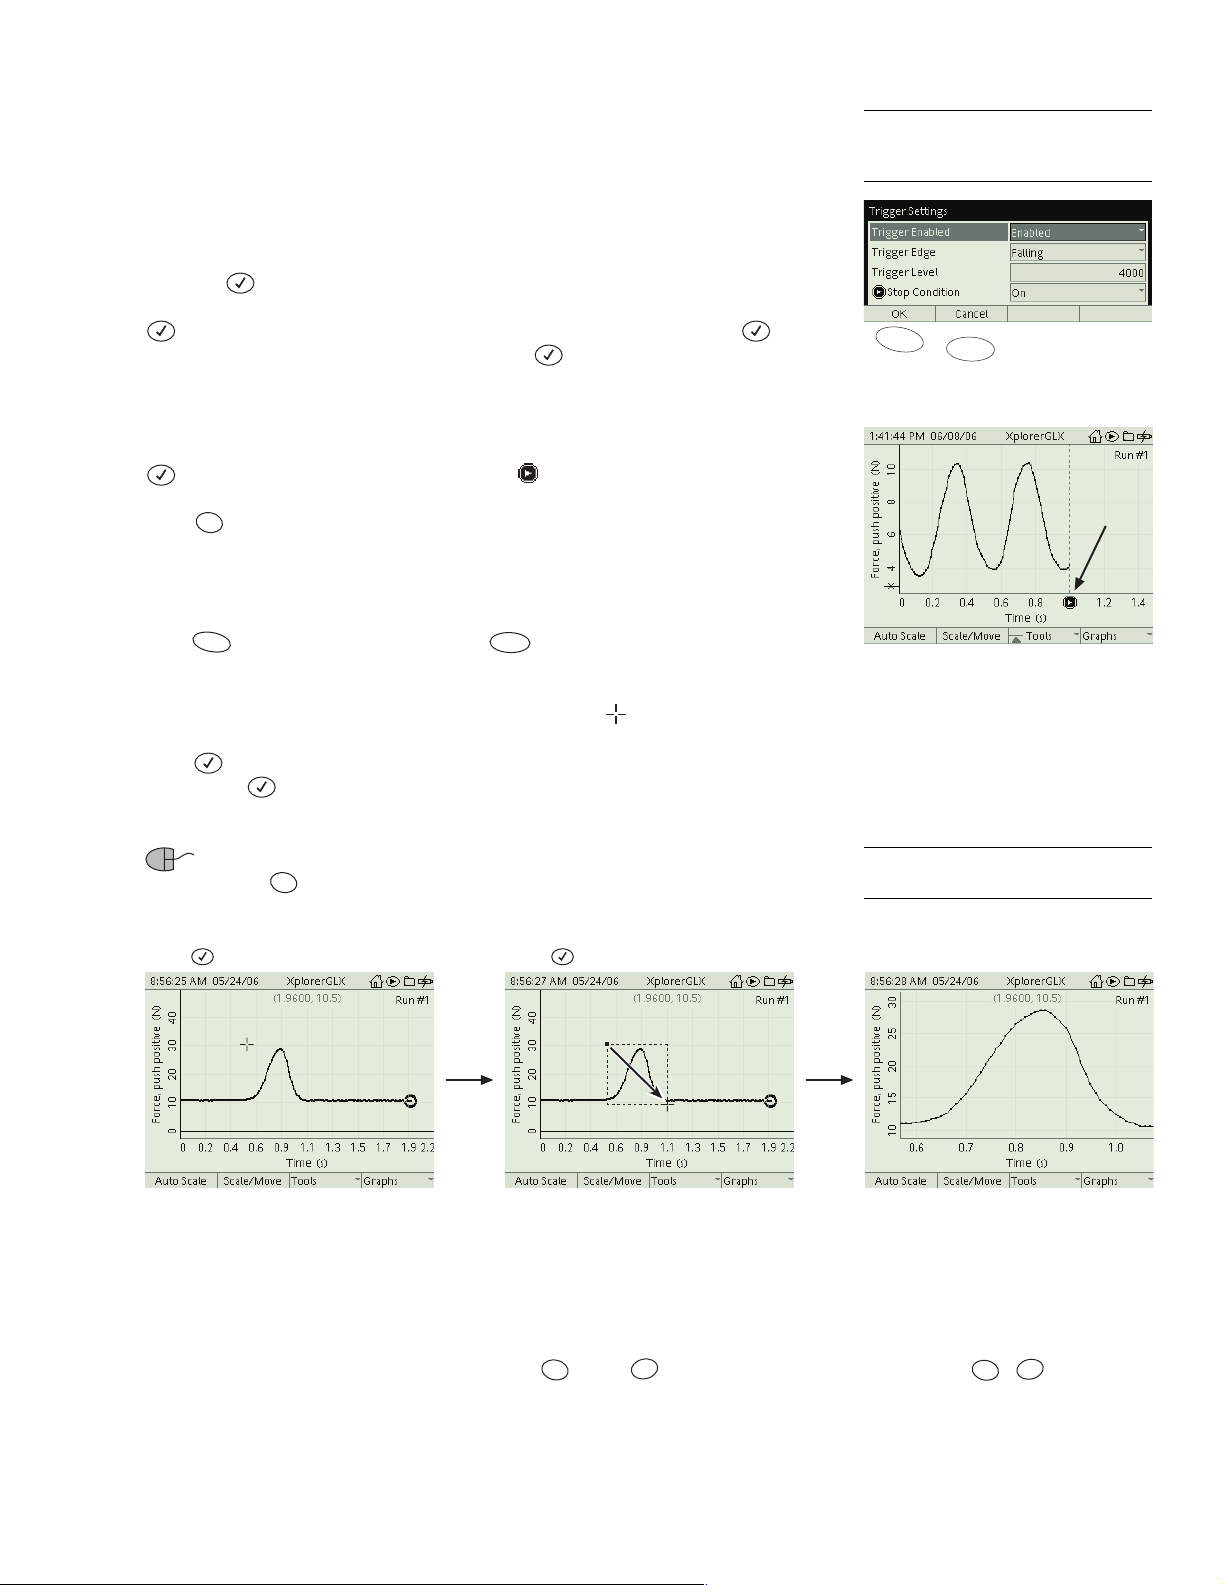
Trigger The Trigger is a tool that allows you to control how the GLX collects
data. With the Trigg er, you make the GLX delay data recording (after you press
) until a certain condition is met by the incoming data. The Trigger has two
parameters: Trigger Edge, which can be rising or falling, and Trigger Level,
which specifies the data value that must be crossed. For example, on a voltage
versus time graph, if you set the Trigger Edge to risin g and the T rigger Level to 5
volts, dat a rec ording will not start unti l the measured voltage rises above 5 volts.
The Tr igger can be used i n normal graph mode t o sta rt conti nuous re co rding, or i t
can be used in Scope Mode (see page 22) to repeatedly trigger bursts of data collection. In bot h modes, the Graph must have time on the horizontal axis.
To turn on the Trigger , select it from the Tools menu.
5
A horizontal dashed line
appears on the Graph indicating the T r igger Level. Press the up and down arrow
keys to change the Trigger Level. Pres s the right arrow key to cycle thro ugh ris ing edge, falling edge, and disabled. (The Trigger is initially disabled, so you
must press the right arrow key at least once to enable it.)
Total Area is area above the axis minus
area below the axis.
Arrow Indicating
Trigger Edge
Trigger Level
Trigger
5
The Trigger turns on automatically
when you turn on Scope mode. See
page 22.
Open Trigger
Settings
Increase
Trigger Level
Enable, Disable, and
Change Trigger Edge
Decrease
Trigger Level
Page 27
Xplorer GLX Users’ Guide 21
The Trigger affects data recording eve n if you are not viewing the Graph. If you
have set up two or more triggers on s eparate Graph pages,
6
data recording will
start when the most recently set trigger condition is met.
Trigger Settings When the Trigger is turne d on, you can open the Trigge r Settings dialog box by pressing the left arrow key (you can also select it from the
Tools menu). In the dialog box, use the arrow keys to highlight Trigger Enabled
and press to enable or disable the Trigger. To change the edge from rising to
falling, or vic e-versa, use the arrow keys to highlight Trigger Edge and press
. To set the level, use the arrow keys to highlight Trigger Level, press ,
enter the desire d value on the keypad, and press again.
You can also turn on the Stop Condition, which causes data collection to automatically stop at a specified time. To turn on the Sto p Condition in the Tri gger
Settings dialog box, use the arrow keys to highlight Stop Conditi on and press
. When the Stop Condition is on, an icon ( ) and vertical dashed line
appear on the Graph in dicating the stop time. While viewing the Graph, hold
Esc
down and press the left and right arrow keys to adj ust the stop time. For the
Stop Condition to work, the Trigger must be turned on (but does need to be
enabled).
When you have finished changing the settings in the T r igger Settings dialog box,
press to ac cept the cha ng e s, o r p re ss to cancel th e m .
F1
F2
Zoom Use the Zoom Tool to enlarge an area that you define by drawing a rect angle. Sel ect Zoom from the Tools menu; a zoom cursor ( ) appears. Move the
cursor (using the arrow keys) to where you want one corner of the rectangle.
Press . Move the cur sor to define the diagonall y opposite corner of the rectangle. Press again. The area enclosed by th e rectang l e enlarg es to fill t h e
screen.
6
For information about multiple Graph
pages, se e “N ew Gr ap h P ag e” on
page 24.
F1
F2
Trigger Settings dialog bo x
Stop time
Stop condition
If you have a mouse, you do not have to open the Tools menu to zoom.
Just hold down while you click and drag on the Graph to draw the rectangle.
Position the cursor to define one corner.
Press .
Esc
Move the cursor to define the opposite corner.
Press .
Zoom Tool
Swap Cursors This option appears in the Tools menu when you are using the
Delta Tool, Statistics, Linear Fit, or Area Tool. When you select Swap Cursors,
the active and inactive curs ors swap places, allowing you to move the previousl y
stationary corn er of the Delta Tool or side of the ROI.
To swap cursors without opening the menu: hold , press , and release
Esc
Õ
both keys.
7
7
See also page 17 for other ways to
scale the Graph w ith a mouse .
Area enlarges.
Esc
Õ
+
Swap Cursors Shortcut
Toggle Active Data This option appears in the Tools menu when the Grap h is
in one of the t wo-data s et mode s (see p ages 23–24 ). Sele ct it t o swit ch fo cus fro m
one da ta se t to th e o th er. The active data set is th e on e to wh i ch th e D a t a C ur sor
Page 28
22 Graph
and other tools are app lied. In case s where the two dat a sets are scal ed separa tely,
the active that is scaled.
To toggle data withou t opening the menu: hold , press , and release both
Esc
keys.
Create Calculation from Linear Fit This option appears in the T ools menu
when the Linear F it (se e page 19) is turned on. Select thi s op tion to a utomat ical ly
create an equation in the calculator based on the slope and y-intercept of the currently displ ay best-fit line. If the equation of the best fit line is ,
ymxb+=
where m is the slope and b is the y- intercept, then the calcula tion will take the
form . This calcula tion will appear in the Calc ulator and in
x 1 m⁄()ybm⁄–=
data source menus with the name “Linear Fit Cal.” For instructions on working
with calcula tions, see page 41.
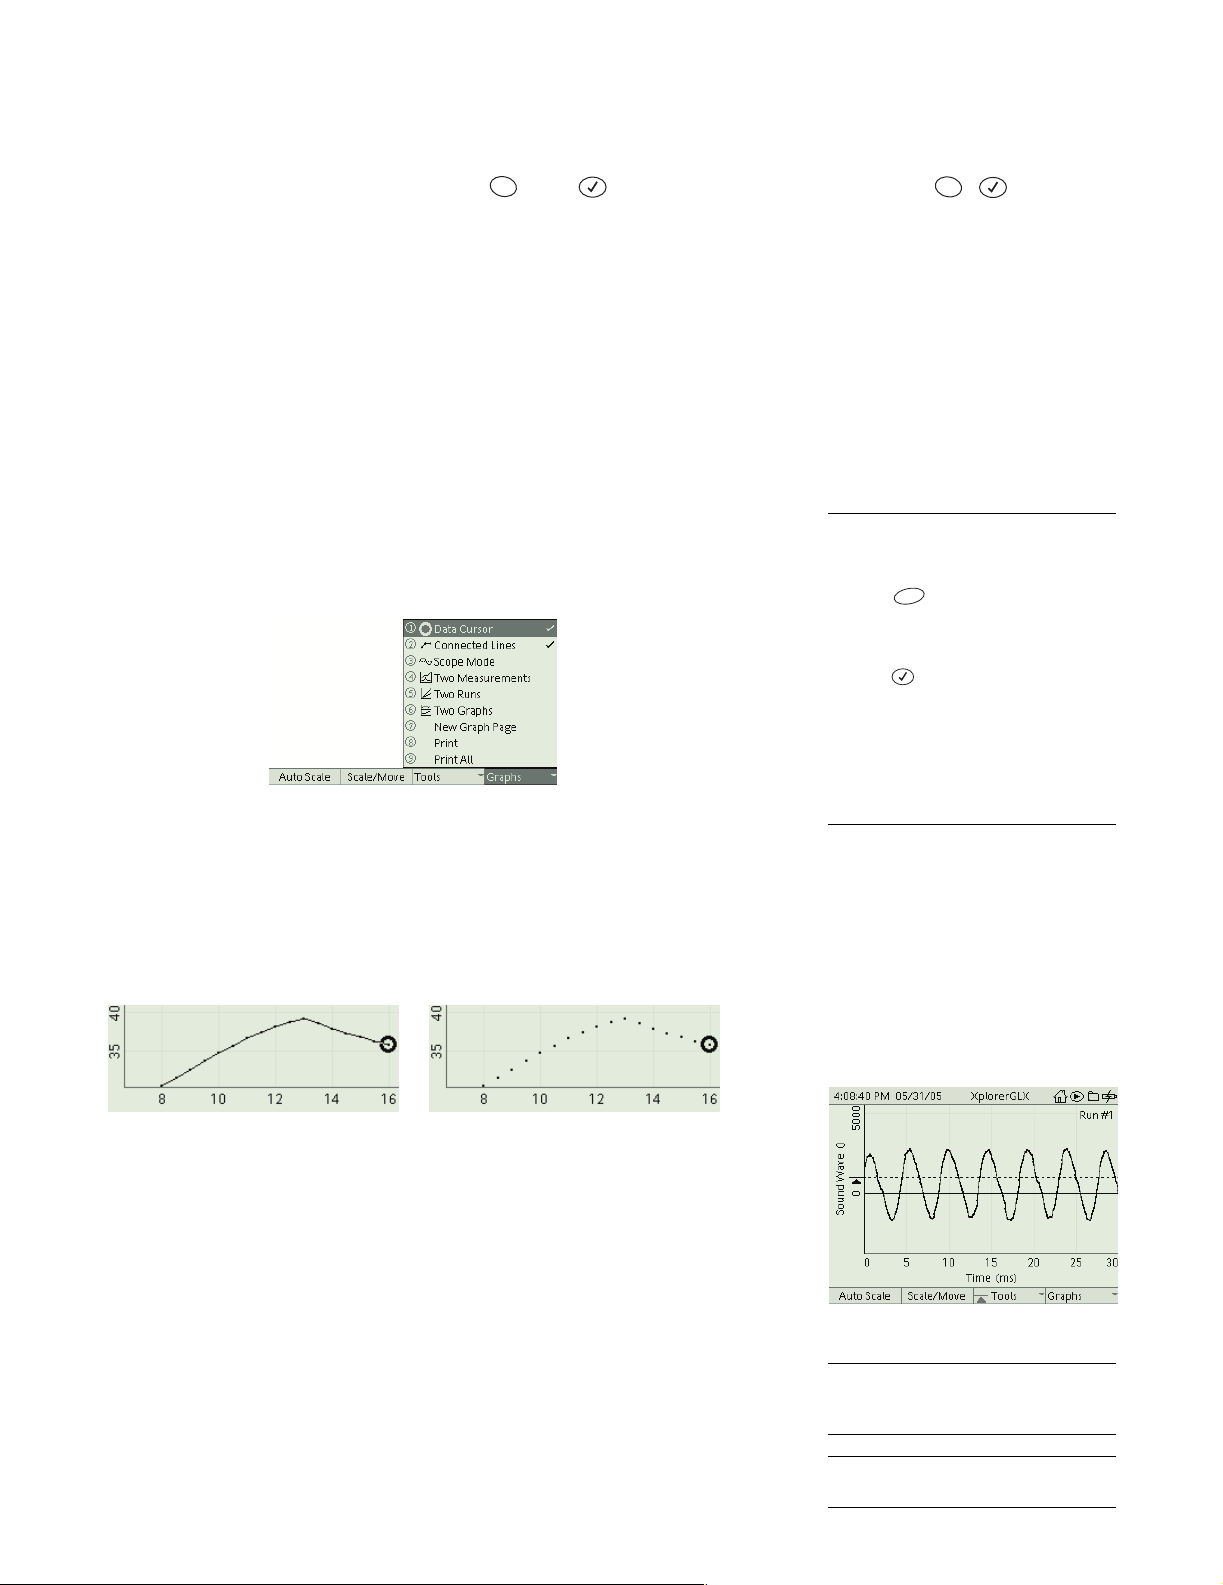
F4 Graphs Menu
The Graphs menu cont ains options8 to control the appea rance of the Gra ph, make
it emulate an oscilloscope, make it plot two data sets simultan eous ly , manage
multiple pa ges, and print.
The Graphs menu
Esc
+
Toggle Data Shortcut
8
To select an option from the Graphs
menu
Keypad
1. Press to open the Graphs
2. Use the arrow keys to move the high-
Mouse
1. Click “Graphs” at the bot tom of the
2. Click the desired menu option.
F4
menu.
light to the desired menu option and
or
press ;
keypad corresponding to the desired
menu option.
screen to open the Graphs menu.
press the nu mber on t he
Data Cursor Select this option to turn on or off the Data Cursor and Coordinates displayed on the Graph. See page 16 for more information.
Connected Lines Select this o ption fro m t he Graphs m enu to turn on or of f the
lines connecting the data points.
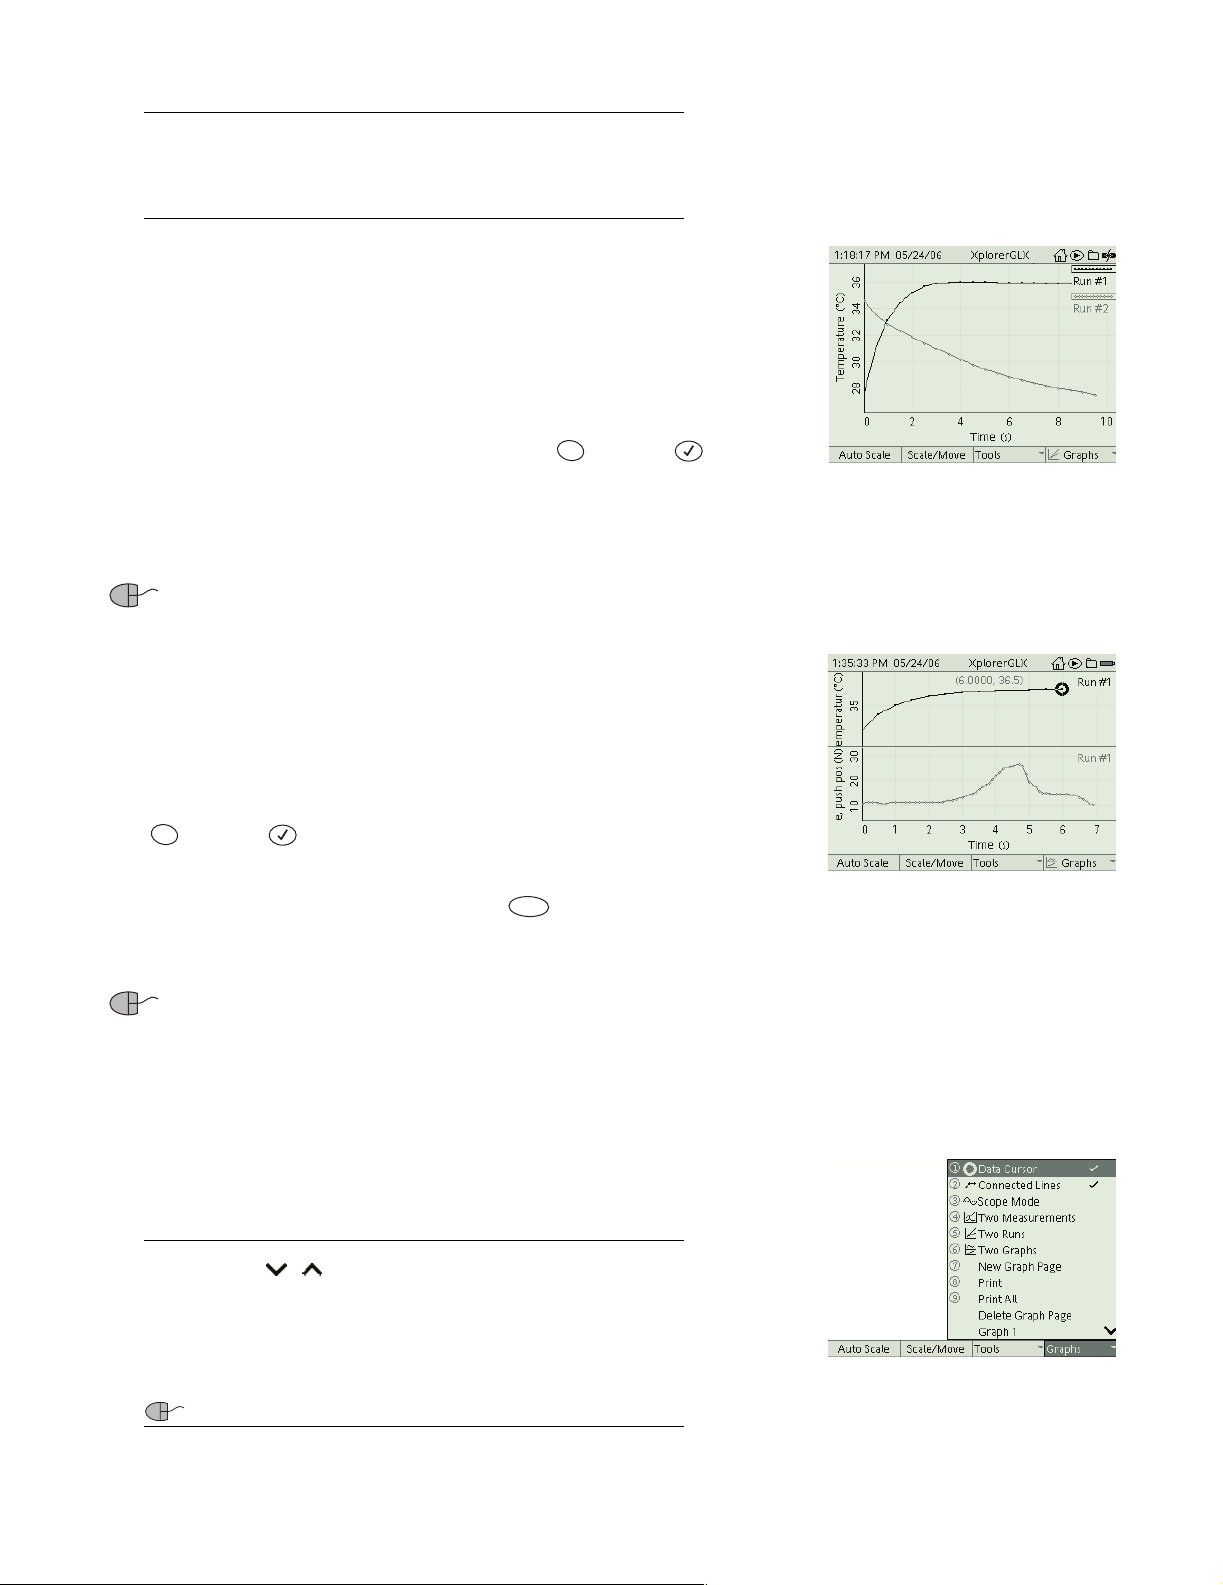
Graph with connected lines (left) and without connected lines (right)
Scope Mode Select Scope mode from t he Graphs menu to make the GLX emu-
late a digital storage oscilloscope. In this mode, the GLX collec ts and displays
data in repeated burst s. The length of the burst and the sampl e rate are determined by the time scale of the Graph display. Scope mode can be used with any
sensor to co llect bursts of dat a; it is especially useful with th e G LX ’s bui lt-in
sound sensor (see page 58) or voltage sensor.
When you turn on Scope mode, the Gra ph automatically sets its time range to
30 milliseconds and turns on the Trigger.
9
It also adjusts the sampling rate of the
displayed se ns or so that it wil l collect about 500 data points (or as ma ny as possible) in each burst. If you change the Graph’s time scale,
10
the GLX automatically
adjusts the sampling rate.
Scope mode
9
The Trigger is initially disabled. See
page 20 for i nstructions on enabling and
setting the Trigger.
10
See “F1 Autoscale” and “F2 Scale/
Move” on page 16.
Page 29
Xplorer GLX Users’ Guide 23
After you press , the GLX begins collecting and displaying a series of data
bursts (each burst is enough data fill the Graph from left to right). If you have
enabled the Trigger, the GLX waits for the tr igger condition to be met befor e collecting each burst .
While Scope-mode data collect ion is in progress , you can change the scale of the
Graph (with Autoscale, Scale/Move, or the mouse) and you can
F1
F2
change the Trigger settings with the arr ow keys.
To stop data collection, press again. The GLX will save the last-collected
data burst as Run #1 (or #2, #3, #4, etc.). You can also use the Trigger’ s Stop
Condition (se e page 21) to make the GLX stop automatically after collecting a
single data bu r s t .
You can use Scope Mode in conjunction with Two Measurements mode or
Two Graphs mode (see below) to display two traces simultaneously.
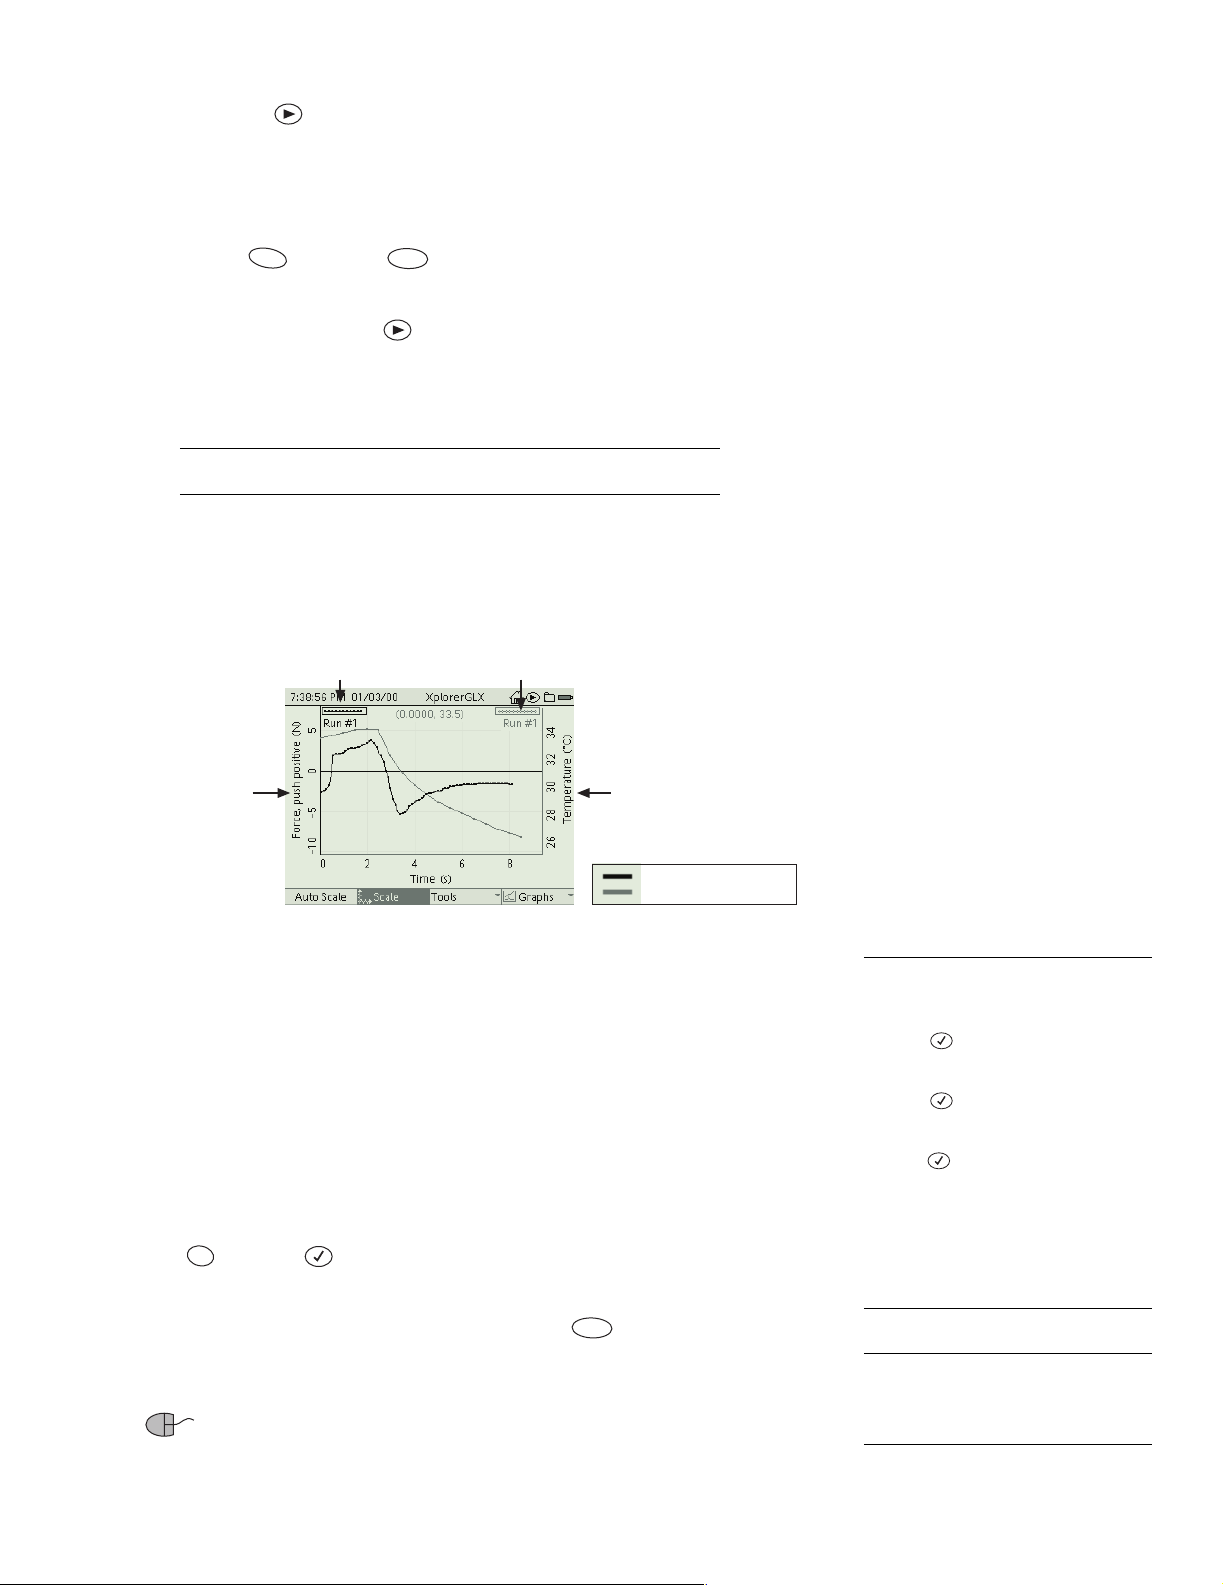
Two Measurements Select this option from the Graphs menu t o put the Graph
into T wo Measurement s mode. In this mode, two measure ment s (or data se ts) are
graphed simultaneously.
Run Number of
First Measurement
(select to change)
Data Source of
First Measurement
(select to change)
Two Measurements mode
Run Number of
Second Measurement
(select to change)
Data Source of
Second Measurement
(select to change)
Active Data (black)
Inactive Data (gray)
The data source and s cale of the Firs t Measureme nt ar e displ ayed on th e left side ,
and the data source and s cale of the Second Measurement is displayed on the
right side. Select either the left or right data source field
11
to change the corre-
sponding measurement.
The run number of the First Measurement is d is played in the upper left corner of
the Graph, and the run number of the Second Measurement is displayed in the
upper right corner. To change the run number of either measurement, select the
corresponding run num ber field.
11
One of the measurements is plotted in black, and the other one in gray. The measurement in black is the active data. To switch activity to the other measurement,
Esc
hold and press .
The Data Cursor appears on the active data. If you select a tool from the Tools
menu, it is applied to the active data set. If you press to scale or move vertically, only the active data will change.
12
However, moving the Graph horizon-
F2
tally or changing the horizontal scale will affect both sets.
If you are using a mouse, you can swi tch activity to a measurement by
clicking on the line above its run number. Vertically scale each measurement by
dragging its numeric labels (on the left or right side of the Graph).
11
To select a data source field or run
number field:
Keypad
1. Press to light up the active fields.
2. Use the arrow keys to move the highlight to the desired field.
3. Press again to open the menu.
4. Use the arrow keys to move the highlight to the desired menu option and
press ;
keypad corresponding to the desired
menu option.
Mouse
1. Click the desired field to open the
menu.
2. Click the desired menu option.
12
The exce ptio n t o t his rul e is when bot h
data sets are of the same units (both
temperature in °C, for instance); in that
case, both data sets scale together.
or
press the nu mber on t he
Page 30
24 Graph
Ty pically y ou would use Two Measurements mode to display data from two
different sour ces, but y ou can also u s e it to display two runs from the same
source . Sele c t the sa m e so ur c e fr o m bo th data source fields, and di ffe re nt
runs from each run number field. For another way to display two runs from
the same source, see “Two Runs” below.
Two R uns Select T w o Runs from the Graphs menu to display two data sets
from a single data source.
In this mode, a second run appears on the Graph. A second run number field
appears in the uppe r right corner (below the first run number) , whic h you can
select to choose a different run.
One of the runs is plotted in black, and the other one in gray. The run in black is
the active data. To switch activity to the othe r run, hold and press . The
Esc
Data Cursor appears on the active data. If you select a tool from the Tools menu,
it is app li ed to th e active da ta se t .
Both runs share a single pair of axes and they are scaled and moved together.
If you are using a mouse, you can swi tch activity to a run by clicking on
the line above its r un number.
Two Grap hs Select Two Graphs from the Graphs menu to display two separate
graphs simult aneously . This mode is similar to Two Measurements mode (see
page 23), but eac h measur ement is plott ed o n the to p or bo tto m half o f the s creen ,
rather than overlapping.
One of the measurements is plotted in black, and the other one in gray. The measurement in black is the active data. To switch activity to the other measurement,
Esc
hold and press .
The Data Cursor appears on the active data. If you select a tool from the Tools
menu, it is applied to the active data. If you press to scale or move vertically, only the active data will change.
However, moving the Graph horizontally
F2
or changing the horizontal scale will affect both sets.
If you are using a mouse, you can swi tch activity to a measurement by
clicking on it.
Two Runs m ode
Two Graphs mode
New Graph Pag e The GLX supports an unlimited number of graph pages.
Select New Graph Page from the Graphs menu to c onfigure a new graph while
preserving the previous one.
When two or more graph pages exist, each page appears in the Graphs menu. To
make a page visible, select it from the menu.
If added graph pages make the Graphs menu too long to fit on the screen, an
arrow or arrows (
cate that some of the menu options are not visible.
Press the up or down arrow key multiple times to
the visible portion of the menu.
view.
If you are using a mouse, you can click the arrows to scroll the menu.
, ) will appear on the right side of the menu to indi-
move the highlight beyond
The menu will scroll to bring other options into
The Graphs menu as it a ppears when
multiple pages exist
Page 31

Xplorer GLX Users’ Guide 25
Print I f there is a printe r connected to the GLX, select Print from the Graphs
menu to print the currently displayed graph page.
Print All Select Print All to print all of the graph pages.
For more information, see “Printing” on page 91.
Delete Graph Page This option is available when two or more graph pages
exist. When you select Delete Graph Page from the Graphs menu, the currently
displayed page is deleted and t he next page appears. (If there is no next pa ge, the
previous page appears.)
Data Annotation
The GLX’ s dat a-annot ation capa bil ity all ows you to at tach not es to data poi nts in
the Graph display. You can add these notes while you are vie wing the Graph
either durin g or a fter da ta c oll ectio n.
include a text message, an audio recording of your voice, or both; it can also be
“empty” (not containing text or audio).
13
A note ( rep r esen ted b y a fl ag i con : ) can
13
In order to add a note
lection, the GLX must be in Continuous
Sampling mode (its default mode), rather
than Manual Sampling mode. Se e
page 57 for more information.
during
data col-
Data with notes
There are two ways to attach a note to a data point in the Graph display:
• Press quickly to mark a data point with an icon ( ) representing an
empty note. You can later add text and audi o to this note.
•Press and hold and begin speaking to mark a point and immediately
record an audio message. When you are finished speaking, release .
In both cases, the note is added at the location of the Data Cursor.
See page 16 for instructions on moving the Data Cursor. If you are adding
notes during data collection, it is often convenient to have the cursor tracking
the data so that notes are always attached to the most recently collected
point; press the down arrow key to make the cursor track the data.
15
14
After you have a dded a note, you can ac cess its audio and text by positioning the
Data Cursor on it.
14
The GLX cannot record audio for a
data note when the microphone is configured as a sound sensor or sound level
sensor. See page 58 for more information.
15
The Dat a cursor must be turned on
(see page 22) in order to use data annotation.
Page 32

26 Graph
A note with the Data Cursor positioned on it
To make the Data Cursor jump directly to a note, hold and press one of the
arrow keys. Press plus the left or right arrow key to make the cursor jump to
the next visible note in ei ther direction; p res s plus the up or down arrow key
Esc
Esc
Esc
to make the cursor jump to the first or last visible note. When the cursor lands on
a note, the audio portion (if any) starts playing
16
and the text portion of the note
(if any) appears.
Annotation Menu
To change any of a note’s attributes, pos ition the Data Cursor on the note and
press ; the Annotation menu will open.
If you have a mouse, you can open the menu by clicking the flag icon.
Annotation Menu
Select17 any of the following menu options.
Edit Note Select this option to open the Note Editor dialog box. There you can
read the text, lis ten to the audio, enter new text, change existing text, and record
new audio. See “Note Editor Dialog Box” below for instructions.
Always Show Text This option is either turned on (with a check mark appearing next to it in the menu) or off (no check mark). When the option is on, the
note’s text is visible on the Graph even when the cursor is not on the note. To
switch Always Show Text on or off, select it from the Annotation Menu.
Delete Note Select this option to delete the entire note, including the text and
audio portions and the flag icon.
16
If you have not changed the default
setting, the audio plays thr ough the
GLX’s b ui lt -i n s pe aker ; othe r wis e i t pl ay s
through the output device specified in
the Audio Settings dialog box, which is
accessed from the Settings screen. See
page 87 for more information.
17
To select and option from the
Annotation menu
Keypad
1. Position the Data Cursor on the data
note.
2. Press
3. Use the arrow keys to move the high-
light to the desired menu option and
press
to open the menu.
; or press the number on
the keypad corresponding to the
desired menu option.
Mouse
1. Click the flag icon ( ) to open the
menu.
2. Click the desired menu option.
Move Select this option to move the note to a different data point. After you
have selected Move, the flag icon becomes mobile; use the a rrow keys (or
mouse) to move the ic on t o a dif fe rent data point an d pre ss to attach it to tha t
point.
Hide All Text and Show All Text Select either of these options to hide or
show the text of all note s in the displayed data run. These options are equivalent
to turning on or off the Always Show Text option for every note.
Delete All Notes Select this option to delete every note in the displayed data
run.
Page 33

Note Editor Dialog Box
Text Portion
Audio Portion
Audio Duration Audio Size
Xplorer GLX Users’ Guide 27
F1
Note Editor Dialog Box
F3F2
F4
The Note Editor opens when you select Edit Note from the Annotation menu.
The text portion of the note appears in the upper half of the box. Use the GLX’s
keypad (or an attache d USB keyboard) to enter new text or edit exis ting text.
Press to open the T ext menu, which c ont ains opti ons rela ted to enteri ng a nd
F4
18
editing text.
F4
Text Menu
To type a capital letter , select Shif t or Caps Lock.19 To take the keypad out of
multipress text mode (to type only numerals ), s elect Num Lock. T o delete the
entire text portion of the note, select Delete Text.
The audio portion of the note is graphically represented in the lower half of the
Note Editor alo ng wit h the audi o re cording d uratio n an d size. Press to open
the Audio Note menu, which contains options for recording and playing audio.
F3
Audio Note Menu
F3
14
18
See “Multipress Text Input Mode” on
page 90.
19
To select an option from the Text or
Audio Note menu
Keypad
1. Press or to open the
F3
F4
menu.
2. Use the arrow keys to move the highlight to the desired menu option and
press
; or press the number on
the keypad corresponding to the
desired menu option.
Mouse
1. Click “Audio Note” or “Text” at the bottom of the screen.
2. Click the desired menu option.
To record new audio, selec t Record Audio Note and begin speaki ng; press
to stop recording.
14
When you record new audio, the note ’s previous audio is
F3
overwritten. To play the audio portion of the note, select Play Audio Note from
the Audio Note menu.
16
To delete the audio, select Delete Audio Note.
Two other menu options, Record Quality and Record Level, allow you to set the
GLX’s audio sample rate, bits per sam ple, and microphone volume before you
record audio. The prop erties set using these opti ons are identical to those in the
Audio Settin gs di alog box (which is accessed from th e Settings screen); see
page 87 for details.
When you have finished changing the text and audio portions of the note, press
F1
to acce pt c h an g es and close th e N o te E ditor, or press to cancel
F2
changes.
Page 34

28 Table
Table
Use the Table to displ ay da ta, edit or enter data manual ly, and display statistics
on data sets. The Table can show up to four columns of numeric or text data.
To Open the Table
From the Home Screen, do one of the following:
press , the function key below the Table icon;
F2
use the arrow keys to highlight the Table icon, then press ; or
click the Table icon.
From anywhere in the GLX environment, you can always get to the Ta ble with
the shortcut + .
F2
Data Source
Run Number
Data source field
with nothing selected
The Table Display
The Table icon on
the Home Screen
Choosing Data to Display
The Table can contain up to four columns.20 Each column can be set to display
data fr om one data source. If time is displaye d, it occupies its own column. A column can also be empty (not set up for any da ta source).
The active fields described below are used to control what data appear in each
column. (See page 14 for more information about active fields.)
Data Source Select the data source field
sensor measurement, calculation, manually entered data set, or tim e, or to clear
the colum n. If no data source is as signed to a colu mn, the data source f ield
appears as a series of dashes (----).
Data Source menu
21
at the top of a column to choose a
20
See “F4 Tables” on page 31 for
instructions on changing the number of
displa yed colum ns .
21
To select the data source, units, or
run number field
Keypad
1. Press to light up the active fields.
2. Use the arrow keys to move the high-
light to the desired field.
3. Press again to open the menu.
4. Us e th e ar ro w key s to hi gh lig ht the
desired menu option and press ;
or
press the number on the keypad
corres ponding to the des ir e d me nu
option.
Mouse
1. Click the desired field to open the
menu.
2. Click the desired menu option.
Page 35

Xplorer GLX Users’ Guide 29
If the chosen data source does not contain data, the data source name will appear
at the top of the column, but the cells of the column will remai n empty until data
collec tion starts.
Also from the data source menu, you can select Properties to edi t the name and
other properties of the currently displayed data set. See “Data Properties” on
page 69 for more information.
For mor e information on selecting data from a data source menu when you
are wo rking wit h more than one sensor, or with a multiple-measure ment sensor, see “Da ta Source Me nus” on page89.
Units Select the units field21 to choose differ ent units (if availabl e) for the cho-
sen data source.
Run Number Sele ct th e r un number fiel d
21
to choose a different run, or select
No Data to display nothing.
By default, the Table is set to change the displayed run number in all columns whenever you change it in one column. Refer to “Lock Run Selection”
on page 31 to change that setting.
The last two options in the run number menu are Delete Run and Rena me Run.
See “Run Number” on page 15 for more information.
Table Scrolling
At any time, up to eight cells of data are visible in each column. Press the up or
down arrow key to scrol l the Table and make other rows of dat a visibl e. Pr ess and
hold the up or down arrow key to make the Table scroll continuously. Press the
left arrow key to jump to the beginning of the table; pres s the right arrow key to
jump to th e en d .
The rules for scr olling are differ ent when an editable column is v isible. See
page 35
Table Functi on Keys
In the Table, the function keys are used t o control the display of statistics, to edit
data, and to set the number of columns.
Units menu Run number menu
Scroll up
Jump to
the top
Scroll down
F1
Jump to
the bottom
F3F2
F4
F1 Statistics
From the Statistics menu, you can choos e to display any of the following statistics for the displ ayed data sets:
• Minimum (Min), the lowest value in the data set,
• Maximum (Max), the highest value in the data set,
• Average (Avg), the average of all values in the data set,
• Standard Deviation (σ), a measure of how much the data varies from th e
averag e, and
• Co unt (#), the number of values in the data set.
Statistics menu
Page 36

30 Table
The chosen st atistics will be displayed at the bottom of every column. To choose
a statistic, select it from the menu.
22
To turn off a displayed statistic, select it
again.
Select Show All or Hide All to turn on or off all of the statistics.
Table with statist ic s d isp layed
F2 Edit Cell
When you are navigating in an editable column, press to edit the selected
cell. See “Manually Entered Data” on page 32 for instructions on editing data.
F2
F3 Edit
22
To select a statistic from the Statis-
tics menu:
Keypad
1. Press to open the Statistics
2. Use the arrow keys to move the high-
Mouse
1. Click “Statistics” at the bottom of the
2. Click the desired statistic.
F1
menu.
light to the desired statistic and press
;
or
press the number on the keypad corresponding to the desired statistic.
screen to open the Statistics menu.
The options in the Edit menu are used when editing or entering data. See “Manually Entered Data” on page 32 for more information.
New Data Column Select New Data Column from the Edit menu to create an
editable data set. See “Manually Entered Data” on page 32 for more information.
Insert Cell Insert Cell works only when the dashed Navigating Box is visible
23
(see page 34). When you select Insert Cell, a new cell is added directly above the
Navigating Box. If the column contains numeric dat a, the new cell will contain
the number 0. If the column co ntains text data, the new cell will be blank. Every
cell below the new cell shifts down by one position.
Delete Cell Delete Cell works only when the dashed Navigating Box is
23
visible
(see page 34). When you select Delete Cell, the cell that the Navigat ing
Box is on is deleted. Every cell below the deleted cell shifts up by one pos ition.
Num Lock Num Lo ck is on l y ava il ab l e in th e Ed i t menu when an edi table column is displayed. When Num Lock is turned on (which it is by default), a check
mark ( ) appears next to it in the menu, and the keypad operates in numbers only mode.
When Num Lock is turned off, the keypad can be used in multipress text input
mode (see page 90) to enter numbers and letters. To turn Num Lock on or off,
select it from the Edit menu.
Edit menu
23
To make the Navigating Box appear in
an editable column, press .
Esc
Caps Lock Caps Lo ck is only av ailable in th e Edit menu whe n an editable column is displa yed. When Caps Lock is t urned on, a check mark ( ) appears next
to it in the menu. When used in m ultipress text input mode, the keypad inputs
capital letters.
Page 37

F4 Tables
Xplorer GLX Users’ Guide 31
F4
Tables Menu
From the Tables menu, you can select to display one, two, three, or four col-
24
umns.
If you increase the number of colum n s, new columns are added to th e
right side (the GLX automatically selects data sources, if available, for new columns). If you decrease the number of columns, they will be removed from the
right side (the data displayed in those col umns disappears, but is not be permanently delet ed).
24
To select an option from the Tables
menu
Keypad
1. Press to open the Tables menu.
2. Use the arrow keys to move the high-
Mouse
1. Click “Tables” at the bottom of the
2. Click the desired menu option.
F4
light to the desired menu option and
or
press ;
keypad corresponding to the desired
menu option.
screen to open the Tables menu.
press the nu mber on t he
Tables with one, two, three, and four columns
Other options in the Tables menu are described below.
Show Time Sel ect Show Tim e to add a colum n of ti m e data in th e le f t- most
position.
25
If there are four columns displayed when you select Show Time, the
fourth column will be removed and the other three columns will shift to the right
to make ro o m fo r th e ti m e column on th e le f t.
Date/Time To turn on this opti on, select it from the Tables menu. With the
option turned on, times displayed in t he Table appear as the date and ti me of day
at which each data point was recorded. Wit h the Date/Time option turned off,
time da ta appears as m e as u r ed f rom the star t of data coll ec tion.
The Date/Time format is set in the Settings screen. See page 85.
Lock Run Se l ec tio n When Lock Run Selection is on (which it is by default),
all data columns will display the same run number, and changing the run number
25
To show time in a column other than
the first one, select it from the data
source menu at the top of the desired
column. See “Data Source” on page 28
for more information.
Table with Date/Time option
Page 38

32 Table
of one colum n will cause al l of them to change.26 To turn Lock R un S election off
or on, select it from the Tables menu.
Export All Data If you have a USB storage device
27
(such as a USB flash
drive), you can use this option to export data in tab-delimited text format. The
GLX creates a text file on the storage device that you can open on a computer in
a spreadsheet, mapping software, DataStudio, and other programs.
See page 83 for other ways to save and open data on a USB storage device.
Connect the storage device to the GLX’s USB port and select Expor t All Data
from the Tables menu. A dialog box appears showing which data sets will be
exported. Highlight any of these data sets and press to exclude it. To select
other data source s for exporting press to add a single data source or press
F4
to add all data sources that have been set to “vis ible” in the Sensors screen.
Press (OK) to create the export file on the USB sto rage device .
F1
Before exporting data for use with mapping software, display time in the first
column and turn on the Date/ Time option (see page 31).
F3
28
To view the exported data, disconnect the storage device from the GLX and connect it to a computer. You will find the text file at the root level of the storage
device. Its filen ame enc odes t he dat e and time at whic h t he dat a was exp orted; for
instance, i f you exported data on October 28, 2005 a t 11:22:53 AM, the filenam e
will be “Export10282005112253.txt”. You can open this file in a text edit or,
spreadsheet, or other program designed to import tab-delimited data.
29
Print If there is a printer connected to the GLX, select Print to print one page of
data. The GLX will print the data that are visible on the screen, plus as much
additional data as will fit on one page.
30
Print All Select Print All to print the entire contents of the displayed data sets,
including data that are not currently vis ible on the screen (data that you would
have to scroll up or down to see). If necessary, the GLX will print multiple pages.
26
See “Run Number” on page 29 for
instructions on changing the run number
displa ye d in a column.
27
The USB storage device must be formatted using the FAT16 or FAT32 file
system. Most flash dr ives are for matted
this way. Other mass-storage devices
such as portable hard drives and audio
players may also be comp atibl e. Y o u can
use a USB card reader, however the
card must be in the reader before you
connect the reader to the GLX.
28
If you export data while data collection
is in progress, the text file will contain the
data collected up to that point, and the
GLX will continue to collect data.
29
T o import the file into DataStudio, open
the File menu and select Import Data.
30
For more information on printing, see
“Printing” on page 91.
Manuall y En ter ed Da ta
In addition to col lec ting data from sensors, the GLX allows you to enter data in
the Table display via the keypad or an attached keyboard. Any da ta that you ha ve
entere d can la ter be edited.
Entering a New Data Set
Creating a New Data Column Before you can enter data, an edit able data
column must exist. To create one, press to open the Edit menu and select
New Data Column.
The keyp ad sh ort cut for c reat i ng a new da ta c ol um n i s , , pre sse d i n
sequence.
The new editable column takes t h e place of the first blank colum n in the Table. I f
there is no bl a nk co l umn, and the r e ar e th r e e or fe wer other col u m n s, the new
editable column is added on the right side of the table. If the Table is already displaying four columns, the new editable column replaces the fourth column.
F3
1pqrs
F3
Create
an editable
data column
F3
Page 39

Xplorer GLX Users’ Guide 33
Entering Numeric Data In a New Column In the new editable column, you
will see a box around the first cell and a blinking cursor inside the cell.
1. Type a number on the keypad (or attached keyboard) , then press .
Box with
blinking
cursor
When editing data in the Table, has the same effect as .
=
2. The box and cursor will step to the next cell in the column. Enter another
value and repeat.
3. When you are finished, press . (You must press to lock in the last
value before you press .)
If you would like to change or add to the data after you have pressed ,
refer to “Editing an Existing Data Set” on page 34.
Esc
Esc
Esc
Entering T ext Data in a New Column In addition to numeric data, the Table
allows y o u to cr ea t e a co lu m n of te x t.
1. Create a new data column as described on page 32.
2. Pres s to open the Edit m enu. I f Num Lock is turn ed on, sel ect it to t urn
F3
it off and enable multipress text input mode. (If you are using an attached
keyboard, this step is unnecessary.)
For mor e inf or mat io n, see “ Num Loc k” on p age30 and “Multipr es s Text Input
Mode” on page 90.
3. Type a non-numeric string of text and press .
4
ghi
Press or
click here
to turn off
Num Lock
F3
The non-numeric text string can contain numerals , but it must have at least
one letter or punctuation mark, so the GLX knows that it is supposed to be
text. This limitation applies to only one cell in the column. After non-numeric
text has be en ent e red i n o ne cell , t h e GL X wi ll t r eat e ver y thin g i n t h at col u mn
as text, even if it looks like a number.
4. A dialog box will appear, readi ng: “Treat this column as text data?” Press
F1
to select OK.
The column is now configured to contain text data. If you enter a numeric
value it will be tre ated as te xt only. Y ou can recogniz e a text- only da ta set by
its left-j ust ification (contents appe ar on the left side of the column) as
opposed to numeric data, which is always righ t-justified.
5. Conti nue entering text in subsequent cells. Press after you type in each
cell to loc k in that text string and step to the next cell. You can press on
a blank cell to leave it empty.
6. When you are f inish ed ente ring dat a, pre ss . (You must press to lock
in the las t val u e before you press .)
If you would like to change or add to the text data af ter you have pressed
Esc
, refer to “Editing an Existing Data Set” on page34.
Esc
Esc
F1
Text data
left-justified
F2
Numeric data
right-justified
Page 40

34 Table
Naming Manually Entered Data and Adding Units
By default, new editable data sets are named “Data 1,” “Data 2,” etc., and they do
not have defined units. To change the name and add units, open the data source
menu and sele ct Data Properties.
For more information, see “Data Source” on page 28, and “Data Properties”
on page 69.
31
Editing an Existing Data Set
The above section, “Entering a New Data Set” starting on page 32, describes
how to crea t e an d en ter dat a in a new co lu mn . Thi s sec t ion de scr ibe s ho w to
change and add to a manually entered data set that has previously been created.
Whenever you have one or mor e edi table columns displa yed in the Table, one of
the editabl e ce lls is surrounded by a box. The box is eit her an Editing Box (solid
lines) or a Navigating Box (dashed lines).
31
To open the data source menu and
select Data Properties
Keypad
1. If the blinking cursor is visible,
2. Press to light up the active fields.
3. Use the arrow keys to move the high-
4. Press to open the menu.
5. Us e th e ar ro w key s to hi gh lig ht Data
Mouse
1. Click the data source field to open the
2. Click Data Properties.
Esc
press .
light to the data source field.
or
Properties and press ;
the number on the keyp ad correspondi ng to Data Properties.
menu.
press
Editing Box The Editing Box
32
is drawn with solid li nes, and alway s contains a
blinking cursor. It may be on a cell that already contains data, or it may be on an
empty cell.
To move the Editing Box to a different cell, refer to “Navigating Box” below.
If the Editing Box is on an empty cell, anything that you type on the keypad (or
attached keyboa rd) will appear in that cell.
When the Editing Box is on a cell that already contains dat a, what you type will
either replace or amend the contents of the cell , depending on whether the contents are highlighted.
• If the cell contents are highlighted, they will be replace d by any num ber or
text that you type. If you press , the entire contents of the cell will be
Õ
deleted.
• If the cell contents are not highlighted, they will be amended at the location
of the blinking cur sor. If you press , the character to the le ft of the cursor
Õ
will be delete d.
By default, when the Editing Box appears on a ce ll, the conte nts (if any) a re highlighted. To remove the highlight, press the le ft or right arrow key, then use the
left or right arrow key to move the blinking cursor to the position where you
would like to make an edi t.
32
If you do not see the Editing Box,
F2
press .
Editing Box on an
empty cell
The existing
contents will
be replaced
The existing
contents will
be amended
After you have changed the cell contents, you must press to lock in the
change. If you want to ca nce l the change, or leave the cell without entering data,
Esc
press instead of .
If the contents of a cell are not highlighted, you can restore the highlight by
pressing .
Navigating Box The Navigating Box
F2
33
is drawn with dashed lines. Use the up
and down arrow keys to move it within an editabl e colum n. Use the left and right
arrow keys to move it to oth er ed itable columns.
33
If an ed i t able c ol umn e xi sts , bu t yo u do
not see the Navigating Box, press .
Esc
Page 41

Xplorer GLX Users’ Guide 35
Use the arrow keys
to move the
Navigating Box
Position the Navigating Box on a cell whe r e you would like to enter or edit data,
then press to make the Editing Box app ear. To restore the Navigating Box,
press .
F2
Esc
If you would like to add data to the bottom of a data set, posi tion the Navigating
Box on the first empty c ell below the existing data and press .
F2
Table Scrolling with Manually Entered Data
At any time, up to eight cells of data are visible in a manually entered data column. As with regul ar Table scrolling (see pag e 29), use the up or down arrow key
to scroll the Table up or down and make other rows of data visible.
To scroll the Table when manually entered data column is displayed, the dashe d
Navigating Box must be visi ble.
(or press and hold it) to move the Navigating Box to the first visible cell, then
continue to press (or hold) the key. To scro ll down, press the down arrow key
repeatedly (or press and hold it) to move the Navigating Box to the last visible
cell, then continue to press (or hold) the key.
34
To s croll up, press th e up arrow ke y repeate dly
F2
Press to edit
this cell
34
If the Navigating Box is not visible,
Esc
press .
F2
Press to add
to this data set
Press to scroll up
Press to scroll down
All column s scroll together. The Table will not scroll past the bottom of th e column containing the Navigating Box. In the tabl e pic ture below, the Navigating
Box is at the end of the shorter data column. To scroll the Table down, press the
left arrow key to place the Navigating Box on the longer manually entered column.
Page 42

36 Table
Graphing Manually Entered Data
Numeric Data After you have cr eated an editable numeric data set in the Table,
you can display it in the Graph. In the Gr aph, select the e ditable data from the
horizontal or ve rtical data source menu (see page 15).
Text Data A text data set can be displayed on the horizontal axis of the Graph.
First select a numeric data as the vertical data source, then select the text data as
the horizonta l data source (see page 15). The text from each cell of the Ta ble
appears on the Graph as a label next to the corresponding data point.
Graph displa yi ng ma nua ll y ente red
text data on the horizontal axis
Page 43

Digits Display
Use the Digits display to show data from up to eight data sourc es . This display
monitors and shows live data even when the GLX is not recording.
Data Source Units
Digits display
To Open the Digits Display
From the Home Screen, do one of the following:
Xplorer GLX Users’ Guide 37
use the arrow keys to highlight the Digits icon, the n pres s ; or
click the Digits icon.
Choosing Data to Display
Data Source Select the data source field35 at the top of each section to select a
data source. A dat a source would usually be a sensor measur em ent or a calculation based on a sensor mea surement.
Sensor measurements or calculations based on sensor measurements can
vary while data collection is in progress. If you select a static data source
(such as manually entered data), the Digits display will show only the last
data point.
For mor e information on selecting data from a data source menu, see “Data
Source Menus” on page 89.
Also select th e dat a s ource field to access the Data Prope rties of the displayed
data. See “Data Prope rties” on page 69 for more information.
Units Select the units field
for the selected data source (if available).
35
at the top of each displa y t o select different un its
The Digits icon on
the Home Screen
35
To select a data source field
Keypad
1. Press to light up the active fields.
2. Use the arrow keys to move the highlight to the data source or units field.
3. Press again to open the menu.
4. Us e th e ar ro w key s to hi gh lig ht the
desired menu option and press ;
or
press the number on the keypad
corres ponding to the des ir e d me nu
option.
Mouse
1. Click the data source or units field to
open the menu.
2. Click the desired menu option.
Digits Function Keys
Press , , , or to divide the dis play into two, four, six, or
F1
F3
F2
eight se gments. T he GLX a uto mati cally s elec ts da ta s ourc es, if avai la ble, for new
segments.
F4
Page 44

38 Meter
Meter
The Meter display simulates an analog mete r with a ne edle that deflects in proportion to a sensor measurement or sensor-based calculation. This display monitors and shows live data even when the GLX is not recording.
Data Source Units
Meter dis play
To Open the Meter Display
From the Home Screen, do one of the following:
use the arrow keys to highlight the Meter icon, then press ; or
click the Meter icon.
Choosing Data to Display
Data Source Select the data source field36 at the top of the Mete r dis p lay to
select a data source. A data source would usually be a sensor measurement or a
calculation based on a sensor measurement.
Sensor measurements or calculations based on sensor measurements can
vary while data collection is in progress. If you select a static data source
(such as manually entered data), the Meter display will sh ow only the last
data point.
For more informa tion on selecting da ta from the a data sou rce menu, see
“Data Source Menus” on page89.
Units Select the units field36 at the top of the display to s elect different units for
the selected data source (if av ailable).
Auto Scale and Reset
The Meter ic on on
the Home Screen
36
To select a data source or units field
Keypad
1. Press to light up the active fields.
2. Use the arrow keys to move the highlight to the desired field.
3. Press again to open the menu.
4. Us e th e ar ro w key s to hi gh lig ht the
desired menu option and press ;
or
press the number on the keypad
corres ponding to the des ir e d me nu
option.
Mouse
1. Click the desired field to open the
menu.
2. Click the desired menu option.
Press to automatically scale the Meter . If the GLX is recording data, the
F1
lower and upper limits of the meter will be reset to equal the lowest and highest
values measured thus far in the current or most recent data run. Press to
restor e th e d ef au l t sc ale.
Press to print the Meter. See page 91 for more information.
F4
F2
Page 45

Xplorer GLX Users’ Guide 39
Chapter 2: Utility Screens
This chapter describes the Output screen, Calculator, Notes screen, and Stopwatch.
Output
The Output screen is the control panel for generating so und through the GLX’s
built-in speaker or t hrough headphon es or ampli fied s tereo speakers connec ted to
the signal output port.
To Open the Output Screen
From the Home Screen do one of the following:
use the arrow keys to highlight the Output icon, then press ; or
click the Output ic on.
Navigating in the Output Screen
Output
Settings
Left
Output
Channel
The Output screen is divided into three parts: Output Settings , Left Output Channel, and Right Out put Channel. There are three con trols within each part, for a
total of nine cont rols. One of the controls is always highlighted. Use the arrow
keys to move the highlight. Press to select the highlighted control. If a menu
opens, use the up and down arrow keys to highlight the desired setting and press
. If a cursor appears, ty pe the desired value and press . The Volume, Fre-
quency, and Phase controls can also be set using and .
+
If you are using a mouse, clic k the co ntrol that y ou woul d like t o set ; then
click the desired menu option, or type the desire d value.
Right
Output
Channel
The Output icon on the
Home Screen
Output Fu nct ion Keys
F1 and F3 On/Off
Press to turn the left channel on or off, press to turn the right chan nel
F1
on or off.
F2 and F4
When the Frequency control for the left or right channel is highlighted, press
F2
select one of the step sizes or select Custom Step to enter any value. The step size
determines the amount by which the frequency changes when you press ,
F4
or to set the st ep size for tha t ch an n el. From th e m e n u th at opens ,
X
, , or (see “Frequency” below).
F3
F1
+
Output function keys
F3F2
F4
Page 46

40 Output
Output Settings
1
Output Device
Highlight the Output control and press to select the output device that you
are using.
Headphones Select this opt ion t o pl ay soun d through he adp hones connec ted to
the signal output port on the left side of the GLX.
Internal Speaker If there is nothing connected to the signal output port, select
Internal Speaker to play sound through the GLX’s built-in speaker.
External Speaker Select this option to play sound through a pair of amplified
stereo sp eakers con ne ct ed to th e s i gnal output po r t .
Power Amplifier Selecting this option puts the Output scr een into a special
mode for the optional GLX Power Amplifier.
Volume
The Volume setting determ ines the overall loudness of the output sound. Highlight the Volume control and press or to change it inc rementally; or
press to select the desi red volume from a menu.
+
1
The output settings in the Output
screen can also be c hanged in the
Audio Settings dialog box, accessed
from the Settings screen (see page 87).
When you change the settings in one
location, they are automatically updated
in the other location.
Signal output port
for headphones or
a pair of stereo
speakers
Speaker Config
When Output Device is set to Headphones or External Speak er, the two options
for Speaker Config are Stereo and Mono. When Output device is set to Internal
Speaker, Mono is the only option. In Mono configuration, the si gnals from both
channels are combined within the GLX; both external speakers or both sides of
the headphones play the same combined signal. In S tereo configuration, the Left
Output Channel pl ays through the left speake r or the left side of the headphones,
and the Right Output Channel plays through the right spe ake r or the right side of
the headphones.
2
Left and Right Output Channels
Wave
Highlight the le ft or right Wave control and press to set the wave form of
each output cha nnel. The options are Sine , S quare, Ramp, and Triangle.
Frequency
Highlight the left or right Frequency control and press or to change the
frequency up or down by the value specified above or ; press or
to multiply or divide the frequency by that value. To enter the frequency
directly, press . The frequency can be set between 240 and 5000 Hz for the
internal spea ker, or between 60 and 5000 Hz for external speakers and headphones.
Phase
+
F2
F4
2
If you are using stereo headphones to
demon st rate beats or de structive inte r ference, set Speaker Config to Mono so
that each ear ca n he ar bo th t on es .
Sine
Square
X
Ramp
Triangle
Highlight the left or right Phase control and use or to adjust
+
the phase up
or down, or press and enter the des ired phase. The phase of each channel
can be set between - 360° and 360°.
Output wave forms
Page 47

Xplorer GLX Users’ Guide 41
Calculator
You can use the GLX Calculator like a regular calculator for finding the result of
a simple expression, like a graphing ca lculator for plotting equations, and for performing operati ons, i n real time , on stre ams of d ata c ollec ted from senso rs and on
sets of manually entered data.
To Open the Calculator
From the Home Screen, do one of the following:
press , the function key below the Calculator icon;
F3
use the arrow keys to highlight the Calculator icon, then press ; or
click the Calculator icon.
From anywhere in the GLX environment, you can always get to the Calculator
with the shortcut + .
F3
Types of Calculations
The Calculator supports four types of calculations: basic, algebraic, graphing,
and sensor-based. The following examples will demonstrate the four types.
Basic Calculations
Basic calcul ations involve only numer als (no constants or variab les ). Open the
Calculator and try this:
• On the first blank line, type:
1 + 1
The Calculator icon on
the Ho me Screen
Result is added to the
entered expression
Cursor moves
to next line
The Calculator responds by adding an equal sign and the result. It also displays the result at the bottom of the screen. Notice that the cursor has moved
to the next line.
• On the next line type:
9 * (8 + 3)
To type the multiplication symbol (the asteris k), press .
For the parenthese s, press once to open the first Functions menu
=
X
F1
the arrows to highlight the pair of parentheses, then press .
Note that has the same effect as .
=
3
; use
Result also
indicated here
F1
3
For more information on the Functions
menu s, se e pag e 48.
Pair of parentheses
First Functions menu
Page 48

42 Calculator
• Press the up arrow key to put the cursor back on the above expression and
modify it to read:
9 * (9 + 3)
When you type something into the middle of an existing expression, the new
characters are inserted without overwriting anything; press to delete the
Õ
characters that you don’t want.
Note that the corr ect result does not appear until you have moved the cursor
to a different line by pressing or , or the up or down arrow key.
=
Algebraic Calculations
Algebraic calculations involve symbols (letters or words ) standing for constan ts .
When you enter an algebraic expression, the GLX fills in the result if it knows
the value of every symbol us ed in the expres sion. If it does not know the value of
a symbol, it will prompt you to enter it.
If you are entering an equation to be graphed, leave one symbol undefined.
See “Graphing Equations” on page 44 for more information.
Try these examples:
• Type:
a + 3
For the a symbol, press twice to open the second Functions menu. Use
the arrow keys to highlight
F1
a
, then pr ess .
This expression has just been
modified, but the user has not yet
pressed or so it appears to
=
show an incorrect result.
F1
press twice
Second Functions menu
For mor e information on the Functions menus, see page 48.
The Calculator does not know the value of a, so it prompts you with:
a =
Type:
5
The Calculator fills in the result of the or iginal expression.
• Try entering a new value for a on the next line:
4
a = 6
Note that th e or iginal expres sion still reads
a + 3 = 8
The Calculator fills in the result of a+3
a
when the value of
4
For the a symbol, press twice
and sele ct it fro m t he sec o nd Fu nc ti ons
menu.
is entered.
F2
Page 49

Xplorer GLX Users’ Guide 43
When there is more than one definition for the same symbol, the calculator
uses the first definition. To avoid confusion, do not define a symbol more
than once. I f you want to c hange the val ue of a symb ol, us e the arrow key s to
go back to the original definition and change it.
Do not
do this
• When you are prompted for the value of a symbol, you can enter another
expression rather than a simple number. Type:
5
b + 3
When pro mpted for th e val u e of b, enter:
1 + 1
The Calculator displ ays the value of b at the bottom of the screen and f ills in
the resu lt of b + 3 on the line above.
• Rather than a simple expression, you can enter a complete equation for the
Calculator to evaluate . Enter:
6
z = y * 2
When pro mpted for th e val u e of y, enter:
4
The Cal cul at or ind ica te s the val ue of y at the b ot tom of the scre en. To see the
value of z at the bottom of the screen, use the up arrow key to put the cursor
on the definition of z.
5
For the b symbol, press twice
and sele ct it from t he second Functions
menu.
Calculator fills in result
Value of b
6
For the z or y symbol, press
twice and select it from the second
Functi ons menu.
F2
F2
Cursor
Value of y
Cursor
Value of z
Reposition the cursor to see the value of z
Page 50

44 Calculator
• A symbol does not have to be a single letter. The Calculator will recognize
any text string (without spaces) as a symbol, including text strings that contain numerals. (To type text on the keypad, see “Num Lock” on page 50.)
Examples of text strings used as
symbols in algeb raic calcu lations
Graphing Equations
If you enter an equation that contains one undefined variable to the right of the
equal sign, the GLX can gra ph it.
• Type:
7
y = m * x + b
• When prompted, assign numeric values for m and b, but not forx.
• Press the up arrow key to place the cursor on
y = m * x + b
and press .
F3
The equation is plotted in a preview graph in the lower half of the scree n.
The preview graph will a lways show the equation that the cursor is on.
(Move the cursor down to m and see what happens.)
Cursor
7
For the
y, m, x,
twice an d select it from the sec-
F2
ond Functions menu.
Enter values for m and b, but not
or b symbol, press
x is undefined
x
F3
The preview graph shows the equation
that the cursor is on
Press again to turn off the preview grap h.
F3
• The preview graph is a simplif ied version of the Graph s creen, witho ut al l of
the scaling and analysis features.
F1
+ , then select th e calculation ( ) from the data source menu of
8
For the normal full-screen Graph, press
the vertical axis.
8
If y ou are using a mouse, you can scale
the preview graph by direct manipulation
(see page 17).
Page 51

Xplorer GLX Users’ Guide 45
See “Data Source” on page 15 for more information about selecting data in
the Gr aph.
In the Graph, select the calculation from
the data source menu
• You don’t have to use x as the undefined variable; whichever sy mbo l you
leave undefined on the right side of the equation will be plotted on the horizontal axis. However, the labe l on the horizontal axis will always read “x,”
even if the variable used in the calculation is not x.
Do not leave more t han one symbol on the right side of the equatio n undefined. If you do, the graph will use both of them as model ranges with confusing results.
• The text on the left side of the equation does not have to be y. The text to the
left of th e equal sig n is th e na m e of th a t calcula ti o n, and wil l app e ar as th e
vertical axis label on the Graph. It can consi st of any combination of letters,
numerals, and spaces.
If you are defining more tha n one equation to be graphed, use dif f erent text
on the left s ide of each equation so that you ca n distinguish between them in
the data source menu of th e Graph.
When defining
multiple equations
to be graphed,
give each a
unique name
Each equation can be
identified in the data
source menu of the
Graph by its unique
name
Sensor-based Calculations
You can create a calculation to automatically transform any data collected by a
sensor.
• Connect a temperature probe to one of the ports on the left side of the GLX.
Press to collect data for a few seconds. Press again to stop.
Page 52

46 Calculator
• Open the calculator . On the first blank line, ente r:
9
d = [Temperature (°C)] - 20
Instead of typing “[Temperature (°C)]”, select it from the [Data] menu.
F2
Open the [Data] menu; select Temperature and °C
• Press the up arrow key to place the cursor on the calculation. Press to
10
F3
view the calculation on the preview graph. Note how the calculated data di ffers from th e or iginal tempera tur e data.
• Press + to open the full-screen Graph. Press twice to open the
F1
vertical data source menu and choose the calculat ion (see right).
See “Data Source” on page 15 for more information about selecting data in
the Gr aph.
9
For the d symbol, pr es s twice and
select it from the second Functions
menu.
10
T o select Temperature from the
[Dat a] menu
Keypad
1. Press to open the [Data] menu.
2. Use the up or down arrow key to high-
3. The units menu will open. Use the up
Mouse
1. Click [Dat a] to open the menu.
2. Click Temperature .
3. The units menu will open. Click °C.
F2
light Temperature and press ;
press the number on the keypad corresponding to Temperature.
or down arrow key to highlight °C and
or
press ;
keypad corresponding to°C.
press the number on the
F1
or
Calculation
• Press to begin collect ing data again. Note that the calc ulation is performed in real time on the new data.
• Calculations have no units by default. To assign units to a calculation, select
Data Properties from the data source menu in the Graph (see “Data Properties ” on page 69).
• In addition to sensor-collected data, calculations can operate on other data
sources, such as manually entered data sets, other calculations, and time. To
insert any data source into a calculation, press and select it from the
F2
[Data] m enu .
Uses of Sensor-based Calculations
Shift Data Vertically In the example above, the sensor-bas ed
tracts 20 °C from the measured temperature. This calculation
experiment where the difference between the measured temperature and room
temperature is of interest (a study of Newton’s law of cooling, for insta nce ). The
calculation in the example shifts the temperature graph down by 20 °C.
Time-shift Data When a data plot appears on the Graph with Time on the horizontal axis, the plot can be shifted right or left with a time-based calculation.
For example, the graph shown at the right is from an experiment in which a temperature probe was dipped into warm water, then removed, wiped dry, and
allowed to cool. The r elevant data start after the probe was dried, about 14 seconds from the start of data collection. To make the analysis simpler, the graph
needs to be shifted l eft so that the relevant data start at time zero. To do so, cr ea te
the calculation below. (To insert [T ime (s)], press and select it from the
F2
[Data] m enu .)
calculation sub-
might be used in an
In the Graph, choose the calculation
from the data source menu
This data plot needs to be time-
shifted
[Time (s)] - 14
Page 53

Xplorer GLX Users’ Guide 47
Plot the calculation on the horizontal axis in place of Time to create the graph
shown below. (See page 28 for instructions on selecting dat a for the horizontal
axis.)
Convert Units of Measure Most of the sensors used with the GLX are programmed w i th SI units (or th e I nternational Sy stem of Units) and, in some cas es,
other common units. If you wish to make a measurement using units that are not
programmed into the sensor, create a calculation to convert the measured data.
11
For example, if you are us ing a Motion Sensor, which measures position in
meters, and you want to convert the measurement to centimeters, create the ca lculation bel ow. (To ente r text, see “Num Lock” on page 50.)
position in cm = [Position(m)]*100
Calculate an Experimental Value In some experiments, it is possible to calculate an experimental value based on a sensor measurement. For example, in an
experiment where a Motion Sensor measures the acceleration of an object, you
can use the Calculator to calculate the net force:
force = mass * [Acceleration (m/s/s)]
The Calculator will prompt you for the value of mass.
Compare Measurements from Two Sensors When collecting data with
two sensors, a calculation can be used to compare the separate measurements.
For example, if you a re using two temper ature probes, na med “Temperature” and
“Temperature2,” and you want to know the temperature difference between
them, create the calculation:
[Temperature (°C)] - [Temp eratur e2 (°C)]
This data plot has been time-shifted
11
For certain measurements (temperature, for instance), it is not necessary to
calculate a units conversion because the
sensor is programmed with other common units of meas ure (°C, °F, and K),
which can be selec ted from the units
field of any display. See pages15
and 29.
by -14 s
Graph Line ari zation In some cases, such as the examples below, you may
want to linearize data so th at you can use the Linear Fit tool in the Graph display
(see “Linear Fi t” on p age 19). To do s o, us e the Calc ula tor to calcu late the square,
square root, natural log, etc., of the measured data. (See “F1 Functions” on
page 48 for more information on these and other functions.)
• The graph to the right shows period (T) versus length (L) data from a simple
pendulum. The graph can be linearized by plotting T
the graph (shown below on the left) is 4π
2
/g, where g is the free-fal l acceleration. Alternatively, the g r aph can b e linearized by plot ting T versus . On
the graph (shown below right ), the slope is .
2
T
vs. L for a simple pendulum
2π g⁄
T
vs. √⎯L for a simple pendul um
2
versus L. The slope of
L
Period vs. Length for a
simple pendulum
Page 54

48 Calculator
• The position versus time graph of an object in fre e fall (below right ) exhi bits
a typical quadr atic relationship . The object was dropped from a height of
0.79 m, wit h the release occurring 2.2 s after the start of data c ollection. The
graph can be lineari zed (as shown belo w right) by repla cing T im e on the horizontal axis with the calculation (
a 2⁄
line is , where a is the acceleration of the object.
free fall
[Time (s)]
-2.2)^2. The slope of the best-fit
Linearized free-fall dataPosition vs. Time of an object in
• Voltage versus time graph for a dis charging capacitor is shown below on the
left. The gra ph the natural log of volt age ve rsus ti me is a l inear ( below ri ght).
The slope of the line is , where C is the capacitanc e and R is the
1 RC⁄–
resistance through which the capacitor discharges.
Voltage versus Time data for a
capacitor
Linearized data for a discharging
capacitor
Calculator Function Keys
F1 Functions
Press (or click Functions) repeatedly to access the three Fu nctions menus.
These menus contain the following items.
• Functions: sin, cos, tan, arcsi n, arccos, arctan, ^2, log, ln, sqrt , 10 ^ , e^
• Operators: ^ (the exponent operator)
• Co nsta nts: π
• Commonly used symbols: x, y, z, m, a, b, c, d, α, ω λ, θ
• Sample expressions: y = 2x +3, y = x^2, y = si n (x), y = e^x sin(x)
• Parentheses: a pair of parentheses and a single right parenthesis
• Special Functions: limit, mod, abs, random
• Output-control Functions: outstate, outswitch, outfreq, outvolume
• Logic Operators and Functions: <, >, inrange, and, or, not
F1
The first and second Functions
menus
Page 55

Xplorer GLX Users’ Guide 49
Special functions, output-control functions, and logic operato rs and functions
are typically us ed to control the GLX’s digital and audio output. See “Outputcontrol Calculations” on page 50 for detailed explanations of these functions
and opera t o rs.
Inserting a Function When you select an item from one of the Functi ons
menus, it is inserte d at the curso r location.
12
If the it em inclu de s a pa ir of p ar en -
theses, the curs or will be positioned betwe en them.
Degrees/Radians A calculation containing a tr igon ometri c functi on can be set
to operate in degrees or radians. This setting is applied to each calculation separately. The lower right corner of the Calculator indicates whether the calculation
that th e cur sor is on is set for deg r ees or radian s .
To switch the setting, press to open the Edit menu and select (or desele ct)
F4
Radians. After you ha ve sw itched the setting for a calc ulation, you must press
=
or to make the GLX reevaluate the calculation.
Degree/Radian Indicator
12
T o select an item fro m the Func-
tions menus
Keypad
1. Press once to open the first
2. Use the arrow keys to high light the
Mouse
1. Click Functions once to open the first
2. Click the desired item.
F1
menu, or twice to op en the seco n d
menu.
desired item and press .
menu, or twice to op en the seco n d
menu.
Predefined Constants The sym bol π is a predefine d constant. The C alculator
will recogniz e its value as 3. 141592 when it is us ed as part of a n express ion or on
the right side of an equa tion.
The symbol e is a predefined constant equal to 2.718282. Th e capital letter E can
be used inte rchange ably wi th e. Typically e is used with the expone nt ope rator (^ )
to form e^, the exponential function.
13
F2 [Data]
Press (or click [Data]) to select a data source to insert into an equation. See
“Sensor-based Calculations ” on page 45 for more information.
The [Data] menu contains sensor measurements, manually entered data, calculations, and time.
F2
F3 Graph
Press or (click Graph) to plot the equation that the cursor is on in the preview graph on the lower ha lf of t he screen. See “Graphin g Equations ” on pa ge 44
for more information.
F3
13
When usin g the co ns t an t e, be careful
not to enter it in a way that the GLX will
mistak e for sc ie ntific notat i on . Se e
page 91 for more information.
Page 56

50 Calculator
F4 Edit Menu
Press (or click Edit) to ope n the Edit menu, which contains the options
F4
described below.
Num Lock When Num Lock is on (which it is by defaul t), an icon ( ) appears
in the l o w er right cor n er of the screen.
Num Lock Icon
To turn Num Lock on or off, select Num Lock from the Edit men u.
14
With Num Lock on, you can type only numerals (not letters or punctuation
marks) with the k eypad. Mult iple pre sses of a ke y will not cycle thr ough mult ipl e
characters. (Tha t way you can type “100,” for instance, without having to wait
between zeros.) The single exception is the letter E, which you can always type
by pressing deci mal point key ( ) twice.
EE
With Num Lock off, the keypad operates in multipress text input m ode (see
page 90), allowing you to e nter letters and punctuation marks.
It is often unnecessary to turn off Num Loc k because commonly used letters and
other symbols can be selected from the Functions menus, and the names of data
sources can be selected from the [Data] menu.
Edit menu
14
T o select an option from the Edit
menu
Keypad
1. Press to open the Edit menu.
2. Use the arrow keys to highlight the
Mouse
1. Click Edit to open the menu.
2. Click the desired menu option.
F4
desired menu option and press ;
or
press the number on the keypad
corresponding to the desired menu
option.
Radians Select or deselect this option to switch the highlighted calculation to
radians or degrees. See “Degrees/Radians” on page 49.
Clear Expression This optio n remove s the expre ssion th at the cursor i s on and
leaves a blank line.
Delete Expression This option removes the expression that the cursor is on
and shifts up everything below it to fill in the blank line.
Insert Expression This option shifts the ex pres sion that the cursor is on (and
everything bel ow it) down by one line to create a bl ank line at the cursor loc ation .
Data Properties Select this optio n to open the Data Properties dialog box for
the highlighted calculation. See pag e 69 for more information.
Print If there is a printer connected to the GLX, select Print to print the Calculator screen.
15
Output- co ntr ol Cal cul ati o ns
The functions and oper ators des cribed below ca n be selected from the third Fun ctions menu.
the GLX’s audio outputs, and the out puts of connected Digital Adapters.
16
With the m, yo u can writ e ex pr ess io ns in the Cal cu lat or th at con trol
15
For more information on printing, see
“Printing” on page 91.
16
See “F1 Functions” on pag e48.
Page 57

Xplorer GLX Users’ Guide 51
Special Functions
These special functions do not directly control output, but can be useful in combination with the output-control functions.
limit(min , max, x)
The limit function is used keep a varying value within a
specified r ange. The function has three arguments: min, max, and x.
• If x < min, then limit(min, max, x) = min.
• If x > max, then limit(min, max, x) = max .
• If min ≤ x ≤max, then limit(min, max, x) = x.
mod(numerator, denominator)
The mod function is equal to the remainder
when numerator is divided by denominator. Th e argu ments numerator and
denominator can be any number (not just whole numbers). If denominator =0,
then mod(numerator, denominator)=0.
abs(x)
random()
The abs function is equal to the absolute valu e of its argument.
The random functio n equals a rando mly genera ted number be tween 0
and 1. Each time the func tion is evaluated, a new random val ue is generated.
Note that the random function appears wit h a pair of parentheses after it , but it
cannot have anything between the parentheses .
Output-control Functions
The output-c ontrol functions s et the output of the GLX’ s audio channels and connected Digit al Ada pters. The output-cont rol functions work only when data collection is in process. Each function must be used as part of a sensor-based
calculation (the calculation must include data from a sensor or time). Any property of the audio output that is not specified in the Calc ulator will be det er m ined
by the setting in the Output screen (see page 39). In the Functions menu, the
names of these functions are abbreviated to outstate, outswitch, outfreq, and out-
volume.
outputstate(GLXPort, AdapterChannel, state)
tion to switch on or off a Digital Relay connected through a Digital Adapter.
Use the outputstate func-
17
The first argument of the function, GLXPort, can equal 1, 2, 3, or 4; it identifies
the port that the Digital Adapter is connected to. The second argument,
AdapterChannel, can equal 1 or 2 and identifies which channel of the ad apter the
Digital Relay is connected to. The thi r d argument, state, can equal any number
and determines whet her the relay is OFF or ON.
• If state = 0, then the relay is OF F.
• If state ≠ 0, then the relay is ON.
outputswitch(Channel, state)
the left or right audio output channel .
Use the outputswitch function to turn on or off
18
The first argument, Channel, can equal 1
(for left) or 2 (for right) and identifies which audio channel is to be controlled.
The second argument, state, can equal any number and determines whether the
audio output is OFF or ON.
• If state = 0, then the aud io output is OFF.
• If state ≠ 0, then the digital output is ON.
17
The Digital Relay is PASCO part
CI-6462. The Digital Adapter is PASCO
part PS-2159.
See “Relay Control” on page 67 for
instructions on connecting and configuring the adapter.
18
Whether the output is played through
the ou tput port (to a pai r of headphones
or amplified speakers) or through the
GLX’ s built-in speaker depends on the
Output se tt i ng in th e Out put scr een (s ee
page 40).
Page 58

52 Calculator
outputfreq(Channel, frequen cy)
quency of the audio o utpu t sign al.
Use the outputfreq function to set the fre-
18
The first argument, Channel, can e qual 1 ( for
left) or 2 (for right) and identifies which channel is to be controlled. The second
argument, frequency, sets the frequency, in Hz, of the output signal. The fre-
quency can be set between 250 and 5000 Hz for the built-in speaker, or between
60 and 5000 Hz for headphones or external speakers.
outputvolume(volume)
18
nals.
The argument of the function can be set between 0 (for no output) and 10
Use this function to se t the loudness of the output sig-
(for the loudest possible output). The function controls both audio channels
together.
Logic Operators and Functions
A logic function ha s two poss ible values: 0 and 1. A logic operator (< or >) is
used to build an expression that can have a value of 0 or 1.
Less Than and Greater Than If an expression such as a < b is true, then it
equals 1. If the expression is false, then it equals 0.
inrange(min , ma x, x)
and max, define the upper and lower limit of a range, and the third, x, is an input
value to be compared with that range. If min ≤ x ≤max, then th e f u nction equ als
1. If x < min, or x > max, then the function equals 0.
This function has three arguments: the first two, min
and(a, b)
This function equals 0 if either of the arguments equals 0; other wise
the function equ als 1.
or(a, b)
This function equal s 0 if bot h of the a r guments equal 0; otherwise the
function equals 1.
not(x)
This function equals 1 if the argument equals 0; otherwise the function
equals 1.
Audio Temperature Indicator
In this example, the GLX is programed to emit a sound when the temperature
exceeds 30 °C. The frequency of th e sound increases as t h e temperatur e
increases.
Connect a tempera ture sensor to the GLX. In the Calculator, enter these two
expressions:
outputswitch(1,[ Tem perat ure (°C)]>30)
°
outputfreq(1 ,[Tem per ature (
C)]*10)
Audio Temperature Indicator Example
Select the outputswitch and outputfreq functions from the Functions menu.
Select the [T emperature (°C)] meas u r ement from the [Data] menu.
F1
F2
Press to start data collection. Pla ce the temperature sensor in warm water.
Then allow it to cool again. When t he temperature reaches 30 °C, the GLX emits
a tone at 300 Hz. As the temperature rises, the frequency of the tone rises.
Page 59

Notes Screen
Use the Notes screen to record experiment instructi ons, information about the
sensors and displays that you have set up, notes on recorded data, or any other
text in formati on .
To Open the Notes screen
From the Home Screen, do one of the following:
use the arrow keys to highlight the Notes icon, then press ; or
Xplorer GLX Users’ Guide 53
click the Note s icon.
Entering, Reading, and Printing Text Notes
Enter text via the GLX keypad or a connected USB keyboard.
See “Multipress Text Input Mode” on page 90 or “Using a USB Keyboard” on
page 90.
To input a single capit al letter, f irs t press to turn on Shift. To input all capital letters, turn on Caps Lock by pressing . To disable multipress text input
mode (for typing just numbers), turn on Num Lock by pressing .
F1
The GLX can store multi ple note s page s. To start a new page, press to open
the Notes menu and select New Page .
If more than one page exists, you can also press to select a previo usly created page for vie wing and editing, or to delete the currently display ed page. The
page number of the visible page and the total number of pages are indicated in
the lower right corner of the screen.
F1
F2
F3
F3F2
19
F4
F4
F4
The Notes icon on the
Home Screen
19
To select an option from the Notes
menu
Keypad
1. Press to open the Notes menu.
2. Use the arrow keys to hi ghlight the
Mouse
1. Click the page number in the lower
2. Click the desired menu option.
F4
desired menu option and press ;
or
press the number on the keypad
corresponding to the desired menu
option.
right corner to open the Notes menu.
To print the currently displayed page on a connected printer, press and
F4
select Print. To print all notes pages, select Print All.
For more information, see “Printing” on page 91.
Click here
or
Press
The Note s menu
F4
Page 60

54 Stopwatch
Sto pwat ch
With the Stopwatch screen, you can use the GLX like a conventional stopwatch.
To Open the Stopwatch
From the Home Screen, do one of the following:
use the arrow keys to highlight the Stopwatch icon, then press ; or
click the Stopwatch icon.
Timing with the Stopwatch
The numbers displa yed on the stopwatch indicate elapsed time in minutes and
seconds.
minutes seconds
F1
Press to start timing. Press again to stop timing.
F1 F1
When timing is stopped, press to set the displayed elapsed time back to
00:00.00
F2
F2
The Stopwatch icon on
the Home Screen
Page 61

Xplorer GLX Users’ Guide 55
Chapter 3: Settings and Files
Sensors Screen
In many cases, the sensor set-up proce ss requires nothing m ore than simply plugging in a sensor. However, if you would like to change a ny of the sensor settings,
or configure a sensor that you have not physically plugged in, or change the
mode of data collection, go to the Sensors screen. Also use the Sensors Screen to
configure the GLX’s micropho ne as a sound s ensor.
Sensors screen
To Open the Sensors Screen
From the Home Screen, do one of the following:
press , the function key below the Sensors icon;
F4
use the arrow keys to highlight the Sensors icon and press ; or
click the Sensors icon.
From anywhere in the GLX environment, you can always open the Sensors
Screen with the shortcut + .
F4
Working with Multiple Sensors
An icon for each sensor conne cted to the GLX appears at the top of the screen.1
A box around one of the icons indi cate s the s elected senso r . Use the left an d right
arrow keys (or mouse) to select the sensor that you want to set up. The se ttings
for the selected sensor appear in the lower part of the screen.
Multiple Sensors
Selected Sensor
The Sensors icon on
the Home Screen
1
In som e cases , an i con for a se ns or th at
is not physically connected to the GLX
appears in the Sensor screen. Such
icons are designated with .
Top portion of the Sensors screen;
this GLX is connected to an accelera-
tion sensor and a force sensor
Page 62

56 Sensors Screen
Sensor Se ttings
To change any of the settings, use the arrow keys to highlight the settings and
press .
If you are using a mouse, click the de si red setting.
Sample Rate Unit Select Sample Rate Unit
2
to choose how the sampling rate
will be measured. Th e cho ices are samples per second; or second s, mi nutes, or
hours (time betwe en s amples).
Number of
samples per
second
Time between
samples
Sample Rate Sele ct Sample Rate
3
to set the sensor’s rate of data collection
(measured in the units selected above).
+
Open the Sampling Rate menu or change the
sampling rate with and
+
Reduce/Smooth Averaging This feature is a type of oversampling. You can
use it to:
• reduce what would be a large data set to a manageable size,
2
To select Sample Rate Unit
Keypad
1. Use the arrow keys to highlight Sample Rate Unit
2. Press to open the menu.
3. Use the arrow keys to highlight the
or
or
press
press
desired units and press ;
the number on the keyp ad corresponding to the desired units.
Mouse
1. Click Sample Rate Unit to open the
menu.
2. Click the desired uni ts.
3
To select Sample rate
Keypad
1. Use the arrow keys to highlight Sample Rate.
2. Press to open the menu.
3. Use the arrow keys to high light the
desired rate and press ;
the number on the keypad corresponding to the desired rate.
or
1. Use the arrow keys to highlight Sample Rate.
2. Press or to increase or
Mouse
1. Click box to the right of Sample Rate
2. Click the desired rate.
+
decrease the value.
to open the menu.
• smooth noisy data,
• improve the effective resolution of a sensor.
Select Reduce/Smooth Averaging and choose the numb er of points to be aver-
4
aged.
The number of points represents the factor by which the effective sam-
pling rate, data set size and noise level are reduced.
No averaging
2-point averaging
10-point averaging
4
To select Reduce/Smooth Averaging
Keypad
1. Use the arrow keys to highlight
Reduce/Smooth Averaging.
2. Press to open the menu.
3. Use the arrow keys to highlight the
desired number of points and press
;
or
press the number on the keypad co rresponding to the desired
number of points.
Mouse
1. Click the box to the right of Reduce/
Smooth Averaging to open the menu.
2. Click the desired number of points.
Page 63

Xplorer GLX Users’ Guide 57
Zero Automatically On Start This setting appears for sensors that support
zeroing (such as a ccelera tion, rotary motio n, and drop counte r se nsors ). The t hree
choices are “On,” “Off ,” and “Zero Now.” When “On” is selected (which it is b y
default), the se ns or me asurement is adjusted with each new data run to make the
first sample zero. W h en “O ff” is selected, t h e measurement is not autom atically
zeroed. When you select “Zero Now,” the measurement is adjusted to make
present value ze ro, but it will not be re-zeroed a t the start of data collection.
Measurements Each of th e se nsor’s meas urements ha v e a “Visib le ” o r “No t
Visible” tag. Visible measure me nts appear in the data source menus of the display sc re en s. Se lect a meas u rement to chan ge its sett in g fro m “Visib le ” to “N o t
Visible,” or vice-versa.
A measurement set to “Not Visible” does not appe ar in the displays’ d ata
source menus; howeve r, it is still acce ssible by selecting “Mor e” from the
menu. See “Expanding the Data Source Menu” on page89.
5
Sensors Function Keys
F1 Mode
The Mode menu contains options for how the GLX collects data. When you
select a sampl ing mode
Continuous Samplin g Continuous Sampling is the defa ult and most commonly used mode. In this mod e, when you press , the GLX starts to collect
and record data from every s ens or at a constant rate. Data collection stops when
you press again.
6
, that mode is app lied to all sensors.
F1
Modes menu
5
T o change the visibility of a mea-
surement
Keypad
1. Us e the ar row ke y s t o hig hl ig ht the
measurement.
2. Press .
Mouse
Click on the word “Visible.”
6
T o select a sampling mode
Keypad
1. Press to open t he Mode menu .
2. Use the arrow keys to hi ghlight the
Mouse
1. Click Mode to open the menu.
2. Click the desired menu option.
F1
desired menu option and press ;
or
press the number on the keypad
corresponding to the desired menu
option.
The rate of data collection is determined separately for each sensor. See
“Sample Rate” on page 56 for more information.
Manual S am p l in g Select Manual Sampling from the Mode menu to record a
series of single manually triggered samples. See page 60 for instructions on se tting up and using manua l sampling.
F2 Data Properties
To open the Data Properties dialog box for a sensor measurement, first use th e
arrow keys to highlight the measurement, then press . See page 69 for a
description of the Data Properties dial og box.
F2
To open the Properties dialog box,
highlight a measurement before you
F2
press
Page 64

58 Sensors Screen
F3 Microphone
The Microphone menu contains options for setting how the GLX uses its built-i n
microphone. The selected option is indi cated by a check mark ( ) appearing
next to it in the menu.
Microphone
7
7
To select an option from the
Microphone menu
Keypad
1. Press to open the menu.
2. Use the arrow keys to highlight the
Mouse
1. Click Microphone to open the menu.
2. Click the desired option.
F3
desired menu option and press ;
or
press the number on the keypad
corresponding to the desired option.
Sound Sens o r When Sound Sensor is selected, the GLX’s microphone
becomes a sensor tha t collects data showing the wavefo rm of sound. The sound
sensor appears in the upper part of the Sensors screen, jus t like any other sensor.
Like other sensors, the Sound Sensor sett ings include Sample Rate Unit, Sample
Rate, and Reduce/Smooth Averaging; however you typically would not cha nge
any of these s ettings because the sample rate is au tomatically set by the Graph in
Scope Mode.
The Sensitivity setting sets the gai n of the Sound Sensor .
8
For very loud sounds
set the Sensitivity lower; for softer so unds, set it higher. To make the Sound Sensor automatically adjust its sensitivity bas ed on the loudness of the sounds that it
detec ts , se t th e Sensit i vi t y to A u to m atic.
The Sound Sensor is most co mmonly used with the Graph display in Scope
mode. Press and together t o go to the Graph display. Then press
to open the Graphs menu, and press to select Scope mode. P r ess . Whis-
F1
3wxyz
F4
tle or hum; you will see sound wave in the Graph. (See page 22 for more information on Scope mode.)
Sound Lev e l When Sound Level is selected, the GLX’s microphone measure s
the loudness of sound in decibels (on the dBA scale).
The Sound Level sensor operates at a much lower samplin g rate than the Sound
Sensor . Like most othe r sensors , you would norm ally use the Sound Leve l sensor
in continuous or manual sampling mode (see page 57), not in Scope mode.
Audi o N otes With this default setting, the microphone is configured to record
the audio portion of data notes (see “Data Annotation” on pag e 25). If you have
previously re corded sound-sensor or sound level data, selecting Audio Notes is
equivalent to unplugging the Sound or Sound Level sensor. The GLX will preserve any sound dat a sets that ha ve been recorde d, but it will not collec t new data
from the microphone .
8
To change the Sensitivity
Keypad
1. Use the arrow keys to high light
Sensitivity.
2. Press to open the menu.
3. Use the arrow keys to high light the
desired setting and press ;
press the number on the keypad corresponding to the desired se tting.
or
1. Use the arrow keys to high light
Sensitivity.
2. Press or to increase or
Mouse
1. Click box to the right of Sensitivity to
2. Click the desired setting.
+
decrease the value.
open the menu.
or
Page 65

F4 Sensors
Xplorer GLX Users’ Guide 59
The Sensors menu con tains the following options for adding, removing, and calibrating sensors.
9
Add Select thi s option to set up a sensor without physically connectin g it. A
menu containi ng all PASPORT s ensor s wil l op en. Use the a rrow k eys to hi ghl ight
the desired sensor and press .
Remove Use this option to dele te the selected sensor without disconnecting it
from the GLX. All data collected by that sensor will be deleted.
If there are multiple sensors, select the sensor that you want to delete before
selecting the Remove option. See “Working with Multiple Sensors” on
page 55.
It is not necessary to select Remove from the Sensors menu in order to disconnect a sensor; you can simply unplug it.
When you physically unplug a sensor (after recording data), the icon for the sensor remains in the uppe r part of the Sensors screen with above it. All data
recorded from that sensor, and the sensor’s settings (such as sampling rate) are
preserved i n the GLX. If that sensor is ever reconnected, it will be installed in its
old place with the sa me se ttings. If you would like to remove the archived data
and setting s, se lect the icon of the unplugged sensor
10
, then sel ec t Remove fro m
the Sensors menu.
9
T o se l ect an opt i on f ro m th e S e nsor s
menu
Keypad
1. Press to open t he menu.
2. Use the arrow keys to hi ghlight the
Mouse
1. Click Se ns o rs t o op en th e me nu .
2. Click the desired option.
10
T o select a sensor icon
Keypad
Press the left or right arrow key to move
the box to t he ico n i n t he up pe r p ort io n of
the Sens or s sc ree n.
Mouse
Click the icon in the upper portion of the
Senso r s sc r e en .
F4
desired menu option and press ;
or
press the number on the keypad
corresponding to the desired option.
Calibrate Select Cali brat e from the Se nsors menu to open the Cali bra tion di al og
box. See page 71 for a descr iption of the dialog box and instructions on calibrating a sensor.
Analog Adapter with a
ScienceWorkshop
Sensor Set-up
You can connect an analog ScienceWorkshop sensor to the G LX vi a an A n al og
Adapter (PS-2158) . When you conne ct the Analog Ada pter to the GLX, a special
menu listing a ll Sc ienceWorkshop sensors appears. From this menu, se lect the
sensor that you ha ve connected (or will connect) to the adapter.
11
After you have
selected it, the sensor appears in the top portion of the Sensors screen, just like a
PASPORT sensor.
In addition to the regular sensor settings (see page 56), a Sensitivity setting
appears in the Sensor scre en. Th is set tin g contro ls the ga in of the Anal og Adapte r
and can be set to Low (1X), Medium (10X), or High ( 100X). The gain is the factor by which the resolution of the sensor is improved, and by which the range is
decreased.
ScienceWorkshop
Sensors screen with a
Sensors menu (left) and
ScienceWorkshop
sensor (right)
11
To select a sensor form the
ScienceWorkshop
Keypad
1. Connect an Analog Adapter to the
GLX to launch the menu.
2. Us e th e ar ro w key s to hi gh lig ht the
desired sensor. Arrows (
appear on the menu to indicate that
some sens ors are not visible. Press
the up or down arrow key multiple
move the highlight beyond the
times t o
visible portion of the menu.
will scroll to bring other sensors into
view. To skip directly to the last sensor on the menu, move the highlight to
the first sensor, then press the up
arrow key.
3. Press .
Mouse
1. Click the up or down arrow on the
menu (
sensor into view.
2. Click the desired sensor.
Sensors menu
, )
The menu
, ) to bring the desired
Page 66

60 Sensors Screen
Manual Sampling Mode
In Manual Sampling mode, the GLX records a single sample from each measurement only when you trigger it by pres sing . Follow these steps to se t up Manual Sampling mode an d record data.
Set Up
1. Press + to go to the Sensors screen.
2. Press to open the Mode menu.
F4
F1
3. Use the arrow keys to highlight Manual and press .
The Data Properti es dialog box appears. This box s pecifies the name and
units of the (optional) manually entered data. By default, the name is “Keyboard Data” and the units are unnamed.
4. If you plan to manually enter data to go with each sa mpl e, enter the name
and units of this data in the Data Properties box. (See page 69 for instructions on using the Dat a Pr operties box.)
5. Do one of the following:
• Press (OK) to enter Manual Sampling mode with the manually
F1
entered data option.
• Press (No Data) to enter Manual Sampling mode without the
F2
option of manually entering data.
• Press (Graph) to enter Manual Sampling mode with a Graph dis-
F3
play automatically set up to display a sensor measurement on the vertical axis and man ually entered data on the horizontal axis.
F1
F3F2
Sampling
1. Press . The GLX starts measuring, but not recording. A blinking flag
icon ( ) appears in the upper right-hand corner of the screen.
2. When you are ready to take a data point, press . The GLX instantly
records a single sample from each measurement.
3. If you have selected the manually entered data option, the GLX prompts you
to enter data. Type in the data (either numeric or text
12
) and press
F1
(OK).
4. Repeat steps 2 and 3 to record additional samples.
5. When you have finished recording all samples, press .
Cell-sel ective Samp lin g
You can collect data in manual sampl ing mode while viewing any displ ay; however, using the Table display allows additional flexibility. After setting up the
GLX in manual sampling mode as described above, follow these steps to record
data into specific table cells.
1. Press + to open the Table display .
F2
12
To type text data, press to dis-
able Num Lock. The first time the GLX
detects non-numeric data, it will ask you
to confi rm that the da ta shou ld be treate d
as text.
F3
Page 67

Xplorer GLX Users’ Guide 61
2. Press . The GLX starts measuring, but not reco rding. A blinking flag
icon ( ) appears in the upper right-hand corner. Another flag icon appears
at the left side of the first table row.
3. Press th e right arrow key . Notice that the flag icon moves to first cell of one
column. If there is another column displaying collected data (not manually
entered) p r ess the right arrow again to move the icon to that c o lumn. This
icon indicat es which cell will collec t data when you press . If the icon is
at the lef t end of the row, all cell s in that row will co llect data.
4. Use the ar row keys to select which cell or cells in the first row you wish to
collec t data.
5. Press .
6. If you have selected the manually entered data option, the GLX prompts you
to enter data. Type in the data and press (OK).
F1
7. To collect more data, use the arrow keys to position the flag icon on the sin-
gle cell or row where you want to collect data. If the selected cells already
contain data, that data will be overwritten.
All cells in selected row will collect
data
Only selected cell will collect data
Only selected cell will collect data
8. Press .
9. Repeat steps 7 and 8 to record additional samples.
10. When you have finished recording all samples, press .
Why Use C el l -selective S ampling?
Redo a Sample Cell-s elective sampling is use ful for redoing data points. For
instance, suppose that you are measuring the pH of several different solutions.
You place the pH probe in a solution and pres s to record a sample. You then
realize that you made a mistake—you forgot to wait for the measurement to stabilize. To correct the mistake, press the up arro w to retur n the flag i con to t he first
row. Press again to overwrite the data on that row with a new sample.
You can redo any sample even if you have recorded subsequent samples; use the
arrow keys to return the flag icon to any previously recor ded row or ce ll and
press . Remember to move the icon back to an empty row if you want to take
a new sample without overwriting an old one.
Alternate Between Sensors If you have two or more sensors connected to
the GLX, you may want to record single sample s from each sensor sepa rate ly. To
do this you would select a single cell (instead of a whole row) for each sample.
For example, you have sev eral solutions and you would like to measure the pH
and conductivity of ea ch. Place the pH probe in the first solution. Press the right
arrow key to select a single cell in the pH column. Press to record only in
that cell. Remove the pH probe from the solution and place the conductivity
probe in the same solution. Use the arrow keys to select the cell in the conductivity column ( in the same row). Press to record into that cell. Repeat this process for al l o ther solu tio ns. In thi s way you will re cord pH-c onducti vit y data pairs
without having to m ake pH and conductivity measur ements simultaneously.
Previously recorded data in selected
row will be overwritten
Page 68

62 Timing Screen
Timing Screen
Use the Timing screen to set up measurements made with photogates, Smart Pulleys and other switch- or counting-type sensors.
The Timing Screen
To Open the Timing Screen
The T iming sc reen usua ll y launc hes a utoma tica lly when you c onnect a swit ch- or
counting- type digital sensor to th e GLX thro ugh a Photogate Port or a Digital
Adapter.
If a timer for a sensor has already been set up, the Timing screen will not automatically la unch when that sensor is plugge d in. To manually open the Ti ming
screen from the Home Screen, do one of the following:
13
13
Photogate Port is PASCO part
PS-2123A. Digital Adapter is PASCO
part PS-2159.
use the arrow keys to highlight the Timing icon and press ; or
click the Timing icon.
Theory of Timing
Certain digit al sensors conne cted to the GLX through a Digital Adapt er or Photogate Port operate diffe r ently from most other sensors. Rather than collec ting data
at a constant ra te, t hey send a sign al to the GLX only when a n event happens . For
instance:
• when a photogate switches from being bl ocked to unblocked, or vice-versa;
• when the spoke of a pulley enters or exits a photogate; or
• when a nuclear sensor detects a particle.
The GLX can be configured to measure the time span of a particular sequence of
events. Examples of sequences include:
• blocked-unblocked, or “time-in-gate;”
• blocked-b lo cked, or “t ime-between-gates;” and
• blocked-blocked-blocked, used to measure the period of a pendulum.
The Timing icon on
the Ho me Screen
The “blocked” event occurs when a photogate switches from being
unblocked to blocked. The “unblocked” event occurs when a photogate
switches from being blocke d to unblocke d.
Whenever the specified sequence occurs, the GLX records the time span of the
sequence as a data point. It also records the time at which the sequence occur r ed,
Page 69

Xplorer GLX Users’ Guide 63
measured from the start of data collection to the midpoint of the sequence. From
these measurements and us er-entered (or defaul t) constants, the GLX derives
other measurements such as position, velocity, and acceleration. The configuration of what sequences the GLX measu r es and what secondary measurements it
derives is called a timer.
14
The GLX is programmed wit h nin e timers . The timer tha t you choos e depe nds on
the sensor (or combination of sensors) that you are usi ng and the type of measurement that you would like to make. The following example details the procedure for selecting and setting up the “Photogate Timing” timer. The general
procedure for ot her timers i s si milar , and the specifi cs of e ach ti mer are de scribed
on pages 64 through 67.
Setting Up the “Photogate Timing” Timer
In this example, we will connect and set up a single photogate to measure the
velocity of an obj ec t of known width.
1. Connect a Phot ogate Port or Digital Adapte r and a single photogate to the
GLX.
14
One exception, the “General Counting”
timer, measures the nu mber of events
that occur within a specified period. S ee
page 66 for details.
If the Timing Screen does not open automatically, go to the Home Screen,
use the arr o w key s to highlight the Tim in g ic on , and press . Then press
F1
to open the Add menu.
2. You will see the Add men u, which contains the timer options. For this example, select Photogate Timing.
15
Once you have chosen a tim er, there are two types of things to set:
• measurements, which can be set as “visible” or “not visible,” and
• constants, which, in this case, are Flag Length and Photogate Spacing.
15
To select a timer from the Add menu
Keypad
1. Press to open the Add menu.
2. Use the up and down arrow keys to
Mouse
1. Click Add t o op en the menu.
2. Click the desired timer.
F1
highlight the desired timer and press
or
press the number on the key-
;
pad co rrespondi ng to the desired
timer.
Constants
Measurements
3. In this exa mple there is only one photogate, so set Time Between Gates and
Velocity Between Gates to “Not Visible.”
16
16
T o change t he visibility of a mea-
surement:
Keypad
1. Use the arrow keys to hi ghlight the
measurement.
2. Press .
Mouse
Click the word “Visible.”
Page 70

64 Timing Screen
4. Set Time in Ga te and Veloci t y in G at e to “Visib le .”
5. Pretend that you have a cart with a 5 cm flag on it; set the Fla g Len gth constant to 0.05 m. (High light Flag Length and press , then type 0.05.)
6. In this case, photogate spacing is irrelevant, so leave the Photogate Spacing
field blank.
Viewing and Collecting Data from a Timing Sensor
After you have set up a timer, its measurements are available from the data
source menus of the Graph (se e pag e 15), Table (page 28) and other displays.
To start collecting data, press .
Working with Multiple Timers
If there is more than one timer, an icon for each timer appears at the top o f the
screen. To set up each one, select it with the left and right arrow keys or with the
mouse.
Note that in certain cases, a single timer operates with multiple sensors, so having more than one sensor does not necessarily mean tha t you will have (or need)
more than one timer.
Timing Screen Function Keys
F1 Add
The Add menu usually launches automatically when you connect a photogate or
other timing sensor. If you wish to set up a tim er for a sensor that you have not
yet connected, or for a sensor that is already connected, open the Timing screen
and press . From the Add menu, sele ct one of the following timers.
F1
Two timers
17
17
To select a timing option from the
Add menu
Keypad
1. Press to open the Add menu.
2. Use the arrow keys to high light the
desired menu option and press ;
or
press the number on the keypad
corresponding to the desired menu
option.
Mouse
1. Cli ck Ad d to op en th e me nu .
2. Click the desired option.
Selected timer
F1
F1
If you are usi ng a Dig it al Adapt e r , the Ad d me nu ma y inclu de Mot ion S ens or,
Rotar y Motion Sensor , and Relay Control. See page67 for informati on on
these sp ec ia l op t io ns .
Photogate and Picket Fence Select this timer for a single photogate used
with a picke t fence or p hotog at e tape. T he con stant , Band Spacing , i s the distanc e
(in meters) between the centers of the dark bands on the pic ket fence or photogate tape.
The measurements are Position, Velocity, and Acceleration. Each time the phot ogate is interrupted by a band of the picket fence, the timer registers a change in
Page 71

Xplorer GLX Users’ Guide 65
Position equal to the Band Spacing. Velocity and Acceleration are calculated
based on the time intervals between the changes in Position.
Picket fences include PASCO par ts ME-937 7A and ME-9804. Photogate
tape is included with parts ME-6664 and ME-6666.
Smart Pulley (Linear) Use this tim er f o r measuring line ar motion with a
Smart Pulley (or a combination of photogate and pulley). The constant, Spoke
Arc Length, equals the circumference of the pulley (in meters) divided by the
number of spokes.
18
The measurements are Position, Velocity, and Acceleration. Each time the phot ogate is i nterrupt ed by a s poke, the ti mer re giste rs a c hange in Posit ion equal t o th e
Spoke Arc Length. Velocity and Acceleration are calculated based on the time
intervals between the chang es in Positio n.
Smart Pulley (Rotational) Use this timer f or me asuring rotational motion
with a Smart Pulley (or a combination of photogat e and pulley). The constant,
Spoke Angle Spacing, equals 360° divided by the number of spokes.
The measurements are (angular) Position, (angular) Velocity and (angular)
Acceleration. Each time the photogate is interrupted by a spoke, the timer registers a change in angular Position equal to the Spoke Angle Spacing. Angular
Velocity and angular Acceleration are calculated based on the time intervals
between the changes in angle.
18
The default value, 0.0150 m, is the
spoke arc length of the inside groove of
the P A SC O Supe r Pull ey (p art ME- 94 50)
and similar 10-spoke pulleys.
Free Fall Adapter Use this timer with PASCO part ME-9207B. The constant,
Heigh t O f Fall, is the dis ta nce (in meters) from th e re lease mec h an i sm to th e
receptor pa d.
The measurements are Time Of Fall and Acceleration.
• Time Of Fall i s the ti me int erv al s tar tin g when the ba ll is rel eas ed and e ndi ng
when it hits the receptor pad.
• Acceleration is calculated using the formula:
2x
a
----- -=
2
t
Where a is Acceleration, x is Height Of Fall, and t is Time Of Fall.
Photogate and Pendulum The constant for this timer is Pendulum Width
19
,
which is the width of the pe ndulum bob (or whatever part passes th rough the
photogate).
The meas urements are Period and Velocity.
• Period is the time the pendul um take s to compl ete one cycle of osci llati on. A
period data point is recorded every other time the photogate is blocked.
19
It is necessary to enter Pendulum
Width only if you are intere sted in the
velocity of the pendulum bob.
• V elocity is the Pendul um Width divide d by the time-in-gate . A velocity data
point i s recorded every time the pendulum passes through the photogate. For
more accurate velocity measurements, use a cylindrical (rather than spherical) pendulum bob.
Page 72

66 Timing Screen
Time of Flight Use this timer with a projectile launcher, two phot ogates, and a
Time-of-Flight Accessory.
20
The constant, Photogate Spacing, is the distance (in
meters) between the centers of the photogates.
The measurements are In it ial Velocity and Time Of Fli g h t.
• Initial Velocity is the Photogate Sp ac ing divided by the time-between-gates.
• Time Of Flight is the elapsed time starting when the projectile blocks the
first photoga te a nd ending when it hits the Time-of-Flight Accessory.
Photogate Timi ng Use this timer for gen era l me asurements made with one or
two photogates.
21
The constants are Flag Length and Photogate Spacing.
• Flag Length is the length (in meters) of the object that passes through the
photogates.
• Photogate Spacing is the distance (in me ters) between the centers of the photogates. This constant is not rele vant if you are using only one photoga te.
There ar e four measur ements: Time In Gate, Velocity In Gat e, Time Between
Gates, and Velocity Between Gates.
• Time In Gate is the time that the flag spends inside either gate each time it
passes through. A data point is recorded every time either photogate detects
a blocked-unblocked sequence.
20
The Time-of-Fl ight Accessory is
PASCO part ME-68 1 0. P rojectile
Launche rs include ME-6800 and
ME-6801. A Photogate Bracket, part
ME-6821, is necessary to attach the
photogates to the launcher.
21
Photogate Timi ng works best for measuring the velocity of a single object that
blocks only one photogate at a time. To
measure the separate velocities of two
objects, use Collision Timer.
• V elocity In Gate equals Flag Length divided by Time In Gate.
• Time Between Ga tes is the t ime elapsed between successive interruptions of
either gate. A data point is recorded every time one of the photogates is
blocked (except the first time).
• V elocity Between Gates equ als P hotogate Spacing divided by Time
Between Gates.
General Counting Use this timer with nuclear sensors, dr op counters, and
other counting-type digital sensors. The constant, Count Time Interval, is the
period over which the timer counts pulses for each data point. It is also the time
between succe ssive data points.
The measurement, Pulse Count , is th e number of puls es (nuclea r event s or drops)
detected du ring the Count Time Interval. Pulse Count data points are rec o rded at
a constant rate, one data point at the conclusion of every Count T im e Interval.
Collision Timer U se th i s tim er to m ea s u r e th e v el o ci ti es o f tw o ca r ts b e fo r e
and after they collide. The constant is Flag Le ngth, which is the length (in
meters) of the objec ts th at pas s th rough the phot ogates. The fl ags att ached to bo th
carts must be the same length.
The measurements, Velocity 1 and Velocity 2, ar e th e velocities measured by
each photogat e. Velocity 1 is Fla g Len gth divided by the time-in-ga te of the first
photogate. Velocity 2 is Flag Length divided by the time-in-gate of the second
photogate.
Arrange the photogates so that the collision occurs between the photogates.
Page 73

Xplorer GLX Users’ Guide 67
If both carts are traveling in the same direc tion before the collision, one photogate will measure the initi al velocity of both car ts. Similarly, if both carts are
traveling in the same direction after the collision, one photogate will meas ur e
both final velocities.
If one of the carts is stationary before the collision, its initial position will be
between the ph otogate s, a nd its i nit ial ve locit y will not be me asured. If one of t he
carts is stationary after the collision, its final velocity will not be measured.
Digita l In pu t Select the Digital Input timer
22
to record the state changes of a
photogate or other switch-type sensor.
This timer measures the sensor’s Log ic State, which has only two possible values: 0 and 1. A Logic State value of 0 corresponds to a sensor output voltage of
0 V, and a value of 1 corresponds to an output voltage of 5 V.
In the case of a photogate, if the most recently recorded Logi c State value is 0,
then the photoga te is blocked; if the most recent value is 1, then the photogate is
unblocked. A dat a point is recorded each time the s ens or changes states; th us
when the photogate switches from being unblocked to blocked, the timer records
0, and when the photogate switches from blocked to unblocked, the timer
records 1.
Typically, the interesting data recorded by the Digital Input timer is not the
0-or-1 Log ic State value, but rather the time-stamps rec o r ded with those values.
To see the time data, view Time in one column of the Table display and Logic
State in ano th e r co l u mn .
23
F2 Remove
To remove a timer, press or . If you have more than one timer set up,
F2
first use t he left and right arrow keys (or mouse) to se lec t the timer that you want
to remove in the upper part of the sc ree n, then press or .
Õ
F2
Õ
22
If the Add menu is too long to fit on the
screen, arrows (
menu to indicate that some of t he menu
options are not visible.
Press the up or down arrow key multiple
times to
visible portion of the menu.
scroll to bring other options into view.
click the arro w s to scro ll the men u .
23
ing data to display in the Table.
move the highlight beyond the
If you are using a mouse, you can
See pag e28 for inst ruc t ions on cho os -
Select the timer to be deleted
and press or
, ) appear on the
The menu will
F2
Õ
If there are data collected by that timer, they will be perman ently deleted. (The
GLX will ask you for confirmation before it deletes the timer.)
Digital Adapter Options
In addition to switch-type sensors, the Digital Adapter (PS-2159) allows the
GLX to be used with a ScienceWorkshop Motion Sensor, a ScienceWorkshop
Rotary Motion Sensor , or a Digital Relay.
To set up the GLX for one of these devices, connect the Digital Adapter to the
GLX and connect the sensor or rel ay to the adapter (in either order). The Add
menu will open automatically with Motion Sensor, Rota ry Motion Sensor, and
Relay Control among the options. (These options do not appear if you press
F1
to open the menu.)
ScienceWorkshop
of the s e s e nsors
the sensor t o ports 1 and 2 (re specti vely) of the adapter a nd conne ct the adapt er to
the GLX. The Add menu will open autom atically; select Motion Sensor or
Rotary Motio n Sensor. To set the sample rate and other sensor properties, go the
Sensors screen (see page 55).
Relay Control To set up the GLX for control of a Digital Relay
Digital Adapte r, connect the relay to the adapter and connect the adapter to the
Motion Se nsor or Rotary Motion S ensor T o use one
24
with a Digital Adapte r, connect the yellow and black plugs of
25
through a
F2
24
The
ScienceWorkshop
is PASCO part CI-6742. The
ScienceWorkshop
sor is PASCO part CI-6538.
25
The Digital Relay is PASCO part
CI-6462.
Motio n Sensor
Rotary Motion Sen-
Page 74

68 Timing Screen
GLX. The Add menu wi ll open automatically; select Relay Control.22 Both ports
of the adapter will be configured for Relay Control (though they are control led
separately), so you can connect a second relay to the adapter with no additional
set-up required. You can connect up to four Digital Adapters, each with two
ports, for up to eight separately control led output channels. See page 51 for information about controlling digital output through the Calculator.
To use a Digital Relay an d a digital sensor simultaneously, connect them to separate adapters.
Page 75

Data Properties
Xplorer GLX Users’ Guide 69
F1
Data Properties dia log box
F2
Every data se t and da ta s ource i n the GLX h as data p rope rties , whic h control how
the data are displ ayed in the Graph, Table, and other scre ens.
To Open the Data Properties Dialog Box
To access and edit the properties of a data source, set up th e Graph or Table to
display the data source, then open the data source menu and select Properties.
The Data Properties dialog box will open.
You can also access the data properties of a sensor measurement from the Sensors screen. In the Sensors screen, pres s . (See page 55 for more informa-
F2
tion.)
When you are fin ishe d viewin g or e diting the data prop ertie s, pres s (OK) to
close the dialog box and return to the previous screen, or pre ss to cancel
F1
F2
any changes.
Navigating in the Data Properties Dialog Box
Measurement Name The Measurement Name is the label that designates a
data source on a grap h axis or at the top of a table column. You may want to edit
the Measurement Name to add more information about that measurement
(change “Temperature” to “Water Temperature,” for instance) or to shorten it
(chan g e “Force” to “F,” for instance).
26
26
For instruction s on displa ying data in
the Graph and selecting items from the
data so ur ce me nu , see p a ge s 1 3 and 1 5.
For instructions on displaying data in the
Table and selecti ng items from the data
source menu, see pages 28 and 28.
To edit the Measurement Name, use the up and down arrows keys to highlight it
and press (or click it if you are using a mouse). Type the new name on the
keypad and press (or press to cancel).
See “Multipress Text Input Mode” on page 90 for instructions on using the
keypad to enter text.
Esc
Measurement Unit The Measurement Unit is the name of units that are displayed on a graph axis or at the top of a ta ble column.
You many want to edit the Measurement Unit to add units to a calculation or
manually entered data set, or to abbreviate or spell out the units of a sensor measurement. For instance, you might change “m” to “meters.”
To edit the Measurement Unit, use the up and down arrows keys to highlight it
and press (or click it if you are using a mouse). Type the new unit name on
the keypad and press (or press to cancel).
Esc
Page 76

70 Data Properties
See “Multipress Text Input Mode” on page 90 for instructions on using the
keypad to enter text.
Note that changing the name of the units will have no effect on the actual data.
For instance, if you change the name of the Temperature units from “°C” to “°F,”
the numeric values of displayed temperature will not change. To change the
actual unit of measure, select the units field in the Graph (see page 15), Table
(page 29), or other display ; or cre ate a calculation (see page 47).
Numeric Style and Number of Digits Select Numeric Style
of Digits
28
to set how numbers are displayed in the Table and Digits displays.
27
and Number
The meaning of Number of Digits depends on the selected Numeri c Style, as
described below.
• Fi x ed D ec ima ls : in this style, the Number of Digits determin es how many
digits are di splayed to the right of the decimal point.
• Significant Figures: the Number of Digits determines the number of signif-
icant figures that are displayed.
• Scientific Notation: all numbers are displayed with a single digit to the left
of the decimal point, and the other digits to the right, followed by symbol E
and an exponent. (The E means “times 10 raised to the power of….”) The
Number of Digits is the total number of digits displaye d on both sides of the
decimal point (not including the exponent).
• Engineering Notation: This style is similar to scientific notation, but there
are three digi ts to the left of the decimal place and Number of Digits determines the number of digits to the right of the decimal place.
• NSEW 000°00.000: Use this style for longitude or latitude data collected
with a GPS sensor. The data will be displayed in degrees and minutes.
27
T o select a Numeric S tyle
Keypad
1. Use the arrow keys to hi ghlight
Numeric Style.
2. Press to open the menu.
3. Use the arrow keys to hi ghlight the
desired style and press ;
the number on the keypad corresponding to the desired style.
Mouse
1. Click Numeric Style to open the menu.
2. Click the desired style.
28
T o select t he Number of Digits
Keypad
1. Use the arrow keys to highlight Number of Digits.
2. Press or inc rease or
Mouse
1. Click Number of Digits to highlight it.
2. Press or inc rease or
+
decrease the value.
+
decrease the value.
or
press
EE for Exponent <= This data property determines the smallest number that
will be displ ayed without using exponential notation. A value of -3, for instance ,
means that anything less than or equal to 10
-2
will be displa yed in exponential
notation.
EE for Exponent >= This data property determines the largest num ber that
will be displayed without using exponential notation. A value of 6, for in stance,
means that anything greater than or equal to 10
6
will be displayed in exponential
notation.
Zero |Value| < This data property is the smallest absolute value that will be displayed. Any number with a smaller absolute value will be displayed as 0.
Page 77

Xplorer GLX Users’ Guide 71
Calibration
Some of the sensors that you use with the GLX can be calibrated in the Calibration dialog box, which is accessible throu gh the Sensors screen. Cali bration can
make a measurement more accurate or adjust multiple measuremen ts so th at they
agree with each other.
Sensors des igned for c alibr ation inc lude the t emper ature probe s i nclude d with the
GLX. Certain other PASPORT sensors are also calibratable . To find out if a sensor can be calibrated , check its documentat ion , or connect it to the GLX and look
for it in the Sensor field of the Calibration dialog box.
To Open the Calibration Dialog Box
From the Sensors Screen29 follow these steps.
29
See “Sensors Screen” on page 55.
1. Press to open the Sensor Menu.
F4
2. Use the arr ow keys to highlight Calibrate and press ; or press the number on the keypad corres ponding to Calibrate.
The Calibration dialog box will not open during data collection.
Theory of Calibration
To skip to the pr ac tica l in str uc ti ons on ca li bra ti ng a se nso r, see “Navig ati ng in
the Calibration Dialog Box” on page 73 and “Calibration Procedures” on
page 75.
One of the functions of the GLX is to take the stream of raw data from a sensor
and transform it into the calibrated data that you see in the Graph, Table, and
other displays . If you do not calibrate a sensor yourself, the GLX uses a default
calibration that is loaded when the sensor is connected.
You can think of the GLX as containing a device that takes in raw data and outputs calibrated data.
Raw Input Measurement
(from sensor)
Calibration
Calibrated Output Measurement
(to Graph, Table, etc.)
When you perform a calibration, the GLX redefines the linear equation that
transforms the raw input into the calibrated output. The linear f unction is of the
form:
Raw Input Slope Calibrated Output Offset+×=
Or:
Calibrated Output Raw Input Offset–()Slope⁄=
This function can be graphically represe nted as a line.
Page 78

72 Calibration
Pt 2
DInput
Input Data
Pt 1
Offset
DOutput
Output Data
Slope
DInput
=
DOutput
Two points, Pt 1 and Pt 2, define the line. In the two-point calibration procedure,
each point is reset by associ ating a known standard value (for insta nce, the pH of
a buffer sol ution) wit h a raw input measure ment th at the se nsor sends to the GLX
when it is in that standard. In a one-point calibration, only one of the points is
reset b y th e user.
Types of Calibration
There are three types of calibration: two-point, one-point slope, and one-point
offset. Any of these calibrations can be performed on a single sensor, or simultaneously on multi ple simi lar sens ors; howe ver , for any give n sensor, the GLX will
automatic ally select the most typical calibration type as the def ault setting.
Two-Point In a two-point calibration, you reset two points to define a new line.
This type of calibration affects both the sl ope and the offset. For step-by-step
instructions on the two-point calibration procedure, see page 75.
old
calibration
new
calibration
Input Data
Output Data
Two-point calibration; two points are set to redefine the line
Pt 1
Pt 1
Pt 2
Pt 2
One-Point Slope In a one-point slope calibration, you res et only one point.
The slope of the line changes so that the line intersects the new point, while the
offset (or Y-intercept) does not change. For step-by-step instructions on the onepoint slope calibration procedure, see page 76.
new
point
new
Input Data
Offset
does not
change
One-point slope calibration; the line changes its slope to intersect the new point
calibration
slope changes
old
calibration
Output Data
old
point
Page 79

Xplorer GLX Users’ Guide 73
One-Point Offset In a one-point offset calibration, you reset only one point.
The line shifts so that it intersects the new point, but its slope doe s not change.
new
calibration
new
point
Input Data
line shifts
Output Data
One-point slope calibration; the line shifts to intersect the new point
old
calibration
Offset calibration is usually used to make one se nsor agree with another sensor.
The graph below on the left sho ws the me asurements from two temperature
probes in the same cont ain er of wate r . Due to nor mal va ria tion among probe s, the
second probe consistently reads about 0.08 °C higher than the first probe. Normally this difference would be insignificant; however, an offse t calibration can
be used to bring the sensors into closer alignment. See “One-Point Offset Calibration or Multiple-Measurement Alignment Procedure” on page 77 for step-bystep instructions.
One measurement
is shifted to align
with other
measurement
Before offset calibration After offset calibration
Navigating in the Calibration Dialog Box
For step-by-step instructions on the calibration procedure, see page 75.
The Calibration dialog box contains a list of fields that are used to select the measurement (or measureme nts ) to be calibrated, and to enter the par ameters of the
calibration. One of the fields is always highlighted. Use the up and down arrow
keys to move the highlight to a different field.
You will sometimes see an up or down arrow ( or ) near t he bottom of the
dialog box indicating that more fields are available, but not currentl y visible.
When you see the up arrow displa yed on the screen, you can press the up arrow
key on the keypad multi ple times to make more fields visibl e. When you see the
down arrow displayed on the sc ree n, you can press the down arrow key to make
more fields visible.
Page 80

74 Calibration
The top and bottom portions of the Calibration dialog box
Sensor Field
Measurement Field
Single/All Field
Calibration Type
Arrow indicating that
additional fields can be
displayed with the down
arrow key
Pt 1 Standard Value
Pt 1 Sensor Input Value
Pt 2 Standard Value
Pt 2 Sensor Input Value
Arrow indicating that
additional fields can be
displayed with the up
arrow key
Sensor Fi eld Highlight this field and press or to cycle through the
+
calibratable sensors connected to the GLX.
Measur em e nt Fi el d Highlight this field and pre ss or to cycle through
+
the cal ibr at ab le measur e m en t s of th e selected sen s o r.
Single/ All Field Highlight the S ingle/All Field and press to switch
between “Calibrate selected m easurement only” and “Calibrate all similar measurements.”
30
Calibration Type In most cases , it is not necess ary to access this field because
the GLX automatically selects the most typical calibration type for the selected
measurement.
To override the au tom atic selection, highlight Calibration Type and press to
open the menu. Highli ght the des ired cali brat ion type an d press , or press the
number on the keypad corres ponding to the desired typ e. The options are 2 Point ,
1 Point Slope, and 1 Poi nt Offset.
Pt 1 Standard Value Highlight this field and press . Enter a value and
press .
Pt 1 Sensor Input Value It is usually not necess ary to access this field
because its value is entered automatically when you press .
F3
30
See “One-Point Offset Calibration or
Multiple-Measurement Alignment Procedure” on page 77 for more information.
To enter a value manually, highlight the field and press . Enter a value and
press .
Pt 2 Standard Value Highlight this field and press . Enter the value of the
standard and press .
Pt 2 Sensor Input Value It is usually not necess ary to access this field
because its value is entered automatically when you press .
F4
To enter a value manually, highlight the field and press . Enter the val ue of
the standard and pres s .
Page 81

Xplorer GLX Users’ Guide 75
Because they are not needed, the fields for Pt 1 are hidden when the 1 Point
Slope calibration type is selected, and the fields for Pt 2 are hidden when the
1 Point Offse t cal ibration typ e is sel ec t ed .
Calibrated Output and Raw Input Two live values are displayed at the bottom of the Calibr ation dialog box: the Cal ibrated Output Measurement and the
Raw Input Measurement. The Raw Input Measurement is the data transferred
from the sens or to the GLX. The Calibrated Output Measurement is the value
resulting from the currently defined calibration. The Calibrated Output Measurement is displayed in the Graph, Table, and other displays.
Note About Raw Input Measurement
The value and units of the raw input mea surement data can be confusing bec ause
they do not necessarily have an obvious meaning. Depe nding on which sensor
you are using, the raw input may represent the default calibration, the voltage
produced by an electrode in the sensor, or the digital output of the sensor’s analog-to-dig ital converter.
Keep in mi n d th at it does no t m a tter what th e value is, or w ha t it s un i ts are. It is
only importa nt tha t t he raw s enso r input v ari es i n direc t pr oportion to t he quan tit y
being measured.
Calibration Procedures
If you don’t know whether a two-point or one-point slope calibration is best
suite d for a particular s ensor, follow steps 1–3 of either procedure and
observe the Calibration Type that is automatically selected.
Two-Point Calibration Procedure
A two-point calibration requires two known standards. For instance, if you are
calibrating a pH sens or, you might use two buffer solutions: one of pH 4 and the
other of pH 7.
The fields of the Calibration dialog box are identified on page 74.
Calibrated Output
Measurement
Live Data
Raw Input
Measurement
1. From the Sensor field, select the desired sensor.
2. From the Measure me nt field, select the desired measurement.
3. Set the Single/All field to “Calibrate selected measur ement only.”
4. From the Calibration Type menu, select 2 Po int, if it is not already selected.
5. Place the probe in the first known standard.
6. Enter the value of the standard in the Standard Value field for Pt 1.
7. Observe the Raw Input Measurement displayed nea r the bottom right corner
of the scre en and wait until it ha s stabilized.
Enter standard
value here
F3
Press to copy Raw
Input Measurement to Pt 1
Sensor Input Value
Page 82

76 Calibration
8. Press to read the sensor inpu t value of Pt 1.
F3
Note that th e Raw I nput Measurement has been automatically ent er ed into
the Pt 1 Sensor Input Value field, and the standard value is now displayed as
the Calibrated Output Measurement.
9. Place the probe in the second known standard.
10. Enter the value of the standard in the Standard Value field for Pt 2.
11. Observe the Raw Input Measu r ement displayed near the bottom right corner
of the scre en and wait until it ha s stabilized.
12. Press to read the sensor input value of Pt 2.
F4
Note that th e Raw I nput Measurement has been automatically ent er ed into
the Pt 2 Sensor Input Value field, and the standard value is now displayed as
the Calibrated Output Measurement.
13. Press to accept the new calibration and return to the Sensors screen, or
press to cancel t he new c alibr ation and revert to the previ ous or default
F1
F2
calibration.
Enter standard
value here
Press to
copy Raw Input
Measurement
to Pt 2 Sensor
Input Value
F4
F1
Accept new calibration
and return to Sensors
screen
F2
Cancel new calibration
or
and revert to previous
calibration
One-Point Slope Calibration Procedure
A one-point slope cal ibration requires one known sta ndard. For instance, if you
are calibrating a dissolved oxygen sensor, you might use 100% saturated water,
for which you can look up the oxygen concentration based on te mpe rature and
pressure.
The fields of the Calibration dialog box are identified on page74.
1. From the Sensor field, select the desired sensor.
2. From the Measure me nt field, select the desired measurement.
3. Set the Single/All field to “Calibrate selected measur ement only.”
4. From the Cali bration Type menu, select 1 Point Slo pe, if it is not already
selected.
5. Place the probe in the known standard.
Page 83

Xplorer GLX Users’ Guide 77
6. Enter the value of the standard in the Standard Value field for Pt 2.
7. Observe the Raw Input Measurement displayed nea r the bottom right corner
of the scre en and wait until it ha s stabilized.
8. Pres s to read the sensor input value.
F4
Note that th e Raw I nput Measurement has been automatically ent er ed into
the Pt 2 Sensor Input Value field, and the standard value is now displayed as
the Calibrated Output Measurement.
9. Press to accept the new calibration and return to the Sensors screen, or
press to cancel t he new c alibr ation and revert to the previ ous or default
F1
F2
calibration.
One-Point Offset Calibration or Multiple-Measurement Alignment Procedure
If you are making tw o or more simulta ne ous measure ments of th e same ty pe, it is
sometimes desirable to slightly adjust the calibrations so that all of the measurements agree. For inst ance, if you are using several temperature probes, you may
find that they hav e slightly differ ent readings when immersed in the same container of liquid; a multiple-mea surement alignment will make all of the probes
read th e same temperature.
Enter standard
value here
F4
Press to
copy Raw Input
Measurement
to Pt 2 Sensor
Input Value
This procedure is a one-po int of fset cal ibrati on perform ed on two o r more sim ilar
measurements simultaneously.
The fields of the Calibration dialog box are identified on page 74.
1. From the Sensor field, select the desired sensor.
2. From the Measure me nt field, select the desired measurement.
31
3. Set the Si ngle/All field to “Calibrate all si milar measurements .”
4. From the Cali bration Type menu, select 1 Point Of fset.
5. Place all the probes s o that they are all measuring the same thing. It is not
necessary to know the value of what they are measuring at th is point. (For
instance, plac e all the temperature probes into th e same contai n er of water.)
6. Press . Note that the Calibrated Ou tput Measur ement has been auto-
F3
matically en tered into the Pt 1 Standa rd Value field, and the Raw Input Measurement has been automatically entered into the Pt 1 Sensor Input Value
field.
7. Press to accept the new calibration and return to the Sensors screen, or
press to cancel t he new c alibr ation and revert to the previ ous or default
F1
F2
calibration.
To confirm that the measurements are aligned, open the Digits display and view
two or more of the m easurements sim u lt an eously wh i le record in g data. They
should be ident ical or very close.
31
In this case, the calibration of the
not
selected measurement will
Rather, the calibrations of all other similar measurements will be changed to
match the selecte d measurement.
Press to copy
Calibrated Output
Measurement to Pt 1
Standard value;
and Raw Input
Measurement to Pt 1
Sensor Input Value
change.
F3
For information on the Digits display, see page37.
Page 84

78 Data Files Screen
Data Files Screen
Collected data , cal cu latio ns, n ote s, d ispla y confi gurati ons , and sensor s etting s are
all stored in the GLX’s memory. You can save data in a file during or after an
experiment, or save a file without data to use as the sta rting point of an experiment. Use the Data Files screen to view, create, copy, move, and delete these files
and their components. In this screen you can also transfer files to and from a second GLX or a flash drive connected to the USB port.
To Open the Data Files Screen
From the Home Screen, do one of the following:
use the arrow keys to highlight the Data Files icon, then press ; or
click the Da ta F iles icon.
Navigating in the Data Files Screen
The Data Files screen is divi ded into two secti ons: the Folder Selector and the
File Lis t. The Folder Se lector is used to select one of the GLX’s two data-s torage
locations. The File Li st displays the files stored in th e selected folder.
The Data Files icon on
the Home Screen
At any time, the f o cus is either on the F o lder Selector or the File List, indicated
by a dark box surrounding that section. The focused section also has one of its
items highlighted.
Folder
Selector
File List
Highlighted folder
Folder Selector active File List active
Dark box
surrounding
active section
Press the down arrow key to move the focus from the Folder Selector to the File
List section. Press the up arrow key (when the hig hlight is on the top entry of the
File List) to move the focus from the File List to the Folder Selector.
If the File List is empty, the focus cannot be moved to it.
Navigating in the Folder Selector
There are two folders in the Folder Selector: RAM and Flash. When the Fo ld er
Selector has the focus, the selected folder is highlighted. Press the left and right
arrow keys to switch between RAM and Flash. The size and free capaci ty of the
selected folder ar e indicated below the Fo lder Selec t or. The files in th e selected
folder are displayed in the File List section.
Highlighted
file list entry
Selected folder;
Press to change selection
Press the down arrow key to move the focus to the File List of the selected folder.
When the focus is not on the Folder Selector, the selected folde r is indicated by a
dashed box.
Page 85

For more informa tion on the RAM and Flas h data-storage locations, see
page 82.
Navigating in the File List
Xplorer GLX Users’ Guide 79
When the focus is on t he File Lis t, a hi ghlight appears on one of th e entri es. Pre ss
the up and down arrow keys to move the highlight.
The entri es in the File List consist of:
The Active File This is the open file that you are currently working with. It
always appears as the first entry in the RAM file list. Any data that is recorded
becomes part of the active file.
The active file may be saved or unsaved (see “F2 Save” on page 80). If you have
collecte d data or you have changed any settings since the last time you saved the
active file , the saved version of the active file may not match the current state of
the GLX.
Saved Files These are files t hat are stored but not ne cess arily ope n. The fil e l ist
indicates the size of each file and the dat e on which it was last saved. When you
open a saved file (see “F1 Open” on page 80), it becomes the active file.
File Contents By default, the fi le co ntents are hidd en. To view the contents of a
file, highlight the file and press the ri ght arrow key. To hide the co ntents, press
the left arrow key. The icon to the left of the file indi cates whether a file can be
expanded or contracted.
The file contents include the following types of components, which can be recognized by their icons.
Selected folder
Active file
Saved Files
File Contents
File can be expanded
to show its contents
File can be contracted
to hide its contents
Highlight a file and press or
to hide or show its contents
• Sen sors and timers. Every sensor or timer that appears in the Sensors
screen of the file receives a separate entry in the file list. (See “Sensors
Screen” on page 55.)
• Data runs. If the file contains data collected from sensors, ea ch dat a run
appears as a f ile list entry with the time at which data collection started. A
data run repre sents all of the data recorded from all of t he connected sensors
within a single period of data collection . By default, data runs are named
Run #1, Run #2, etc., but they can be renamed (see “Rename” on page 81).
• Manually entered data. Each column of data that has been entered in the
Table appears as a separate entry. (See “Manually Entered Data” on
page 32.)
• Ca lculatio ns. Every equation or expression entered in the Calculator
appears as a separate entry . (See “Calculator” on page 41.)
• Displays. If the Graph or Table in the file has been altered from its default
settings, it appears in the file lis t. If multiple graph pages exist, each page
appears separat ely. (See “Graph” on page 13 and “Table” on page 28.)
• Notes. If one or more Notes pages exist in the file, they are rep r es ented by a
single entry. (See “Notes Screen” on page 53.)
The GLX saves all the components of a file, but not all of them appear in th e File
List. The hidden com ponents include the Digits display configuration, Output
settings, and data properties.
Examples of sensor
and timer icons
Data run icon
Manually entered data icon
Calculation icon
Graph icon
Table icon
Notes icon
Page 86

80 Data Files Screen
F1
F1
Mouse Navigation
If you are using a mouse, click RAM or Flash to view the File List for each
folder. Click the file or file component to highlight it. Click the icon to the l eft of
a file to show or hide the file contents.
Data Files Function Keys
F1 Open
To open a saved file, highlight it in the File List and press (or click Open).
F1
If changes have been made to the current active file since it was last saved, a di alog box will ask if you want to save the file. Select Yes ( ) to save the active
file before the new fil e is opened. Sele ct No ( ) to open the new fi le without
F2
F1
saving the active file; any changes you have made to the active file since it was
last saved wil l be lost. Select cancel ( ) to keep the acti ve file open and not
F3
open a ne w file.
To make the active file rev ert to its last-saved state, highlight it and press
(Open). When t he dialog box a s ks if you want to save changes, select No ( ).
F2
F2 Save
Press (or click Save) to save the active file. If a previous version of the file
had been saved in RAM, it will be overwritten. If the active file had originally
been opened from the Flash folder, a new copy will be saved in the RAM folder .
F2
F3 Delete
To delete a file, highlight it in the File List and press (or click Delete). A
dialog box will ask for confirmation before the file is deleted; select OK ( )
or Cancel ( ).
F2
F3
F1
F3F2
You can use instead of to delete a si ngle file.
Õ
F3
If you delete th e active file, it will be unloaded from the GLX and the last copy
saved in RAM will be deleted.
To delete a data run or manual ly entered data set from the active file, highlight it
and press (or click Delete). To delete an individual data run or data set
F3
from a saved file, the file must first be opened.
When the Folder Selector is active, the option is Delete All. Highlight the
RAM or Flash folder and press (or click Delete All) to delete the entire
F3
F3
contents of that folder.
F4 Files
Press (or click Files) to o pen the Files menu. The contents of this menu
change depending on what item is highlighted in the File Lis t or F o lder Selector.
Possible menu options are described below.
New File This option is always available from the Files menu. Select it to
unload the current active file and create a new acti ve file.
F4
32
32
T o select an option from the Files
menu
Keypad
1. Press to open the Files menu.
2. Use the arrow keys to high light the
Mouse
1. Click Files to open the Files menu.
2. Click the desired menu option.
F4
desired menu option and press ;
or
press the number on the keypad
corresponding to the desired menu
option.
Page 87

Xplorer GLX Users’ Guide 81
If changes have been made to the current active file since it was last saved, a di alog box will as k if you want t o save the file . Sele ct Yes ( ) to save the curre nt
active file before it is unloaded. Select No ( ) to unload the file without sav-
F2
F1
ing it; any cha nges you have made since it was last saved will be lost. Select can-
F3
cel ( ) to keep the current active fil e ope n and not create a new file.
Save As This option appears in the Files menu when the active file is highlighted. Sel ect Save As to save the active file with a new name.
Enter the new file name on the keypad (see “Multipress Text Input Mode” on
page 90) and press .
Move File Move File appears in the Files menu when a saved file (other than
the active file) is highlighted. Use this option to move the highlighted file from
the RAM folder to the Flash folder, or vice versa.
When you select Move File, an icon appears in the Folder Selector section of the
screen. Press the left or r ight arrow key to place the icon next to RAM or Flash
and press . The file will be moved to that folder.
You cannot move the activ e f ile, because th at file must remain in the RAM
folder. To place the active file in the Flash folder, press to save it, then use
F2
Copy File (see below) from the Files menu.
Move All Files This option appears in the Files menu when the Folder Selector
has the focus and the selected folder contain s save d files other than the active
file. Move All F iles is similar to Mov e File, but it moves ever y saved file in the
selected folder, except the active file, to the folder that you choose.
Copy File This option appears in the Files menu when any save d file is highlighted. Copy File is simil ar to Move File, but, instead of movin g the file, a copy
of the file is placed in the folder that you choose.
If Copy F ile is used on the a ctive file, the last saved state of the active file will be
copied. Any changes that have been ma de to the active file since you last saved it
will not be part of the copied file.
Press and to place the icon next to
RAM or Flash and press .
Move or Copy File
If you pla ce the copied fil e in a different folder, it will have the same name as the
original. If you place it in the same folder, the words “Copy of” will be added to
the original name.
Copy Al l Files This option appears in the Files menu when the Folde r Selector
has the focus . Copy Al l Fil es i s simi lar to Copy Fi le , but i t c opies eve ry sa ved file
in the selecte d folder to the folder that you ch oose.
Rename This option is available when a file in the RAM folder or a data run in
the active file is highlighted. Follow these steps to change the name of a file or
data run.
1. Highlight the file or data run.
2. Select re name from the Files menu.
3. Enter t he new fi le na me on t he key pad (see “Multi press Text Input Mode” on
page 90) and press (or press to cancel the name change).
Esc
You can rename a file or run without opening th e Files menu. Highlight the file
or run and press . Type the new name and press .
Page 88

82 Data Files Screen
RAM and Flash
The GLX has two types of memory for file storage: RAM and F lash, represente d
by two f ol d er s in th e D a t a F i le s s cr ee n . By defaul t, fil e s are s av ed in th e RAM
folder. Whether it i s mos t appropriate to store a file in RAM or Flash depends on
how you intend to use th e file.
Files in the RAM folde r are saved in the GLX’s random access memory. With a
capacity of about 12 MB, the RAM folder is large enough to store many files,
including ones conta ining la r ge data sets. F iles ca n be saved to RAM qui ckl y and
easily.
Files copied to the Flash folder are stored in a special type of programmable
read-only memory. Use the Flash folder to store files that you do not want to be
easily alte red, such as configuration files for experiments or sample data files.
When you open a file from the Flash folder and save it again, it does not overwrite the original file; rather, it saves a copy in the RAM folder. This property
prevents users from acc identally saving collected data over a file designed to be
used as an experiment set-up file.
Files saved in ei ther RAM or Flash will remain saved even if the GLX’s ba ttery
runs too low for norm al operation. When the battery drains to a critical level, the
GLX shuts down, reserving e nough energy to maintain the RAM memory unti l it
can be connected to AC power. However, if you store the GLX for several days
without power connected after the battery has drained to the critical level, it is
possible for the battery to run so low that RAM is erased.
Flash memory does not require any power to store data permanent ly. You can
leave the GLX unpowered for any amount of time without losing files s ave d in
the Flash folder.
33
File Size Limits
In order to reserve enough free RAM capacity to sa ve a data file, the GLX limits
a single file to 4 MB. If that size limit is reached, da ta collection will automatically s to p . To collect data after the f ile-size limit has been reached, delete existing data or sta rt a new file . Data colle ction wi ll als o st op if the size of the da ta fil e
exceeds the free sp ac e remaining in RAM. Since a 4-MB file typically contains
over 100000 data points (depending on the sensors used), most users will not be
affected by these limi ts .
33
See page 94 for more information
about ba ttery power an d da ta sto r ag e.
Page 89

Using the GLX with a USB St orage Device
Xplorer GLX Users’ Guide 83
If you have a USB storage device34 (such as a US B flash drive), you can use it to
add storage capacity to your GLX, back up data, and transfer data to another
GLX or a comp u t er.
See also “Export All Data” on page 32 for instructions on exporting data as a
tab-delimited text file to USB storage.
Connec t a st orage devic e to th e la rg er U SB so ck e t ( la b el ed wi t h ) o n th e
side of the GLX.
File Transfer
When a USB storage device is connected to the GLX, a third icon appears in the
Folde r Selecto r of th e Data Fil es sc reen.
This icon represents the USB storage “folder.” Use this folder like the standard
RAM and Flash folders to open, delete, move, copy, and rename files (see pages
80–81). You cannot open a file directly from USB storage; you must first move
the file to the GLX’s RAM or Flash folder. After you have saved files on the storage device, you can unplug it and connect it to any other GLX to open the files.
If you connect the storage device to a computer, you will find the files on the
device’s root level . See page 101 for instructions on opening these files in
DataStudio, or page 104 for instructions on opening them in the GLX Simulator.
You can also copy GLX files
open these files on a GLX. When you copy or save a GLX file from your co mputer to the storage device, you can put it at the root level or i n a folder; when the
device is connecte d to a GLX, the GLX searches through the entire device and
displ ay s al l G LX f il e s in th e Data Files scree n .
35
from the computer to the storage device, and later
34
The USB storage device must be formatted using the FAT16 or FAT32 file
system. Most flash dr ives are for matted
this way. Other mass-storage devices
such as portable hard drives and audio
players may also be comp atibl e. Y o u can
use a USB card reader, however the
card must be in the reader before you
connect the reader to the GLX.
USB Storage
A third folder appears when a USB
stora ge device is connected
35
GLX files on your computer may have
been t ransf erred there fro m anot her GLX
(see page 100) or created using the GLX
simula tor (see p age 103).
Backup and Restore GLX Files
T o back up th e GLX, go to t he Data Fil es scre en and pre ss to open the Files
menu; select Bac kup GLX Files. All data files in the Ram and Flash folders and
all settings are copied to the flash drive. To restore these files and settings, press
F4
to open the Files menu and select Resto re GLX Fil es. Onc e a GLX has
been backed up onto a storage device, you can restore the files and settings onto
any other GLX.
The back-u p and restor e opera tio ns may er ase a nd over writ e fil es an d s ettin gs on
the GLX or flash drive. When you back up a GLX, any previous GLX back-up
data on the flash dri ve is overwrit te n. When you restor e backe d-up data, al l previous files and settings on the GLX are overwritten.
Data that you have stored using the GLX backup operation can only be accessed
using the res tore ope ration . If you want t o save multi ple fi les t hat can be acce ssed
individually , us e the Move All Files or Copy All Files options from the Files
menu (see page page 81).
If you connect the flash drive to a computer after you have backed up a GLX,
you will find a folder named
This folder and the files in it are intended only for access by the GLX when it
performs the restore operation.
GLXBackup
, which contains the back-up data.
F4
F4
Backup and Restore options in the
Files menu
Page 90

84 Data Files Screen
GLX-to-GLX File Transfer
To transfer files dire ctly between two GLXs, connec t the larger USB port of one
GLX to th e sm aller US B po r t of the other GLX us i n g the incl ud ed USB ho stconnection cable.
Host GLX Remote GLX
Use the host-connection cable to connect two GLXs
The GLX connected by the larger USB port is the host unit, and the one con-
nected by the smaller port is the remote uni t. All GLX-to-GLX file-transfer operations are controlled in the Settings screen of the host unit.
When a remote GLX is connected, two additional folders appear in the Settings
screen of the host GLX, which represent the RAM and Flash folders of the
remote unit. Use these folders like the host RAM and Flash folders to open,
delete, move, and copy files (see pages 80–81). You cannot open a file directly
from the remote GLX; you must firs t move the file to the host GLX’s RAM or
Flash folder.
Remote GLX
Folders
The Data Files screen with a remote GLX connected
Page 91

Settings Screen
Xplorer GLX Users’ Guide 85
F1
F2
Setti ngs screen
F4
The Settings screen contains the controls for how the GLX environment looks
and acts.
To Open the Settings Screen
From the Home Screen, do one of the following:
use the arrow keys to highlight the Settings icon, then press ; or
click the Sett in g s ic on.
Settings
To change any of the settings, use the arrow keys to highlight the setting and
press .
If you are using a mouse, click th e desired setting.
Name If the active file (see page79) has not been named, the GLX’s name
appears in the Top Bar. By default, the name of the GLX is “XplorerGLX.” If
you are working with more than one GLX and would like to uniquely ident ify
each one, change the name of each GLX. Highlight Name and press . Type
the new name
Date Format The date shown in the Top Bar can be displayed in two formats:
month/day/ year (MM/DD/YY) or day/month/year (DD/MM/YY). Highlight
Date Format and press to switch between the two opti ons.
36
and press .
The Settings icon on
the Hom e S cre en
36
See “Multipres s Text Input Mode” on
page 90.
Tim e Fo rma t The time sho wn in t he Top Bar can be displayed in e ither 12- hour
or 24-hour format. Hig hlight Time Format and pre ss to switch between the
two options.
See “F1 Set Date and Time” below to manually set the date and time.
Auto Power Off This setting controls how many idle minutes the GLX will
wait before it automatically shuts off or goes into sleep-between-samples mode
when running on battery power. See “Auto Power Off” on page 8 for more information.
Highlight Auto Power Off and press to open the menu. Use the arrow keys
to highlight the desired time and press .
Page 92

86 Settings Screen
Back Light From anywhere in the GLX environm ent, the easiest way to turn
the screen’s back light on or off is to hold and press .
You can also operate the back light from the Settings screen. Highlight Back
Light and press to open the menu. Use the arrow keys to highli ght the
desired menu option and press or press the number on the keypad corresponding to the desired menu option. The options are:
•Off;
•On;
• Keypress (10 s): the back light is norm ally off, but turns on when you press
any key and stays on for 10 seconds ; and
• Keypress (30 s): the back light is norm ally off, but turns on when you press
any key and stays on for 30 seconds.
Screen Contrast From anywhere in the GLX environment, hold down
and pres s th e up or d ow n ar r ow ke y to ad ju st the screen co n tr a st.
From the Settings sc reen, you can also highlight S creen Contrast and press
+
to make the screen dar ker or to make it lighter.
Language The GLX has several language options. Highlight Language and
press to open the menu. Use the arrow keys to highlight the desired language and press .
An arrow ( ) in the lower right corner of the menu indicates that more
menu op tions are available, but not visible; press the down arrow key to
move the highlight to the bottom of the menu, then press the arrow key again
to make more options visible.
Sensor Auto-Display Sensor Auto-Display causes the GLX to automatically
launch a display (such as the Graph) when you plug in a single sensor while
viewing the Home Screen, or when you turn on the GLX with a sensor connected. This feat ure is designed to simplify basic data collection with a single
sensor.
Sensor Auto-Display is on by default. To turn it off, highlight it in the Settings
screen and press .
Startup Action There are two options for Startup Action. By default, the Startup Action is set t o “Open New Experiment ,” whic h causes the creati on of a new,
empty data file every time the GLX starts up.
Language Options:
The other Startup Act ion option is “Open Las t File,” which makes the GLX open
the most recently s aved file whenever it starts up. It is convenient to use this
option if you plan to turn the GLX off and on during an activity, or if the GLX is
likely to automatically turn itself off due to being left idle .
To change the Startup Action, highlight it in the Settings screen and press .
Page 93

Settings Screen Function Keys
F1 Set Date and Time
The date and time are s et automatically when you connect the GLX to a computer running DataStudio.
Follow these steps to set the date and time manually.
Xplorer GLX Users’ Guide 87
1. Press . A dialog box will open with settings for Mont h, Day, Year,
F1
Hour, Minute, and Second.
2. Use the up and down arrow key s to highlight the setting you would like to
change.
3. Press or to increase or decrease the selected setting; or press ,
enter the setting on the keypad and press again.
+
37
4. Repeat steps 2 and 3 until all desired settings have been changed.
5. Press to accept changes or press to cancel changes.
F1
F2
F2 Audio Settings Dialog Box
From the Settings screen, press to open the Audio Settings dialog box.38
The audio settings determine how audio notes (see page25) are recorded and
played back. Some of the Output screen’ s de fault settings (see page 39) are also
based on these set tings. After changing any of the settings, press to accept
the chan g es or to cancel.
F2
Sample Rate and Bits Per Sample These t wo set ti ngs de termi ne the qua lity
and size of recorded audio notes. Higher values of either setting result in higherquality audio, but also make audio notes use more of the GLX’s memory.
F2
F1
F1
37
If the Time Format is 12-Hour (AM/
PM), then a menu will open when you
highlight Hour and press ; use the up
and down arrow keys to select the hour
and press agai n.
F2
Audio Settings
F3F2
F4
Mic Inpu t Volume This setting dete r mines the sensitivity of the GLX’ s microphone when used for recording audio notes. When set to Automatic, the mic volume adjusts itself in response to the present sound level.
Speaker Volume This setting determines the loudness of audio-note play back
and sound output.
Output Device To play audio notes and sound output through the GLX’s builtin speaker, set Output Device to Internal Speaker. Set Output Device to Headphones or External Speake r if you have headphones or powered stereo speakers
connected to the GLX’s signal output port.
Speaker Configuration This setting de termines how sound generate d in the
Output Screen is play ed through headphones or external spe ake rs . If Output
Device is s et to Headphones or External Speakers, the two options are Mono and
Stereo ; if Output Device is set to Internal S pea ker, the only option is Mono.
F4 Version
Press to see the version numbers of the Firmware, Core, and Power Manager installe d on your GLX. These version numbers represent the updatable portions of the GLX’s operating system.
F4
Audio Settings dialog box
38
T o change an audio sett ing
Keypad
1. From the Settings screen press
to open the Audio Settings dialog box.
2. Use the arrow keys to high light the
desired setting.
3. Press .
4. If a menu opens, use the arrow keys
to sel ect the desired value and
press .
Mouse
1. At the bottom of the Settings screen,
click Set to open the Audio Settings dialog box .
1. Click the desired setting.
2. If a menu opens, click the desired
value.
F2
Page 94

88 Settings Screen
Page 95

Xplorer GLX Users’ Guide 89
Chapter 4: Navigation and Input
Data Source Menus
The axes of the Graph, the columns of the T able, the sections of the Digits display, and the Meter each have a data source field, which you access to choose
what data to displ ay. Selecting any of these data sourc e field s opens a da ta source
menu containing a list of all available data sources.
Identifying a Data Source
• In one of the simplest cases—a GLX with one single-meas urement sensor
connected, and no calculations or manually entered data—the data source
menu contains two items, as illustrated to the right.
only one data source option, so it is selected automatically.
Selecting the other option in the menu, Data Properties, opens the Data
Properties dialog box for t he selecte d measurement. See “Accessing Data
Proper ties” on page 90.
In this examp le, there is
• In this example, the GLX is conne cted to two s ingle-measuremen t sensors: a
Temperature Sensor and a Rel ative Pressure Sen sor. There are t w o d ata
sources to choos e from. The sele cted data so urce has a chec k mark nex t to it.
The two data source s a r e from two different sensors, so each has a different
icon.
• Certain sensors make more than one measurement. T he data source menu
pictured here is from a GLX connected to a Press ure/Temperature Sensor.
Note that the two data s ources have the same icon, ind icating that they both
come from the same sensor.
• The menu pictured to the right is from a GLX connected to two sensors: a
Temperature Sensor and pH/ORP/ISE/Temperature Sensor. The pH/ORP/
ISE/Temperature Sensor makes several measurements , one of which is T emperature. There are two data sources named “Temperature,” one from the
pH/ORP/ISE/Temperature Sensor and one from the Temperature Sensor.
You can tell which sensor each temperature m easurement is from by looking
at the icon s n ex t to th e m eas u re m e n t na m e s .
Expanding the Data Source Menu
• The menu pictured to the right is f r om a GLX con nected to a Motion Sensor.
The Motion Sensor makes three measurements: Position, Velocity, and
Acceleration. Only one measurement, Position, is visible. The “More”
option that appears with a Motion Sensor icon indicates that other measurements are a vaila ble from that sens or , b ut a re not s ho wn. Sele ct “More ” to s ee
the ot h er available measurements.
• In the menu pictured to the right, two sensors are present that each ha ve hidden measurements . There are two “Mor e” opti ons, one for each s ensor. They
can be distinguished by their differe nt icons.
Page 96

90 Multipress Text Input Mode
Accessing Data Properties
Selecting the Data Properties option from a data source menu opens the Data
Properties dialog box for the selected measurement. In this example, the Data
Propertie s for Relative Pressure would ope n.
To access the Data Proper ties of anot h er measure ment, first select that measurement from the dat a source menu, then open the menu again and select Data Properties.
For information on the Data Properties dial og box, see page 69.
Multipress Text Input Mode
Multipress text input is used to ente r numbe r s and letters through the keypad of
the GLX. Each o f the GLX’s input keys has a nu mbe r and several letters or punctuation marks printed on it. In multipress mode, repeatedly pressing a key will
cycle through th es e characters.
7
The 7 key ( ) will cycle through punctu ation marks, not all of which are
printed on the key. The characters in the cycle are:
?!
7 ? ! @ ( ) , : ; & ~ % # < >
The 0 key ( ) cycles through two characters: 0 and a spac e.
The decimal point key ( ) cycles through two characters: a period (or decimal
0
EE
point) and E, which is used often in scientific notation.
Using a USB Keyboard
For most use r s, text entry is faster and easi er with a USB keyboa rd1 connecte d to
the GLX. A keyboard also all ows th e input of capital letters in areas of the GLX
environment where Shift and Caps Lock are not available.
Most keys on the GLX’s keypad have an obvious equivalent key on an attached
USB keyboard. The less obvious keyboard equivalents are shown in the table
below.
GLX Key USB Keyb oar d Equivalent
Enter and Return
Home
1
PASCO part PS-2540 or PS-2541
Õ
F5
F6
Backspace and Delete
X
* (asterisk)
Page 97

Xplorer GLX Users’ Guide 91
Scientific Notation
The GLX displays very la rge and very small numbers usi ng s cientific notation.
You can also input any number using scient ific notation. On the GLX, the letter
E, when it is pl ac ed be tw een two numbers (wi th n o sp ac es ) is interpr et e d as
meani ng “times 10 raised to the p ower of….”
The letter E can always be input by pressing the decimal point key ( ) twice,
EE
even wh en th e G L X is n o t in m u lt ip r ess text in pu t m od e .
Below are some examples of sc ientific notation and their normal equivalents.
5E2 = 500
1.234E5 = 123400
56.789E1 = 567.89
6.518E-3 = 0.006518
A lowercase e can be used interchangeably with uppercase E:
4.35e5 = 4.35E5 = 435000
A number expressed in scientific notation must not have a space adjacent to the
E. The number to the left of the E can contain a decimal point, but one is not
required. The number to the right of the E must not contain a dec im al point.
Printing
The Graph, Table, Calculator, Sensors, Output, Notes, Meter, and St opwatch
screens can all be printed on certain models of printers
USB port. In these screens, select the print command (or comma nds) from the
F4
menu.
To install a printer on the GLX, simply connect it to the GLX’s USB port using
the cable that came wi th y our printer . D r iv ers for comp atible pri n ters are factory
installed on the GLX and updated when eve r the GLX receiv es a firmware update
(see page 93).
2
connected to the GLX’s
2
The list of co m pat i bl e pr i nte r s is con ti nually increasing as new printer models
become available. For an up-to-date list
of compatible printers, visit
www.pasco.com or contact PASCO technical su pport at:
support@pasco.com
or
(916) 786-3800
or
(800) 772-8700
Page 98

92 Printing
Page 99

Xplorer GLX Users’ Guide 93
Chapter 5: Hardware Maintenance and
Operation
Firmware Update
From time to time, PASCO issues a free update to the firmware that runs on the
GLX. Updates include new and impro ved features and bug fixes. Send in the registration card that you received with your GLX, or register at
www.pasco.com/glx to be notified of new updates.
To check the version of firmware currently installed on your GLX, open the Settings screen (see page85) and press .
F4
You can always download t he la te st u pdate from www.pasco.com/glx. Fol low the
instructions at the website to download the update to your computer or a USB
flash drive. When you downl oad the firmware update, also downloa d the latest
revision of thi s Users’ Guide from the same web page.
Installi ng updates may delete files save d in the RAM and Flash folders of the
GLX. Transf er s tored files to your computer before upgrading the GLX. (See
“Tran sferring Files” on page 100.)
Updating from a Computer
Once the update is on your computer, con nect the GLX to the USB port and run
DataStudio. When DataStudio detects a GLX running an older firm ware version,
it will give the opt ion of upgrading that GLX. (See “GLX with DataStudio” on
page 99.)
Updating from a USB Flash Drive
Connect the USB fla sh drive con tainin g the update t o the GLX’s USB port. Open
the Data Files scre en (see pa ge 78). Press to open the Files menu and select
Upgrade GLX Firmware.
1
F4
F4
Version numbers displa y ed in the
Settings screen
1
To updat e the firmware from a f lash
drive, t he pr evio us fir mware versi on mus t
be 1.35 or later.
Battery and Power
Battery Charging
To char g e th e battery, simply connect the GLX to the AC power adapter. The
GLX will automatically power on. If its battery is less than fully char ged, the
GLX will begin to charge the battery and remain powered on until the battery is
fully charged.
If the battery is fully charged and AC power is con nected, the GLX will automatically save da ta and shut down after 60 minutes of i dle time.
power on and top off the battery as needed.
The typical full charging time for a new battery at room temperature is about 14
hours. When practical, allow the GLX to charge its battery in a room-temperature
or cooler environment. Plac e the GLX on a flat surface with it s stand unfolded t o
accommodate air flow and heat dissipation.
2
3
It will periodically
2
The icon in the upper-right corner of the
display indicates the condition of the bat tery. See page 11 for details.
3
The GLX is considered idle when
not
•the GLX is
• the Stopwat c h is
•the GLX is
puter running DataStudio, and
•the GLX is
its keypad, a mouse, or a USB keyboard.
See “Timed Auto Power Off” on page8
for more information.
collecting dat a,
not
running,
not
connected to a com-
not
receivi ng i n put thr o ugh
Page 100

94 Battery and Power
While charging, the GLX monitors its own temperature to prevent overheating.
The maximum recommended ambient temperature for charging is 32 °C (90 °F)
without sensor s, or 28°C (82 °F) with four maximum-lo ad s ensors
4
connected. If
the GLX becomes too hot, i t will te mporari ly s top cha r ging to al low its elf t o c ool,
resulting in a longer charge time.
Battery Power and Data File Storage
The GLX’s RAM (random-acce ss memory) requires a small amount of power. In
order to prese rve stor ed data , the GLX automat ical ly shut s down when it s batt ery
begins to run low. At that point, AC power must be connected within three days
to prese r ve data files stored in the RAM folder.
When powered off, disconnected from AC power, and starting with a fully
charged battery, the GLX will store RAM data for two weeks.
Flash memory does not require power. Dat a files stored in the Flash folder will
be preserved inde finitely even if the batte r y runs down or is remo ved.
4
A maximum-load senso r is one that
draws 10 0 mA of current from the GLX,
such as the PASPORT CO
PASPORT sens ors draw muc h le ss cur rent.
sensor . Most
2
For permanent storage, save files in the GLX’s Flash folder or tra n sfer files to a
USB Flas h d r iv e o r a com pu t er.
5
GLX Storage
To maximize the long-term performance of the battery, keep it charged as much
as possible. Note that the battery will drain slowly even when the GLX is powered off and disconnected from AC power. When you are not using the GLX, follow these storage guidelines:
• Whenever possible: Keep the GLX connected to AC power .
• Unplugged for more than a few days: Backup your data and allow the bat-
tery to fully charge before disconnecting the AC power .
• Unplugged for more than a month: Backup your data, allow the battery to
fully charge, then follow the instructions und er “Manual Internal Disconnection” below. A disconnected battery or a GLX in “deep sleep” mode can be
stored for up to a year before you sh ould recharge it.
Battery Disconnection
Automatic Internal Disconnection
5
See “Data Files Screen” on p age 78 for
more information.
When it is unplugged and turned off, the GLX uses a small amount of ba ttery
power to pres erve data saved in RAM. In order t o avoid fully dis charging the battery (which is not good for it), the GLX will go into “deep sleep” mode whe n
either of these cond itions is met:
• The GLX has been unused and unplugged for two weeks.
• The battery has drained to a critical level.
When the GLX enters deep sleep mode, it disconnects its battery by opening a
switch on its circ uit board. At this point, data saved in RAM is lost, but data
saved in Fl ash is preserved. Connect the GLX to AC power or press t he reset button (on the back of the GLX) to turn it back on.
 Loading...