

Page 1
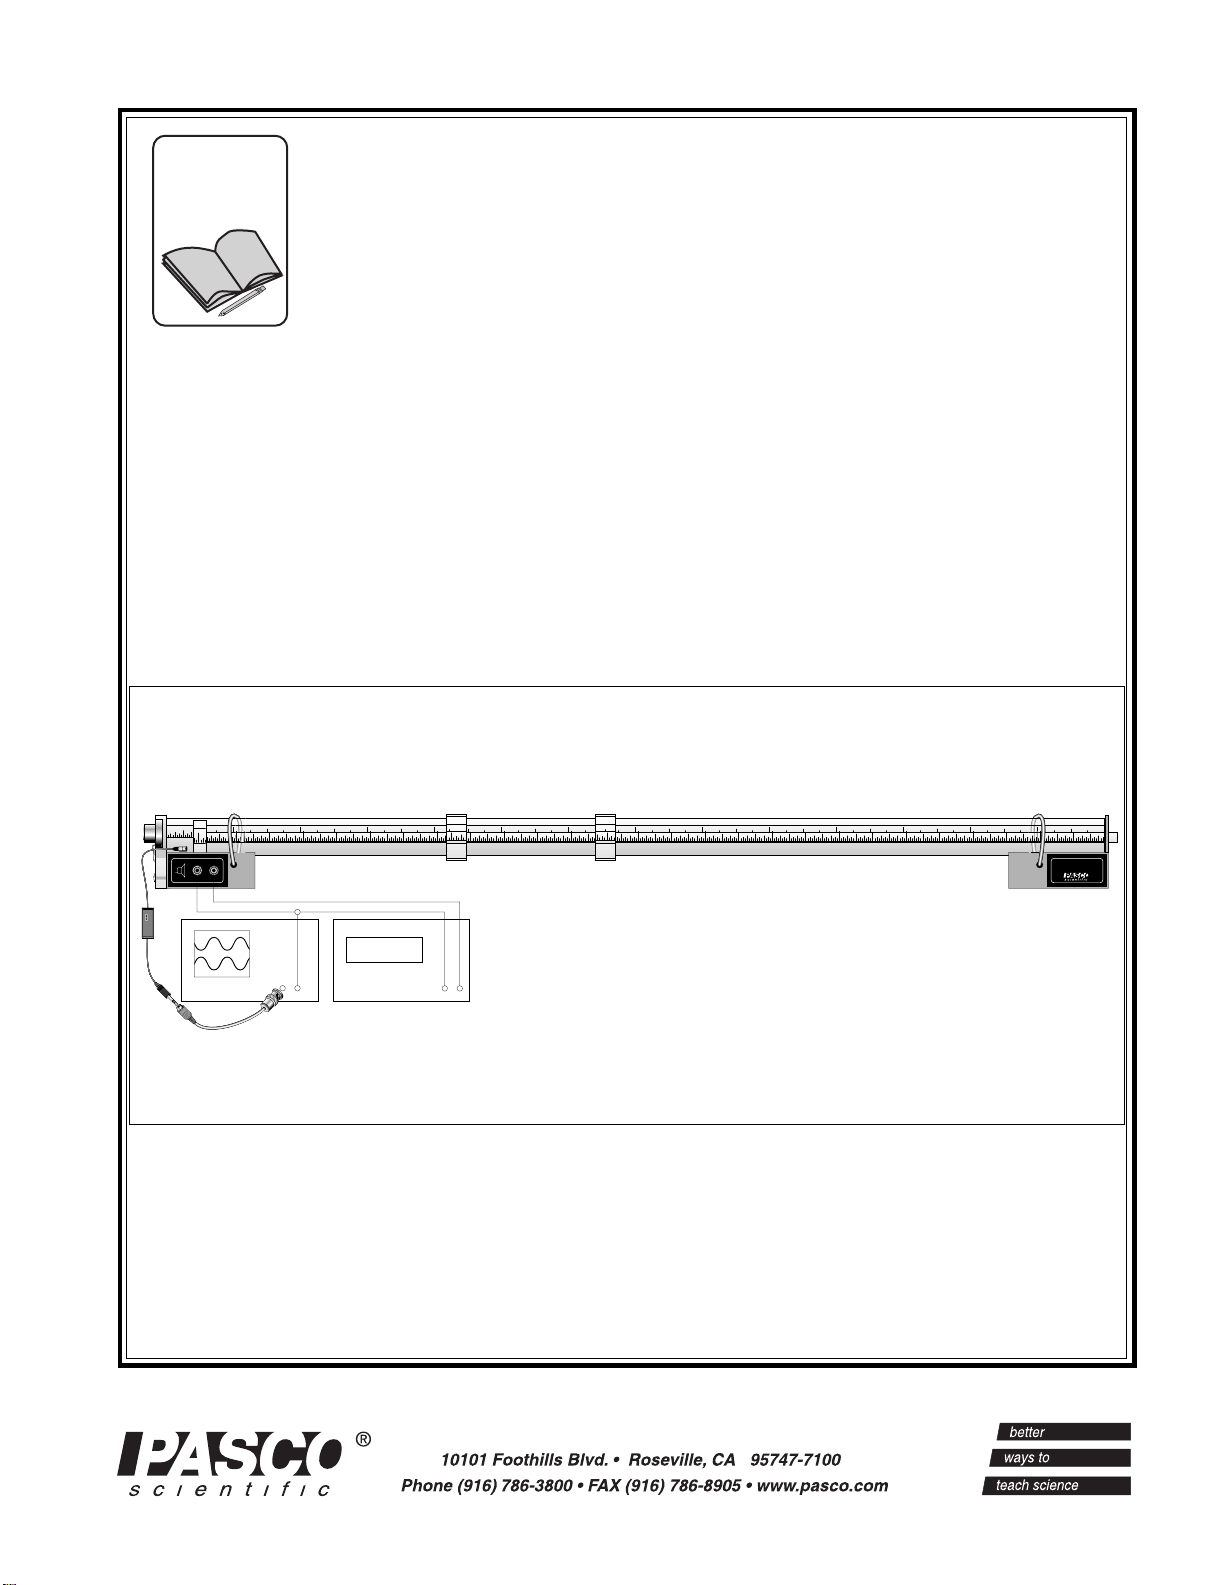
123456789
10 11 12 13 14
13
Includes
Teacher's Notes
and
Typical
Experiment Results
Instruction Manual and
Experiment Guide for
the PASCO scientific
Model WA-9612
RESONANCE
TUBE
012-03541E
3/95
123456789
SPEAKER INPUT
.1 W MAX
ON
ON
OFF
OFF
100.5 Hz
10 11 12 13 14
13
WA-9612
RESONANCE TUBE
© 1988 PASCO scientific $7.50
Page 2

Page 3

012-03541E Resonance Tube
T able of Contents
Section Page
Copyright, Warranty and Equipment Return...................................................ii
Introduction .....................................................................................................1
Equipment and Setup.......................................................................................1
Using the Resonance Tube:
with the PASCO Series 6500 Computer Interface ..............................3
with the Power Amplifier: ................................................................... 3
with the Data Monitor Program:..........................................................3
Waves in a Tube Theory:.................................................................................4
Experiments:
Experiment 1: Resonant Frequencies of a Tube.................................. 7
Experiment 2: Standing Waves in a Tube ...........................................9
Experiment 3: Tube Length and Resonant Modes .............................13
Experiment 4: The Speed of Sound in a Tube....................................15
Suggested Demonstration ...............................................................................17
Suggested Research Topics ............................................................................18
Teacher’s Guide..............................................................................................19
Technical Support................................................................. Inside Back Cover
i
Page 4
Resonance Tube 012-03541E
Copyright, Warranty and Equipment Return
Please—Feel free to duplicate this
manual subject to the copyright restrictions below.
Copyright Notice
The PASCO scientific Model WA-9612 Resonance
Tube manual is copyrighted and all rights reserved.
However, permission is granted to non-profit educational institutions for reproduction of any part of this
manual providing the reproductions are used only for
their laboratories and are not sold for profit. Reproduction under any other circumstances, without the
written consent of PASCO scientific, is prohibited.
Limited Warranty
PASCO scientific warrants this product to be free from
defects in materials and workmanship for a period of
one year from the date of shipment to the customer.
PASCO will repair or replace, at its option, any part of
the product which is deemed to be defective in material or workmanship. This warranty does not cover
damage to the product caused by abuse or improper
use. Determination of whether a product failure is the
result of a manufacturing defect or improper use by the
customer shall be made solely by PASCO scientific.
Responsibility for the return of equipment for warranty
repair belongs to the customer. Equipment must be
properly packed to prevent damage and shipped
postage or freight prepaid. (Damage caused by
improper packing of the equipment for return shipment
will not be covered by the warranty.) Shipping costs
for returning the equipment, after repair, will be paid
by PASCO scientific.
Equipment Return
Should the product have to be returned to PASCO
scientific for any reason, notify PASCO scientific by
letter, phone, or fax BEFORE returning the product.
Upon notification, the return authorization and
shipping instructions will be promptly issued.
ä
NOTE: NO EQUIPMENT WILL BE
ACCEPTED FOR RETURN WITHOUT AN
AUTHORIZATION FROM PASCO.
When returning equipment for repair, the units
must be packed properly. Carriers will not accept
responsibility for damage caused by improper
packing. To be certain the unit will not be
damaged in shipment, observe the following rules:
➀ The packing carton must be strong enough for the
item shipped.
➁ Make certain there are at least two inches of
packing material between any point on the
apparatus and the inside walls of the carton.
➂ Make certain that the packing material cannot shift
in the box or become compressed, allowing the
instrument come in contact with the packing
carton.
Credits
This manual authored by: Clarence Bakken
This manual edited by: Eric Ayars
Teacher's guide written by: Eric Ayars
Address: PASCO scientific
10101 Foothills Blvd.
Roseville, CA 95747-7100
Phone: (916) 786-3800
FAX: (916) 786-3292
email: techsupp@pasco.com
web: www.pasco.com
ii
Page 5
012-03541E Resonance Tube
Introduction
The PASCO Model WA-9612 Resonance Tube lets
you investigate the propagation of sound waves in a
tube. You can observe standing wave patterns in a
closed or open tube, and locate nodes and antinodes
while varying the length of the tube. You can measure
the speed of sound in the tube either indirectly, by
measuring the frequency and wavelength of a resonance mode, or more directly, by using a triggered
oscilloscope to measure the transit times for sound
pulses along the tube. The tube also has two holes in it
that can be covered or uncovered to investigate the
physics of wind instruments.
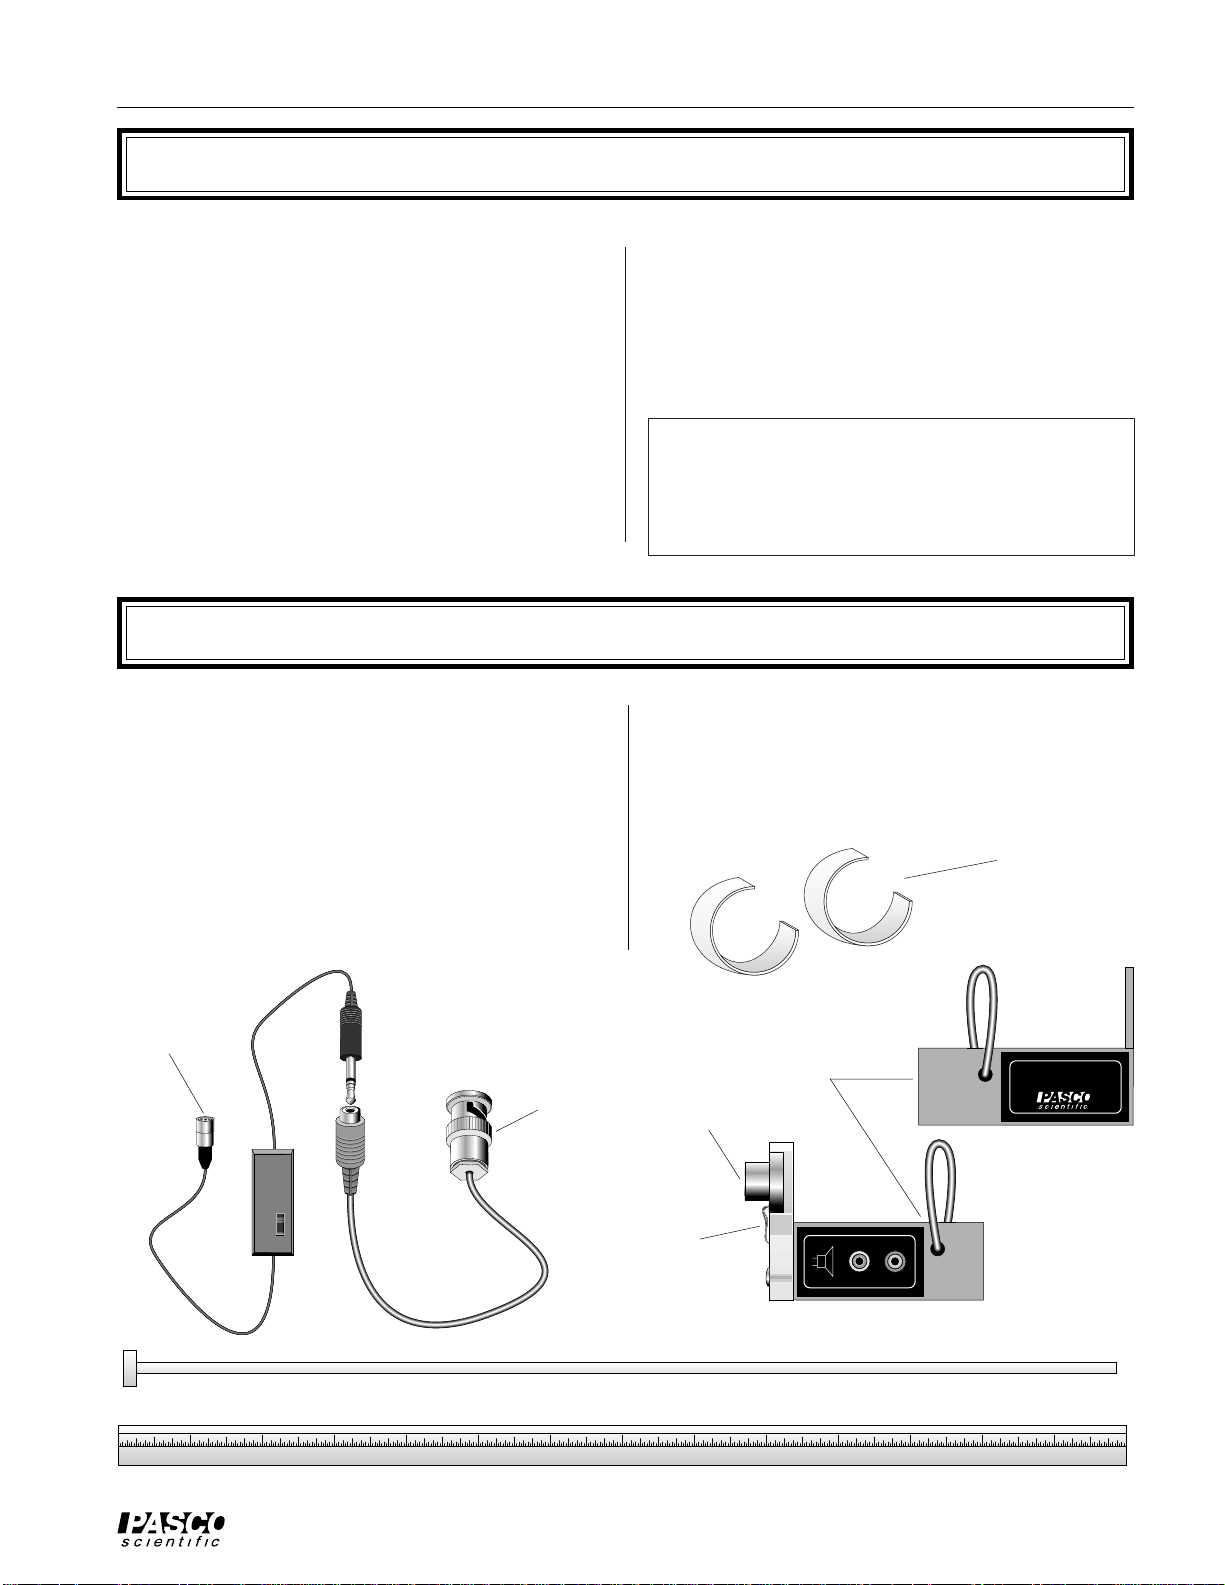
Equipment and Setup
The WA-9612 Resonance Tube comes with
the following equipment (see Figure 1):
• 90 cm clear plastic tube with a built-in metric
scale
• Two tube mounting stands, one with a built-in
speaker and a mount for the microphone
• Miniature microphone with a battery powered
amplifier (battery included) and a coax connector
for direct attachment to an oscillosocope
Waves in the tube are produced by a speaker and
detected by a miniature microphone. The microphone
can be mounted beside the speaker to detect resonance
modes, or it can be mounted on a rod and moved
through the tube to examine wave characteristics
inside the tube.
➤ NOTE: To use the Resonance Tube, you
will need an oscilloscope to examine the signal
detected by the microphone, and a signal generator capable of driving the 32 Ω 0.1 W speaker.
• Moveable piston
• Microphone probe rod (86 cm brass rod, not
shown)
• Clamp-on hole covers
Clamp-on hole
covers
Miniature
microphone
123456789
Microphone battery
and circuitry
Tube mounting
Coax
adapter
OFF
OFF
ON
ON
Moveable piston
Tube with built-in metric scale
Speaker
Microphone
mount
stands
SPEAKER INPUT
10 11 12 13 14
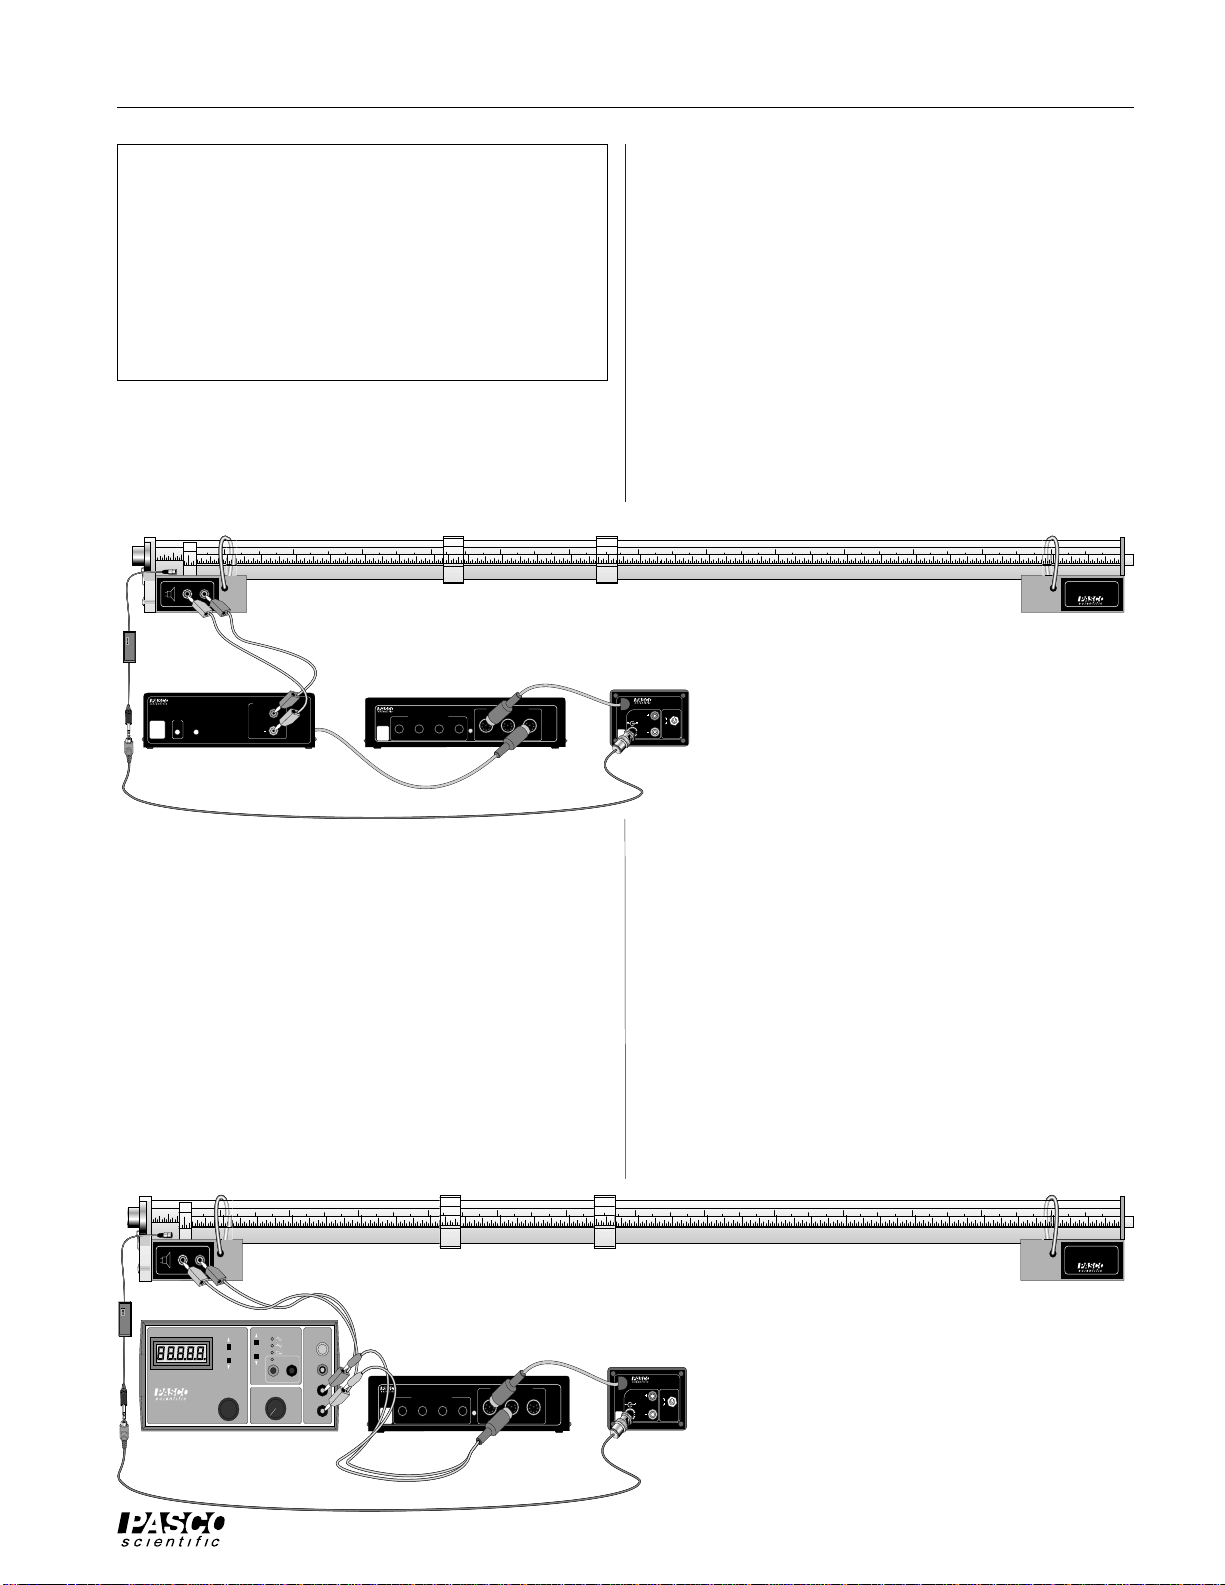
Figure 1 Equipment Included with the WA-9612 Resonance Tube
1
.1 W MAX
WA-9612
RESONANCE TUBE
Page 6
Resonance Tube 012-03541E
11 12 13 14
13
123456789
10 11 12 13 14
13
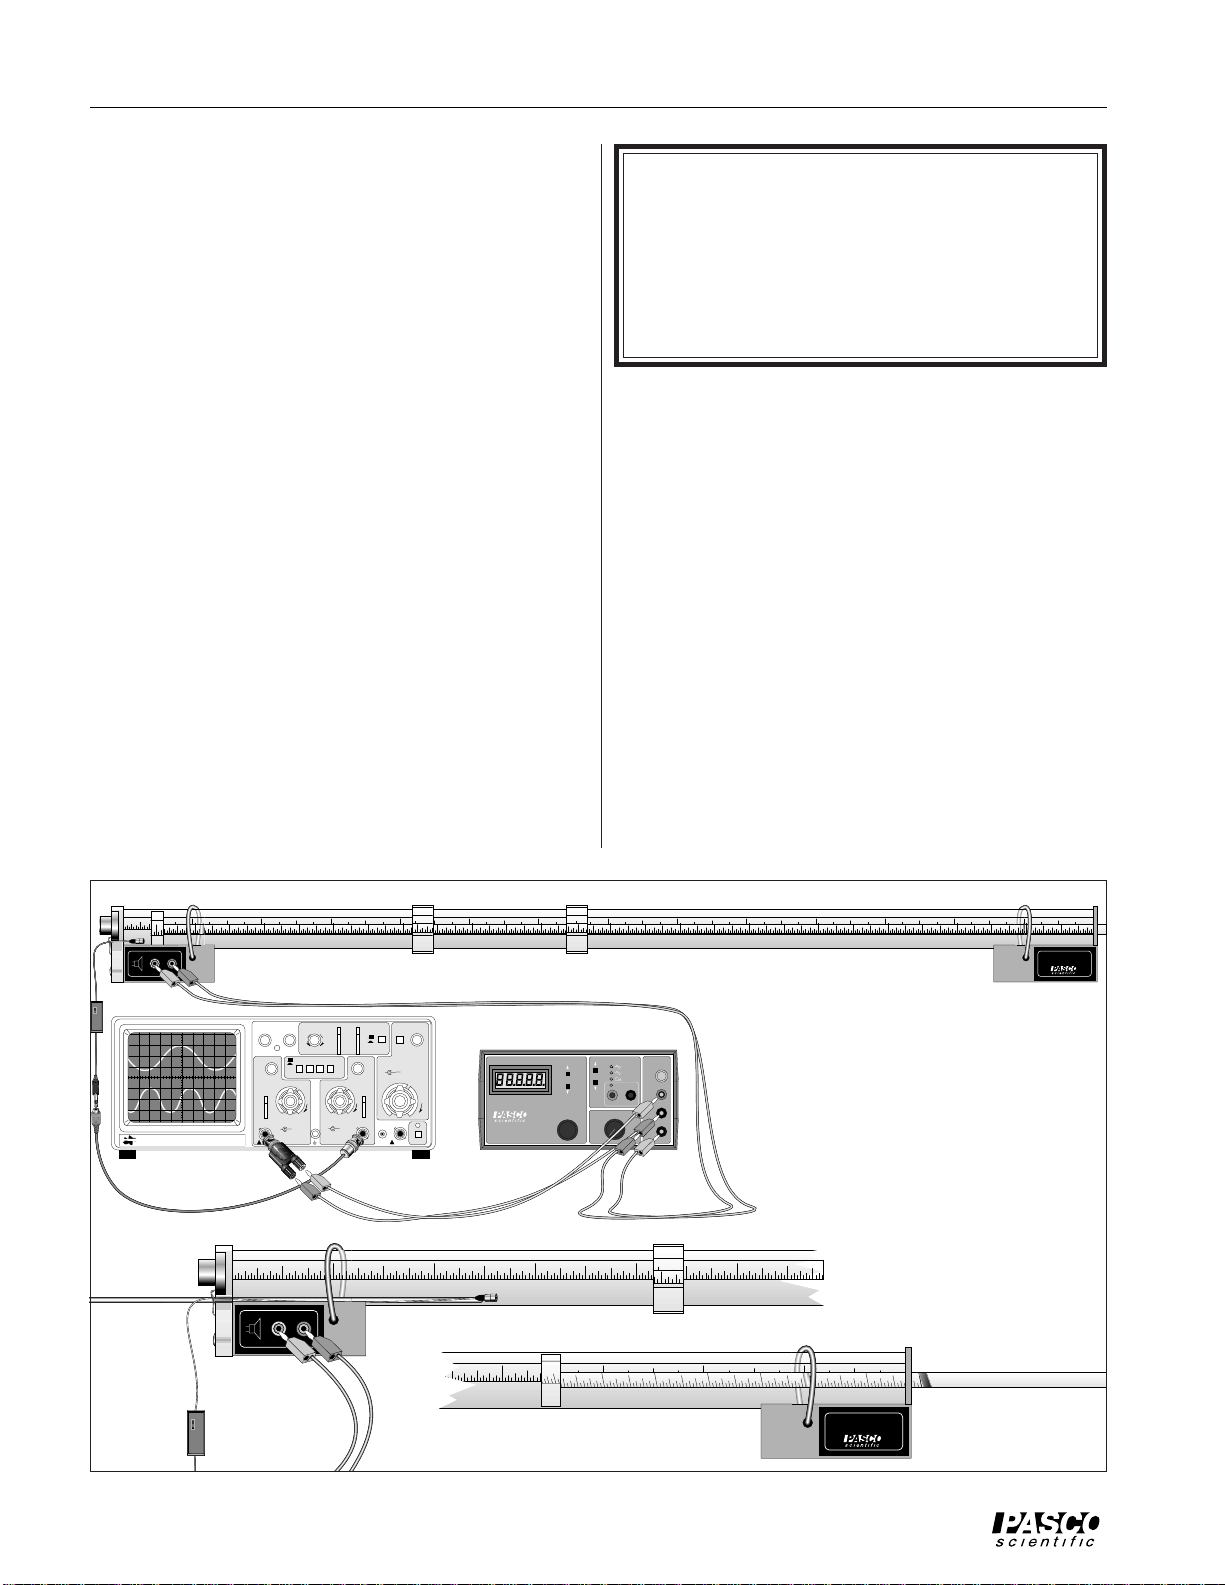
You will also need:
• A function generator capable of driving the 32 Ω,
0.1 W speaker (such as the PASCO PI-9587B
Digital Function Generator.
• An oscilloscope (such as the PASCO SB-9591)
• Banana plug hook-up wires for connecting your
function generator to the speaker
To set up the Resonance Tube
(see Figure 2):
➀ Set up the equipment as shown in Figure 2. The mi-
crophone can be mounted in the microphone hole
below the speaker, or, as shown in the lower insert,
it can be taped to the end of the microphone probe
rod and inserted through the mounting hole so that
nodes and antinodes can be located within the tube.
You can also vary the effective tube length by inserting the moveable piston as shown in the upper
insert. The end of the piston rod that is outside the
tube should be supported to avoid putting excessive
strain on the piston.
➁ Set the frequency of the function generator to ap-
proximately 100 Hz, and the amplitude to zero,
then turn it on. Slowly raise the amplitude until you
hear a sound from the speaker.
➤ CAUTION: You can damage the speaker by
overdriving it. Raise the amplitude cautiously.
The sound from the speaker should be clearly
audible, but not loud. Note also that many
function generators become more efficient at
higher frequencies, so you may need to reduce
the amplitude as you raise the frequency.
➂ Turn on the oscilloscope and switch on the battery
powered amplifier. Set the sweep speed to approximately match the frequency of the signal generator
and set the gain until you can clearly see the signal
from the microphone. If you can’t see the microphone signal, even at maximum gain, adjust the frequency of the signal generator until the sound from
the speaker is a maximum. Then raise the amplitude of the signal generator until you can see the
signal clearly on the oscilloscope.
➃ You can now find resonant modes by adjusting the
frequency of the sound waves or the length of the
tube, and listening for a maximum sound and/or
watching for a maximum signal on the oscilloscope.
123456789
SPEAKER INPUT
.1 W MAX
ON
ON
OFF
OFF
200 Mhz OSCILLISCOPE
BK PRECISION
MODEL 2120
INTENSITY
TRACE NOTATION
AC
DC
CH 1
POS
∞
FOCUS
TRIG LEVEL
-
MANUAL AUTO
NORM
CH1
EXT
EXT
CH2
VERTICAL MODE
CH 1 VOLTZ/DIV
CAL
V
mV
VAR VAR
PULL XS PULL XS
T X-Y
+
T X-Y
CH1
CH2
CH 2 VOLTZ/DIV
COUPLE SOURCE
AC
LINE
V
CH1
CH2
ALT
EXT
mV
X-POS
λ - Y
SLOPE
+
-
POSNORM
TIME/DIV
VAR SWEEP
AC
CAL
DC
CAL
CH4
∞
CH 2
CAL EXT
POWER
200V MAX
400V MAX400V MAX
Function generator
RANGE
HERTZ
PI-9587B
DIGITAL FUNCTION
GENERATOR - AMPLIFIER
ADJUST
WAVEFORM
AMPLITUDE
MIN
EXTERNAL
INPUT GND
OUTPUTFREQUENCY
TTL
HI Ω
GND
LO Ω
MAX
10 11 12 13 14
13
WA-9612
RESONANCE TUBE
Oscilloscope
12345
12345
SPEAKER INPUT
.1 W MAX
10 11 12 13 14
ON
ON
OFF
OFF
Using the moveable piston to vary the
Using the microphone probe rod
13
WA-9612
RESONANCE TUBE
tube length
Figure 2 Equipment Setup
2
Page 7
012-03541E Resonance Tube
123456789
10 11 12 13 14
13
123456789
10 11 12 13 14
13
➤ NOTE: In most textbooks, an open tube is
considered to be a tube that is open at both ends.
A closed tube is considered to be a tube that is
closed at one end and open at the other. In
keeping with this convention, the speaker and
microphone should be postioned several centimeters back from the end of the tube, so the microphone/speaker end of the tube is open.
If a resonance mode is excited in the tube, a pressure
antinode (a displacement node) will always exist at a
closed end of the tube. An open end of the tube
corresponds, more or less, to a pressure node (a
123456789
SPEAKER INPUT
.1 W MAX
ON
ON
OFF
OFF
CI-6502
POWER AMPLIFIER
CAUTION!
WHEN LIGHT IS ON
WAVEFORM IS DISTORTED.
DECREASE AMPLITUDE!
SIGNAL OUTPUT
0 to ±10 V
1 A MAX
+
PASCO
SERIES
6500
INTERFACE
SYSTEM
FOR USE WITH PASCO SERIES 6500 INTERFACES
ON
Figure 3
CI-6510
FOR USE WITH PASCO SERIES 6500 SENSORS
DIGITAL CHANNELS
1234
PASCO
SERIES
6500
INTERFACE
SYSTEM
SIGNAL INTERFACE
ON
ANALOG CHANNELS
A ▲
GAIN = 1,10,100
ISOLATED
B ■ C ●
=
GAIN
1
ISOLATED
GAIN = 1
REF TO GND
Using the Power Amplifier:
Connect the Power Amplifier DIN plug to channel C
of the Interface. Connect the output of the Power
Amplifier to the resonance tube speaker, but DO NOT
TURN THE POWER AMPLIFIER ON UNTIL YOU
HAVE SET THE OUTPUT AMPLITUDE FROM
WITHIN THE PROGRAM.
Connect the BNC plug on the resonance tube microphone to the BNC jack on the CI-6508 Input Adapter
Box, and the DIN plug on the Adapter Box to channel
A of the Interface. Turn the amplification select switch
on the CI-6508 to 100x. (See Figure 3.)
ANALOG INPUT
PASCO
SERIES
6500
INTERFACE
SYSTEM
Model CI-6508
INPUT ADAPTOR
FOR USE WITH PASCO SERIES 6500 INTERFACES
(±10V MAX)
tube.
10 11 12 13 14
Start the program. (Consult your
manual for details on the operation of the program if necessary.) Set the output
to a 1 V sine wave, then turn the CI-6502
GAIN SELECT
X 100
X 10
X 1
Power Amplifier on. Show channel A and
NOTE: SWITCH
FUNTIONS ONLY WHEN
ADAPTOR IS
CONNECTED TO INPUT
MARKED ▲ ON THE
SIGNAL INTERFACE
channel C on the screen, so you can see both
the speaker output and the waveform in the
13
WA-9612
RESONANCE TUBE
displacement antinode). However, the pressure node
will, in general, not be located exactly at the end of the
tube. You can investigate the behavior of the sound
waves near the open end using the microphone.
Using the Resonance Tube with the
PASCO Series 6500 Computer Interface
There are two ways of using the PASCO Series-6500
Computer Interface with the resonance tube, depending on whether you intend to drive the resonance tube
with the CI-6502 Power Amplifier or with a separate
function generator.
123456789
SPEAKER INPUT
.1 W MAX
ON
ON
OFF
OFF
HERTZ
PI-9587B
DIGITAL FUNCTION
GENERATOR - AMPLIFIER
RANGE
ADJUST
WAVEFORM
INPUT GND
AMPLITUDE
MIN
EXTERNAL
OUTPUTFREQUENCY
TTL
HI Ω
GND
LO Ω
MAX
PASCO
SERIES
6500
INTERFACE
SYSTEM
Figure 4
CI-6510
SIGNAL INTERFACE
FOR USE WITH PASCO SERIES 6500 SENSORS
DIGITAL CHANNELS
1234
ON
ANALOG CHANNELS
A ▲
GAIN = 1,10,100
ISOLATED
B ■ C ●
=
GAIN
1
ISOLATED
GAIN = 1
REF TO GND
Using a Function Generator:
Connect the BNC plug on the Resonance tube microphone to the BNC jack on the CI-6508 Input Adapter
Box, and the DIN plug on the Adapter Box to channel
A of the Series-6500. Turn the amplification select
switch on the CI-6508 to 100x.
If you have a CI-6503 Voltage Sensor, use it to link
the function generator and channel B of the CI-6500.
(This step is optional; it allows you to use the function
generator for triggering, with slightly improved
results.) See Figure 4.
Start the program. (Consult your manual for details on
the operation of this program if necessary.) In oscillo-
10 11 12 13 14
scope mode, set triggering to automatic
on channel B. Show channels A and B
on the screen, and find the resonances you are
interested in. If you wish, turn on the fre-
GAIN SELECT
X 100
quency analysis option (FFT) and observe the
X 10
X 1
NOTE: SWITCH
FUNTIONS ONLY WHEN
ADAPTOR IS
CONNECTED TO INPUT
MARKED ▲ ON THE
SIGNAL INTERFACE
frequencies that are contributing to the stand-
ANALOG INPUT
(±10V MAX)
PASCO
SERIES
6500
INTERFACE
SYSTEM
Model CI-6508
INPUT ADAPTOR
FOR USE WITH PASCO SERIES 6500 INTERFACES
ing wave.
(*Available only for the Macintosh
MS-DOS version of the Data Monitor.)
3
®
13
and for the
WA-9612
RESONANCE TUBE
Page 8

Resonance Tube 012-03541E
Waves in a T ube Theory:
Sound Waves
When the diaphragm of a speaker vibrates, a sound
wave is produced that propagates through the air. The
sound wave consists of small motions of the air
molecules toward and away from the speaker. If you
were able to look at a small volume of air near the
speaker, you would find that the volume of air does
not move far, but rather it vibrates toward and away
from the speaker at the frequency of the speaker
vibrations. This motion is very much analogous to
waves propagating on a string. An important difference is that, if you watch a small portion of the string,
its vibrational motion is transverse to the direction of
propagation of the wave on the string. The motion of a
small volume of air in a sound wave is parallel to the
direction of propagation of the wave. Because of this,
the sound wave is called a longitudinal wave.
Another way of conceptualizing a sound wave is as a
series of compressions and rarefactions. When the
diaphragm of a speaker moves outward, the air near
the diaphragm is compressed, creating a small volume
of relatively high air pressure, a compression. This
small high pressure volume of air compresses the air
adjacent to it, which in turn compresses the air adjacent to it, so the high pressure propagates away from
the speaker. When the diaphragm of the speaker moves
inward, a low pressure volume of air, a rarefaction, is
created near the diaphragm. This rarefaction also
propagates away from the speaker.
In general, a sound wave propagates out in all directions from the source of the wave. However, the study
of sound waves can be simplified by restricting the
motion of propagation to one dimension, as is done
with the Resonance Tube.
Standing Waves in a Tube
Standing waves are created in a vibrating string when
a wave is reflected from an end of the string so that the
returning wave interferes with the original wave.
Standing waves also occur when a sound wave is
reflected from the end of a tube.
A standing wave on a string has nodes—points where
the string does not move—and antinodes—points
where the string vibrates up and down with a maximum amplitude. Analogously, a standing sound wave
has displacement nodes—points where the air does not
vibrate—and displacement antinodes—points where
the amplitude of the air vibration is a maximum.
Pressure nodes and antinodes also exist within the
waveform. In fact, pressure nodes occur at displacement antinodes and pressure antinodes occur at
displacement nodes. This can be understood by
thinking of a pressure antinode as being located
between two displacement antinodes that vibrate 180°
out of phase with each other. When the air of the two
displacement antinodes are moving toward each other,
the pressure of the pressure antinode is a maximum.
When they are moving apart, the pressure goes to a
minimum.
Reflection of the sound wave occurs at both open and
closed tube ends. If the end of the tube is closed, the
air has nowhere to go, so a displacement node (a
pressure antinode) must exist at a closed end. If the
end of the tube is open, the pressure stays very nearly
at room pressure, so a pressure node (a displacement
antinode) exists at an open end of the tube.
Resonance
As described above, a standing wave occurs when a
wave is reflected from the end of the tube and the
return wave interferes with the original wave. However, the sound wave will actually be reflected many
times back and forth between the ends of the tube, and
all these multiple reflections will interfere together. In
general, the multiply reflected waves will not all be in
phase, and the amplitude of the wave pattern will be
small. However, at certain frequencies of oscillation,
all the reflected waves are in phase, resulting in a very
high amplitude standing wave. These frequencies are
called resonant frequencies.
In Experiment 1, the relationship between the length of
the tube and the frequencies at which resonance occurs
is investigated. It is shown that the conditions for
resonance are more easily understood in terms of the
wavelength of the wave pattern, rather than in terms of
the frequency. The resonance states also depend on
whether the ends of the tube are open or closed. For
an open tube (a tube open at both ends), resonance
occurs when the wavelength of the wave (l) satisfies
the condition:
L = nl/2, n = 1, 2, 3, 4,….
where L = tube length.
These wavelengths allow a standing wave pattern such
that a pressure node (displacement antinode) of the
4
Page 9
012-03541E Resonance Tube
wave pattern exists naturally at each end of the tube.
Another way to characterize the resonance states is to
say that an integral number of half wavelengths fits
between the ends of the tube.
For a closed tube (by convention, a closed tube is open
at one end and closed at the other), resonance occurs
when the wavelength of the wave (l) satisfies the
condition:
L = nl/4, n = 1, 3, 5, 7, 9,….
These wavelengths allow a standing wave pattern
such that a pressure node (displacement antinode)
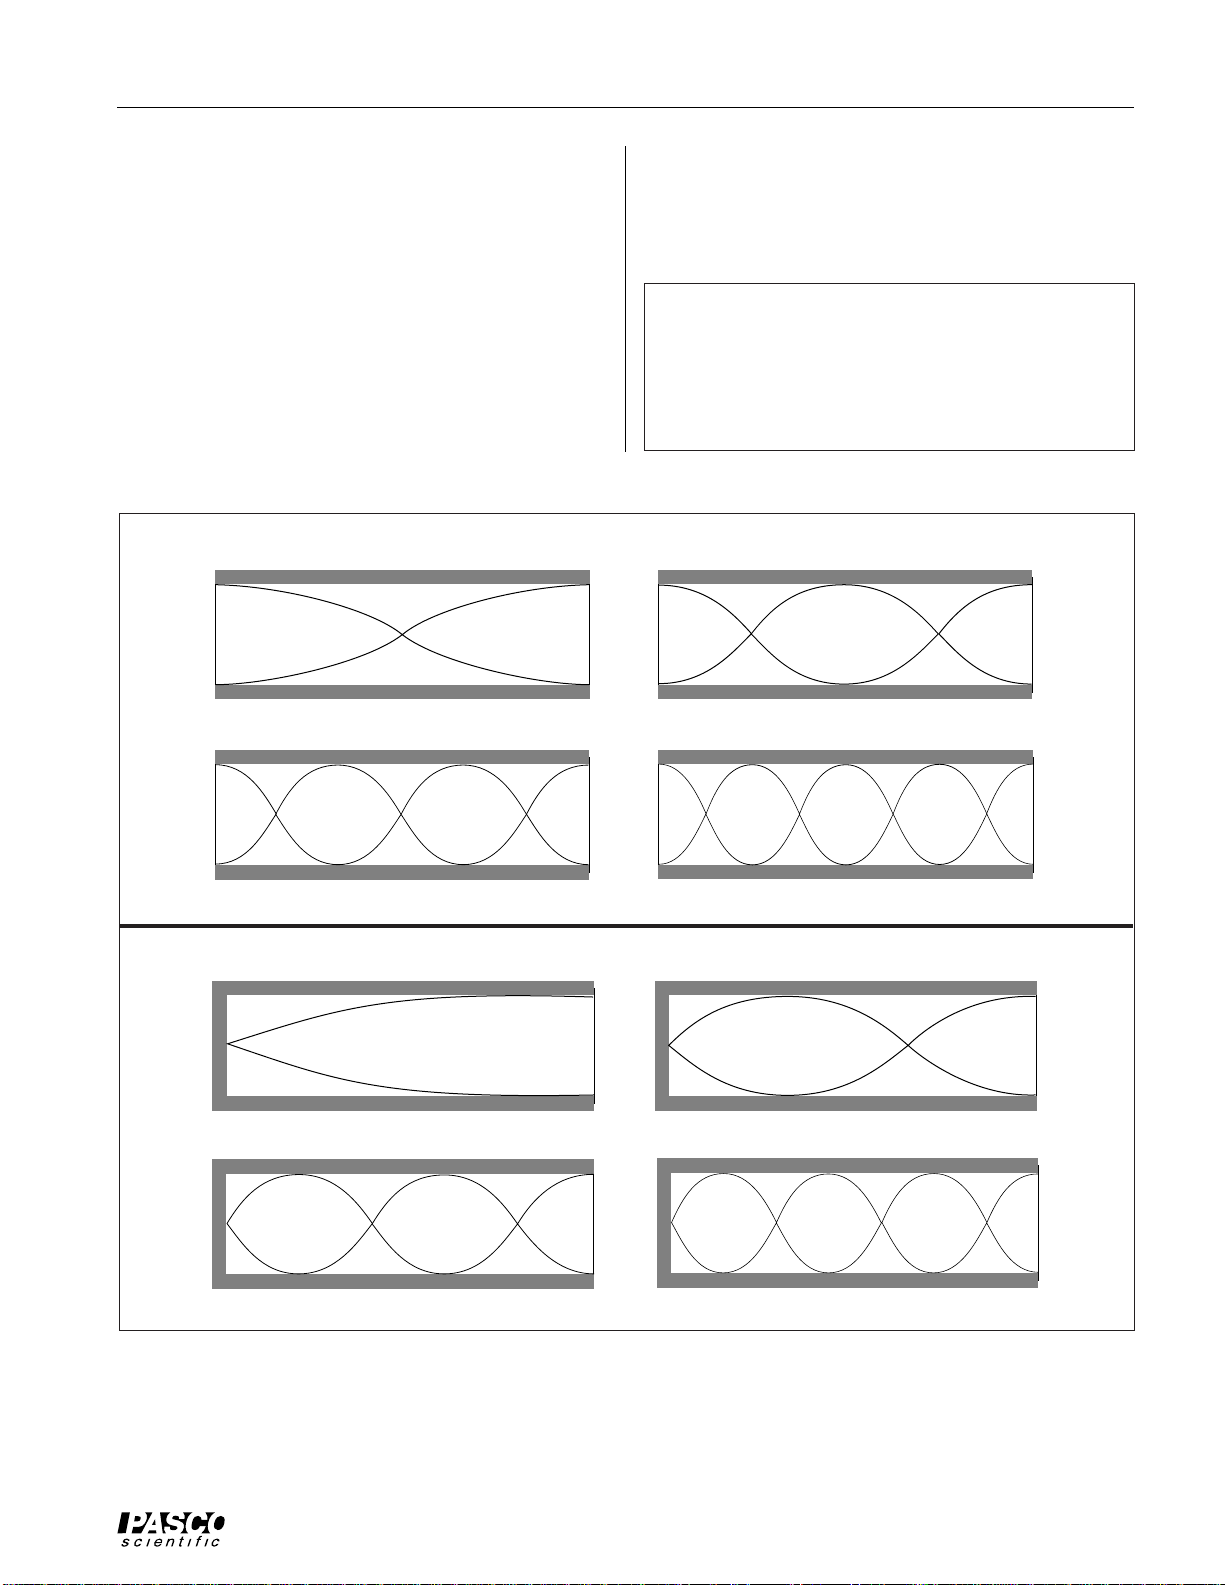
OPEN TUBE
N
A A
Fundamental: Open tube
A
occurs naturally at the open end of the tube and a
pressure antinode (displacement node) occurs naturally
at the closed end of the tube. As for the open tube, each
successive value of n describes a state in which one
more half wavelength fits between the ends of the tube.
➤ NOTE: The first four resonance states for open
and closed tubes are diagramed below. The first
resonance state (n = 1) is called the fundamental.
Successive resonance states are called overtones. The
representation in each case is relative displacement.
N
N
AA
1st Overtone: Open tube
A
CLOSED TUBE
N
N
N
N
A
2nd Overtone: Open tube
Fundamental: Closed tube
N
A
2nd Overtone: Closed tube
A
Resonance States:Open and Closed Tubes
A
N
N
A
A
A
A
N
N
N
N
A
3rd Overtone: Open tube
A
A
1st Overtone: Closed tube
N
A
3rd Overtone: Closed tube
A
N
N
N
A
A
N
A
A
N
A
5
Page 10

Resonance Tube 012-03541E
The formulas and diagrams shown above for resonance in a tube are only approximate, mainly because
the behavior of the waves at the ends of the tube
(especially at an open end) depends partially on
factors such as the diameter of the tube and the
frequency of the waves. The ends of the tubes are not
exact nodes and antinodes. It can be a useful experiment to investigate the wave behavior at the ends of
the tube using the microphone. The following empirical formulas give a somewhat more accurate description of the resonance requirements for standing waves
in a tube.
For an open tube:
L + 0.8d = nl/2, n = 1, 2, 3, 4,….
➤ NOTE: The following four experiments require the WA-9612 Resonance Tube,
and a function generator capable of driving the 32 Ω, 0.1 W speaker (such as the
PASCO PI-9587C Digital Function Generator). You will also need banana plug
hook-up wires to connect the function generator to the speaker.
An oscilloscope (such as the PASCO SB-9591 Student Oscilloscope) is recommended for all the experiments and required for Experiment 4.
If you are using a function generator that does not provide an accurate indication of
frequency output, you will need a frequency counter (such as the SB-9599A
Universal Digital Meter) for all four experiments.
where L is the length of the tube and d is the diameter.
For a closed tube:
L + 0.4d = nl/4, n = 1, 3, 5, 7, 9,….
where L is the length of the tube and d is the diameter.
➤ NOTE: When using the microphone to
investigate the waveform within the tube, be
aware that the microphone is a pressure transducer. A maximum signal, therefore, indicates a
pressure antinode (a displacement node) and a
minimum signal indicates a pressure node
(displacement antinode).
6
Page 11

012-03541E Resonance Tube
123456789
10 11 12 13 14
13
Experiment 1: Resonant Frequencies of a Tube
EQUIPMENT NEEDED:
— PASCO Resonance Tube
— Function Generator
— Frequency Counter (if your function generator doesn't accurately indicate frequency)
— Oscilloscope (recommended, not necessary)
Introduction
When a speaker vibrates near a tube, there are certain frequencies at which the tube will
amplify the sound from the speaker. These frequencies are called resonant frequencies, and
occur because the dimensions of the tube are such that, at these frequencies, there occurs a
maximum transfer of energy between the speaker and the tube.
Procedure
➀ Set up the Resonance Tube, oscilloscope, and function generator as shown in Figure 1.1.
Turn on the oscilloscope. Set the oscilloscope sweep speed to approximately 5 ms/div and
the gain on channel one to approximately 5 mV/div. Turn on the amplifier and the function
generator. Set the output frequency of the function generator to approximately 100 Hz.
Adjust the amplitude of the function generator until you can distinctly hear the sound from
the speaker. If you use the oscilloscope, trigger on the speaker output.
➤ WARNING: You can damage the speaker by overdriving it. The sound from the
speaker should be clearly audible, but not loud. Note also that many signal generators
become more efficient and thus produce a larger output as the frequency increases, so
you may need to reduce the amplitude as you increase the frequency.
➁ Increase the frequency slowly and listen carefully. In general, the sound will become
louder as you increase the frequency because the function generator and speaker are more
efficient at higher frequencies. However, listen for a relative maximum in the sound level—
a frequency where there is a slight decrease in the sound level as you increase the frequency
slightly. This relative maximum indicates a resonance mode in the tube. Adjust the frequency carefully to find the lowest frequency at which a relative maximum occurs. (You
can also find the relative maximum by watching the trace on the oscilloscope. When the
signal is a maximum height, you have reached a resonant frequency.) Record the value of
this lowest resonant frequency as n
123456789
SPEAKER INPUT
.1 W MAX
ON
ON
OFF
OFF
Amplifier
200 Mhz OSCILLISCOPE
BK PRECISION
MODEL 2120
Oscilloscope
INTENSITY
TRACE NOTATION
AC
DC
CH 1 ∞
FOCUS
POS
CH 1 VOLTZ/DIV
V
VAR VAR
PULL XS PULL XS
TRIG LEVEL
-
MANUAL AUTO
CH1
EXT
CH2
VERTICAL MODE
CAL
mV
NORM
EXT
+
CH 2 VOLTZ/DIV
COUPLE SOURCE
AC
T X-Y
T X-Y
LINE
CH1
CH2
V
CH1
λ - Y
SLOPE
+
CH2
-
ALT
EXT
POSNORM
TIME/DIV
AC
CAL
DC
mV
CH 2
∞
CAL EXT
200V MAX
400V MAX400V MAX
X-POS
VAR SWEEP
CAL
CH4
POWER
in Table 1.1
0
Function generator
HERTZ
PI-9587B
DIGITAL FUNCTION
GENERATOR - AMPLIFIER
10 11 12 13 14
WAVEFORM
AMPLITUDE
MIN
EXTERNAL
INPUT GND
OUTPUTFREQUENCY
TTL
HI Ω
GND
LO Ω
MAX
RANGE
ADJUST
13
WA-9612
RESONANCE TUBE
Figure 1.1 Equipment Setup
7
Page 12

Resonance Tube 012-03541E
➂ Raise the frequency slowly until you find a new resonant frequency. Again measure and
record the frequency.
➃ Continue finding still higher resonant frequencies. Find at least five.
➄ Now close one end of the tube. You can either put the piston in the end of the tube, support-
ing the rod on some convenient object, or place an object, such as a book, against the end of
the tube.
➅ Repeat steps 2-4 for the closed tube, recording your readings in Table 1.2.
TABLE 1.1
Resonant Frequencies for an Open Tube
Frequencies
ν
ν
= --------
0
Analysis
For each tube configuration (open and closed) divide each of your resonant frequencies (n)
by the lowest resonant frequency (n0) that you were able to find. Your results should give
you a series of whole numbers. Record this series for each tube configuration. If you do not
get a series of whole numbers, you may not have found the lowest resonant frequency for
the tube. If this is the case, try to use your results to determine what the lowest resonant
frequency would have been, had you been able to detect it.
ν/ν
TABLE 1.2
Resonant Frequencies for a Closed Tube
0
Frequencies
ν
ν
= --------
0
ν/ν
0
Questions
Is the number series you determined the same for both closed and open tubes? Which tube
configuration gives a series of consecutive whole numbers? If you have already studied
standing wave patterns, try to explain your results in terms of the types of standing wave
patterns that are excited in each tube configuration. Is there a node or an antinode at a
closed end of the tube? Is there a node or an antinode at an open end of the tube?
8
Page 13

012-03541E Resonance Tube
Experiment 2: Standing Waves in a Tube
EQUIPMENT NEEDED:
— PASCO Resonance Tube
— Function Generator
—Frequency Counter (if your function generator does not accurately indicate frequency)
— Oscilloscope (recommended, but not necessary)
Introduction
A sound wave propagating down a tube is reflected back and forth from each end of the tube,
and all the waves, the original and the reflections, interfere with each other. If the length of the
tube and the wavelength of the sound wave are such that all of the waves that are moving in the
same direction are in phase with each other, a standing wave pattern is formed. This is known as
a resonance mode for the tube and the frequencies at which resonance occurs are called resonant
frequencies. In this experiment, you will set up standing waves inside the Resonance Tube and
use the miniature microphone to determine the characteristics of the standing waves.
Procedure
➀ Set up the Resonance Tube, oscilloscope, and function generator as shown in Figure 2.1. Turn on the
oscilloscope. Set the sweep speed to 5 ms/div and the gain on channel one to approximately 5 mV/div.
Microphone and
probe rod
Amplifier
ON
ON
OFF
OFF
BK PRECISION
12345
12345
SPEAKER INPUT
.1 W MAX
COUPLE SOURCE
CH1
200 Mhz OSCILLISCOPE
MODEL 2120
INTENSITY
AC
DC
CH 1
TRACE NOTATION
POS
∞
FOCUS
TRIG LEVEL
-
+
MANUAL AUTO
NORM
CH1
EXT
EXT
CH2
VERTICAL MODE
CH 1 VOLTZ/DIV
CAL
V
mV
VAR VAR
PULL XS PULL XS
AC
T X-Y
T X-Y
LINE
CH1
CH2
CH 2 VOLTZ/DIV
V
CH2
ALT
EXT
POSNORM
CAL
mV
∞
CH 2
400V MAX400V MAX
X-POS
λ - Y
SLOPE
+
-
TIME/DIV
VAR SWEEP
AC
DC
CAL EXT
CAL
CH4
POWER
200V MAX
Oscilloscope
Figure 2.1 Equipment Setup
HERTZ
PI-9587B
DIGITAL FUNCTION
GENERATOR - AMPLIFIER
Function generator
WAVEFORM
RANGE
EXTERNAL
INPUT GND
AMPLITUDE
ADJUST
MAX
MIN
OUTPUTFREQUENCY
TTL
HI Ω
GND
LO Ω
Turn on the amplifier and the function generator. Set the output frequency of the function generator
to approximately 100 Hz. Adjust the amplitude of the function generator until you can distinctly
hear the sound from the speaker. If you use the oscilloscope, trigger on the speaker output.
➤ WARNING: You can damage the speaker by overdriving it. The sound from the speaker
should be clearly audible, but not loud. Note also that many signal generators become more
efficient and thus produce a larger output as the frequency increases, so you may need to
reduce the amplitude as you increase the frequency.
9
Page 14

Resonance Tube 012-03541E
11 12 13 14
13
➁ Slowly increase the frequency and listen carefully. In general, the sound will become louder as
you increase the frequency because the function generator and speaker are more efficient at
higher frequencies. However, listen for a relative maximum in the sound level—a frequency
where there is a slight decrease in the sound level as you increase the frequency slightly. This
relative maximum indicates a resonance mode in the tube. Adjust the frequency carefully to find
the lowest frequency at which a relative maximum occurs. (You can also find the relative
maximum by watching the trace on the oscilloscope. When the signal height is a relative maximum, you have found a resonant frequency.)
➤ NOTE: It can be difficult to find resonant frequencies at low frequencies (0-300 Hz). If you
have trouble with this, try finding the higher frequency resonant modes first, then use your
knowledge of resonance modes in a tube to determine the lower resonant frequencies. Be sure
to check to make sure that resonance really occurs at those frequencies.
➂ Mount the microphone on the end of the probe arm and insert it into the tube through the hole in
the speaker/microphone stand. As you move the microphone down the length of the tube, note
the positions where the oscilloscope signal is a maximum and where it is a minimum. Record
these positions in table 2.1. You will not be able to move the probe completely down the tube
because the cord is too short. However, you can move the probe around to the opposite end of
the tube, to examine the other end of the tube. Pay particular attention to the wave characteristics
near the open end of the tube.
➃ Repeat the above procedure for at least five different resonant frequencies and record your
results on a separate sheet of paper.
➄ Insert the piston into the tube, as in Figure 2.2, until it reaches the maximum point that the
microphone can reach coming in from the speaker end.
10 11 12 13 14
Piston
Figure 2.2 Using the Plunger
13
WA-9612
RESONANCE TUBE
Plunger
➅ Find a resonant frequency for this new tube configuration. Use the microphone to locate the
maxima and minima for this closed tube configuration, recording your results in table 2.2.
Repeat this procedure for several different frequencies.
10
Page 15

012-03541E Resonance Tube
Analysis
Use the data that you have recorded to sketch the wave activity along the length of your tube for
both the open and closed tube at each of the frequencies you used.
The microphone you are using is sensitive to pressure. The maxima are therefore points of
maximum pressure and the minima are points of minimum pressure. On your drawings, indicate
where the points of maximum and minimum displacement are located.
Determine the wavelength for the waves in at least two of your trials. Given the frequency of the
sound wave you used in each configuration, calculate the speed of sound in your tube. How
does this agree with the accepted value of 331.5 m/sec + .607 T, where T is the temperature in
Celsius degrees?
Describe the nature of the wave behavior at the end of an open tube based on your measurements. Also describe the nature of the waves at a solid obstacle like the face of the piston.
Table 2.1 Open Tube
Resonant Frequency: _____________
Microphone Positions
Maxima Minima
Table 2.2 Closed Tube
Resonant Frequency: _____________
Microphone Positions
Maxima Minima
11
Page 16

Resonance Tube 012-03541E
Notes
12
Page 17

012-03541E Resonance Tube
11 12 13 14
13
Experiment 3: Tube Length and Resonant Modes
EQUIPMENT NEEDED:
— PASCO Resonance Tube
— Function Generator
— Frequency Counter (if your function generator does not accurately indicate frequency)
— Oscilloscope (recommended, but not necessary)
Introduction
For any given tube length, there are a variety of resonant frequencies—frequencies at which
standing waves will be formed in the tube. Likewise, for a given frequency, there are a
variety of tube lengths at which a standing wave will be formed. In this experiment you will
examine the series of tube lengths which will resonate with a set frequency.
Procedure
➀ Set up the Resonance Tube, oscilloscope, and function generator as shown in Figure 3.1.
Move the piston to a position very near the end of the tube. Set the signal generator to
approximately 800 Hz and turn the amplitude up until the speaker is clearly heard. Record
this frequency. If you use the oscilloscope, trigger on the speaker output.
12345
12345
SPEAKER INPUT
.1 W MAX
ON
ON
OFF
OFF
200 Mhz OSCILLISCOPE
BK PRECISION
MODEL 2120
INTENSITY
AC
DC
CH 1
TRACE NOTATION
POS
∞
FOCUS
TRIG LEVEL
-
MANUAL AUTO
CH1
EXT
CH2
VERTICAL MODE
CH 1 VOLTZ/DIV
CAL
V
mV
VAR VAR
PULL XS PULL XS
NORM
EXT
T X-Y
+
CH1
CH2
CH 2 VOLTZ/DIV
COUPLE SOURCE
AC
T X-Y
LINE
V
CH1
X-POS
λ - Y
SLOPE
+
CH2
-
ALT
EXT
POSNORM
TIME/DIV
VAR SWEEP
AC
CAL
DC
mV
CAL
CH4
CH 2
∞
CAL EXT
POWER
200V MAX
400V MAX400V MAX
Function generator
HERTZ
PI-9587B
DIGITAL FUNCTION
GENERATOR - AMPLIFIER
10 11 12 13 14
13
Piston
WAVEFORM
AMPLITUDE
MIN
EXTERNAL
INPUT GND
OUTPUTFREQUENCY
TTL
HI Ω
GND
LO Ω
MAX
RANGE
ADJUST
WA-9612
RESONANCE TUBE
Oscilloscope
Figure 3.1 Equipment Setup
➤ WARNING: You can damage the speaker by overdriving it. The sound from the speaker
should be clearly audible, but not loud. Note also that many signal generators become
more efficient and thus produce a larger output as the frequency increases, so if you
increase the frequency, you may need to reduce the amplitude.
➁ Slowly push the piston further into the tube, until you hear the sound from the speaker
being amplified by the tube, indicating that you have produced a standing wave in the tube.
Adjust the piston position carefully until you find the point which produces the loudest
sound as well as the largest signal on the oscilloscope screen. Record this position.
Plunger
➂ Now continue moving the piston into the tube until you reach a new position where a
➃ Repeat the procedures above for as many different frequencies as your instructor directs.
standing wave is produced. Record this new position. Continue moving the piston until you
have found all of the piston positions along the tube which produce standing waves.
13
Page 18

Resonance Tube 012-03541E
Analysis
Use the data that you have recorded to sketch the wave activity along the length of your tube
with the piston in the position furthest from the speaker. How do the successive piston positions that produced a standing wave relate to this sketch? Is the apparent spacings of nodes and
antinodes consistent with the wavelength of your sound waves as calculated from λ = V/ν,
where V = speed of sound?
Table 3.1 Closed Tube Resonances
Frequency:
Piston Positions
Frequency:
Piston Positions
Frequency:
Piston Positions
Frequency:
Piston Positions
14
Page 19

012-03541E Resonance Tube
11 12 13 14
13
Experiment 4: The Speed of Sound in a Tube
EQUIPMENT NEEDED:
— PASCO Resonance Tube
— Function Generator
— Oscilloscope
Introduction
You can determine the speed of sound in a tube from a standing wave pattern. Create a standing wave, then determine the wavelength of the sound from the standing wave pattern. You can
then multiply the wavelength by the frequency to determine the speed of the wave (V = ln).
However, you can also measure the speed of sound more directly. In this experiment you'll
measure the speed of sound in the tube by timing a sound pulse as it propagates down the tube
and reflects off the end.
Procedure
➀ Set up the Resonance Tube, oscilloscope, and function generator as shown in Figure 4.1. Move
the piston near the end of the tube. Set the signal generator to approximately 10 Hz square
wave and turn the amplitude up until the speaker is clearly heard making a clicking sound. The
oscilloscope should be triggered with the output from the signal generator, or from a trigger
output of the generator. When viewed at a frequency roughly equal to the frequency of the
signal generator output, the screen should look something like the diagram in Figure 4.2.
12345
12345
SPEAKER INPUT
.1 W MAX
ON
ON
OFF
OFF
200 Mhz OSCILLISCOPE
BK PRECISION
MODEL 2120
INTENSITY
AC
DC
CH 1
TRACE NOTATION
POS
∞
FOCUS
TRIG LEVEL
-
MANUAL AUTO
CH1
EXT
CH2
VERTICAL MODE
CH 1 VOLTZ/DIV
CAL
V
mV
VAR VAR
PULL XS PULL XS
NORM
EXT
T X-Y
+
CH1
CH2
CH 2 VOLTZ/DIV
COUPLE SOURCE
AC
T X-Y
LINE
V
CH1
CH2
ALT
EXT
mV
X-POS
λ - Y
SLOPE
+
-
POSNORM
TIME/DIV
VAR SWEEP
AC
CAL
DC
CAL
CH4
CH 2
∞
CAL EXT
POWER
200V MAX
400V MAX400V MAX
Function generator
HERTZ
PI-9587B
DIGITAL FUNCTION
GENERATOR - AMPLIFIER
10 11 12 13 14
13
Piston
WAVEFORM
AMPLITUDE
MIN
EXTERNAL
INPUT GND
OUTPUTFREQUENCY
TTL
HI Ω
GND
LO Ω
MAX
RANGE
ADJUST
WA-9612
RESONANCE TUBE
Oscilloscope
Time from initial pulse until echo
Figure 4.1 Equipment Setup
Figure 4.2 Equipment Setup
➤ WARNING: You can damage the speaker by overdriving it. The sound from the speaker
should be clearly audible, but not loud. Note also that many signal generators become more
efficient and thus produce a larger output as the frequency increases, so if you increase the
frequency, you may need to reduce the amplitude.
➁ Increase the sweep speed of the oscilloscope until you are able to see more clearly the details
of the pulses along one part of the square wave. You should see a series of waves generated by
the initial ringing of the speaker caused by the sudden voltage increase of the square wave.
This will be followed shortly by a similar-looking series of waves representing the returned
sound echoing off the face of the piston at the other end of the tube. The oscilloscope trace
with the faster sweep speed should look something like the lower diagram in Figure 4.2.
Plunger
15
Page 20

Resonance Tube 012-03541E
➂ Determine how far on the screen it is from the initial pulse to the first echo. Record this in
table 4.1. Record also the sweep speed setting (the sec/cm setting of the oscilloscope) and
the distance from the speaker to the piston.
➃ Move the piston to a new position. Note that the first echo moves, too. At the new posi-
tion, record the distance from the speaker to the piston face, the distance from the initial
pulse to the echo, and the sweep speed.
➄ Continue moving the piston until you have accumulated at least five sets of data.
➅ Now remove the piston and repeat the experiment with the open tube.
➤ Now move the microphone around to the open end of the tube. Determine how long it
takes the sound wave to travel from the speaker to the microphone.
Analysis
Use the data that you have recorded to calculate the speed of sound in the closed tube.
Assuming that the speed of sound in the open tube is equal to the speed of sound in the
closed tube (a good assumption), how long does the tube appear to be for the open tube?
How does this answer compare to the actual length of the tube? Discuss the comparison
you just made.
Describe how you might set up an experiment to determine the velocity of sound in air, not
in the tube.
TABLE 4.1 Speed of Sound in a Closed Tube
Tube Distance on Sweep Speed of
Length Scope Screen Speed Sound
TABLE 4.2 Speed of Sound in an Open Tube
Tube Distance on Sweep Speed of
Length Scope Screen Speed Sound
16
Page 21

012-03541E Resonance Tube
Suggested Demonstration
EQUIPMENT NEEDED:
— PASCO Resonance Tube
— Cork Dust
— Speaker
— Function Generator
— Resonance Tube Plunger
Resonance Tube
Speaker
Introduction
Your PASCO WA-9612 Resonance Tube can be used as a Kundt's Tube with some minor
modifications. This makes a very effective demonstration for a class or for students working
in small groups.
SPEAKER INPUT
.1 W MAX
HERTZ
PI-9587B
DIGITAL FUNCTION
GENERATOR - AMPLIFIER
Function Generator
12345
Cork Dust
RANGE
ADJUST
WAVEFORM
EXTERNAL
INPUT GND
AMPLITUDE
MIN
MAX
OUTPUTFREQUENCY
TTL
HI Ω
GND
LO Ω
Procedure
➀ Sprinkle a small amount of cork dust evenly along the bottom of the resonance tube. Rotate
the tube slightly so the cork dust is positioned slightly up the side of the tube.
➁ Set the speaker at the end of the tube as shown in the diagram. Adjust the amplitude and
frequency until you obtain a standing wave in the tube. (Accompanied by a marked increase
of amplitude of the sound.) At this point, displacement antinodal areas will show rapid
movement of the cork dust, while nodal areas will show no movement.
➂ You can now adjust the frequency to other standing wave frequencies, or you can put the
plunger in one end to observe the difference in closed tube standing waves versus open tube
standing waves.
17
Page 22

Resonance Tube 012-03541E
Suggested Research T opics
The following are a few suggestions for further
experimentation with the Resonance Tube.
➀ Obtain tubes of different diameters, all made from
the same material. Investigate the relationship between tube diameter and the speed of sound in the
tube.
➁ Using the same technique as in Experiment 4, mea-
sure the speed of sound outside the tube. (This can
be a bit tricky. It is particularly important to remove any reflective surfaces that might interfere
with the measurement.) How does the speed outside
the tube compare with the speed inside the tube?
➂ Seal the tube and fill it with a gas such as C0
or O2. Determine the speed of sound in various gases.
, N2,
2
➃ With one end of the tube open, calculate the speed
of sound in the tube with air flowing through the
tube. This can be done with the flow of air going
toward or away from the speaker. The speed of
sound as it moves with and against the stream of air
leads directly to a discussion of the MichelsonMorley experiment.
➄ Use the holes in the side of the tube to investigate
the use of finger stops in musical instruments. How
does the open or closed hole effect the fundamental
frequency? Does it make a difference if the hole is
at a node or antinode of the standing wave pattern?
18
Page 23

012-03541E Resonance Tube
T eacher’s Guide
Experiment 1: Resonant Frequencies of a Tube
Notes on Procedure
➅ The fundamental frequency for the closed tube with
the piston in the very end (longest possible closed
tube) is about 95 Hz. Because it is difficult to see
the resonance at such a low frequency, you may
want to make sure that the piston is inserted to at
least the 70cm mark.
Notes on Analysis
Open tubeOpen tube
Open tube
Open tubeOpen tube
185 1.00 94 1.00
369 1.99 282 3.00
555 3.00 473 5.03
740 4.00 663 7.05
918 4.96 852 9.06
1102 5.96 1042 11.09
1271 6.87 1230 13.09
1369 7.40 1434 15.26
1676 9.06 1626 17.30
1870 10.11 1812 19.28
2056 11.11 2006 21.34
v v/vo v v/vo
Closed tubeClosed tube
Closed tube
Closed tubeClosed tube
Notes on Questions
The open-tube number series (1,2,3,4...) contains
consecutive integers. The closed-tube series
(1,3,5,7...) contains odd integers. This series is a
series of the values of n: see theory section.
There will be some data points which seem to be
resonant, but aren’t at the theoretical resonant
frequencies (Italicized points on the “open tube”
data above, for example. On the whole, however,
the data should be fairly close to theoretical.
19
Page 24

Resonance Tube 012-03541E
Experiment 2: Standing Waves in a Tube
Notes on Procedure
➀➁ If you have already done experiment 1, use the
known open-tube resonant frequencies from that
experiment.
➂ The node points near the open ends of the tube may
actually be located beyond the ends, outside of the
tube.
Notes on Analysis
➀➁ The wave activity pattern will be similar to the
diagrams in the “theory” section of the manual, except that the microphone detects pressure variation
rather than displacement variation. Because of this,
the standing wave pattern will be shifted 90° from
the pattern shown.
Displacement representation
The Theory section of the manual shows the
displacement representation for the open and closed
tubes; but the microphone will see the pressure
representation.
➂ The velocity of the sound wave inside the tube is
theoretically higher than outside the tube; but
within the limits of this experiment they will be the
same.
➃ The pressure wave reflects without inversion at the
face of the piston. It reflects with an inversion at
the open end of the tube.
Press ur e r epr es entation
Displacement representation
Press ur e r epr es entation
20
Page 25

012-03541E Resonance Tube
Experiment 3: Tube Length and Resonant Modes
Notes on Analysis
The successive piston positions correspond to
pressure antinode (displacement node) positions.
The spacing between these positions is equal to half
the wavelength of the sound.
Note
It is possible to measure the speed of sound in the
tube very accurately by a variation of this method.
Plot the length of the tube as a function of n, where
n is the number of antinodes in the standing wave
pattern (The graph shown is for the tube with both
ends closed.) The slope of this line will be equal to
λ/2, and from this you can find the velocity.
80
f(x) = 1.142500E+1*x + 2.857143E-2
70
R^2 = 9.999954E-1
60
50
40
30
Length (cm)
20
10
0
01234567
5
5
1.5 kHz
5
5
5
5
n
5
v = 342.75 m/s
Compare with the theoretical value of
331.5 + 0.607 T = 342.42 m/s. (T = 18°C)
The intercept is related to the “effective length” of
the tube, and will change with frequency.
21
Page 26

Resonance Tube 012-03541E
Experiment 4: The Speed of Sound in a Tube
Procedure
➀ We recommend that you use external triggering on
the oscilloscope. You will also have to adjust the
triggering level and holdoff in order to get a clean,
steady trace on the screen.
➁➄ Our measurements gave values of 335-347 m/s,
with the variation mostly due to difficulties in measuring the distance between echoes. The trace is not
always steady and easy to read.
Analysis
➀ v 340 m/s. For better precision, use the method
described in the teacher’s guide to experiment 3.
➁ We were able to measure this by building a corner-
cube reflector out of some scrap lexan sheets and
tape. The signal was very weak, though, and practically useless beyond 1m.
➂ The reflected sound pulse will be inverted when the
end of the tube is open; and non-inverted when
closed. This indicates—among other things—that
the speed of sound inside the tube is faster than outside the tube. (We have not been able to experimentally demonstrate this velocity difference with this
apparatus.)
22
Page 27

012-03541E Resonance Tube
T echnical Support
Feed-Back
If you have any comments about this product or this
manual please let us know. If you have any suggestions on alternate experiments or find a problem in the
manual please tell us. PASCO appreciates any customer feed-back. Your input helps us evaluate and
improve our product.
To Reach PASCO
For Technical Support call us at 1-800-772-8700 (tollfree within the U.S.) or (916) 786-3800.
email: techsupp@PASCO.com
Contacting Technical Support
Before you call the PASCO Technical Support staff it
would be helpful to prepare the following information:
• If your problem is computer/software related, note:
Title and Revision Date of software.
Type of Computer (Make, Model, Speed).
Type of external Cables/Peripherals.
• If your problem is with the PASCO apparatus, note:
Title and Model number (usually listed on the label).
Approximate age of apparatus.
A detailed description of the problem/sequence of
events. (In case you can't call PASCO right away,
you won't lose valuable data.)
If possible, have the apparatus within reach when
calling. This makes descriptions of individual parts
much easier.
• If your problem relates to the instruction manual,
note:
Part number and Revision (listed by month and year
on the front cover).
Have the manual at hand to discuss your questions.
23
Page 28

 Loading...