

Page 1
Includes
Teacher's Notes
and
Typical
Experiment Results
Instruction Manual and
Experiment Guide for
the PASCO scientific
Model WA-9611, and 9613
SONOMETER
012-03489E
5/95
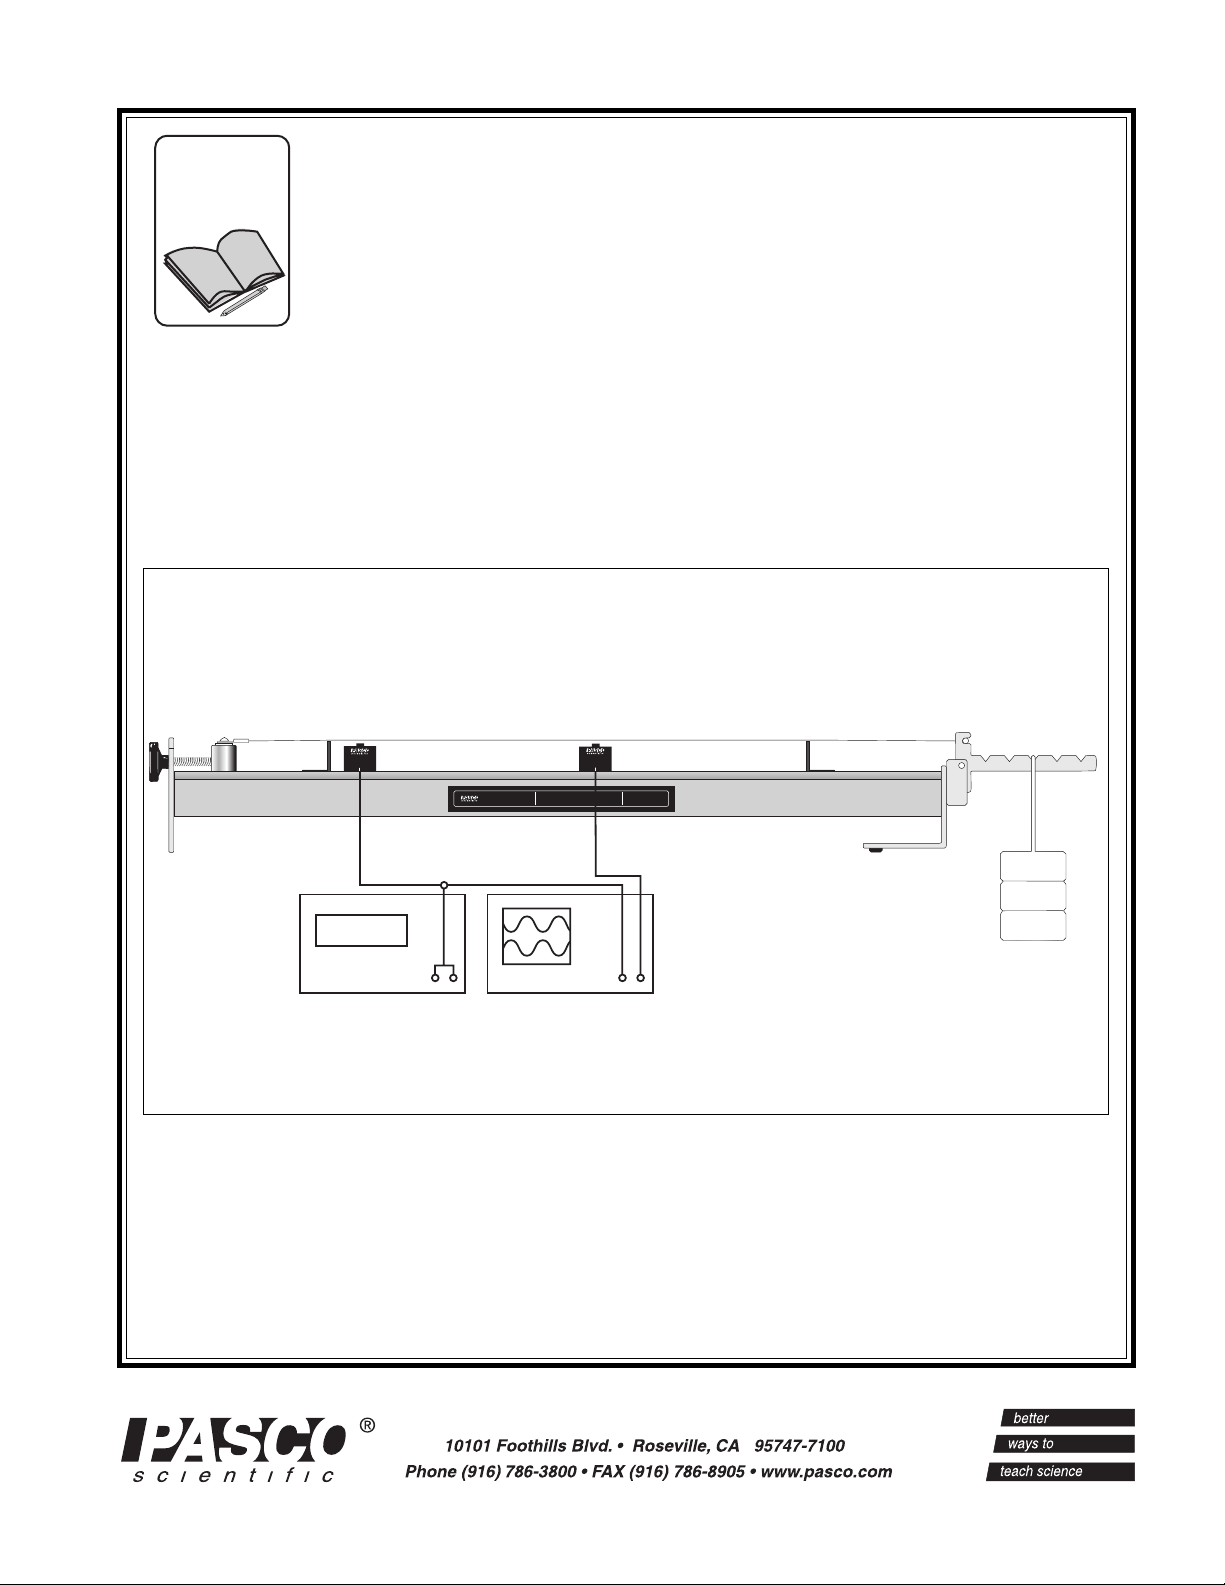
WA-9613
DRIVER
WA-9611
SONOMETER
WA-9613
DETECTOR
KEEP WEIGHTS AS NEAR TO FLOOR
AS POSSIBLE IN THE EVENT THE
SONOMETER WIRE SHOULD BREAK
CAUTION!
1.75 kg MAXIMUM
LOAD ON LEVER
100.5 Hz
© 1988 PASCO scientific $5.00
Page 2

Page 3
012-03489E Sonometer
T able of Contents
Section Page
Copyright, Warranty and Equipment Return......................................................ii
Introduction ......................................................................................................1
Equipment ........................................................................................................1
Setup and Operation..........................................................................................2
Using the Sonometer and the WA-9613 Driver/Detector Coils:
Sonometer w/WA-9613, Driver/Detector Coils ...........................................3
Sonometer and Driver/Detector w/PASCO Computer Interface ...................4
Power Amplifier w/Series 6500 Computer Interface .................................... 4
Power Amplifier w/CI-6550 or CI-6565 Computer Interface .......................4
Function Generator w/Series 6500 Computer Interface ................................ 5
Function Generator w/CI-6550 or CI-6565 Computer Interface ...................6
Replacing Sonometer Strings ............................................................................7
Theory of Waves on a Stretched String..............................................................8
Experiments:
Experiment 1: Resonance Modes of a Stretched String ........................ 11
Experiment 2: Velocity of Wave Propagation ......................................13
Suggested Research Topics ..............................................................................16
Teacher’s Guide...............................................................................................17
Technical Support ....................................................................Inside Back Cover
i
Page 4
Sonometer 012-03489E
Copyright, Warranty and Equipment Return
Please—Feel free to duplicate this manual
subject to the copyright restrictions below.
Copyright Notice
The PASCO scientific Model WA-9611 Sonometer
manual is copyrighted and all rights reserved. However,
permission is granted to non-profit educational institutions for reproduction of any part of this manual providing the reproductions are used only for their laboratories
and are not sold for profit. Reproduction under any other
circumstances, without the written consent of PASCO
scientific, is prohibited.
Limited Warranty
PASCO scientific warrants this product to be free from
defects in materials and workmanship for a period of one
year from the date of shipment to the customer. PASCO
will repair or replace, at its option, any part of the product
which is deemed to be defective in material or workmanship. This warranty does not cover damage to the product
caused by abuse or improper use. Determination of
whether a product failure is the result of a manufacturing
defect or improper use by the customer shall be made
solely by PASCO scientific. Responsibility for the return
of equipment for warranty repair belongs to the customer.
Equipment must be properly packed to prevent damage
and shipped postage or freight prepaid. (Damage caused
by improper packing of the equipment for return shipment will not be covered by the warranty.) Shipping
costs for returning the equipment, after repair, will be
paid by PASCO scientific.
Equipment Return
Should the product have to be returned to PASCO
scientific for any reason, notify PASCO scientific by
letter, phone, or fax BEFORE returning the product.
Upon notification, the return authorization and
shipping instructions will be promptly issued.
ä
NOTE: NO EQUIPMENT WILL BE
ACCEPTED FOR RETURN WITHOUT AN
AUTHORIZATION FROM PASCO.
When returning equipment for repair, the units
must be packed properly. Carriers will not accept
responsibility for damage caused by improper
packing. To be certain the unit will not be
damaged in shipment, observe the following rules:
➀ The packing carton must be strong enough for the
item shipped.
➁ Make certain there are at least two inches of
packing material between any point on the
apparatus and the inside walls of the carton.
➂ Make certain that the packing material cannot shift
in the box or become compressed, allowing the
instrument come in contact with the packing
carton.
Credits
This manual authored by: Clarence Bakken
This manual edited by: Dave Griffith
Teacher’s guide written by: Eric Ayars
Address: PASCO scientific
10101 Foothills Blvd.
Roseville, CA 95747-7100
Phone: (916) 786-3800
FAX: (916) 786-3292
email: techsupp@pasco.com
web: www.pasco.com
ii
Page 5
012-03489E Sonometer
Introduction
Introduction
The PASCO scientific Model WA-9611 Sonometer is an
enhanced version of the classic sonometer. You can perform the standard, qualitative sonometer experiments,
varying the tension, length, and linear density of the string
and observing the effects on the pitch of the plucked string.
Also, you can perform quantitative experiments, verifying
the equations for wave motion on a string by adding the
WA-9613 Driver/Detector Coils, a function generator capable of delivering 0.5 A of current, and an oscilloscope (or
a computer interface and power amplifier) where,
l = wavelength
L = length of string
Equipment
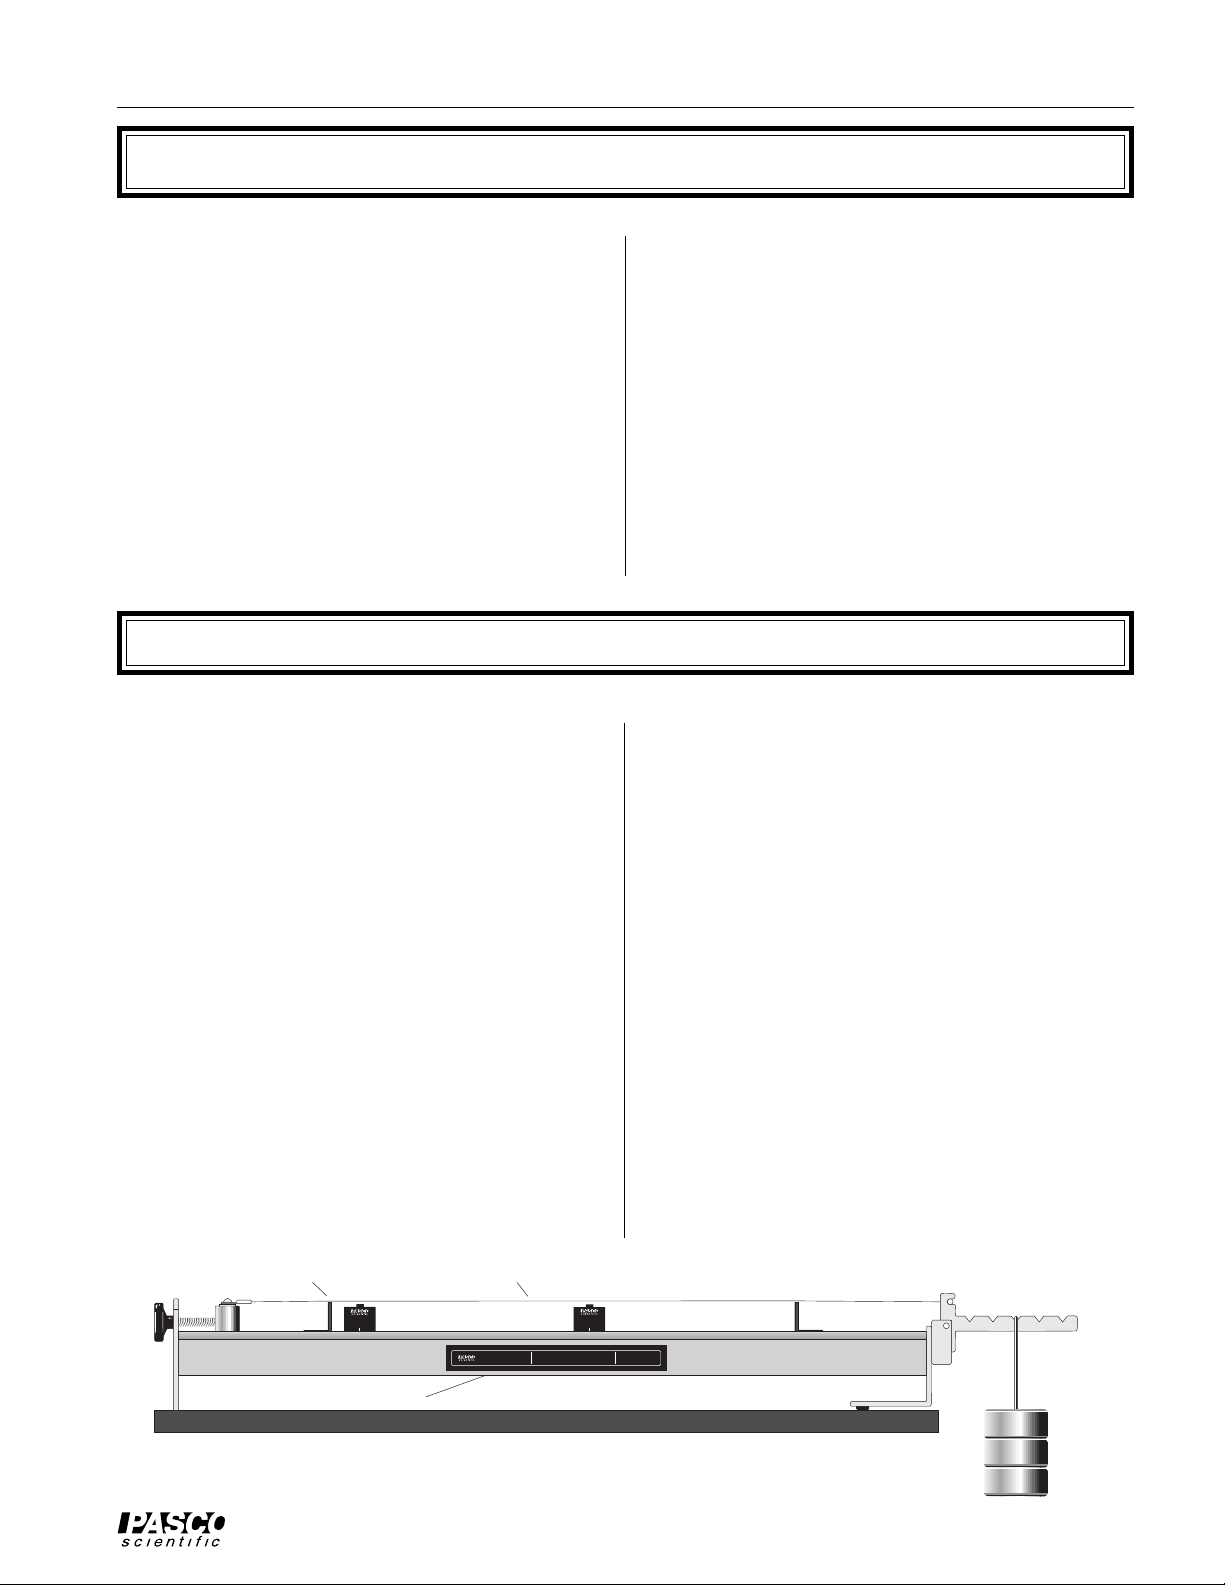
The WA-9611 Sonometer comes with the following
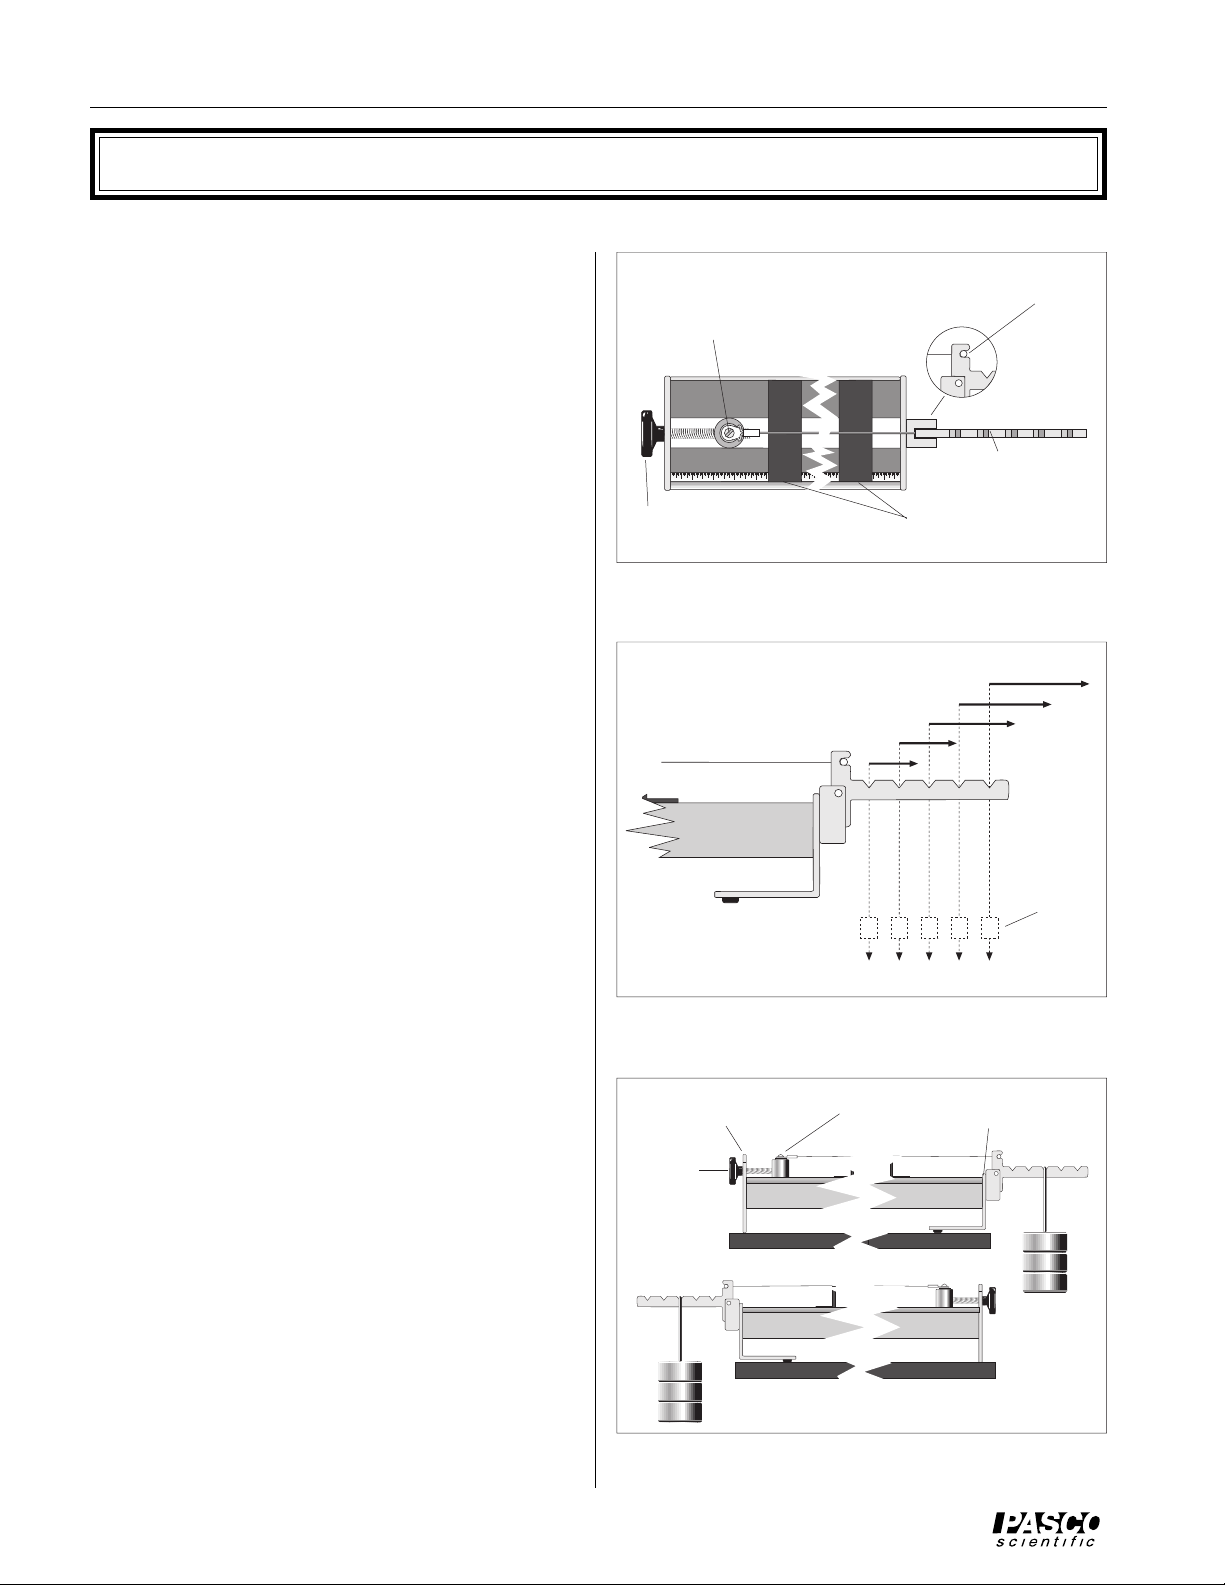
equipment (see Figure 1):
• Sonometer base with tensioning lever
• Two bridges
• 10 wires (guitar strings), 2 each of the following diameters (linear densities):
— 0.010" (0.39 gm/m)
— 0.014" (0.78 gm/m)
— 0.017" (1.12 gm/m)
— 0.020" (1.50 gm/m)
— 0.022" (1.84 gm/m)
Additional Equipment
To perform qualitative experiments, you will also need a
mass hanger and no more than 1.75 kg of mass to hang
from the tensioning lever.
Bridge
WA-9613
DRIVER
String
WA-9611
SONOMETER
WA-9613
DETECTOR
KEEP WEIGHTS AS NEAR TO FLOOR
AS POSSIBLE IN THE EVENT THE
SONOMETER WIRE SHOULD BREAK
n = number of antinodes
V = velocity of wave propagation
T = string tension
m = linear density of string
n = frequency of wave
The driver and detector coil can be placed anywhere along
the string. The driver coil drives string vibrations at any
frequency your function generator (or computer-compatible power amplifier) will produce. The detector coil allows
you to view the vibration of the string on your oscilloscope
or computer interface. With a dual trace oscilloscope or a
computer interface, you can examine phase differences between the driving frequency and the string vibrations.
Recommended Equipment
If you wish to accurately measure the frequency and
wavelength of the string vibrations, you will also need:
• WA-9613 Driver/Detector coils
• CI-6550 or CI-6565 Computer Interface and a
Power Amplifier (CI-6552)
OR
• Series 6500 Computer Interface, CI-6508 Input
Adapter Box, and a function generator capable of
producing 0.5 A
OR
• dual trace oscilloscope and a function generator
capable of producing 0.5 A
Optional Equipment (for use with function
generator)
• banana plug patch cords and BNC-to-banana
adapter (for connecting the function generator to
the BNC connector on an oscilloscope)
Tensioning
lever
CAUTION!
1.75 kg MAXIMUM
LOAD ON LEVER
Sonometer base
Figure 1 The Sonometer and Suggested Accessories
1
Page 6
Sonometer 012-03489E
Setup and Operation
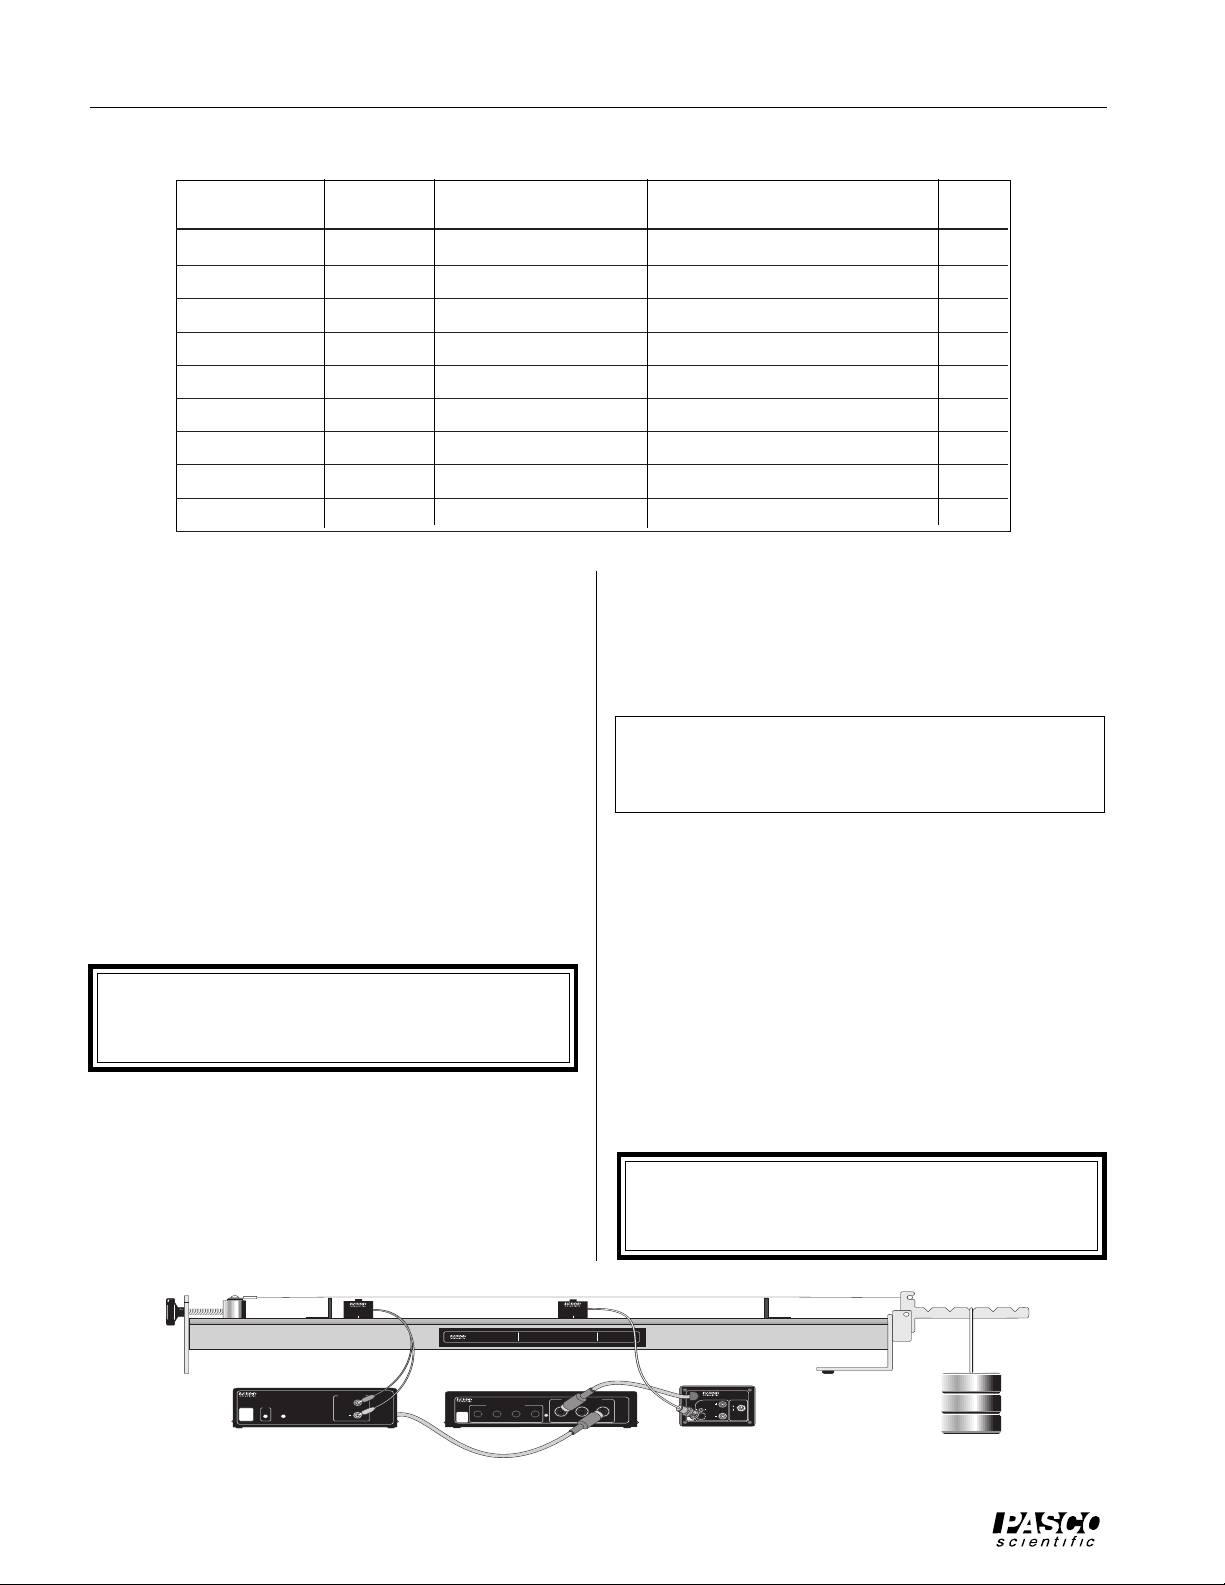
To setup the sonometer (see Figure 2):
➀ Choose one of the ten strings and place the brass
string retainer into the slot on the tensioning lever.
➁ Loosen the string adjustment screw and place the
crimped lug that is attached to the other end of the
string over the screw head, as shown.
Crimped lug
Brass string retainer
➂ Tighten the string adjustment screw until the
tensioning lever hangs level.
➃ Place the bridges in any locations you wish, to deter-
mine the length of the string.
➄ Hang a mass (approximately 1 kg) from the tensioning
lever to produce the desired tension, then adjust the
string adjustment screw as needed so that the
tensioning lever is level. See Figure 3. (The lever must
be level to accurately determine the string tension
from the hanging mass.)
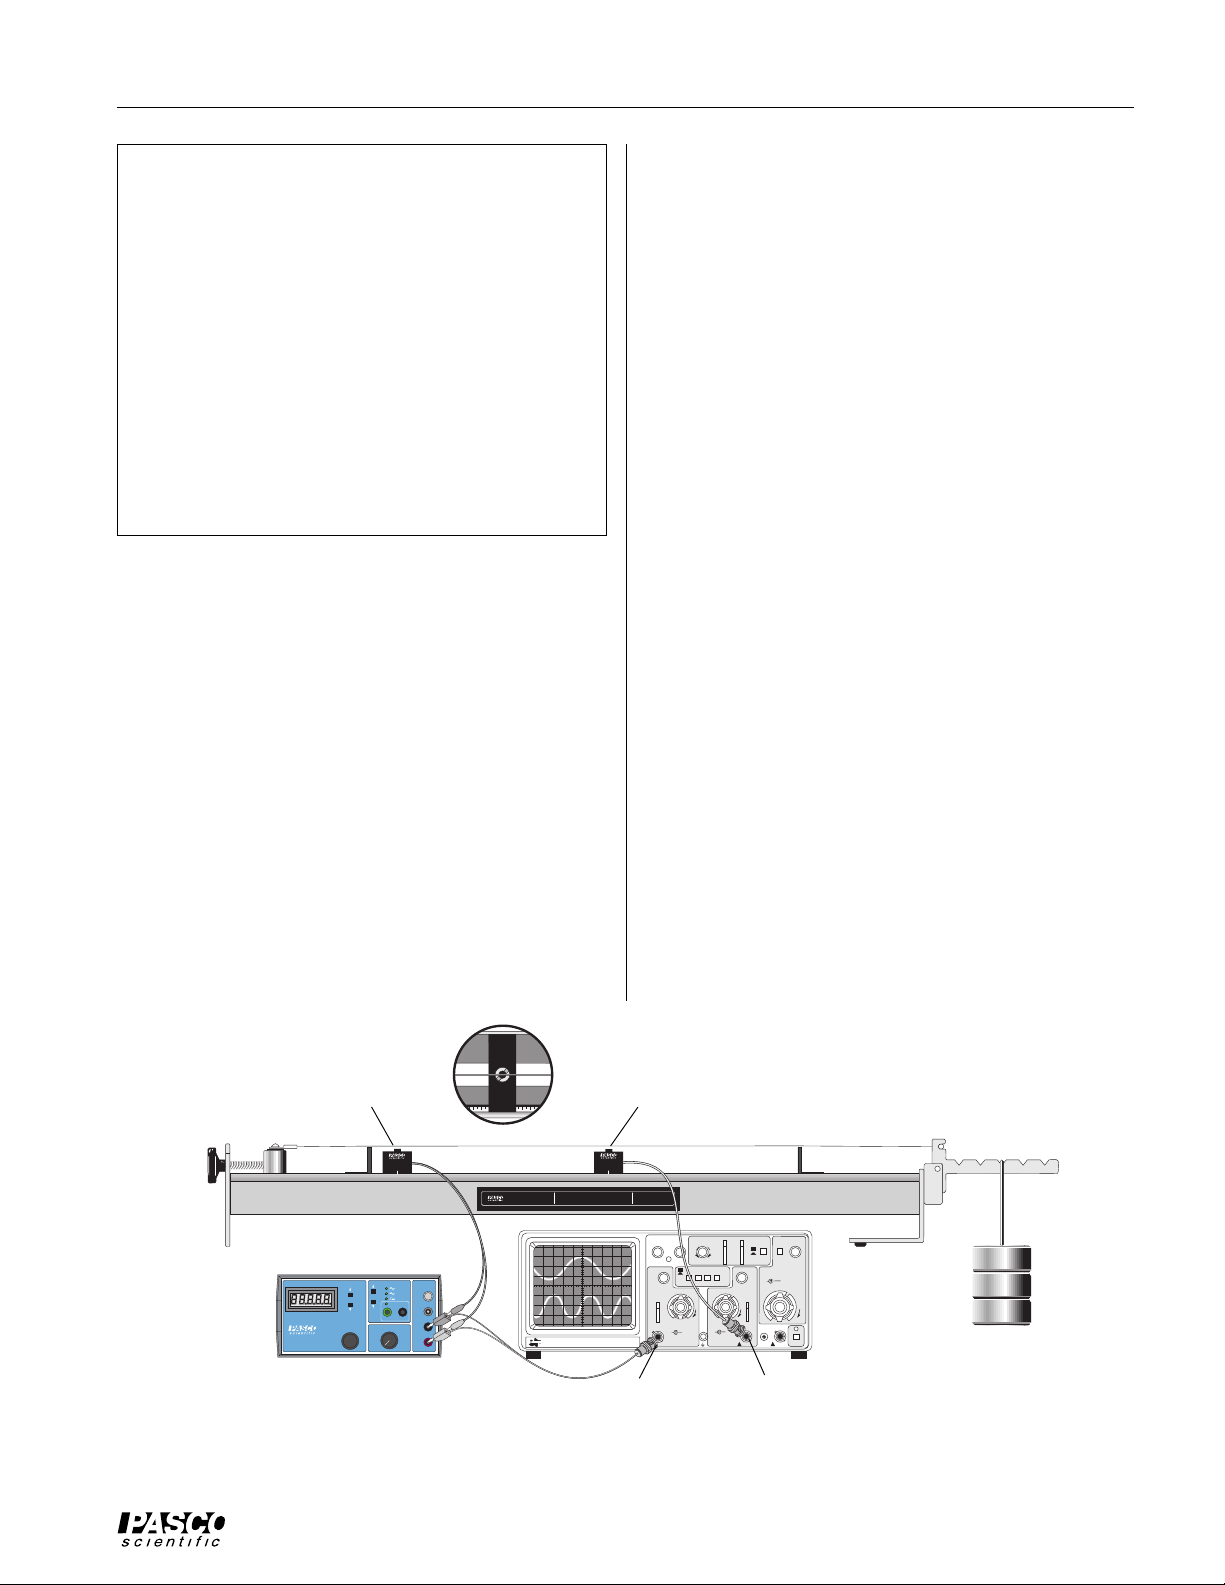
String tension is determined as shown in Figure 3. If
you hang a mass “M” from slot one of the lever, the
tension of the string is equal to Mg, where g is the
gravitational constant (9.8 m/s
2
). If you hang the mass
from slot two, the tension equals 2Mg; if you hang it
from slot three, the tension is 3 Mg, etc.
➅ You can now:
- Vary the tension of the string by hanging the mass
from different slots in the tensioning lever. (Always
adjust the string adjustment screw so the lever remains
level.)
String adjustment screw
Figure 2 Sonometer Setup
String tension (T)
Slot 1 2 3 4 5
Figure 3 Setting the Tension
Tensioning lever
Bridges
5Mg
4Mg
3Mg
2Mg
1Mg
Hanging
Mass
(mass = M)
(weight = Mg)
- Vary the length of the string by adjusting the distance
between the bridges.
- Vary the linear density of the string by changing
strings.
- Pluck the string to observe how each of these variables effects the resonant frequency.
2
End plate
String
Adjustment
screw
Aluminum Cylinder
Figure 4 Reversing the End Plates
End plate
Page 7
012-03489E Sonometer
➤NOTE: At some lab stations, you may want the
tensioning lever to hang over the left end of the
table instead of the right (see Figure 4). In this case,
you can switch the end plates so that, when performing the experiment, the metric scale will still
be right side up. To switch the endplates:
➀ Loosen the string adjustment screw and remove
the string.
➁ Unscrew the two screws that hold each end plate
onto the sonometer and remove the end plates.
➂ Slide the aluminum cylinder out of the slot.
➃ Slide the cylinder into the slot on the other end
of the sonometer, then switch the end plates.
Using the Sonometer and the WA-9613
Driver/Detector Coils:
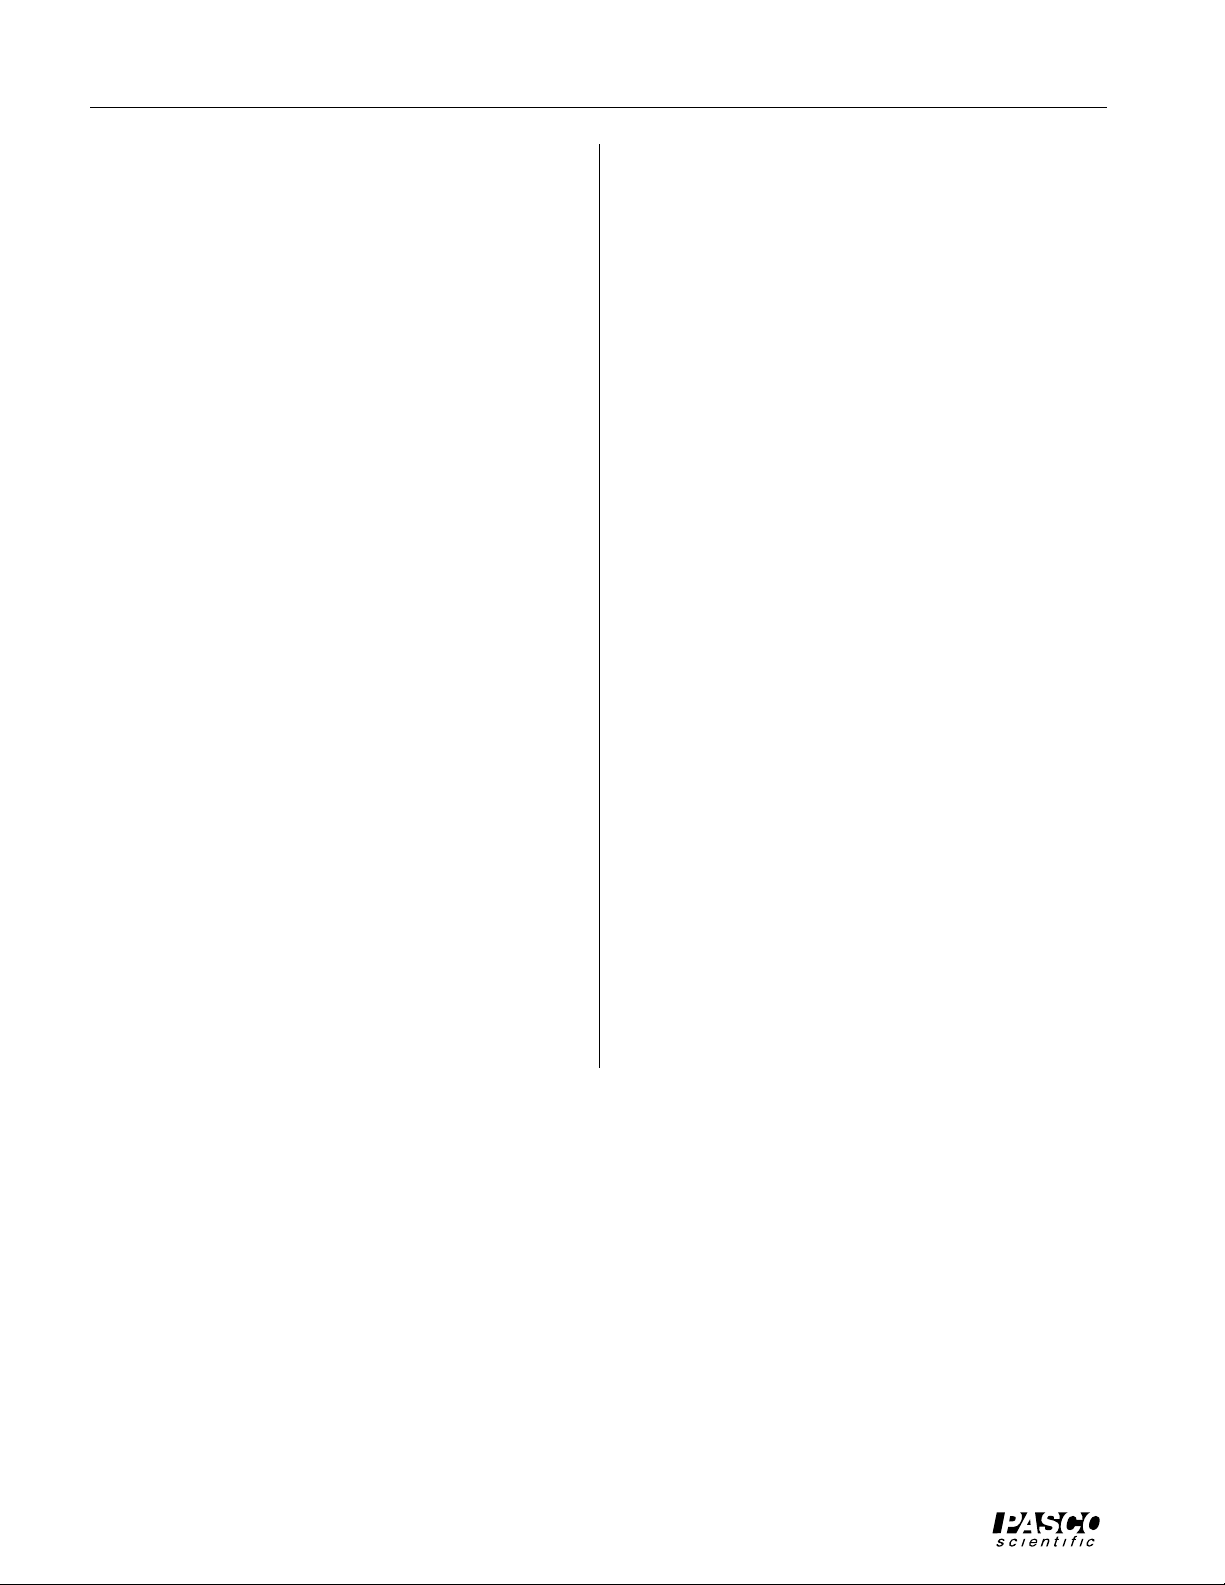
Sonometer and Driver/Detector Coils with a function
generator and oscilloscope:
➀ Connect the Driver and Detector Coils to the function
generator and oscilloscope as shown in the diagram.
Connect the driver coil directly to the output of the
PASCO PI-9587B Digital Function Generator. Connect the detector coil directly to channel two of an oscilloscope that has a BNC connector. You can use banana plug patch cords and a BNC-to-banana plug
adapter to connect the output of the function generator
to channel one of an oscilloscope that has a BNC connector. (If you are using a single trace oscilloscope,
connect only the detector coil to the oscilloscope.)
➁ Position the driver coil approximately 5 cm from one
of the bridges.
Depending on the wave pattern you are trying to pro-
duce, you might want to place the driver at some other
position. It will drive the string best if it is placed at an
antinode of the wave pattern. However, if you place it
near one of the bridges, it will work reasonably well
for most frequencies.
➂ Position the detector midway between the bridges ini-
tially, though for some patterns you may want to reposition it to best pick up the signal. As with the driver
coil, it works best when positioned near an antinode of
the wave pattern.
➃ Set the gain on channel-one of the oscilloscope to 5
mV/cm. Adjust the oscilloscope so it triggers on the
signal from the function generator.
➄ Set the function generator to produce a sine wave. Set
the frequency to a value between 100 and 200 Hz. Adjust the amplitude to about 5 V (approximately half of
maximum). Slowly vary the frequency of the function
generator output. When you reach a resonant frequency, you should see the motion of the string and
the sound produced by the vibrating string should be a
maximum. The wave pattern shown on the oscilloscope should become a clean sine wave. If you can’t
see or hear the string, raise the amplitude of the function generator output slightly and try again.
Driver coil Detector coil
WA-9613
DRIVER
FREQUEN
CY
HE
RTZ
PI-9587B
DIGITAL FUNCTION
GENERATOR AMPLIFIER
WAVEFO
RA
NGE
RM
EXTERN
AL
INPUTG
ND
AMPLITU
ADJU
ST
DE
M
MI
AX
N
Function generator
WA-9611
SONOMETER
OUTP
UT
TT
L
HI
Ω
G
ND
LO
Ω
WA-9613
DETECTOR
KEEP WEIGHTS AS NEAR TO FLOOR
AS POSSIBLE IN THE EVENT THE
SONOMETER WIRE SHOULD BREAK
200 Mhz OSCILLISCOPE
BK PRECISION
Channel 1 (trigger) Channel 2
Figure 5 Using the Driver and Detector Coils
CAUTION!
1.75 kg MAXIMUM
LOAD ON LEVER
INTENSITY
TRACE NOTATION
POS
AC
DC
CH 1
∞
400V
MODEL
MAX
2120
Oscilloscope
3
FOCUS
TRIG LEVEL
-
MANUAL AUTO
NORM
CH1
EXT
EXT
CH2
VERTICAL MODE
CH 1
VOLTZ/DIV
CAL
V
mV
VAR VAR
PULL XS PULL XS
+
T XY
T XY
LINE
CH1
CH2
CH 2
VOLTZ/DIV
V
COUPLE SOURCE
AC
mV
CH1
X-POS
λ - Y
SLOPE
+
CH2
-
ALT
EXT
POSNORM
TIME/DI
V
VAR SWEEP
AC
CAL
DC
CAL
CH4
CAL EXT
CH 2
∞
200V
POWER
400V
MAX
MAX
Page 8
Sonometer 012-03489E
Table 1
Computer Interface Device to drive coil Software FFT?
Apple II AI-6501 Power Amplifier Power Amplifier (Apple II) no
Apple II AI-6501 function generator Data Monitor (Apple II) no
DOS - PC CI-6500 Power Amplifier Power Amplifier (MS-DOS) no
DOS - PC CI-6500 function generator Data Monitor (MS-DOS) yes
Macintosh CI-6550 Power Amplifier Science Workshop (Mac) yes
Macintosh CI-6550 function generator Science Workshop (Mac) yes
Windows - PC CI-6565 Power Amplifier Science Workshop (Windows) yes
Windows - PC CI-6565 function generator Science Workshop (Windows) yes
Windows - PC CI-6500 function generator Data Monitor (Windows) yes
Sonometer and Driver/Detector Coils with a PASCO
Computer Interface
There are several ways to use a PASCO Computer Interface with the sonometer. The method you use depends on
the kind of computer, the interface (e.g., CI-6500, CI6550, etc.), the device to control the coil, and whether you
wish to do frequency analysis (Fast Fourier Transform or
FFT) of the standing waves. See Table 1.
Using the Power Amplifier with a Series 6500
Computer Interface:
➀ Connect the Power Amplifier DIN plug to channel C
of the interface. Connect the Sonometer Driver Coil to
the output of the Power Amplifier.
➤ CAUTION: Do not turn on the power amplifier
until you have set the output amplitude from within
the program.
➁ Connect the BNC plug on the Sonometer Detector
Coil to the BNC jack on the CI-6508 Input Adapter
Box, and the DIN plug on the Adapter Box to channel
A of the interface. Turn the amplification select switch
on the CI-6508 to 100X. (See Figure 5.1.)
➂ Start the Power Amplifier program and set the output
to a 3-5 V sine wave; then turn on the power amplifier. Show channel A and channel C on the screen, so
you can see both the driving force and the resultant
motion of the wire.
➤ NOTE: The Power Amplifier program does not
have a frequency analysis feature (Fast Fourier
Transform or FFT).
Using the Power Amplifier with a CI-6550 or CI-6565
Computer Interface:
The Science Workshop program that comes with the CI-
6550 or CI-6565 interface allows you to do frequency
analysis (Fast Fourier Transform, or FFT) of the standing
waves. This can be used for an in-depth analysis of the
harmonics present in a standing wave, analysis of noise,
or observation of multiple simultaneous resonances.
➀ Connect the Power Amplifier DIN plug to channel C
of the interface. Connect the Sonometer Driver Coil to
the output of the Power Amplifier.
➤ CAUTION: Do not turn on the power amplifier
until you have set the output amplitude from within
the program.
CI-6502
POWER AMPLIFIER
FOR USE WITH PASCO SERIES 6500 INTERFACES
ON
CAUTION!
PASCO
SERIES
WHEN LIGHT IS ON
WAVEFORM IS DISTORTED.
6500
INTERFACE
DECREASE AMPLITUDE!
SYSTEM
Power Amplifier
KEEP WEIGHTS AS NEAR TO FLOOR
AS POSSIBLE IN THE EVENT THE
SONOMETER WIRE SHOULD BREAK
Interface
A ▲
ON
GAIN = 1,10,100
ISOLATED
WA-9613
DETECTOR
ANALOG CHANNELS
B ■ C ●
=
GAIN
1
ISOLATED
GAIN = 1
REF TO GND
CAUTION!
1.75 kg MAXIMUM
LOAD ON LEVER
ANALOG INPUT
PASCO
SERIES
6500
INTERFACE
SYSTEM
INPUT ADAPTOR
FOR USE WITH PASCO SERIES 6500 INTERFACES
(±10V MAX)
Model CI-6508
GAIN SELECT
X 100
X 10
X 1
NOTE: SWITCH
FUNTIONS ONLY WHEN
ADAPTOR IS
CONNECTED TO INPUT
MARKED ▲ ON THE
SIGNAL INTERFACE
SIGNAL OUTPUT
0 to ±10 V
1 A MAX
WA-9613
DRIVER
WA-9611
SONOMETER
CI-6510
SIGNAL INTERFACE
+
FOR USE WITH PASCO SERIES 6500 SENSORS
DIGITAL CHANNELS
1234
PASCO
SERIES
6500
INTERFACE
SYSTEM
Adapter Box
Figure 5.1 Using the Power Amplifier and Series 6500 Interface
4
Page 9

012-03489E Sonometer
➁ Connect the BNC plug on the Sonometer Detector
Coil to the BNC adapter that is included with the
Driver/Detector Coils. Connect the banana plugs of a
CI-6503 Voltage Sensor to the BNC adapter. Connect
the DIN plug of the Voltage Sensor to channel A of
the interface.
➂ Start the Science Workshop program. In the Experi-
ment Setup window, click-and-drag the analog sensor
plug icon to channel C. Select “Power Amplifier”
from the list of sensors. Set the Signal Generator output to a 3-5 V sine wave. Click on “Auto ON/OFF”
(so the output signal will begin when you start your
measurements) and switch on the power amplifier.
➄ In the Scope, use the input menu for the second chan-
nel to select “Analog A” so the Scope will show both
the driving signal and the detected motion of the wire.
Set the sensitivity for the Analog A channel to about
0.005 v/div.
For frequency analysis, select “New FFT” from the Display
menu. Click on “MON” in the Setup window (or commandM on the keyboard) when you are ready to begin.
➃ In the Experiment Setup window, click-and-drag the
analog sensor plug icon to channel A. Select “Sound
Sensor” from the list of sensors. Click-and-drag a
Scope display to the Output channel icon in the Setup
window.
WA-9613
DRIVER
WA-9611
SONOMETER
WAVEFO
FREQUEN
RA
NGE
CY
HE
RTZ
ADJU
PI-9587B
DIGITAL FUNCTION
GENERATOR AMPLIFIER
ST
PI-4587C Function Generator
OUTP
RM
UT
TT
L
EXTERN
AL
HI
Ω
INPUTG
ND
G
AMPLITU
ND
DE
LO
Ω
M
MI
AX
N
CI-6510
FOR USE WITH PASCO SERIES 6500 SENSORS
DIGITAL CHANNELS
1234
PASCO
SERIES
6500
INTERFACE
SYSTEM
SIGNAL INTERFACE
Figure 5.2 Using a Function Generator and the Series 6500
WA-9613
DETECTOR
KEEP WEIGHTS AS NEAR TO FLOOR
AS POSSIBLE IN THE EVENT THE
SONOMETER WIRE SHOULD BREAK
CI-6500
A ▲
ON
GAIN = 1,10,100
ISOLATED
Using a Function Generator with the Series 6500
Computer Interface:
The MS-DOS and Windows™ versions of the Data
Monitor program allow you to do frequency analysis
(Fast Fourier Transform or FFT) of the standing waves.
This can be used for an in-depth analysis of the harmonics present in a standing wave, analysis of noise, or observation of multiple simultaneous resonances.
➀ Connect the BNC plug on the Sonometer Detector
Coil to the BNC jack on the CI-6508 Input Adapter
Box, and the DIN plug on the Adapter Box to channel
A of the Series-6500. Turn the amplification select
switch on the CI-6508 to 100X.
➁ If you have a CI-6503 Voltage Sensor, use it to link
the function generator to channel B of the CI-6500
interface. (This step is optional; it allows you to use
the function generator for triggering, with slightly improved results.) See Figure 5.2.
CAUTION!
1.75 kg MAXIMUM
LOAD ON LEVER
Model CI-6508
INPUT ADAPTOR
ANALOG CHANNELS
B ■ C ●
=
GAIN
1
ISOLATED
GAIN = 1
REF TO GND
FOR USE WITH PASCO SERIES 6500 INTERFACES
ANALOG INPUT
(±10V MAX)
PASCO
SERIES
6500
INTERFACE
SYSTEM
CI-6508
GAIN SELECT
X 100
X 10
X 1
NOTE: SWITCH
FUNTIONS ONLY WHEN
ADAPTOR IS
CONNECTED TO INPUT
MARKED ▲ ON THE
SIGNAL INTERFACE
5
Page 10
Sonometer 012-03489E
➂ Set the function generator to produce a sine wave. Set
the frequency to a value between 100 and 200 Hz. Adjust the amplitude to about 5 V (approximately half of
maximum). Slowly vary the frequency of the function
generator output. When you reach a resonant frequency,
you should see the motion of the string and the sound
produced by the vibrating string should be a maximum.
For the Data Monitor (MS-DOS) Program:
Start the program. Select “Oscilloscope” from the Main
Menu. Set triggering to automatic on channel B. Show
channels A and B on the screen, and find the resonances
you are interested in. If you wish, turn on the frequency
analysis option (FFT) and observe the frequencies that are
contributing to the standing wave.
For the Data Monitor (Windows™) Program:
Start the program. Choose “Select Channels” from the
Experiment menu and turn off channel C. Select “Replace
Window” from the Window menu, and change the Plotter/Graph window to an Oscilloscope window. Repeat the
process to change the Data Table window to the FFT window. Click on “Trigger” to set the triggering for channel B.
Using a Function Generator with a CI-6550 or CI6565 Computer Interface:
The Science Workshop program that comes with the CI-
6550 or CI-6565 interface allows you to do frequency
analysis (Fast Fourier Transform, or FFT) of the standing
waves. This can be used for an in-depth analysis of the
harmonics present in a standing wave, analysis of noise,
or observation of multiple simultaneous resonances.
➀ Connect the BNC plug on the Sonometer Detector
Coil to the BNC adapter that is included with the
Driver/Detector Coils. Connect the banana plugs of a
CI-6503 Voltage Sensor to the BNC adapter. Connect
the DIN plug of the Voltage Sensor to channel A of
the interface.
If you have another CI-6503 Voltage Sensor, use it to
link the function generator to channel B of the computer interface. (This step is optional; it allows you to
use the function generator for triggering, with slightly
improved results.)
➁ Start the Science Workshop program. In the Experi-
ment Setup window, click-and-drag the analog sensor
plug icon to channel A. Select “Sound Sensor” from
the list of sensors. If you have connected a Voltage
Sensor from the function generator to channel B,
click-and-drag the analog sensor plug icon to channel
B and select “Voltage Sensor” from the list of sensors.
➂ To view the data, click-and-drag a Scope display to
the Sound Sensor icon. (If you have connected a Voltage Sensor from the function generator to channel B,
use the input menu of the first channel on the Scope to
switch the input to “Analog B”. Use the input menu of
the second channel on the Scope to select “Analog A”.
This will allow you to use the function generator for
triggering.) Set the sensitivity for the Analog A channel to about 0.005 v/div. Click on “MON” to begin
measuring data.
➃ Set the function generator to produce a sine wave. Set
the frequency to a value between 100 and 200 Hz. Adjust the amplitude to about 5 V (approximately half of
maximum). Slowly vary the frequency of the function
generator output. When you reach a resonant frequency, you should see the motion of the string and
the sound produced by the vibrating string should be a
maximum.
6
Page 11

012-03489E Sonometer
➤NOTES:
➀ The frequency observed on the wire may not be
the frequency of the driver. Usually it is twice the
driver frequency, since the driver electromagnet
exerts a force on the wire twice during each cycle.
It is theoretically possible for the wire to form
standing waves at the driver frequency, and at any
even integer multiple of the driver frequency; although the highest multiple observed on this equipment so far has been six.
➁ If the detector is placed too close to the driver, it
will pick up some interference. You can check for
this interference by observing the waveform from
the detector on an oscilloscope; when they are too
close, the trace will change shape. For best results,
keep the detector at least 10 cm from the driver.
➂ You will occasionally see higher and lower fre-
quencies superimposed on the primary waveform. It
is possible for multiple standing waves to form. For
example, the wire may vibrate at the driver frequency
and twice the driver frequency at the same time, thus
causing two sets of “nodes” (see figure below).
At the points where only one wave has a node, instead of complete extinction you will see the waveform change from a combined wave to a single
wave of the lower frequency. Complete extinction
will occur only at the nodal points for both waves.
This does somewhat complicate things; if you wish
to avoid this problem, you may do so by using
higher frequencies whenever possible. (Since
higher frequencies damp faster, the doubled-frequency standing wave will not have a significant
amplitude—compared to the normal wave—at high
frequencies.) A full analysis of this effect would
make an excellent experiment for sophomore- or
junior-level physics or engineering students.
Replacing Sonometer Strings
You can use standard steel or electric guitar strings to
replace lost or broken strings. However, you will need to
attach a spade lug to the end of the wire to mount it on the
Sonometer. To ensure that the connection between the
wire and the lug is secure, wrap the wire around the spade
lug, then crimp and/or solder the wire into the lug
(see Figure 7).
Nodes for higher frequency, but not lower.
Nodes for both frequencies.
Wrap wire around lug, then
crimp and/or solder.
Standard steel or
Spade lug
Figure 7 Adapting Guitar Strings for the
Sonometer
electric guitar string
7
Page 12

Sonometer 012-03489E
Theory of Waves on a Stretched String
Standing Waves
A simple sine wave traveling along a taut string can be
described by the equation y1 = ym sin 2π (x/λ - t/n). If the
string is fixed at one end, the wave will be reflected back
when it strikes that end. The reflected wave will then interfere with the original wave. The reflected wave can be
described by the equation y2 = ym sin 2π (x/λ + t/n). Assuming the amplitudes of these waves are small enough
so that the elastic limit of the string is not exceeded, the
resultant waveform will be just the sum of the two waves:
y = y
+ y2 = ym sin 2π (x/λ - t/λ) + ym sin 2π (x/λ + t/λ).
1
Using the trigonometric identity:
sin A + sin B = 2 sin1/2(A + B) cos1/2(B - A),
this equation becomes:
y = 2y
This equation has some interesting characteristics. At a
fixed time, t
, the shape of the string is a sine wave with a
0
maximum amplitude of 2ym cos (2πt0/λ). At a fixed position on the string, x0, the string is undergoing simple harmonic motion, with an amplitude of 2ym sin (2πx0/λ).
Therefore, at points of the string where x0 = l/4, 3l/4, 5l/4,
7l/4, etc., the amplitude of the oscillations will be a maximum. At points of the string where x0 = l/2, l, 3l/2, 2l,
etc., the amplitude of the oscillations will be zero.
This waveform is called a standing wave because there is
no propagation of the waveform along the string. A time
exposure of the standing wave would show a pattern
something like the one in Figure 8. This pattern is called
the envelope of the standing wave. Each point of the
string oscillates up and down with its amplitude determined by the envelope. The points of maximum amplitude are called antinodes. The points of zero amplitude
are called nodes.
Antinode
Node
Figure 8 The Envelope of a Standing Wave Pattern
sin (2πx/λ) cos (2πt/λ).
m
Antinode
Node
Node
Antinode
Node
Antinode
Node
Resonance
The analysis above assumes that the standing wave is
formed by the superposition of an original wave and one
reflected wave. In fact, if the string is fixed at both ends,
each wave will be reflected every time it reaches either
end of the string. In general, the multiply reflected waves
will not all be in phase, and the amplitude of the wave
pattern will be small. However, at certain frequencies of
oscillation, all the reflected waves are in phase, resulting
in a very high amplitude standing wave. These frequencies are called resonant frequencies.
In Experiment 1, the relationship between the length of
the string and the frequencies at which resonance occurs
is investigated. It is shown that the conditions for resonance are more easily understood in terms of the wavelength of the wave pattern, rather than in terms of the frequency. In general, resonance occurs when the wavelength (λ) satisfies the condition:
λ = 2L/n; n = 1, 2, 3, 4,…
Another way of stating this same relationship is to say
that the length of the string is equal to an integral number
of half wavelengths. This means that the standing wave is
such that a node of the wave pattern exists naturally at
each fixed end of the string.
Velocity of Wave Propagation
Assuming a perfectly flexible, perfectly elastic string, the
velocity of wave propagation (V) on a stretched string
depends on two variables: the mass per unit length or linear density of the string (m) and the tension of the string
(T). The relationship is given by the equation:
V =
Without going into the derivation of this equation, its basic form can be appreciated. The equation is analogous to
Newton’s Second law, providing a relationship between a
measure of force, a measure of inertia, and a quantity of
motion. With this analogy in mind, it makes sense that the
velocity should depend on the tension and linear density
of the string. That the form of the two equations is not exactly the same is to be expected. The motion of the string is
considerably different than the motion of a simple rigid
body acted on by a single force. (It could be asked whether
velocity, rather than acceleration, is the right measure of
motion to focus on. Since the waves on the string do not
accelerate, this is at least a reasonable assumption.)
T
µ
8
Page 13

012-03489E Sonometer
If the analogy with Newton’s Law is accepted, and it is
assumed that the wave velocity depends only on tension
and linear density, dimensional analysis shows that the
form of the equation must be as it is. There is no other
way to combine tension (with units of MLT -2) with linear
density (ML-1) to get velocity (LT -1).
Of course, the equation must be verified experimentally.
This is done in Experiment 2, in which the linear density
of the string is varied by using different strings. The tension is varied using hanging weights on a lever arm. The
wavelength is then measured by adjusting the frequency
until a resonance pattern develops. The velocity can then
be calculated using the relationship
V = λν, and the effects of tension and linear density on
velocity can be determined.
Experiments
The two experiments are:
• Resonance Modes of a Stretched String
• Velocity of Wave Propagation
Both can be done with a function generator and dual-trace
oscilloscope OR with a computer interface (such as the
CI-6550) and power amplifier.
9
Page 14

Sonometer 012-03489E
Notes:
10
Page 15

012-03489E Sonometer
Experiment 1: Resonance Modes of a Stretched String
EQUIPMENT NEEDED:
– WA-9611 Sonometer – Mass and mass hanger
– WA-9613 Driver/Detector Coils – Dual trace oscilloscope
– Function generator capable of delivering 0.5 amp
Procedure
➀ Set up the Sonometer as shown in Figure 1.1.
Start with the bridges 60 cm apart. Use any of the included strings and hang a mass of approximately 1 kg from the tensioning lever. Adjust the string adjustment knob so that the tensioning
lever is horizontal. Position the driver coil approximately 5 cm from one of the bridges and position the detector near the center of the wire. Record the length, tension (mg), and linear density
of the string in Table 1.1.
String
adjustment
knob
FREQUEN
CY
HE
RTZ
PI-9587B
DIGITAL FUNCTION
GENERATOR AMPLIFIER
Frequency generator
Driver coil
RA
NGE
ADJU
ST
Detector coil
60 cm
KEEP WEIGHTS AS NEAR TO FLOOR
AS POSSIBLE IN THE EVENT THE
SONOMETER WIRE SHOULD BREAK
BK PRECISION
WA-9613
DETECTOR
MODEL
200 Mhz OSCILLISCOPE
2120
Oscilloscope
CAUTION!
1.75 kg MAXIMUM
LOAD ON LEVER
INTENSITY FOCUS
TRACE NOTATI ON
AC
DC
CH 1
MANUAL AUTO
POS POSNORM
CH 1
VOLTZ/DIV
V
∞
400V
PULL XS PULL XS
MAX
COUPLE SOURCE
AC CH1
TRIG LEVEL
T X-
-++Y
T XY
LINE
CH1
NORM
CH1
EXT
CH2
EXT
CH2
VERTICAL MODE
CH 2
VOLTZ/DIV
CAL
mV
VAR VAR
X-POS
SLOPE - Y
CH2
ALT
EXT
TIME/DI
V
VAR SWEEP
AC
CAL
mVV
CAL
DC
∞
CH 2
CAL EXT CH4
200V
400V
MAX
MAX
POWER
Channel 2 (detector coil)
Channel 1 (driver coil)
WA-9613
DRIVER
WA-9611
SONOMETER
OUTP
WAVEFO
UT
RM
TT
L
HI
EXTERN
INPUTG
Ω
ND
AL
G
ND
AMPLITU
DE
LO
Ω
MI
M
N
AX
Figure 1.1 Equipment Setup
➁ Set the signal generator to produce a sine wave and set the gain of the oscilloscope to approxi-
mately 5 mV/cm.
➂ Slowly increase the frequency of the signal to the driver coil, starting at approximately 25 Hz.
Listen for an increase in the volume of the sound from the sonometer and/or an increase in the size
of the detector signal on the oscilloscope screen. Frequencies that result in maximum string vibration are resonant frequencies. Determine the lowest frequency at which resonance occurs. This is
resonance in the first, or fundamental, mode. Measure this frequency and record it in Table 1.1.
Tensioning
lever
1 kg
➃ Start with the detector as close as you can get it to one of the bridges. Watch the oscilloscope as
you slide the detector slowly along the string. Locate and record the locations of each node and
antinode. Record your results in Table 1.1.
➄ Continue increasing the frequency to find successive resonant frequencies (at least five or six).
Record the resonance frequency for each mode, and the locations of nodes and antinodes in
Table 1.1.
11
Page 16

Sonometer 012-03489E
Vibrating
Waveform
Driving
Waveform
Oscilliscope Screen
➤ NOTE: The driving frequency of the signal generator may not be
the frequency at which the wire is vibrating. By using a dual trace
oscilloscope, you can determine if the two frequencies are the same,
or if the vibrating frequency is a multiple of the driving frequency,
as shown in Figure 1.2.
➅ From your results, determine and record the wavelength of each
resonance pattern you discovered. (➤ Note that adjacent nodes are
one half wavelength apart.)
➆ Change the string length by moving one or both of the bridges.
Construct a new data table and repeat your measurements for at least
Figure 1.2 String Vibrations at a
Multiple of the Driving Frequency
three different string lengths.
Analysis
Using your data, determine the shape of the successive resonance waveforms as the frequency is
increased. How do the wave shapes depend on the length of the string? Sketch the resonance
waveforms for an arbitrary string length. What relationship holds between the wavelength of the
wave and the string length when resonance occurs? Can you state this relationship mathematically?
For each string length, inspect the frequencies at which resonance occurred. Determine a mathematical relationship between the lowest resonant frequency (the fundamental frequency) and the
higher frequencies (overtones) at which resonance occurred.
Optional
➀ Change the string tension by hanging the weight from a different notch. Experiment as needed to
answer the following questions. Do the frequencies at which resonance occurs depend on the
tension of the wire? Do the shapes of the resonance patterns (locations of nodes and antinodes)
depend on the tension of the wire?
➁ Change the linear density of the string by changing strings. Do the frequencies at which resonance
occurs depend on the linear density of the wire? Do the shapes of the resonance patterns (locations of nodes and antinodes) depend on the linear density of the wire?
Table 1.1
String length:________________ String tension:_______________ Wire diameter:_______________
Resonant Amplitude Maxima Amplitude Minima
Mode Frequencies (Antinodes) (Nodes)
12
Page 17

012-03489E Sonometer
Experiment 2: Velocity of Wave Propagation
EQUIPMENT NEEDED:
– WA-9611 Sonometer – WA-9613 Driver/Detector Coils
– Function generator capable of delivering 0.5 amp – Dual trace oscilloscope
– Mass and mass hanger
Procedure
➀ Set up the Sonometer as shown in Figure 2.1.
Set the bridges 60 cm apart. Use any of the included strings and hang a mass of approximately 1
kg from the tensioning lever. Adjust the string adjustment knob so that the tensioning lever is
horizontal. Position the driver coil approximately 5 cm from one of the bridges and position the
detector near the center of the wire.
➁ Set the signal generator to produce a sine wave and set the gain of the oscilloscope to approxi-
mately 5 mV/cm.
➂ Slowly increase the frequency of the signal driving the driver coil, starting with a frequency of
around 1 Hz. Determine the lowest frequency at which resonance occurs. Record this value in
Table 2.1.
WA-9613
DETECTOR
KEEP WEIGHTS AS NEAR TO FLOOR
AS POSSIBLE IN THE EVENT THE
SONOMETER WIRE SHOULD BREAK
200 Mhz OSCILLISCOPE
MODEL
2120
CAUTION!
1.75 kg MAXIMUM
LOAD ON LEVER
INTENSITY
AC
DC
CH 1
400V
MAX
FOCUS
TRACE NOTATION
POS
CH 1
VOLTZ/DIV
V
∞
VAR VAR
PULL XS PULL XS
TRIG LEVEL
-
MANUAL AUTO
CH1
EXT
CH2
VERTICAL MODE
CAL
mV
NORM
EXT
+
CH 2
VOLTZ/DIV
COUPLE SOURCE
AC
T XY
T XY
LINE
CH1
CH2
V
CH1
CH2
ALT
EXT
CAL
mV
X-POS
λ - Y
SLOPE
+
-
POSNORM
TIME/DI
V
VAR SWEEP
AC
DC
CAL
CH4
CAL EXT
∞
CH 2
200V
POWER
400V
MAX
MAX
FREQUEN
CY
HE
RTZ
PI-9587B
DIGITAL FUNCTION
GENERATOR AMPLIFIER
WA-9613
DRIVER
WA-9611
SONOMETER
WAVEFO
RA
NGE
ADJU
ST
OUTP
RM
UT
TT
L
EXTERN
AL
HI
Ω
INPUTG
ND
G
AMPLITU
ND
DE
LO
Ω
M
MI
AX
N
BK PRECISION
Figure 2.1 Equipment Setup
➤ NOTE: To be sure you have found the lowest resonant frequency, slide the detector coil the
length of the string. The wave pattern should have just a single antinode located midway between the two bridges.
13
Page 18

Sonometer 012-03489E
➃ In Table 2.1, record the string tension (T) and the linear
density of the string (µ).
The tension is determined as shown in Figure 2.2. Just
multiply the weight of the hanging mass by one, two,
three, four, or five, depending on which notch of the
tensioning lever the mass is hanging from. The linear
density of the strings are given in the front of this
manual (see your teacher, if necessary).
➄ Change the string tension by hanging the mass from a
different notch. Repeat steps 3 and 4 for five different
values of the string tension.
➅ Set the string tension to a midrange value. Then repeat
your measurements of steps 3 and 4 using each of the
five different strings.
Table 2.1 Data and Calculations
Tension Linear Density Fundamental Wave
(T) (µ) Frequency Velocity
String tension
(T)
2Mg
1Mg
15234Slot
5Mg
4Mg
3Mg
(mass = M)
(weight = Mg)
Figure 2.2 Setting the Tension
Hanging
Mass
14
Page 19

012-03489E Sonometer
Analysis
➀ Use your measured string length, the fundamental frequency, and the equation V = λν to determine the velocity
of the wave on the string for each value of tension and linear density that you used.
➁ Determine the functional relationship between the speed of the wave (V) and the wire tension (T). This can be
accomplished using either of the following three methods. If you are not familiar with these procedures, you
might want to try all three.
➤ NOTE: Options A and B are easily performed using a computer with graphical analysis
software.
A. Plot a graph of V versus T, with V on the y-axis. If the graph is not a straight line, try plotting V versus some
2
power of T (such as T
B. Assume that the functional relationship is of the form V = kT
1/2
, T
, etc.), until you get a straight line.
p
. Then ln V = p ln T + ln k, where p and k are
unknown constants. Then, if lnV is plotted against the independent variable lnT, a straight line will be obtained having a slope p, where p is lnV/ lnT and ln k is the y-intercept.
C. Many calculators have the ability to do power regressions or linear regressions on the logarithms of V and T.
This will accomplish essentially what the graph of method B did.
➂ Using one of the methods above, determine the functional relationship of the speed of the wave (V) to the linear
density of the string (µ).
Conclusions
Characterize the resonant modes of a vibrating wire. That is:
➀ Determine a mathematical relationship that describes the wavelengths of the waves that form standing wave
patterns in a wire of length L (see Experiment 1).
➁ Use your answer to question 1, and the expression V = λν, to determine the resonant frequencies of a wire of
length L.
➂ Use your experimental results to write an expression for the resonant frequencies of a vibrating wire in terms of
T, µ, and L.
15
Page 20

Sonometer 012-03489E
Suggested Research T opics
The following are a few suggestions for further experimentation with the Sonometer.
➀ Obtain two wires of the same linear density (mass per unit length), one that is wound and one that
is not wound (a plain wire). Investigate the effects of the winding on the mathematical relationships of wave propagation.
➁ Use a harmonic analyzer to analyze the effects of placing the Driver Coil at different places along
the wire. Also investigate the effects of placing the Detector Coil at different places along the
wire. You can also investigate the effects of plucking, strumming, and bowing the string.
➂ By devising a method to measure string stretch, you can use this apparatus to investigate the
Hooke's Law relationship for a wire placed under tension. Possible investigations include:
a. Strain versus Stress (Stretch versus Applied Load)
b. Strain versus Diameter of Wire (Constant Stress)
c. Strain versus Type of Wire (Constant Diameter)
➃ Obtain wires made of different materials, but with the same linear density. Investigate the speed
of wave propagation in these wires when the same tension is applied to e
ach.
16
Page 21

012-03489E Sonometer
T eacher’s Guide
Experiment 1: Resonance Modes of a Stretched String
Note
To avoid cross-talk between the detector and driver, keep
the detector coil at least 10 cm from the driver coil during
measurements.
Notes on Analysis
Wavelength v. String Length
0.3
f(x) = 4.000000E-1*x + 1.084202E-19
R^2 = 10.000000E-1
0.25
n = 5 (constant)
This verifies that wavelength = 2L/n
0.2
0.15
0.1
Wavelength (m)
0.05
0
0 0.1 0.2 0.3 0.4 0.5 0.6 0.7
X
X
X
String Length (m)
X
X
X
There is a linear relationship between resonant wavelength and string length.
The overtones are all multiples of the fundamental
frequency.
X
X
X
Optional
➀
Frequency v. Tension
1600
1400
1200
1000
800
600
Frequency (Hz)
400
200
0
0 5 10 15 20 25 30 35 40 45 50
1200
1000
800
600
400
Frequency (Hz)
200
0
0.0002 0.0007 0.0012 0.0017 0.0022 0.0027
X
X
X
f(µ) = 2.163996E+1 * (µ^-5.088207E-1 )
R^2 = 9.991369E-1
This verifies that f ` µ
X
f(T) = 2.105721E+2 * (T^5.045696E-1 )
R^2 = 9.994170E-1
This verifies that f ` T
Tension (N)
Frequency v. Mass/Length
X
µ (kg/m)
X
X
1/2
X
-1/2
X
X
17
Page 22

Sonometer 012-03489E
Note
To avoid cross-talk between the detector and driver, keep
the detector coil at least 10 cm from the driver coil during
measurements.
Analysis
➁
400
350
300
250
200
150
Velocity (m/s)
X
100
50
0
0 5 10 15 20 25 30 35 40 45 50
➂
Velocity v. Tension
X
X
X
f(x) = 5.053730E+1 * (x^5.045696E-1 )
R^2 = 9.994170E-1
µ = 0.00039 kg/m
Theoretical: 50.637
Experimental constant is 0.2% low.
This verifies that V ` T
1/2
Tension (N)
X
Notes on Conclusions
➀ As shown in Experiment 1, l = 2L/n.
➂ From the Analysis section, V = sqrt(T/µ). Since
l = 2L/n, substituting and rearranging gives us
n = (n/2L)*sqrt(T/µ)
The graphs below verify this equation.
Frequency v. n
1400
f(x) = 1.357518E+2*x + -5.901176E+0
R^2 = 9.995529E-1
1200
T = 9.8 N; µ = 0.00039 kg/m; L = 0.60 m
Theoretical slope: 1/2L * sqrt(T/µ) = 132.099
1000
Experimental value 2.8% above theoretical.
X
800
600
Frequency (Hz)
400
200
X
X
X
X
X
X
0
012345678910
n
X
X
X
X
X
X
X
X
300
X
Velocity v. Mass/Length
250
200
150
f(x) = 5.193590E+0 * (x^-5.088207E-1 )
R^2 = 9.991369E-1
Velocity (m/s)
100
T = 29.4 N
Theoretical: 5.4222
50
Experimental constant is 4.2% low.
This verifies that V ` µ
0
X
X
X
X
-1/2
0.0002 0.0007 0.0012 0.0017 0.0022
µ (kg/m)
Frequency v. Tension
1600
1400
1200
1000
X
X
800
600
Frequency (Hz)
400
X
f(T) = 2.105721E+2 * (T^5.045696E-1 )
R^2 = 9.994170E-1
Theoretical: (n/2L)*sqrt(1/µ) = 210.99
200
Experimental constant is 0.2% low.
0
0 5 10 15 20 25 30 35 40 45 50
Tension (N)
X
X
18
Page 23

012-03489E Sonometer
T echnical Support
Feed-Back
If you have any comments about this product or this
manual please let us know. If you have any suggestions on alternate experiments or find a problem in the
manual please tell us. PASCO appreciates any customer feed-back. Your input helps us evaluate and
improve our product.
To Reach PASCO
For Technical Support call us at 1-800-772-8700 (tollfree within the U.S.) or (916) 786-3800.
Internet: techsupp@PASCO.com
Tech Support Fax: (916)786-3292
Contacting Technical Support
Before you call the PASCO Technical Support staff it
would be helpful to prepare the following information:
• If your problem is with the PASCO apparatus, note:
Title and Model number (usually listed on the label).
Approximate age of apparatus.
A detailed description of the problem/sequence of
events. (In case you can't call PASCO right away,
you won't lose valuable data.)
If possible, have the apparatus within reach when
calling. This makes descriptions of individual parts
much easier.
• If your problem relates to the instruction manual,
note:
Part number and Revision (listed by month and year
on the front cover).
Have the manual at hand to discuss your questions.
19
Page 24

 Loading...