

Page 1

®
Instruction Manual
012-09189A
Heat Conduction Apparatus
TD-8513
Page 2

Heat Conduction Apparatus Table of Contents
Contents
Introduction . . . . . . . . . . . . . . . . . . . . . . . . . . . . . . . . . . . . . . . . . . . . . . . . . . . . . . . . . . . 3
Connections. . . . . . . . . . . . . . . . . . . . . . . . . . . . . . . . . . . . . . . . . . . . . . . . . . . . . . . . . . .4
Safety. . . . . . . . . . . . . . . . . . . . . . . . . . . . . . . . . . . . . . . . . . . . . . . . . . . . . . . . . . . . . . . . 4
Specifications. . . . . . . . . . . . . . . . . . . . . . . . . . . . . . . . . . . . . . . . . . . . . . . . . . . . . . . . . .4
Material Properties. . . . . . . . . . . . . . . . . . . . . . . . . . . . . . . . . . . . . . . . . . . . . . . . . . . . . . 4
Experiment #1: Heat Conduction. . . . . . . . . . . . . . . . . . . . . . . . . . . . . . . . . . . . . . . . . . . 5
Experiment #2: Angstrom’s Method. . . . . . . . . . . . . . . . . . . . . . . . . . . . . . . . . . . . . . . . . 9
Sample Data . . . . . . . . . . . . . . . . . . . . . . . . . . . . . . . . . . . . . . . . . . . . . . . . . . . . . . . . . 13
Technical Support . . . . . . . . . . . . . . . . . . . . . . . . . . . . . . . . . . . . . . . . . . . . . . . . . . . . . 17
Page 3
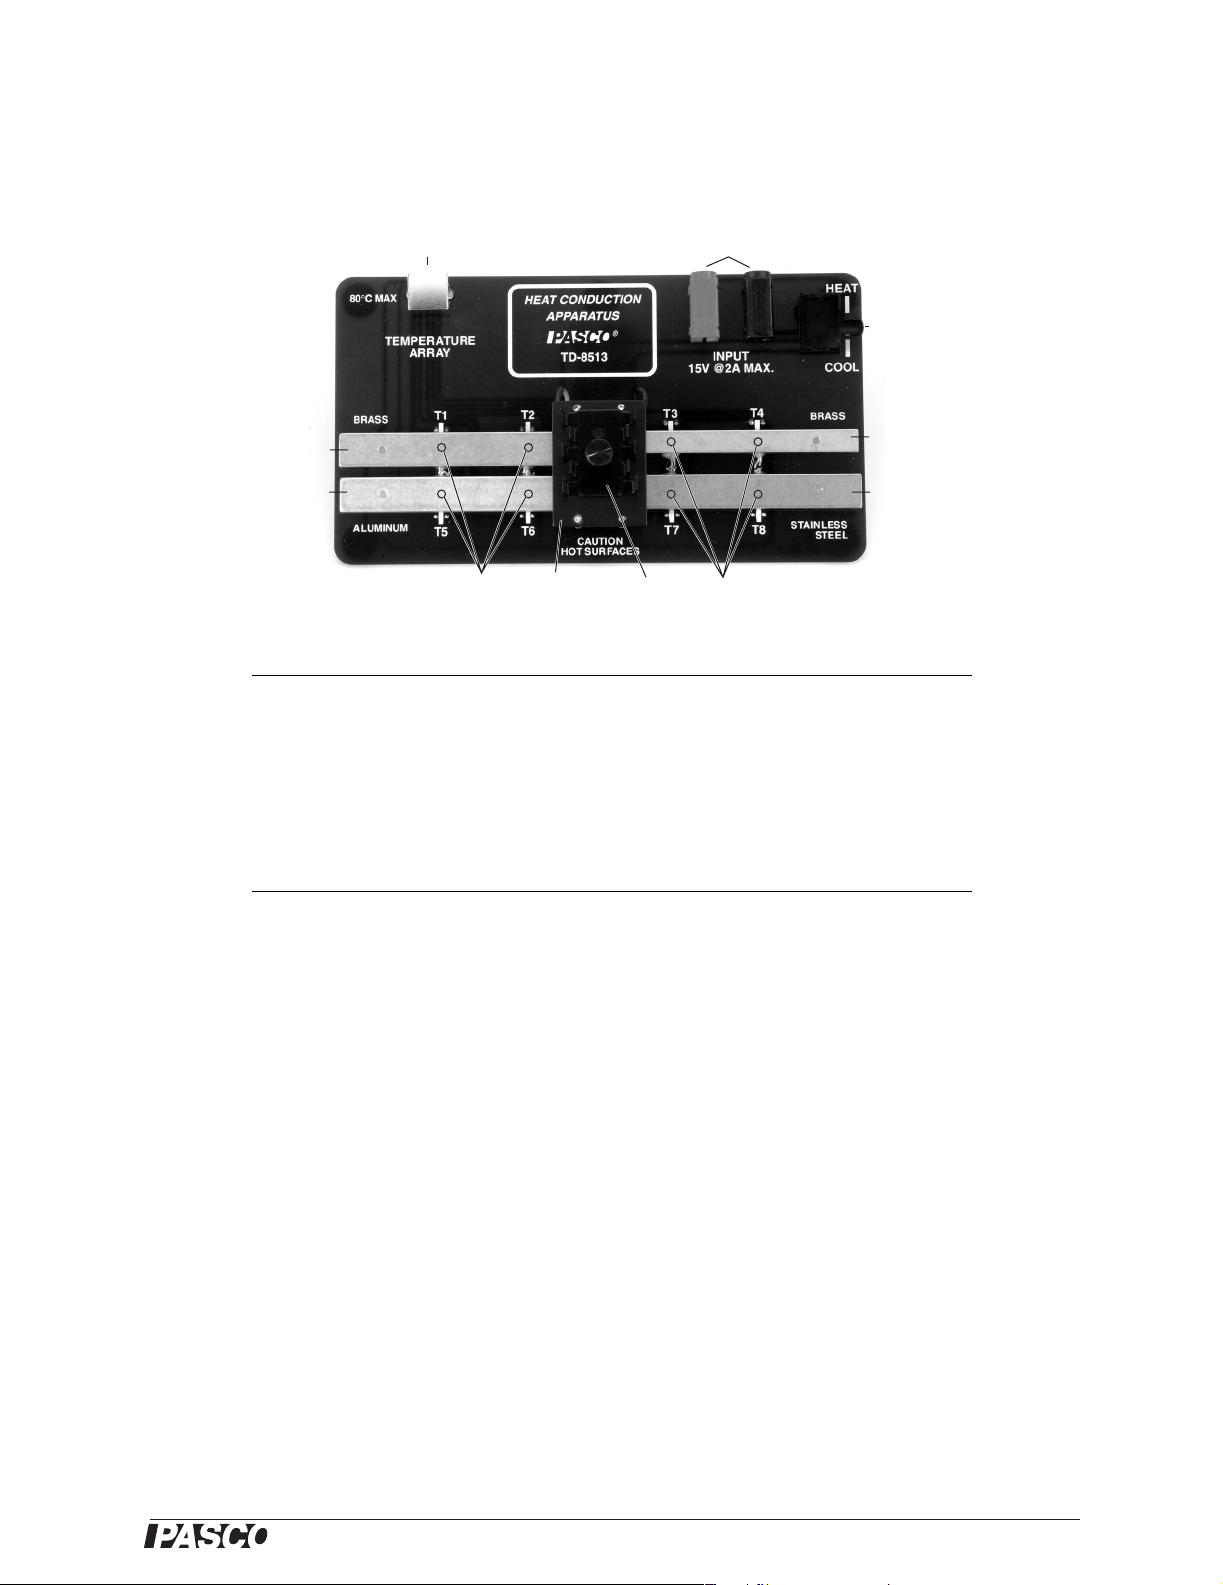
Heat Conduction Apparatus
TD-8513
Temperature
Port
Power Input
Ports
Heat/Cool
Switch
Wide Brass Bar
Aluminum Bar
Peltier
Device
Included Equipment Part Number
Heat Conduction Board TD-8513
Heat Sink 624-005
Thumbscrew 617-013
Foam Insulators (qty. 2) 648-09185
Temperature Array Cable 514-09162
Required Equipment Part Number
PASPORT Temperature Array
DC Power Supply PI-9877
4 mm Banana Patch Cords (qty. 2) SE-9750, SE-9751, or similar
1
Temperature Array requires a PASPORT interface; see PASCO catalog or www.pasco.com
2
Or similar power supply capable of supplying at least 5 volts and 1 amp.
1
Heat
Sink
ThermistorsThermistors
PS-2157
2
Narrow Brass Bar
Stainless Steel Bar
Introduction
The PASCO Heat Conduction Apparatus demonstrates the difference in the rate of heat conduction through bars
of different materials and cross-sectional areas. The apparatus has four metal bars: one aluminum, one stainless
steel, and two brass with different cross-sections. One end of each bar is heated or cooled by a Peltier device.
Each bar has two 10 kΩ thermistors embedded about 3 cm from each other. A cable is supplied to connect the
thermistors to a PASPORT Temperature Array (PS-2157) so data can be recorded from all eight sensors simultaneously. Foam insulators cover the bars to minimize heat exchange with the environment.
The embedded thermistors are labeled T1 through T8; these labels correspond to the Temperature Array channels
(1 through 8) on which data is collected. The lines printed on the board indicate the lateral positions of the thermistors within the bars.
®
3
Page 4
Heat Conduction Apparatus Connections
The Heat/Cool switch changes the polarity of the voltage applied to the Peltier device
so that the lower surface of the device either heats or cools the bars. When the switch
is set to Cool, the device pumps heat from the lower surface to the upper surface; the
heat sink helps to dissipate this heat.
Connections
Use the included cable to connect the temperature port of the Heat Conduction Apparatus to the multiport of a PS-2157 Temperature Array. Connect the Temperature
Array to a PASPORT interface. Connect the interface to a computer and start
DataStudio.
1
Connect a PI-9877 DC Power Supply (or similar) to the power input ports of the
1
If your PASPORT interface is an Xplorer GLX,
you can use it without a
computer or DataStudio.
apparatus with the positive terminal of the power supply connected to the red input
port, and the negative terminal connected to the black input port. Set the voltage to
zero.
Safety
The Peltier device and metal bars can be hot. Do not touch them while the appa-
ratus is in use. When applying power to the device, always monitor the temperatures and do not allow them to exceed 80 °C. After use, do not leave the apparatus
unattended until all parts have cooled.
Do not apply more than 15 V or 2 A to the apparatus.
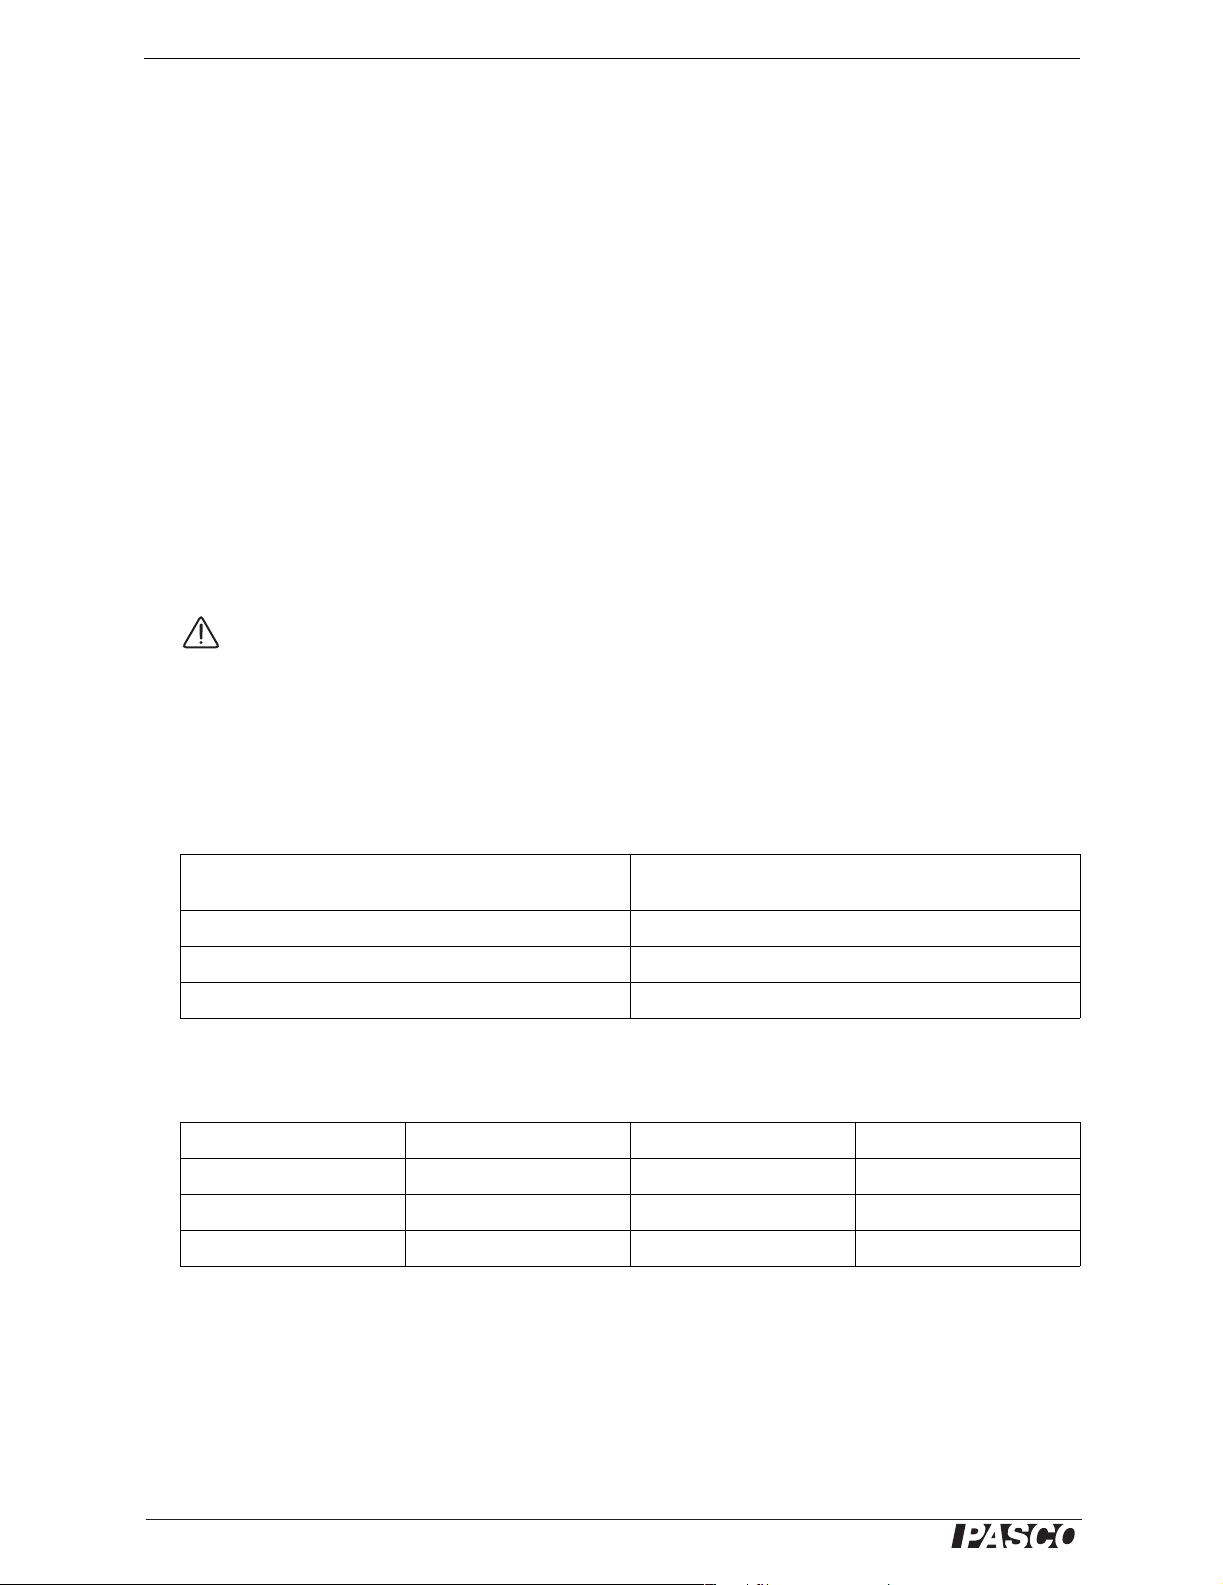
Specifications
Aluminum, stainless steel, and wide brass bar
dimensions
Narrow brass bar dimensions 9 × 0.7 × 0.4 cm
Maximum input voltage 15 VDC
Thermistors Eight embedded 10 kΩ thermistors
9 × 1.2 × 0.4 cm
Material Properties
Brass (360 Alloy) Aluminum (6063-T5) Stainless Steel (304)
3
Density ρ (kg/m
Specific Heat
Conductivity
) 8520 2800 8000
c
(J/kg·K) 385 830 400
k
(W/m·K) 115 150 14
4
®
Page 5

Model No. TD-8513 Experiment #1: Heat Conduction
Experiment #1: Heat Conduction
Equipment Required Model
Heat Conduction Apparatus TD-8513
DC Power Supply PI-9877
Temperature Array
DC Power Supply PI-9877
4 mm Banana Patch Cords (qty. 2) SE-9750, SE-9751, or similar
1
Temperature Array requires a PASPORT interface; see PASCO catalog or www.pasco.com
Set-up
1. On the power supply, turn the Function switch to SET MAX and set the voltage
2. Use two banana patch cords to connect the power supply to the Heat Conduction
1
PS-2157
limit to 8 V; this will prevent accidental overload during the experiment. Turn the
Function switch to constant DC mode ( ).
Apparatus. Connect the positive (+) terminal of the power supply to the red input
jack of the Heat Conduction Apparatus; connect the negative (−) terminal of the
power supply to the black input jack of the Heat Conduction Apparatus.
3. Use the included cable to connect the temperature port of the apparatus to the
multiport of the Temperature Array. Connect the Temperature Array to the
PASPORT interface. Connect the interface to a computer and start DataStudio.
4. Measure the distance between the two thermistors embedded in each bar; their
positions are marked by the white lines on the board.
5. Make a drawing showing the layout of the apparatus including the Peltier device,
the four bars, and the thermistors. Label each thermistor with the following designations:
T1 Wide Brass (far)
T2 Wide Brass (close)
T3 Narrow Brass (close)
T4 Narrow Brass (far)
T5 Aluminum (far)
T6 Aluminum (close)
T7 Stainless (close)
T8 Stainless (far)
A. Heat Conduction Race
Set-up
1. Set the switch to HEAT and place the insulators over the bars.
2. In DataStudio, set the sampling rate of the Temperature Array to 5 Hz. Set up a
graph display to show the temperatures measured by all four “far” thermistors
(T1, T4, T5, and T8).
3. Collect a test run of data to make sure that all four bars are all at room tempera-
ture. Delete the data.
®
5
Page 6
Heat Conduction Apparatus Experiment #1: Heat Conduction
Procedure
1. Set the power supply to 5 V (constant DC) and simultaneously start recording in
DataStudio. Watch the graph of “far” temperatures and allow them to increase for
about 5 minutes. Stop recording.
2. Set the power supply voltage to zero. Remove the insulators to allow the bars to
1
cool.
Analysis
1. Look at the final temperature measured by the “far” thermistor of each bar.
Which material is the best conductor? Which is the worst? Is there a difference
between the two brass bars?
2. Create a graph showing data from both thermistors in the wide brass bar (T1 and
T2). Zoom in on the area of the graph where the temperatures start to increase.
Notice that the temperature at the close thermistor (T2) starts to increase before
the temperature at the far thermistor (T1). Measure this time difference.
3. Calculate the speed of the heat pulse down the brass bar. At this speed, how long
would it take for the pulse to travel the length of the bar?
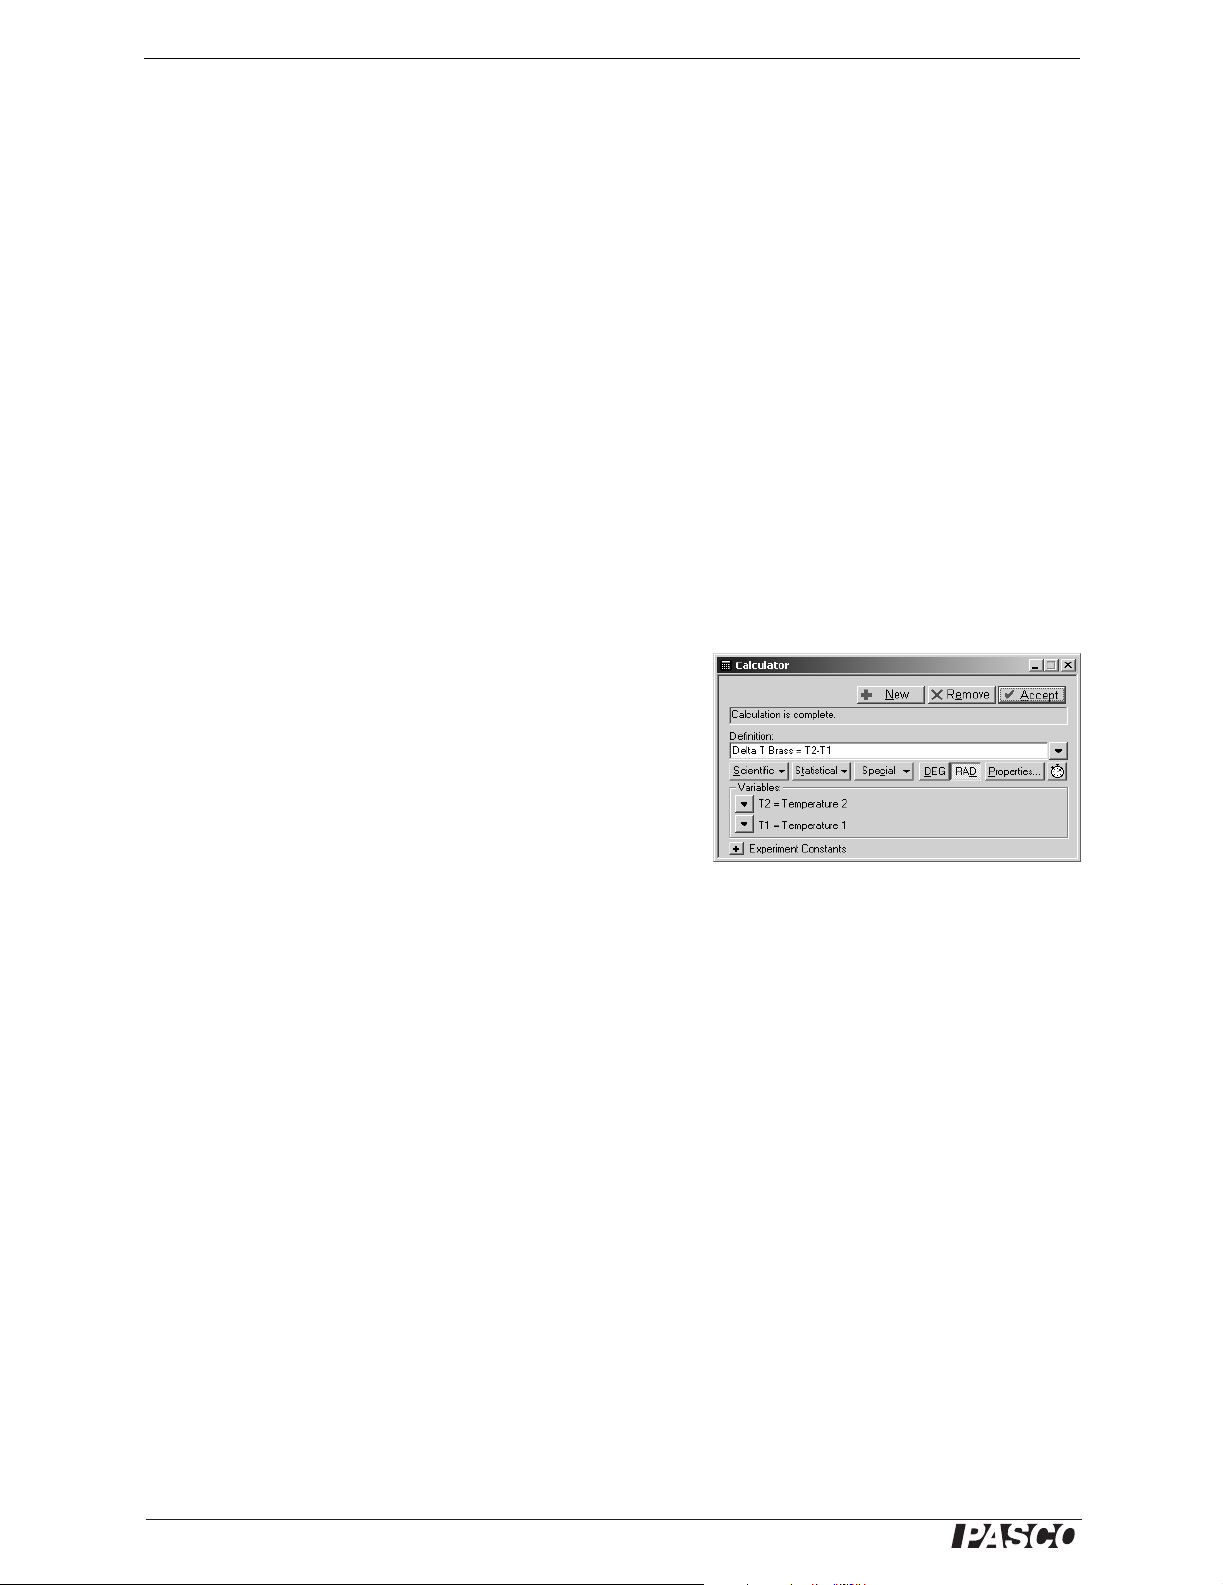
4. In DataStudio, create a calculation for the temperature differ-
ence (∆T) between the close and far thermistors in the wide
brass bar. Create similar calculations for the other three bars
(be sure to subtract the “far” temperature from the “close”
temperature). Display all four calculations in a graph.
Which bar has the largest ∆T? Which bar has the smallest?
What is the correlation between ∆T and how good a
conductor each material is?
1
To cool the bars faster,
you can set the switch to
COOL and apply 5 volts
for a few minutes; then
wait a few more minutes
with the apparatus
un-powered for the bars
to come to equilibrium.
5. Why does ∆T peak and then decrease? Why does this peak occur at different
times for the four bars?
6. Notice that ∆T in each bar approaches a final equilibrium value. Estimate this
final value for each bar.
7. The rate of heat flow (∆Q/∆t, in joules per second) is given by
Q∆
kA T∆
--------
--------------=
t∆
x
where k is the thermal conductivity of the material, A is the cross-sectional area
of the bar, and x is the distance between the thermistors.
See page 4 for the conductivities of brass, aluminum, and stainless steel. Measure
the dimensions of the bars. Calculate the final heat flow rate in each bar.
8. Which bar has the highest heat flow rate? Is there a correlation between ∆T and
heat flow rate? Why is the heat flow lower in the narrow brass bar than in the
wide one?
Further Study
Repeat the previous experiment with the switch set to COOL. Which direction does
heat flow in this case?
6
®
Page 7

Model No. TD-8513 Experiment #1: Heat Conduction
B. Heat Pulse
Set-up
1. Set the switch to HEAT and place the insulators over the bars.
2. In DataStudio, set the sampling rate of the Temperature Array to 2 Hz. Set up a
graph display to show the temperatures measured by both thermistors in the wide
brass bar (T1 and T2).
3. Collect a test run of data to make sure that all four bars are all at room tempera-
ture. Delete the data.
Procedure
1. Set the power supply to 5 volts (constant DC) and start recording in DataStudio.
Wait until the “close” temperature (measured by T2) reaches about 40 °C.
2
2. Change the switch to the COOL position and start timing with a clock or stop-
watch. Change the switch every 30 seconds. In this way the end of the bar is
alternately heated and cooled with a period of 60 s.
3. Continue for several minutes until the temperature wave at each thermistor has
stabilized with a constant amplitude.
4. Stop data recording and set the power supply to 0 V.
3
Analysis
1. Observe the shape of the two waves (it helps to zoom in on the last few cycles).
What is the shape of the wave that you applied to the bar by switching between
heating and cooling? What is the shape of this wave when it reaches the close
thermistor (T2)? How has it changed when it reaches the far thermistor (T1)?
2. Notice that there is a time lag between the two waves. What causes this? Measure
the time lag. How is the time lag related to the distance between the thermistors?
3. Why is there an amplitude change between the two waves? Are these really two
different waves?
2
You can decrease the
wait time by applying a
higher voltage (8 V), but
reduce the voltage back
to 5 V before the temperature reaches 40
3
If you are going to do
part C of this lab, set the
power supply now. This
will allow the system to
come to equilibrium while
you perform the following analysis. See the
Set-up section for part C
below.
o
C.
4. Create a new graph showing data collected by the thermistors in the aluminum
bar (T5 and T6). Repeat analysis steps 1 through 3 for the aluminum bar.
5. Compare the shape of the waves in the aluminum and brass bars. Why are they
different? Compare the amplitude of the waves. Which material is the better conductor?
6. Compare the time lags in the aluminum and brass bars? What does this tell you
about the speed of the pulse in each bar?
C. Heat Waves
Theory
In this part, the power supply will apply a triangle wave voltage to the Peltier device.
This heating and cooling of one end of each bar causes a thermal wave to travel down
the bar. The wave on each bar is measured by two thermistors. You will investigate
the relationship between wave speed, period, and wavelength.
®
7
Page 8

Heat Conduction Apparatus Experiment #1: Heat Conduction
Set-up
8 V
1. Set the switch to COOL.
2. Place the insulators on the bars.
3. Set the power supply to output an 8 V positive triangle wave with a 50 s period,
as shown in the diagram. See the PI-9877 DC Power Supply manual for detailed
instructions.
4. In DataStudio, set the sampling rate to 2 Hz. Create a graph to show data col-
lected by both thermistors in the wide brass bar (T1 and T2).
5. Start recording data. Wait for several minutes until the thermal wave at each ther-
mistor has stabilized with a constant amplitude. Stop recording data and delete
the data run.
Procedure
Start recording data again. After two full cycles, stop recording.
4
Analysis
1. Measure the time lag between the wave measured by the “close” and “far” ther-
mistors.
2. Calculate the speed (
V) of the wave using the distance between the thermistors
and the time lag between the waves.
0 V
50 s
Power Supply Settings:
Max. Voltage 8 V
Min. Voltage 0 V
Period 50 s
Auto-repeat −0
4
If you are going to do
the Further Study part of
this section, change the
period of the triangle
wave to 100 s now and
allow the system stabilize
while you do the following
analysis.
3. Calculate the frequency (f) of the wave in Hz.
4. The speed of any wave is related to its frequency and wavelength (λ) by
V λf=
Calculate the wavelength of this wave. How does λ compare to the length of the
entire bar?
5. Create another graph showing temperatures measured in the aluminum bar.
Repeat analysis steps 1 through 4. Do the same for the narrow brass bar and the
stainless steel bar.
Questions
1. Is the wave speed different in each material? Which has the highest speed? How
is the wave speed related to the conductivity of the material?
2. Notice the decrease in amplitude (attenuation) of the wave measured at the far
thermistor compared to the close thermistor. How is this related to the material
and the conductivity? Which material has the most attenuation.
Further Study
Repeat the experiment for a wave with a period of 100 Hz. How are the wave speed,
wavelength, and attenuation affected by the frequency of the wave?
8
®
Page 9

Model No. TD-8513 Experiment #2: Angstrom’s Method
Experiment #2: Angstrom’s Method
Equipment Required Model
Heat Conduction Apparatus TD-8513
DC Power Supply PI-9877
Temperature Array
DC Power Supply PI-9877
4 mm Banana Patch Cords (qty. 2) SE-9750, SE-9751, or similar
1
Temperature Array requires a PASPORT interface; see PASCO catalog or www.pasco.com
Set up
1. On the power supply, turn the Function switch to SET MAX and set the voltage
2. Use two banana patch cords to connect the power supply to the Heat Conduction
1
PS-2157
limit to 8 V; this will prevent accidental overload during the experiment. Turn the
Function switch to constant DC mode ( ).
Apparatus. Connect the positive (+) terminal of the power supply to the red input
jack of the Heat Conduction Apparatus; connect the negative (−) terminal of the
power supply to the black input jack of the Heat Conduction Apparatus.
3. On the Heat Conduction Apparatus set the switch to COOL.
4. Use the included cable to connect the temperature port of the apparatus to the
multiport of the Temperature Array. Connect the Temperature Array to the
PASPORT interface. Connect the interface to a computer and start DataStudio.
5. Measure the distance between the two thermistors embedded in each bar; their
positions are marked by the white lines on the board.
6. Make a drawing showing the layout of the apparatus including the Peltier device,
the four bars, and the thermistors. Label each thermistor with the following designations:
T1 Wide Brass (far)
T2 Wide Brass (close)
T3 Narrow Brass (close)
T4 Narrow Brass (far)
T5 Aluminum (far)
T6 Aluminum (close)
T7 Stainless (close)
T8 Stainless (far)
Theory
In this experiment, you will measure the thermal conductivity of the metal bars using
Angstrom’s method. A periodic wave travels down the bar and the resulting temperature wave is measured at two points using thermistors. The thermal diffusivity, α, can
determined by measuring the amplitude of the temperature wave at the close thermistor (A
) and the amplitude at the far thermistor (Af) as well as the relative phase
c
(φ) between these two waves.
®
9
Page 10

Heat Conduction Apparatus Experiment #2: Angstrom’s Method
According to Angstrom’s method
2
A
c
------
A
f
α
nω x∆()
------------------------=
2φ ln
where n is the harmonic, ω is the driving frequency, and ∆x is the distance between
the thermistors.
In this experiment, the driving frequency is very small so it is easier to consider the
period (T) of the wave, where
2π
ω
------=
T
The time delay (∆t) between the two waves is measured directly. The relative phase,
(φ), is calculated using
t∆
-----
=
where T
φ 2π
is the period of the harmonic. Thus
n
T
n
T
=
T
---
n
n
Combining these four equations yields
2
x
α
∆
=
---------------------------
2 t ln
∆
A
c
------
A
f
Note that α is independent of the harmonic (n) and of the driving frequency (ω).
A more commonly used quantity that is related to the thermal diffusivity, but includes
the specific heat (c) and density (ρ) of the material, is the thermal conductivity (k).
kcρα=
This gives the final expression:
2
A
c
------
A
f
k
=
cρα x∆()
---------------------------
2 t ln
∆
10
®
Page 11

Model No. TD-8513 Experiment #2: Angstrom’s Method
A. Aluminum
Set-up
1. In DataStudio set the sampling rate of the Temperature Array to 2 Hz. Create a
graph to display temperatures measured by both thermistors in the aluminum bar
(T5 and T6).
2. Set the power supply to output an 8 V positive triangle wave with a 30 s period,
as shown in the diagram. See the PI-9877 DC Power Supply manual for detailed
instructions.
8 V
Procedure
1. Start recording data. While driving the apparatus with the triangle wave, monitor
the temperature waves until each has stabilized with constant amplitude. Stop
recording and delete the data run. (Let the power supply continue to run.)
2. Start recording data. After two complete cycles of the driving wave, stop record-
ing.
3. On the graph, measure the amplitudes of both waves (A
and Af) and the time dif-
c
ference between corresponding peaks of the two waves (∆t). Make a copy of the
table below and record these measurements in it.
Period (s)
30
40
A
c
A
f
∆
tk
(W/m·K) Average
0 V
30 s
Power Supply Settings:
Max. Voltage 8 V
Min. Voltage 0 V
Period 30 s
Auto-repeat −0
k
(W/m·K)
50
Average
4. Repeat steps 2 and 3 for a total of three data runs and record all values in your
table.
5. On the power supply, set the period of the triangle wave to 40 s and repeat steps 1
through 4.
You can start the following analysis while you wait for the system to stabilize.
6. Set the period of the wave to 50 s and repeat steps 1 through 4 again.
Analysis
1. For each of the data runs recorded with a 30-second triangle wave, calculate the
thermal conductivity (k). What is the average value of k? What is the uncertainty
of the average?
®
11
Page 12

Heat Conduction Apparatus Experiment #2: Angstrom’s Method
2. Repeat the calculations for the data runs taken with 40-second and 50-second tri-
angle waves.
Save the three data runs recorded with 50-second triangle wave for the next part.
3. Does k appear to depend on the period of the wave?
4. Calculate the average k (including uncertainty) for all data runs and compare
your answer to the accepted value of k for aluminum.
B. Brass
Record two more data runs with a 50-second triangle wave so that you have a total of
five. Repeat the analysis from part A for the wide brass bar and narrow brass bar seperately. Does the bar’s cross-sectional area appear to affect the value of k?
C. Stainless Steel
Record five data runs with a 100-second triangle wave. Repeat the analysis for the
stainless steel bar.
Compare the thermal conductivities of the three materials that you tested.
12
®
Page 13

Model No. TD-8513 Sample Data
Sample Data
Experiment #1: Heat Conduction
A. Heat Conduction Race
Temperatures measured by the “far” thermistors show the aluminum bar to be the best
conductor and stainless steel the worst. Notice
the cross-over point for the two brass bars (two
central traces).
A close-up of the wave measured at two points
in the wide brass bar shows the pulse arriving
at the “close” thermistor 5.2 s before the “far”
thermistor. The distance between the thermistors is 30 mm. The pulse speed is
30 mm / 5.2 s = 5.8 mm/s
The temperature differences between the thermistors in each bar show that aluminum (with
the smallest ∆T) is the best conductor and
stainless steel (with the largest ∆T) is the worst.
The peak occurs because the leading edge of
the heat pulse arrives at the “close” thermistor
before the “far” thermistor. These peaks occur
at different times because the pulses in different
bars travel at different speeds.
®
13
Page 14

Heat Conduction Apparatus Sample Data
For these sample data, the heat flow rates are:
Wide Brass 0.36 J/s
Narrow Brass 0.28 J/s
Aluminum 0.28 J/s
Stainless Steel 0.17 J/s
The wide brass bar has a higher heat flow rate than the narrow brass bar. The data also
show that ∆T in different materials is not directly related to heat flow rate.
B. Heat Pulse
This graph shows the temperatures increasing
(with the switch set to HEAT) before the switch
starts alternating. The apparatus is driven with
a square wave. At the first close thermistor
(upper trace on the graph) the wave resembles a
triangle wave; at the far thermistor is looks
more like a sine wave.
The wave at the far thermistor lags the near
thermistor by 10.5 s. The wave speed is
30 mm/10.5 s = 2.9 mm/s.
14
®
Page 15

Model No. TD-8513 Sample Data
C. Heat Waves
In this graph the far thermistor lags the near
thermistor by 11.1 s. The wave speed is
30 mm/11.1 s = 2.7 mm/s.
The wavelength is 140 mm, about twice the
length of the bar.
Experiment #2: Angstrom’s Method
A. Aluminum
Period (s)
30
40
50
B. Brass
Wide brass bar:
Period (s)
A
c
0.671 0.206 5.38 165
0.673 0.219 5.28 176
0.912 0.341 6.21 171
0.903 0.330 6.51 159
1.09 0.449 7.5 157
1.12 0.471 7.05 171
A
c
0.430 0.110 10.2 106
A
f
A
f
∆
tk
∆
tk
(W/m·K) Average
Average 165
(W/m·K) Average
k
1720.673 0.214 5.22 174
1660.909 0.339 6.28 169
1601.09 0.441 7.6 152
k
(W/m·K)
(W/m·K)
50
0.452 0.121 9.7 115
0.426 0.108 11.1 97
0.429 0.118 11.1 103
0.440 0.123 10.3 112
®
107
15
Page 16

Heat Conduction Apparatus Sample Data
Narrow brass bar:
Period (s)
50
C. Stainless Steel
Period (s)
100
A
c
0.578 0.142 10.2 103
0.599 0.150 9.9 108
0.571 0.142 10.8 98
0.577 0.147 10.8 100
0.589 0.151 10.5 103
A
c
0.800 0.051 37.5 14
0.792 0.060 37.1 15
0.796 0.042 45.0 11
0.778 0.048 41.1 13
0.815 0.044 44.3 11
A
f
A
f
∆
tk
∆
tk
(W/m·K) Average
(W/m·K) Average
k
102
k
13
(W/m·K)
(W/m·K)
16
®
Page 17

Model No. TD-8513 Technical Support
Technical Support
For assistance with any PASCO product, contact PASCO at:
Address:
PASCO scientific
10101 Foothills Blvd.
Roseville, CA 95747-7100
Phone:
916-786-3800 (worldwide)
800-772-8700 (U.S.)
Fax: (916) 786-3292
Web: www.pasco.com
Email: support@pasco.com
Limited Warranty
For a description of the product warranty, see the PASCO catalog.
Copyright
The PASCO scientific 012-09189A
is granted to non-profit educational institutions for reproduction of any part of this manual, providing the reproductions are used only
in their laboratories and classrooms, and are not sold for profit. Reproduction under any other circumstances, without the written consent of PASCO scientific, is prohibited.
Trademarks
PASCO, PASCO scientific, DataStudio, and PASPORT are trademarks or registered trademarks of PASCO scientific, in the United
States and/or in other countries. All other brands, products, or service names are or may be trademarks or service marks of, and are
used to identify, products or services of, their respective owners. For more information visit www.pasco.com/legal.
Heat Conduction Apparatus Instruction Manual
is copyrighted with all rights reserved. Permission
®
17
Page 18

 Loading...