

Page 1
Includes
Teacher's Notes
and
Typical
Experiment Results
Instruction Manual and
Experiment Guide for the
012-06697B
PASCO scientific
Model SE-9076
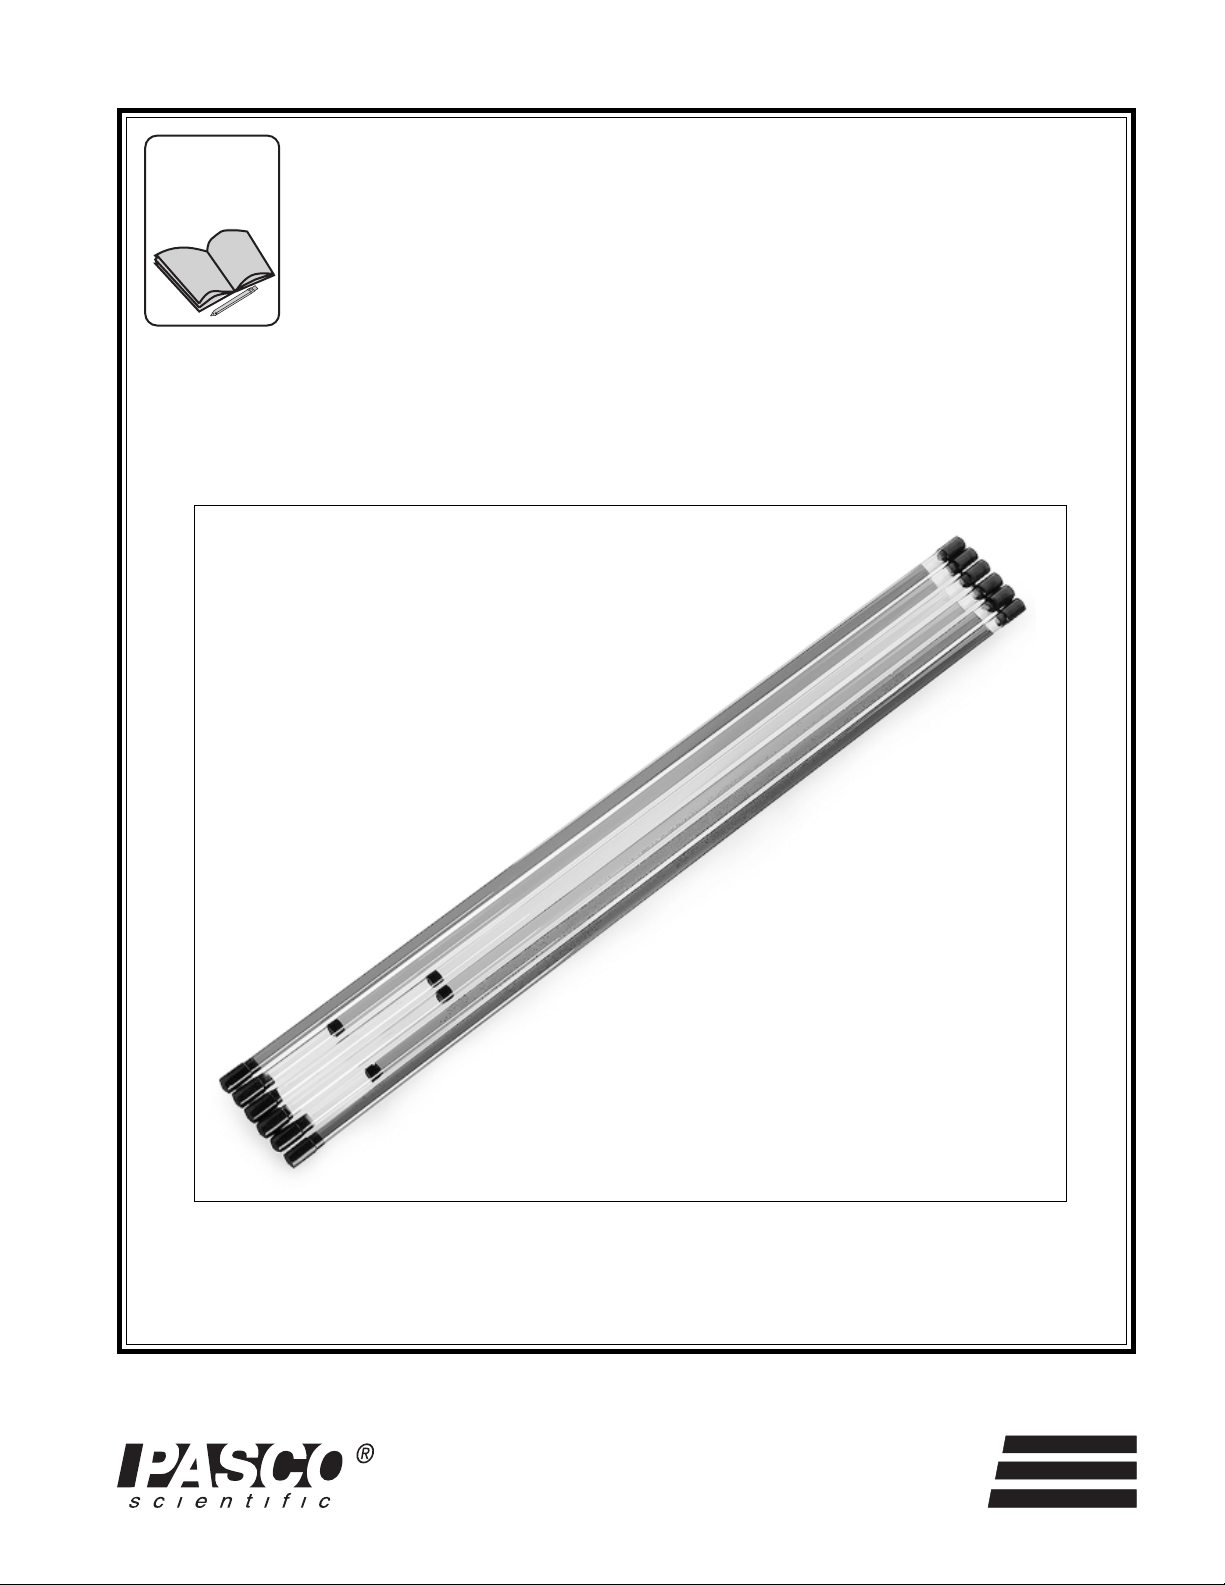
CONSTANT VELOCITY TUBES
12/98
© 1997 PASCO scientific $5.00
better
10101 Foothills Blvd. • P.O. Box 619011 • Roseville, CA 95678-9011 USA
Phone (916) 786-3800 • FAX (916) 786-8905 • email: techsupp@PASCO.com
ways to
teach science
Page 2
Constant Velocity Tubes 012–06697B
The exclamation point within an
equilateral triangle is intended to alert the
user of important operating and safety
instructions that will help prevent damage
to the equipment or injury to the user.
Page 3

012–06697B Constant Velocity Tubes
Table of Contents
Section Page
Copyright, Warranty, and Equipment Return............................................................................................i i
Introduction.............................................................................................................................................1
Equipment...............................................................................................................................................1
Maintenance ...........................................................................................................................................1
MSDS: CHEVRON Hydraulic Oil AW ISO 22 ......................................................................................2
First Aid Measures .................................................................................................................................2
MSDS: CITGO A/W Hydraulic Oil 46....................................................................................................3
Acute Exposure Symptoms .....................................................................................................................3
First Aid Measures .................................................................................................................................3
Pre-Lab Exercise: Graphing in the Lab............................................................................................... 4 –8
Experiments
Experiment 1: Constant Velocity Motion and the Linear Graph ..........................................................9–13
Teacher's Notes
Pre-Lab Exercise ...................................................................................................................................15
Experiment 1 ...................................................................................................................................16–17
Technical Support .................................................................................................................. Back Cover
i
Page 4
Constant Velocity Tubes 012–06697B
Copyright, Warr anty, and Equipment Return
Please—Feel free to duplicate this manual
subject to the copyright restrictions below.
Copyright Notice
The PASCO scientific Constant Velocity Tubes (01206697B) manual is copyrighted and all rights
reserved. However, permission is granted to nonprofit educational institutions for reproduction of any
part of the manual providing the reproductions are
used only for their laboratories and are not sold
for profit. Reproduction under any other
circumstances without the written consent of the
copyright holders is prohibited.
Limited Warranty
PASCO scientific warrants the product to be free
from defects in materials and workmanship for a
period of one year from the date of shipment to the
customer. PASCO will repair or replace at its option
any part
of the product which is deemed to be defective in
material or workmanship. The warranty does not
cover damage to the product caused by abuse or
improper use. Determination of whether a product
failure is the result of a manufacturing defect or
improper use by the customer shall be made solely by
PASCO scientific. Responsibility for the return of
equipment for warranty repair belongs to the
customer. Equipment must be properly packed to
prevent damage and shipped postage or freight
prepaid. (Damage caused by improper packing of the
equipment for return shipment will not be covered by
the warranty.) Shipping costs for returning the
equipment after repair will be paid by PASCO
scientific.
Equipment Return
Should the product have to be returned to PASCO
scientific for any reason, notify PASCO scientific by
letter, phone, or fax BEFORE returning the product.
Upon notification, the return authorization and
shipping instructions will be promptly issued.
➤ NOTE: NO EQUIPMENT WILL BE
ACCEPTED FOR RETURN WITHOUT AN
AUTHORIZATION FROM PASCO.
When returning equipment for repair, the units must
be packed properly. Carriers will not accept
responsibility for damage caused by improper
packing. To be certain the unit will not be damaged
in shipment, observe the following rules:
➀ The packing carton must be strong enough for the item
shipped.
➁ Make certain there are at least two inches of packing
material between any point on the apparatus and the
inside walls of the carton.
➂ Make certain that the packing material cannot shift in
the box or become compressed, allowing the
instrument come in contact with the packing carton.
Address: PASCO scientific
10101 Foothills Blvd.
Roseville, CA 95747-7100
Phone: (916) 786-3800
Credits
Author: Jim Housley
Editor: Sunny Bishop
FAX: (916) 786-3292
email: techsupp@pasco.com
web: www.pasco.com
ii
Page 5
Constant Velocity Tubes 012–06697B
Introduction
The PASCO SE-9076 Constant Velocity Tubes are simple devices that students can use
to generate velocity vs. time data for exercises to improve their graphing skills. The
plexiglass tubes contain colored, oil-based liquid of two different viscosities, and there
are three different lengths of liquid columns. A bubble of air trapped in each of the liquid
columns rises at a constant velocity that is determined by the viscosity of the liquid.
Equipment
INCLUDED
• SE-9076 Constant Velocity Tubes (6)
ADDITIONAL EQUIPMENT REQUIRED
• Meter stick or metric ruler
• Clock with sweep second hand, or stopwatch
Maintenance
• Clean with mild nonabrasive dish soap.
• Store in original box, out of direct sunlight.
Do not store in chemical storerooms.
• If a tube breaks, discard in accordance with
your school’s procedures for chemical
handling.
➤ The fluids may cause stains on some materials.
Stains may usually be removed by simple
procedures such as the use of a laundry stain
remover.
The red,orange and yellow tubes contain
CHEVRON Hydraulic Oil AW ISO 22. The
green, blue and violet tubes contain CITGO A/W
Hydraulic Oil 46. Please refer to the following
MSDS section for a short listing of exposure
concerns.
1
Page 6

Constant Velocity Tubes 012–06697B
MSDS: CHEVRON Hydraulic Oil A W ISO 22
To request a complete material safety data sheet (MSDS) you may either use the following contact information, use
the Chevron web site “www.chevron.com”, or request a copy directly from PASCO.
COMPANY IDENTIFICATION EMERGENCY TELEPHONE NUMBERS
Chevron USA Products Company HEALTH (24 hr): (800)231-0623 or
Environmental, Safety , and Health (510)231-0623 (International)
Room 2900 TRANSPOR TATION (24 hr): CHEMTREC
575 Market St. (800)424-9300 or (202)483-7616
San Francisco, CA 94105-2856
PRODUCT INFORMATION: MSDS Requests: (800) 228-3500
Environmental, Safety , & Health Info: (415) 894-1899
Product Information: (800) 582-3835
FIRST AID MEASURES
CHEVRON Hydraulic Oil AW ISO 22 is not expected to cause prolonged or significant eye irritation, or skin irritation,
and is considered practically nontoxic to internal organs if swallowed. Prolonged or repeated breathing of petroleum
oil mist can cause respiratory irritation.
EYE:
No first aid procedures are required. However, as a precaution flush eyes with fresh water for 15 minutes. Remove
contact lenses if worn.
SKIN:
No first aid procedures are required. As a precaution, wash skin thoroughly with soap and water. Remove and wash
contaminated clothing.
INGESTION:
If swallowed, telephone for medical advice. DO NOT make person vomit. If medical advice cannot be obtained, take
the person and product container to the nearest medical emergency treatment center or hospital.
INHALATION:
If respiratory discomfort or irritation occurs, move the person to fresh air. See a doctor if discomfort or irritation
continues.
2
Page 7

Constant Velocity Tubes 012–06697B
MSDS: CITGO A/W Hydraulic Oil 46
To request a complete material safety data sheet (MSDS) you may either use the following contact information, or
request a copy directly from PASCO.
COMPANY IDENTIFICATION EMERGENCY TELEPHONE NUMBERS
CITGO Petroleum Corporation Technical Contact: (918) 495-5933
P.O. Box 3758 Medical Emergency: (918) 495-4700
Tulsa, Oklahoma 74102 CHEMTREC Emergency: (800) 424-9300
ACUTE EXPOSURE SYMPTOMS
CITGO A/W Hydraulic Oil 46 is generally of a low order of toxicity.
EYE:
This material may cause transient eye irritation.
SKIN:
This material may cause transient skin irritation.
INGESTION:
If swallowed, there is slight risk of aspiration to the lungs. Upon ingestion, gastrointestinal discomfort, diarrhea, and
headache may occur.
INHALATION:
In enclosed spaces or when hot, vapors may reach concentrations sufficient to cause drowsiness, dizziness, headaches,
nausea, or lung irritation. Elevated mist concentration well above applicable workplace exposure levels may cause
severe lung damage.
FIRST AID MEASURES
EYE:
Flush eyes with large volumes of fresh water. Seek medical attention if pain, excessive tearing or irritation persists.
SKIN:
Wash exposed skin with soap and water. Remove contaminated clothing. Launder before use. Seek medical attention
if tissue damage occurs or if irritation persists.
INGESTION:
Induce vomiting ONLY upon the advice of a physician. Seek medical attention immediately.
INHALATION:
Move victim to fresh air. If victim is not breathing, immediately begin cardiopulmonary resuscitation (CPR). If
breathing is difficult, 100 percent humidified oxygen should be given by a qualified individual. Seek medical attention
immediately.
3
Page 8

Constant Velocity Tubes 012–06697B
Pre-Lab Exercise: Graphing in the Lab
Purpose
T o help students develop graphing skills that will be needed to complete the activities
with the Constant Velocity Tubes
Background
Graphs are an effective way of presenting numerical data in a laboratory report, but that
is not their only use. Graphs can also be used to determine the mathematical relationship
between two variables. In the following graphing exercise, you will work with two
types of variables: an independent variable and a dependent variable. An independent
variable is the part of the experiment that you change in a measured, controlled way.
The dependent variable is the part of the experiment that changes as a result of the
changes in the independent variable.
This exercise will help you develop the graphing skills you will need in your experiments
with the Constant V elocity T ubes. Y ou will draw a graph of experimental data that were
previously collected.
In a previously conducted experiment, a measured volume of liquid mercury
(independent variable) was added to a glass beaker, and then the mass of the beaker and
mercury (dependent variable) was determined with a platform balance.
Procedure
1. In an experiment, there are generally several variables that might possibly affect
______________________________________________________________________________________________________________________________________________________________________________________________
_______________________________________________________________________________________________
2. For the first data point of this experiment, the beaker was filled to the 250 ml mark
the dependent variable. If we can arrange to allow only one of these to vary and
hold the others constant during the experiment, it is far easier to interpret the results.
Besides the volume of liquid, the kind of liquid is an example of a variable which
might possibly affect the mass reading; thus the kind of liquid used should not be
changed during the experiment. Can you think of any other variables that should
be held constant in this experiment?
with liquid mercury, and the mass reading from the pan balance was 3,600 g. Next,
the beaker was emptied and then filled to the 50 ml mark. The mass reading was
then 1000 g. Notice that these first two sets of data represent two extreme
possibilities. Why do you suppose such values were chosen?
________________________________________________________________________________________________________________________________________________________________________________________________
_______________________________________________________________________________________________________________________________________________________________________________________________
4
Page 9

Constant Velocity Tubes 012–06697B
3. It is useful to sketch a graph of the data as it is collected and examine the pattern as it forms.
Make a graph on the grid below using the data above, as follows:
a) Label the horizontal axis with the name of the independent variable (sometimes
called the “control” variable). Follow the name with the type of units of
measurement being used in parentheses ( ). In a similar manner, label the vertical
axis, which is used for the dependent variable.
b) Number the axes. Start numbering with zero at the origin (lower left corner).
➤ When numbering the axes, number the lines, not the spaces. Choose a
regular numbering system (e.g. by fives, tens, fifties, etc). Adopt a spacing
system that numbers every second, every fifth, or possibly every tenth line.
These choices make it easier to locate and plot data from metric system
measurements, as compared to systems involving numbering every three or
four lines. The numbering system chosen will depend on the largest
numbers that will need to be plotted.
c) Plot the data points. Make small, precise points. Then, because small points are hard
to find, make them more obvious by surrounding each point with a small circle,
triangle, or similar figure. These are called point protectors.
➤ If you feel uncertain about your work thus far, you should seek help
before proceeding.
➤ Drawing a graph as an experiment proceeds can help you to decide what
to do next. The two points plotted are just the beginning of a pattern.
Obtaining and plotting additional data points makes the pattern become
clearer.
5
Page 10

Constant Velocity Tubes 012–06697B
4. On the same graph, plot this additional data:
150 ml — 2,500 g and 100 ml — 1,600 g
5. Looking at your graph, what volume would you suggest be used next?
________________
6. Now plot this data pair: 200 ml — 1,300 g
➤ Plotting data on a graph helps reveal mistakes. If the graph is
made as the experiment is being done, the mistake can be corrected.
Later, it may be difficult or impossible to reconstruct the experiment
and correct the error.
7. Which of the data points on your graph represents a mistake? __________________
➤ It is not wise to immediately discard data that “looks wrong”.
Many important new discoveries in science “looked wrong” at first.
In this case, however, a simple mistake was made: the “1” and the
“3” in the last mass reading were transposed. The data pair should
have been: 200 ml — 3,100 g.
8. Correct the mistake noted.
9. By now a pattern should be clear. To make the pattern more visible, draw a best-fit
line (the line that most closely follows the pattern revealed by the data points).
Since the pattern seems to be straight, it is appropriate to use a straight edge to draw
the line. (A transparent plastic straight edge is particularly useful for this purpose.)
Extend the line all the way to the vertical axis.
➤ You may find that the points don’t quite fit on the line. This is
because all of our data include uncertainty. The uncertainty is due
to imperfections in the measuring tools, our inability to read these
tools perfectly, and perhaps the fact that other variables have varied
despite our attempts to keep them constant. The odds are that some
of the points are too high, and some are too low. Even though the
uncertainty in the data makes the locations of the data points slightly
in error, we can discover the pattern that represents the true
relationship between mass and volume. We assume that the truth is
that the pattern is a straight line, and that the points miss the line due
to errors.
➤ Computer programs, including built-in programs in some calculators and Science Workshop® can also draw a best-fit line. The
process is called curve-fitting. If we decide in advance that a straight
line is the appropriate pattern, the process is called linear
regression.
6
Page 11

Constant Velocity Tubes 012–06697B
➤ In algebra, a graph of this type is described by the equation y = mx + b, where:
y is the quantity on the vertical axis,
x is the quantity on the horizontal axis,
m is the slope, and
b is the y-intercept (also called the vertical intercept).
By replacing each of these abstract symbols with the actual items dealt with in the
experiment, the mathematical equation can be transformed into a physics equation.
10. In the space below write the equation that results when you replace the symbols y and x
with the actual physical units, mass and volume in the equation for a straight line,
y = mx + b:
11. In the space below, substitute y-intercept value (360 grams) for b in the equation (notice
that the dimensional units grams are part of the value):
12. It is unlikely that your graph shows a y-intercept of exactly 360 g. What is the value of the
y-intercept, according to your graph?
13. Calculate the slope, m, as follows:
The slope, m, is found from the formula slope = rise / run. The first step in finding slope
is to mark two points directly on your best-fit line. Label these points so they won’t be
confused with data points. The farther apart you place them, the more accurate your result
will be. Choosing points that are on one of the grid lines will also improve your accuracy .
a) Select two points on the best-fit line, and read their coordinates from your graph:
First Point: y
Second Point: y
-coordinate_____________ x1-coordinate______________
1
-coordinate_____________ x2-coordinate______________
2
Did you remember to record the units of measurement, as well as the number?
b) Calculate the rise and run from these coordinates.
rise (y2 - y1) = __________________ run (x2 - x1)= __________________
Did you remember to record the units of measurement, as well as the number?
7
Page 12

Constant Velocity Tubes 012–06697B
c) Now calculate the slope (don’t forget the units):
slope =
rise
run
=
y2– y
x2– x
1
=
1
➤ Your answer should be approximately 13.4 g/ml. You should not
expect to get exactly this answer.
d) Now substitute this value for slope (m) in the formula:
➤ This equation allows us to calculate the mass reading that would result
if some other volume of mercury were tried. Using algebra to solve for
volume, we can also obtain an equation that tells us what volume of mercury
to use to cause some particular mass reading.
14. Solve the equation for volume. Ask for help if you need it.
➤ The original equation would be much more useful if it could apply to
other substances besides mercury as well as containers other than the one
that was used in this experiment. Often, reasoning allows us to adapt an
equation to other purposes.
15. Look at your graph and see if you can express in words the meaning of the y-intercept. (Not
the mathematical meaning, but rather some aspect of the experiment that this value represents.
Hint: What is the volume, at the y-intercept?)
_________________________________________________________________________________
16. Does the value of the slope remind you of anything? How about the units? Hint: use a
reference to look up the physical properties of mercury. Keep in mind that the numerical
value we obtained by experiment will not be exact.
_________________________________________________________________________________
17. Finally, the mass reading from the pan balance might better be called gross mass, which is
the mass of both the container and the contents. The preceding ideas can be used to rewrite
the equation into a more generally useful form:
Gross Mass = Density of Contents * Volume of Contents + Mass of Container
8
Page 13

Constant Velocity Tubes 012–06697B
Experiment 1: Constant Velocity Motion and the Linear Graph
Purpose
The purpose of this experiment is to study a rising bubble and to develop a quantitative description
of its motion.
Theory
Under a given set of conditions, the motion of a rising bubble is highly repeatable. At the most
basic level, describing motion involves describing position as a function of time. In this
experiment, variables that might conceivably affect the bubble’s motion, such as tube angle
and temperature, are held constant. Position data are recorded for a variety of times.
Before position data can been meaningful, a reference frame must be defined. For convenience,
the initial position of a moving object is often chosen to be zero. Since the initial position of the
bubble is concealed in this experiment, it is not possible to determine the initial position.
Instead, the end of a tube is defined as position zero, simply because this is a convenient place
to measure from. Given that the bubble moves upward, it is most convenient to define positions
above the end of the tube to be positive.
When the position–time data points from one of the tubes are graphed, a clear pattern to the
data can be clearly seen. Plotting data from other tubes on the same graph produces similar
patterns, but with distinctive differences that may be related to the differences in the motion.
The patterns that emerge are of a type familiar to algebra students, and an equation for each can
readily be written.
Procedure
1. Obtain a tube which has one end wrapped in paper. Do not remove
2. W ork with a partner to practice timing the motion of the bubble as
➤ Follow your lab’s safety procedures, including wearing safety glasses.
the paper. Record the color of the fluid in the tube.
_____________________
follows:
a) Hold the tubing nearly horizontal, but with the wrapped
end slightly higher. Allow time for the bubble to travel as
far as it can under the paper wrapping (Figure 1) .
wrapped
end
b) Your partner should be watching the clock (or operating
the stopwatch). Choose a time interval that is long
Figure 1
9
Page 14

Constant Velocity Tubes 012–06697B
enough for the bubble to come into view, but short enough so that the bubble does
not reach the top of the tube. At a convenient
time your partner should say “start.”
c) Quickly rotate the tube into a vertical
position; the wrapped end should be
downward (Figure 2).
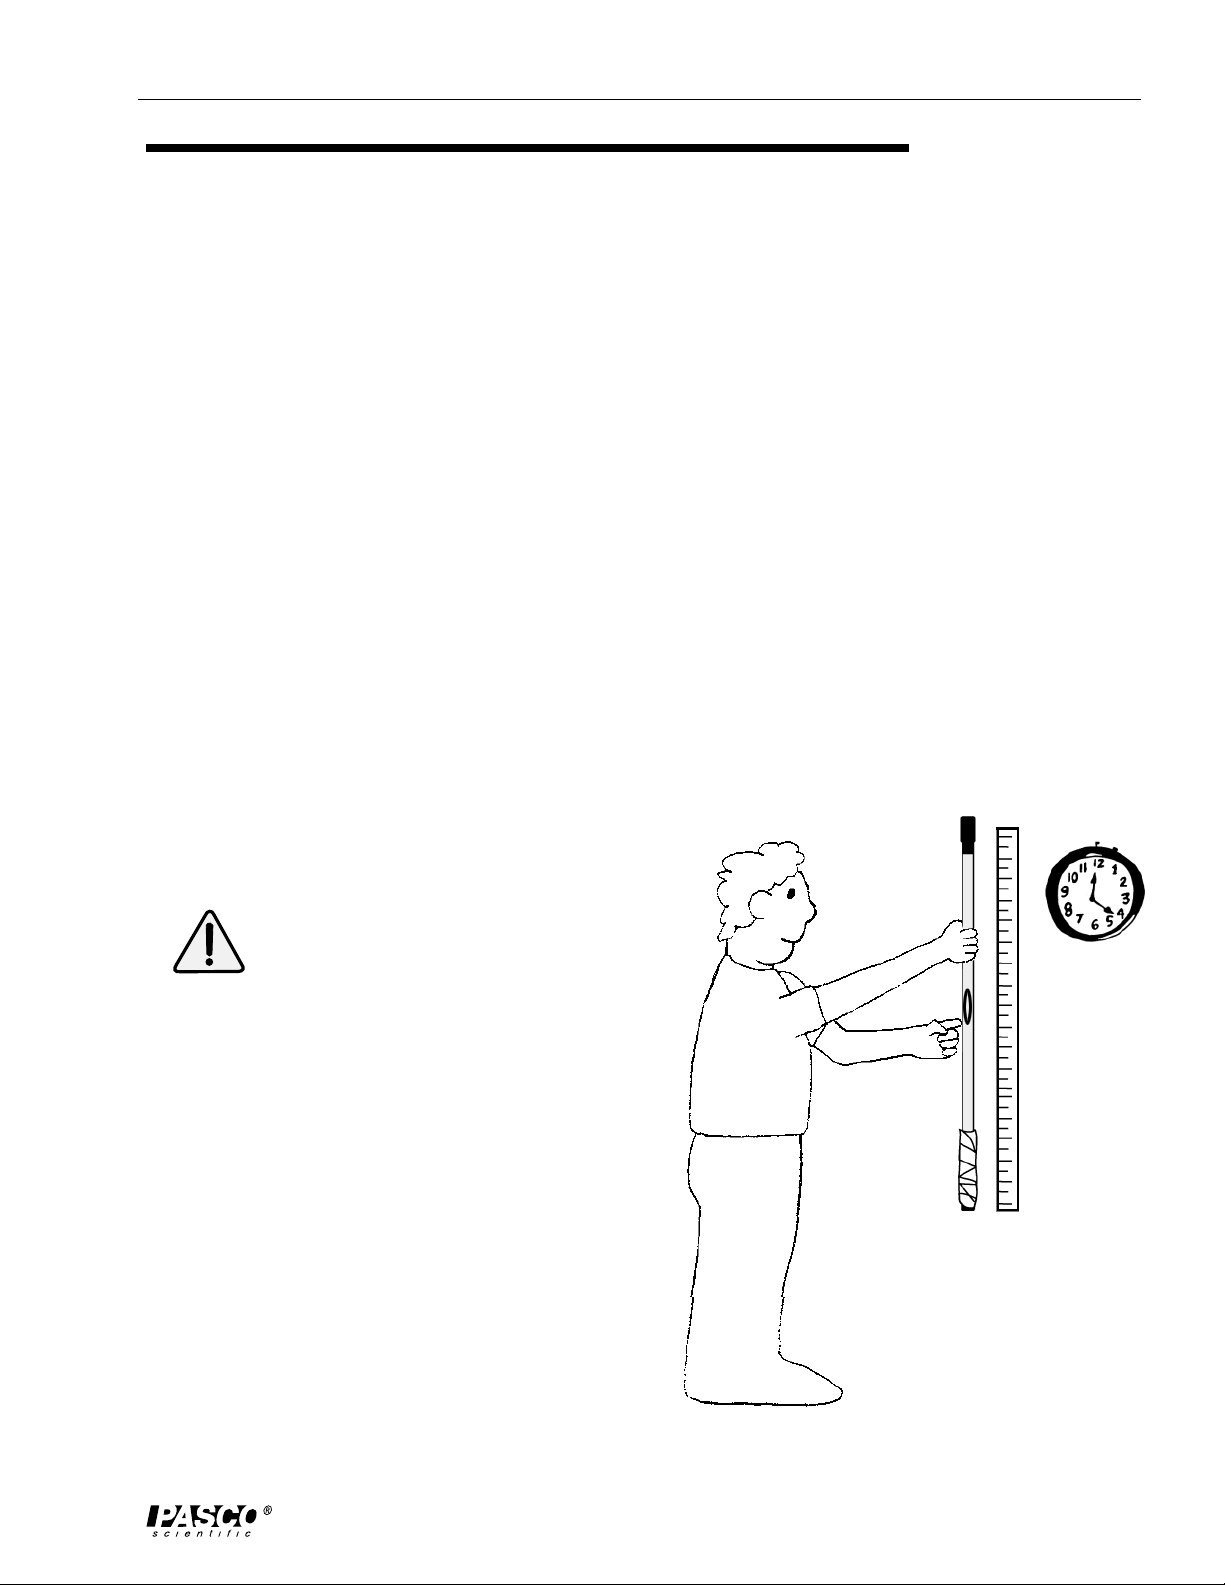
d) As a bubble comes into view, keep the index
finger of one hand pointing at the bottom of
the bubble as it rises. When your partner says
“Stop,” stop moving your finger and hold it
there to mark the position of the bottom of the
bubble (Figure 3).
e) Measure the distance from the bottom of the
tube to the point marked by your finger
(Figure 4).
wrapped
end
f) Record the time of travel and the bubble’s
position and plot the point on the graph.
3. Do the above for two different time intervals. Choose
one time interval that is short enough so that the
bottom of the bubble has just emerged from the paper
Figure 2
wrapping. Choose another time interval almost long
enough to permit the bubble to reach the top of the tube. Enter your data into the data table.
When your partner says
time, mark the position of
the bottom of the bubble
with your finger.
Measure the
distance (d ) from
your finger to the
bottom of the
tube.
d
Figure 3
10
Figure 4
4. Prepare a graph, and plot the two data points.
Page 15

Constant Velocity Tubes 012–06697B
5. Choose other lengths of time between these two extremes. Enter the data into the data
table. Plot the points as you go and examine the pattern as it forms. Choose additional
times to try based on missing parts of the pattern. Be on the lookout for obvious mistakes as
you plot the points. Do not rush to throw out any of your data, though.
6. Draw a best-fit line though your data. A straight line drawn with a ruler should do a good
job of representing the pattern of the data. If it does not, ask your instructor for advice.
➤ If time permits, improved accuracy can be obtained by repeating a time
more than once and plotting the average position for that length of time.
7. If necessary, extend your line until it meets the vertical axis. What is the value of the y-
intercept? ___________________ (Don’t forget units of measurement.)
8. What is the meaning of the y-intercept? (Not the mathematical meaning, but the meaning
in terms of the details of this experiment.)
______________________________________________________________________________________________________________________________________________________________________________________________
_______________________________________________________________________________________________
9. Unwrap the paper from the tube and examine the tube. Measure from the bottom of the
tube to the place where the bottom of the bubble started. (If the bubble started somewhere
under the black end cap, you may estimate its starting position at 1 cm.) Record this
measurement:
____________________
Replace the wrapping.
10. Compare your results for steps 7 and 9 above and comment:
______________________________________________________________________________________________________________________________________________________________________________________________
_______________________________________________________________________________________________
11. Some of the tubes in the set have bubbles that travel at essentially the same speed as the one
you just worked with. Others travel at a dramatically different speed. Choose a tube of a
different color, but with a speed that is essentially the same as the one you used before.
Take time and position data for this tube, and enter it into a new data table, but plot the
points on the same graph you used before. Draw a best-fit line for this data, too.
12. Compare the best-fit lines from the two tubes for similarities and differences. Try to explain
the reasons for them. Unwrap the paper from the second tube to verify your explanation.
Replace the wrapping.
______________________________________________________________________________________________________________________________________________________________________________________________
_______________________________________________________________________________________________
11
Page 16

Constant Velocity Tubes 012–06697B
13. Select a tube with a bubble that travels at a distinctly different speed. In this tube, does the
bubble move faster or slower than the previous two you tried?_______________ Take
position–time data for this tube and enter it into a new data table, but plot the points on the
same graph you used before. Draw a best-fit line for this data, too.
14. Compare this line to the other two lines. Try to explain the reasons for any similarities or
differences, including the different slope. Unwrap the paper from this third tube to verify
your explanation. Replace the wrapping.
______________________________________________________________________________________________________________________________________________________________________________________________
_______________________________________________________________________________________________
_______________________________________________________________________________________________
➤ The remainder of the analysis may be performed outside the lab.
15. For each of the three tubes you experimented with, calculate the slope of the best-fit line.
Fill in the blanks showing the results of your intermediate steps, as well. Don’t forget to
include units of measurement.
Color of tube:__________
First Point: y-coordinate _____________ x-coordinate ______________
Second Point: y-coordinate _____________ x-coordinate ______________
rise = __________________ run = ______________
slope = ______________________
Color of tube:__________
First Point: y-coordinate _____________ x-coordinate ______________
Second Point: y-coordinate _____________ x-coordinate ______________
rise = __________________ run = _____________
slope = ______________________
Color of tube:__________
First Point: y-coordinate _____________ x-coordinate ______________
Second Point: y-coordinate _____________ x-coordinate ______________
12
rise = __________________ run = ______________
slope = ______________________
Page 17

Constant Velocity Tubes 012–06697B
16. What arguments can you offer, based on this experiment, that the speed of the bubble is the
same as the slope of the position vs. time graph?
_____________________________________________________________________________________________________________________________________________________________________________________________
___________________________________________________________________
In algebra, a graph of the type seen in this experiment is described by the equation:
y = mx + b
where: y is the quantity on the vertical axis,
x is the quantity on the horizontal axis,
m is the slope, and
b is the y-intercept (also called the vertical intercept).
17. Write equations for each of the three tubes you experimented with by substituting into the
basic equation above the appropriate values for slope and y-intercept, as well as the names
of the variables that x and y represent.
Color:_________ Equation: ________________________________________
Color:_________ Equation: ________________________________________
Color:_________ Equation: ________________________________________
18. By replacing each of these abstract symbols with the actual items dealt with in the experiment,
the mathematical equation can be transformed into a basic equation of motion. Write a
basic equation for motion using the words position, time, velocity, and initial position.
______________________________________________________________________________________________________________________________________________________________________________________________
_______________________________________________________________________________________________
13
Page 18

Constant Velocity Tubes 012–06697B
Data T ables and Graph
Time (s) Position (cm)
Time (s) Position (cm)
14
Page 19

Constant Velocity Tubes 012–06697B
g
Teacher’s Notes
Pre-lab Exercise
Answers to questions
1. Other potential variables that should be held constant include the container (could be a
different mass), the pan balance used (might not be properly calibrated, or calibration methods
could be crude), two different methods of measuring the liquid (eg beaker vs. graduated
cylinder), or ambient temperature.
2. Plotting the extremes allows one to begin the graphing process with the assurance that all
data will fit on the graph and to more accurately guess the slope of the true line that represents
the relationship between the variables (assuming it is a linear relationship).
5. Answers will vary.
7. the 200 ml, 1300 g point
10. mass = m • volume + b
11. mass = m • volume + 360 g
12. Answers will vary around 360 g.
13. a) y
= 1640 g x1 = 100 ml
1
= 3675 g x2 = 250 ml
y
2
(Answers will vary somewhat.)
- y1 = 2035 g x2 - x1 = 150 ml
b) y
2
(Answers will vary somewhat.)
c) 13.6 g/ml
(Answers will vary somewhat.)
d) mass (g) = 13.6 g/ml • volume (ml) + 360 g
14.
volume (ml) =
mass (g) – 360 g
13.6
/ml
4000
3000
mass (g)
2000
1000
50
100
corrected
data point
150
volume (ml)
best-fit line
mistaken
data point
200
Graph of Plotted Data
250
15. The y-intercept equals the mass of the beaker.
16. The slope represents the density of the liquid mercury. The accepted value for the density
of mercury is 13.5 g/ml (room temperature) or 13.6 g/ml at 0 °C.
15
Page 20

Constant Velocity Tubes 012–06697B
Experiment 1
➤ To preserve the discovery aspect of the lab, you will need to cover
the ends of the tubes with paper before the lab starts. A sheet of notebook
paper secured with rubber bands and masking tape works well. Scotch (or
cellophane) tape is very difficult to remove from the tubes.
7. Red or violet tube: 1 cm
Orange or blue tube: 9 cm
Yellow or green tube: 16 cm
8. The y-intercept is the position of the bubble at time = 0; more simply, it is the initial
position of the bubble.
9. The measurement should be approximately the same value as the value at the y-intercept.
10. The answers to 7 and 9 should be approximately the same.
11.
80
70
60
50
40
30
20
10
16
18
2468101214
ELAPSED TIME (SECONDS)
16
12. The result should be two parallel lines having the same slope but different y-intercepts.
The difference in y-intercepts is due to the different initial positions.
13. See graph above.
Page 21

Constant Velocity Tubes 012–06697B
14. A greater slope corresponds to a greater speed.
15. The slopes (speeds) will vary depending on room temperature. Typical values might be:
red, orange, yellow tubes: 5.4 cm/s
green, blue, violet tubes: 3.8 cm/s
16. a) Greater slope corresponds to greater speed.
b) The dimensional units of the slope are appropriate for speed (velocity).
c) The rise is the change in position during a time interval, and the run is the elapsed
time during that time interval. Rise divided by run equals the average speed
(velocity).
17. for example, green: position = 3.8 cm/s • time + 16 cm
18. position = velocity • time + initial position
17
Page 22

Constant Velocity Tubes 012–06697B
18
Page 23

Technical Support
Feedback
If you have any comments about the product or manual,
please let us know. If you have any suggestions on
alternate experiments or find a problem in the manual,
please tell us. PASCO appreciates any customer
feedback. Your input helps us evaluate and improve our
product.
To Reach PASCO
For technical support, call us at 1-800-772-8700
(toll-free within the U.S.) or (916) 786-3800.
fax: (916) 786-3292
e-mail: techsupp@pasco.com
web: www.pasco.com
Contacting Technical Support
Before you call the PASCO Technical Support staff, it
would be helpful to prepare the following information:
➤ If your problem is with the PASCO apparatus, note:
- Title and model number (usually listed on the
label);
- Approximate age of apparatus;
- A detailed description of the problem/sequence of
events (in case you can’t call PASCO right away, you
won’t lose valuable data);
- If possible, have the apparatus within reach when
calling to facilitate description of individual parts.
➤ If your problem relates to the instruction manual,
note:
- Part number and revision (listed by month and year
on the front cover);
- Have the manual at hand to discuss your
questions.
Page 24

 Loading...