

Page 1
Instruction Manual and
Experiment Guide for
the PASCO scientific
Model ME-9430
Dynamics Cart with Mass
012-04840E
Page 2

Page 3

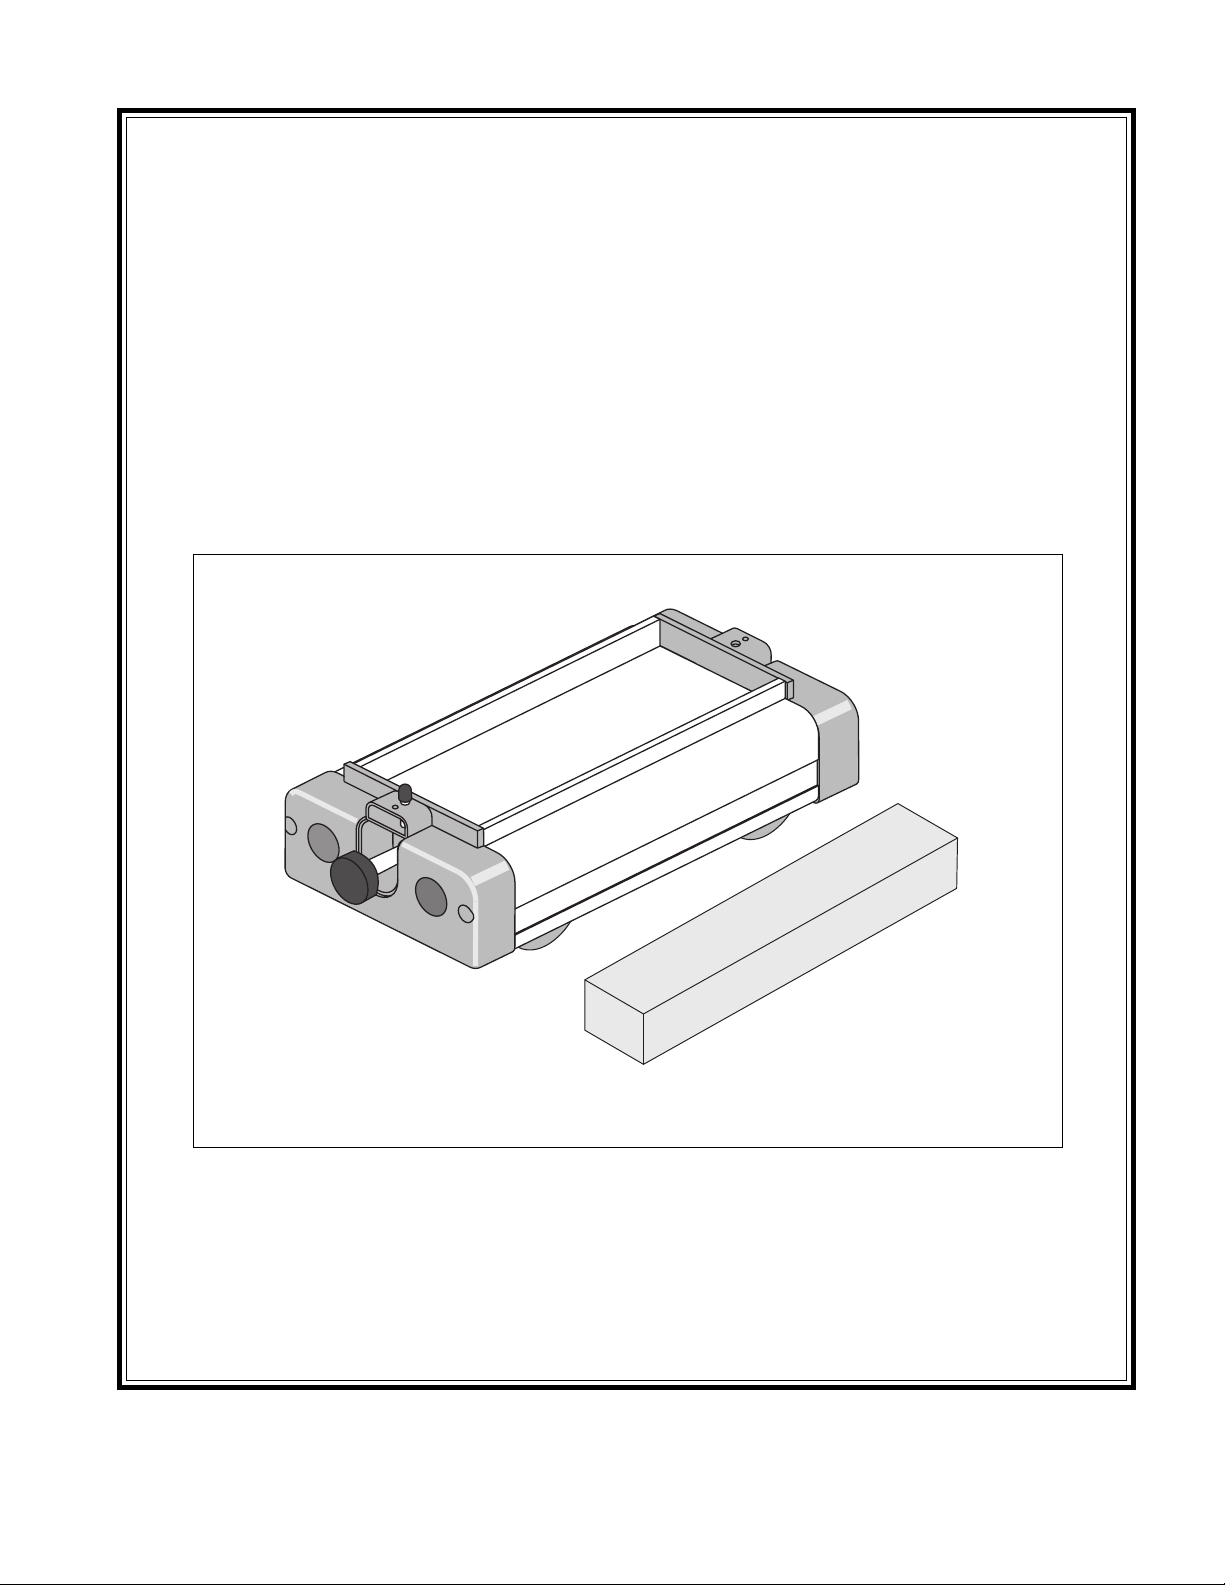
Dynamics Cart
012-04840E
Copyright, Warranty and Equipment Return
Please—Feel free to duplicate this manual
subject to the copyright restrictions below.
Copyright Notice
The PASCO scientific Model ME-9430 Dynamics Cart
with Mass Manual is copyrighted and all rights reserved.
However, permission is granted to non-profit educational
institutions for reproduction of any part of this manual,
providing the reproductions are used only for their
laboratories and are not sold for profit. Reproduction
under any other circumstances, without the written
consent of PASCO scientific, is prohibited.
Limited Warranty
PASCO scientific warrants this product to be free from
defects in materials and workmanship for a period of one
year from the date of shipment to the customer. PASCO
will repair or replace, at its option, any part of the product
which is deemed to be defective in material or workmanship. This warranty does not cover damage to the product
caused by abuse or improper use. Determination of
whether a product failure is the result of a manufacturing
defect or improper use by the customer shall be made
solely by PASCO scientific. Responsibility for the return
of equipment for warranty repair belongs to the customer.
Equipment must be properly packed to prevent damage
and shipped postage or freight prepaid. (Damage caused
by improper packing of the equipment for return shipment
will not be covered by the warranty.) Shipping costs for
returning the equipment, after repair, will be paid by
PASCO scientific.
Equipment Return
If this product requires return to PASCO scientific, for
whatever reason, notify PASCO scientific by letter or
phone BEFORE returning the product. Upon notification,
the return authorization and shipping instructions will be
promptly issued.
NOTE: NO EQUIPMENT WILL BE ACCEPTED
FOR RETURN WITHOUT AN AUTHORIZATION.
When returning equipment for repair, the units must be
properly packed. Carriers will not accept responsibility
for damage caused by improper packing. To be certain
the unit will not be damaged in shipment, observe the
following rules:
1. The carton must be strong enough for the item
shipped.
2. Make certain there is at least two inches of packing
material between any point on the apparatus and the
inside walls of the carton.
3. Make certain that the packing material can not shift in
the box, or become compressed, thus letting the instrument come in contact with the edge of the box.
Address: PASCO scientific
10101 Foothills Blvd.
Credits
This manual authored by: Scott K. Perry
This manual edited by: Dave Griffith
Roseville, CA 95678-9011
Phone: (916) 786-3800
FAX: (916) 786-3292
Email: techsupp@pasco.com
Web: www.pasco.com
i
®
Page 4

012-04840E
Dynamics Cart
Table of Contents
Section Page
Copyright, Warranty, Equipment Return, and Credits . . . . . . . . . . . . . . . . . . i
Introduction . . . . . . . . . . . . . . . . . . . . . . . . . . . . . . . . . . . . . . . . . . . . . . . . . . 1
Equipment . . . . . . . . . . . . . . . . . . . . . . . . . . . . . . . . . . . . . . . . . . . . . . . . . . . 1
Experiment 1: Kinematics (Average vs. Instantaneous Velocities) . . . . . . . 3
Experiment 2: Coefficient of Friction . . . . . . . . . . . . . . . . . . . . . . . . . . . . . . 5
Experiment 3: Newton's Second Law (Predicting Accelerations) . . . . . . . . 7
Experiment 4: Cart Calibration (Measuring the Spring Constant) . . . . . . . 11
Experiment 5: Rackets, Bats and "Sweet Spots" . . . . . . . . . . . . . . . . . . . . . 15
Experiment 6: Sliding Friction and Conservation of Energy . . . . . . . . . . . 19
Appendix (Replacing Parts) . . . . . . . . . . . . . . . . . . . . . . . . . . . . . . . . . . . . . 23
®
ii
Page 5
012-04840E
Dynamics Cart
Introduction
The PASCO Model ME-9430 Dynamics Cart with
Mass performs high quality motion experiments
through its low-friction design.
The PASCO Dynamics Cart has several excellent
features:
• An extremely low friction ball-bearing design provides smooth motion.
• A built-in spring plunger, activated by a convenient trigger (button) located on the front end cap,
with three positions of launching amplitude, enables the cart to be launched without using additional apparatus.
• A unique suspension system allows the wheels to
collapse inside the body of the cart to prevent
damage to the internal components of the cart
caused by being dropped or other misuse (such as
the cart being used as a roller skate).
• Rugged construction on the cart-body and endcaps prevents damage to the cart and the environment during high-impact situations.
• Convenient holes located at the top of the end cap
on each end of the Dynamics Cart facilitate the
use of string, springs, etc..
• Hook and loop fasteners on the front of each Dynamics Cart enable the user to perform inelastic
collision experiments without using additional apparatus.
• The mass of the Dynamics Cart is approximately
500g. The additional mass also has an approximate mass of 500g.
NOTE: For best results, measure the mass of the
cart and mass bar with an accurate balance or
scale.
• Other features include: rounded corners on molded
plastic end caps for durability, a tray on top of the
cart for application of additional mass, and the
ability of the carts to be stacked.
While performing experiments, you may find that you
get better results by making the surface over which the
cart rolls more uniform and clean. One way that this
can be achieved is by taping a long piece of butcher
paper to the surface on which the cart rolls.
The spring plunger of the Dynamics Cart has three
cocking positions. Determine the one that gives you a
range that fits your situation best, taking into account
the limitations of space. Most experiments require a
range of at least 2 meters or more. To cock the spring
plunger, push the plunger in, and then push the plunger
upward slightly to allow one of the notches on the
plunger bar to “catch” on the edge of the small metal
bar at the top of the hole.
Practice launching the Dynamics Cart by placing the
cart on the floor with its cocked plunger against a wall
or a secured brick.
NOTE:
1. Before performing experiments with the Dynamics Cart and Mass, they should be calibrated to insure accurate results from your experiments. It is suggested to perform Experiment #2 before Experiment #5 and #4 before
#6.
2. To ensure that you do not give the cart an initial velocity, other than that supplied by the
spring plunger, release the trigger by tapping
it with a rod or stick using a flat edge.
3. Rolling distance can be shortened by adding
more mass to the cart.
4. For even less friction use, 1/4 inch plate glass
as surface for the Dynamics Cart.
®
1
Page 6
Dynamics Cart
012-04840E
Equipment
The ME-9430 Dynamics Cart with Mass includes
the following:
• (1) Dynamics Cart
• (1) 500g Mass
• Instruction Manual/Experiments Guide
Additional Equipment Required:
• A spool of thread
• Masses, such as PASCO's Slotted Mass Set (SE-
8704)
• A pulley and clamp, such as PASCO's Super Pulley with Clamp (ME-9448) or Super Pulley (ME-
9450) used with Model ME-9376A Universal
Table Clamp and Model SA-9242 Pulley Mounting Rod
• Metric Ruler, such as PASCO's Metric Measuring
Tape (SE-8712) and 30cm/12in. Ruler (SE-8731)
• Stopwatch, such as PASCO's Digital Stopwatch
(SE-8702)
• Mass balance, such as PASCO's Triple-Beam Balance (SE-8723)
• A friction block that can fit in the cart's accessory
tray (i.e. PASCO part number 003-04708)
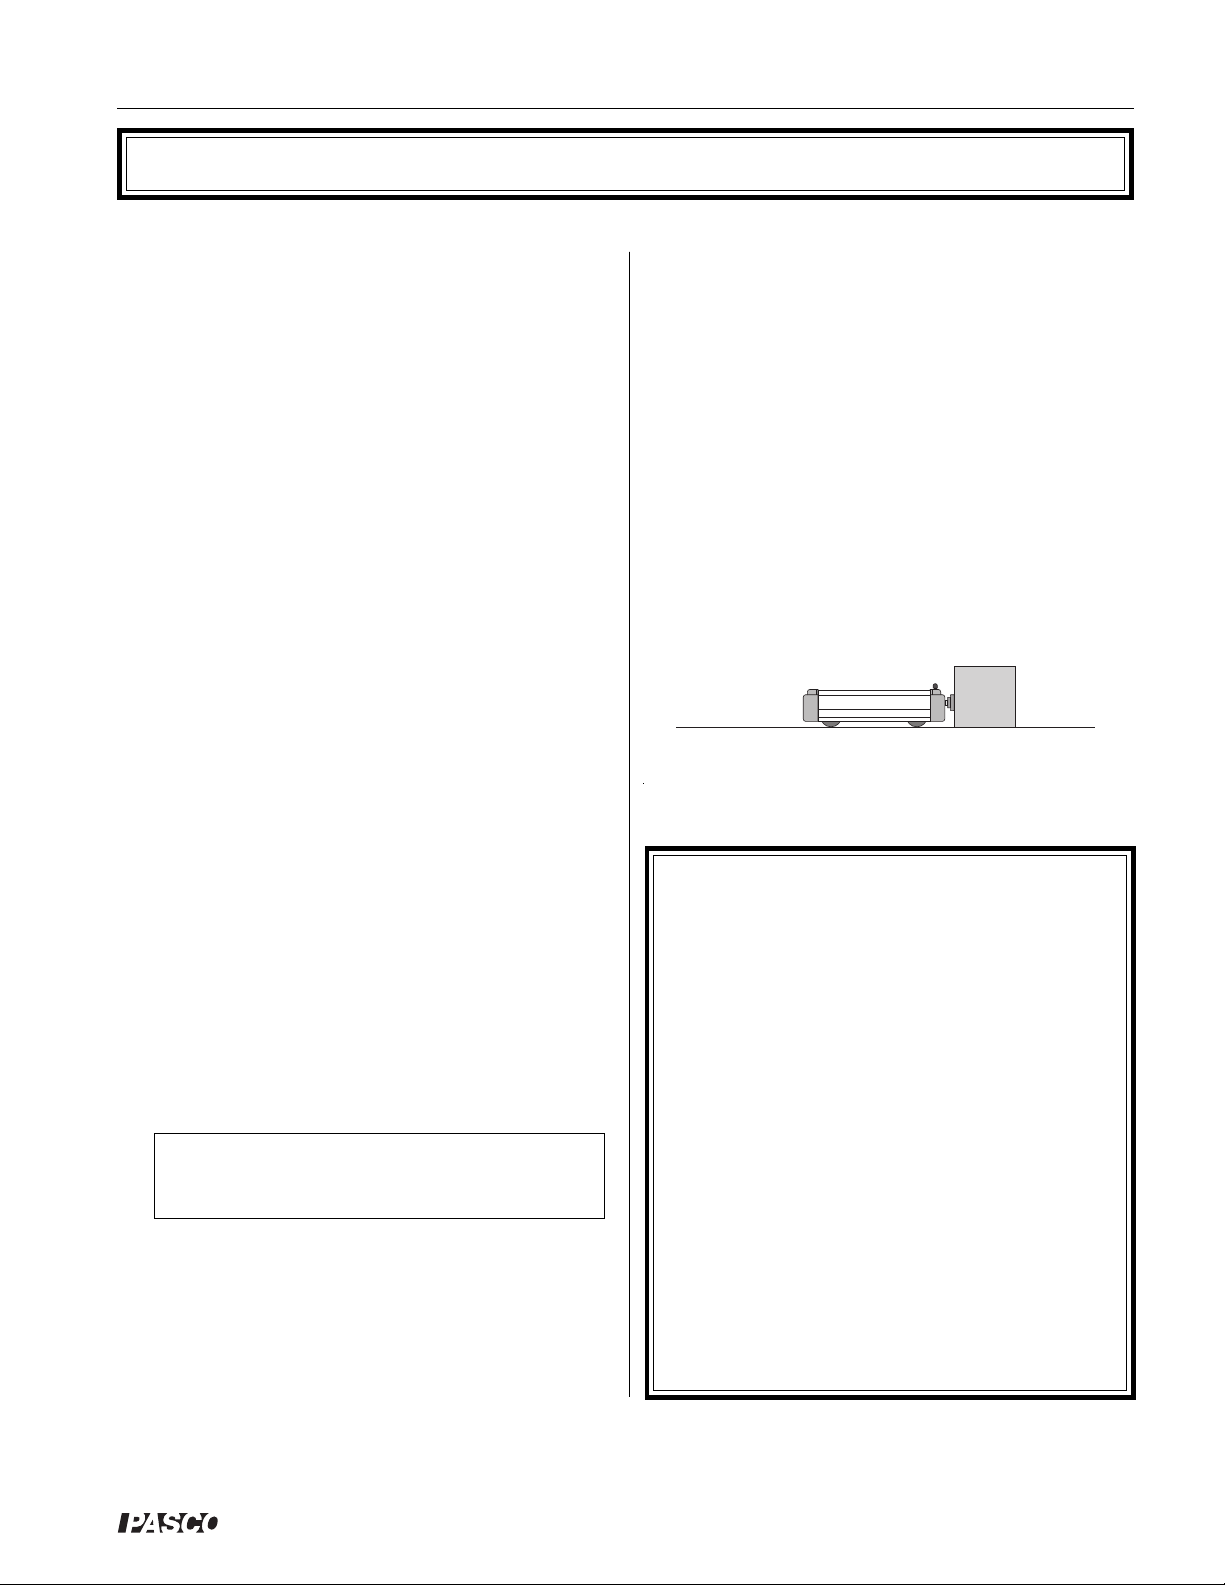
Dynamics Cart
(500 g ± 20 g)
Plunger Bar
Knob
Plunger Bar
Release
Plunger Bar
Accessory
Tray
Additional Mass
(500 g ± 20 g)
2
®
Page 7

012-04840E
Dynamics Cart
Experiment 1: Kinematics
(Average vs. Instantaneous Velocities)
EQUIPMENT NEEDED:
– Dynamics Cart (ME-9430)
– Metric tape (SE-8712)
– Stopwatch (SE-8702)
Purpose
In this lab, the Dynamics Cart will be used to investigate one dimensional accelerated
motion. You will launch the cart over the floor using the built-in spring plunger. The cart
will “decelerate” over the floor under the combined action of rolling friction and floor slope.
You will be able to establish whether or not the acceleration of the cart is constant. This will
be done by initially assuming a constant acceleration and then by examining the results to
see if they are consistent with this assumption.
Theory
The cart will be allowed to roll to a stop. The distance covered, D, and the total elapsed
time, T, from launch to stop will be measured and recorded. The average velocity over this
interval is given by:
If the acceleration of the cart is constant as it rolls to a stop over the floor, then the initial
instantaneous velocity of the cart at the final moment of launch is given by:
And the value of the acceleration would be given by:
D
v
= (EQN–1)
av
T
v
= 2vav = (EQN–2)
0
2D
T
Figure 1.1
v
If the acceleration and v
∆
a = = = – (EQN–3)
∆
are known, then the time, t1, required to cover the distance (d) to
o
t
0 – v
T
0
2D
T
2
some intermediate point (i.e. short of the final stopping point!) can be calculated by applying
the quadratic formula to:
2
1
(EQN–4)
Calculated values of t
d = v
will be compared with directly measured values. The extent to which
1
+ 1/2at
0t1
the calculated values agree with the directly measured values is an indication of the constancy of the acceleration of the cart.
Note your theoretical values in Table 1.1.
®
3
Page 8

Dynamics Cart
Procedure
1. Once you have roughly determined the range of the cart, clearly mark a distance, d, that is
about half way out from the start. Measure this distance and record it at the top of Table 1.1.
012-04840E
2. Using a stopwatch with a lap timer and metric tape, you can determine t
, T and D for each
1
launch. Practice this step a few times before you start recording data.
NOTE: To eliminate reaction time errors, have the person who launches the cart also be the
timer!
3. Launch the cart and record the data described in the previous step for six trials. To cock the
spring plunger, push the plunger in, and then push the plunger slightly upward to allow one of
the notches on the plunger bar to “catch” on the edge of the small metal bar at the top of the
hole. (NOTE: If the timer feels that a distraction interfered with the measurement, don't count
that trial.) Record your best trials in Table 1.1.
4. Using the equations described in the Theory section and the data recorded in the table, do the
calculations needed to complete the table.
Data Analysis
d = _______cm
Table 1.1
Trial
Experiment
t1 (sec) T (sec) D (cm)
vo (cm/s)
a (cm/s2)
Theory
t1 (sec)
1
% Diff.
2
3
4
5
6
Questions
1. Is there a systematic difference between the experimental and calculated values of t1? If so,
suggest possible factors that would account for this difference.
2. Can you think of a simple follow-up experiment that would allow you to determine how much
the cart’s “deceleration” was affected by floor slope?
4
®
Page 9
012-04840E
EQUIPMENT NEEDED:
– Dynamics Cart (ME-9430)
– Metric tape (SE-8712)
– Stopwatch (SE-8702)
Purpose
In this lab, the Dynamics Cart will be launched over the floor using the on-board spring
launcher. The cart will “decelerate” over the floor under the combined action of rolling
friction and the average floor slope. To determine both the coefficient of rolling friction µ
and θ, the small angle at which the floor is inclined, two separate experiments must be done.
(Recall that to determine the value of two unknowns, you must have two equations.)
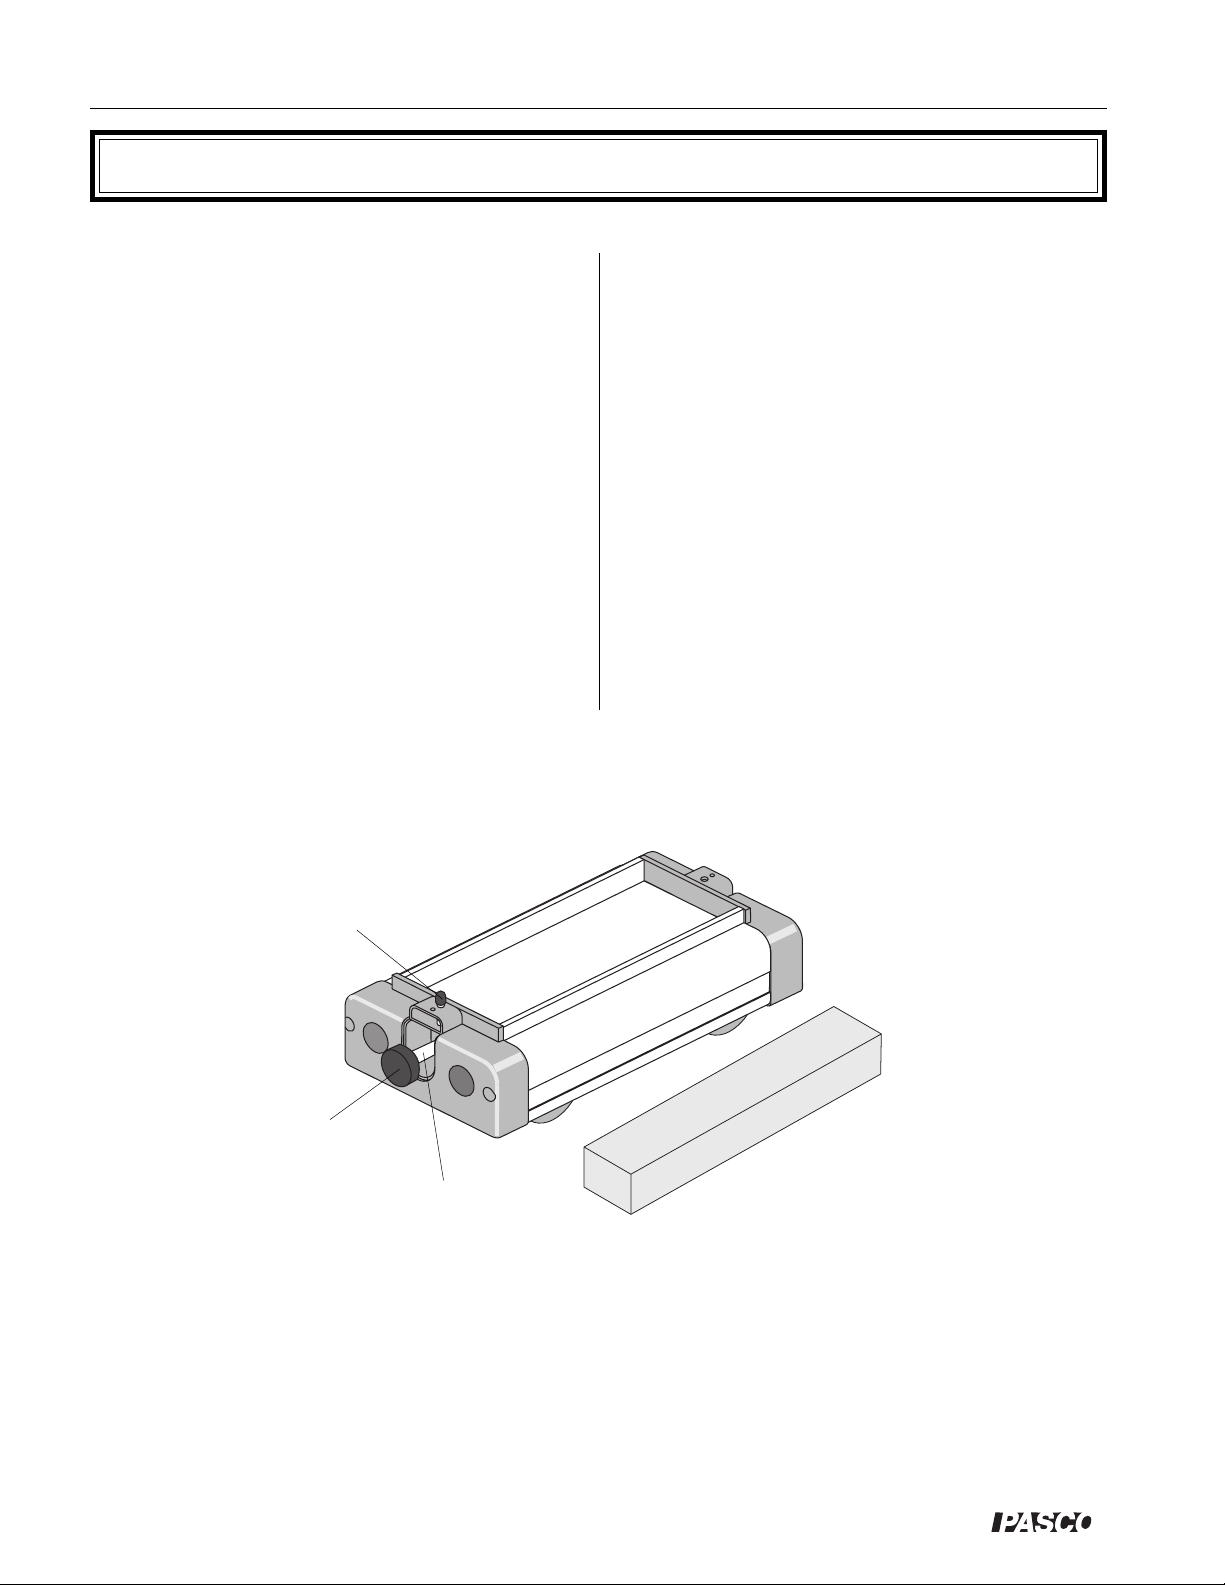
Dynamics Cart
Experiment 2: Coefficient of Friction
r
Theory
UPSLOPE
Figure 2.1
DOWNSLOPE
The cart will be launched several times in one direction, and then it will be launched several
times along the same course, but in the opposite direction. For example, if the first few runs
are toward the east, then the next few runs will be toward the west (See Figure 2.1). In the
direction which is slightly down-slope, the acceleration of the cart is given by:
a1 = + gsinθ – µrg (EQN-1) (since cosθ = 1)
And the acceleration in the direction that is slightly up-slope will be:
a
= – gsinθ – µrg (EQN-2)
2
Numerical values for these accelerations can be determined by measuring both the distance
d that the cart rolls before stopping and the corresponding time t. Given these values, the
acceleration can be determined from:
2d
a = (EQN-3)
2
t
Having obtained numerical values for a1 and a2, EQN-1 and EQN-2 can be solved
simultaneously for µr and θ.
®
5
Page 10

Dynamics Cart
Procedure
1. Place the cart in its starting position and then launch it. To cock the spring plunger, push the
plunger in, and then push the plunger upward slightly to allow one of the notches on the
plunger bar to “catch” on the edge of the small metal bar at the top of the hole. Using a
stopwatch and metric tape, determine the range d and the total time spent rolling t. Record
these in Table 2.1.
2. Repeat step 1 six times for each direction and enter your results in Table 2.1.
3. Using EQN-3, compute the accelerations corresponding to your data and an average accel-
eration for each of the two directions.
012-04840E
4. Using the results of step 3, determine µ
ically.
First Direction
Trial
d (cm) t (sec)
a ( )
1
2
3
4
5
6
and θ by solving for the two unknowns algebra-
r
Table 2.1
Second Direction
cm
s
2
Trial
d (cm) t (sec)
1
2
3
4
5
6
cm
a ( )
2
s
Average Acceleration = __________
cm
s
2
Average Acceleration = __________
Data Analysis
Coefficient of rolling friction = ________________ Floor Angle = ________________
Questions
1. Can you think of another way to determine the acceleration of the cart? If you have time try
it!
2. How large is the effect of floor slope compared to that of rolling friction?
6
cm
s
2
®
Page 11

012-04840E
Experiment 3: Newton's Second Law
(Predicting Accelerations)
EQUIPMENT NEEDED:
– Dynamics Cart (ME-9430)
– Pulley and pulley clamp (ME-9448)
– Mass set (SE-8704)
– Stopwatch (SE-8702)
– String
– Paper clips
– Block (to act as bumper)
Bumper block
Dynamics Cart
Trigger
Figure 3.1
– Balance (SE-8723 or equiv.)
Purpose
In this lab, a small mass m will be connected to the Dynamics Cart by a string as shown in
Figure 3.1. The string will pass over a pulley at the table’s edge so that as the mass falls the
cart will be accelerated over the table’s surface. As long as the string is not too elastic and there
is no slack in it, both the falling mass and the Dynamics Cart will have the same acceleration.
The resulting acceleration of this system will be determined experimentally, and this value will
be compared to the acceleration predicted by Newton’s Second Law.
Theory
The cart will be released from rest and allowed to accelerate over a distance d. Using a stopwatch, you will determine how long it takes, on average, for the cart to move through the
distance d. An experimental value for the cart’s acceleration a can be determined from:
Assuming that the tabletop is truly horizontal (i.e. level), Newton’s Second Law ( F = ma)
predicts that the acceleration of this system will be:
Procedure
1
2
d = at
which leads to: a = (Experimental Value)
2
F
a = or
M
TOTAL
net
Paper clips
2d
2
t
M
m
TOTAL
a = ( ) g (Theoretical Value)
1. Set up the pulley, cart, and a bumper of some sort to prevent the cart from hitting the pulley at
the end of its run. Add the following masses to the bed of the cart: 10 g, 50 g, 500 g and two 20
gram masses.
2. Carefully level the table until the cart has no particular tendency to drift or accelerate in either
direction along its run.
3. Put a loop in one end of the string and place this loop over the spring-release trigger on the
®
7
Page 12

Dynamics Cart
Dynamics Cart. Drape the string over the pulley. Adjust the pulley so the string is level.
4. Adjust the length of the string so that the longest arrangement of masses that you intend to
use will not hit the floor before the cart has reached the end of its run. Put a loop in this end
of the string.
NOTE: The cart’s acceleration falls to zero when the falling mass hits the floor.
5. Hang enough paper clips onto the dangling loop in the string until the cart will just continue
to move without apparent acceleration when barely nudged. This small added mass will
compensate for friction in the system and will be ignored in the following calculations. The
paper clips will remain attached to the loop throughout the experiment!
6. Move a 10 gram mass from the bed of the cart to the hanging loop, and pull the cart back to
a clearly marked starting point. Determine the distance d that the cart will move from the
starting point to the bumper block and record this distance at the top of Table 3.1.
NOTE: The total mass of the system will remain constant throughout the experiment.
7. Practice releasing the cart, being careful not to give it any push or pull as you do so. The
best way to do this is to press your finger into the table in front of the cart, thereby blocking
its movement. Quickly pull your finger away in the direction that the cart wants to move. At
the instant you pull your finger away, start your stopwatch. Stop your stopwatch at the
instant the cart arrives at the bumper. To eliminate reaction time errors, have the person who
releases the cart also do the timing!
012-04840E
8. Determine the average time for the cart to move through the distance (d) having been
released from rest. Record the average of the four time trials in which you have the most
confidence in Table 3.1. Repeat for all of the masses given in the data table.
9. Excluding the pulley, determine the total mass of your system, M
(cart, added masses,
Total
string) and record at the top of Table 3.1. (It will be close to 1100 grams, but you might
want to check it on a balance.)
10. Fill in the table using your data and the equations given in the Theory section.
8
®
Page 13

012-04840E
Data Analysis
Dynamics Cart
Trial
1
2
3
4
5
6
7
8
d = __________ cm M
m (grams)
Average time
(sec.)
10
20
30
40
50
60
70
80
TOTAL
Table 3.1
= __________ grams
cm
a
exp
2
s
a
Th
cm
s
2
% Diff.
Questions
1. Can you think of any systematic errors that would effect your results? Explain how each would
skew your results.
®
9
Page 14

Dynamics Cart
012-04840E
Notes:
10
®
Page 15

012-04840E
EQUIPMENT NEEDED:
– Dynamics Cart (ME-9430) – 500 g mass
– Mass set (SE-8704) – Stopwatch (SE-8702)
– Pan for holding masses – 15 cm/6 in ruler (SE-8730)
– Balance (SE-8723 or equiv.)
Purpose
The Dynamics Cart has a spring plunger, which can be used to produce relatively elastic
collisions and provide a reproducible launch velocity.
Theory
For this and following experiments, you will find the spring constant k of the cart’s spring plunger.
As compressional forces F are applied to the spring, the spring will compress a distance x which is
measured with respect to its uncompressed equilibrium position. If F vs. x is plotted on graph paper,
the spring constant is given by the slope of the graph as:
Once k is known, you can predict the launch velocity v
elastic potential energy stored in the spring is converted into kinetic energy at the time of launch. The
launch velocity can be found from:
which leads to:
This predicted launch velocity can be checked experimentally by measuring the total rolling distance
d on a horizontal surface and the corresponding time t for given launch conditions. This leads to:
(Here it is assumed that the acceleration of the cart is constant, so that the initial velocity of the cart
at the moment of launch is twice the average velocity of the cart over its whole run.
Experiment 4: Cart Calibration
(Measuring the Spring Constant)
k = ∆F/∆x (EQN-1)
by using conservation of energy, since the
o
1
mv
2
1
2
= kx
0
vo = x
vo = 2 (EQN-4)
2
(EQN-2)
0
2
k
(EQN-3)
m
o
d
t
Dynamics Cart
Total added mass
®
Note the initial position
15 cm ruler attached to
1
of the plunger.
cart
Pan for holding masses
2
Figure 4.1
11
1/2 total added mass
Spring plunger
Note the final
position of the end
of the plunger.
3
Page 16

Dynamics Cart
Procedure
1. Stand the Dynamics Cart on its end so that the spring plunger is aimed up, as shown in
Figure 4.1. Using masking tape or rubber bands, fix a ruler to the cart and adjust it so that
the 0 cm mark on the ruler lines up with the upper surface of the plunger. Take care to avoid
parallax errors!
2. Carefully add enough mass to the top of the plunger so that it is nearly fully depressed.
Record this mass and the corresponding compression x (initial position) of the spring in
Table 4.1.
3. Remove approximately one quarter of the mass used in step 2. Record the new mass and x
values in Table 4.1.
4. Repeat step 3 until no mass remains on the plunger.
5. Plot a graph of F versus x using your data and determine the slope of the best line through
your data points. This slope is the spring constant for your cart. Show your slope calculations on the graph and record k below.
6. Determine the mass of the cart using a mass balance and record this value below.
012-04840E
7. Using EQN-3 and your values for m, x
predict the launch velocity of your cart and record this below.
8. Cock the spring plunger to the value of x
starting position and launch it. Using a stopwatch and a meter stick, determine the average
range d and the average total time spent rolling t. Record these below.
NOTE: To avoid reaction time errors, the person who launches the cart should also time
the cart’s motion.
9.Using EQN-4, determine the observed value of v
Data and Analysis
Mass of cart = _________ kg
k = ________ x
Predicted value of launch velocity v
(i.e. the compression of the cocked spring) and k,
o
that you have chosen; then place the cart in its
o
and compare it with the predicted value.
o
N
m
= ________ m
o
= __________
o
m
s
Average d = _________ m Average t = __________ sec
Observed value of the launch velocity v
= __________
o
Percent (%) difference between observed and expected values of v
12
m
s
= __________
o
®
Page 17

012-04840E
Dynamics Cart
Table 4.1
Trial
1
2
3
4
5
6
7
8
m (kg)
F (= mg)
(newtons)
x (meters)
®
13
Page 18

Dynamics Cart
012-04840E
Notes:
14
®
Page 19

012-04840E
y
x
Experiment 5: Rackets, Bats and "Sweet Spots"
EQUIPMENT NEEDED:
– Dynamics Cart (ME-9430) – Mass set (SE-8704)
– Metric tape (SE-8712) – Meter stick or a long rod
– Long horizontal table or board (3/4” x 1’ x 8’)
Purpose
When a batter or tennis player strikes a ball, a portion of the rotational kinetic energy of the bat
or racket is transferred to the ball. In a somewhat oversimplified picture, the motion of the bat
or racket can be thought of as a simple rotation about a pivot, which is located near its end and
close to the batter’s wrists. The portion of the bat’s original kinetic energy that is transferred to
the ball depends on the distance y between the point of impact and the pivot point. The position
on the bat corresponding to the maximum energy transfer is called a “sweet-spot.” We will call
this maximum energy the sweet-spot (SS1).
NOTE: For simplicity, it is assumed that the collisions
are perfectly elastic.
Pivot point
Dynamics Cart
Theory
As any batter can tell you; if you hit the ball at a certain
point on the bat, there will be no shock, or impulse,
transferred to your hands! This “sweet-spot” is generally located at a different position than SS1 and is called
the “percussion point.” We will call this zero-impulse
sweet-spot SS2. For a given “bat” and pivot, the
position of SS2 can be found from:
y
SS2
I
= (EQN-1)
my
cm
Figure 5.1
where I is the rotational inertia of the bat for the corresponding pivot, m is the total mass of the
bat, and y
is the distance from the pivot to the center of mass of the bat. (e.g. If a uniform
cm
rod of length L is pivoted about an end-point, SS2 is located at 0.67L from the pivot.)
The positions of both SS1 and SS2 can be found theoretically, or by using the Sweet-Spot
computer program (see page 18 for details). The position of SS2 can be found experimentally
using the PASCO Force Transducer or, roughly, by actually hitting a ball at a variety of
positions on the bat and noting where the least shock to your wrists occurs. In this experiment,
a method for determining the location of SS1 is described.
Using a meter stick or rod as a bat (see Figure 5.1), the Dynamics Cart can play the role of a
ball. By observing how far the cart rolls after impact, the relative, or even absolute energy
transfer can be determined for various values of y. In this manner, SS1 can be found.
If you have already done the experiment to determine the coefficient of rolling friction for your
cart for the same surface that you will be using in this experiment, you can determine the
kinetic energy of the cart at the moment after impact since:
1
mv2 = µmgx (EQN-2)
2
®
15
Page 20

Dynamics Cart
Procedure
1. Set up the system as shown in Figure 5.1. Position the cart so that its plunger hangs over the
edge of the table several centimeters.
NOTE: You will need a long, horizontal table or board for this experiment. A 3/4 inch by 1
foot by 8 foot plywood board is recommended.
2. Arrange to have a stop of some sort to insure that you always use the same pull-back angle for
the hanging meter-stick.
3. Pull the meter-stick or rod back to the pull-back angle that you have chosen, and release it,
allowing it to strike the cart plunger. Record the corresponding values of y and x in Table 5.1.
4. Repeat step 3 four times for each value of y, changing it from roughly 10 to 90 cm in 10 cm
increments.
5. Compute the average value of x for each value of y.
6. By interpolation, determine the location of SS1 from your data and record it below Table 5.1.
7. Using EQN-1, compute the location of SS2 and record it below Table 5.1.
8. If time permits, repeat the above after either re-positioning the pivot (i.e. “choking up”) or
adding 100 grams or so at some point on the stick.
012-04840E
NOTE: This would add a little realism to the experiment, since neither a bat nor a tennis
racket is uniform!
16
®
Page 21

012-04840E
Dynamics Cart
Data and Analysis
Table 5.1
Trial
1
2
3
4
5
6
7
8
y-position of SS1 = _____ cm
y-position of SS2 = _____ cm
y (cm)
10
20
30
40
50
60
70
80
x (cm)
Average
x (cm)
Optional
µmgx (joules)
Questions
1. Is it possible to construct a “Super-bat” for which both SS1 and SS2 coincide? If so, what changes would
have to occur to the uniform rod to bring SS1 and SS2 closer together? (You might use the Sweet-Spot
computer program to help you answer this!)
2. What assumptions have we made in analyzing this system? How do they affect our results?
®
17
Page 22

Dynamics Cart
012-04840E
“Sweet Spot” Computer Program
The following is a listing of the “Sweet Spot” computer program written by
Scott K. Perry of American River College, Sacramento, CA., using Quickbasic 4.5.
REM Program: SWEET SPOTS and PERCUSSION
POINTS (Fixed Pivot)
REM (Version: 15DEC91)
CLS
LOCATE 1, 1
INPUT “What pullback angle will you be using for this
experiment (deg.)”; theta
INPUT “What is the mass of your meter-stick ’bat’
(kg); Ms
g = 9.8: Mc = .5: L = 1: theta = theta / 57.3
COLOR 15
Begin:
CLS
LOCATE 1, 1
INPUT “How far from the center-of-mass is the pivot
located (m)”; S
INPUT “How large is the load mass (kg)”; m
IF m = 0 GOTO Skip
INPUT “ How far is the load mass from the pivot (m)”;
y
Skip:
I = (1 / 12) ∗ Ms ∗ L ^ 2 + Ms ∗ S ^ 2 + m ∗ y ^ 2
PE = (Ms ∗ S + m ∗ y) ∗ (1 – COS(theta)) ∗ g
Wo = SQR(2 ∗ PE / I)
h = (1 + 2 ∗ (y / L) ∗ (m / Ms)) ∗ (1 – COS(theta)) ∗ L
/ 2
PRINT: PRINT
COLOR 14
PRINT “Y-Impact (m)”; TAB(16); “Cart-Speed (m/
s)”; TAB(35); “Omega (rad/sec)”; TAB(54); “Impulse at Pivot (N∗sec)”
COLOR 15
PRINT
FOR k = 1 TO 9
r = k / 10
a = Mc / 2 + (Mc ∗ r) ^ 2 / (2 ∗ I)
b = –Mc ∗ Wo ∗ r
c = –PE + (1 / 2) ∗ I ∗ Wo ^ 2
v = (–b + SQR(b ^ 2 – 4 ∗ a ∗ c)) / (2 ∗ a)
w = (I ∗ Wo – Mc ∗ r ∗ v) / I
DeltaP = Mc ∗ v + Ms ∗ w ∗ L / 2 – Ms ∗ Wo ∗ L / 2
v = INT(1000 ∗ v + .5) / 1000
w = INT(1000 ∗ w + .5) / 1000
DeltaP = INT(100 ∗ DeltaP + .5) / 100
PRINT TAB(5); r; TAB(20); v; TAB(39); w;
TAB(60); DeltaP
NEXT
PRINT: PRINT
INPUT “Would you like to input different values ”; a$
IF a$ < > “N” and a$ < > “n” GOTO Begin
END
18
®
Page 23

012-04840E
q
Purpose
Experiment 6: Sliding Friction and
Conservation of Energy
EQUIPMENT NEEDED:
– Dynamics Cart (ME-9430) – Stopwatch (SE-8702)
– Metric tape (SE-8731) – Brick or block of wood
– Long board that can be used as a ramp – Friction Block (003-04708)
– Protractor
In this lab, the Dynamics Cart will be launched down a
ramp, as shown in Figure 6.1, while riding on a friction
block. The initial elastic potential energy and gravitational
potential energy of the cart are converted to thermal energy
as the cart slides to a stop. The thermal energy generated on
the surfaces is the same as the work done against sliding
friction.
Dynamics Cart
friction block
Figure 6.1
Theory
Using the principle of conservation of energy, we can equate the initial energy of the system with the final
(i.e. thermal) energy of the system. This leads to:
2
+ mgDsinθ = µkmgDcosθ (EQN-1)
1/2kx
(elastic P.E.) + (gravitational P.E.) = (work done against friction)
where k is the spring constant of the plunger (from Experiment 4), x is the distance that the plunger is pushed
in, m is the mass of the cart plus the friction block, D is the distance that the block slides after the cart’s plunger
is released,
θθ
θ is the angle of the ramp to the horizontal, and µk is the coefficient of kinetic or “sliding” friction.
θθ
In this experiment, you will use the principle of the conservation of energy to predict D, given certain measurements you will make and the value of k determined in Experiment 4. First you will need to determine the
coefficient of kinetic or “sliding” friction for the friction block.
Determining µ
: If the angle of the ramp is high enough, the friction block will slide down the ramp with
k
uniform acceleration due to a net force on the block. The net force on the block is the difference between
the component of the gravitational force (mgsinø) that is parallel to the surface of the ramp and the friction
force (-µkmgcosø) that retards the motion . The angle ø is the angle of the ramp when the block slides
down the ramp with uniform acceleration. The acceleration down the ramp is given by:
a = gsinø
- µkgcosø (EQN-2)
The average acceleration down the ramp is given by:
a = 2d/t
2
(EQN-3)
where d is the total distance the block slides and t is the time required to slide through that distance. If the
acceleration is uniform, EQN-2 equals EQN-3. You can use the measured values of the angle ø (the angle of
uniform acceleration), the distance d, and the time t to calculate the kinetic coefficient of friction µ
®
19
.
k
Page 24

Dynamics Cart
Procedure
NOTE: To get consistent results in this experiment, you must insure that the ramp you will be
using is both straight and clean. Wipe the surface of the ramp and the friction block with a rag.
Determining coefficient of kinetic or “sliding” friction:
1. Place the cart with the friction block on the ramp. Set up the ramp at a relatively low angle (one that
does not cause the friction block to begin sliding down the ramp by itself).
012-04840E
2. Increase the angle of the ramp until the block will begin to slide down the ramp on its own, but
only
after you “release” it by slapping the table (or tapping the ramp very lightly). Now increase the
angle of the ramp by a few more degrees so that the block will slide down the ramp with a uniform
acceleration when you release it with a “slap” or tap. The angle of the ramp must be low enough so
that the block does not begin to slide on its own -- only when you release it. Measure the angle of
the ramp with the protractor and record it as the angle of uniform acceleration (ø) in the data table.
3. Release the block from the grasp of static friction as described in the previous step and measure the time
of the cart’s descent down the ramp. Record this time as t in data Table 6.1. Measure the distance d
that the block slides down the ramp and record this in data Table 6.1. Repeat the measurements four
times. Use EQN-3 to compute the accelerations of the block and
enter the values in data Table 6.1. Determine the average value
Block or brick
of acceleration and enter it below data Table 6.1.
4. Use EQN-2 to calculate the coefficient of kinetic or “sliding”
friction. Enter it below the data table.
Prediction of D and Measurement of D:
(about 1/2 the slip angle)
5. Now reduce the angle of the ramp slightly until the block
will just barely slide down the ramp with a uniform
speed
when you release it with a slap or tap. Measure this “slip”
q
Figure 6.2
angle. Reduce the angle of the ramp to about one half of the
“slip” angle. Measure this new angle and record its value in
data Table 6.2 as
. Secure a brick or block at the upper end of the ramp as shown in Figure 6.2.
θ
6. It is time to make a prediction – Using EQN-1 and the information that you have recorded, predict
D, the distance that the cart will slide down the ramp after being launched. Assume that the plunger
on the cart is fully cocked at the position of maximum spring compression. Record your prediction
at the top of Table 6.2.
7. After double checking your work in the previous step, launch the cart down the ramp by placing it
on the ramp with its cocked plunger against the secured brick. Then tap the spring-release trigger
with a rod or stick using a flat edge.
NOTE: This will help to insure that you do not give the cart an initial velocity other than that
supplied by the spring plunger.
8. For six trials, measure the distance D that the cart slides and record these in Table 6.2.
NOTE: Sometimes the cart will twist a bit as it descends, so use the midpoint of the back edge of
your cart as a reference point for measuring D.
9. Compare your results with your prediction. Compute the percent difference between these two
values and enter it below Table 6.2.
20
®
Page 25

012-04840E
Data and Analysis
ø = _________ Spring constant, k = _________ (from Experiment 4)
Dynamics Cart
Table 6.1
Trial
t (sec)
d (cm) a ( )
cm
s
2
1
2
3
4
average acceleration = _________ coefficient of sliding friction = _________
θ = _________ Predicted value of D = _________ cm
cm
2
s
Trial
Table 6.2
D (cm)
1
2
3
4
5
6
Average of measured value of D = _________ cm Percent of difference = _________%
Questions
1. In analyzing this system, has the energy been fully accounted for? Discuss.
2. How do your results agree with your prediction? Discuss.
3. What if you launched the cart up the same ramp? How far up would it go?
®
21
Page 26

Dynamics Cart
012-04840E
Notes:
22
®
Page 27

012-04840E
Dynamics Cart
Appendix
WARNING!
If the baseplate is removed, the axle assemblies
may fly out, because they are held in place by
compressed springs.
Removal of the plate is a two person operation:
One person needs to push down on the wheels
while the other slides out the base plate.
Replacing the Wheel-Axles Assemblies
1. Detach the end cap at the rear of the cart by removing the two screws from the rear end cap as shown.
NOTE: The screws that secure the end caps to
either end of the Dynamics Cart are thread
forming screws and may require substantial force
to remove and reinstall. A #1 Phillips point screw
driver is required.
Thread forming
Screws
Wheel-axle
assembly
Compression
spring
Baseplate
4. Slide the baseplate back into position.
5. Replace the rear end cap with the two screws.
Replacing the Front End-Cap Attachments
• Screw the plunger bar knob finger-tight onto
the plunger bar.
• Peel off Velcro
• The plastic cover may get pulled off the plunger
bar catch. Replace with the new cover.
• If the plunger bar becomes defective, please contact PASCO scientific for technical support.
® tab and replace with new tab.
Rear Endcap
2. Push the wheels into the recessed area and slide the
base plate over the wheels.
3. Replace the wheel-axle assembly and springs in reverse order.
®
Velcro tab
Plunger bar knob
23
Plunger bar
trigger
Plunger bar
Plunger bar
catch
Plastic cover
Page 28

Dynamics Cart
012-04840E
Replacement Parts
Description Part No. Qty
Wheel-axle assembly ME-6957 4
End cap, modified 648-04699 2
For rear end cap assembly add:
End cap plug 648-04694 1
Plunger bar 648-04653 1
Plunger bar knob assembly
Screw (10-32x1/4 socket cap) 610-179 1
Knob 620-033 1
Plunger bar catch cover 699-04658 1
Compression spring (plunger bar) 632-035 1
Suspension spring 632-034 4
Base plate 648-04651 1
Velcro tab, 1/2 inch, Loop 616-074 1
Velcro tab, 1/2 inch, Hook 616-075 1
500 g Mass 648-04636 1
24
®
Page 29

012-04840E
Dynamics Cart
Technical Support
Feedback
If you have any comments about this product or this
manual please, let us know. If you have any suggestions on alternate experiments or find a problem in the
manual, please tell us. PASCO appreciates any
customer feedback. Your input helps us evaluate and
improve our product.
To Reach PASCO:
For Technical Support,
Phone: 1-800-772-8700 (toll-free within the U.S.)
or (916) 786-3800.
Email: techsupp@PASCO.com
Fax: (916) 786-3292
Web: http://www.pasco.com
Contacting Technical Support
Before you call the PASCO Technical Support staff, it
would be helpful to prepare the following information:
• If your problem is computer/software related, note:
-Title and revision date of software
-Type of computer (make, model, speed)
-Type of external cables/peripherals
• If your problem is with the PASCO apparatus, note:
-Title and model number (usually listed on the label)
-Approximate age of the apparatus
-A detailed description of the problem/sequence of
events (In case you can't call PASCO right away,
you won't lose valuable data.)
-If possible, have the apparatus within reach when
calling. This makes descriptions of individual parts
much easier.
• If your problem relates to the instruction manual,
note:
-Part number and revision (listed by month and year
on the front cover)
-Have the manual at hand to discuss your questions.
®
25
Page 30

 Loading...