

Page 1

Instruction Manual and
Includes
Teacher’s Notes
and
Typical
Experiment Results
Experiment Guide for
the PASCO scientific
Model ME-9215B
PHOTOGATE TIMER
012-06379B
Page 2

Page 3

012-06379B Photogate Timer
Table of Contents
Page
Copyright, Warranty and Technical Support ....................................................ii
Introduction ...................................................................................................... 1
Operation ......................................................................................................... 2
Accessories for the Photogate Timer ................................................................ 4
10 Copy-Ready Experiments: .......................................................................... 4
Experiment 1: Instantaneous vs Average Velocity .................................... 5
Experiment 2: Kinematics on an Inclined Plane ........................................ 7
Experiment 3: Speed of a Projectile .......................................................... 9
Experiment 4: Newton's Second Law ......................................................11
Experiment 5: The Force of Gravity ........................................................ 13
Experiment 6: Conservation of Momentum ............................................. 15
Experiment 7: Kinetic Energy .................................................................. 17
Experiment 8: Conservation of Mechanical Energy ................................. 19
Experiment 9: Elastic-Kinetic Energy ...................................................... 21
Experiment 10: Pendulum Motion ........................................................... 23
Teachers Guide ............................................................................................... 27
Maintenance .................................................................................................. 39
®
i
Page 4

Photogate Timer 012-06379B
Copyright, Warranty and Technical Support
Copyright Notice
The PASCO scientific 012-06379B Instruction
Manual is copyrighted with all rights reserved.
Permission is granted to non-profit educational
institutions for reproduction of any part of this
manual, providing the reproductions are used only in
their laboratories and classrooms, and are not sold for
profit. Reproduction under any other circumstances,
without the written consent of PASCO scientific, is
prohibited.
Limited Warranty
For a description of the product warranty, see the
PASCO catalog.
Technical Support
For assistance with any PASCO product, contact
PASCO at:
Address: PASCO scientific
10101 Foothills Blvd.
Roseville, CA 95678-9011
Phone: 916-786-3800 (worldwide)
800-772-8700 (U.S)
FAX: (916) 786-3292
Web www.pasco.com
email: support@pasco.com
ii
®
Page 5

012-06379B Photogate Timer
Introduction
The PASCO ME-9215B Photogate Timer is an accurate
and versatile digital timer for the student laboratory.
The ME-9215B memory function makes it easy to time
events that happen in rapid succession, such as an air track
glider passing twice through the photogate, once before
and then again after a collision.
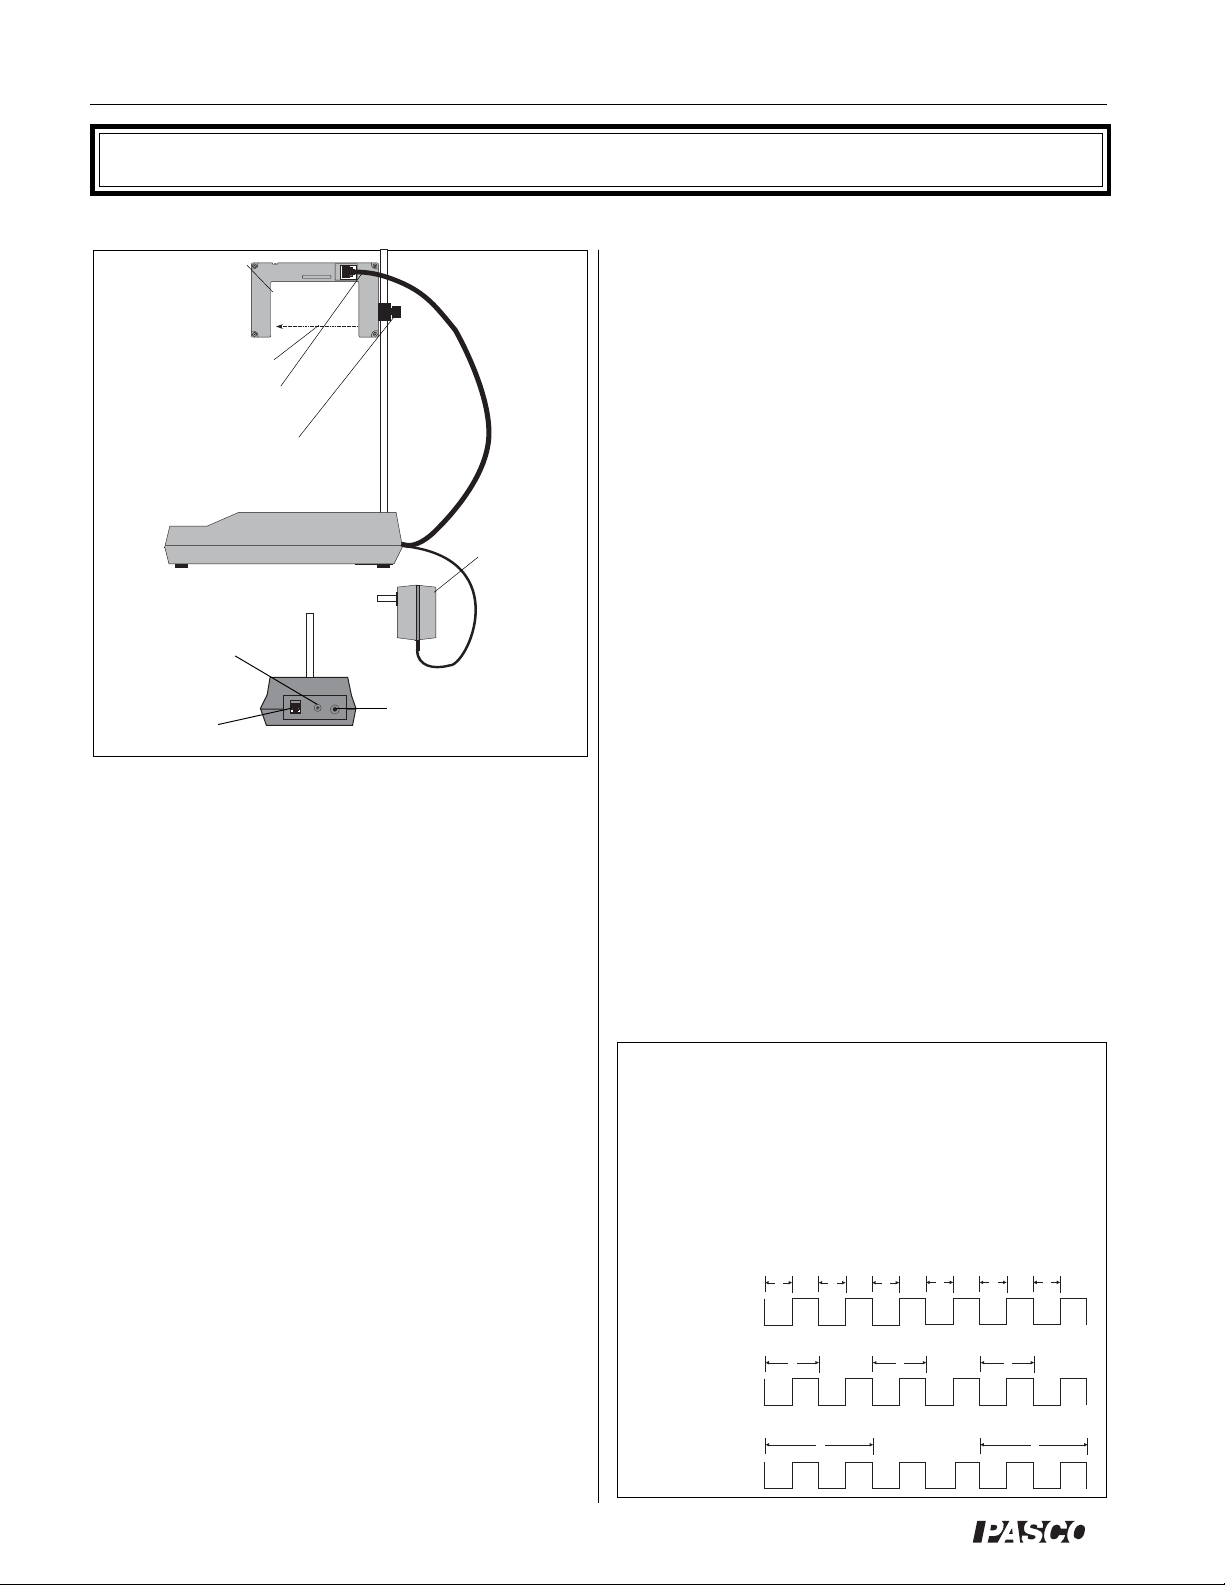
The Photogate Timer uses PASCO’s narrow-beam infrared photogate (see Figure 1) to provide the timing signals.
An LED in one arm of the photogate emits a narrow infrared beam. As long as the beam strikes the detector in the
opposite arm of the photogate, the signal to the timer
indicates that the beam is unblocked. When an object
blocks the beam so it doesn’t strike the detector, the signal
to the timer changes. The timer has several options for
timing the photogate signals. The options include Gate,
Pulse, and Pendulum modes, allowing you to measure the
velocity of an object as it passes through the photogate or
between two photogates, or to measure the period of a
pendulum. There is also a START/STOP button that lets
you use the timer as an electronic stopwatch.
An important addition to your Photogate Timer is the
ME-9204B Accessory Photogate, which must be ordered
separately. It plugs directly into the Photogate Timer and
triggers the timer in the same manner as the built-in photogate. In Pulse Mode, the Accessory Photogate lets you
measure the time it takes for an object to travel between
two photogates. In Gate mode, it lets you measure the
velocity of the object as it passes through the first
photogate, and then again when it passes through the
second photogate.
LED: Lights when
beam is blocked
Detector
Figure 1: The PASCO Photogate Head
➤➤
➤ NOTES:
➤➤
Plug in RJ12 connector
from Photogate timer
Infrared beam
LED:
Source of infrared
beam
c The Photogate Timer can be powered using
the included 7.5 V adapter. It will also run
on 4 C-size, 1.5 Volt batteries. Battery installation instructions are in the Appendix.
d Ten ready-to-use experiments are included
in this manual, showing a variety of ways in
which you can use your Photogate Timer.
The equipment requirements vary for different experiments. For many of the experiments, you will need an air track (dynamics
carts will also work). Many also require a
ME-9204B Accessory Photogate in addition
to the Photogate Timer. Check the equipment requirements listed at the beginning of
each experiment.
®
1
Page 6
Photogate Timer 012-06379B
Operation
Photogate Head
Photogate beam
Plug in RJ12 connec-
tor from timer
Clamp screw: loosen to
adjust photogate angle or
height
7.5 volt
power adapter
to 120 VAC,
60 Hz
or
7.5 volt
power port
Photogate port
Rear panel
Figure 2: Setting Up the Photogate Timer
Accessory
photogate port
220/240 VAC,
50 Hz
To Operate the Photogate Timer:
c Plug the RJ12 phone connector from the timer into the
RJ12 phone jack on the Photogate Head.
d Plug the 7.5 volt power adapter into the small recep-
tacle on the rear of the timer and into a standard 110
VAC, 60 Hz (or 220/240 VAC, 50 Hz) wall outlet.
e Position the Photogate Head so the object to be timed
will pass through the arms of the photogate, blocking
the photogate beam. Loosen the clamp screw if you
want to change the angle or height of the photogate,
then tighten it securely.
f If you are using a ME-9204B Accessory Photogate,
plug the stereo phone plug of the Accessory Photogate
into the large receptacle (see Figure 2) on the rear of
the timer.
g Slide the mode switch to the desired timing mode:
Gate, Pulse, or Pendulum. Each of these modes is described below. Switch the MEMORY switch to OFF.
h Press the RESET button to reset the timer to zero.
i As a test, block the photogate beam with your hand to
be sure that the timer starts counting when the beam is
interrupted and stops at the appropriate time.
j Press the RESET button again. You are ready to
begin timing.
Timing Modes
Gate Mode: In Gate mode, timing begins when the beam
is first blocked and continues until the beam is unblocked.
Use this mode to measure the velocity of an object as it
passes through the photogate. If an object of length L
blocks the photogate for a time t, the average velocity of
the object as it passed through the photogate was L/t.
Pulse Mode: In Pulse mode, the timer measures the time
between successive interruptions of the photogate. Timing begins when the beam is first blocked and continues
until the beam is unblocked and then blocked again.
With an Accessory Photogate plugged into the Photogate
Timer, the timer will measure the time it takes for an
object to move between the two photogates.
Pendulum Mode: In Pendulum mode, the timer measures the period of one complete oscillation. Timing begins as the pendulum first cuts through the beam. The
timer ignores the next interruption, which corresponds to
the pendulum swinging back in the opposite direction.
Timing stops at the beginning of the third interruption, as
the pendulum completes one full oscillation.
Manual Stopwatch: Use the START/STOP button in
either Gate or Pulse mode. In Gate mode the timer starts
when the START/STOP button is pressed. The timer
stops when the button is released. In Pulse mode, the
timer acts as a normal stopwatch. It starts timing when
the START/STOP button is first pressed and continues
until the button is pressed a second time.
TIMING DIAGRAMS
The following diagrams show the interval, t, that is
measured in each timing mode. In each diagram, a
low signal corresponds to the photogate being blocked
(or the START/STOP button pressed). A high signal
corresponds to the photogate being
unblocked (and the START/STOP button unpressed).
MODE
GATE
PULSE
PENDULUM
DIAGRAM
t t t
t t t
t
t t t
t
2
®
Page 7

012-06379B Photogate Timer
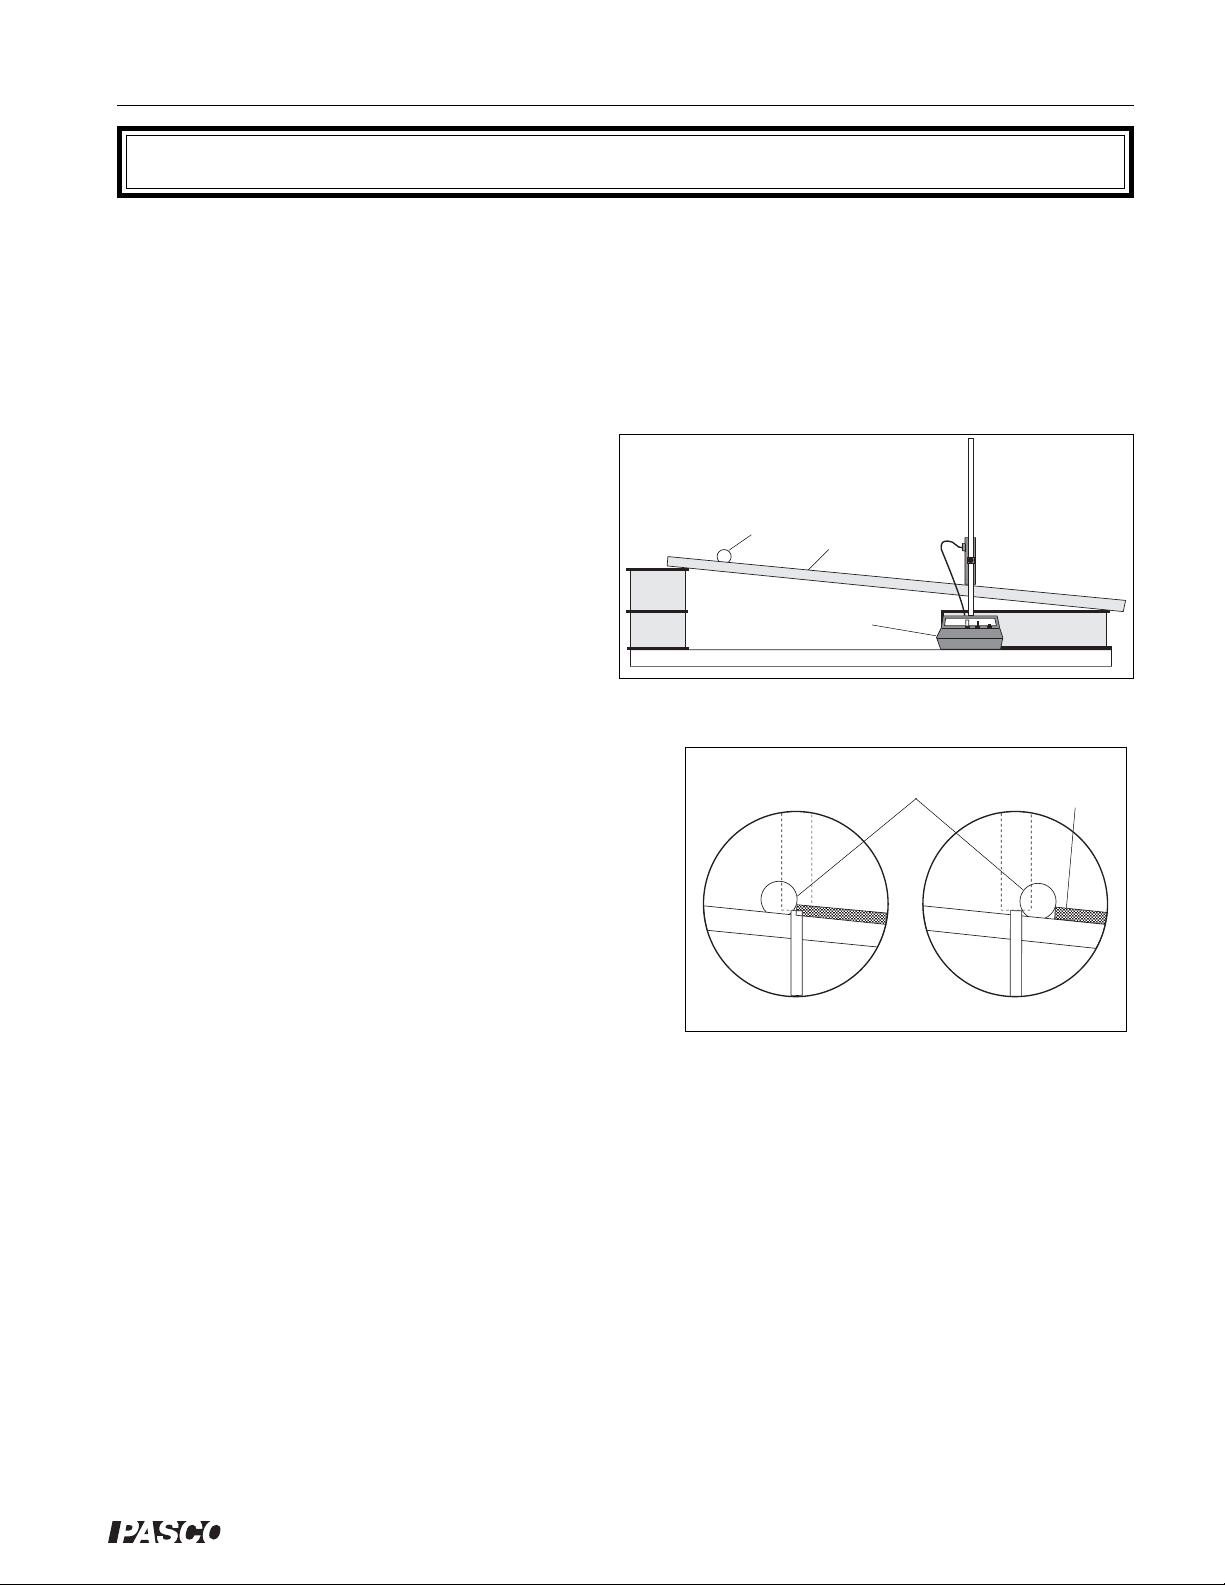
TIMING SUGGESTION
Since the source and detector of the photogate have a
finite width, the true length of the object may not be
the same as the effective length seen by the photogate. This parallax error may be minimized by having the object pass as close to the detector side of the
photogate as possible, with the line of travel perpendicular to the beam. To completely eliminate the
parallax error in experimental data, determine the
effective length of the object as follows:
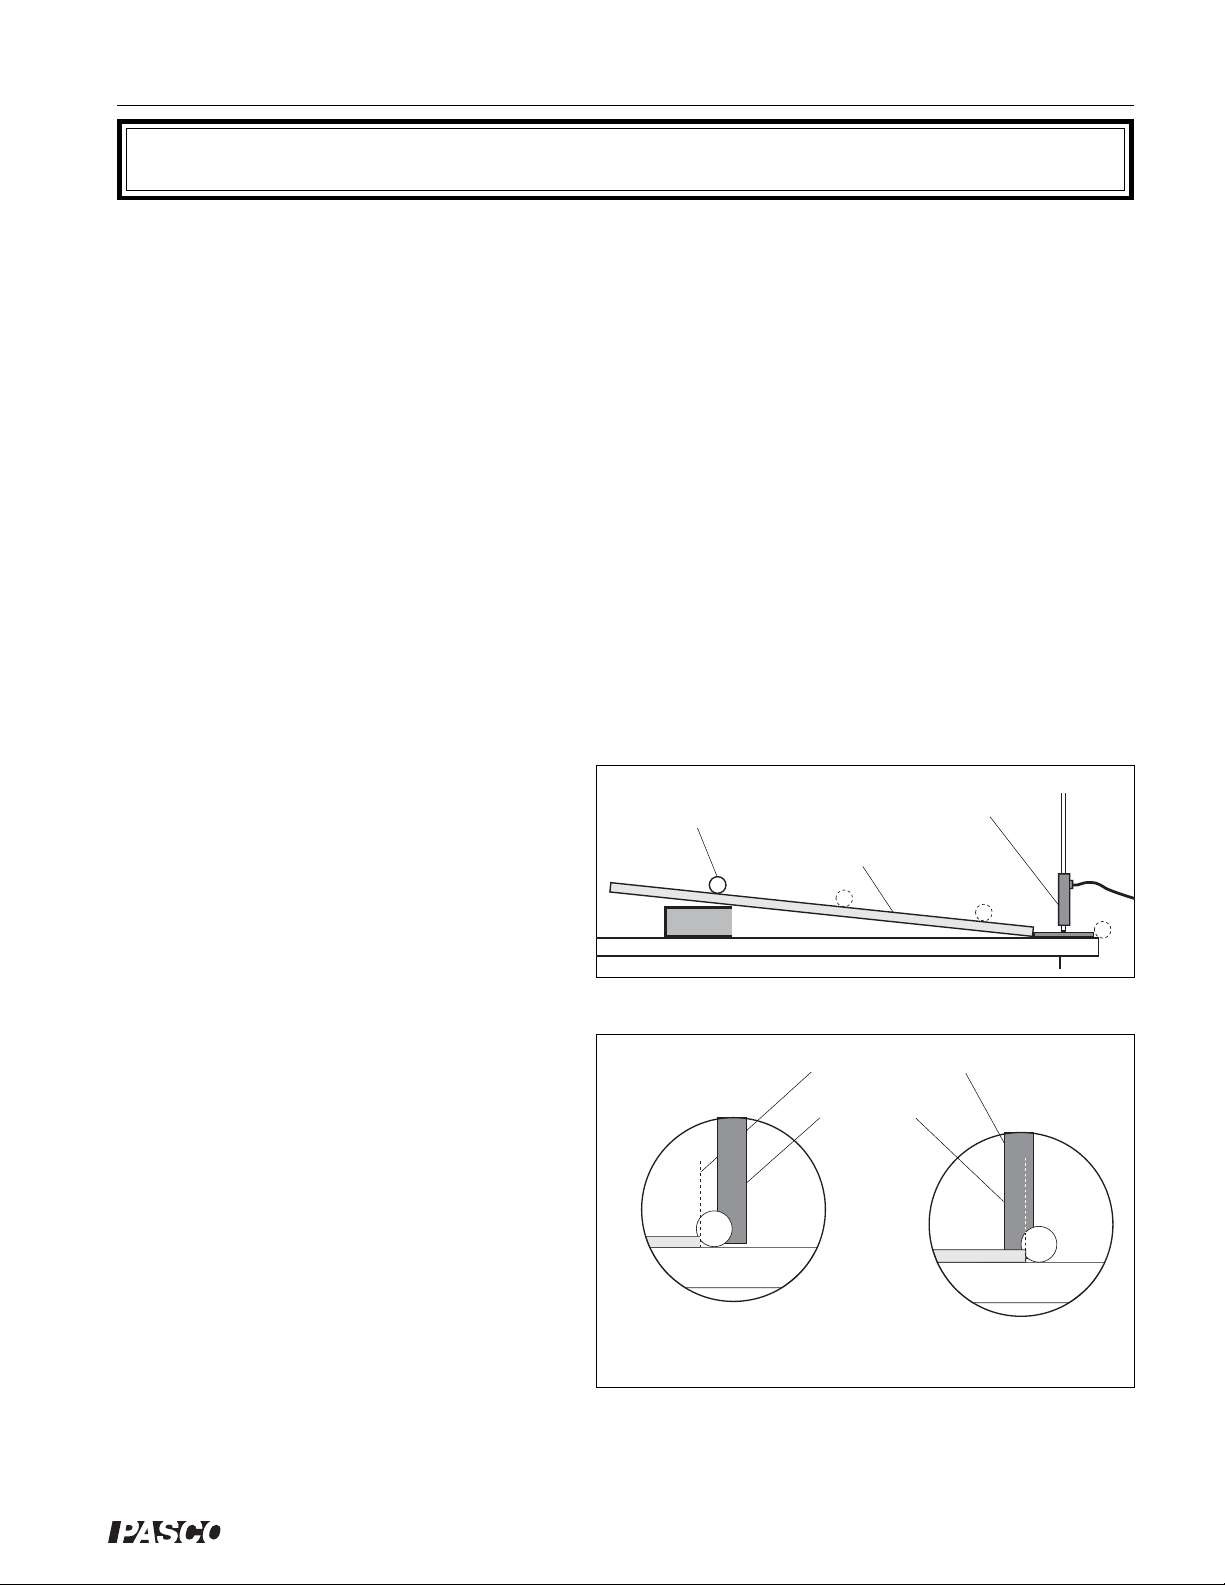
c With the Timer in Gate mode, push the object
through the photogate, along the path it will follow in the experiment.
d When the photogate is triggered (the LED on top
of the photogate comes ON), measure the position
of the object relative to an external reference
point.
e Continue pushing the object through the photo-
gate. When the LED goes OFF, measure the position of the object relative to the same external reference point.
f The difference between the first and second meas-
urement is the effective length of the object.
When measuring the speed of the object, divide
this effective length by the time during which the
object blocked the photogate.
Memory Feature
When two measurements must be made in rapid succession, such as measuring the pre- and post-collision velocities of an air track glider, use the memory function. It can
be used in either the Gate or the Pulse mode.
➤➤
➤ NOTE: If additional photogate interruptions
➤➤
occur after the second time is measured, and before
the MEMORY switch is flipped to READ, they too
will be measured by the timer and included in the
cumulative time.
Figure 3: Timing an Air Track Glider
SPECIFICATIONS
Detector rise time: 200 ns max.
Fall Time: 200 ns max.
Parallax error: For an object passing through the photo-
gate, within 1 cm of the detector, with a velocity of less
than 10 m/s, the difference between the true and effective
length of the object will be less than 1 millimeter.
Infrared source: Peak output at 880 nm; 10,000 hour life.
To use the memory:
c Turn the MEMORY switch to ON.
d Press RESET.
e Run the experiment.
When the first time (t
ately displayed. The second time (t
cally measured by the timer, but it will not be shown
on the display.
f Record t
, then push the MEMORY switch to READ.
1
The display will now show the TOTAL time, t
Subtract t
from the displayed time to determine t2.
1
®
) is measured, it will be immedi-
1
) will be automati-
2
+ t2.
1
Figure 4: Photogate Timing a Pendulum
3
Page 8
Photogate Timer 012-06379B
Accessories for the Photogate Timer
The following accessories are available to help extend the
utility of your model ME-9215B Photogate Timer. All
the accessories work equally well with either model. See
the current PASCO catalog for more information.
ME-9204B Accessory Photogate
The stereo phone plug of the ME-9204B Accessory
Photogate plugs into the phone jack on the rear of the
Photogate Timer, giving you two identical photogates
operating from a single timer. With the timer in Gate
mode, you can measure the velocity of an object as it
passes through one photogate, then again as it passes
through the second photogate. With the timer in Pulse
mode, you can measure the time it takes for an object to
pass between the two photogates. (Many of the experiments in this manual are most easily performed using a
Photogate Timer with an Accessory Photogate.)
ME-9207B Free Fall Adapter
For easy and accurate measurements of the acceleration
of gravity, the ME-9207B Free Fall Adapter is hard to
beat. The Free Fall Adapter plugs directly into the phone
plug on the rear of the Photogate Timer. It comes with
everything you need, including two steel balls (of different size and mass), a release mechanism, and a receptor
pad. The release mechanism and the receptor pad automatically trigger the timer, so you get remarkably accurate measurements of the free fall time of the steel ball.
ME-9259A Laser Switch
This highly collimated photodetector is identical to a
photogate, except that you use a laser (not included) as
the light source. You can now time the motion of objects
that are far too big to fit through a standard photogate.
Measure the period of a bowling ball pendulum or the
velocity of a car. The Laser Switch operates in all three
timing modes (Gate, Pulse, and Pendulum).
10 Copy-Ready Experiments
The following 10 experiments are written in worksheet form. Feel free
to photocopy them for use in your lab.
NOTE: In each experiment, the first paragraph is a list of equipment
needed. Be sure to read this paragraph first, as the equipment needs
vary from experiment to experiment.
This manual emphasizes the use of an air track, but the air track experiments can also be performed with dynamics carts. Many also require a
ME-9204B Accessory Photogate in addition to a Photogate Timer.
Collision experiments, such as experiments 6 and 7, require four times
to be measured in rapid succession and are therefore most easily performed using two Photogate Timers.
4
®
Page 9
012-06379B Photogate Timer
Experiment 1: Instantaneous Versus Average Velocity
EQUIPMENT NEEDED:
- Photogate Timer with Accessory Photogate
- Air Track System with one glider.
Introduction
An average velocity can be a useful value. If you know you will average 50 miles per
hour on a 200 mile trip, it’s easy to determine how long the trip will take. On the other
hand, the highway patrolman following you doesn’t care about your average speed over
200 miles. He wants to know how fast you’re driving at the instant his radar strikes your
car, so he can determine whether or not to give you a ticket. He wants to know your
instantaneous velocity. In this experiment you’ll investigate the relationship between
instantaneous and average velocities, and see how a series of average velocities can be
used to deduce an instantaneous velocity.
Procedure
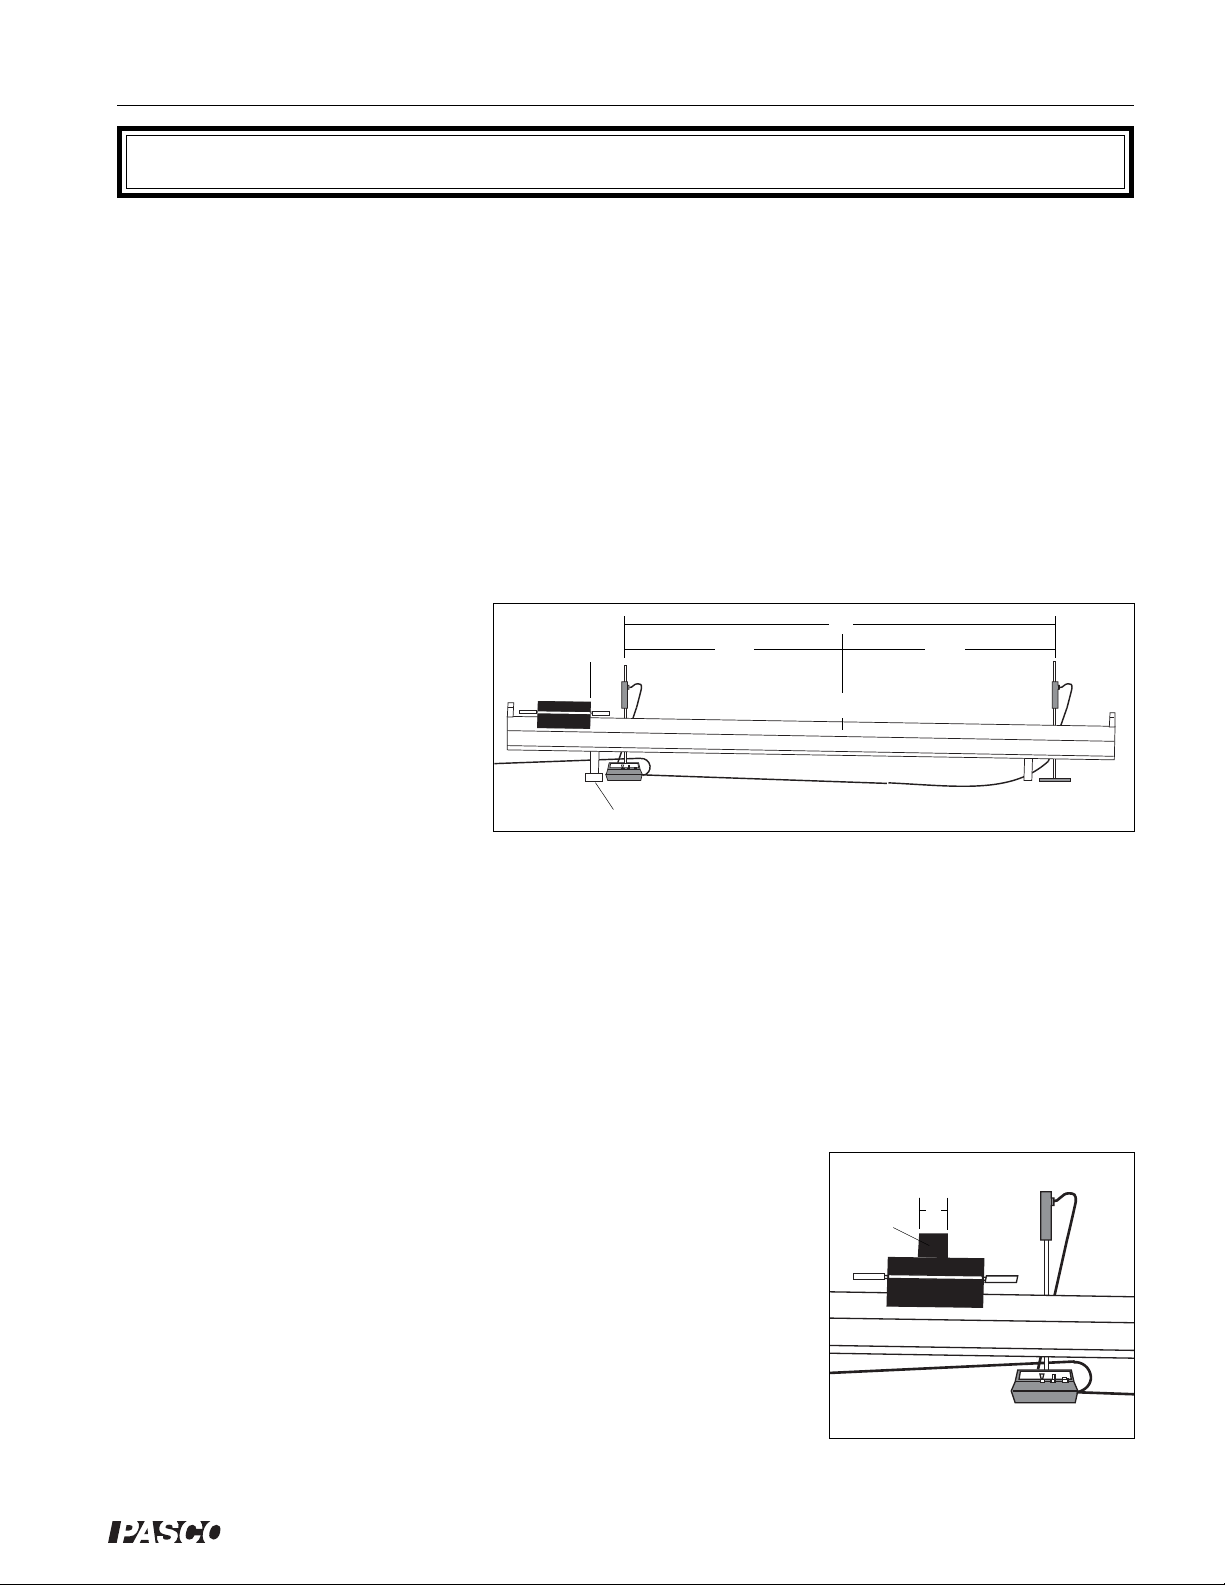
c Set up the air track as shown in
x
0
D/2
Figure 1.1, elevating one end of
the track with a 1-2 cm support.
d Choose a point x
near the center
1
of the track. Measure the position
of x1 on the air track metric scale,
1-2 cm support
and record this value in Table 1.1.
If you are using an air track with-
Figure 1.1: Setting Up the Equipment
out a scale, use a meter stick to
measure the distance of x1 from the edge of the upper end of the track.
e Choose a starting point x
for the glider, near the upper end of the track. With a pencil,
0
carefully mark this spot on the air track so you can always start the glider from the
same point.
f Place the Photogate Timer and Accessory Photogate at points equidistant from x
shown in the figure. Record the distance between the photogates as D in Table 1.1.
g Set the slide switch on the Photogate Timer to PULSE.
h Press the RESET button.
i Hold the glider steady at x
displayed after the glider has passed through both photogates.
, then release it. Record time t1, the time
0
j Repeat steps 6 and 7 at least four more times, recording the times as t
through t5.
D
D/2
x
1
, as
1
Card-
board
2
D
k Now repeat steps 4 through 9, decreasing D by approximately 10 centi-
meters.
l Continue decreasing D in 10 centimeter increments. At each value of D,
repeat steps 4 through 8.
®
5
Figure 1.2: Measuring Veloc-
ity in Gate Mode
Page 10
Photogate Timer 012-06379B
Optional
You can continue using smaller and smaller distances for D by changing your timing technique. Tape a piece of cardboard on top of the glider, as shown in Figure 1.2. Raise the photogate so it is the cardboard, not the body of the glider, that interrupts the photogate. Use just
one photogate and place it at x1. Set the timer to GATE. Now D is the length of the cardboard. Measure D by passing the glider through the photogate and noting the difference in
glider position between where the LED first comes on, and where it goes off again. Then
start the glider from x
as before, and make several measurements of the time it takes for the
0
glider to pass through the photogate. As before, record your times as t1 through t5. Continue
decreasing the value of D, by using successively smaller pieces of cardboard.
Data and Calculations
c
For each value of D, calculate the average of t1 through t5. Record this value as t
d
Calculate v
avg
= D/t
. This is the average velocity of the glider in going between the two
avg
photogates.
e
Plot a graph of v
x1 =
versus D with D on the x-axis.
avg
Table 1.1 Data and Calculations
avg
.
Questions
c
Which of the average velocities that you measured do you think gives the closest approximation
to the instantaneous velocity of the glider as it passed through point x
d
Can you extrapolate your collected data to determine an even closer approximation to the instantaneous velocity of the glider through point x
maximum error you expect in your estimated value.
D t1 t
2
t
3
? From your collected data, estimate the
1
t
4
t
5
?
1
t
avg
v
avg
e
In trying to determine an instantaneous velocity, what factors (timer accuracy, object being
timed, type of motion) influence the accuracy of the measurement? Discuss how each factor
influences the result.
f
Can you think of one or more ways to measure instantaneous velocity directly, or is an instantaneous velocity always a value that must be inferred from average velocity measurements?
6
®
Page 11
012-06379B Photogate Timer
Experiment 2: Kinematics on an Inclined Plane
EQUIPMENT NEEDED:
-Photogate Timer -Meter stick
-Ball and ramp, [A ball bearing (approximately 1.8 cm diameter) and a U-channel
ramp (approximately 50 cm long with an inside width of approximately 1 cm) will
work well, but the exact dimensions are not important].
Introduction
In this lab you will investigate how the velocity
of an object varies as it undergoes a constant
acceleration. The object is a ball rolling down
an inclined ramp. Instead of the usual investigation of velocity as a function of time, you will
measure its velocity as a function of the distance
it has travelled from its starting point.
➤➤
(
➤ Note: This experiment is just as easily per-
➤➤
formed with a glider on an inclined airtrack.)
Ball
Ramp
Photogate
Timer
Procedure
c Set up the apparatus as shown in Figure 2.1.
Fig-
d Move the ball slowly through the photogate, using the
meter stick as shown in Figure 2.2. Determine the point
at which the ball first triggers the Photogate Timer—this
is the point at which the LED on top of the photogate
first turns ON—and mark it with a pencil on the side of
the channel. Then determine the point at which the ball
last triggers the timer, and mark this point also. Measure
the distance between these marks and record this distance as
and mark it in pencil on the side of the channel.
Δ Δ
Δd. Determine the mid-point of this interval,
Δ Δ
LED comes ON
e Set the Photogate Timer to GATE mode and press the
RESET button.
Figure 2.2: Measuring
f Move the ball to a point 5 cm along the track above your mid-point. Hold it at this
position using a ruler or block of wood. Release the ball so that it moves along the
ramp and through the photogate. Record the distance travelled (from the starting point
to the midpoint) and the time (t
) in Table 2.1.
1
g Repeat the trial 3 times so you have a total of four measured times, then take the aver-
age of your measured times. Record your results in the table.
Mark with a pencil
on side of channel.
LED goes OFF
Meter Stick
Δ Δ
Δd
Δ Δ
h Move the ball to positions 10, 15, 20…40 cm from the midpoint, and repeat steps 3-5.
Data and Calculations
c For each distance from the midpoint of the photogate, calculate the final velocity of the
ball by dividing Δd by your average time.
d Construct a velocity versus distance graph, with distance on the horizontal axis.
®
7
Page 12

Photogate Timer 012-06379B
e If the graph doesn't turn out to be a straight line (as it shouldn't), manipulate the data math-
ematically and replot it until you obtain a straight line graph. For example, try plotting dis-
tance as a function of
v
, v2, 1/v, etc. From your graph, what is the mathematical relation-
ship between the velocity of an object on an inclined plane and the distance from its starting
point that it has travelled along the plane?
Questions
Table 2.1 Data and Calculations
Distance inside photogate =
ΔΔ
Δd:
ΔΔ
Distance
Travelled
t
1
t
2
t
3
t
4
Average
Time
Final
Velocity
c
The standard equations for motion with a constant acceleration (starting from rest) include:
x = 1/2 at
2
and v = at. Eliminate t from these equations to determine the relationship between
x and v. Using your result and your graph, can you determine the acceleration of the ball as it
rolled down the plane?
d From your answer to question 1, write the equation of motion for the accelerating ball, giving
its position as a function time. Why do you think equations of motion are most often expressed as a function of time instead of simply relating position to velocity and acceleration?
8
®
Page 13
012-06379B Photogate Timer
Experiment 3: Speed of a Projectile
EQUIPMENT NEEDED:
-Photogate Timer, with Accessory Photogate
-Ball and ramp -Meter stick
-Plumb bob -Carbon paper
Introduction
Projectile motion adds a new dimension, literally, to experiments in linear acceleration. Once a projectile is in motion, its acceleration is constant and in one direction
only—down. But unless the projectile is fired straight up or down, it will have an
initial velocity with a component perpendicular to the direction of acceleration. This
component of its velocity, since it is perpendicular to the applied force of gravity,
remains unchanged. Projectile motion is therefore a superposition of two relatively
simple types of motion: constant acceleration in one direction, and constant velocity
in an orthogonal direction.
In this experiment you will determine the initial velocity of a projectile directly,
using the Photogate Timer, and compare that with a value calculated by examining
the motion of the projectile.
Procedure
c Set up the apparatus as in figure 3.1, so the
ball rolls down the ramp onto the table, then
passes through the photogate, interrupting
the beam.
d Tape a piece of paper to the table, under the
Accessory Photogate. Use the ramp to push
the ball slowly through the Accessory
Photogate, as shown in Figure 3.2. Determine the point at which the ball first triggers
the Photogate Timer—this is the first point at
which the LED turns ON—and mark it on
the paper. Then determine the point at which
the ball last triggers the timer, and mark this
point also. Measure the distance between
these marks and record this distance as
Replace the ramp as in Figure 3.1.
e Use a plumb bob to determine the point
directly below where the ball will leave the
edge of the table after rolling down the ramp.
Measure the distance from the floor to the
top of the table at the point where the ball
leaves the table and record this value as d
f To measure the position where the ball will
strike the floor after rolling down the ramp,
tape a piece of plain paper onto the floor with a piece of carbon paper on top. The
impact of the ball will leave a clear mark for measuring purposes.
Δ Δ
Δd.
Δ Δ
y
Accessory
Ball
Ramp
Figure 3.1: Equipment Setup
Mark with pencil
Photogate
Ramp
.
LED comes ON LED goes OFF
Figure 3.2: Measuring
Photogate
Δ Δ
Δd
Δ Δ
Ramp
®
9
Page 14
Photogate Timer 012-06379B
g Set the Photogate Timer to GATE mode. Now move the ball to a starting point somewhere
on the ramp. Mark this starting position with a pencil so you will be able to repeat the run,
starting the ball each time from the same point. Hold the ball at this position using a ruler or
block of wood. Press the RESET button. Release the ball so that it moves along the ramp
and through the photogate. Record the time in Table 3.1.
h Repeat the trial at least four more times with the same starting point, and record your times in
the table.
i Measure the distance from the point directly below the ramp to each of the landing spots of
your ball. Record these distances in the data table.
Data and Calculations
c Take the average of your measured times and of your measured distances. Record these aver-
ages in the data table. Also record the average distance as d
of the table.
Table 3.1
Data from Photogate Timer
Trial Time Distance
Δ Δ
Δd =
1
Δ Δ
in the space provided to the right
x
2
3
Vertical height, dy =
Average horizontal distance, dx =
4
5
Averages
v0 (avg)
d Divide
Δ Δ
Δd by your average time to determine v0, the velocity of the ball just before it left the
Δ Δ
Horizontal velocity, v0 =
Percentage difference =
table.
e Now determine the horizontal velocity of the sphere using the equations for projectile motion
and your measured values for d
d
= v0t; dy = 1/2 at2;
x
where a equals the acceleration caused by gravity (9.8 m/s
f Compare your two values for v
and dy:
x
2
or 980 cm/s2).
. Report the two values and the percentage difference.
0
Optional
If you have time, choose a value for dx and a value for dy. For what value of v0 will the ball
travel the distance dx as it falls the distance dy? Adjust the height and angle of the ramp and the
starting point until you produce the predicted value of v0. Now run the experiment to see if
your calculated values for dx and dy are correct.
10
®
Page 15

012-06379B Photogate Timer
Experiment 4: Newton’s Second Law
EQUIPMENT NEEDED:
-Photogate timer with Accessory Photogate (or two Photogate Timers)
-Air TrackSystem with one glider -Masses
-Pulley -Pulley Mounting Clamp
-Universal Table Clamp
Introduction
There’s nothing obvious about the relationships governing the motions of objects. In
fact, it took around 4,000 years of civilization and the genius of Isaac Newton to figure
out the basic laws. Fortunately for the rest of us, hindsight is a powerful research tool.
In this experiment you will experimentally determine Newton’s second law by examining the motion of an air track glider under the influence of a constant force. The constant force will be supplied by the weight of a hanging mass that will be used to pull the
glider. By varying the mass of the hanging weight and of the glider, and measuring the
acceleration of the glider, you’ll be able to determine Newton’s second law.
Procedure
c Set up the air track as shown in Figure
4.1. Level the air track very carefully by
Counter
Balance
Glider
x
0
Hook
Photogate
Timer
adjusting the air track leveling feet. A
glider should sit on the track without
accelerating in either direction. There
may be some small movement of the
glider due to unequal air flow beneath the
glider, but it should not accelerate
Figure 4.1: Equipment Setup
steadily in either direction.
d Measure the effective length of the glider, and record your value as L in Table 4.1.
e Mount the hook into the bottom hole of the cart. To counterbalance its weight, add a
piece of similar weight on the opposite end as shown on Fig. 4.1.
f Add 50-60 grams of mass to the glider using 10 or 20 gram masses. Be sure the masses
are distributed symmetrically so the glider is balanced. Determine the total mass of your
glider with the added masses and record the total as m in Table 4.1.
g Place a mass of approximately 5-10 grams on the weight hanger. Record the total mass
(hanger plus added mass) as m
.
a
h Set your Photogate Timer to GATE mode.
i Choose a starting point x
pencil so that you can always start the glider from this same point.
for the glider, near the end of the track. Mark this point with a
0
String
Accessory
Photogate
Tableclamp
Pulley
Mounting
Rod
m
a
j Press the RESET button.
k Hold the glider steady at x
through the first photogate, and t
second photogate. Repeat this measurement four times. Take the average of your measured t1's and t2's and record these averages as t1 and t2 in Table 4.1. panel
, then release it. Note t1, the time it took for the glider to pass
0
, the time it took for the glider to pass through the
2
l Set the Photogate Timer to PULSE mode.
Press the RESET button.
11
®
11
Page 16

Photogate Timer 012-06379B
Again, start the glider from x0. This time measure and record t3, the time it takes the glider to
12
pass between the photogates. Repeat this measurement four more times and record the average of these measurements as t
Vary ma, by moving masses from the glider to the hanger (thus keeping the total mass,
13
in Table 4.1.
3
m + ma, constant.) Record m and ma and repeat steps 5 through 11. Try at least four different
values for ma.
Now leave ma constant at a previously used value. Vary m by adding or removing mass from
14
the glider. Repeat steps 5-11. Try at least four different values for m.
Calculations
For each set of experimental conditions:
c Use the length of the glider and your average times to determine v
and v2, the average glider
1
velocity as it passed through each photogate.
d Use the equation a = (v
- v1)/t3 to determine the average acceleration of the glider as it passed
2
between the two photogates.
e Determine F
(F
= mag; g = 9.8 m/s2 = 980 cm/s2)
a
, the force applied to the glider by the hanging mass.
a
Analysis
c Draw a graph showing average acceleration as a function of applied force, F
.
a,
d Draw a second graph showing average acceleration as a function of the glider mass with M
being held constant.
e Examine your graphs carefully. Are they straight lines? Use your graphs to determine the
relationship between applied force, mass, and average acceleration for the air track glider.
f Discuss your results. In this experiment, you measured only the average acceleration of the
glider between the two photogates. Do you have reason to believe that your results also hold
true for the instantaneous acceleration? Explain. What further experiments might help extend
your results to include instantaneous acceleration?
a
Glider Length, L =
mmat
Table 4.1 Data and Calculations
1
t
2
t
3
12
v
1
v
2
aF
a
®
Page 17

012-06379B Photogate Timer
Experiment 5: The Force of Gravity
EQUIPMENT NEEDED:
-Photogate timer with Accessory Photogate -Air Track System with one glider.
Introduction
In this experiment, you will use Newton’s Second Law (F = ma) to measure
the force exerted on an object by the Earth’s gravitational field. Ideally, you
would simply measure the acceleration of a freely falling object, measure its
Force of air cushion
pushing glider away
from air track
mass, and compute the force. However, the acceleration of a freely falling
object is difficult to measure accurately. Accuracy can be greatly increased
by measuring the much smaller acceleration of an object as it slides down an
Glider
inclined plane. Figure 5.1 shows a diagram of the experiment. The gravitational force Fg can be resolved into two components, one acting perpendicular and one acting parallel to the motion of the glider. Only the component
acting along the direction of motion can accelerate the glider. The other
component is balanced by the force from the air cushion of the track acting in
the opposite direction. From the diagram, F = Fg sin
θθ
θ, where Fg is the total
θθ
gravitational force and F is the component that accelerates the glider. By
measuring the acceleration of the glider, F can be determined and Fg can be
Component of F
perpendicular to air track
Figure 5.1: Forces Acting
calculated.
Procedure
c Set up the air track as shown in Figure 5.2.
Remove the block and level the air track very
carefully.
L
D
d Measure d, the distance between the air track
support legs. Record this distance in the
space on the following page.
e Place a block of thickness h under the support
leg of the track. Measure and record h on the
following page. (For best results, measure h
h{=
d
Figure 5.2: Equipment Setup
with calipers.)
f Measure and record D, the distance the glider moves on the air track from where it triggers the first
photogate, to where it triggers the second photogate. (Move the glider and watch the LED on top of
the photogate. When the LED lights up, the photogate has been triggered.)
g Measure and record L, the effective length of the glider. (Move the glider slowly through a photo-
gate and measure the distance it travels from where the LED first lights up to where it just goes off.)
h Measure and record m, the mass of the glider.
i Set the Photogate Timer to GATE mode and press the RESET button.
j Hold the glider steady near the top of the air track, then release it so it glides freely through the
photogates. Record t
during which it blocks the second photogate. Use the memory function to determine each time.
, the time during which the glider blocks the first photogate, and t2, the time
1
k Repeat the measurement several times and record your data in Table 5.1. You needn’t release the
glider from the same point on the air track for each trial, but it must be gliding freely and smoothly
(minimum wobble) as it passes through the photogates.
F
g
ϑ
g
on the Glider
®
13
Page 18

Photogate Timer 012-06379B
l Change the mass of the glider by adding weights and repeat steps 6 through 8. Do this for at
least five different masses, recording the mass (m) for each set of measurements. (If you have
time, you may also want to try changing the height of the block used to tilt the track.)
Data and Calculations
d = D = θ =
h = L =
Table 5.1 Data and Calculations
mt1t
c Calculate
θθ
θ, the angle of incline for the air track, using the equation
θθ
2
d For each set of time measurements, divide L by t
v
1
v
2
aa
and t2 to determine v1 and v2, the velocities
1
avg
θθ
θ = tan-1(h/d).
θθ
F
of the glider as it passed through the two photogates.
e For each set of time measurements, calculate a, the acceleration of the glider, using the equa-
tion
2
2
- v
v
= 2a(x2-x1) = 2aD.
2
1
f For each value of mass that you used, take the average of your calculated accelerations to
determine a
avg
.
g For each of your average accelerations, calculate the force acting on the glider along its line of
motion (F = ma
h For each measured value of F, use the equation F = F
i Construct a graph of F
avg
).
θθ
sin
θ to determine Fg.
θθ
g
versus m, with m as the independent variable (x-axis).
g
Analysis
g
Does your graph show a linear relationship between Fg and m? Does the graph go through the
origin? Is the gravitational force acting on the mass proportional to the mass? If so, the gravitational force can be expressed by the equation Fg = mg, where g is a constant. If this is the
case, measure the slope of your graph to determine the value of g.
g =
Questions
c In this experiment, it was assumed that the acceleration of the glider was constant. Was this a
reasonable assumption to make? How would you test this?
2
d The equation v
tions is this equation valid? Are those conditions met in this experiment? (You should be able
to find a derivation for this equation in your textbook.)
e Could you use the relationsip F
Moon? Explain.
2
- v
= 2a(x2-x1) was used to calculate the acceleration. Under what condi-
2
1
= mg to determine the force acting between the Earth and the
g
14
®
Page 19

012-06379B Photogate Timer
Experiment 6: Conservation of Momentum
EQUIPMENT NEEDED:
-Air track system with two gliders -Two Photogate Timers.
Introduction
When objects collide, whether locomotives, shopping carts, or your foot and the sidewalk, the
results can be complicated. Yet even in the most chaotic of collisions, as long as there are no external forces acting on the colliding objects, one principle always holds and provides an excellent
tool for understanding the dynamics of the collision. That principle is called the conservation of
momentum. For a two-object collision, momentum conservation is easily stated mathematically
by the equation:
= m1v1i + m2v2i = m1v1f + m2v2f = pf ;
p
i
where m
jects (before the collision), v1f and v2f are the final velocities of the objects, and pi and pf are the
combined momentums of the objects, before and after the collision. In this experiment, you will
verify the conservation of momentum in a collision of two airtrack gliders.
and m2 are the masses of the two objects, v1i and v2i are the initial velocities of the ob-
1
Procedure
c Set up the air track and
photogates as shown in
Figure 6.1, using bumpers
on the gliders to provide an
Glider
1
m
1
Photogate
elastic collision. Carefully
level the track.
d Measure m
and m2, the
1
masses of the two gliders to be used in the collision. Record your results in Table 6.1.
e Measure and record L
and L2, the length of the gliders. (e.g., push glider1 through photogate1 and
1
measure the distance it travels from where the LED comes on to where it goes off again.)
1
Figure 6.1: Equipment Setup
f Set both Photogate Timers to GATE mode, and press the RESET buttons.
g Place glider
surements in Table 6.1 as follows:
t
= the time that glider1 blocks photogate1 before the collision.
1i
= the time that glider2 blocks photogate2 before the collision.
t
2i
= the time that glider1 blocks photogate1 after the collision.
t
1f
= the time that glider2 blocks photogate2 after the collision.
t
2f
at rest between the photogates. Give glider1 a push toward it. Record four time mea-
2
(In this case, there is no t2i since glider2 begins at rest.)
Glider
m
Photogate
2
2
2
➤
IMPORTANT: The collision must occur after glider1 has passed completely through
photogate
and, after the collision, the gliders must be fully separated before either glider
1
interrupts a photogate.
➤➤
➤ NOTE: Use the memory function to store the initial times while the final times are being
➤➤
measured. Immediately after the final times are recorded, the gliders must be stopped to prevent
them from triggering the photogate again due to rebounds.
®
15
Page 20

Photogate Timer 012-06379B
h Repeat the experiment several times, varying the mass of one or both gliders and varying the
initial velocity of glider
i Try collisions in which the initial velocity of glider
bit to coordinate the gliders so the collision takes place completely between the photogates.
.
1
is not zero. You may need to practice a
2
Data and Calculations
c For each time that you measured, calculate the corresponding glider velocity.
(e.g., v
tive when it moves to the left.
= ±L1/t1i, where the velocity is positive when the glider moves to the right and nega-
1i
d Use your measured values to calculate p
fore and after the collision. Record your results in the table.
Questions
m
m
1
L1 =L
t
2
1i
Table 6.1 Data and Calculations
t
2i
and pf, the combined momentum of the gliders be-
i
=
2
t
1f
t
2f
v
1i
v
2i
v
1f
v
2f
p
i
p
f
(m1v1i + m2v2i)(m1v1f + m2v2f)
c Was momentum conserved in each of your collisions? If not, try to explain any discrepancies.
d If a glider collides with the end of the air track and rebounds, it will have nearly the same mo-
mentum it had before it collided, but in the opposite direction. Is momentum conserved in
such a collision? Explain.
e Suppose the air track was tilted during the experiment. Would momentum be conserved in the
collision? Why or why not?
Optional Equipment
Design and conduct an experiment to investigate conservation of momentum in an inelastic
collision in which the two gliders, instead of bouncing off each other, stick together so that
they move off with identical final velocities. If you are using a PASCO airtrack, replace the
bumpers with the wax and needle. Otherwise, velcro fasteners can be used with most gliders.
16
®
Page 21

012-06379B Photogate Timer
Experiment 7: Conservation of Kinetic Energy
EQUIPMENT NEEDED:
-Two Photogate Timers -Air Track System with two gliders.
Introduction
Momentum is always conserved in collisions that are isolated from external forces. Energy is also
always conserved, but energy conservation is much harder to demonstrate since the energy can
change forms: energy of motion (kinetic energy) may be changed into heat energy, gravitational
potential energy, or even chemical potential energy. In the air track glider collisions you’ll be
investigating, the total energy before the collision is simply the kinetic energy of the gliders:
E
= (1/2)mv
k
2
+ (1/2)mv
1
In this experiment you’ll examine the kinetic energy before and after a collision to determine if
kinetic energy is conserved in air track collisions.
2
.
2
Procedure
c Set up the air track and
photogates as shown in
Figure 7.1, using bumpers
Glider
1
m
1
Photogate
1
on the gliders to provide an
elastic collision. Carefully
level the track.
d Measure m
and m2, the
1
Figure 7.1: Equipment Setup
masses of the two gliders to be used in the collision. Record your results in Table 7.1.
e Measure and record L
and L2, the length of the gliders. (e.g., push glider1 through photogate1 and
1
measure the distance it travels from where the LED comes on to where it goes off again.)
f Set both Photogate Timers to GATE mode, and press the RESET buttons.
g Place glider
surements in Table 7.1 as follows:
t
= the time that glider1 blocks photogate1 before the collision.
1i
t
= the time that glider2 blocks photogate2 before the collision.
2i
t
= the time that glider1 blocks photogate1 after the collision.
1f
t
= the time that glider2 blocks photogate2 after the collision.
2f
at rest between the photogates. Give glider1 a push toward it. Record four time mea-
2
(In this case, there is no t2i since glider2 begins at rest.)
Bumpers
Glider
m
2
Photogate
2
2
➤ ➤
➤ IMPORTANT: The collision must occur after glider
➤ ➤
has passed completely through
1
photogate1 and, after the collision, the gliders must be fully separated before either glider
interrupts a photogate.
➤➤
➤ NOTE: Use the memory function to store the initial times while the final times are being
➤➤
measured. Immediately after the final times are recorded, the gliders must be stopped to prevent
them from triggering the photogate again due to rebounds.
®
17
Page 22

Photogate Timer 012-06379B
h Repeat the experiment several times, varying the mass of one or both gliders and varying the
initial velocity of glider
i Try collisions in which the initial velocity of glider
to coordinate the gliders so the collision takes place completely between the photogates.
.
1
is not zero. You may need to practice a bit
2
Data and Calculations
c For each time that you measured, calculate the corresponding glider velocity (e.g., v
d Use your measured values to calculate E
before and after the collision. Record your results in the table.
Table 7.1 Data and Calculations
L1 =L
m
m
1
t
2
1i
t
2i
t
1f
and Ekf, the combined kinetic energy of the gliders
ki
=
2
t
2f
v
1i
v
2i
v
1f
v
2f
, = L1/t1i).
1
E
ki
E
kf
Questions
c Was kinetic energy conserved in each of your collisions?
d If there were one or more collisions in which kinetic energy was not conserved, where
did it go?
Optional Equipment
Design and conduct an experiment to investigate conservation of kinetic energy in an inelastic
collision in which the two gliders, instead of bouncing off each other, stick together so that
they move off with identical final velocities. If you are using a PASCO air track, replace the
bumpers with the wax and needle. Otherwise, velcro fasteners can be used with most gliders.
18
®
Page 23

012-06379B Photogate Timer
Experiment 8: Conservation of Mechanical Energy
EQUIPMENT NEEDED:
-Photogate timer and Accessory Photogate -air track system with one glider
-block of wood of known thickness (approximately 1-2 cm).
Introduction
Though conservation of energy is one of the most powerful laws of physics, it is not an easy principle to verify. If a boulder is rolling down a hill, for example, it is constantly converting gravitational potential energy into kinetic energy (linear and rotational), and into heat energy due to the
friction between it and the hillside. It also loses energy as it strikes other objects along the way,
imparting to them a certain portion of its kinetic energy. Measuring all these energy changes is no
simple task.
This kind of difficulty exists throughout physics, and physicists meet this problem by creating
simplified situations in which they can focus on a particular aspect of the problem. In this experiment you will examine the transformation of energy that occurs as an airtrack glider slides down an
inclined track. Since there are no objects to interfere with the motion and there is minimal friction
between the track and glider, the loss in gravitational potential energy as the glider slides down the
track should be very nearly equal to the gain in kinetic energy. Stated mathematically:
ΔE
=Δ(mgh)=mgΔh;
k
where Ek is the change in kinetic energy of the glider [ ΔE
= (1/2)mv
k
2
- (1/2)mv
2
2
] and Δ(mgh)
1
is the change in its gravitational potential energy (m is the mass of the glider, g is the acceleration
of gravity, and Δh is the change in the vertical position of the glider).
Procedure
c Level the airtrack as accurately as possible.
d Measure d, the distance between the air track
support legs. Record this distance in Table
8.1.
e Place a block of known thickness under the
support leg of the track. For best accuracy,
the thickness of the block should be measured with calipers. Record the thickness of
the block as h in Table 8.1.
L
h{=
Table 8.1: Data and Calculations
D
d
f Setup the Photogate Timer and Accessory Photogate as shown in Figure 8.1.
g Measure and record D, the distance the glider moves on the air track from where it first triggers the
first photogate, to where it first triggers the second photogate. (You can tell when the photogates
are triggered by watching the LED on top of each photogate. When the LED lights up, the photogate has been triggered.)
h Measure and record L, the effective length of the glider. (The best technique is to move the glider
slowly through one of the photogates and measure the distance it travels from where the LED first
lights up to where it just goes off.)
i Measure and record m, the mass of the glider.
j Set the Photogate Timer to GATE mode and press the RESET button.
k Hold the glider steady near the top of the air track, then release it so it glides freely through the
®
19
Page 24

Photogate Timer 012-06379B
photogates. Record t1, the time during which the glider blocks the first photogate, and t2, the
time during which it blocks the second photogate. (If you have an ME-9215A Photogate
Timer, the memory function will make it easier to measure the two times. If not, someone
will need to watch the timer during the experiment and quickly record t1 before the glider
reaches the second photogate.)
l Repeat the measurement several times and record your data in Table 8.1. You needn’t release
the glider from the same point on the air track for each trial, but it must be gliding freely and
smoothly (minimum wobble) as it passes through the photogates.
Change the mass of the glider by adding weights and repeat steps 7 through 10. Do this for at
11
least five different masses, recording the mass (m) for each set of measurements. (If you have
time, you may also want to try changing the height of the block used to tilt the track or the
distance between the photogates.)
Table 8.1 Data and Calculations
d = h =
D = L = m =
m θ t
1
t
2
v
1
v
2
E
k1
E
k2
Data and Calculations
c Calculate θ, the angle of incline for the air track, using the equation θ = arctan (h/d).
For each set of time measurements:
d Divide L by t
each photogate.
and t2 to determine v1 and v2, the velocity of the glider as it passed through
1
Δ(mgh)
e Use the equation E
= (1/2)mv2 to calculate the kinetic energy of the glider as it passed
k
through each photogate.
f Calculate the change in kinetic energy, ΔE
= Ek2 - Ek1.
k
g Calculate Δh, the distance through which the glider dropped in passing between the two
photogates ( Δh = D sin θ, where θ = arctan h/d).
h Compare the dimetic energy gained wiht the loss in gravitational potential energy. Was me-
chanical energy conserved in the motion of the glider?
20
®
Page 25

012-06379B Photogate Timer
Experiment 9: Elastic-Kinetic Energy
EQUIPMENT NEEDED:
-Photogate timer -Air Track with one glider
-Weight hanger with weights -Flag (see Procedure 1 below)
-Spring (with a low spring constant)
Introduction
It takes work to stretch or compress a spring. Suppose a spring has a natural (unstretched) length
L0, and a spring constant k. If that spring is stretched or compressed to a new length, L = L0 ± x,
the work required is given by the expression 1/2 kx2. If the energy stored in the spring is then used
to accelerate an object, the kinetic energy of the object, 1/2 mv2, will be equivalent to the work that
was originally stored in the spring. In this lab you will investigate this equivalency between the
work stored in a stretched spring and the kinetic energy it can impart to an object.
Procedure
c Set up the equipment as
shown in Figure 9.1, and
Spring
Platform
Flag
level the track. As shown,
attach a cardboard flag to
your glider with masking
tape. The flag can be
from 1 to 5 cm wide.
Make a platform for your
spring, so it will be supported horizontally and
Figure 9.1: Equipment Setup
will not sag. Attach the
platform securely to the end of the air track. Connect the spring to the glider with a piece of thread
so that the glider is about in the middle of the air track with the spring unstretched. Run another
piece of thread from the glider over a pulley at the end of the track and attach it to a hanger.
Thread (attached to plug at
bottom of flag)
Hang weights for
calibration of spring
d Hang masses on the hanger and determine how far the spring stretches. This is easily done using
the metric scale on the side of the air track and using the glider to monitor the distance the spring
has extended. Record the masses added and the position of the glider in Table 9.1. (The air flow
should be on while gathering this data.) Then remove the hanger and thread.
e Measure and record m, the mass of your glider and flag, in Table 9.2. Then pass the glider slowly
through the photogate and note the position of the glider when the LED on the photogate first goes
on and again when the LED goes off. The difference between these positions is Δd. Record Δd
on the following page.
f Position the glider so the spring exerts no force on the glider, but the thread does not sag. Record
this glider position as x
. Position the photogate between the glider and the spring.
1
g Pull the glider approximately 5 cm farther away from the spring. Measure the distance between
this glider position and x
, and record this distance as the Spring Stretch in Table 9.2.
1
h Set the Photogate Timer to GATE mode and press the RESET button.
i Hold the glider steady as you turn the air flow on. Release the glider, but catch it before it crashes
into the spring platform. Record the measured time as t
®
in Table 9.2.
1
21
Page 26

Photogate Timer 012-06379B
j Repeat steps 5-8 four more times. Record your times as t
the average of these five times and record this value as t
through t5 in Table 9.2. Determine
2
.
avg
k Repeat steps 5-9 for different distances of stretch of the spring up to 20 cm. Also try varying
the mass of the glider by adding masses to it. Note the new masses in Table 9.2.
Data and Calculations
On another sheet of paper:
c Determine k, the spring constant of your spring. Construct a graph of the stretch of the spring
versus the amount of force applied to it by the hanging weights. The slope of this graph, in
newtons/meter, is equal to k.
d For each set of trials you performed for a given spring stretch and glider mass, divide Δd by
your average time to determine the average velocity of the glider as it passed through the
photogate. Calculate the final kinetic
energy of the glider, 1/2 mv
2
.
Table 9.1 Determining the Spring Constant
e Calculate the energy stored in the spring
in each case, 1/2 kx
spring constant, and x is the spring
stretch.
2
, where k is the
Added Glider Applied Spring
Mass Position Force Stretch
f For each trial, determine the percentage
difference between the elastic potential
energy stored in the spring and the final
translational kinetic energy of the glider.
x1 =
Trial m
Table 9.2 Spring Stretch and Glider Velocities
Flag width,
Δ Δ
Δd
Δ Δ
=
Spring
Stretch
t
1
t
2
t
3
22
t
4
t
5
t
avg
®
Page 27

012-06379B Photogate Timer
Experiment 10: Pendulum Motion
EQUIPMENT NEEDED:
-Photogate timer -Meter stick.
-Pendulums of various masses and lengths (the pendulum bob should be no more than 3 cm in diameter)
Introduction
In this experiment, you will investigate two aspects of pendulum motion.
First you will investigate the relationship between pendulum length, pendulum mass, and the period of oscillation. Then you will determine
whether mechanical energy is conserved as the pendulum swings.
Procedure
Part 1: Period of Oscillation versus Mass and Length
c Measure the mass of the pendulum bob. Record this value as m in Table
10.1.
d Set up the pendulum and photogate as shown in Figure 10.1. For best
results, the pendulum should be suspended from two points as shown.
This helps keep the swing of the pendulum in the plane perpendicular to
the photogate.
e Measure and record L, the length of the pendulum. (If you are suspending
the bob from two points, L is the distance from the center of mass of the
bob to the point midway between the points of suspension.)
f Set the Photogate Timer to GATE mode. Adjust the height of the photo-
gate so the bob interrupts the photogate beam as it swings.
g Switch the Timer to PENDULUM mode. Start the bob swinging, but keep
the swings relatively small.
h Press the RESET button on the Timer. Note the first time displayed. This
is the period of the pendulum, the time for one complete oscillation. Repeat this measurement several times by pressing the RESET button and recording the first time measured. Take the average of
these measured times to determine T, the period of the pendulum. Record T in Table 10.1.
i Change the mass of the pendulum bob and repeat the mea-
surement. Do this for several different mass values, keeping
the length constant.
j Using one of the masses you used from a previous measure-
ment, change the string length and remeasure the period. Do
this for at least 5 different string lengths.
Part 2: Conservation of Mechanical Energy
c Use a long string (at least one meter long), to suspend the
pendulum between the photogate as shown on Fig 10.1.
Make and attatch a rigid protractor as shwon on Fig 10.1.
This protractor can be created by photocoping the angular
readings of a compass onto a piece of white paper before
attatching it to a rigid board by means of adhesive. This
compass-board will be used to keep track of θ, the angle
between the string and the vertical..
d Measure L, the length of the pendulum.
Thread
Protractor
Detail
Figure 10.1: Equipment
LED comes on
Photogate
Figure 10.2: Measuring
Δd
Protractor
LED goes off
Meter Stick
Δ Δ
Δd
Δ Δ
L
®
23
Page 28

Photogate Timer 012-06379B
e Now adjust the position of the photogate as accurately as you can so that the photogate beam
strikes the center of the pendulum bob.
f Support a meter stick just under the bob, so you can measure the position of the bob but the
meter stick does not interfere with the photogate beam (see Figure 10.2). Pull the pendulum
bob to one side, then move it slowly through the photogate, along its path of oscillation. There
should be no slack in the string. Using the meter stick, note the position of the bob when the
photogate beam is first interrupted (the LED lights up) and again when the bob is out of the
beam (the LED goes off). Record the difference between these two points as Δd in Table 10.2.
g Now set the Photogate Timer to GATE mode. Pull the bob to one side along its path of oscilla-
tion. Again, be sure there is no slack in the string. Measure the angle the string makes with the
vertical and record this starting angle as θ in Table 10.2.
h Release the bob so the pendulum oscillates. Record the first times you see on the timer display.
This is the time during which the bob blocked the photogate beam as it passed through the photogate. Repeat this measurement several times, starting the bob from the same height each time.
Take the average of your measured times and record this value as t in Table 10.2.
i Change the starting height of the bob and repeat steps 4 through 5. Do this for at least five dif-
ferent starting heights.
Data and Calculations
Part 1
c Plot a graph of T versus L, using your measured values from Table 10.1. Is the graph a straight
line? If not, try manipulating the data mathematically until you do get a straight line. For example, try plotting T2, L2, etc. When you get a straight line graph, measure the slope of the
graph.
Slope =
Part 2
d For each value of θ, calculate Δh = L-L cosθ.
e For each value of h, calculate ΔU, the change in gravitational potential
energy of the pendulum as it went from the highest point in its swing to
the lowest.
ΔU = mg Δh
=
mL T
f For each value of h, calculate Ek, the total kinetic energy of the pendulum
as it passed through the lowest point of its swing:
E
= 1/2 mv2 = 1/2 m ( Δd/t)2 =
k
Table 10.1
24
®
Page 29
012-06379B Photogate Timer
Questions
c Discuss your graphs of pendulum period versus mass and length. What relationship between mass and length
produces a straight line graph?
d Did the period of your pendulum vary with the mass of the bob? Discuss why it did or did not.
e Was mechanical energy conserved during a single swing of the pendulum?
f No matter how high the initial height of the bob, the pendulum ultimately slows down and stops. Does this
slowing down defy the principle of the conservation of energy? Explain.
Table 10.2
L =
Δd =
m =
θ t Δh ΔUE
(m)
(m)
(Kg)
k
(deg) (S) (m) (J) (J)
®
25
Page 30

Photogate Timer 012-06379B
26
®
Page 31

012-06379B Photogate Timer
Teachers Guide
Exp. 1 - Instantaneous Versus Average Velocity
Notes - on Procedure, Experiment 1:
Instantaneous vs Average Velocity
f In order to accurately measure D, allow D to the be the
distance between the points where the glider first triggers the Photogate Timers.
i If the Photogate Timer does not have a memory func-
tion, after the glider has passed through both
photogates, prevent it from triggering the Photogate
Timer again upon rebound.
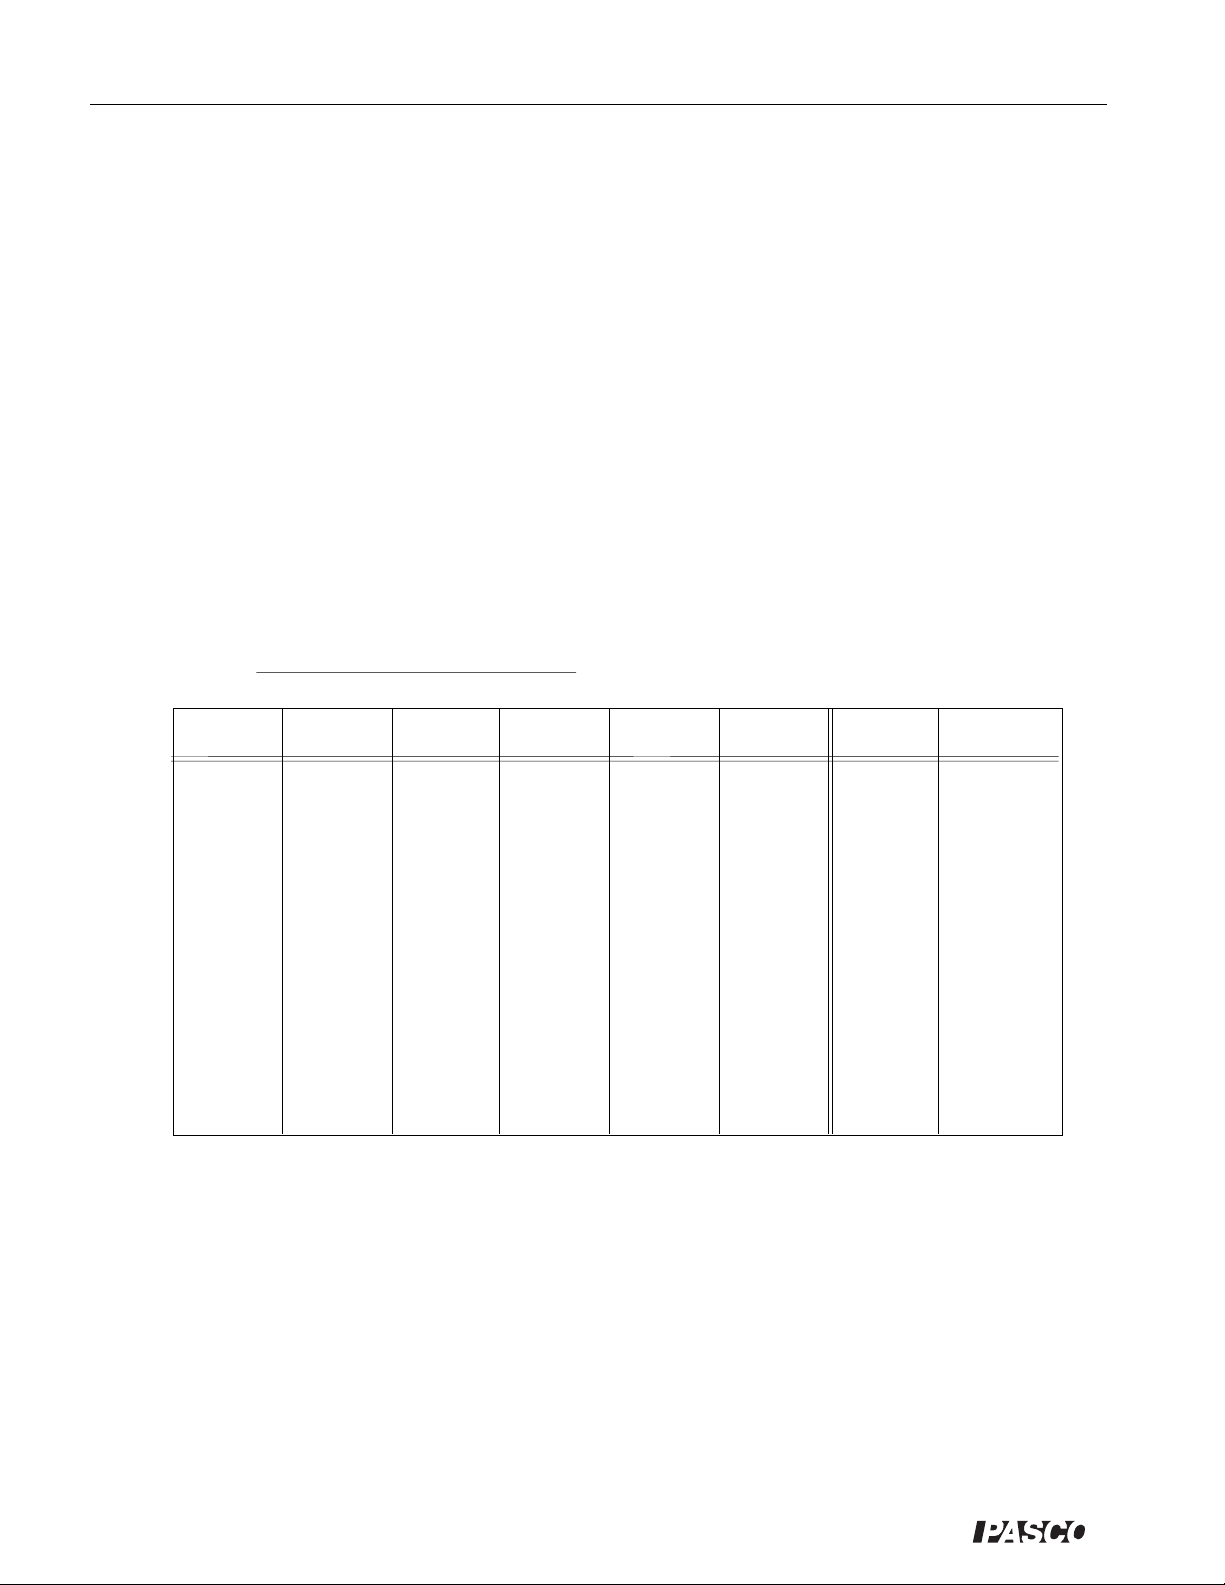
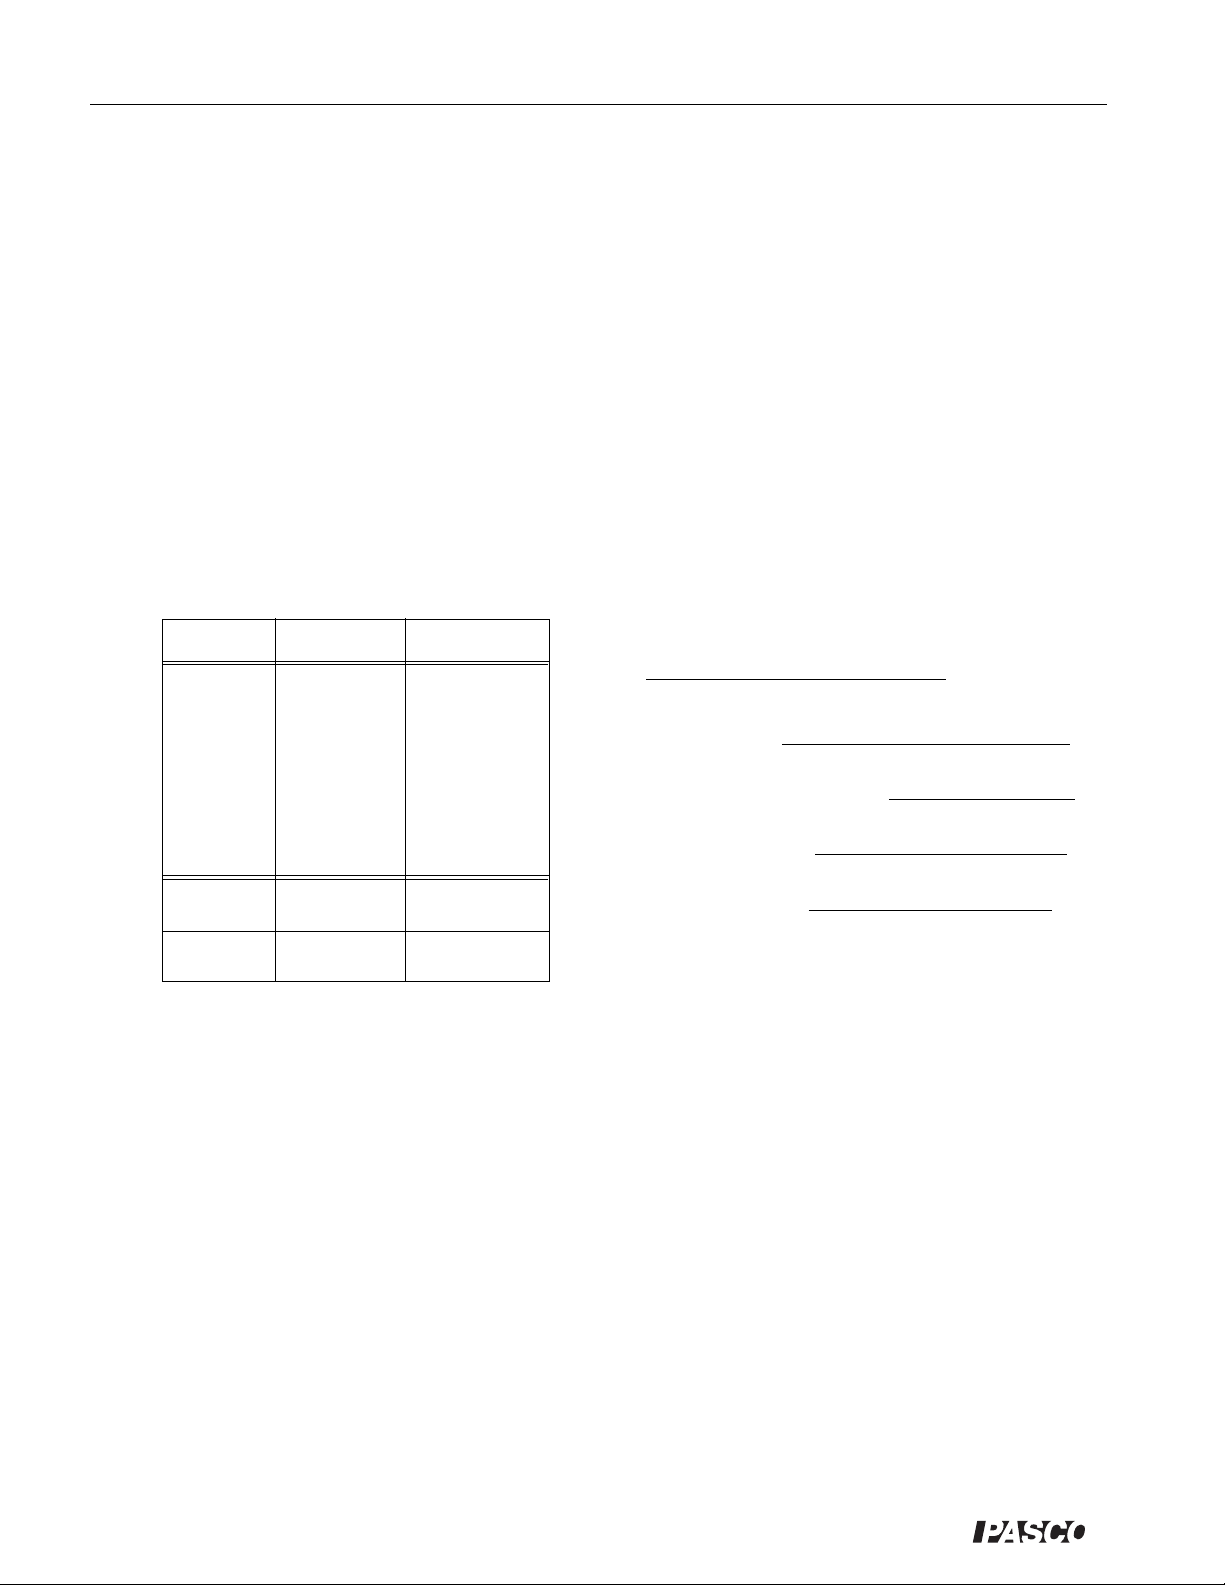
Table 1.1
X1 = 100.0 cm
Dt1t
(cm) (s) (s) (s) (s) (s) (s) (m/s)
80 1.85 1.85 1.85 1.86 1.86 1.85 0.43
70 1.61 1.61 1.61 1.61 1.62 1.61 0.43
60 1.37 1.38 1.38 1.37 1.38 1.38 0.44
50 1.13 1.14 1.14 1.13 1.14 1.14 0.44
40 0.90 0.90 0.91 0.90 0.90 0.90 0.44
30 0.68 0.68 0.68 0.68 0.68 0.68 0.44
20 0.45 0.45 0.45 0.45 0.45 0.45 0.45
2
t
3
Notes - on Analysis
Here are the results for the measurement of average velocities with Photogate Timers positioned at seven different distances apart.
t
4
t
5
t
avg
v
avg
Here is a plot of the average velocities of the glider being
measured by Photogate Timers positioned at seven different distances apart.
®
Answers - to Questions
c The average velocity becomes a closer approximation
to the instantaneous velocity when the distance between the photogates is reduced.
d Yes. The maximum error can be evaluated using the
standard deviation or best fit methods.
e Timer accuracy has the greatest impact on the accu-
racy of velocity measurements. The ability to measure
small time intervals accurately will allow a better approximation of the instantaneous velocity. The object
being timed and type of motion should not influence
the accuracy of the measurements.
f Instantaneous velocity is always inferred from an aver-
age velocity.
27
Page 32

Photogate Timer 012-06379B
Exp. 2 - Kinematics on an Inclined Plane
Notes - on Procedure, Experiment 2:
Kinematics on an Inclined Plane
f If the ramp tends to wobble upon ball release, stabilize
it by holding on to the upper end of the ramp.
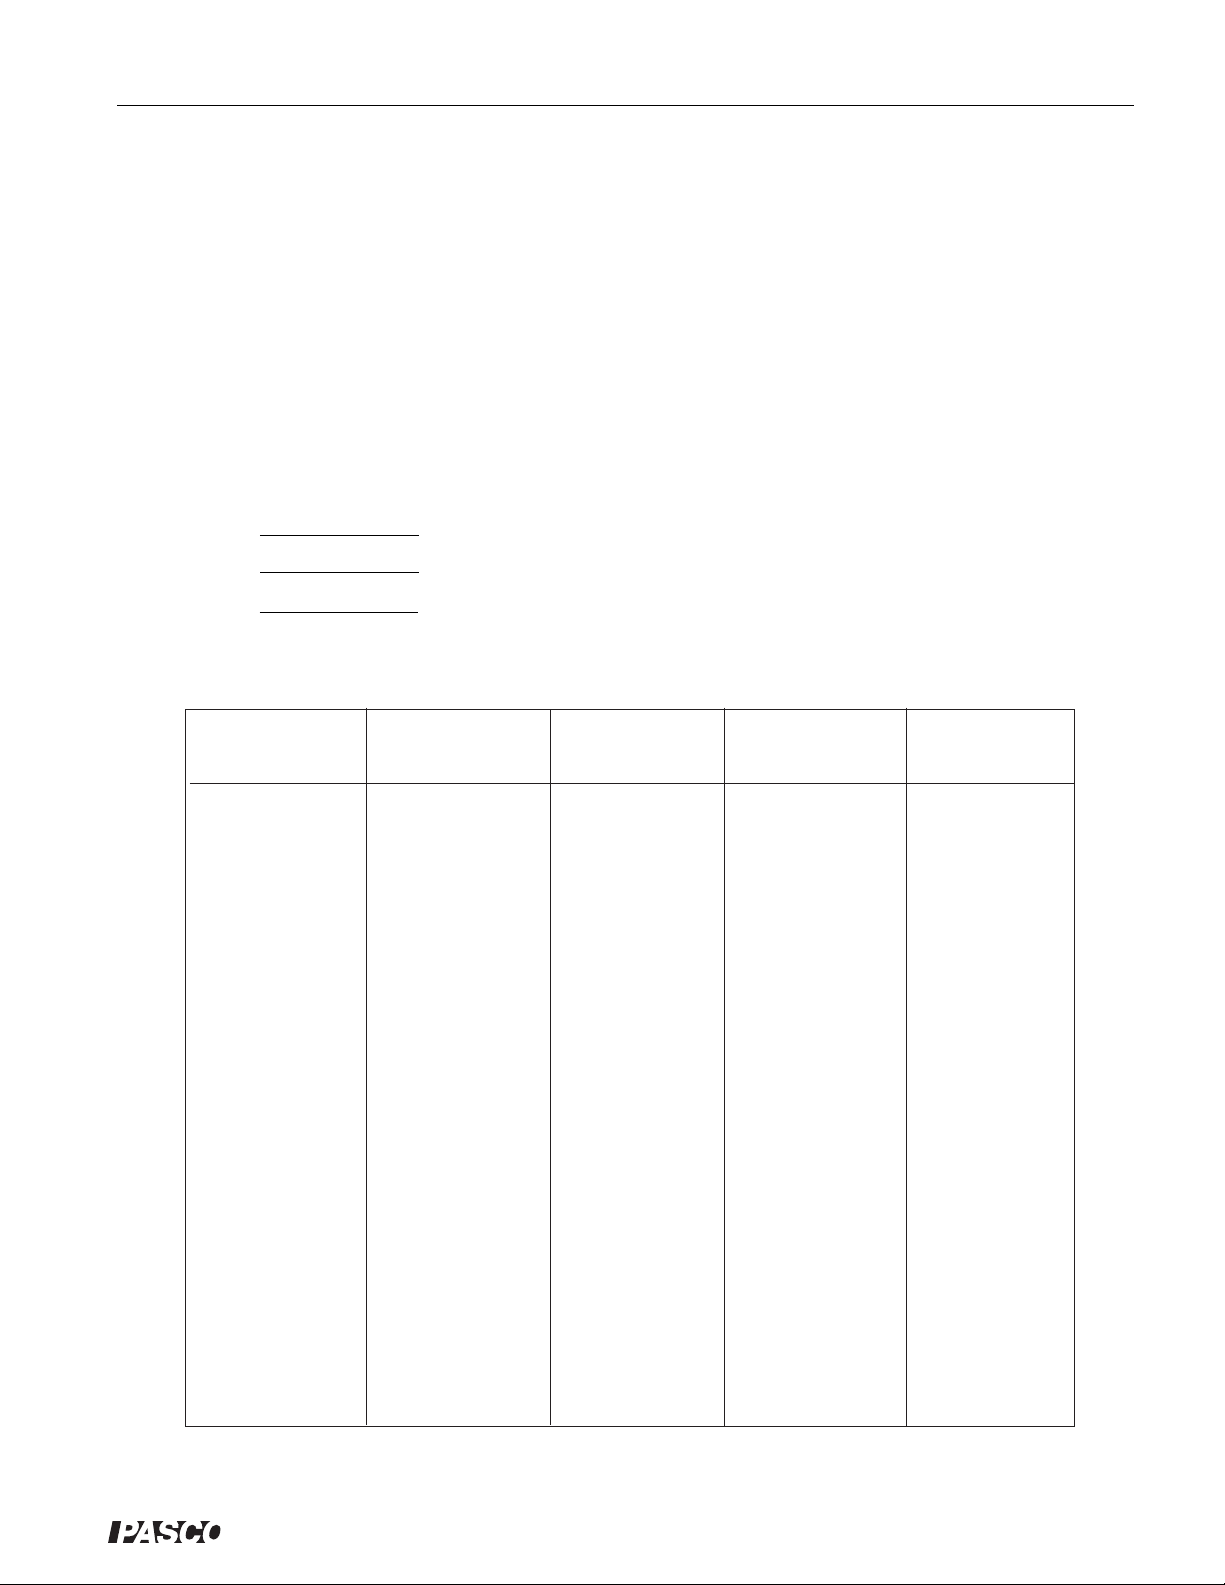
Table 2.1
Δd = 1.6 cm
Distance t1 t2 t3 t4 Average Final
Travelled Time Velocity
(cm) (s) (s) (s) (s) (s) (m/s)
5 0.07 0.07 0.07 0.07 0.07 0.22
10 0.05 0.05 0.05 0.05 0.05 0.30
15 0.04 0.04 0.04 0.04 0.04 0.37
20 0.04 0.04 0.04 0.04 0.04 0.42
25 0.03 0.03 0.03 0.03 0.03 0.47
30 0.03 0.03 0.03 0.03 0.03 0.52
35 0.03 0.03 0.03 0.03 0.03 0.55
40 0.03 0.03 0.03 0.03 0.03 0.59
Notes - on Analysis
Here are the results for the measurement of the fnal velocities of the ball down the incline plane.
Here is a plot of describing the linear relationship between the squared of the final velocity and distance travelled by the ball down the incline plane.
The mathematical relationship being depicted by the plot
2
2
v
-v
= 0.861 D
f
i
Answers - to Questions
c Yes. a = 0.43 m/s
2
d . This is because time can be accurately
measured. This is not true for velocity and
accceleration for complex motions.
is
28
®
Page 33

012-06379B Photogate Timer
Exp 3 - Speed of a Projectile
Notes - on Procedure
Slide a horizontal plate against the ramp if needed to
c
ensure that the ball is rolling on a nearly continous surface. This is critical for the success of the ensuing
experiments.
Δd (cm) = 1.60
Trial Time d
1 0.0161 40.7 73.3
2 0.0161 40.7 73.3
3 0.0161 40.7 73.3
4 0.0161 40.7 73.3
5 0.0161 40.7 73.3
Averages 0.0161 40.7 73.3
e If the ramp tends to wobble upon ball release, stabilize
it by holding on to the upper end of the ramp using a
clamp.
Notes - on Analysis
Here are the results for the measurement of the fnal velocities of the ball down the incline plane.
Table 3.1
x
(s) (cm) (cm)
v
exp 0.99 m/s
o
v
theo 1.05 m/s
o
% of Error 5.56 %
d
y
Exp 4 - Newton's Second Law
Notes - on Procedure
➤➤
c
➤ IMPORTANT: Elevate the Air track setup if
➤➤
neccessary to prevent the weight hanger from striking
the ground before the glider clears the final photogate.
➤ ➤
➤ NOTE: The placement of the final photogate
➤ ➤
can be easily obtained by allowing the glider to
slide forward until the weight hanger nearly
reaches the ground.
Table 4.1 Constant System Mass
MMat1t1+t
(g) (g) (s) (s) (s) (s) (m/s) (m/s) (m/s^2) (N)
260.5 10.3 0.31 0.48 0.17 1.19 0.41 0.76 0.30 0.10
240.48 30.32 0.20 0.30 0.10 0.68 0.65 1.22 0.84 0.30
220.47 50.33 0.14 0.21 0.07 0.54 0.93 1.70 1.45 0.49
200.47 70.33 0.11 0.18 0.06 0.44 1.10 1.99 2.02 0.69
2
e Mount the hook into the bottom hole of the glider. To
counterbalance its weight, add an accessory with similar weight to the opposite end of the glider as shown.
The tables below list the results from two experimental
conditions. The value of each parameter was the average
derived after five trials.
t
2
t
3
v
1
v
2
aF
a
®
29
Page 34

Photogate Timer 012-06379B
Table 4.2 Constant Accelerating Force
MMat
1
t1+t
2
t
2
t
3
v
1
v
2
aFa
(g) (g) (s) (s) (s) (s) (m/s) (m/s) (m/s^2) (N)
240.48 10.3 0.30 0.46 0.16 1.15 0.42 0.79 0.32 0.10
220.48 10.3 0.29 0.44 0.15 1.11 0.43 0.83 0.36 0.10
200.48 10.3 0.28 0.42 0.14 1.06 0.46 0.88 0.39 0.10
Notes - on Analysis
e yes. The acceleration of the glider is linearly propor-
tional to the applied force. The acceleration of the
glider is inversely proprotional to the glider mass.
f The relationship among applied force, mass and
acceleration seemed to obey Newton’s Second Law of
Motion F = ma. Yes. Instantaneous accelearation is
defined as change of velocity per unit of time. As the
incremental time period or the length of the object being
measured becomes sufficiently small, the acceleration
being measured will become a better approximation of
the instantaneous accelearation. One way to include
instantaneous accelearation in the axperiement is to
reduce the distance between the photogates.
30
®
Page 35

012-06379B Photogate Timer
Exp 5 - The Force of Gravity
Notes - on Procedure
f In order to mantain a constant D throughout the
experiement, It is recommended that the Photogate
The tables below list the results from two experiemtnal
conditions. The value of each parameter was the average
derived after numerous trials.
Timers be held down to their respective locations by
means of tape.
Table 5.1
d (cm) = 100 D (cm) = 80 h (cm) = 1.3 L (cm) = 12.6 θ = 0.013 rad
mt1 t1+t
2
(g) (s) (s) (s) (m/s) (m/s) (m/s^2) (N)
180.2 0.35 0.57 0.22 0.36 0.57 0.12 1.66
200.2 0.35 0.57 0.22 0.36 0.57 0.12 1.84
220.2 0.35 0.57 0.22 0.36 0.57 0.12 2.03
240.3 0.35 0.57 0.22 0.36 0.57 0.12 2.23
t
2
v
1
v
2
a
avg
F
g
Table 5.2
d (cm) = 100 D (cm) = 80 h (cm) = 2.6 L (cm) = 12.6 θ = 0.026 rad
mt1t1+t
2
(g) (s) (s) (s) (m/s) (m/s) (m/s^2) (N)
180.2 0.25 0.40 0.16 0.51 0.80 0.24 1.67
220.2 0.25 0.41 0.16 0.51 0.80 0.24 2.00
261.6 0.25 0.41 0.16 0.51 0.80 0.24 2.43
t
2
v
1
v
2
a
avg
F
g
Notes - on Analysis
c Yes. Yes. Yes. g ≅ 9.33 m/s
value is approximately 5% below the established value
of 9.80 m/s
2
.These results however seemed to reaffirm
®
2
in both cases.This
that gravitational acceleration is for all practicality
constant for different masses and altitudes near the
earth’s surface. Try repeat the experiements for higher
values of h.
31
Page 36

Photogate Timer 012-06379B
Notes - on Questions
Yes. This assumption can be tested by setting the
c
photogates at a fixed distance apart but moving them
along the air track to measure and compare the average accelerations along the line of motion.
d This equation is valid if and only if the acceleration is
truly constant. Yes.
Exp 6 - Conservation of Momentum
Notes - on Procedure
i
In order to ensure that the gliders are as close to
travelling at constant velocities as possible prior to
collision, the distance between the photogates should be
reduced. Also, the gliders should be pushed to collide
with the ends of air track so that the rebounded gliders
will have near constant velocities prior to triggering the
photogates.
Table 6.1 Glider 2 is initially Stationary
e No. The gravitional force by the earth on the moon
and vice versa is described by
F =
where:
G = universal gravitational constant
m
= Mass of Earth
1
= Mass of Moon
m
2
R = Distance between the centers of
gravity of the two bodies
The tables below list the results from two experimental
conditions. Table 6.1 presents the results of elastic collision with one glider being initially stationary. Table 6.2
presents the results of elastic collision with both gliders
moving intially.
,
L1 = 12.6 cm L2 = 12.8 cm Distance Between Photogates = 79.8cm
m
1
(g) (g) (s) (s) (s) (s) (m/s) (m/s) (m/s) (m/s) (kg*m/s) (kg*m/s) (%)
180.2 201.3 0.275 N/A 3.81 0.318 0.46 0 -0.03 0.40 0.08 0.08 9.08
180.2 201.3 0.33 N/A 4.267 0.381 0.38 0 -0.03 0.34 0.07 0.06 9.44
180.2 201.3 0.242 N/A 3.369 0.278 0.52 0 -0.04 0.46 0.09 0.09 8.40
180.2 201.3 0.295 N/A 3.43 0.341 0.43 0 -0.04 0.38 0.08 0.07 10.43
180.2 201.3 0.239 N/A 3.635 0.274 0.53 0 -0.03 0.47 0.10 0.09 7.59
180.2 261.5 0.492 N/A 3.956 0.637 0.26 0 -0.03 0.20 0.05 0.05 -1.43
180.2 261.5 0.38 N/A 2.597 0.481 0.33 0 -0.05 0.27 0.06 0.06 -1.83
180.2 261.5 0.243 N/A 1.513 0.309 0.52 0 -0.08 0.41 0.09 0.09 0.13
180.2 261.5 0.202 N/A 1.164 0.256 0.62 0 -0.11 0.50 0.11 0.11 1.03
180.2 261.5 0.274 N/A 1.625 0.35 0.46 0 -0.08 0.37 0.08 0.08 1.45
180.2 302.2 0.4 N/A 1.747 0.562 0.31 0 -0.07 0.23 0.06 0.06 1.64
180.2 302.2 0.31 N/A 1.317 0.436 0.41 0 -0.10 0.29 0.07 0.07 2.41
180.2 302.2 0.262 N/A 1.119 0.366 0.48 0 -0.11 0.35 0.09 0.09 1.46
180.2 302.2 0.246 N/A 1.053 0.342 0.51 0 -0.12 0.37 0.09 0.09 0.82
m
2
t
1i
t
2i
t
t
1f
v
2f
v
1i
v
2i
1f
v
2f
P
i
Pf% Error
180.2 402.5 0.3 N/A 0.834 0.51 0.42 0 -0.15 0.25 0.08 0.07 2.50
180.2 402.5 0.15 N/A 0.421 0.259 0.84 0 -0.30 0.49 0.15 0.14 4.22
180.2 402.5 0.219 N/A 0.602 0.368 0.58 0 -0.21 0.35 0.10 0.10 1.34
180.2 402.5 0.214 N/A 0.596 0.363 0.59 0 -0.21 0.35 0.11 0.10 2.14
180.2 402.5 0.171 N/A 0.473 0.287 0.74 0 -0.27 0.45 0.13 0.13 0.96
32
®
Page 37

012-06379B Photogate Timer
Table 6.2 Both Gliders have Initial Velociies
L1 = 12.6 cm L2 = 12.8 cm Distance Between Photogates = 60cm
m
m
1
t
2
1i
t
t
2i
1f
t
2f
v
1i
v
v
2i
v
1f
2f
P
i
P
f
(g) (g) (s) (s) (s) (s) (m/s) (m/s) (m/s) (m/s) (kg*m/s) (kg*m/s) (%)
180.2 261.3 0.362 0.422 0.312 0.589 0.35 -0.303 -0.40 0.22 -0.02 -0.02 3.31
180.2 261.3 0.353 0.427 0.313 0.568 0.36 -0.300 -0.40 0.23 -0.01 -0.01 2.51
180.2 261.3 0.49 0.468 0.356 0.848 0.26 -0.274 -0.35 0.15 -0.03 -0.02 3.15
180.2 261.3 0.461 0.574 0.42 0.726 0.27 -0.223 -0.30 0.18 -0.01 -0.01 11.38
180.2 261.3 0.486 0.593 0.435 0.778 0.26 -0.216 -0.29 0.16 -0.01 -0.01 4.93
L1 = 12.8 cm L2 = 12.6 cm Distance Between Photogates = 60cm
m
m
1
(g) (g) (s) (s) (s) (s) (m/s) (m/s) (m/s) (m/s) (kg*m/s) (kg*m/s) (%)
261.3 180.2 0.349 0.285 0.475 0.265 0.37 -0.442 -0.27 0.48 0.02 0.02 5.57
261.3 180.2 0.442 0.354 0.583 0.332 0.29 -0.356 -0.22 0.38 0.01 0.01 4.44
261.3 180.2 0.491 0.451 0.769 0.372 0.26 -0.279 -0.17 0.34 0.02 0.02 1.31
261.3 180.2 0.4 0.327 0.542 0.302 0.32 -0.385 -0.24 0.42 0.01 0.01 4.99
261.3 180.2 0.346 0.298 0.503 0.264 0.37 -0.423 -0.25 0.48 0.02 0.02 4.70
Notes - on Questions
t
2
1i
t
2i
t
t
1f
2f
v
1i
v
2i
v
v
1f
2f
P
i
P
f
General Notes
% Error
% Error
c No. In most cases, there is slight loss of momentum due
to existence of slightly inelastic collisions. Secondly, as
the gliders collide, the linear motion of the gliders may
be changed to include vibvrations that introduced
additional loss of momentum due to friction or drag.
d Yes. This the definition for the conservation of momen-
tum.
e No. In this case momentum is added or lost due to the
influenced of gravitational acceleration.
Generally the amount of momentum loss in the collisions
for this experiement ranged from 1% to 11%. Momentum loss is contributed by equipment setup and the inability to maintain a constant velocity throughout the
experiement. It however also points out the fact that
mommentum is always loss not gained. The increased in
momentum in one or two cases is due to additional influences such as gravitational introduced by unlevelled
airtrack .
®
33
Page 38

Photogate Timer 012-06379B
Exp 7 - Conservation of Kinetic Energy
Notes - on Procedure
i In order to ensure that the gliders are as close to
travelling at constant velocities as possible prior to
collision, the distance between the photogates should be
reduced. Also, the gliders should be pushed to collide
The tables below list the results from two experiemtnal
conditions. Table 7.1 presents the results of elastic collision with one glider being initially stationary. Table 7.2
presents the results of elastic collision with both gliders
moving intially.
with the ends of air track so that the rebounded gliders
will have near constant velocities prior to triggering the
photogates.
Table 7.1 Glider 2 is Initially Stationary
L1 = 12.6 cm L2 = 12.8 cm Distance Between Photogates = 79.8cm
m
1
(g) (g) (s) (s) (s) (s) (m/s) (m/s) (m/s) (m/s) (J) (J) (%)
180.2 201.3 0.275 N/A 3.81 0.318 0.46 0 -0.03 0.40 0.02 0.02 13.26
180.2 201.3 0.33 N/A 4.267 0.381 0.38 0 -0.03 0.34 0.01 0.01 12.92
180.2 201.3 0.242 N/A 3.369 0.278 0.52 0 -0.04 0.46 0.02 0.02 12.12
180.2 201.3 0.295 N/A 3.43 0.341 0.43 0 -0.04 0.38 0.02 0.01 12.98
180.2 201.3 0.239 N/A 3.635 0.274 0.53 0 -0.03 0.47 0.03 0.02 11.85
180.2 261.5 0.492 N/A 3.956 0.637 0.26 0 -0.03 0.20 0.01 0.01 9.11
180.2 261.5 0.38 N/A 2.597 0.481 0.33 0 -0.05 0.27 0.01 0.01 4.39
180.2 261.5 0.243 N/A 1.513 0.309 0.52 0 -0.08 0.41 0.02 0.02 4.80
180.2 261.5 0.202 N/A 1.164 0.256 0.62 0 -0.11 0.50 0.04 0.03 3.74
180.2 261.5 0.274 N/A 1.625 0.35 0.46 0 -0.08 0.37 0.02 0.02 5.37
m
2
t
t
1i
t
2i
1f
t
2f
v
v
1i
v
2i
1f
v
2f
E
ki
Ekf% Error
180.2 302.2 0.4 N/A 1.747 0.562 0.31 0 -0.07 0.23 0.01 0.01 7.08
180.2 302.2 0.31 N/A 1.317 0.436 0.41 0 -0.10 0.29 0.01 0.01 6.97
180.2 302.2 0.262 N/A 1.119 0.366 0.48 0 -0.11 0.35 0.02 0.02 5.83
180.2 302.2 0.377 N/A 1.408 0.474 0.33 0 -0.09 0.27 0.01 0.01 -16.65
180.2 302.2 0.246 N/A 1.053 0.342 0.51 0 -0.12 0.37 0.02 0.02 5.00
180.2 402.5 0.3 N/A 0.834 0.51 0.42 0 -0.15 0.25 0.02 0.01 7.30
180.2 402.5 0.15 N/A 0.421 0.259 0.84 0 -0.30 0.49 0.06 0.06 9.99
180.2 402.5 0.219 N/A 0.602 0.368 0.58 0 -0.21 0.35 0.03 0.03 5.13
180.2 402.5 0.214 N/A 0.596 0.363 0.59 0 -0.21 0.35 0.03 0.03 6.99
180.2 402.5 0.171 N/A 0.473 0.287 0.74 0 -0.27 0.45 0.05 0.05 5.10
34
®
Page 39

012-06379B Photogate Timer
Table 7.2 Both Gliders have Initial Velociies
L1 = 12.6 cm L2 = 12.8 cm Distance Between Photogates = 60cm
m
m
1
2
t
1i
t
2i
t
1f
t
2f
v
1i
v
2i
v
1f
v
2f
P
i
Pf% Error
(g) (g) (s) (s) (s) (s) (m/s) (m/s) (m/s) (m/s) (kg*m/s) (kg*m/s) (%)
180.2 261.3 0.362 0.422 0.312 0.589 0.35 -0.30332 -0.40 0.22 0.02 0.02 9.03
180.2 261.3 0.353 0.427 0.313 0.568 0.36 -0.29977 -0.40 0.23 0.02 0.02 8.54
180.2 261.3 0.49 0.468 0.356 0.848 0.26 -0.27350 -0.35 0.15 0.02 0.01 9.33
180.2 261.3 0.461 0.574 0.42 0.726 0.27 -0.22300 -0.30 0.18 0.01 0.01 7.99
180.2 261.3 0.486 0.593 0.435 0.778 0.26 -0.21585 -0.29 0.16 0.01 0.01 8.63
L1 = 12.8 cm L2 = 12.6 cm Distance Between Photogates = 60cm
m
m
1
(g) (g) (s) (s) (s) (s) (m/s) (m/s) (m/s) (m/s) (kg*m/s) (kg*m/s) (%)
261.3 180.2 0.349 0.285 0.475 0.265 0.37 -0.44211 -0.27 0.48 0.04 0.03 15.14
261.3 180.2 0.442 0.354 0.583 0.332 0.29 -0.35593 -0.22 0.38 0.02 0.02 13.84
261.3 180.2 0.491 0.451 0.769 0.372 0.26 -0.27938 -0.17 0.34 0.02 0.01 12.29
261.3 180.2 0.4 0.327 0.542 0.302 0.32 -0.38532 -0.24 0.42 0.03 0.02 14.15
261.3 180.2 0.346 0.298 0.503 0.264 0.37 -0.42282 -0.25 0.48 0.03 0.03 14.72
Notes - on Questions
c Yes.
d In most cases, there was a slight loss of kinetic
energy due to existence of slightly inelastic colli-
t
2
1i
t
2i
t
1f
t
2f
v
1i
v
2i
v
1f
v
2f
P
i
Pf% Error
sions. Secondly, as the gliders collided, the linear motion
of the gliders might be changed to include vibvrations thus
converting simple kinetic energy to include vibrational
energy not accounted for. Some of the kinetic energy was
converted into heat due to friction.
Exp 8 - Conservation of Mechanical Energy
Notes - on Analysis
The tables below list the typical results for the experiment performed at two different incline angles.
Table 8.1
d = 100 cm h = 1.3 cm
D = 80 cm L= 12.6 cm θ= 0.013 rad
mt1t
2
v
1
v
2
E
k1
E
k2
Ek2-E
(g) (s) (s) (m/s) (m/s) (J) (J) (J) (J) (%)
180.2 0.35 0.22 0.36 0.57 0.01 0.03 0.02 0.02 5.82
200.2 0.35 0.22 0.36 0.57 0.01 0.03 0.02 0.02 6.31
220.2 0.35 0.22 0.36 0.57 0.01 0.04 0.02 0.02 5.75
240.3 0.35 0.22 0.36 0.57 0.02 0.04 0.02 0.02 5.39
301.8 0.35 0.22 0.36 0.57 0.02 0.05 0.03 0.03 5.53
®
35
ΔΔ
Δ(mgh) % Error
ΔΔ
k1
Page 40

Photogate Timer 012-06379B
Table 8.2
d = 100 cm h = 2.6 cm
D = 80 cm L = 12.6 cm θ= 0.026 rad
mt1t
2
v
1
v
2
E
k1
E
k2
Ek2-E
ΔΔ
Δ(mgh) % Error
ΔΔ
k1
(g) (s) (s) (m/s) (m/s) (J) (J) (J) (J) (%)
180.2 0.25 0.16 0.51 0.80 0.02 0.06 0.03 0.04 5.67
220.2 0.25 0.16 0.51 0.80 0.03 0.07 0.04 0.04 7.32
261.6 0.25 0.16 0.51 0.80 0.03 0.08 0.05 0.05 5.16
h Yes. The experiemental data indicated that potential
energy was consitently transformed into kinetic enery.
There was however a loss of 5% to 7% in energy . This
is attributed to experiemental error as well measurement
as loss of energy due to friction between gliders and air
track.
Exp 9 - Elastic-Kinetic Energy
Notes - on Analysis
The results of the each portion of the experiement is presented to the right.
Figure 9.1 Spring Constant
Table 9.2 Potential Energy vs. Kinetic Energy of Spring Mass System
X1 = 104.2 cm K = 7.52 N/m Flag Width = 3.8 cm
m Spring Stretch t
avg
(g) (cm) (s) (m/s) (J) (J) (%)
211.5 5 0.13 0.29 0.01 0.01 4.6
211.5 10 0.06 0.60 0.04 0.04 0.0
211.5 15 0.04 0.88 0.08 0.08 3.3
211.5 20 0.03 1.18 0.15 0.15 1.9
231.5 5 0.13 0.29 0.01 0.01 -3.7
231.5 10 0.07 0.57 0.04 0.04 0.0
231.5 15 0.04 0.86 0.09 0.08 0.0
231.5 20 0.03 1.13 0.15 0.15 1.9
v
avg
K.E. P.E. % Error
36
®
Page 41

012-06379B Photogate Timer
Exp 10- Pendulum Motion
Notes - on Analysis
Part 1: Period of Oscillation versus Mass and Length
The graphs below present the relationship between period
and length of oscillation for four different masses.
®
37
Page 42

Photogate Timer 012-06379B
Part 2: Conservation of Mechanical Energy
The table below present theresults for the conservation of
energy with the pendulum dropped at varying heights.
L = 100 cm
θΔhtΔuE
(deg) (cm) (s) (J) (J) (%)
15 3.41 0.00 0.06 0.07 -11.97
20 6.03 0.00 0.10 0.11 -3.50
25 9.37 0.00 0.16 0.16 0.00
30 13.40 0.00 0.23 0.21 6.96
35 18.08 0.00 0.31 0.30 2.55
ΔΔ
Δd = 2 cm Mass = 175.2 g
ΔΔ
After repeated trials, these are the best results that can be
obtained by means of a Photogate Timer. The accuracy
of the experiment increases with an increase in the precision of measurements of angles and lengths. To get even
better accuracy, you may consider using the Computer
Photogate Timing System.
k
% of diff.
Notes - Questions
c From the graphs, there exist a linear relationship
between period and the squared root of the length of
oscillation. This relationship remained unchanged
despite changes in mass of pendulum.
d No. For small oscillation, period of oscillation is
independent of mass.
e Yes.
f No. During the repeated cyles of conversion of energy
from purely potential to kinetic energy, frictional and
gravitational forces continued to act on the pendulum to
convert some of the energy to other forms.
38
®
Page 43

012-06379B Photogate Timer
Maintenance
Battery Replacement
The batteries probably need replacing when:
c The timer counts when there is no object interrupting
the beam,
d The LCD display loses contrast, or
e The LCD display appears sluggish when switching
from one number to another,
To Replace the Batteries:
c Remove the two screws on the bottom of the timer and
lift out the bottom panel.
d Remove the thumb screw which holds the battery re-
tainer plate, then lift out the retainer plate and the batteries.
e Replace with four new “C” size, 1.5 VDC batteries.
Be sure the polarity is as shown on inside of the case.
f Replace the battery retainer plate and the bottom panel.
➤ CAUTION: Do not store the timer with the
batteries installed. The batteries may leak and damage the timer electronics.
Inside the Timer with the bottom panel removed.
++
–
Insert 4 "C" size batteries with the polarity as shown.
Figure 5: Battery Replacement
–
+
–
®
39
Page 44

 Loading...