

Page 1

OPENLANE
PERFORMANCE WIZARD
USER’S GUIDE
Document No. 7800-A2-GB28-80
May 1999
Page 2

Copyright E 1999 Paradyne Corporation.
All rights reserved.
Printed in U.S.A.
Notice
This publication is protected by federal copyright law. No part of this publication may be copied or distributed,
transmitted, transcribed, stored in a retrieval system, or translated into any human or computer language in any form
or by any means, electronic, mechanical, magnetic, manual or otherwise, or disclosed to third parties without the
express written permission of Paradyne Corporation, 8545 126th Ave. N., Largo, FL 33773.
Paradyne Corporation makes no representation or warranties with respect to the contents hereof and specifically
disclaims any implied warranties of merchantability or fitness for a particular purpose. Further, Paradyne Corporation
reserves the right to revise this publication and to make changes from time to time in the contents hereof without
obligation of Paradyne Corporation to notify any person of such revision or changes.
Changes and enhancements to the product and to the information herein will be documented and issued as a new
release to this manual.
Warranty, Sales, Service, and Training Information
Contact your local sales representative, service representative, or distributor directly for any help needed. For
additional information concerning warranty , sales, service, repair, installation, documentation, training, distributor
locations, or Paradyne worldwide office locations, use one of the following methods:
H Internet: Visit the Paradyne World Wide Web site at www.paradyne.com. (Be sure to register your warranty
there. Select
H Telephone: Call our automated system to receive current information by fax or to speak with a company
representative.
— Within the U.S.A., call 1-800-870-2221
— Outside the U.S.A., call 1-727-530-2340
Service & Support → Warranty Registration
.)
Document Feedback
We welcome your comments and suggestions about this document. Please mail them to Technical Publications,
Paradyne Corporation, 8545 126th Ave. N., Largo, FL 33773, or send e-mail to userdoc@paradyne.com. Include
the number and title of this document in your correspondence. Please include your name and phone number if you
are willing to provide additional clarification.
Trademarks
All products and services mentioned herein are the trademarks, service marks, registered trademarks or registered
service marks of their respective owners.
Printed on recycled paper
A
May 1999
7800-A2-GB28-80
Page 3

Contents
About This Guide
H Document Purpose and Intended Audience v. . . . . . . . . . . . . . . . . . . . . . . . .
H Document Summary v. . . . . . . . . . . . . . . . . . . . . . . . . . . . . . . . . . . . . . . . . . . . .
H Product-Related Documents vi. . . . . . . . . . . . . . . . . . . . . . . . . . . . . . . . . . . . . .
H Reference Documents vi. . . . . . . . . . . . . . . . . . . . . . . . . . . . . . . . . . . . . . . . . . .
1 Getting Started with OpenLane Performance Wizard
H What is OpenLane Performance Wizard? 1-1. . . . . . . . . . . . . . . . . . . . . . . . . .
H New Features 1-2. . . . . . . . . . . . . . . . . . . . . . . . . . . . . . . . . . . . . . . . . . . . . . . . . .
H Read Before Installing 1-2. . . . . . . . . . . . . . . . . . . . . . . . . . . . . . . . . . . . . . . . . . .
Verifying Supported Operating Platforms 1-3. . . . . . . . . . . . . . . . . . . . . . .
Checking Hardware Requirements 1-3. . . . . . . . . . . . . . . . . . . . . . . . . . . . .
Installing the Java Runtime Environment 1-4. . . . . . . . . . . . . . . . . . . . . . .
Integrating with OpenView or NetView 1-5. . . . . . . . . . . . . . . . . . . . . . . . . .
Using Default Paths 1-5. . . . . . . . . . . . . . . . . . . . . . . . . . . . . . . . . . . . . . . . . .
H Installing Performance Wizard 1-5. . . . . . . . . . . . . . . . . . . . . . . . . . . . . . . . . . . .
Installing in Windows 1-6. . . . . . . . . . . . . . . . . . . . . . . . . . . . . . . . . . . . . . . . .
Installing in UNIX 1-9. . . . . . . . . . . . . . . . . . . . . . . . . . . . . . . . . . . . . . . . . . . .
Finalizing the Windows NT Apache Setup 1-13. . . . . . . . . . . . . . . . . . . . . .
H Starting the Performance Wizard 1-13. . . . . . . . . . . . . . . . . . . . . . . . . . . . . . . . . .
Starting on Solaris, HP-UX, and AIX 1-14. . . . . . . . . . . . . . . . . . . . . . . . . . .
Starting on Windows 1-15. . . . . . . . . . . . . . . . . . . . . . . . . . . . . . . . . . . . . . . . .
H Installation Troubleshooting 1-15. . . . . . . . . . . . . . . . . . . . . . . . . . . . . . . . . . . . . .
H Using the License Key 1-16. . . . . . . . . . . . . . . . . . . . . . . . . . . . . . . . . . . . . . . . . . .
H Removing the Performance Wizard 1-17. . . . . . . . . . . . . . . . . . . . . . . . . . . . . . . .
Removing from Solaris, HP-UX, or AIX 1-17. . . . . . . . . . . . . . . . . . . . . . . . .
Removing from Windows 1-17. . . . . . . . . . . . . . . . . . . . . . . . . . . . . . . . . . . . .
H Setting Up the Web Server (for SLM Reports Only) 1-18. . . . . . . . . . . . . . . . . .
Using the User History Poller Daemon 1-18. . . . . . . . . . . . . . . . . . . . . . . . .
Troubleshooting the Apache Web Server Setup 1-19. . . . . . . . . . . . . . . . .
7800-A2-GB28-80
May 1999
i
Page 4

Contents
2 Using the Navigation Wizard
H Displaying the Navigation Wizard 2-1. . . . . . . . . . . . . . . . . . . . . . . . . . . . . . . . .
H Accessing Components and Menus 2-2. . . . . . . . . . . . . . . . . . . . . . . . . . . . . . .
Components of the Navigation Wizard 2-2. . . . . . . . . . . . . . . . . . . . . . . . .
H Performing Tasks Using the Navigation Wizard 2-3. . . . . . . . . . . . . . . . . . . . . .
H Managing the Device Display Area 2-4. . . . . . . . . . . . . . . . . . . . . . . . . . . . . . . .
Populating the Device Display Area 2-4. . . . . . . . . . . . . . . . . . . . . . . . . . .
Selecting Devices for Operations 2-5. . . . . . . . . . . . . . . . . . . . . . . . . . . . . .
Updating Device Configuration Information 2-6. . . . . . . . . . . . . . . . . . . . .
Deleting Devices 2-8. . . . . . . . . . . . . . . . . . . . . . . . . . . . . . . . . . . . . . . . . . . .
Locating Devices 2-8. . . . . . . . . . . . . . . . . . . . . . . . . . . . . . . . . . . . . . . . . . . .
H Setting FrameSaver Options 2-9. . . . . . . . . . . . . . . . . . . . . . . . . . . . . . . . . . . . . .
Managing PVC Connections 2-9. . . . . . . . . . . . . . . . . . . . . . . . . . . . . . . . . .
Setting Frame and Burst Ranges 2-11. . . . . . . . . . . . . . . . . . . . . . . . . . . . . .
H Displaying Real Time Charts 2-13. . . . . . . . . . . . . . . . . . . . . . . . . . . . . . . . . . . . . .
Setting the Real Time Polling Frequency 2-14. . . . . . . . . . . . . . . . . . . . . . .
Launching a Real Time Chart 2-15. . . . . . . . . . . . . . . . . . . . . . . . . . . . . . . . .
H Displaying Historical Charts 2-17. . . . . . . . . . . . . . . . . . . . . . . . . . . . . . . . . . . . . .
Starting and Stopping the Historical Daemon 2-17. . . . . . . . . . . . . . . . . . . .
Enabling or Disabling Historical Data Collection for a Device 2-18. . . . . .
Launching a Historical Chart 2-19. . . . . . . . . . . . . . . . . . . . . . . . . . . . . . . . . .
H Using the Service Level Management (SLM) Reports 2-21. . . . . . . . . . . . . . . .
H Starting Diagnostic Tests 2-21. . . . . . . . . . . . . . . . . . . . . . . . . . . . . . . . . . . . . . . . .
H Accessing the NetScout Manager Plus 2-22. . . . . . . . . . . . . . . . . . . . . . . . . . . . .
Setting the Path to the NetScout Manager 2-22. . . . . . . . . . . . . . . . . . . . . .
Starting NetScout Manager 2-22. . . . . . . . . . . . . . . . . . . . . . . . . . . . . . . . . . .
3 Using Real Time Charts
H What is a Real Time Chart? 3-1. . . . . . . . . . . . . . . . . . . . . . . . . . . . . . . . . . . . . .
H Accessing and Launching Real Time Charts 3-2. . . . . . . . . . . . . . . . . . . . . . . .
H Managing Real Time Charts 3-5. . . . . . . . . . . . . . . . . . . . . . . . . . . . . . . . . . . . . .
ii
Polling Devices 3-5. . . . . . . . . . . . . . . . . . . . . . . . . . . . . . . . . . . . . . . . . . . . . .
Specifying a Graph Format 3-6. . . . . . . . . . . . . . . . . . . . . . . . . . . . . . . . . . .
Querying a Point on a Graph 3-6. . . . . . . . . . . . . . . . . . . . . . . . . . . . . . . . . .
Printing a Chart to File or Printer 3-7. . . . . . . . . . . . . . . . . . . . . . . . . . . . . .
Zooming In and Out of a Graph Portion 3-7. . . . . . . . . . . . . . . . . . . . . . . . .
Selecting Other Chart Types and Displaying 3-7. . . . . . . . . . . . . . . . . . . .
Modifying PVC Throughput Displays 3-8. . . . . . . . . . . . . . . . . . . . . . . . . . .
Handling FrameSaver SLV NNI PVC Displays 3-8. . . . . . . . . . . . . . . . . . .
Obtaining Help 3-8. . . . . . . . . . . . . . . . . . . . . . . . . . . . . . . . . . . . . . . . . . . . . .
May 1999
7800-A2-GB28-80
Page 5

4 Using Historical Charts
H What is a Historical Chart? 4-1. . . . . . . . . . . . . . . . . . . . . . . . . . . . . . . . . . . . . . .
H Accessing Historical Charts 4-1. . . . . . . . . . . . . . . . . . . . . . . . . . . . . . . . . . . . . .
H Viewing Historical Charts 4-2. . . . . . . . . . . . . . . . . . . . . . . . . . . . . . . . . . . . . . . . .
H Managing Historical Charts 4-3. . . . . . . . . . . . . . . . . . . . . . . . . . . . . . . . . . . . . . .
Specifying a Graph Format 4-3. . . . . . . . . . . . . . . . . . . . . . . . . . . . . . . . . . .
Querying a Point on a Graph 4-3. . . . . . . . . . . . . . . . . . . . . . . . . . . . . . . . . .
Zooming In and Out of a Graph Portion 4-4. . . . . . . . . . . . . . . . . . . . . . . . .
Printing a Chart to File or Printer 4-4. . . . . . . . . . . . . . . . . . . . . . . . . . . . . .
Obtaining Help 4-4. . . . . . . . . . . . . . . . . . . . . . . . . . . . . . . . . . . . . . . . . . . . . .
5 Creating Service Level Management Reports
H What are Service Level Management (SLM) Reports? 5-1. . . . . . . . . . . . . . .
Discovering FrameSaver SLV Units 5-1. . . . . . . . . . . . . . . . . . . . . . . . . . . .
Using the SLM Report Administration Web-Based Interface 5-2. . . . . . .
SLM Reports Administration 5-3. . . . . . . . . . . . . . . . . . . . . . . . . . . . . . . . . .
Saving Polling Data 5-4. . . . . . . . . . . . . . . . . . . . . . . . . . . . . . . . . . . . . . . . . .
SLM Report Data Export 5-5. . . . . . . . . . . . . . . . . . . . . . . . . . . . . . . . . . . . .
SLM Report Scheduling 5-5. . . . . . . . . . . . . . . . . . . . . . . . . . . . . . . . . . . . . .
Time Zone Settings 5-5. . . . . . . . . . . . . . . . . . . . . . . . . . . . . . . . . . . . . . . . . .
SLM Report Filters 5-7. . . . . . . . . . . . . . . . . . . . . . . . . . . . . . . . . . . . . . . . . . .
H Viewing SLM Reports 5-9. . . . . . . . . . . . . . . . . . . . . . . . . . . . . . . . . . . . . . . . . . . .
SLM Report Example 5-10. . . . . . . . . . . . . . . . . . . . . . . . . . . . . . . . . . . . . . . .
Contents
6 Diagnostic Tests
H What are Diagnostic Tests? 6-1. . . . . . . . . . . . . . . . . . . . . . . . . . . . . . . . . . . . . .
H Accessing Diagnostic Tests 6-2. . . . . . . . . . . . . . . . . . . . . . . . . . . . . . . . . . . . . . .
A Messages
H Error and Status Messages A-1. . . . . . . . . . . . . . . . . . . . . . . . . . . . . . . . . . . . . . .
Glossary
Index
7800-A2-GB28-80
Accessing from the Navigation Wizard 6-2. . . . . . . . . . . . . . . . . . . . . . . . .
Accessing from OpenView 6-4. . . . . . . . . . . . . . . . . . . . . . . . . . . . . . . . . . . .
Obtaining Help 6-4. . . . . . . . . . . . . . . . . . . . . . . . . . . . . . . . . . . . . . . . . . . . . .
May 1999
iii
Page 6

Contents
iv
May 1999
7800-A2-GB28-80
Page 7

About This Guide
Document Purpose and Intended Audience
The OpenLane Performance Wizard Version 4.2 provides you with a set of
tools that you can use to monitor, analyze, test, and troubleshoot various network
devices.
This manual is intended for use by Network Administrators and Service
Providers. It describes how to install and use the Performance Wizard on a
variety of operating platforms.
Document Summary
Section Description
Chapter 1
Chapter 2
Chapter 3
Chapter 4
Chapter 5
Chapter 6
Appendix A
Getting Started with OpenLane Performance Wizard.
Provides instructions on installing and running the
Performance Wizard on a variety of operating
platforms.
Using the Navigation Wizard.
maintain Performance Wizard and navigate to the
various components.
Using Real Time Charts.
launch, and manage real time reports.
Using Historical Charts.
launch, and manage historical charts.
Creating Service Level Management Reports.
Describes how to generate Web-based historical
reports for FrameSaver SLV devices.
Diagnostic Tests
Tests on FrameSaver devices.
Messages.
messages.
. Describes how to perform Diagnostic
Describes status and SNMP error
Describes how to
Describes how to create,
Describes how to create,
7800-A2-GB28-80
May 1999
v
Page 8

About This Guide
Section Description
Glossary Defines acronyms and terms used in this guide.
Index Lists key terms, acronyms, and concepts in
Product-Related Documents
Contact your sales or service representative to order product documentation.
Paradyne documents are also available on the World Wide Web at
www.paradyne.com. Select
alphabetical order.
Service & Support → Technical Manuals.
See the
about services, applications, and network deployment.
Reference Documents
Black, Ulysses.
Protocols.
Comer, Douglas.
Architecture, Volume 1.
(ISBN 0-13-468505-9)
IBM.
NetView for AIX Installation and Configuration, Version 4, Document
Number: SC31-8163
McCloghrie, K., Rose, M.T.,
Management of TCP/IP-based Internets.
Rose, M.T.,
Internets.
Rose, M.T.,
http://www.simple-times.org/pub/simple-times/issues
DSL Sourcebook
Network Management Standards. The OSI, SNMP and CMOL
New York, NY: McGraw-Hill, 1992. (ISBN 0-07-005554-8)
Internetworking with TCP/IP: Principles, Protocols, and
The Simple Book: An Introduction to Management of TCP/IP-based
Englewood Cliffs, NJ: Prentice-Hall, 1994 (ISBN 0-13-177254-6)
The Simple Times: The Bi-monthly Newsletter of SNMP Technology
and
FrameSaver Sourcebook
New York, NY: Prentice-Hall, 1991.
: International Business Machines, 1992, 1995
Management Information Base for Network
RFC 1156, March 1991
for more information
,
vi
May 1999
7800-A2-GB28-80
Page 9

Getting Started with OpenLane
Performance Wizard
What is OpenLane Performance Wizard?
OpenLanet Performance Wizardt Version 4.2 provides you with a set of tools
that you can use to monitor, analyze, test, and troubleshoot various network
devices. Using the Performance Wizard, you can:
H Obtain real time and historical data on various network devices. All
information collected is compiled into charts, based on chart type, and the
information is viewable as graphs.
Use these charts to monitor, analyze, and troubleshoot networks that use
Frame Relay, T1, DDS, Hotwirer DSL, MVL network devices, and other
network devices that support MIB-2 Frame Relay Transmission (RFC-1315),
DS1 Transmission (RFC-1406), DS-3 Transmission (RFC-1407), Frame
Relay Services (RFC-1604) MIB variables, and Paradyne Enterprise MIBs.
1
H Create and deliver Web-based historical reports to customers that provide
service level verification, capacity planning, and trending data to use to
troubleshoot performance problems.
Web-based reports are available for FrameSaverr SLV devices only.
H Perform Diagnostic Tests that enable you to check the integrity and
performance of network devices, and to some extent, the network itself.
Available tests include the ability to run loopback and pattern tests, as well as
perform a Lamp Test, Connectivity Test, or check EIA Leads Status.
This feature is available for FrameSaver devices only.
This chapter provides you with the information you need to install and start the
OpenLane Performance Wizard application on a variety of operating platforms.
NOTE:
OpenLane Performance Wizard Real Time reports support all Paradyne
devices, as well as other devices, that support standard MIB-2 and Frame
Relay MIBs.
7800-A2-GB28-80
May 1999
1-1
Page 10

Getting Started with OpenLane Performance Wizard
New Features
The Performance Wizard Version 4.2 product offers several new enhancements:
H Support for Hotwire M/HDSL and M/SDSL devices:
— Hotwire 7974, 7975, and 7976 Multirate Symmetric Digital Subscriber
Line (M/SDSL) Standalone Units
— Hotwire 7984, 7985, and 7986 Multirate High-bit-rate Digital Subscriber
Line (M/HDSL) Standalone Units
— Hotwire 8774, 8775, and 8776 M/SDSL Cards
— Hotwire 8784 and 8786 M/HDSL Cards
H Support for FrameSaver Service Level Verifier (SLV) devices:
— FrameSaver SLV 9124-A2 T1 Access Unit
— NextEDGEt 9192/9195 Multiservices Access System
— FrameSaver SLV 9580 T3 ATM DSU
H Automated installation of the Apache Web server
H Additional features for FrameSaver Service Level Management (SLM)
Reports:
— Option to export report raw data
— Ability to request exception filtering of report data
— Report Scheduling feature
H Diagnostic Wizard GUI provides windows to view status, run tests, and
diagnose FrameSaver network problems.
H Navigation Wizard collects additional device parameters, including:
— Device Name
— Device Serial Number
H New Device dialog provides a history list display.
H Edit Connection dialog provides both the local and remote connection
information.
Read Before Installing
Before you install the Performance Wizard, ensure that your operating system
and environment meet the necessary prerequisites.
H Verifying Supported Operating Platforms
H Checking Hardware Requirements
H Installing the Java Runtime Environment
H Integrating with OpenView or NetView
1-2
May 1999
7800-A2-GB28-80
Page 11

Verifying Supported Operating Platforms
The Performance Wizard can be installed on the following platforms:
H Supported servers
— Solaris 2.5.1 or 2.6
— HP-UX 10.20
— AIX 4.1 or 4.2
— Windows NT 4.0
H Supported clients
— Netscape Communicator 4.51 or later
— Internet Explorer 4.01 or later
Checking Hardware Requirements
The
recommended
hardware configuration for the Performance Wizard is:
Getting Started with OpenLane Performance Wizard
H 266 Mhz CPU
H 64 MB RAM
H 20 MB free disk space, plus variable requirements for data collection.
Performance Wizard uses between:
— 8 MB and 16 MB of virtual memory per user interface session
— 4 MB and 6 MB of virtual memory if historical data collection is enabled
The
minimum
H 133 Mhz CPU
H 32 MB RAM
H 15 MB free disk space, plus variable requirements for data collection
Out-of-memory errors may indicate a need to increase the amount of RAM or the
size of the virtual memory swap space on your system.
To install the OpenLane Performance Wizard software, you will need Internet
connectivity or the OpenLane Performance Wizard CD. To install the Apache
Web server in UNIX, GNUZIP utility gzip must be installed.
hardware configuration for the Performance Wizard is:
7800-A2-GB28-80
May 1999
1-3
Page 12

Getting Started with OpenLane Performance Wizard
Installing the Java Runtime Environment
The Java Runtime Environment (JRE) can be installed on your platform before
you install the Performance Wizard or installed during the OpenLane automated
installation. The following are the supported JREs:
H Solaris requires JRE Version 1.1.7
H HP-UX requires JRE Version 1.1.7.01
H AIX requires JRE Version 1.1.6
H Windows NT requires JRE Version 1.1.8
To determine if the JRE is installed on your system, open a command prompt
window and type the following command:
For Windows: jre
or for HP-UX: jre -version
If the JRE is installed, a message similar to the following is displayed:
Java(tm) Runtime Loader Version 1.1.8
Usage: jre [-options] classname [arguments]
Options . . .
If you do not receive a similar message, consult the documentation for your
operating platform to ensure that JRE executable has been included in your
PATH. Should you need to install the JRE, you can download the software from a
site on the World Wide Web that is applicable to your operating system.
H HP-UX:
http://www.hp.com
H AIX:
http://www.ibm.com
H Solaris and Windows NT:
http://www.sun.com
1-4
May 1999
7800-A2-GB28-80
Page 13

Integrating with OpenView or NetView
The Performance Wizard can optionally be integrated with Hewlett Packard (HP)
OpenView (herein referred to as OpenView) or NetView, depending on your
operating platform. Integrating with OpenView or NetView gives you the option of
starting the Performance Wizard, launching Real Time charts, or starting
Diagnostic Tests from within these applications.
The following are the operating platforms and versions of OpenView or NetView
that are compatible with the Performance Wizard:
H Solaris and HP-UX with HP OpenView Version 5.0 or 6.0
H AIX with NetView/AIX Version 4.1 and 5.1
H Windows NT and Windows 95 with HP OpenView Professional Suite D.03.01
OpenView or NetView must be installed on your system, but not running, if you
want to integrate OpenView or NetView with Performance Wizard.
Using Default Paths
Getting Started with OpenLane Performance Wizard
During installation, you must accept the OpenLane Performance Wizard defaults
if you want to integrate Performance Wizard with OpenView or NetView. If the
default destination is used, integrating with OpenView or NetView occurs
automatically during the installation. Defaults paths are:
H For Solaris and HP-UX:
/opt/OV/pdn/PerfWiz
H For AIX:
/usr/OV/pdn/PerfWiz
H For Windows 95/NT:
c:\pdn\PerfWiz
Installing Performance Wizard
The OpenLane Performance Wizard software can be installed from CD-ROM or
downloaded from the World Wide Web, then installed on any of the supported
platforms. The World Wide Web site download location is:
http://www.paradyne.com/perfwizard/index.htm
The Performance Wizard Web site provides you with installation instructions,
product information, and details on product updates. The following sections
discuss how to install the Performance Wizard on your operating platform.
7800-A2-GB28-80
May 1999
1-5
Page 14
Getting Started with OpenLane Performance Wizard
Installing in Windows
Procedure
"
To install or upgrade OpenLane Performance Wizard for Windows, logon as a
user with Admin authority:
1. From the CD-ROM or after downloading the OpenLane Performance Wizard
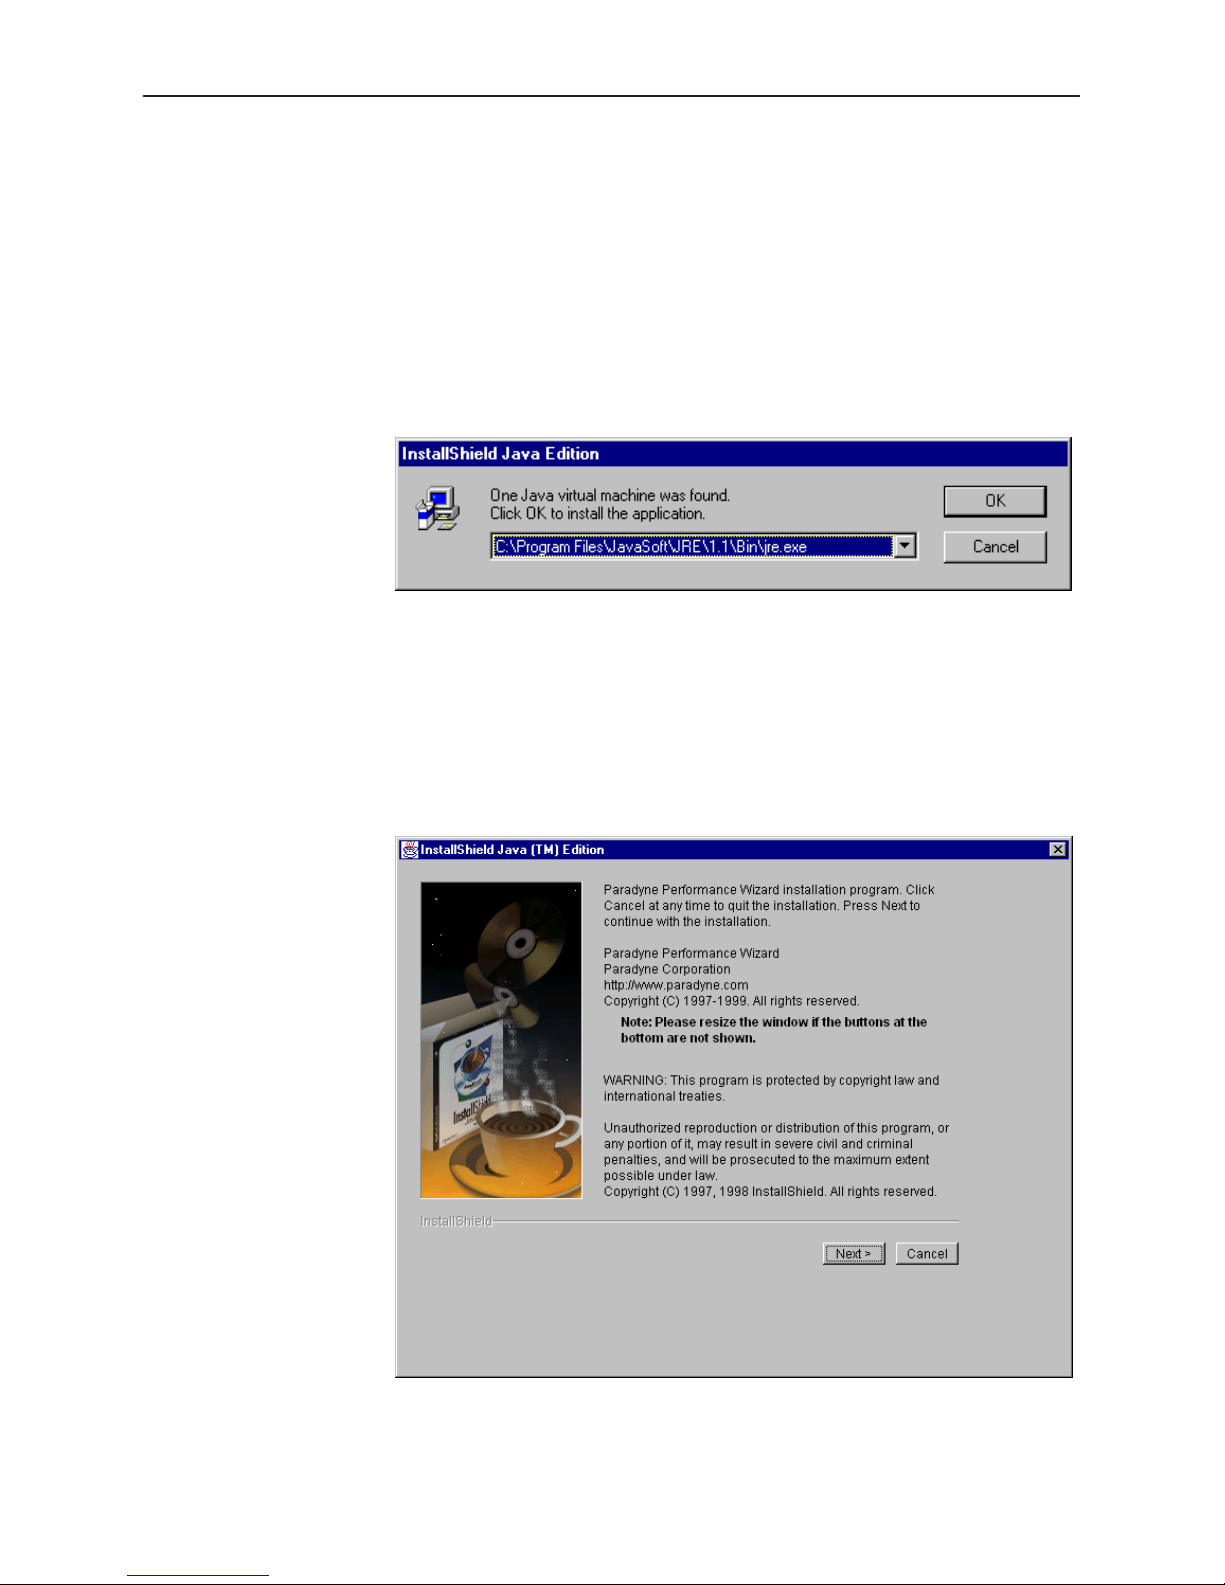
software, double-click on the setup.exe file to begin the installation. The
OpenLane installation program will locate the JRE installed on your system.
— If a JRE is not located, you will be prompted to link to a JRE download
site. Refer to
Installing the Java Runtime Environment
on page 1-4.
— If more than one version of JRE is installed on your system, select the jre
to use during the OpenLane installation.
2. Select OK to continue with the installation.
Read the displayed README.TXT file.
1-6
May 1999
7800-A2-GB28-80
Page 15
Getting Started with OpenLane Performance Wizard
3. The OpenLane installation program searches your C: drive for Performance
Wizard, Apache, and NetScout programs.
If Performance Wizard is found, you are prompted with a dialog box labeled
Existing V ersion Found. The options are Remove Old or Overwrite the
existing version. Overwrite is recommended. The installation program
attempts to stop the Data Collection Daemon and the User History Poller
during installation.
In addition, if NetScout is found, it will be integrated into OpenLane’s menu
structure so NetScout can be launched from the Action menu.
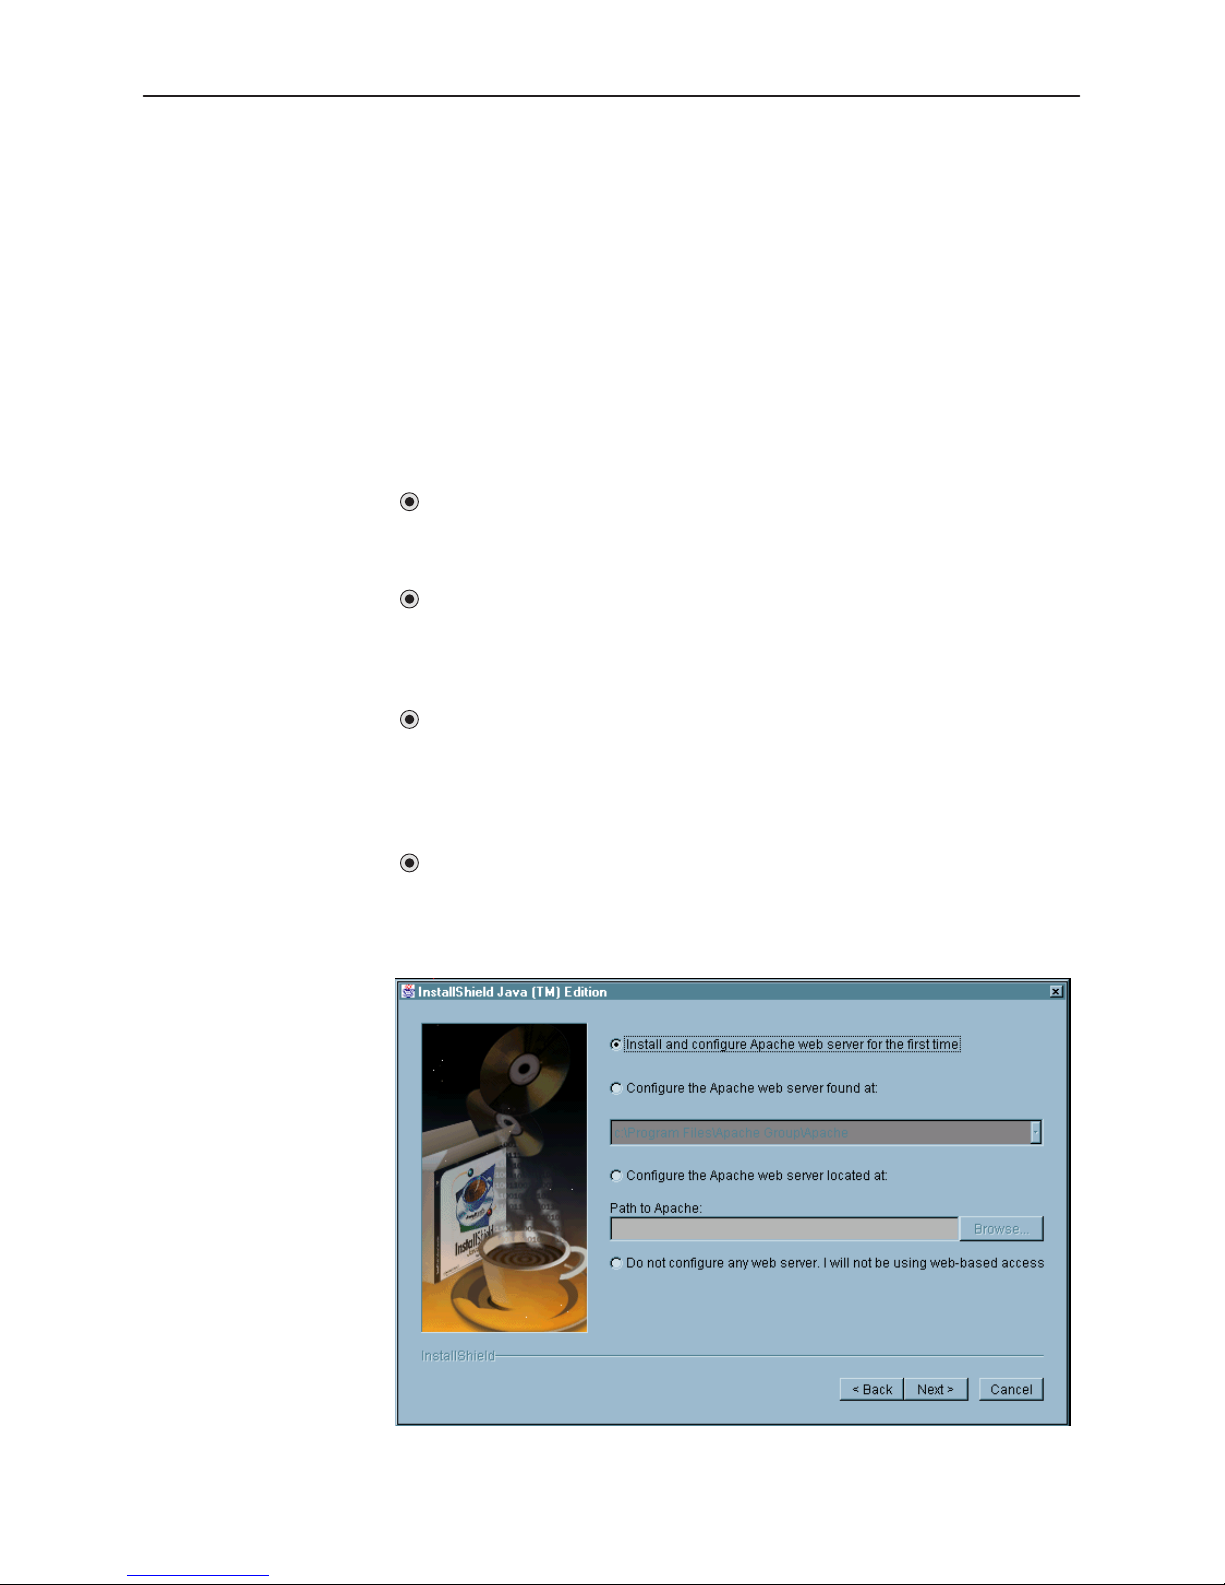
4. The Apache Web installation dialog box appears. Select an option and Next.
The Web server installation options are:
Install and configure Apache web server for the first time
Select this option to use this workstation as the Web server for SLM
reports.
Configure the Apache web server found at
Select this option to use this workstation as the Web server for SLM
reports and there is already an Apache Web server installed on the
C: drive.
Configure the Apache web server located at
Select this option to use this workstation as the Web server for SLM
reports and there is already an Apache Web server installed on a drive
other than the C: drive or Apache Web server is installed on the C: drive
but not found during the program search.
Do not configure any web server. I will not be using web-based
access
Select the last option if you do not intend to use this workstation as a
Web server for SLM Reports.
7800-A2-GB28-80
May 1999
1-7
Page 16
Getting Started with OpenLane Performance Wizard
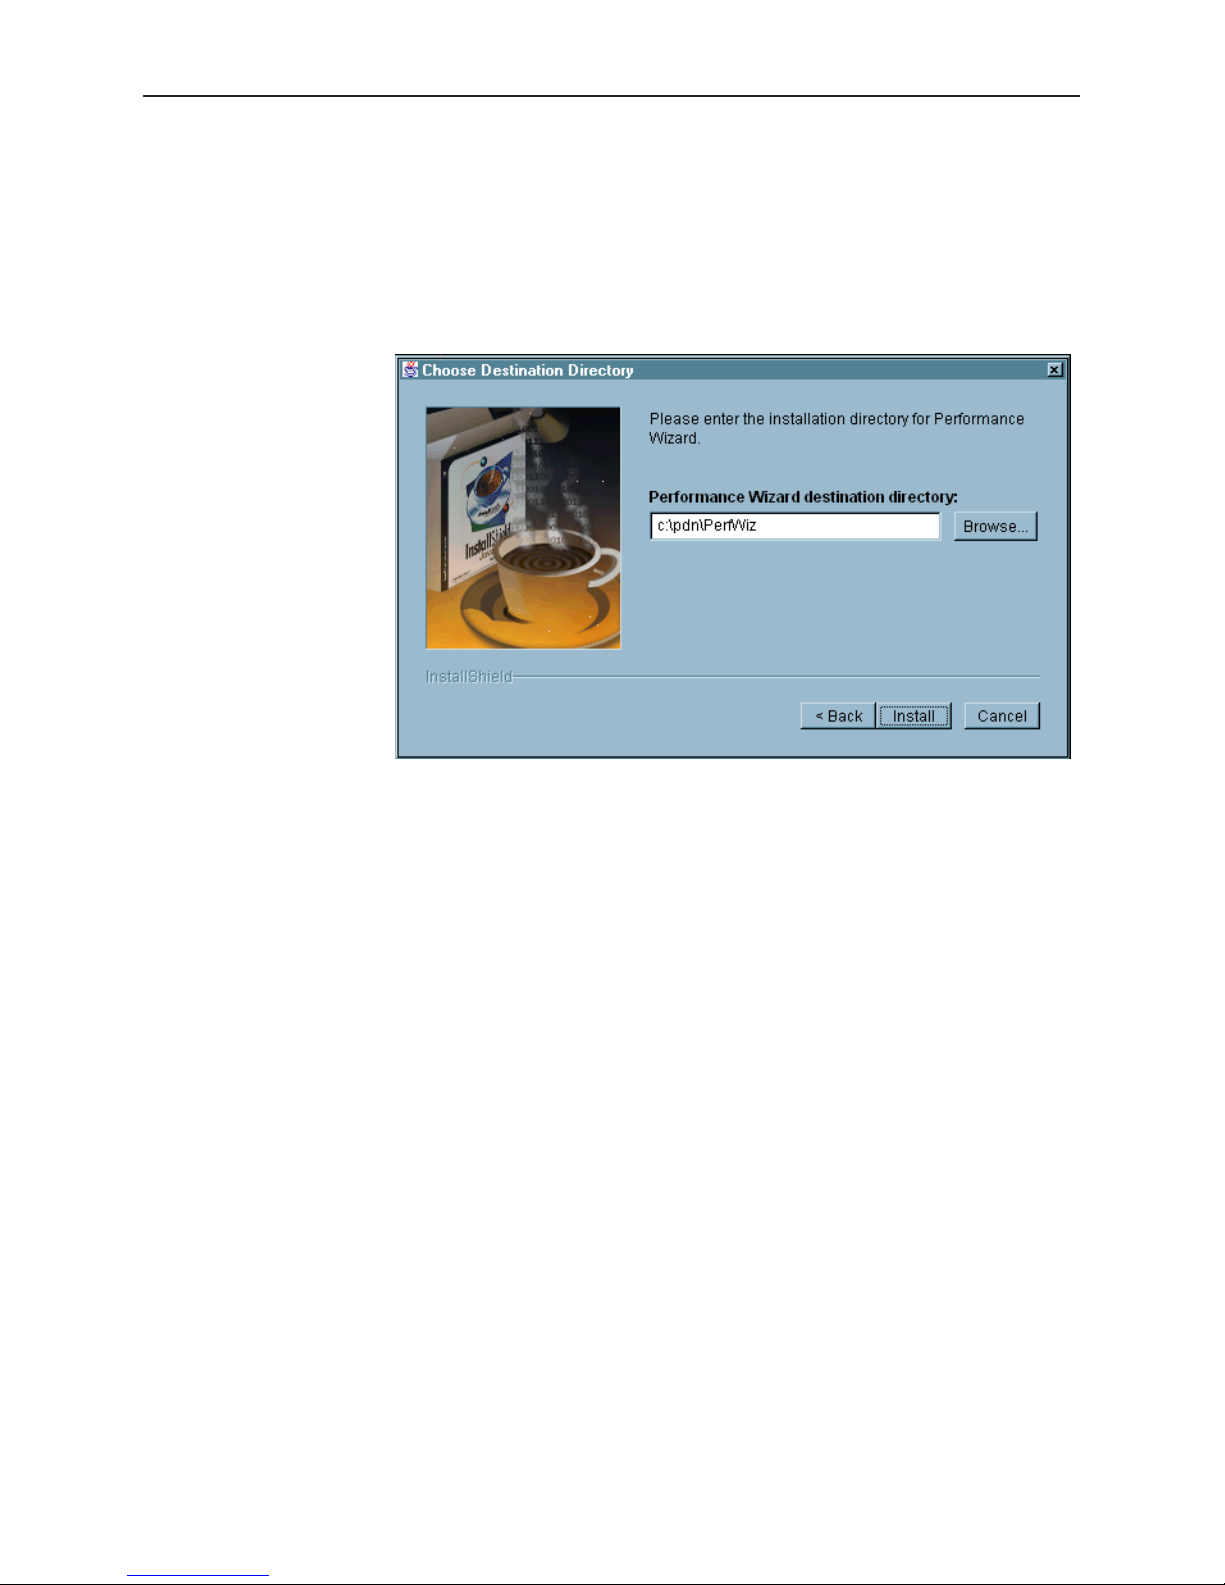
5. Select the Performance Wizard destination directory and select Install.
— If the Performance Wizard destination directory is not found, select Yes to
create the new directory.
— If an earlier version of Performance Wizard is found, select Yes to All
from Copy Files dialog box to obtain the most current files.
6. Files are extracted and, if setting up a Web server, the Apache Web server
files are downloaded, followed by the OpenLane files. Follow the Apache
Web server installation prompts.
NOTE:
To successfully complete the OpenLane installation, do not restart the
computer at the end of the Apache Web server installation. Continue with
the OpenLane installation.
7. Select Finish to complete the installation.
The OpenLane Performance Wizard application has been installed and an icon
added to the Start Menu under Programs. If you chose to install the Apache Web
server, the Apache configuration files have been modified for use with SLM
Reports and an Apache icon appears minimized on your Windows tool bar.
In addition, the User History Poller associated with SLM Reports is started and
appears as a jrew process in Windows Task Manager. The Data Collection
Daemon used with Historical Graphs is started and also appears as a jrew
process in Windows task manager. If Performance Wizard is installed after HP
OpenView Workgroup Node Manager, OpenLane will be available from the
Control menu.
If your workstation will be a Windows NT server, proceed to
Windows NT Apache Setup
Performance Wizard
on page 1-13.
on page 1-13, or continue to
Finalizing the
Starting the
1-8
May 1999
7800-A2-GB28-80
Page 17

Installing in UNIX
Getting Started with OpenLane Performance Wizard
Procedure
"
To install OpenLane Performance Wizard on a UNIX workstation, you must be
logged on as root:
1. From the CD-ROM or after downloading the OpenLane Performance Wizard
software, run setup.sh to begin the installation.
2. The OpenLane installation program will locate the JRE installed on your
system. If more than one version of JRE is installed on your system, select
the jre to use during the OpenLane installation.
3. The OpenLane installation program searches your drive for Performance
Wizard, Apache, and NetScout programs.
If Performance Wizard is found, you are prompted with a dialog box labeled
Existing V ersion Found. The options are Remove Old or Overwrite the
existing version. Overwrite is recommended. The installation program
attempts to stop the Data Collection Daemon and the User History Poller
during installation.
In addition, if NetScout is found, it will be integrated into OpenLane’s menu
structure so NetScout can be launched from the Action menu.
7800-A2-GB28-80
May 1999
1-9
Page 18
Getting Started with OpenLane Performance Wizard
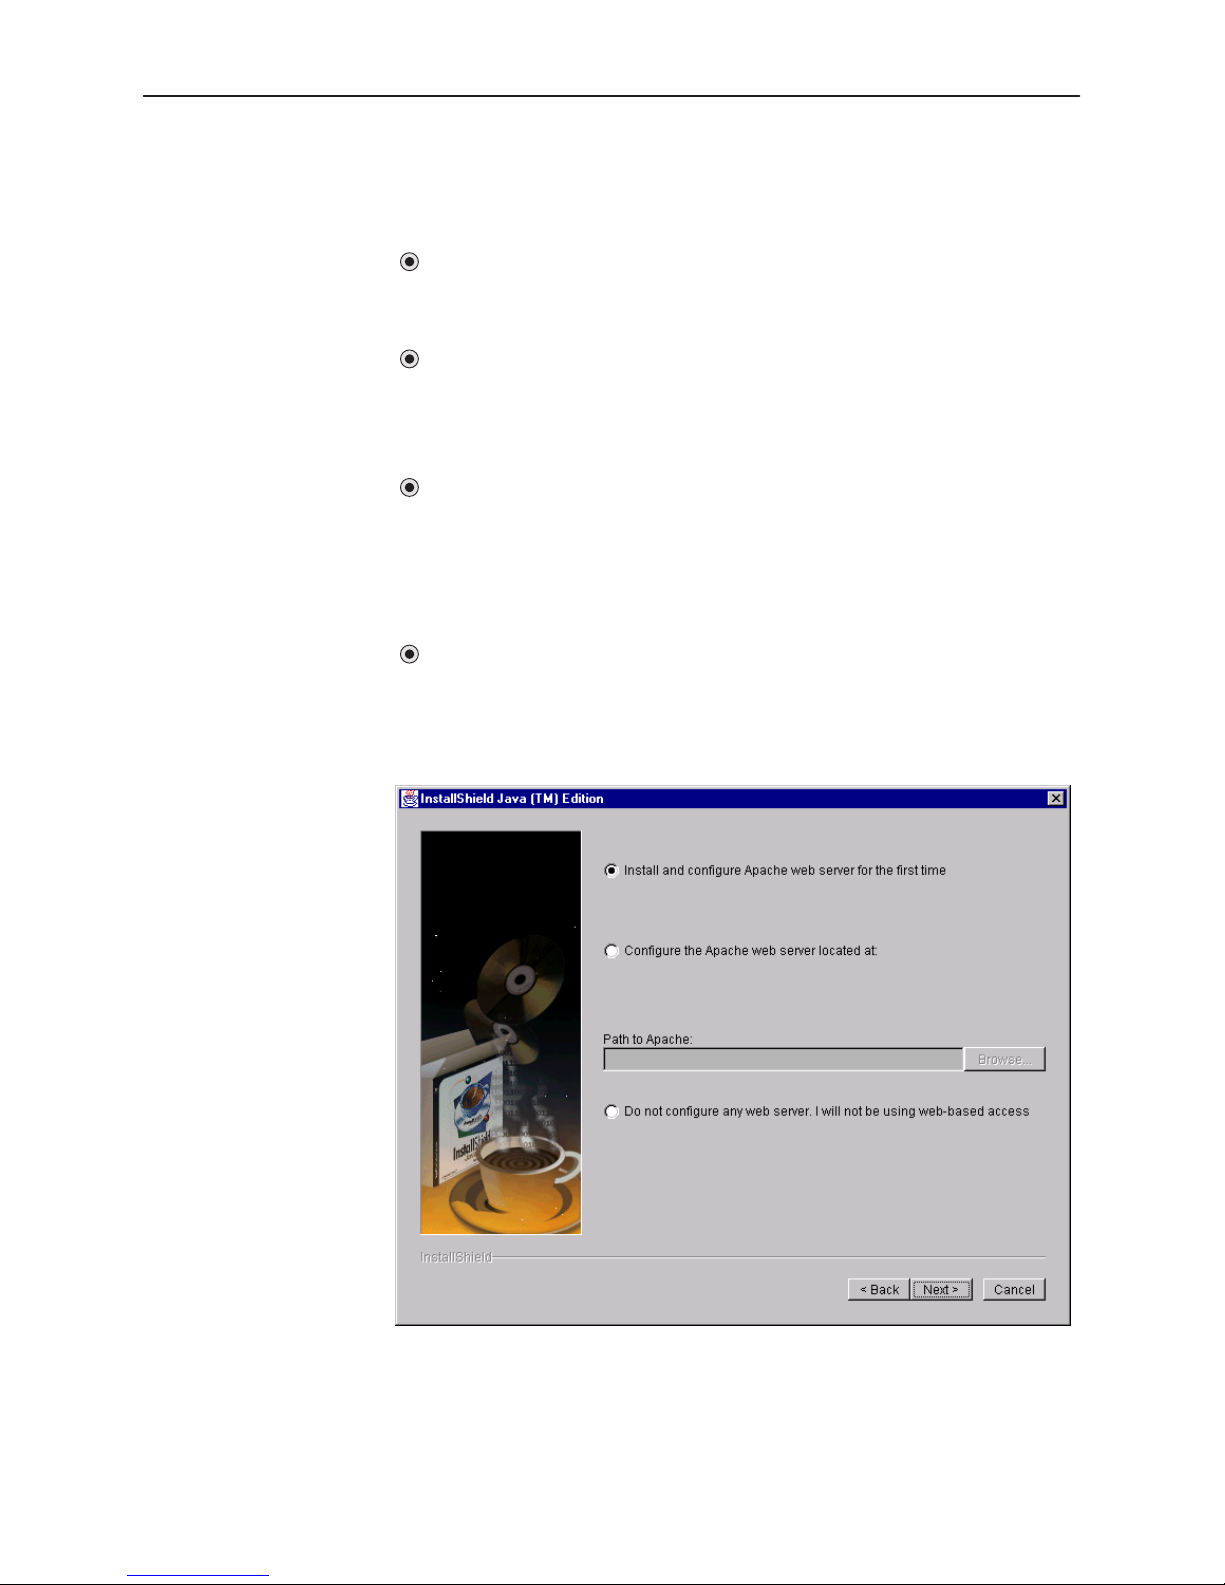
4. The Apache Web installation dialog box appears. Select an option and Next.
The Web server options are:
Install and configure Apache web server for the first time
Select this option to use this workstation as the Web server for SLM
reports.
Configure the Apache web server found at
This option will appear if the Apache Web server software is located.
Select this option to use this workstation as the Web server for SLM
reports where the Apache Web server is already installed on the drive.
Configure the Apache web server located at
Select this option to use this workstation as the Web server for SLM
reports and there is already an Apache Web server installed but not
located. Browse to where the httpd directory is found. A copy of the
httpd.conf file named httpd.conf.bak will be created before OpenLane
installation modifications.
Do not configure any web server. I will not be using web-based
access
Select the last option if you do not intend to use this workstation as a
Web server for SLM Reports.
1-10
May 1999
7800-A2-GB28-80
Page 19
Getting Started with OpenLane Performance Wizard
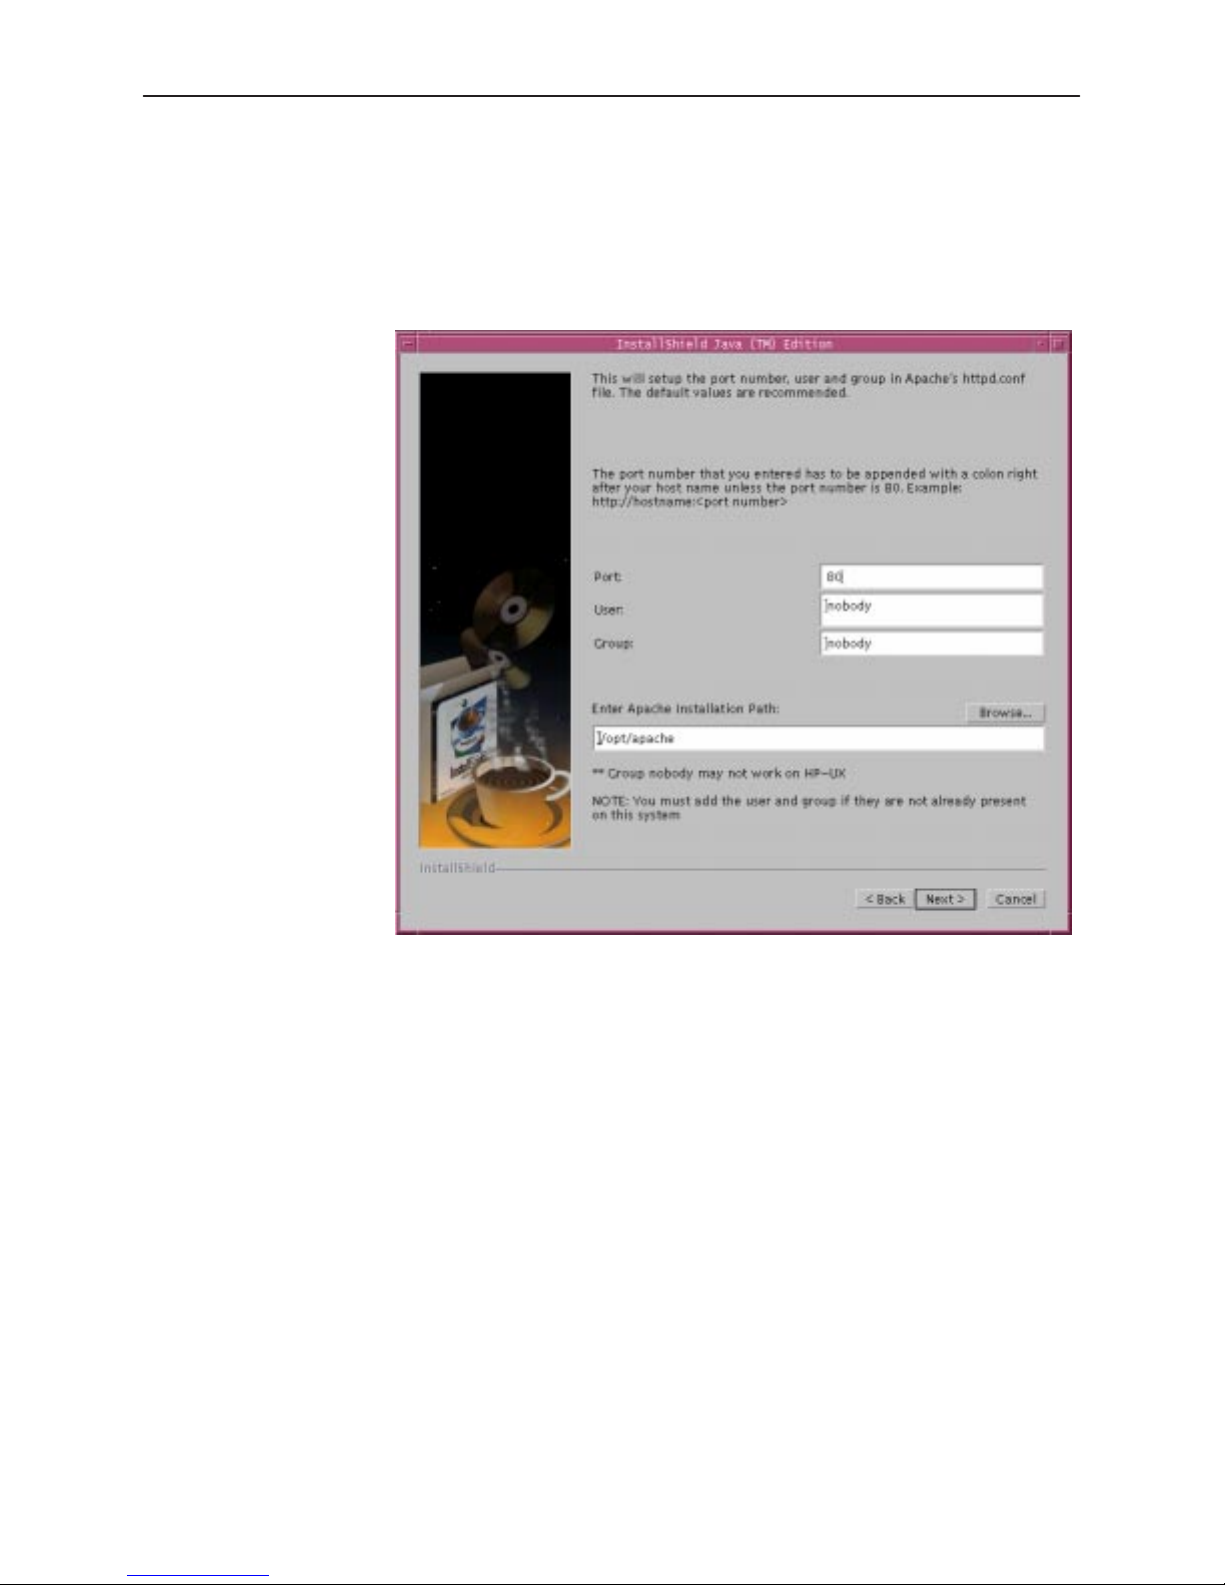
5. Enter the port number for Apache to use. The default is 80. Enter an existing
User and Group for the Apache Web server. By default, the HP-UX group
nobody does not exist. You can use the User bin and the Group bin.
Enter the path for the Apache installation. The default is /opt/apache.
Select Next.
7800-A2-GB28-80
May 1999
1-11
Page 20
Getting Started with OpenLane Performance Wizard
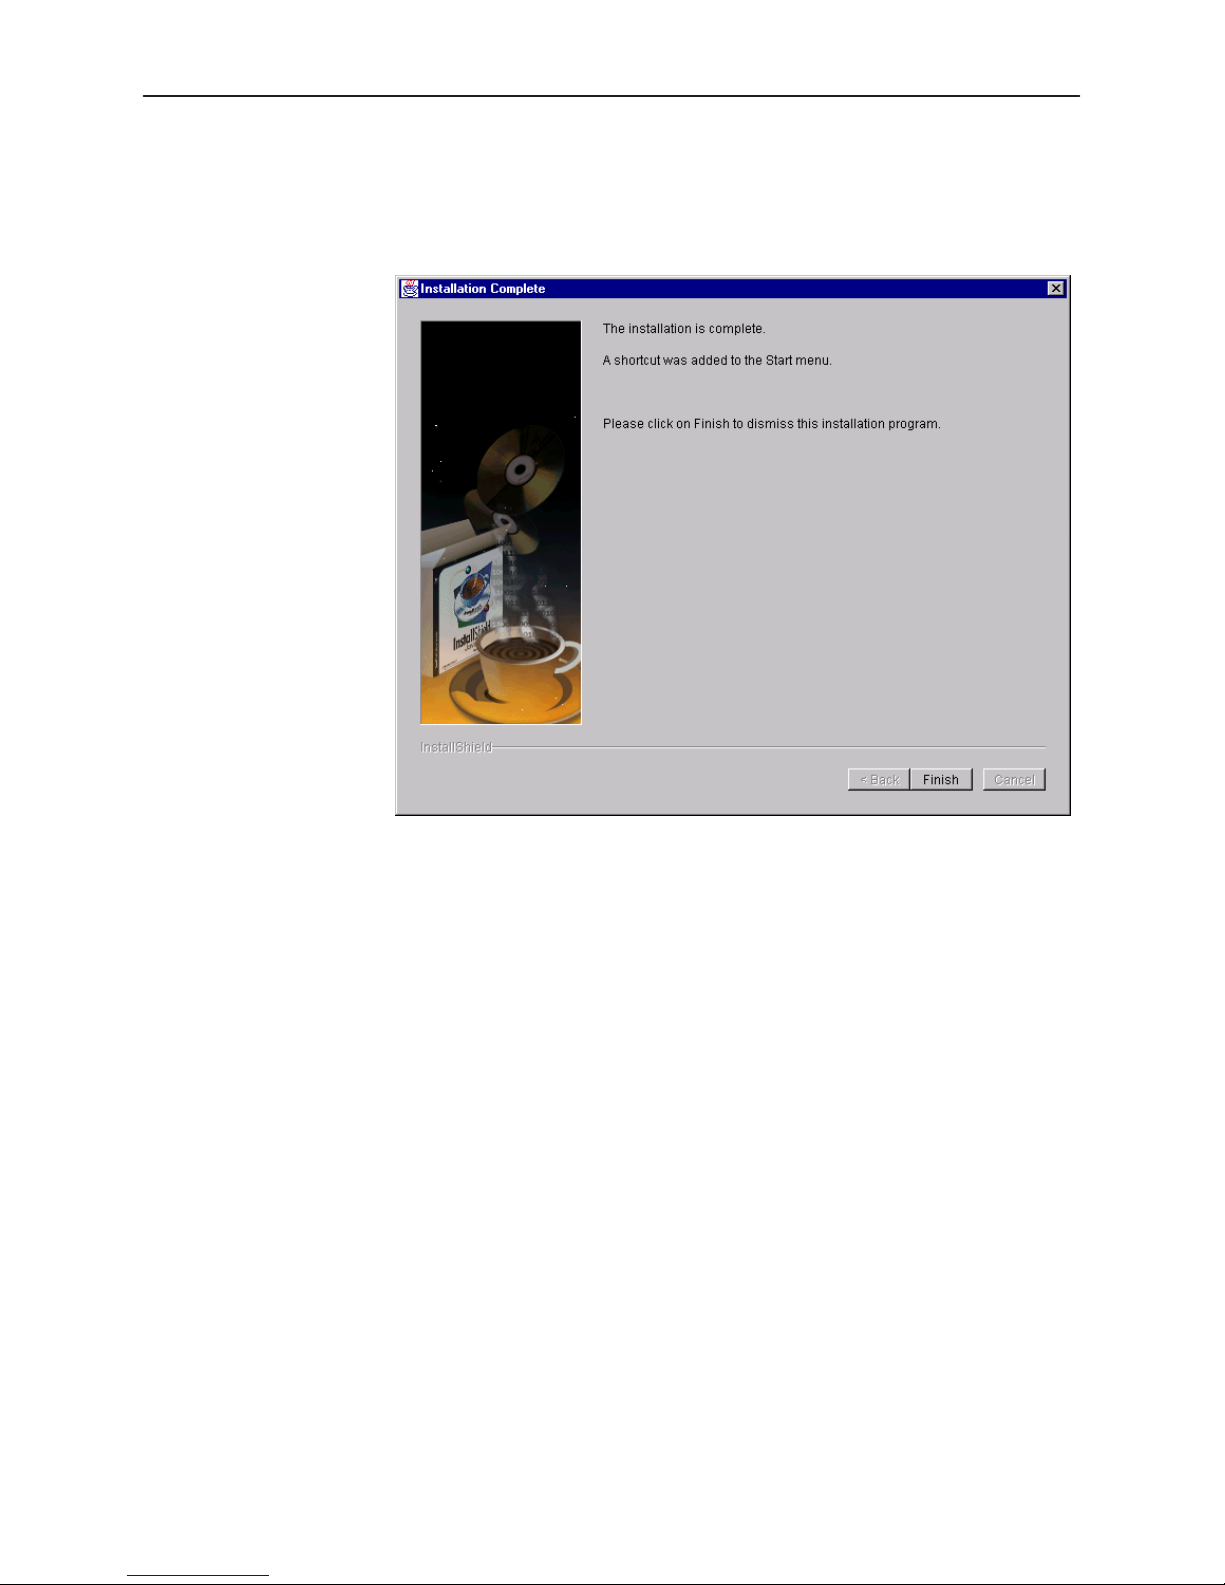
6. Follow the prompts offered by the setup program. The setup program
prompts you to enter a destination for the program files. A message appears
when the installation is complete.
To continue, refer to
Starting the Performance Wizard
on page 1-13.
1-12
May 1999
7800-A2-GB28-80
Page 21

Finalizing the Windows NT Apache Setup
If working with Windows NT, you can setup Apache as a Service to be started
automatically. To do this, from the Start Menu, select:
Programs →Apache Web Server →Install Apache as a Service
Apache will start up automatically as a Service after the next reboot.
Starting the Performance Wizard
You can start the Performance Wizard as a standalone application, or it can be
started from within OpenView or NetView, depending on your operating platform.
H Starting as a standalone application opens the Navigation Wizard, which is
the main window of the Performance Wizard.
H Starting from OpenView or NetView enables you to open the Navigation
Wizard or display a default real time chart.
Getting Started with OpenLane Performance Wizard
Refer to Chapter 2,
Charts
, and Chapter 6,
The following sections describe how to start the Performance Wizard on your
operating platform.
Using the Navigation Wizard
Diagnostic Tests
, for more information.
, Chapter 3,
Using Real Time
7800-A2-GB28-80
May 1999
1-13
Page 22

Getting Started with OpenLane Performance Wizard
Starting on Solaris, HP-UX, and AIX
The Performance Wizard can run as a standalone application or it can be invoked
from within OpenView or NetView (depending on your operating platform) as
described in the following procedures.
" Procedure
To start as a standalone application:
H Solaris and HP-UX only:
/opt/OV/pdn/PerfWiz/PerfWiz &
H AIX only:
/usr/OV/pdn/PerfWiz/PerfWiz &
If you installed the software in a location other than the path specified in the
previous examples, substitute the absolute path of that directory.
" Procedure
To start from OpenView or NetView and display the Navigation Wizard:
1. Click on the Performance menu and select Performance Wizard.
The Performance Wizard menu item has a submenu with the options Graphs
and Navigation Wizard.
2. Click on Navigation Wizard.
" Procedure
To start from OpenView or NetView and display a Real Time Chart:
1. Click on a device icon from the OpenView map.
2. Click on the Performance menu and select Performance Wizard.
The Performance Wizard menu item has a submenu with the options Graphs
and Navigation Wizard.
3. Click on Graphs to display a Real Time Chart.
1-14
May 1999
7800-A2-GB28-80
Page 23

Starting on Windows
" Procedure
" Procedure
" Procedure
Getting Started with OpenLane Performance Wizard
You can start the Performance Wizard with or without OpenView as described in
the following procedures.
To start as a standalone application:
1. Select Programs from the Start menu.
2. Click on the Performance Wizard icon or run the script PerfWiz.bat.
To start from OpenView and display the Navigation Wizard:
1. Click on the Control menu and select OpenLane. The OpenLane menu has a
submenu with the options Graphs and Navigation Wizard.
2. Click on Navigation Wizard.
To start from OpenView and display a default Real Time Chart:
1. Click on a device icon from the OpenView map.
2. Click on the Control menu and select OpenLane. The OpenLane menu has a
submenu with the options Graphs and Navigation Wizard.
3. Click on Graphs to display a Real Time Chart.
Installation Troubleshooting
If the Performance Wizard does not start, do the following:
H Verify that the correct version of the JRE has been installed and that the
JRE executable has been included in your default path. Refer to
Java Runtime Environment
H Verify that you are logged in with the correct permissions. Windows requires
Administrator access and UNIX requires root access.
H Verify that you installed the Performance Wizard in the correct path.
H Verify that at least 256 colors are available for your display configuration.
H Verify that Super VGA with a minimum of 800 x 600 resolution is available on
Windows NT and Windows 95. A resolution of 1024 x 768 resolution or
higher is recommended.
Installing the
on page 1-4.
7800-A2-GB28-80
May 1999
1-15
Page 24
Getting Started with OpenLane Performance Wizard
Using the License Key
The OpenLane Performance Wizard is packaged with a demonstration license
key, which expires shortly. The license key enables you access to the
Performance Wizard product. To have continued access to the product, purchase
the Performance Wizard to obtain an updated license key.
" Procedure
You must update licensing information from within the Navigation Wizard. The
Navigation Wizard is available once you start the Performance Wizard. To update
licensing information:
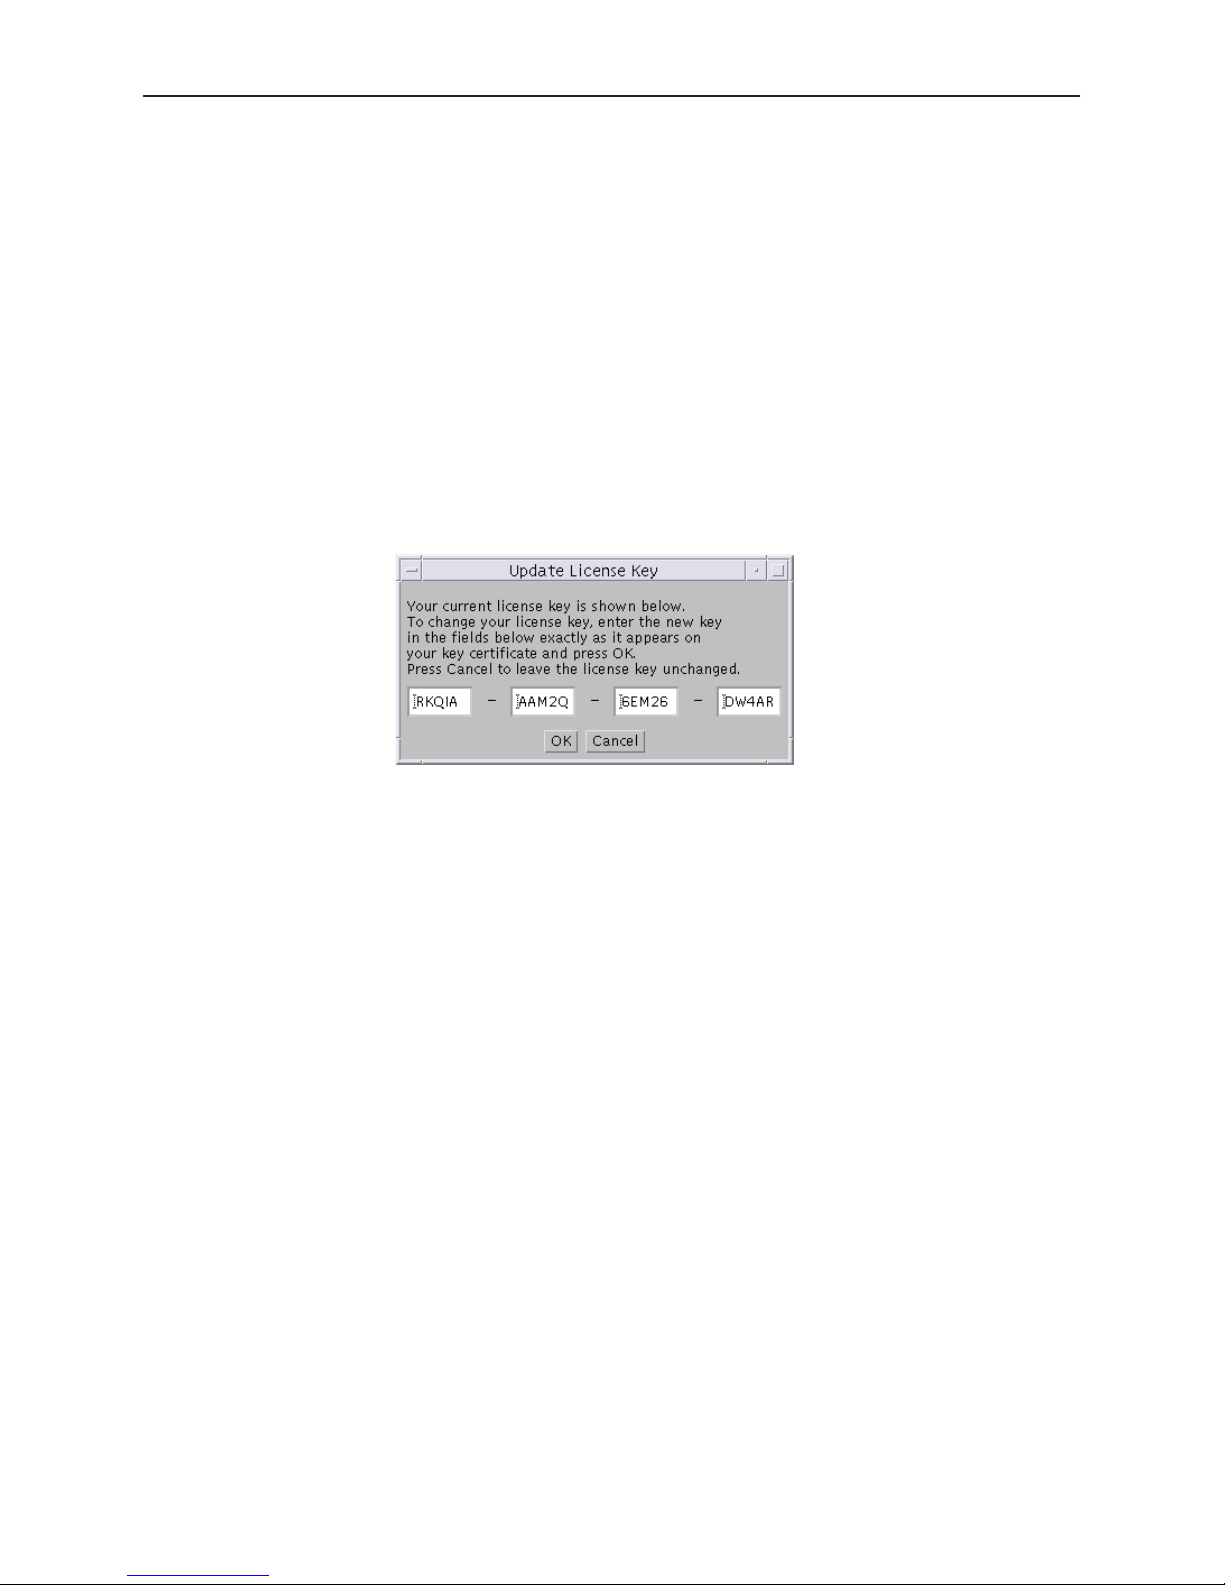
1. Click on the File menu and select Update License Key. The Update License
Key dialog appears.
2. Enter the new license key in the appropriate text input fields.
3. Click on OK to apply the new license key.
A new license key is provided to you when you purchase the product. Contact
your local sales representative for information on purchasing the Performance
Wizard. Refer to page A,
Warranty, Sales, Service, and Training Information.
1-16
May 1999
7800-A2-GB28-80
Page 25

Removing the Performance Wizard
To remove the Performance Wizard from your operating platform and OpenView
or NetView (if the products are integrated), use the instructions in the following
sections.
Removing from Solaris, HP-UX, or AIX
Procedure
"
To remove from Solaris or HP-UX:
1. Become superuser.
su root
2. Change to the source directory.
— For Solaris and HP-UX:
cd /opt/OV/pdn/PerfWiz
Getting Started with OpenLane Performance Wizard
3. Remove the product.
Removing from Windows
Use the Control Panel Install/Uninstall Programs option.
— For AIX:
cd /usr/OV/pdn/PerfWiz
If you installed the software in a location other than the path specified in the
previous examples, change to the directory where you installed the source
files.
./UnInstall
7800-A2-GB28-80
May 1999
1-17
Page 26

Getting Started with OpenLane Performance Wizard
Setting Up the Web Server (for SLM Reports Only)
To display and retrieve the Web-based Service Level Management (SLM) reports,
the Apache Web server and an active User History Poller are set up during the
automated installation of OpenLane Performance Wizard.
Using the User History Poller Daemon
The User History Poller daemon enables data collection by polling FrameSaver
SLV devices for the performance and statistical data that is required to compile
SLM reports. Using the SLM Report Administration interface, data is collected
only for FrameSaver SLV devices enabled for data collection.
The User History Poller daemon is started during OpenLane Performance Wizard
installation when the automated Apache Web server installation option is
selected. While the User History Poller daemon collects data from devices set up
for data collection, it is not necessary to stop and restart the daemon as you add
or remove devices for data collection.
Use these commands for your operating platform to start or stop the User History
Poller manually:
H For HP-UX, Solaris, and AIX systems:
— To start the User History Poller poller:
cd /opt/OV/pdn/PerfWiz
./UHPoller
— To stop the User History Poller:
cd
/opt/OV/pdn/PerfWiz
./UHPollerStop
H For Windows NT:
— To start the User History Poller:
cd C:\pdn\PerfWiz
UHPoller
— To stop the User History Poller:
cd C:\pdn\PerfWiz
UHPollerStop
In the previous commands, the default path is specified during installation.
1-18
May 1999
7800-A2-GB28-80
Page 27

Troubleshooting the Apache Web Server Setup
This section describes how to verify the setup and configuration of the Apache
Web server which occurred during the automated installation of OpenLane
Performance Wizard. In this procedure,
pathname to the directory on your platform where you set up Apache Web server
software.
" Procedure
To verify the setup of the Apache Web server:
1. Open a Web browser and specify a URL with the host and port where you set
up the Apache Web server.
http://
If the Apache Web server is set up and configured correctly, an opening page
indicates that the Apache Web server is working.
If the Apache Web server welcome page is not displayed:
— Ensure that the Apache daemon is running.
apache_machine
Getting Started with OpenLane Performance Wizard
apachepath
:80
specifies the absolute
— Check the
— Verify that the DocumentRoot directive in the
apachepath
— Make sure that the port number specified in the URL matches the Port
directive specified in the
no other Web server is running on this port.
2. Display the OpenLane Service Level Management (SLM) login page.
Change the DocumentRoot directive to point to the
subdirectory. For example, use the default directory, enter:
DocumentRoot /opt/Apache/htdocs
http://
If the Web server setup is correct, the SLM login page appears.
If the SLM login page does not appear, ensure that the Alias directive for
/OpenLane is specified correctly in the
file.
apachepath
/conf/httpd.conf file is configured correctly.
apache_server
/log/error_log file for messages.
apachepath
/OpenLane/index.html
/conf/httpd.conf file, and that
apachepath
apachepath
/conf/httpd.conf
/htdocs
7800-A2-GB28-80
May 1999
1-19
Page 28

Getting Started with OpenLane Performance Wizard
3. Log into the SLM login page, by entering Admin for the Customer ID and
then pressing the Log In button. If correctly set up, the OpenLane Service
Level Management Administration page appears.
If the SLM Administration page does not appear:
— Verify that the ScriptAlias directive for /cgi-bin/OpenLane is
correctly specified in the
apachepath
represents the absolute path to where you set up the Apache
Web server.
— Ensure that the JRE is in the path for the Apache Web server. If it is not,
stop the Web server, add the JRE directory to your PATH, then restart the
Apache Web server.
For HP-UX:
apachepath
/conf/httpd.conf file.
— Verify that you set the owner and permissions for the
specified in the following table. In the following table, it is assumed that
you used the recommended owner of bin.
For Solaris and AIX:
— Verify that you set the owner and permissions for the
specified in the following table. In the following table, it is assumed that
you used the recommended owner of nobody.
Directory/Files Owner (HP-UX)
perfwizpath
perfwizpath
perfwizpath
perfwizpath
perfwizpath
perfwizpath
perfwizpath
*
perfwizpath
/database/userHistory root root 777 (rwxrwxrwx)
/web/cgi-bin bin nobody 755 (rwxr-xr-x)
/web/cgi-bin/Admin bin nobody 755 (rwxr-xr-x)
/web/cgi-bin/Admin/* bin nobody 755 (rwxr-xr-x)
/web/htdocs bin nobody 755 (rwxr-xr-x)
/web/templates bin nobody 755 (rwxr-xr-x)
/web/templates/* bin nobody 755 (rwxr-xr-x)
represents the absolute path to where you installed the Performance Wizard.
Owner
(Solaris and AIX)
perfwizpath
perfwizpath
Permissions
files as
files as
1-20
May 1999
7800-A2-GB28-80
Page 29

Using the Navigation Wizard
Displaying the Navigation Wizard
When you start the Performance Wizard as a standalone application, the
Navigation Wizard is displayed. As the main window of the Performance Wizard,
the Navigation Wizard provides you with the ability to manage devices, and
access other tools, which include:
H Real Time Charts
These charts provide a view of 1 to 4 graphs that show various types of
activity on a device.
2
H Historical Charts
These charts provide a view of a single graph that displays previously
collected data on various types of activity on a device.
H Service Level Management (SLM) Reports
These reports, which are Web-based, provide historical data on device
activity. This Web-based information provides service level accounting and is
used to verify the quality of services rendered and received. You must use
the Navigation Wizard to discover the FrameSaver SLV devices that are
required to generate these Web-based reports.
H Diagnostic Tests
These tests allow you to monitor various activity on FrameSaver devices
using tests, which include loopback and pattern tests.
If you start the Performance Wizard from either OpenView or NetView, you have
the option of displaying the Navigation Wizard, launching a Real Time Chart, or
starting Diagnostic Tests. See Chapter 3,
6,
Diagnostic Tests
respectively.
This chapter provides you with the information you need to access and use the
components of the Navigation Wizard.
, for details on Real Time Charts and Diagnostic Tests,
Using Real Time Charts
, and Chapter
7800-A2-GB28-80
May 1999
2-1
Page 30

Using the Navigation Wizard
Accessing Components and Menus
The Navigation Wizard main window contains several components and menus
that you can use to manage devices and launch other tools, such as Real Time
Charts, Historical Charts, and Diagnostic Tests. From this window, you can also
discover the FrameSaver SLV devices, which are required to create and deliver
SLM Reports through the World Wide Web.
Components of the Navigation Wizard
Table 2-1 lists and briefly describes each component of the Navigation Wizard.
Table 2-1. Navigation Wizard Components
Component
Menus Provide options to manage devices and launch tools.
Device Display Area Lists all devices known to OpenLane Performance Wizard.
Device Display Area
Buttons
Buttons Provide a quick launch mechanism for Tests and Real Time
Status Field Specifies the device selected.
Historical Daemon
Icon
Description
The Device Display Area is divided into three categories:
H Endpoint lists all interfaces and DLCIs, when the Device
Display Area is expanded.
H Connection displays both ends of DLCI connections (if set).
H Historical Collection displays status of collections (if active).
The column headings are buttons. Clicking on a column heading
will sort the list based on that column. Sort will be in ascending
order and clicking again re-sorts the list by that column in
descending order.
Charts. If an item is not selected in the Device Display Area, a
dimmed No Tools button is present.
Indicates the state of the Historical daemon, which is used to
create Historical Charts. If the icon is red with a slash, the
daemon is inactive. If the icon is green, the daemon is active.
The Navigation Wizard menus contain options which you can use to perform
various operations on devices and interfaces. Refer to the Help file menu options
titled Tasks and Reference for menu options and descriptions.
2-2
May 1999
7800-A2-GB28-80
Page 31

Using the Navigation Wizard
Performing Tasks Using the Navigation Wizard
Using the components and menus within the Navigation Wizard, you can perform
many tasks, including:
H Manage the Device Display Area
H Set FrameSaver Options
H Launch Real Time Charts and Historical Charts
H Use SLM Reports
H Perform Diagnostic Tests
H Start the NetScout Manager
7800-A2-GB28-80
May 1999
2-3
Page 32

Using the Navigation Wizard
Managing the Device Display Area
Using the Device Display Area within the Navigation Wizard, you can perform a
variety of tasks, including:
H Add new devices
H Navigate and select devices for operations
H Update device configuration information
H Delete a device
H Locate a device in the display hierarchy
Populating the Device Display Area
When you start the Performance Wizard, the Device Display Area may be empty.
To perform an operation on a device, you must first add devices to the Device
Display Area, which populates the Performance Wizard device database. Use the
following procedure whenever you want to add a new device.
" Procedure
To add devices to the Device Display Area:
1. Click on the File menu and choose New Device. The New Device dialog
appears.
2-4
May 1999
7800-A2-GB28-80
Page 33

If you launch a Real Time Chart from within OpenView or NetView, and the
device you selected is not known to the Performance Wizard, the New
Device dialog box is displayed by default.
2. Enter the Hostname or IP Address of the device in the Device Name text
input field.
3. Enter the Read/Write Community string in the Community input field.
NOTE:
You must specify a Set (Write) Community string for any component that
requires Write access to the device, such as Diagnostic Tests, SLM
Reports, and Configure Device.
4. Click on OK.
Selecting Devices for Operations
Most operations that you perform using the Performance Wizard require that you
select a device, device interface, or DLCI from the Device Display Area. The
Device Display Area organizes devices under the headings Entire Network and
Location.
Using the Navigation Wizard
Entire Network, when expanded, shows the list of all devices contained in the
Performance Wizard database sorted by IP Address. Location, when expanded,
displays all Location IDs extracted from the MIB variables. If the Location IDs list
is not expanded, double-click on Location to display the list.
The column headings in the Device Display area are buttons. Clicking on a
column heading will sort the list based on that column. Sort will be in ascending
order and clicking again re-sorts the list by that column in descending order.
7800-A2-GB28-80
May 1999
2-5
Page 34

Using the Navigation Wizard
Updating Device Configuration Information
When a device is reconfigured (for example, a new PVC is added) or if you begin
encountering unexpected SNMP errors during historical collections or while
creating Real Time Charts, you should ensure that the device configuration
information is current.
" Procedure
To update the device database:
1. Highlight a device in the Device Display Area.
2. Click on the File menu and select Device Sync. The Device Sync dialog box
appears.
The IP Address or Hostname of the selected device is displayed in the
Device Name text input field. This field can be edited if you choose to perform
a Device Sync on another device.
3. Enter the Read/Write Community string in the Community text input field.
4. Click on Apply or OK.
2-6
NOTE:
You must specify a Set (Write) Community string for any component that
requires Write access to the device, such as Diagnostic Tests, SLM
Reports, and Configure Device.
May 1999
7800-A2-GB28-80
Page 35

Using the Navigation Wizard
The status line at the bottom of the dialog returns information on the device
database operation.
Additional Device Sync and Connection Name functions are available from the
Preferences dialog. Click on the Edit menu and select Preferences. Click on the
Device Sync tab. Multiple functions can be selected from the dialog box.
The Device Sync Preferences options are:
H Discover connections and endpoints
When checked, causes discovery of FrameSaver SLV PVC connections and
unknown endpoints.
H Resync already discovered endpoints
When checked along with the first option, any known endpoints are also
resynced.
H Overwrite connection names
When selected, any user-created connection names are overwritten by the
current location setting of the device.
7800-A2-GB28-80
May 1999
2-7
Page 36

Using the Navigation Wizard
Deleting Devices
You can remove devices from the Device Display Area that you no longer want to
monitor. Removing a device deletes it from both the Device Display Area and the
device database.
" Procedure
To remove a device:
1. Highlight the device you want to remove.
2. Click on the File menu and select Delete Device. The Wizard Query dialog
3. Click on OK to remove the device.
Locating Devices
You can locate a device in the Device Display Area using the Find option.
appears.
" Procedure
To locate a device:
1. Click on the Action menu and select Find. The Find dialog appears.
2. Enter the DLCI Connection name or number, Connection ID, Device
IP Address, or Device Hostname in the Find String text input field.
3. Click on the corresponding radio button to identify the type of object you are
seeking.
4. Click on OK. The Find Results dialog appears.
5. Double-click on a discovered object to jump to that object in the Device
Display Area. Click on OK to close the Find Results dialog.
2-8
May 1999
7800-A2-GB28-80
Page 37

Setting FrameSaver Options
From the Navigation Wizard you can set certain FrameSaver options, which
include:
H PVC connections
H Frame and burst measurements
The following sections discuss these options in more detail.
Managing PVC Connections
You can create, modify, or remove connections or create Connection IDs using
the Edit Connection dialog. To access the Edit Connection dialog, use either of
the following methods:
H Highlight a DLCI, press the right mouse button, then select Connection from
the pop-up menu, or
H Highlight a DLCI, then click on the Edit menu and select Connection.
Using the Navigation Wizard
7800-A2-GB28-80
May 1999
2-9
Page 38

Using the Navigation Wizard
The Edit Connection dialog appears.
NOTE:
PVC connections are automatically discovered between FrameSaver SLV
NNI units and FrameSaver SLV endpoints. However, the endpoints are
unaware of these connections and the PVC connections are only visible from
the SLV NNI side of the connection.
When you edit an SLV NNI-based connection, you cannot change the name
of the remote end of the connection. To change the endpoint name, edit the
connection on the remote endpoint of the device instead.
See the FrameSaver SLV user documentation for more information.
2-10
May 1999
7800-A2-GB28-80
Page 39

Setting Frame and Burst Ranges
For FrameSaver SLV devices, you can configure frame size and burst count
ranges for those devices that have been added to the Device Display Area using
the Set (read/write) Community string. These configurations affect the Analysis
view for Real Time and Historical Charts.
NOTE:
The Configure Device component requires Write access to a device. You set
this access by using the Set (Write) Community string when you add devices
to the Device Display Area. See
page 2-4 for more information on adding devices.
In the following procedure, the documented steps use Frame Ranges as an
example. Although the values for frame ranges and burst ranges differ, the
procedure for setting these options remain the same.
Using the Navigation Wizard
Populating the Device Display Area
on
7800-A2-GB28-80
May 1999
2-11
Page 40

Using the Navigation Wizard
" Procedure
To set frame and burst ranges:
1. Highlight a Network Port DLCI within the Device Display Area.
2. Click on the Edit menu and select Configure Device. The Configure Device
dialog appears.
If device configuration information is being collected, the display of the
Configure Device dialog is delayed. A message appears to indicate that data
is being collected.
3. Click on the Frame Ranges or Burst Ranges tab, depending on the options
you want to set.
2-12
May 1999
7800-A2-GB28-80
Page 41

4. Enter a valid numeric value in the Edit text entry box for Frame Range or
Burst Ranges, depending on the options you are setting.
You also have the option of selecting this value from the Frame Size Range
Upper Limit (Octets) or Burst Range Upper Limits (Bits) text selection box,
located at the bottom of the dialog. The Edit text entry box is then populated
with this value.
NOTE:
The highest value listed cannot be entered or selected, as the highest
limit is set by the device itself.
5. Click on Set to update the configuration limit and close the dialog. The Status
field at the bottom of the dialog returns information on the operation.
If you are setting more than one limit, click on Apply to continue setting other
options and retain the display of the dialog. You can then click on Set when
all operations are complete.
Displaying Real Time Charts
Using the Navigation Wizard
From within the Navigation Wizard you can launch a Real Time Chart. A Real
Time Chart provides a view of 1 to 4 graphs that show details on the performance
of a selected device. Information for the charts is gathered from devices based on
a default polling frequency, which you can change.
The following sections discuss how to:
H Set the Real Time Polling Frequency
H Launch a Real Time Chart
See Chapter 3,
manage performance.
Using Real Time Charts
, for information on using these charts to
7800-A2-GB28-80
May 1999
2-13
Page 42

Using the Navigation Wizard
Setting the Real Time Polling Frequency
The Real Time Polling Frequency specifies how often statistical information is
gathered and plotted for charts by Performance Wizard. By default, the Real Time
Polling Interval is 30 seconds, but you can change this value using the Edit
Preferences Performance dialog. Regardless of the value you set, it is in effect
for all charts, unless you specify a different value for an individual chart at launch
time. See
Launching a Real Time Chart
" Procedure
To change the Real Time Polling Interval for all charts:
1. Click on the Edit menu and select Preferences. The OpenLane Preferences
dialog appears.
on page 2-15 for more information.
2-14
2. From the Performance tab, modify the default polling value of 30 seconds
using one of the following methods:
— Drag the slider. The value selected is displayed in the text entry box,
which is positioned the right of the slider.
— Click on the line to either side of the slider. This increments or
decrements the value by one second and the value is displayed in the
text entry box to the right.
— Enter a value in the text entry box, which is located to the right of the
slider.
The polling frequency you select becomes the default for all charts, unless
you change the polling rate when you launch an individual Real Time Chart.
3. Click on OK.
May 1999
7800-A2-GB28-80
Page 43

Launching a Real Time Chart
All data for Real Time Charts is gathered and plotted for charts using the value of
the Real Time Polling Frequency. You can change this polling frequency for an
individual chart if you use the Launch Graph dialog.
" Procedure
To launch a Real Time Chart that uses the Real T ime Polling Frequency:
1. Click on an interface or DLCI in the Device Display Area of Navigation
Wizard. The chart types that are available to you depend on the device you
select.
For example, the following screen example shows a highlighted DLCI. The
chart types available for this DLCI include Throughput, Congestion, and
Analysis.
Using the Navigation Wizard
7800-A2-GB28-80
May 1999
2-15
Page 44

Using the Navigation Wizard
2. Select a DLCI, click the right mouse button, and select Launch Graph from
the drop-down menu.
The Launch Graph dialog specifies the device, interface, and DLCI
(if applicable) that you selected, gives you the option of selecting Real Time
or Historical Charts (Daily Details and Weekly Averaged), and lists the chart
types available for the interface or DLCI you selected.
3. Ensure that the Real Time option is enabled. This is the default.
— Drag the slider. The value selected is displayed in the text entry box,
which is positioned to the right of the slider.
— Click on the line to either side of the slider. This increments or
decrements the value by one second and the value is displayed in the
text entry box to the right.
— Enter a value in the text entry box, which is located to the right of the
slider.
NOTE:
This polling frequency affects the chart type that you selected in this
dialog box only. Refer to
page 2-14.
4. Click on the chart type button (Throughput, Congestion, or Analysis) to open
the Real Time Chart dialog for the selected view.
See Chapter 3,
Using Real Time Charts
performance using these charts.
Setting the Real Time Polling Frequency
, for information on managing
on
See Chapter 6,
2-16
Diagnostic Tests
May 1999
, for information on running tests.
7800-A2-GB28-80
Page 45

Displaying Historical Charts
A Historical Chart displays a single graph that provides details of previous activity
on device interfaces or DLCIs. Before you can launch and view a Historical Chart,
you must start the Historical daemon and enable historical data collections for
each device on which you want to collect historical data.
The following sections discuss how to:
H Start and stop the Historical daemon
H Enable or disable Historical Data Collection
H Launch a Historical Chart
Using the Navigation Wizard
See Chapter 4
charts to help you manage performance of your devices.
, Using Historical Charts
Starting and Stopping the Historical Daemon
To collect historical information, the Performance Wizard uses a Historical (Data
Collection) Daemon that runs in the background. The daemon collects data from
those devices and DLCIs that have been enabled for historical data collection.
The information collected is stored in disk files that can be accessed in the form
of Historical Charts.
H To start the Historical daemon, click on the Action menu and select Start
Historical Daemon.
The Historical daemon icon, which is located next to the Status text field
within the Navigation Wizard, changes color (from red with a slash (/) to
green) when the Historical daemon is active.
In the following example, the bottom portion of the Navigation Wizard window
is displayed. The Historical daemon icon is green, which indicates that the
Historical daemon is enabled.
, for more information on using these
H To stop the Historical daemon, click on the Action menu and select Stop
Historical Daemon.
7800-A2-GB28-80
May 1999
2-17
Page 46

Using the Navigation Wizard
Enabling or Disabling Historical Data Collection for a Device
To collect historical data for a device interface or DLCI, you must enable the
Historical daemon as described in
on page 2-17, then specify the devices for which historical data is to be collected.
The Edit Historical Data Collection dialog is used to enable a device interface or
DLCI for historical data collection. To open the Edit Historical Collection dialog,
use one of the following methods:
H Position the cursor on the interface or DLCI you want to affect, press the right
mouse button, then select Edit Historical Collections from the pop-up menu.
H Highlight an interface or DLCI, click on the Edit menu, then select Edit
Historical Collection.
The Edit Historical Collection dialog appears.
Starting and Stopping the Historical Daemon
The following procedure describes how to enable, modify, or disable Historical
Data Collections for a device interface or DLCI.
2-18
May 1999
7800-A2-GB28-80
Page 47

Using the Navigation Wizard
" Procedure
To enable, modify, or disable a historical collection:
1. Select a device interface or DLCI from Navigation Wizard and open the Edit
Historical Collection dialog box.
2. From the drop-down list, locate the chart type that you want to enable or
disable. The View column lists all available chart groups for the selected
interface or DLCI.
3. Enter a time allotment in the Frequency text input field, which specifies how
often information is gathered for the select view. You can also change the
Frequency by clicking on the arrows (spinbox).
4. Select a measurement from the Unit column that specifies how to interpret
the Frequency. Depending on the device selected, available options can
include seconds, minutes, hours, and days.
5. Click on the select box under the Active column to enable or disable a
collection. A check mark indicates that collections are enabled.
6. Press the Test button to verify that data can be collected. The test results are
displayed in the Status Line and the Status column of each view.
7. Click OK.
The Historical Collection column in the Navigation Wizard main window specifies
whether or not the device interface is enabled for historical data collection.
OK indicates that the historical data collection is turned on.
If the Historical daemon does not start, see Appendix A,
Launching a Historical Chart
A Historical Chart displays a single graph that provides details of previous activity
that you have collected using the Historical daemon and Historical Data
Collection components. You can create Historical Charts for all device interfaces
and DLCIs, and historical charts are available in the following forms:
H Daily Details charts display historical data from a 24-hour period.
H Weekly Averaged (trended) charts display historical data in 7-day increments.
Messages
.
7800-A2-GB28-80
May 1999
2-19
Page 48

Using the Navigation Wizard
" Procedure
To launch a Historical Chart:
1. Select a device interface or DLCI from the Device Display Area.
2. Click on the Action menu and select Launch Graph. The Launch Graph
3. Click on either Daily Details or Weekly Averaged to display the Historical
dialog is displayed and by default, the options for a Real Time Chart are
shown.
Chart options.
The Daily Details dialog is similar to the following and displays historical data
gathered for a 24-hour period. The Weekly Averaged (trended) dialog is also
similar to the following and displays historical data gathered in 7-day
increments.
4. Drag the slider or click on the line on either side of the slider to select the day
or week that you want to view.
5. Select a graph type from the drop-down menu next to the Launch Graph
button.
For Historical Charts, the Edit Historical Collection dialog lists the chart types
available to you for the selected interface or DLCI. There can be from one to
four views available for each chart. Launching a view presents a display of a
single historical graph.
6. Click on Launch Graph to display the chart.
2-20
May 1999
7800-A2-GB28-80
Page 49

Using the Navigation Wizard
Using the Service Level Management (SLM) Reports
SLM Reports are set up and distributed through the World Wide Web. From
within the Navigation Wizard, you need only ensure the discovery of the
FrameSaver SLV devices for which you want to enable data collection. See
Populating the Device Display Area
devices.
on page 2-4 for information on adding these
Chapter 5,
overview of creating and delivering these reports through the World Wide Web.
Creating Service Level Management Reports,
Starting Diagnostic Tests
The Device Display Area, within the Navigation Wizard window, lists and displays
all devices known to the Performance Wizard. By selecting a FrameSaver device,
physical interface, DLCI, or end-to-end connection from the Device Display Area,
you can perform various operations, including starting Diagnostic Tests.
" Procedure
To access Diagnostic Tests from within the Navigation Wizard:
1. Select a device, physical interface, DLCI, or end-to-end connection from the
Device Display Area.
2. Start Diagnostic Tests using any of the following methods:
— Click on the Tests button at the bottom of the Navigation Wizard window.
— Click on the Action menu and select Tests.
— Click on the right mouse button while positioned over an object, then
select Tests from the pop-up menu.
provides you with an
7800-A2-GB28-80
NOTE:
The Diagnostic Tests component requires Write access to a device. You set
this access by using the Set (Write) Community string when you add devices
to the Device Display Area. See
page 2-4 for more information on adding devices.
Chapter 6,
Tests functions and access options.
Diagnostic Tests,
May 1999
provides you with an overview of the Diagnostic
Populating the Device Display Area
on
2-21
Page 50

Using the Navigation Wizard
Accessing the NetScout Manager Plus
You can access NetScout Manager Plus from the Navigation Wizard window, if
the path is defined.
Setting the Path to the NetScout Manager
Procedure
"
To define the path for the NetScout Manager:
1. Click on the Edit menu and select Preferences. The OpenLane Preference
dialog appears.
2. Enter the path to NetScout Manager as needed. A fully qualified absolute
path is needed to execute RMON manager.
3. Click on OK to apply the changes and close the dialog box.
Starting NetScout Manager
Procedure
"
To start NetScout Manager:
1. Click on the Action menu.
2. Select Start NetScout Manager.
See the NetScout user documentation for detailed information on how to use this
application.
2-22
May 1999
7800-A2-GB28-80
Page 51

Using Real Time Charts
What is a Real Time Chart?
A Real Time Chart consists of 1 to 4 graphs that display statistical data on the
performance of your network devices. These graphs are updated dynamically.
That is, you can monitor the performance of devices and data is displayed and
updated in real time.
The data that is collected is divided into chart types (described below). The chart
types that are available to you depend on the device interface or Data Link
Connection Identifier (DLCI) that you select from the Device Display Area within
the Navigation Wizard.
3
Chart Type
Analysis Illustrates burst and end-to-end measurements.
Compression Demonstrates a device’s ability to save bandwidth across the network.
Congestion Specifies what in the network may be causing packets not to reach
Diagnostics Tracks the basic errors on a link that affect data movement.
Integrity Shows how data is able to move over the link.
Summary Displays all activity on a link.
Throughput Indicates the flow of data that is able to travel through the network to its
This chapter describes how to access, view, and manage Real Time Charts. See
Chapter 4,
trended data.
Description
their destination.
destination.
Using Historical Charts
, for information on collecting and displaying
7800-A2-GB28-80
May 1999
3-1
Page 52

Using Real Time Charts
Accessing and Launching Real Time Charts
To display a Real Time Chart from within the Navigation Wizard, you must:
1. Select a device interface or DLCI from the Device Display Area, and
2. Launch a Real Time Chart using either a Chart button at the bottom of the
Device Display Area or the Action→Launch Graph dialog.
You also have the ability to set other options through the Navigation Wizard that
affect the display of a Real Time Chart, including changing the Real Time Polling
Frequency, configuring burst and frame options for FrameSaver devices,
managing PVC connections, and so forth.
See Chapter 2,
and step-by-step instructions on launching Real Time Charts.
Launching a graph type opens a Real Time Chart window that displays from one
to four graphs. If you select an interface other than a DLCI, a Real Time Chart
window similar to the following is displayed.
Using the Navigation Wizard
for details on setting preferences
3-2
May 1999
7800-A2-GB28-80
Page 53

Using Real Time Charts
7800-A2-GB28-80
May 1999
3-3
Page 54

Using Real Time Charts
If you select a chart type for a DLCI, a Real Time Chart window similar to the
following is displayed.
3-4
Refer to online Help for descriptions of the components of a Real Time Chart
window.
May 1999
7800-A2-GB28-80
Page 55

Managing Real Time Charts
From a Real Time Chart window, you can:
H Stop and restart polling of devices.
H Change the appearance of graphs.
H Query a point on a graph.
H Print a chart to a file or the printer.
H Zoom in and out of a graph portion.
H Select other chart types.
H Obtain variable statistics used for end-to-end connections.
— Modify PVC throughput displays.
— V iew FrameSaver SLV NNI device PVC displays.
H Obtain online Help.
Using Real Time Charts
Polling Devices
These topics are discussed in more detail in the following sections.
Launching a chart causes the Performance Wizard to automatically query a
device for information. The information that is gathered during polling is displayed
as a linear collection of points, by default, in the Graph Display Area. You may
elect to stop and restart polling as you are collecting statistics.
H Click on the Stop Poll button to stop querying a device for information.
H Click on the Start Poll button to restart querying a device.
The Status Line at the bottom of a Real Time Chart window specifies whether
polling is active or inactive.
7800-A2-GB28-80
May 1999
3-5
Page 56

Using Real Time Charts
Specifying a Graph Format
The Bar drop-down menu, located in the upper right-hand corner of a graph, is
used to change the appearance of a graph. You can display plots on a graph as a
Line, Bar, or Stack.
Click on the drop-down menu to change to any format listed in the following table.
Graph Format
Line Displays a linear graph of data as connected points.
Bar Plots each data set value at each point as a bar of a different color .
Stack Places the data set bars on top of each other. This is similar to
A Pie graph is also displayed for Frame Relay and DSL interfaces, but it is not
user selectable. A Pie graph displays a total bandwidth or utilization for each
access point across data sets and each set is shown as a slice of pie. This is
equal to four ports on a DSL card or the utilization of all DLCIs configured for a
Frame Relay link.
Querying a Point on a Graph
To obtain the exact timestamp and value of a graph point, you must query this
point.
" Procedure
To query a graph point:
1. Position the cursor over a point on the graph.
Description
creating a bar graph.
3-6
2. Press the right mouse button. The exact time and value of the point closest to
where you clicked is displayed in the pop-up menu.
If you perform the previous steps on a Pie graph, menu items that provide quick
navigation to other chart types are also displayed. Clicking on an Unused portion
of a Pie graph renders no information.
May 1999
7800-A2-GB28-80
Page 57

Printing a Chart to File or Printer
To direct a copy of a chart to a file or the printer, click on the File menu and select
Print. The Print dialog for your operating platform is displayed. Refer to the
documentation for your system to obtain information on using the Print dialog.
Zooming In and Out of a Graph Portion
You can enlarge an area of the graph by zooming into a portion of a graph. The
following procedures describe how to zoom into a graph portion, and how to
return to the default settings.
" Procedure
To zoom into a graph portion:
1. Position the cursor over an area within a graph.
2. Press the left mouse button while dragging the cursor around the area you
want to enlarge.
Using Real Time Charts
To return to the default settings for the graph, use one of the following methods:
H Press the right mouse button and select Reset Zoom.
H Click on the View menu and select Reset Zoom.
H Press either the upper- or lowercase r key in the Graph Display Area.
Selecting Other Chart Types and Displaying
A Real Time Chart window provides a toolbar and menu that you can use to
select another chart type, display the Navigation Wizard window, or run
Diagnostic Tests.
H To view another chart, click on one of the chart types available on the toolbar,
or click on the View menu and select a listed chart. The chart types available
depend on the type of device interface or DLCI you select. The current view
is dimmed within the toolbar and shown as selected in the menu.
H To display the Navigation Wizard main window, click on the Navigation
Wizard button located on the toolbar.
H To run diagnostic tests on the displayed component, click on the Tests button.
7800-A2-GB28-80
May 1999
3-7
Page 58

Using Real Time Charts
Modifying PVC Throughput Displays
Some end-to-end connections provide a view of the Network (cloud). You have
the option of displaying statistics on data that is transmitted, received, or both
through the network, using the Tx, Rx, or Both radio buttons.
The Tx button displays information that is being transmitted by the selected
interface into the network. The Rx button displays information that is being
received from the network by the device. The Both button shows statistics on
data that is being transmitted and received.
Handling FrameSaver SLV NNI PVC Displays
When viewing PVC displays on a FrameSaver SLV NNI device:
H Statistics displayed represent the portion of the user PVC between the SLV
NNI and the remote endpoint.
H PVC connections on the data port of the SLV NNI display one of the PVC
endpoints of the user PVC.
Obtaining Help
H Connections on the network side of the SLV NNI display the other endpoint of
the user PVC.
The online Help for the Real Time Chart window is divided into three topics.
Topic
Tasks From the Help menu, provides step-by-step instructions on most operations
Reference From the Help menu, lists and describes each component within this dialog.
On Graph From a right mouse button click on a graph, defines the Y-Axis, Lines, and
Description
you can perform.
MIB objects used to compile each graph.
3-8
May 1999
7800-A2-GB28-80
Page 59

Using Historical Charts
What is a Historical Chart?
A Historical Chart displays a single graph that provides details of previous activity
on network interfaces and DLCIs that have been collected using the Historical
daemon and Historical Data Collection components.
There are two types of Historical Charts:
H Daily Details – shows historical data collected on a specific day.
H Weekly Averaged – provides a trended chart. That is, data is averaged over
each day in that period.
4
This chapter describes how to access, view, and manage Historical Charts. See
Chapter 3,
performance statistics in real time.
See Chapter 2,
Historical daemon, enabling data collections, and launching Historical Charts.
Using Real Time Charts
Using the Navigation Wizard
Accessing Historical Charts
" Procedure
To display a Historical Chart, you must use the Navigation Wizard as follows:
1. Enable the Historical daemon. The Historical daemon actively polls the
devices you specify for data and stores the information.
2. Set up data collections for the device interfaces and DLCIs on which you
want to collect historical data.
3. Select a device interface or DLCI from the Device Display Area, which has
been enabled for data collections.
4. Launch a Historical Chart using the Launch Graph dialog.
You also have the ability to set other options through the Navigation Wizard,
which affect the display of a Historical Chart, including configuring burst and
frame options for FrameSaver devices and managing PVC connections.
for information on collecting and displaying
for details on options, starting the
7800-A2-GB28-80
May 1999
4-1
Page 60

Using Historical Charts
Viewing Historical Charts
When you launch a Historical Chart for either Daily Details or Weekly Averaged, a
window similar to the following daily report appears:
4-2
May 1999
7800-A2-GB28-80
Page 61

Managing Historical Charts
From the Historical Chart window, you can:
H Change the format of graphs.
H Query a point on a graph.
H Zoom in and out of a graph portion.
H Print a chart to a file or the printer.
H Obtain Help
Specifying a Graph Format
The Bar drop-down menu, located in the upper right-hand corner of a graph, is
used to change the appearance of a graph. You can display plots on a graph as a
Line, Bar, or Stack.
Click on the drop-down menu to change to any format listed.
Using Historical Charts
Querying a Point on a Graph
To obtain the exact value and timestamp of a graph point, you must query the
point.
" Procedure
To query a graph point:
1. Position the cursor over a point on the graph.
2. Press the right mouse button. The exact timestamp value of the point closest
to where you clicked appears in the pop-up menu.
On Weekly Averaged (trended) graphs, a link to the Daily Details graph is also
provided for the date specified.
7800-A2-GB28-80
May 1999
4-3
Page 62

Using Historical Charts
Zooming In and Out of a Graph Portion
You can enlarge an area of the graph by zooming into a portion of a graph.
" Procedure
To zoom into a graph portion:
1. Position the cursor over the graph.
2. Press the left mouse button while dragging the cursor around a select area of
the graph.
To return to the default settings for the graph, use one of the following methods:
H Press the right mouse button and select Reset Zoom.
H Click on the View menu and select Reset Zoom.
H Press either the upper- or lowercase r key in a graph window.
Printing a Chart to File or Printer
To direct a copy of a chart to a file or the printer, click on the File menu and select
Print. The Print dialog for your operating platform appears. Refer to the
documentation for your system to obtain information on using the Print dialog.
Obtaining Help
The online Help for the Historical Chart dialog is divided into three topics.
Topic
Tasks From the Help menu, provides step-by-step instructions on most operations
Reference From the Help menu, lists and describes each component within this dialog.
On Graph From a right mouse button click on a graph, defines the Y-Axis, Lines, and
Description
you can perform.
MIB objects used to compile each graph.
4-4
May 1999
7800-A2-GB28-80
Page 63

Creating Service Level
Management Reports
What are Service Level Management (SLM) Reports?
Network Administrators and Service Providers use the SLM Reports feature to
provide automatic delivery of service level accounting and quality of service
reports to their customers that use FrameSaver SLV devices. This information is
delivered to and accessed by customers through the World Wide Web.
A FrameSaver SLV device contains functionality that enables the device itself to
generate and store performance data. To retrieve this data from the FrameSaver
SLV devices and compile the data into SLM reports that can be delivered to the
end user, the Network Administrator or Service Provider must:
5
H Discover the FrameSaver SLV devices.
H Define customer information and data collection using the SLM Report
Administration interface available through the Web server.
Discovering FrameSaver SLV Units
All FrameSaver SLV devices defined in the OpenLane Performance Wizard
device database can be enabled for data collections. The device database is
accessed through Navigation Wizard, which lists all devices known to
Performance Wizard.
To add devices to the database using the Navigation Wizard, see
Device Display Area
in Chapter 2,
Using the Navigation Wizard
Populating the
.
7800-A2-GB28-80
May 1999
5-1
Page 64

Creating Service Level Management Reports
Using the SLM Report Administration Web-Based Interface
The SLM Report administrative interface is accessible through the Web server.
You must use this interface to access:
H Customer Profile Administration to specify details on the customers (end
users) that are to receive SLM reports.
H Data Collection Administration to enable Data Collection for each device
that is being monitored.
The Web-based interface is constructed to step you through all tasks pertaining
to Customers Profiles and Data Collection with online Help. You must use the
same interface whenever you want to change a Customer Profile or Data
Collection setup.
" Procedure
To access the SLM Report Administration Web-based interface:
1. Open your Web browser and specify the hostname where the Apache Web
server was set up.
http://
An opening Web page should appear that indicates the Apache Web server
is set up correctly.
yourserver
2. Display the SLM Report Administration main page.
http://
3. Enter Admin in the Customer ID text input field, then press the Log In button.
The SLM Report Administration page appears. Within this page, you can
choose to create a Customer Profile or enable Data Collections for a device.
yourserver
/OpenLane/
5-2
May 1999
7800-A2-GB28-80
Page 65

SLM Reports Administration
For security purposes, the authorized user login and password should be setup
immediately after accessing the Reports Administration Web page.
" Procedure
To modify the authorized user login:
1. From the Customer Profile Administration screen, select Admin from the
Existing Customer drop-down list.
2. Select Modify authorized user logins. The Modify User Logins page appears.
3. Enter a User Login ID and Password for the Administrator to use.
4. Select Add New User.
5. Scroll to the bottom of the screen and click Log In.
6. When prompted for the Username and Password Required dialog box, enter
Admin and the password just created. This entry is necessary once per
session.
Creating Service Level Management Reports
" Procedure
To create a new Customer Profile:
1. Access the SLM Report Administration page and specify Admin for your
Customer ID.
2. Click on Customer Profiles. The Customer Profile Administration page
appears.
3. Enter a Customer ID.
Customer IDs must be unique and can consist of alphanumeric characters.
If a Customer ID is not specified, you cannot perform any tasks.
4. Click on the Create a New Customer Profile option. The Create or Modify
Customer Profile page appears. Enter general customer information and click
the Save button to set the general customer and system access options.
5. Click on Modify Assigned Devices. The Modify Assigned Devices page
appears. Within this page, you must specify the devices which this customer
receives SLM Reports.
6. Click on Modify User Logins. The Modify User Logins page appears.
Within this page, specify the users that have access to this account and
assign passwords for those users.
When you have selected user and Web server access, you have completed the
setup of a Customer Profile. You can return to the Customer Profile
Administration page and set up additional users, modify the current profile, or
enable Data Collections on devices specified in this profile so on-demand and
scheduled network service reports can be generated.
7800-A2-GB28-80
May 1999
5-3
Page 66

Creating Service Level Management Reports
" Procedure
To enable Data Collections for a specific customer:
1. Access the SLM Report Administration page and specify Admin for your
Customer ID.
2. Click on Data Collection. The Data Collection Administration page appears.
3. Select the device(s) you want to configure for the customer.
You can enter an IP address for a single device or specify that all of the
devices for specific customer be configured for data collection.
4. If you are configuring all devices for a particular customer, continue to the
next step.
If you selected a single device, it will display the parameters that are
configured for the device.
A device can be assigned to multiple customers or have default parameters
set. It is possible that the device you selected may have parameters already
configured. If parameters are configured, the values are displayed.
5. Enter and/or modify parameters for the device(s).
The parameters to configure include enabling polling and specifying a polling
interval, FTP login, and password. Refer to
Saving Polling Data.
Saving Polling Data
6. Select Save for this Customer or Save for this Device to set these options.
A dialog is displayed to indicate when the operation is complete.
If you chose to set up devices individually, you must repeat these steps for
each device assigned to a customer.
If the User History Poller is running, all new devices you enable for Data
Collection are automatically discovered and polling of these devices for
information begins within five minutes.
In the previous procedure, Data Collection Administration provides a field:
Saved polled data for ___ polling days.
This field is used to specify the number of polling days that the User History
Poller will retain data. A “polling day” is not necessarily the same as a calendar
day. A “polling day” represents a day in which at least one poll occurred.
For example, if the field is set to 90 “polling days,” then it takes 90 days worth of
actual polled data to fill the allotted space. If the polling is stopped, then restarted
later, it may take more than the 90 calendar days to fill the allotted space.
The User History Poller begins writing over the oldest data so the most recent
data is always available. This field should be set based on how far back in time
for which you plan to run reports. In the 90-day example above, with the poller
continuously running, a report run with a report period greater than 90 days ago
would not have data for that report period. The report would show NA and/or
“Data Missing” for the dates earlier than 90 days.
5-4
May 1999
7800-A2-GB28-80
Page 67

SLM Report Data Export
From all reports, there is an option to export report data. Select the output type
CSV (Comma Separated Value). The CSV file can be saved with a .csv extension
and then imported into any statistical program like Microsoft Access, Microsoft
Excel, etc.
SLM Report Scheduling
Scheduled Network Service Reports are available. From the Report Scheduler,
historical reports can be set up to run automatically. Once the schedule
instructions file is created, a scheduler program installed in the same directory as
OpenLane can generate the reports. Typically, “cron” is used with UNIX and the
“at” command is used with Windows NT.
Once the scheduled reports are created, the Scheduled Report Viewer is used to
view the report. Refer to the Report Scheduler administration screen for
instructions and refer to online Help for more complete details.
Creating Service Level Management Reports
Time Zone Settings
The OpenLane SLV Reports are scheduled based on the time zone of the server.
The Time Zone ID can be edited in the preferences.def or preferences.dat file.
At installation time, the directory is pdn/PerfWiz/data/preferences.def file. If any
modifications are made to the preferences.def file, change the Time Zone ID in
pdn/PerfWiz/database/preferences.dat file, entry name:
pdn.slv.timeZone=XXX, where XXX represents the Timezone ID.
Use one of the Time Zone IDs in Table 5-1, Time Zone IDs.
7800-A2-GB28-80
May 1999
5-5
Page 68

Creating Service Level Management Reports
Table 5-1. Time Zone IDs
Raw GMT
Offset in Hours
–1 1 MIT Midway Islands Time
–10 HST Hawaii Standard Time
–9 AST Alaska Standard Time
–8 PST Pacific Standard Time
–7 PNT Phoenix Standard Time
–7 MST Mountain Standard Time
–6 CST Central Standard Time
–5 EST Eastern Standard Time
–5 IET Indiana Eastern Time
–4 PRT Puerto Rico & U.S. Virgin Islands Time
–3.5 CNT Canada Newfoundland Time
Time Zone ID Time Zone Name
–3 AGT Argentina Standard Time
–3 BET Brazil Eastern Time
–1 CAT Central African Time
0 GMT Greenwich Mean Time
+1 ECT European Central Time
+1 EET Eastern European Time
+2 ART Arabic (Egypt) Standard Time
+3 EAT Eastern African Time
+3.5 MET Middle East Time
+4 NET Near East Time
+5 PLT Pakistan Lahore Time
+5.5 ISLT India Standard Time
+6 BST Bangladesh Standard Time
+7 VST Vietnam Standard Time
+8 CTT China Taiwan Time
+9 JST Japan Standard Time
+9.5 ACT Australia Central Time
+10 AET Australia Eastern Time
+1 1 SST Solomon Standard Time
+12 NST New Zealand Standard Time
5-6
May 1999
7800-A2-GB28-80
Page 69

SLM Report Filters
Creating Service Level Management Reports
The report filter data feature is available for all report type from the report setup
pages. A report type must be selected before the filter criteria can be created.
The filters available are based on the report type selected.
The Operator column uses one of three operator types based on the type of
column or expression entered for the Left Operand:
H Logical: And, Or
H Numeric: Equals, Not Equal, Greater Than. etc.
H String: Match, MatchAdvanced, etc.
To be valid, the Right Operand type needs to correspond with the Operator type.
Note that the string NA can be used with the Numeric Operator to filter out report
rows containing NA. For example:
Select Left Operand
PVC Name (Use a column heading to sort on) NotEqual NA
The filter example above would find all NA entries in the PVC Name column and
the report would exclude all rows with NA.
Operator Enter
" Procedure
To create a new Filter:
1. Select a Report Type from any Report Setup page and select the New Filter
button. Enter a filter name.
In the example, PVC Tx Activity (by % CIR) Detail is selected and given the
Filter Name multi2.
2. There is one Main Expression and 8 Sub Expressions.
— If only one expression is needed, complete just the Main Expression.
— If additional criteria are needed, complete the Sub Expressions.
Sub Expressions must be tied together using the ’And’ and ’Or’
Operators.
Complete the Main Expression by tying together the highest level
Sub Expressions. All Sub Expressions must be directly or indirectly tied
to the Main Expressions.
3. Once the expressions are completed, select the Verify button. The
expression will be displayed or indicate errors.
4. Select a Sort Column and/or Sort Order and select the Save Filter option.
Refer to online Help for further details.
7800-A2-GB28-80
May 1999
5-7
Page 70

Creating Service Level Management Reports
PERL5 regular expressions are provided using the MatchAdvanced Operator to
create your own filter expressions using syntax for PERL 5 expressions. Two
examples of PERL regular expressions:
Enter . . . And the MatchAdvanced filter will . . .
?NY? Match any string with the value NY (case-sensitive).
?NY?i Match any string with the value NY (any upper- or lowercase combination).
For additional PERL 5 expression details, refer to one of the following Web sites:
H http://www.oroinc.com/developers/docs/OROMatcher/Syntax.html#Perl5Expressions
H http://www.cpan.org/doc/manual/html/pod/perlre.html
H http://www.cpan.org/doc/manual/html/pod/perlop.html#Regexp_Quote_Like_Operator
5-8
May 1999
7800-A2-GB28-80
Page 71

Viewing SLM Reports
Customers (or the end users), interact with SLM Reports through a standard
Netscape or Microsoft Web browser. The following versions are recommended:
H Netscape Communicator 4.51 or higher
H Microsoft Internet Explorer 4.1
To enable customers to navigate through their SLM Reports, you must provide
them with the location of the Web site and their customer data, which includes
their Customer ID and assigned password.
NOTE:
To view SLM reports online, it is recommended that you maximize your
browser screen window.
Creating Service Level Management Reports
7800-A2-GB28-80
May 1999
5-9
Page 72

Creating Service Level Management Reports
SLM Report Example
The SLV Detail Monthly Report provides statistics on each PVC as shown below.
Detailed online Help is available with each report.
5-10
May 1999
7800-A2-GB28-80
Page 73

Diagnostic Tests
What are Diagnostic Tests?
Diagnostic Tests check the integrity and operation of FrameSaver network
devices, and to some extent, the network itself. Using Diagnostic Tests, you can
run loopback and pattern tests, as well as perform a Lamp Test, Connectivity
Test, check EIA Lead Status, and run physical link tests.
NOTE:
The Diagnostic Tests component requires Write access to a device. You set
this option when you add devices to the Device Display Area by using the Set
(Write) Community string. See
Chapter 2,
Using the Navigation Wizard
6
Populating the Device Display Area
, for information on adding devices.
in
For details regarding Diagnostic Tests, see online Help.
7800-A2-GB28-80
May 1999
6-1
Page 74

Diagnostic Tests
Accessing Diagnostic Tests
Diagnostic Tests can be accessed from within the Navigation Wizard or
OpenView as described in the following sections.
Accessing from the Navigation Wizard
The Navigation Wizard lists and displays all devices known to the Performance
Wizard. By selecting a device, physical interface, DLCI, or end-to-end connection
from the Navigation Wizard, you can perform various operations, including
starting Diagnostic Tests.
" Procedure
To access Diagnostic Tests from within the Navigation Wizard:
1. Select an object (where object is a device, physical interface, DLCI, or
end-to-end connection) from the Device Display Area.
2. Start Diagnostic Tests using any of the following methods:
— Click on the Tests button.
— Click on the Action menu and select Tests.
— Click on the right mouse button while positioned over an object, then
select Tests from the pop-up menu.
6-2
May 1999
7800-A2-GB28-80
Page 75

Diagnostic Tests
A Diagnostic Test window similar to the following is opened for the selected
device.
7800-A2-GB28-80
May 1999
6-3
Page 76

Diagnostic Tests
Accessing from OpenView
Diagnostic Tests can be accessed from the OpenView or NetView menus.
" Procedure
To access Diagnostic Tests from OpenView:
1. Select a device from an OpenView submap.
2. Click on the Performance menu and select Performance.
The Performance menu has a cascading submenu with the following options:
Navigation Wizard, Graphs, or Tests.
3. Click on Tests.
A Diagnostic Tests window is opened for the device you selected.
Obtaining Help
The online Help for the Diagnostic Tests dialog is divided into two topics.
Topic
Tasks From the Help menu, provides step-by-step instructions on most operations
Reference From the Help menu, lists and describes each component within this dialog.
Description
you can perform.
6-4
May 1999
7800-A2-GB28-80
Page 77

Messages
Error and Status Messages
The Messages Table provides suggestions on how to investigate problems with
your network.
If you receive one of the following status or error messages, perform the
recommended action listed in the following table. You may also see error
messages from other software packages, such as OpenView for Windows.
A
Messages Table (1 of 2)
Message
Missing Data
Problem Action
DLCIs reconfigured. Perform a Device Sync from
DSL card inserted or removed. Perform a Device Sync from
Link Personality reconfigured. Perform a Device Sync from
In Band Management Channel
is down.
Management Port in RS232
mode.
Paradyne device does not
support MIB.
Other vendor device does not
support MIB.
Navigation Wizard.
Navigation Wizard.
Navigation Wizard.
Some SNMP data is not valid
when link is down. No action
needed.
Some SNMP data not valid for
that configuration. No action
needed.
Contact your nearest sales or
service representative.
Contact device vendor’s sales or
service representative.
7800-A2-GB28-80
May 1999
A-1
Page 78

Messages
Messages Table (2 of 2)
Message ActionProblem
SNMP Error
Bad value
SNMP Error
Device timed out
SNMP Set is being rejected. Verify the entry is valid on the
device.
No answer from device.
Perform a Device Sync from
Navigation Wizard.
Possibilities include:
H Communication lost to
device.
H The read/write community
string on the device does not
match the read/write
community string that the
If necessary:
H Verify communication is
working with the device.
H Do a Device Sync from
Navigation Wizard using the
read/write community string on
the device.
NMS is using to do an SNMP
Set.
H SNMP is not enabled for this
device.
H SNMP IP authentication is
enabled but the NMS’s IP
address is not in the device’s
H Enable SNMP in the device’s
configuration.
H Add the NMS’s IP address to
the devices list of allowable
NMS IP addresses.
list of allowable IP addresses.
H SNMP IP authentication is
enabled and the NMS’s IP
address is in the device’s list
H Change the NMS’s IP address
to read/write in the device’s
configuration.
as read only access.
H SNMP agent on the device is
H Contact device’s vendor.
defective.
SNMP Error
General error
SNMP Error
PDU too big
SNMP Error
Read only
Unknown error. Contact your nearest sales or
service representative.
The maximum PDU size has
been exceeded for that device.
Locate the Preferences.dat
or Preferences.def file in
Change:
H pdn.snmp.maxOidsPerPdu=
40 to 30 or another number
less than 40.
the Performance Wizard
database/config subdirectory:
H PerfWiz→database→config
The device does not support
write access to that SNMP item.
Verify that the device has the
latest firmware. If firmware is
current, contact device vendor.
A-2
7800-A2-GB28-80May 1999
Page 79

Glossary
AIX
BECN
BES
CIR
community name
CRC6
CSS
daemon
DDS
DE
IBM-UNIX operating system.
Backward Explicit Congestion Notification. A bit set and forwarded by the network to notify
users of data traffic congestion, sent in the opposite direction of the frame carrying the
BECN indicator or bit. Outbound frames may encounter congestion and be dropped.
Bursty Error Seconds. A second in which more than one but less than 320 CRC6 error
events have occurred.
Committed Information Rate. Less than or equal to the access rate, the CIR is used by the
service provider for rate enforcement when the network allocates bandwidth. When rates
exceed the CIR, frames may be discarded.
An identification used by an SNMP manager to grant an SNMP server access rights to a
MIB.
Cyclic Redundancy Check. A mathematical method of confirming the integrity of received
digital data using six check bits.
Controlled Slip Seconds. A period in which a frame was added or deleted because of a
variance in timing.
An agent program that runs continuously on a server system and provides resources to
client systems on the network.
Digital Data Service, such as DATAPHONE Digital Service or ACCUNET Spectrum of
Digital Services, that provides private digital communication circuits.
Discard Eligible. Part of the frame header that marks a frame for low priority if there is
congestion on the network. If congestion occurs, DE frames are the first to be discarded by
the network.
DLCI
DS1
DSL
DSLDSLAM
E1
Enterprise MIB
errored second
FCS
Data Link Connection Identifier. The virtual circuit number corresponding to a particular
connection between two destinations. This number is used as part of the frame relay
header. The total number of DLCIs between endpoints make up the PVC. DLCIs are a
local means of identifying a PVC.
Digital Signal level 1 (one). A digital signal transmitted at the rate of 1.544 Mbps in
North America.
Digital Subscriber Line. The non-loaded, local-loop copper connection between the
customer and the first node within the network.
Digital Subscriber Line Access Multiplexer. A platform for DSL modems that provides
high-speed data transmission with POTS over traditional twisted-pair wiring.
A wideband digital interface operating at 2.048 Mbps, defined by ITU recommendations
G.703 and G.704. It is used primarily outside of North America.
MIB objects unique to a specific company’s devices.
A performance measurement reported during a Digital Test or Transmit Test Pattern that is
defined as a second in which at least one error has been detected.
Frame Check Sequence. A value calculated at the sending and receiving end of a
connection to determine if error have occurred in transmission of a frame.
7800-A2-GB28-80
May 1999
GL-1
Page 80

Glossary
FEC
FECN
frame
frame relay
FTP
G.703
G.704
Get (SNMP)
host
Internet
IPIP
Forward Error Correction. A method of error control for data transmission where the
receiving device can detect and correct a character or block of code containing a
predetermined number of erroneous bits.
Forward Explicit Congestion Notification. A bit set and forwarded by the network to notify
users of data traffic congestion, sent in the same direction of the frame carrying the BECN
indicator or bit. Inbound frames may encounter congestion and be dropped.
One identifiable group of data bits that includes a sequence of bits for control and
identification information.
A high-speed connection-oriented packet switching WAN protocol using variable-length
frames.
File Transfer Protocol. A TCP/IP standard protocol that allows a user on one host to
access and transfer files to and from another host over a network, provided that the client
supplies a login identifier and password to the server.
An ITU recommendation for the physical and logical characteristics of hierarchical digital
devices.
An ITU recommendation for synchronous frame structures.
A command providing read-only access to SNMP MIB objects.
A computer attached to a network that shares its information and devices with the rest of
the network.
The worldwide internetwork, which predominantly uses the TCP/IP protocol.
Internet Protocol. An open networking protocol used for internet packet delivery .
ITU
JDK
JRE
LAN
link
LMI
MAC
MCC
M/HDSL
MIB
MIB II
M/SDSL
International Telecommunications Union. The telecommunications agency of the United
Nations, established to provide standardized communications procedures and practices.
Java Development Kit.
Java Runtime Environment.
Local Area Network. A privately owned and administered data communications network
limited to a small geographic area.
The physical connection between one location and another used for data transmission.
Local Management Interface. The standard set of procedures and messages that manage
a PVC linking two DTEs. It is a common standard for link-management signaling
(information exchange).
Media Access Control. The lower of the two sublayers of the data link layer, the MAC
sublayer controls access to shared media.
Management Communications Controller. The DSLAM circuit card used to configure and
monitor the DSLAM.
Multirate High-bit-rate Digital Subscriber Line. (See HDSL.)
Management Information Base. A database of managed objects used by SNMP to provide
network management information and device control.
MIB Release 2. The current Internet-standard MIB, defined by RFC 1213.
Multirate Symmetric Digital Subscriber Line. (See SDSL.)
MVL
Multiple Virtual Lines. A proprietary local loop access technology that permits several
services to concurrently and discretely use a single copper wire loop.
GL-2
May 1999
7800-A2-GB28-80
Page 81

Glossary
NMS
NNI
node
OOF
OOS
PDU
polling
PPP
PVC
RADSL
router
routing table
SES
Network Management System. A computer system used for monitoring and controlling
network devices.
Network-to-Network Interface. The point of connection of two frame relay networks.
A connection or switching point on the network.
Out of Frame. An error condition in which frame synchronization bits are in error.
Out of Service. A digital network trouble signal reported by the remote unit.
Protocol Data Unit. A message containing protocol-specific information.
The continuous process by which NMS solicits network information.
Point-to-Point Protocol. A protocol for packet transmission over serial links, specified by
Internet RFC 1661.
Permanent Virtual Circuit. A connection established administratively and used to support
A TM, frame relay, and X.25.
Rate Adaptive Digital Subscriber Line. A technique for the use of an existing twisted-pair
line that permits simultaneous POTS and high-speed data communication at adaptive
symmetric and asymmetric rates.
A device that connects LANs by dynamically routing data according to destination and
available routes.
A table used by a node to route traffic to another node in the multiplexer network.
Severely Errored Seconds. Usually defined as a second during which a specific number of
CRC errors was exceeded, or an OOF or other critical error occurred.
Set (SNMP)
SLV
SNMP
submap
subnet
subnet mask
T1
TCP/IP
Telnet
TFTP
A command providing write access to SNMP MIB objects.
Service Level Verifier. A feature that monitors and ensures frame relay network service.
Simple Network Management Protocol. Protocol for open networking management.
A display of connection of devices. A submap may be developed by the HP OpenView
using the autodiscovery feature, or it may be created by the user.
A portion of a network, which may be a physically independent network segment, that
shares a network address with other portions of the network and is distinguished by a
subnet number. A subnet is to a network what a network is to an internet.
A number that identifies the subnet portion of a network address. The subnet mask is a
32-bit Internet address written in dotted-decimal notation with all 1s in the network and
subnet portions of the address.
A term for a digital carrier facility used to transmit a DS1 formatted digital signal at
1.544 Mbps. It is used primarily in North America.
Transmission Control Protocol/Internet Protocol. The dominant protocol suite in the
worldwide Internet, TCP allows a process on one machine to send data to a process on
another machine using the IP. TCP can be used as a full-duplex or one-way simplex
connection.
Virtual terminal protocol in the Internet suite of protocols. Allows the user of one host
computer to log into a remote host computer and interact as a normal terminal user.
Trivial File T ransfer Protocol. A standard TCP/IP protocol that allows simple file transfer to
and from a remote system without directory or file listing. TFTP is user where FTP is not
available.
7800-A2-GB28-80
May 1999
GL-3
Page 82

Glossary
trap (SNMP)
VGA
VLAN
WAN
A notification message to the SNMP manager when an unusual event occurs on a network
device, such as a reinitialization.
Video Graphics Adapter .
Virtual Local Area Network. A logical grouping of users regardless of their physical location
on a network.
Wide Area Network. A network that spans a large geographic area.
GL-4
May 1999
7800-A2-GB28-80
Page 83

Index
A
Action menu, Launch Graph, 2-20
administration of SLM Reports, 5-2
administration of SL V reports
creating customer profile, 5-3
creating report filters, 5-7
data export, 5-5
enabling data collection, 5-4
saving polling data, 5-4
scheduling, 5-5
Apache Web Server
setting up for SLM Reports, 1-18
UNIX installation, 1-10
User History Poller daemon, 1-18
verifying setup, 1-19
Windows installation, 1-7
application, starting Performance Wizard, 1-13
B
bar drop-down menu, 3-6, 4-3
burst, setting counting ranges, 2-1 1
C
configure device, frame size and burst ranges, 2-1 1
connection, edit, 2-10
customer profile, creating for SLM Reports, 5-3
D
Daily Details, historical data, 2-19
data collection, enabling for SLM Reports, 5-4
data export, for SLM reports, 5-5
default paths, during installation, 1-5
Delete Device option, removing devices, 2-8
device configuration
frame and burst ranges, 2-1 1
updating, 2-6
device database
populating, 2-4
removing entries, 2-8
Device Display Area
adding devices, 2-4
deleting devices, 2-8
locating devices, 2-8
Device Sync, updating device database, 2-6
device timeout, A-1
devices
enabling and disabling polling, 3-5
locating in Device Display Area, 2-8
managing PVC connections, 2-9
removing from display , 2-8
selecting for an operation, 2-5
setting frame and burst ranges, 2-9
Diagnostic Tests
accessing from Navigation Wizard, 2-1, 6-2
description of, 6-1
obtaining online Help, 6-4
setting device community string, 2-21
starting from Navigation Wizard, 2-21
dialog boxes
Configure Device, 2-1 1
Device Sync, 2-6, 2-14
Edit Connection, 2-9
Edit Preferences, 2-14
Find, 2-8
New Device, 2-4
Performance, 2-14
Print, 3-7, 4-4
Update License Key , 1-16
Wizard Query, 2-8
disk space requirements, 1-3
DLCIs
frame size and burst ranges, 2-1 1
selecting for real time charts, 3-1
7800-A2-GB28-80 May 1999
IN-1
Page 84

Index
E
Edit Connection dialog, 2-9
edit Preferences, 2-14
end-to-end connections, modifying graph displays, 3-8
error messages, A-1
errors, during historical collections, 2-6
F
features, new in current version, 1-2
filters, for SLM reports, 5-7
Find dialog box, 2-8
frame size, setting the ranges, 2-1 1
FrameSaver devices
managing PVC connections, 2-9
running Diagnostic Tests, 2-21
setting frame and burst ranges, 2-9
FrameSaver SL V devices
discovering, 5-1
enabling for SLM data collection, 5-4
NNI PVC display, 3-8
User History Poller daemon, 1-18
using with SLM Reports, 2-21
G
graph formats, 4-3
definitions of, 3-6
graph point, obtaining exact timestamp and value, 3-6,
4-3
See
graphs.
real time reports
H
hardware requirements, 1-3
historical charts, obtaining help, 4-4
historical reports, 4-1
accessing, 2-1
launching, 2-19
printing to file or printer, 4-4
querying a graph point, 4-3
zooming into a graph portion, 4-4
HP OpenView
accessing Diagnostic Tests, 6-4
integrating with Performance Wizard, 1-5
starting Performance Wizard, 1-13
I
installation procedures, 1-5
installation troubleshooting
of Apache Web Server , 1-19
of Performance Wizard, 1-15
IP address, specifying for a device, 2-5, 2-6
J
Java Runtime Environment.
JRE, verifying installation of, 1-4
See
JRE
L
Launch Graph dialog, 2-20
license key, 1-16
M
messages, error and status, A-1
missing data message, A-1
N
Navigation Wizard, 2-1
accessing Diagnostic Tests, 2-1, 6-2
accessing NetScout Manager, 2-22
adding devices, 2-4
components of, 2-2
deleting devices, 2-8
discovering devices for SLM Reports, 2-1
displaying a Real Time Chart, 2-13
displaying Historical Charts, 2-1
launching a Real Time Chart, 2-15
locating devices, 2-8
setting FrameSaver options, 2-9
starting Diagnostic Tests, 2-21
synchronizing devices, 2-6
updating the license key , 1-16
using for SLM Reports, 2-21
NetScout Manager, accessing from Navigation Wizard,
2-22
NetView
integrating with Performance Wizard, 1-5
starting Performance Wizard, 1-13
network devices
monitoring, 1-1
troubleshooting, A-1
New Device dialog, 2-4
NNI PVC display, FrameSaver SLV devices, 3-8
IN-2
May 1999
7800-A2-GB28-80
Page 85

Index
O
OpenLane features, 1-1
OpenView .
operating platforms
installing Performance Wizard, 1-5
JRE versions, 1-4
removing Performance Wizard, 1-17
supported, 1-3
See
HP OpenView
P
Performance dialog, 2-14
Performance Wizard Web site, 1-5
pie graphs, 3-6
platforms, supported, 1-3
polling
frequency , 2-16
setting default rate, 2-14
setting frequency , 2-14
user history for SLV reports, 5-4
Preferences option, setting default polling, 2-14
prerequisites, installation requirements, 1-2
Print dialog box, 3-7
product updates, obtaining from the WWW, 1-5
PVC Throughput displays, modifying, 3-8
R
Read Community string, specifying for a device, 2-5
real time charts, launching, 3-2
Real Time option, 2-16
real time polling rate, setting default, 2-14
real time reports, 3-1
displaying, 1-13, 3-6
displaying from Navigation Wizard, 2-13
obtaining Help, 3-8
printing, 3-7
querying a graph point, 3-6
selecting other report types, 3-7
setting a polling frequency , 2-14
specifying a graph format, 3-6
Start or Stop Poll button, 3-5
zooming into a graph portion, 3-7
removing Performance Wizard, 1-17
report types
button, 2-16
selecting from a real time report, 3-7
requirements
hardware and software, 1-3
using JRE, 1-4
RMON Manager, 2-22
S
scheduling, of SLM reports, 5-5
Service Level Management Reports.
Service Level Verification, SLM report, 5-1
SLM Reports
adding devices for operations, 2-21
creating a customer profile, 5-3
creating with filters, 5-7
data export, 5-5
discovering FrameSaver SLV devices, 2-1
enabling data collection, 5-4
scheduling, 5-5
setting up Apache Web Server , 1-18
types available, 5-1
using Web-based interface, 5-2
viewing through WWW, 5-9
SNMP errors, 2-6, A-1
standalone application, starting, 1-13
Start Poll button, 3-5
status messages, A-1
Stop Poll button, 3-5
Sync, device database, 2-6
See
SLM Reports
T
text input fields
Community, 2-5
Device Name, 2-5
time zone IDs, scheduling SLM reports, 5-5
timestamp, obtaining on a graph point, 3-6
trended historical report, 2-20
troubleshooting, A-1
installation of Performance Wizard, 1-15
U
Update License Key dialog, 1-16
User History Poller daemon, 1-18
user history polling, for SL V reports, 5-4
7800-A2-GB28-80 May 1999
IN-3
Page 86

Index
W
Web Server
setting up for SLM Reports, 1-18
verifying setup, 1-19
Web sites
accessing Performance Wizard, 1-5
for JRE environments, 1-4
Paradyne, vi
Weekly Averaged, historical data, 2-19
Wizard Query dialog, removing devices, 2-8
Z
zoom
resetting within a real time report, 3-7
within a historical report, 4-4
IN-4
May 1999
7800-A2-GB28-80
 Loading...