

Page 1

HOBOware® User’s Guide
Onset Computer Corporation
470 MacArthur Blvd.
Bourne, MA 02532
www.onsetcomp.com/support/contact
Mailing Address:
P.O. Box 3450
Pocasset, MA 02559-3450
Phone: 1-800-LOGGERS (1-800-564-4377) or 508-759-9500
Fax: 508-759-9100
Technical Support Hours: 8AM to 8PM ET, Monday through Friday
Customer Service Hours: 8AM to 5PM ET, Monday through Friday
© 2010–2018 Onset Computer Corporation. All rights reserved. Onset, HOBO, HOBOlink, HOBOware, HOBOmobile, BoxCar, and FlexSmart are trademarks or registered trademarks of Onset
Computer Corporation for its data logger products and configuration/interface software. Macintosh is a registered trademark of Apple, Inc. Microsoft and Windows are registered trademarks
of Microsoft Corporation. All other trademarks are the property of their respective companies.
12730-AA
Page 2

HOBOware User’s Guide
Chapter 1 An Overview of HOBOware ..................................................................................... 5
New HOBOware Features ....................................................................................................................................... 5
A Tour of the HOBOware Interface ...................................................................................................................... 10
Working in Secure Mode: 21 CFR Part 11 Compliance ......................................................................................... 12
Chapter 2 Working with HOBO Data Loggers ......................................................................... 14
Connecting Devices .............................................................................................................................................. 14
Launching Devices ................................................................................................................................................ 16
Launch Logger Window ........................................................................................................................................ 17
Launch Options for HOBO UX90 Series Loggers ................................................................................................... 18
Launch Options for HOBO UX100 Series Loggers and the HOBO 4-Channel Thermocouple Logger (UX120-
014M) ................................................................................................................................................................... 21
Launch Options for the HOBO 4-Channel Analog Logger (UX120-006M) ............................................................ 24
Launch Options for the HOBO 4-Channel Pulse Input Logger (UX120-017x) ...................................................... 27
Launch Options for the HOBO Plug Load Logger (UX120-018) ............................................................................. 30
Launch Options for the HOBO MX CO2 Logger (MX1102) .................................................................................... 32
Launch Options for Other U-Series Loggers ......................................................................................................... 35
Launch Options for the HOBO U30 and Other Station Loggers ............................................................................ 38
Multiple Logging Intervals .................................................................................................................................... 40
Fast Logging Intervals ........................................................................................................................................... 41
Setting a Default Action on Multiple U-Series Devices ......................................................................................... 41
Using Launch Utilities ........................................................................................................................................... 42
Filter Series at Launch .......................................................................................................................................... 42
Data Assistants Window (Scaling) ........................................................................................................................ 44
Configure Alarms .................................................................................................................................................. 44
Advanced Sensor Properties: Pulse Frequency and Lockout Time ....................................................................... 46
Advanced Sensor Properties: Calibration ............................................................................................................. 47
Advanced Sensor Properties: Occupancy ............................................................................................................. 49
Statistics: Maximum, Minimum, Average, and Standard Deviation ..................................................................... 49
Filtered Series vs. Statistics Logging ..................................................................................................................... 51
Burst Logging ........................................................................................................................................................ 52
Carbon Dioxide Sensor Settings ............................................................................................................................ 53
Checking Device Status ......................................................................................................................................... 55
The Status Window .............................................................................................................................................. 56
Stopping a Device ................................................................................................................................................. 58
Chapter 3 Reading Out, Plotting, and Analyzing Data ............................................................ 59
Reading Out Data ................................................................................................................................................. 59
Plotting Data ......................................................................................................................................................... 60
Opening Files ........................................................................................................................................................ 62
Opening Files from Unsupported Loggers ............................................................................................................ 63
Working with Plots ............................................................................................................................................... 64
Using the Arrow Tool ............................................................................................................................................ 65
Using the Crosshair Tool ....................................................................................................................................... 66
Zooming, Panning, and Smart Scaling Plots ......................................................................................................... 66
Copying Data Points and the Plot ......................................................................................................................... 68
Closing a Plot ........................................................................................................................................................ 68
1-800-LOGGERS 2 www.onsetcomp.com
Page 3

HOBOware User’s Guide
Viewing a Pie Chart ............................................................................................................................................... 68
Printing Plot Elements .......................................................................................................................................... 70
Chapter 4 Modifying a Plot .................................................................................................... 71
Setting Properties for Plot Elements .................................................................................................................... 71
Setting Axis Properties ......................................................................................................................................... 72
Setting Series Properties ...................................................................................................................................... 73
Setting Legend Properties .................................................................................................................................... 74
Setting Title Properties ......................................................................................................................................... 75
Setting View Properties ........................................................................................................................................ 75
Adding a Graph Label ........................................................................................................................................... 76
Selecting a Subset of the Plot (Subset Statistics Tool) .......................................................................................... 77
Moving a Series from Front to Back on the Plot ................................................................................................... 79
Filtering a Series ................................................................................................................................................... 79
Cropping a Series .................................................................................................................................................. 80
Hiding/Showing or Removing a Series from a Plot ............................................................................................... 80
Copying a Series to Another Plot .......................................................................................................................... 81
Merging Files ........................................................................................................................................................ 82
Converting Units ................................................................................................................................................... 83
Undoing and Redoing Plot Changes ..................................................................................................................... 84
Saving Project Files ............................................................................................................................................... 84
Using Data Assistants ........................................................................................................................................... 84
Linear Scaling Assistant ........................................................................................................................................ 86
Pulse Scaling Assistant .......................................................................................................................................... 88
Barometric Compensation Assistant .................................................................................................................... 89
Conductivity Assistant .......................................................................................................................................... 92
Dissolved Oxygen Assistant .................................................................................................................................. 95
Grains Per Pound Assistant ................................................................................................................................ 100
Growing Degree Days Assistant .......................................................................................................................... 101
kWh Assistant ..................................................................................................................................................... 103
Exporting Data .................................................................................................................................................... 104
Exporting Table Data .......................................................................................................................................... 105
Exporting Data in Classic (BoxCar Pro) Format ................................................................................................... 106
Exporting Details ................................................................................................................................................ 106
Formatting the Date/Time Column in Excel ....................................................................................................... 106
The Bulk Export Tool ........................................................................................................................................... 107
Importing Text Files ............................................................................................................................................ 109
Import Text Files Requirements ......................................................................................................................... 110
Chapter 5 Hardware Reference ............................................................................................ 114
Using the RX3000 Manager ................................................................................................................................ 114
Working with the HOBO U30 Station ................................................................................................................. 115
Controlling the Relay on the HOBO U30 Station ................................................................................................ 116
Setting Alarms on a HOBO U30 Station .............................................................................................................. 117
Configuring FlexSmart Modules/Analog Sensor Ports ....................................................................................... 118
Configuring Excitation Power ............................................................................................................................. 120
Setting Voltage Ranges and Scaling Parameters ................................................................................................ 121
Loading a Saved Configuration ........................................................................................................................... 122
Resetting a Module to the Default Configuration .............................................................................................. 122
Working with a Shuttle ....................................................................................................................................... 123
Offloading and Saving Shuttle Files .................................................................................................................... 124
The Shuttle Management Window .................................................................................................................... 125
Deleting Files from a Shuttle .............................................................................................................................. 126
Configuring Loggers with the E50B2 Power & Energy Meter ............................................................................. 127
1-800-LOGGERS 3 www.onsetcomp.com
Page 4

HOBOware User’s Guide
Checking Dates for the HOBO U26 Dissolved Oxygen Logger Sensor Cap ......................................................... 129
Using the Lab Calibration Tool with the HOBO U26 Dissolved Oxygen Logger .................................................. 130
Updating UX/MX Series Logger Firmware .......................................................................................................... 134
Fixing "Read Header Failed" Error ...................................................................................................................... 135
Chapter 6 HOBOnode Manager ........................................................................................... 136
A Tour of HOBOnode Manager .......................................................................................................................... 137
Viewing Real-Time Plots ..................................................................................................................................... 138
Determining Data Node Type ............................................................................................................................. 139
Changing Logging and Connection Intervals ...................................................................................................... 140
Setting up External Sensors ................................................................................................................................ 141
Configuring Scaling on a Sensor ......................................................................................................................... 142
Wattnode Scaling Factors: T-WNB-3Y-208/T-WNB-3D-240/ T-WNB-3D-480 .................................................... 143
Veris Scaling Factors: T-VER-8051-300/T-VER-8053-800.................................................................................... 145
Veris Scaling Factors: T-VER-H970-200 ............................................................................................................... 146
Veris Scaling Factors: T-VER-971BP-200 ............................................................................................................. 147
Veris Scaling Factors: T-VER-PXU-L/T-VER-PXU-X ............................................................................................... 150
Ion Scaling Factors: ION-TVOC ............................................................................................................................ 154
Setting HOBOnode Manager Preferences .......................................................................................................... 155
Working with HOBOnode Manager Data ........................................................................................................... 158
Alarms ................................................................................................................................................................. 172
The Network Map ............................................................................................................................................... 181
Maintenance & Troubleshooting........................................................................................................................ 185
Troubleshooting ................................................................................................................................................. 195
Chapter 7 Reference ............................................................................................................ 197
Setting Preferences ............................................................................................................................................ 197
General Preferences ........................................................................................................................................... 198
Export Settings ................................................................................................................................................... 201
Communications Preferences ............................................................................................................................ 204
Plotting Preferences ........................................................................................................................................... 205
Data Assistant Preferences ................................................................................................................................. 209
Display Preferences ............................................................................................................................................ 209
Warnings Preferences ........................................................................................................................................ 211
Restoring Default Preferences ............................................................................................................................ 214
Menus ................................................................................................................................................................. 214
The Toolbar......................................................................................................................................................... 221
Tips for Working with Multiple Loggers ............................................................................................................. 223
Setting the Language/Format on Your Computer .............................................................................................. 225
Alarm & Readout Tool ........................................................................................................................................ 226
1-800-LOGGERS 4 www.onsetcomp.com
Page 5

HOBOware User’s Guide
Chapter 1
An Overview of HOBOware
HOBOware software is used for launching, reading out, and plotting data from HOBO® data loggers. With
HOBOware, you can also check logger status, filter and export data, save changes to graphs in project files, and
scale data with the Linear Scaling and Pulse Scaling data assistants. There are two versions of
HOBOware: HOBOware and HOBOware Pro. HOBOware Pro offers the following additional features:
• Support for Conductivity, Dissolved Oxygen, and Water Level loggers, which use HOBOware Pro Data
Assistants
• Support for HOBO U-Shuttle and Waterproof Shuttle
• HOBOnode Manager and support for wireless HOBO data nodes
• Launch and readout time-saving options
• Additional data assistants (Barometric Compensation, Conductivity, Dissolved Oxygen, Grains Per Pound,
Growing Degree Days, and kWh)
• Importing of text data
• Bulk Export Tool
• Pie charts for UX90 series loggers
• Additional plot preferences (font type, style, and color, and series and value axis rules)
• Subset statistics tool for graphing a subset of data
• Series cropping on plots
• 21 CFR Part 11 Compliance
To upgrade from HOBOware to HOBOware Pro, call 1-800-564-4377 and ask for Onset Customer Service. To check
for the latest version of HOBOware, select Check for Software Updates from the Help menu. Note: If you are using
HOBOnode Manager with a HOBO ZW wireless network, you must stop device communication before you can
upgrade HOBOware.
Note: HOBOware supports the following languages: English, Simplified Chinese, Traditional Chinese, French,
German, Japanese, Korean, Portuguese, and Spanish. The HOBOware user interface can display all of these
languages as configured by your computer (see Setting the Language/Format on Your Computer). HOBOware
documentation is available in English only.
Videos for using HOBOware and data loggers are available on YouTube (search for Onset data loggers) or go to
https://www.youtube.com/user/hobodataloggers/videos.
New HOBOware Features
The following features are available in HOBOware 3.7.16:
• Polish language support in the software user interface (Help and user guides are available in English
only).
• Support for UX100-011A and UX100-023A loggers.
• Several bug fixes.
1-800-LOGGERS 5 www.onsetcomp.com
Page 6

New Features in Previous Releases
HOBOware 3.7.15:
• Support for Java 10 on Macintosh (HOBOware works with Java 8, 9, and 10 on both Windows and
Mac).
• Several bug fixes.
HOBOware 3.7.14:
• HOBOware 3.7 The ability to import water pressure data in a text or CSV file.
• HOBOware now requires Java 8 or higher for both Windows and Macintosh.
• HOBOnode Manager and RX3000 Manager now work on Java 9.
• Several bug fixes.
HOBOware 3.7.13:
• Exporting to Excel files now uses .xlsx files instead of .xls. Date/time and data values are now also
stored as numeric data instead of text in exported Excel files.
• The ability to run the Barometric Compensation Assistant on a project file from the Edit menu.
• Several bug fixes.
HOBOware User’s Guide
HOBOware 3.7.11:
• Support for Traditional Chinese and Korean languages in the software user interface (Help and user
guides are available in English only).
• A new preference for handling the warning message that may appear when setting up HOBO ZW data
node alarms with email server authentication.
• Several bug fixes.
HOBOware 3.7.9:
• The ability to filter series on monthly or weekly intervals. See Filter Series at Launch or Filtering Series
for details.
• A preference for usage tracking, allowing anonymous information to be shared with Onset Computer
Corporation for future HOBOware enhancements.
HOBOware 3.7.6:
• Simplified Chinese language support for the software user interface (Help and user guides are available
in English only).
• The ability to select a time zone offset when importing text files. Previously, the time zone used for
imported text files was the computer's time zone.
HOBOware 3.7.5:
• The ability to view the latest conditions for the RX3000 Remote Monitoring Station via the RX3000
Manager.
• Support for Windows 10.
HOBOware 3.7.3:
• Support for the new HOBO Temperature/RH/CO2 Logger (MX1102), including launch capability, pre-
launch filters, alarms, burst logging, statistics logging, and CO2 sensor calibration.
HOBOware 3.7.2:
• Support for Japanese in the software user interface; Help and user guides are available in English only.
1-800-LOGGERS 6 www.onsetcomp.com
Page 7

• HOBOware now requires Java 7 or higher (Java 1.7.0_17) for both Windows and Macintosh. Download
the latest Java Runtime Environment (JRE) at www.java.com.
• The ability to quickly hide and show a series from the plot by right-clicking the series in the Details
pane or by using the Edit menu or the right-click menu in the plot.
HOBOware 3.7.1:
• Introduction of HOBOware, formerly known as HOBOware Lite. See an Overview of HOBOware for
details on features in HOBOware and HOBOware Pro.
HOBOware 3.7:
• Support for the new HOBO Plug Load logger (UX120-018), including launch capability, pre-launch
filters, statistics logging, and the ability to stop and restart logging during a single deployment.
HOBOware 3.6:
• Support for the new HOBO 4-Channel Analog logger (UX120-006M), including launch capability, pre-
launch filters, alarms, burst logging, statistics logging (maximum, minimum, average, and standard
deviation), and the ability to stop and restart logging during a single deployment.
• A new preference for exporting the information in the Details Pane and series data from the Points
Table in the same file.
HOBOware 3.5:
HOBOware User’s Guide
• Support for the new HOBO 4-Channel Thermocouple logger (UX120-014M), including launch
capability, pre-launch filters, alarms, burst logging, statistics logging (maximum, minimum, average,
and standard deviation), and the ability to stop and restart logging during a single deployment.
• The ability to assign labels to sensors for all logger models in the Launch Logger window, a feature
previously only available for station loggers, such as the HOBO U30 and Micro Station.
• Enhancements to the export table data feature, including the ability to set the default order of
measurement types in the Export Settings preferences and to quickly reorder series in the Export
window by dragging them.
HOBOware 3.4.1:
• Device menu options specific to HOBO U30 Stations are now available through a new "Manage U30"
menu choice.
HOBOware 3.4:
• Support for the new HOBO UX100 series data loggers, including launch capability, pre-launch filters,
alarms, burst logging, statistics logging (maximum, minimum, average, and standard deviation), and
the ability to stop and restart logging during a single deployment.
• Pie charts for loggers with state series that you can view, print, and save as .png files for additional
analysis beyond line graphs. This is especially helpful for light and occupancy data from UX90-005x
and -006x loggers.
• A firmware upgrade tool that automatically detects when a new firmware file is available for UX90 and
UX100 series data loggers and walks you through the update process.
• Improvements to the process of exporting data points, including the ability to select individual series
or event types and to sort columns.
• A new preference for setting the logger launch description as the serial number so that you can easily
differentiate files when launching and reading out several loggers of the same type.
• The ability to shows gaps in series when merging datafiles or when plotting a UX100 logger that had
stopped and resumed logging.
1-800-LOGGERS 7 www.onsetcomp.com
Page 8

HOBOware User’s Guide
• Improved the Network Map feature in HOBOnode Manager. (This requires a ZW Receiver firmware
upgrade.)
• Support for the new Windows 8 operating system. The current list of supported operating systems is
Windows 8, Windows 7 (Pro, Ultimate, and Home Premium), and Windows XP (Pro and Home) on the
PC and OS X Versions 10.6.x, 10.7.x, and 10.8.x on Mac.
Note: The Alarm & Readout Tool is no longer installed with HOBOware as of version 3.4. It is no longer supported
as of version 3.5.
HOBOware 3.3.2:
• Support for the following languages and their associated formats in the software user interface:
Spanish (Spain), Portuguese (Portugal), and German (Germany); Help and user guides are available in
English only.
• Improved field calibration accuracy in the Conductivity Assistant.
HOBOware 3.3.1:
• Support for the new HOBO U26 Dissolved Oxygen logger, including launch and readout capability, a
Lab Calibration tool to calibrate the logger to 100% and/or 0% saturation, and a Dissolved Oxygen
Data Assistant that corrects for measurement drift from fouling and generates salinity-adjusted DO
concentration as well as percent saturation data.
• The ability to update firmware for receivers and data nodes in the HOBO ZW Wireless System, with
the option to update a single device at a time or multiple data nodes in a group.
• A data encoding preference added to the General preferences that controls whether data in
HOBOware is imported and exported based on UTF-8 or operating system standards.
• French language support for the software user interface (Help and user guides are available in English
only).
HOBOware 3.3:
• Support for the new HOBO UX90 series data loggers, including launch capability, advanced sensor
configuration, and pre-launch filters. The models supported with this release are the
State/Pulse/Event/Runtime logger (UX90-001x), Light On/Off logger (UX90-002x), Motor On/Off
logger (UX90-004x), and Occupancy/Light logger (UX90-005x/-006x).
HOBOware 3.2.2:
• Enhanced display preferences for sorting data series in the Status and Plot Setup windows.
• A utility for upgrading the HOBOnode Manager database to improve performance.
• Performance improvements for the HOBO data nodes data delivery feature.
• A change to the FTP option for the HOBO data nodes data delivery feature so that it uses passive
mode, which allows for better connections through firewalls.
• An update to the Conductivity Assistant, which includes refinements in the calculation of temperature
compensation and a new option for non-linear, sea water compensation based on PSS-78.
• A revision to the calculation for T-CDI-5200-10S and T-CDI-5400-20S sensors when used with U-Series
loggers ensuring data is displaying properly.
• Support for Java 7®.
HOBOware 3.2.1:
1-800-LOGGERS 8 www.onsetcomp.com
Page 9

• The integration of the Alarm & Readout Tool, which is now automatically installed and available for
use from the Tools menu. Note: This tool is no longer supported as of HOBOware 3.5.
• The ability for all non-administrator users to run HOBOware on Windows (administrator privileges are
required to install HOBOware, map and unmap file assocations, and load new Data Assistants).
• Compatibility with iMac® and MacBook® Pro and Intel® Core™ i5 and i7 processors.
• A revision to the calculation for the S-SMD Soil Moisture Sensor ensuring data is displaying accurately.
• The option to create new files or overwrite existing ones via FTP when using the data delivery feature
for HOBO Data Nodes. This allows you to automatically import wireless node CSV data into other
applications, such as Microsoft
HOBOware 3.2:
• A redesigned launch window for quick logger configuration and easy sensor setup.
• Faster processing times for opening large data files (512KB and up).
• The ability to configure filtered series when launching the logger, which automatically generates
custom series, such as average temperature per day, when you read out the logger and plot data.
• The ability to configure Pulse Scaling, Linear Scaling, and kWh Data Assistant series when launching
any logger with applicable external sensors
®
Excel®.
HOBOware User’s Guide
• Support for the new HOBO 4-Channel Pulse Input Data Logger (UX120-017x), including advanced
sensor configuration for setting maximum pulse frequency and lockout times as needed in raw pulse
and event channels.
• Support for the new E50B2 Power & Energy Meter (T-VER-E50B2), including single-step configuration
with the HOBO 4-Channel Pulse Input Data Logger (UX120-017x) and automatic calculation of
numerous additional data series for analysis.
• Support for the new HOBO Conductivity Logger (U24-002).
• The option to disable logging the battery channel by default on some loggers, which can extend
battery life and memory space.
Note: Loggers launched in HOBOware 3.2 or later with series created by the Pulse Scaling, Linear Scaling, and kWh
Data Assistants or with filtered series cannot be read out in earlier versions of HOBOware.
1-800-LOGGERS 9 www.onsetcomp.com
Page 10
HOBOware User’s Guide
A Tour of the HOBOware Interface
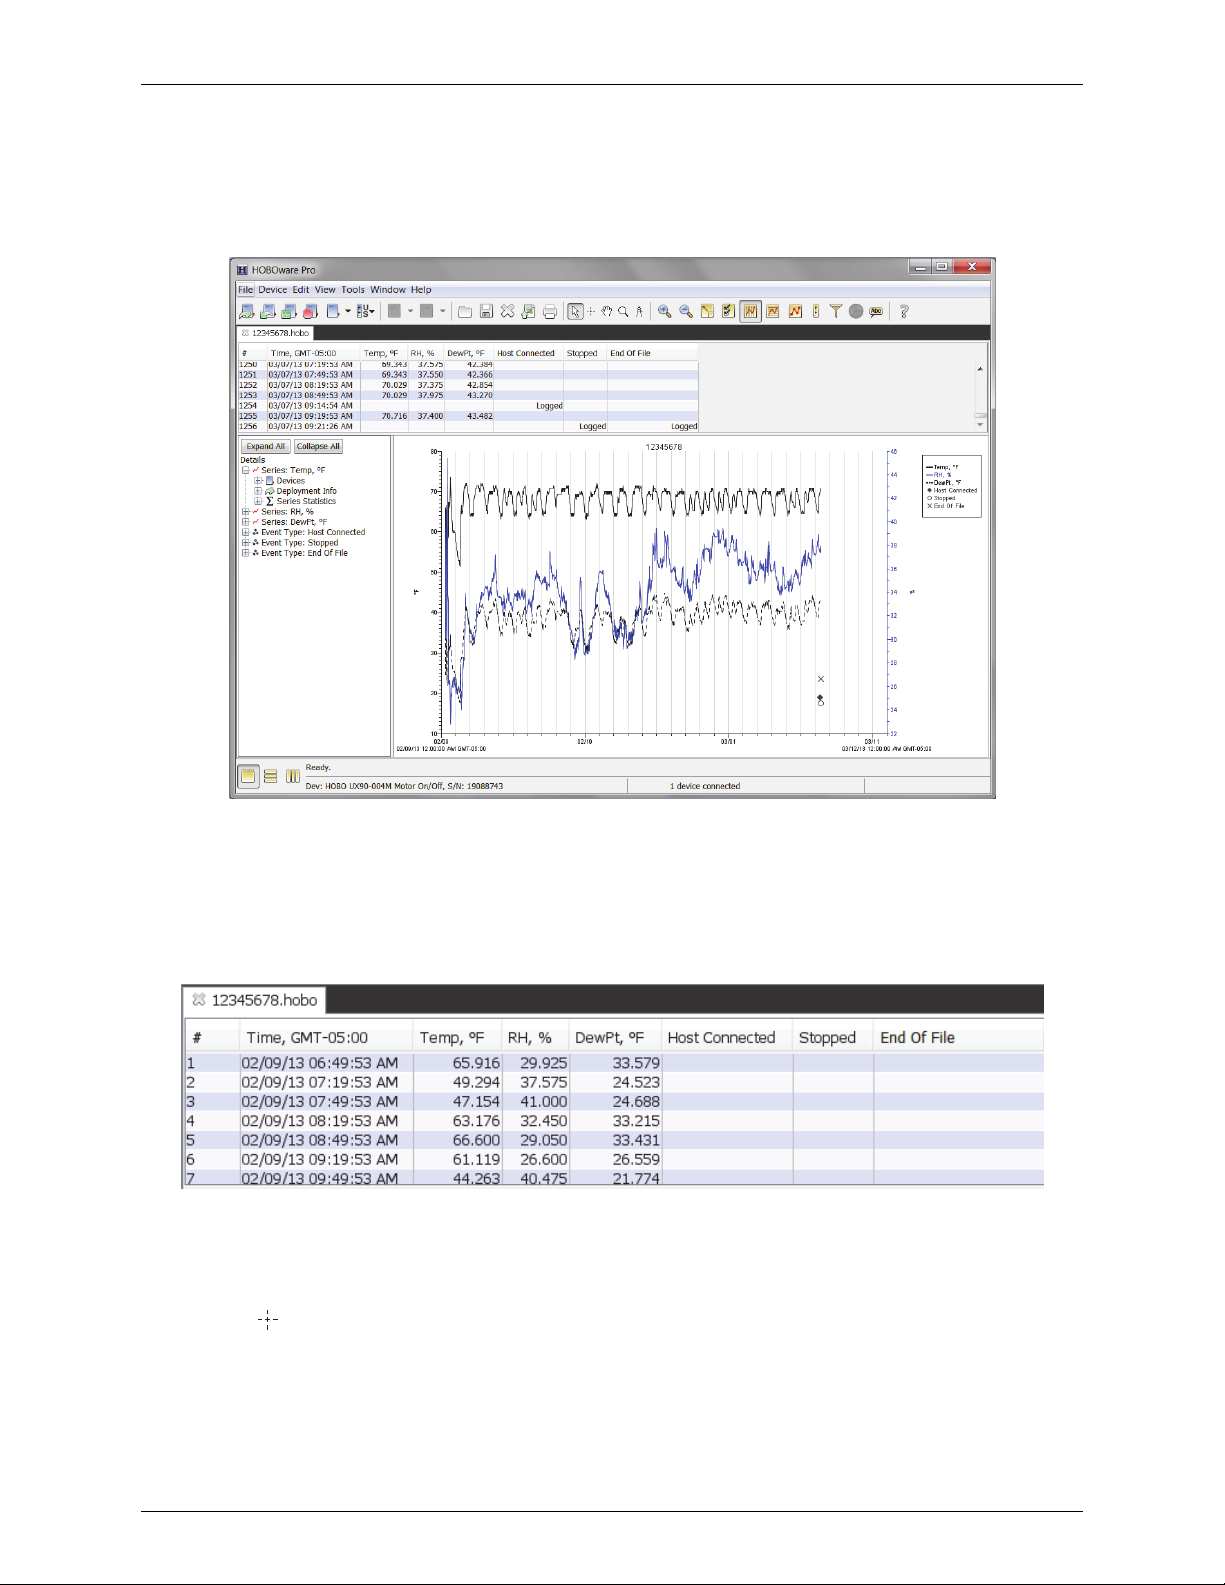
This is the main HOBOware window. Use the menu bar or tool bar to access all the features within HOBOware. The
status bar at the bottom of the window shows the current view in place (as selected by the Window menu) as well
as the device currently selected or connected, if any.
This example shows a file that has been opened and plotted. There are three components to a plotted datafile: the
Points Table, the Details Pane, and the Plot.
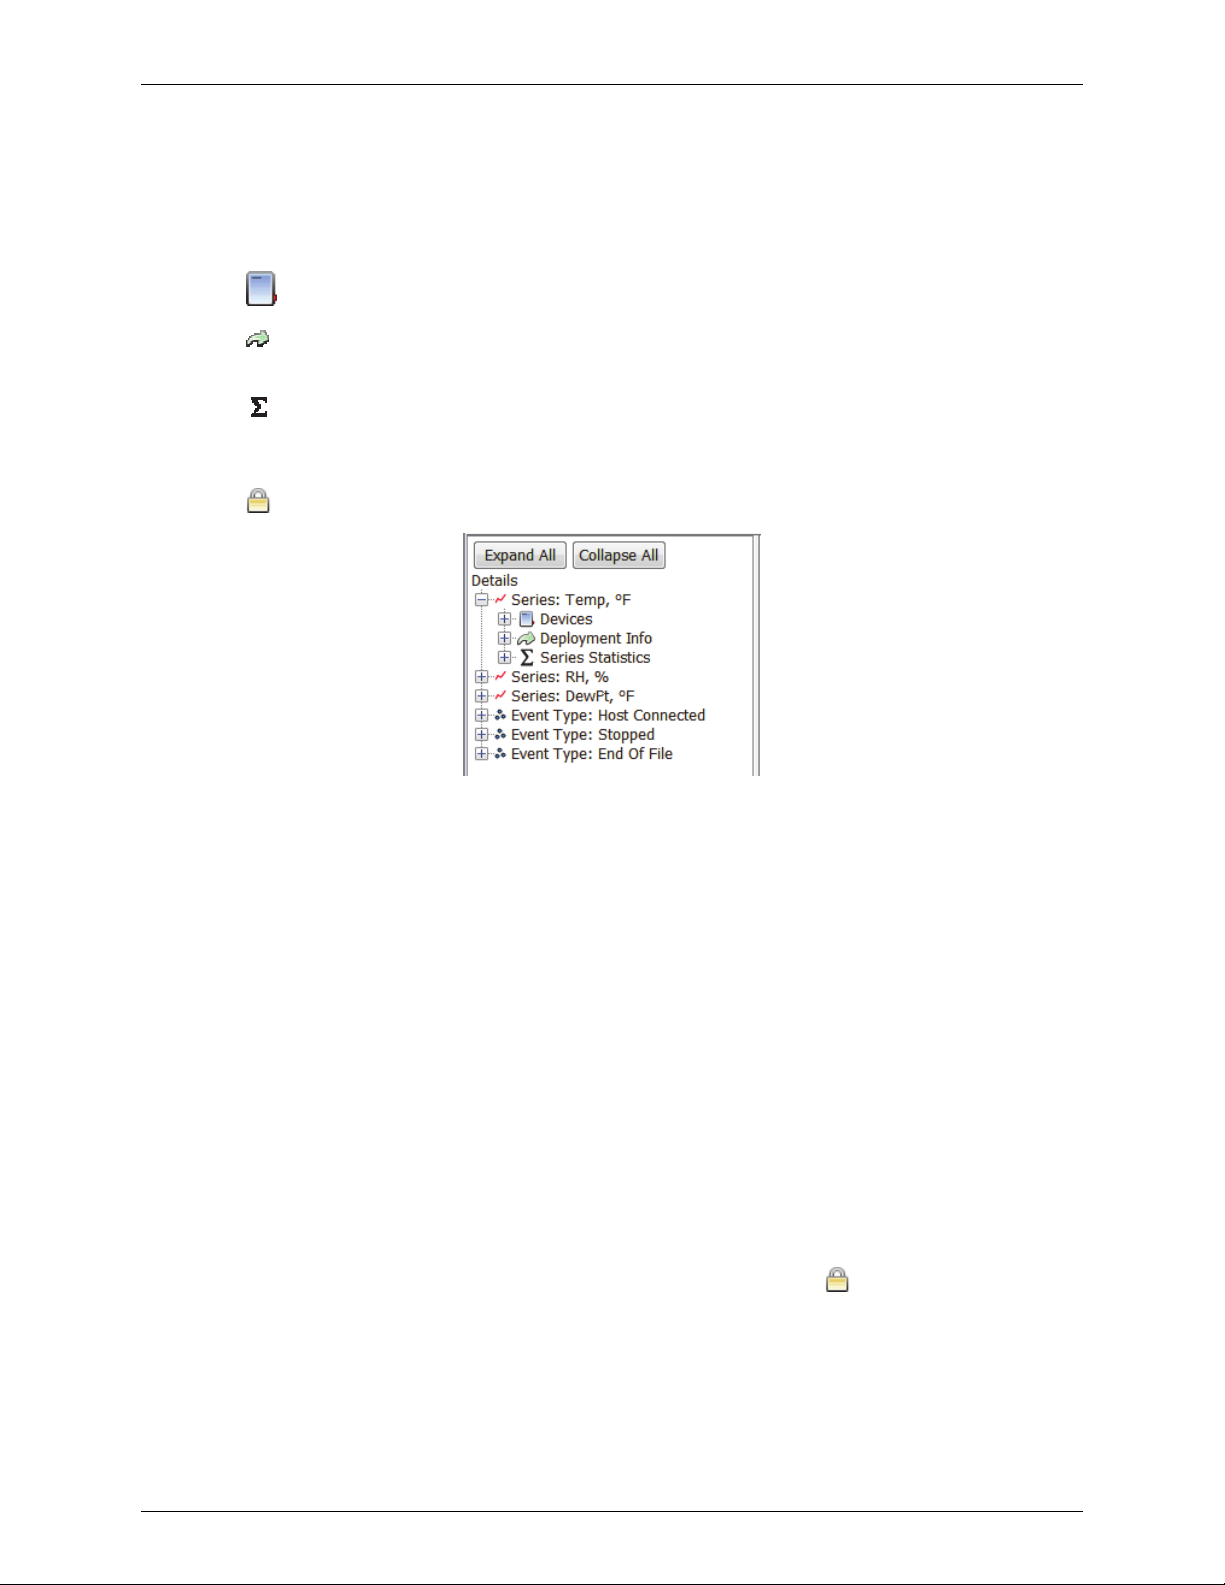
The Points Table
The Points Table is a list of data points, or values, and logged events displayed in the plot. The Points Table is linked
to the graph: only the data for the series and events on the plot are listed in the Points Table.
The data points are listed chronologically. Each point or event is listed in a single row and each series or event type
is displayed in a column. You can resize the columns by clicking and dragging the dividers between the column
headers.
Use the arrow keys or scroll bars to move up, down, left, and right in the Points Table. Additionally, as you click the
crosshair tool
event cell in the Points Table, the crosshair will appear on the graph at the time corresponding to that cell.
in the plot, the corresponding point is selected in the Points Table. Similarly, if you click a value or
To resize the pane, drag the divider between the Points Table and the plot. To hide the Points Table, select Points
Table from the View menu.
1-800-LOGGERS 10 www.onsetcomp.com
Page 11
HOBOware User’s Guide
If you do not want the Points table to be displayed by default when you plot data, open the Preferences, select
Plotting, and then Layout. Disable the "Show the points table when plotting data" checkbox.
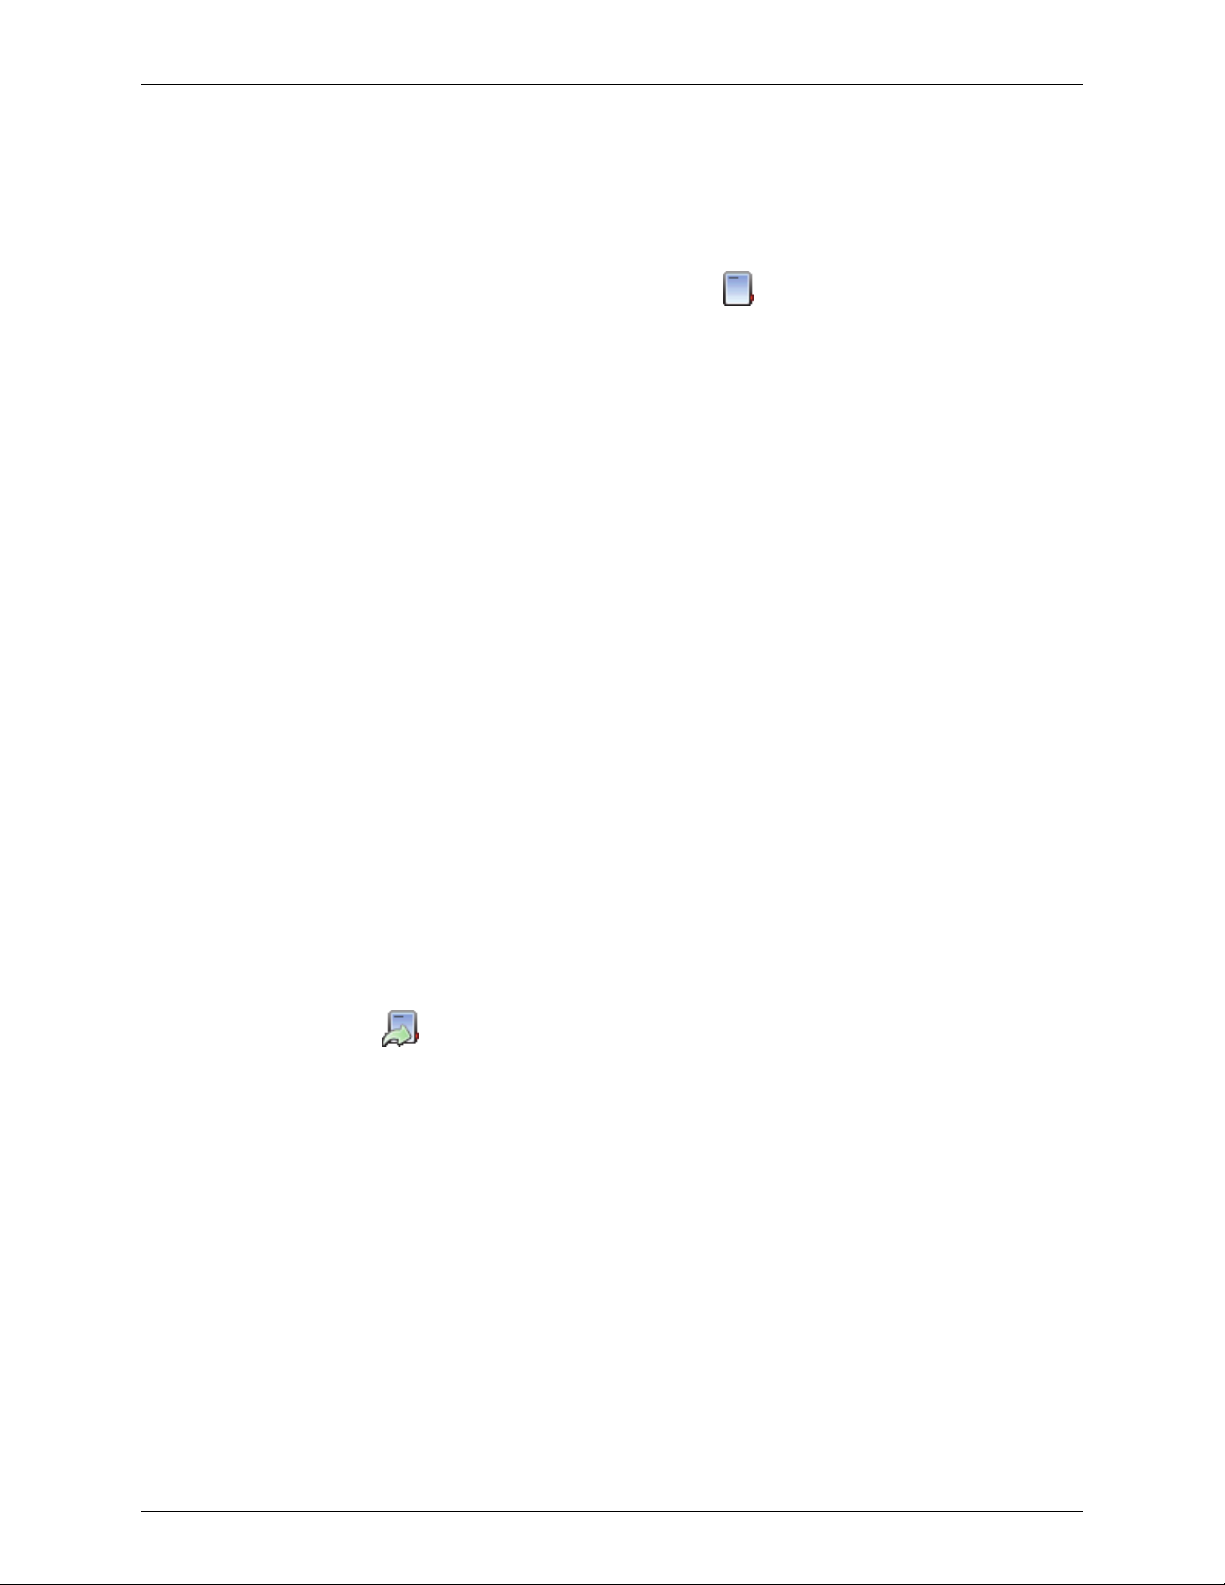
The Details Pane
The Details Pane shows information for each series and event displayed in the plot including:
• Information about the devices, such as model and serial numbers.
• Deployment information, such as the launch description, deployment number, start time and time
zone, logging interval, and battery voltage at launch.
• Series statistics, such as the total number of sensor samples and events, time of the first and last
sample, and the maximum, minimum, average, and standard deviation for each sensor series in the
plot.
• Audit trail information for secure files.
Click the + or - button to expand or collapse an entry in the Details Pane. Click the Expand All/Collapse All buttons
to expand or collapse the entire details tree.
Click a series node in the details tree to select the corresponding series on the graph and corresponding column in
the Points Table.
Right-click a series to hide it on the plot and in the Points table. The hidden series will be grayed out in the Details
Pane. Right-click a grayed out series to show that series or select Show All Hidden Series to show all series that
were previously hidden.
To resize the pane, drag the divider between the Details pane and the graph. To hide the Details Pane, select
Details Pane from the View menu.
If you do not want the Points table to be displayed by default when you plot data, open the Preferences, select
Plotting, and then Layout. Disable the "Show the details table when plotting data" checkbox.
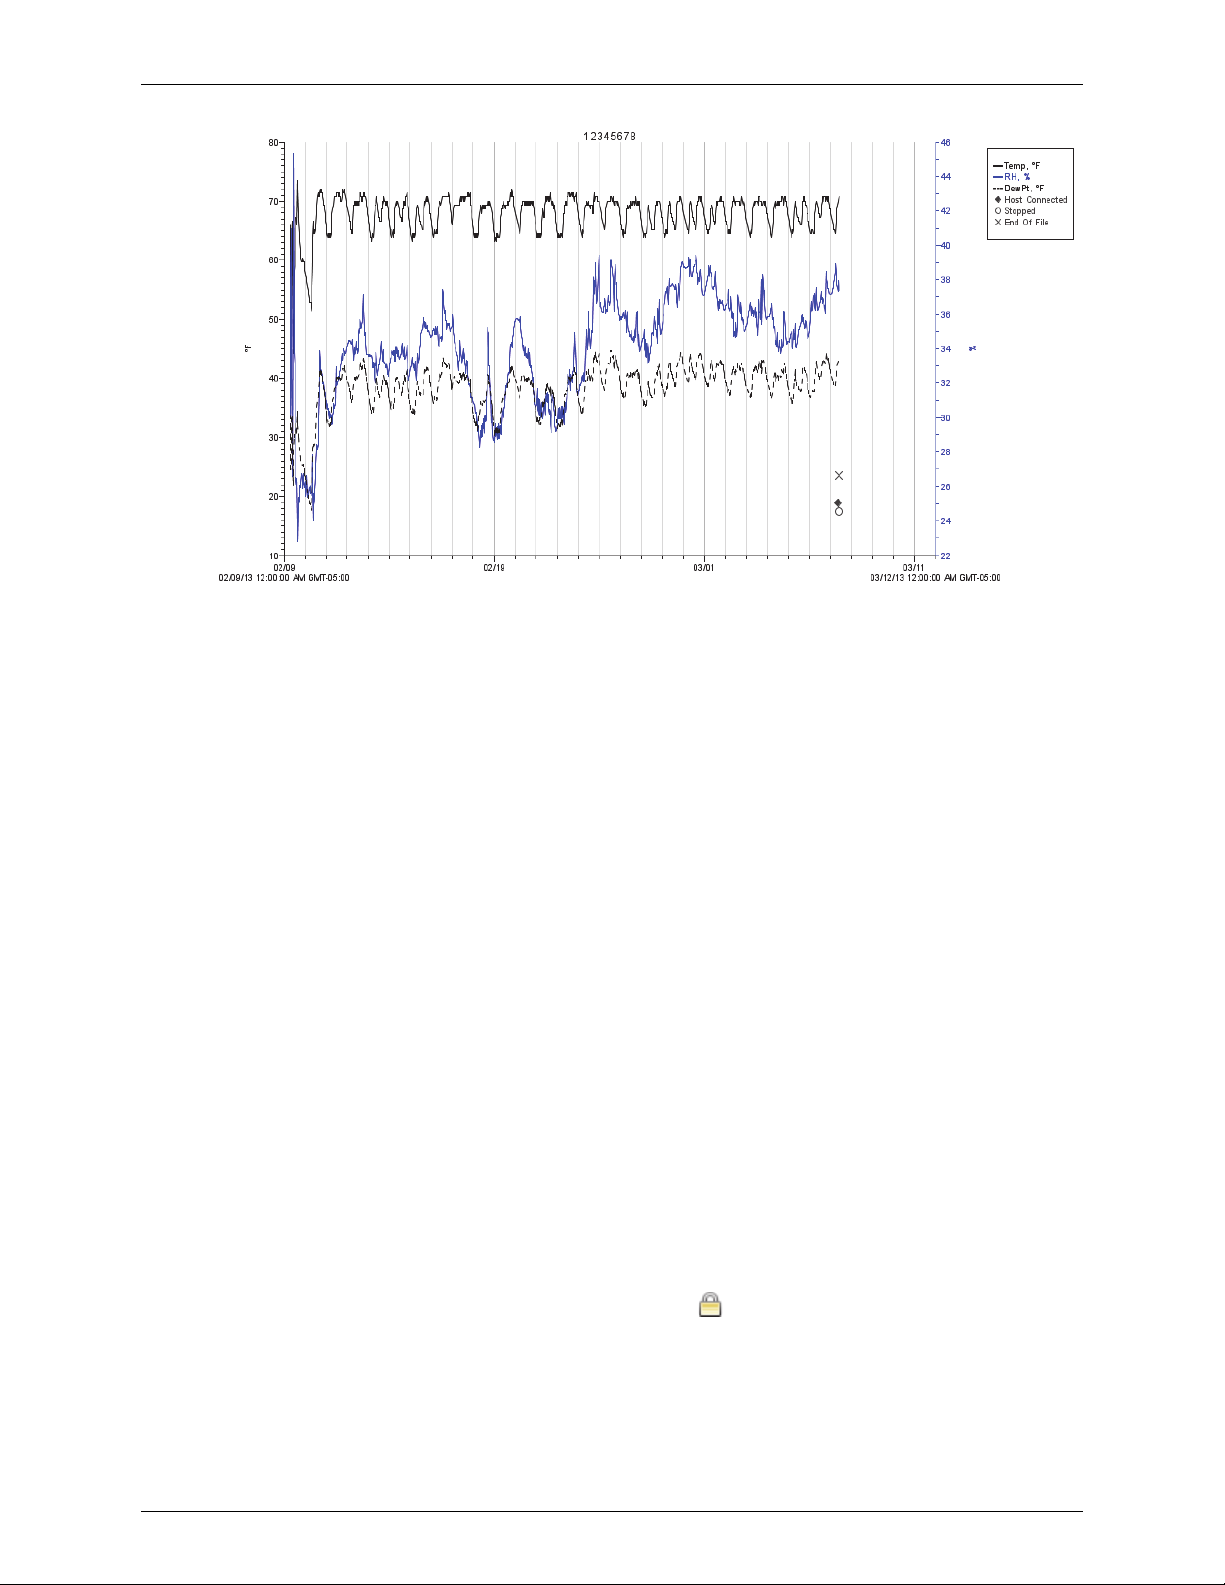
The Plot
The plot displays the data series and events in a graph. The plot has a time axis (x-axis) and a value axis (y-axis) for
each series selected in the Plot Setup window. The title, displayed at the top of the plot by default, is the
Description in the Plot Setup window. The legend, displayed to the right of the plot by default, lists the keys for
each series (line colors and marker types). If the crosshair tool is in use, it also lists the date, time and point values
currently selected by the crosshair. For secure files (.hsec and .dsec), a padlock icon
to the names of the series that were verified as original data.
appears in the legend next
1-800-LOGGERS 11 www.onsetcomp.com
Page 12
HOBOware User’s Guide
To show or hide the title or legend, use the View menu. Double-click a plot element (series, axis, title, or
legend) to change its properties or right-click the plot and select the item from the menu.
For more details on working with plot, see Reading Out, Plotting, and Analyzing Data.
Working in Secure Mode: 21 CFR Part 11 Compliance
You can create secure files in HOBOware Pro to comply with 21 CFR Part 11, or simply to add a level of security
when working with datafiles. When Secure Mode is enabled, HOBOware Pro begins an audit trail in the logger
when you launch it and adds an encoded digital signature to the new datafile when you read it out. A digitally
signed file, or "secure file," has a filename extension of .hsec (for most U-Series loggers) or .dsec (for station-type
loggers).
Notes:
• Issues may arise if you do not always use HOBOware Pro in the Secure Mode, if you sometimes use
HOBOware, or if you sometimes use a version of HOBOware prior to 2.3.0. The resulting file issues are
described later in this section.
• This feature is not available for use with HOBOnode Manager and its associated ZW series data node
files.
• Project (.hproj) and export files are not secure, even if you create them from secure files.
To enable secure mode:
1. From the File menu in Windows or the HOBOware menu in Mac, select Preferences
2. Select General and then select Data Verification.
3. Select the Enable Secure Mode checkbox.
4. Click OK. When Secure mode is enabled, a padlock icon
main HOBOware Pro window
1-800-LOGGERS 12 www.onsetcomp.com
appears in the lower right corner of the
Page 13

HOBOware User’s Guide
Opening a Secure File and Data Verification
Secure files can be opened with HOBOware Pro 2.3.0 or greater. You can open .hsec files only with HOBOware
2.3.0 or greater.
Every time you open a secure file – even when you are not in Secure mode – HOBOware verifies the encoded
digital signature to detect whether the file has been corrupted or tampered with. When a file is verified as secure,
the padlock icon
• Filtered series set up prior to launching or created after readout are not verified.
• Series that were created as a result of user input after readout, such as running a data assistant or
• Series retain their verification status (and padlock icon) when copied and pasted into other plots.
In the Details pane, audit trail information is displayed under the Data Verification node for each series. HOBOware
Pro automatically obtains the Launch User and Readout User names from your computer's operating system. To
save the Launch User name, you must have Secure Mode enabled when you launch the logger.
If the digital signature cannot be verified when you open a file and even a single bit of data has changed since
readout, a warning message will appear that verification has failed. This means that the file has been altered or
become corrupted since it was originally saved. You may still be able to plot the data from the file, but the padlock
icon will not display in the legend or there will be no signing information in the Details pane. You will still be able to
perform typical HOBOware functions on the file.
appears in the legend next to the series that were verified as original data.
entering a constant temperature value for pressure or humidity, are not verified.
File Compatibility
Depending on the type of logger, the version of HOBOware that launched the logger, and the version of
HOBOware that reads out the logger, the resulting datafile may not be compatible with versions of HOBOware
prior to 2.3.0 or you may not be able to read out the logger at all. The following files are created when launching
and reading out in these scenarios:
• Launching and reading out in non-secure mode with any version of HOBOware. A backward-
compatible datafile (.hobo or .dtf) is created.
• Launching in non-secure mode with any version of HOBOware and reading out in secure
mode.
A secure file (.hsec or .dsec) is created with an audit trail that lists the readout user, but not
the launch user. Secure files are not backward-compatible.
• Launching in secure mode and reading out in a pre-2.3 version of HOBOware. Most U-Series
loggers cannot be read out. A backward-compatible datafile (.dtf) is created for station loggers.
• Launching in secure mode and reading out in non-secure HOBOware 2.3. A datafile (.hobo) is
created for U-Series loggers, but it is not backward-compatible. A backward-compatible datafile
(.dtf) is created for station loggers.
• Launching and reading out in secure mode. A secure file (.hsec or .dsec) is created with a full
audit trail. Secure files are not backward-compatible.
1-800-LOGGERS 13 www.onsetcomp.com
Page 14

Chapter 2
Working with HOBO Data Loggers
Working with HOBO data loggers involves the following basic steps:
1. Connect the logger to the computer for the initial setup and launch.
2. Launch the logger. Enter or select the appropriate parameters for the logger deployment and then
launch, or start, the logger.
3. Check the status of the logger. You have the option of checking the current status of the logger and
any current readings while it is still connected to the computer. This can be helpful to verify that the
launch configuration is as expected.
4. Read out the logger. After deploying the logger, read out all recorded data and save it to a file. Many
devices also work with shuttles that allow you to keep the logger in the field, but still read out any
recorded data. You can then bring the shuttle back to the office, connect it to the computer, offload
and save the files.
HOBOware User’s Guide
5. Plot the data. After reading out the logger and saving the data, you can select and define the data
series you wish to plot in a graph. Data Assistants may be available for automatic scaling of certain
data when plotting.
6. Analyze the data and customize the plot. There are numerous tools available for working with the data
and changing the plot, such as exporting, filtering, merging files, cropping, and more.
7. Save changes to the plot as a project file. Changes to the axis, series, plot, and legend properties as
well as any filtering or merging can be saved as an .hproj file.
Connecting Devices
Most HOBO data loggers and shuttles connect to the computer with a USB cable. The HOBO Weather Station,
HOBO Micro Station, and HOBO Energy Logger connect to the computer with a serial cable (or to a USB port with a
Keyspan™ serial adapter).
Some loggers require an optic USB base station/coupler to connect to the computer. Consult the manual that
came with your device for specific information about required base stations/couplers or cables.
Once a device is properly connected to the computer as described below, the device name is listed in the status
bar at the bottom of the main HOBOware window.
Notes:
• For instructions on connecting HOBOware compatible shuttles or using the HOBO Waterproof shuttle
as a base station, refer to the shuttle's user guide.
• For details on working with HOBO ZW Wireless Data Nodes, see HOBOnode Manager.
• Windows only: If the device has never been connected to this computer before, it may take some time
for the computer to detect the new hardware and report that it has connected successfully. One or
more messages will appear, indicating that new hardware has been found. You may also hear a chime.
• Windows only: Your computer may tell you to reboot before you can use the device. It is not
necessary to reboot.
1-800-LOGGERS 14 www.onsetcomp.com
Page 15

HOBOware User’s Guide
Connecting a USB logger or Shuttle
To connect a logger or shuttle to HOBOware using a USB cable:
1. Open HOBOware.
2. Plug the large end of the USB interface cable into a USB port on the computer.
3. Plug the small end of the USB interface cable into the port on the device.
For instructions on connecting shuttles or using the HOBO Waterproof Shuttle as a base station, refer to the
shuttle’s user guide.
Connecting a Serial Device
To connect a device to a computer using a serial cable:
1. Open HOBOware.
2. Plug the 9-pin end of the serial interface cable into a serial port on the computer or Keyspan adapter.
3. Plug the other end of the serial interface cable into the communications port on the device. (Refer to
the diagram and instructions that came with the device if you need help finding the port.)
4. Click the Select Device icon
window. Click the button next to the device in the window, then click OK.
If you are using a serial port other than COM1 (PC) or Default (Macintosh), you will need to set up HOBOware to
use another port. To change the serial port:
1. From the File menu in Windows or the HOBOware menu in Macintosh, select Preferences.
2. Select Communications.
3. Select the serial port you want to use. Note that checking multiple serial ports can take some time,
even when no devices are attached.
4. Click OK.
on the toolbar to ensure that the device is listed in the Select Device
Connecting a Base Station/Coupler
To connect a logger to a base station/coupler:
1. Open HOBOware.
2. Plug the base station/coupler cable into a USB port on the computer.
base/station coupler is the correct model for the logger you want to use. Consult the manual that
came with the logger if you are not sure.
3. Attach the logger to the base station/coupler as described in the documentation that came with your
logger.
Important: Make sure the
Disconnecting a Device
To disconnect the device, simply unplug the USB or serial cable or unplug the device from the base
station/coupler.
To attach another logger via a base station/coupler, remove the logger, leaving the base station/coupler
connected and then connect the next logger.
1-800-LOGGERS 15 www.onsetcomp.com
Page 16
HOBOware User’s Guide
Connecting Multiple Devices
If your computer has multiple USB and serial ports, you can connect multiple devices and work with one at a time.
When multiple devices are connected, the Select Device window opens every time you select Launch, Readout,
Stop, or Status from the Device menu. Click the button next to a device on the list to select it, then click OK. The
selected action will then proceed. The status bar lists the number of devices connected.
To access the Select Device window at any time, click the Select Device
Device from the Device menu.
Click the Blink Device Light button in the Select Device window to verify that you have selected the appropriate
device. This briefly illuminates the light on the devices that you have selected. If the device does not have a light,
or if the light is not visible when the devices is in the base station/coupler, simply check the serial number (S/N) on
your devices to make sure that it matches the one that is selected in this window.
Notes:
icon on the toolbar, or choose Select
• If serial devices are selected in Preferences, it may take some time for HOBOware to scan all the serial
ports. You can select the device you want as soon as it is displayed. You do not have to wait for all of
the ports to be scanned.
• Serial devices that you have added or removed are not reflected in the device count until you click the
Select Device icon on the toolbar to update the device list.
• If you work with multiple U-Series devices frequently and are using HOBOware Pro, you can set the
Default Action in the Device menu to Launch and enable Launch Time-Saving Options to work more
efficiently.
Launching Devices
To set up a logger to record data, you must specify several parameters and launch, or start, the logger.
Tip: Check that the time on the computer is correct before configuring a launch. If it is not correct, close
HOBOware, update your computer's clock manually or synchronize it with an online time server (if available) and
then reopen HOBOware.
To launch a logger:
1. Connect the logger to the computer.
2. Click the Launch
3. Different messages may appear depending on the state of the logger. Answer each of the prompts
accordingly. A warning appears if the logger has already been launched. Click Yes to continue or click
No to cancel.
4. Select the options for the launch in the Launch Logger window.
5. Click the Start button when you are finished choosing the launch settings. Note that the text on the
Start button varies depending on when you chose logging to begin. HOBOware displays the progress
of the launch and warns you not to unplug the logger while it is being configured.
Once the logger begins logging, it will continue logging until the memory is full (if the logger is configured to stop
logging when the memory fills), it is stopped, or the battery runs out. Note: Any data stored in the logger from a
previous launch will be erased once the logger is relaunched.
icon on the toolbar, or select Launch from the Device menu.
1-800-LOGGERS 16 www.onsetcomp.com
Page 17

HOBOware User’s Guide
Launch Logger Window
Use the Launch Logger window to set up your logger to record data. The Launch Logger window is divided into the
following three panes:
• Logger Information. The model of the logger currently selected appears at the top of this pane,
which also includes the serial number, deployment number, and current battery level.
Use the Name field to type up to a 40-character name for the logger deployment. The name you enter
here will be used as the default file name when you read out the logger and save the data. It will also
be the default title on the plot. For new loggers, the name defaults to the logger serial number.
Click the Status button in this pane to see the current status of the logger and the settings used on the
previous launch.
A User Notes button may also appear for some loggers. Click it to enter more extensive notes about
the deployment.
• Sensors. This pane displays a list of the sensors available for the logger. Choose the sensors, or
channels, that you wish to log in this deployment, select any external sensors you may be using, and
type labels for sensors as desired. Note that labels may not be applied to some calculated or derived
channels, such as filtered series. This pane also displays any utilities available for your logger, such as
Alarms, Scaling, and Filters. For the HOBO Plug Load logger (UX120-018) logger, you also have the
option of configuring statistics for each channel in this pane.
• Deployment. Use this pane to select the logging interval (the rate at which you want the logger to
record data) and to choose when the logger should begin recording data. Loggers can be configured to
start logging immediately or on a specific date/time. Some loggers also can be configured to start at an
interval or start with push button/coupler start. The coupler start (also known as a triggered start)
involves removing the logger from its coupler or base station and then taking it to the deployment
location. When you are ready for logging to begin, insert the logger in the coupler without the base
station for three seconds. Refer to the logger manual for details.
This pane also displays the logging duration, which is the approximate time it will take to fill the logger memory
based on the logging interval, sensors, and other settings currently selected. For some loggers, you can also set a
sampling interval, choose when to stop logging, and select other options in this pane.
When you are done choosing the launch settings, click the button in the lower right-hand corner of the window to
send the settings to the logger. Note that the button text changes based on when you chose to start logging.
HOBOware Pro Tip: If you will be using the same launch settings for multiple deployments of the same logger type,
select the Skip Launch Window Next Time checkbox to bypass this window the next time you launch a device. This
will cause the next logger to be launched with either the previous launch settings or the current logger settings as
set in Launch Time-Saving Options subcategory of the General preferences.
The options available in the Logger Launch window vary depending on the type of logger you are using. For more
details about launching your particular device, refer to the following topics:
• Launch Options for HOBO UX90 Series Loggers
• Launch Options for the HOBO UX100 Series Loggers and the HOBO 4-Channel Thermocouple Logger
(UX120-014M)
• Launch Option for the HOBO 4-Channel Analog Logger (UX120-006M)
• Launch Options for the HOBO 4-Channel Pulse Input Logger (UX120-017x)
• Launch Options for the HOBO Plug Load Logger (UX120-018)
• Launch Options for the HOBO MX CO
Logger (MX1102)
2
• Launch Options for Other U-Series Loggers
1-800-LOGGERS 17 www.onsetcomp.com
Page 18
HOBOware User’s Guide
• Launch Options for the HOBO U30 and Other Station Loggers
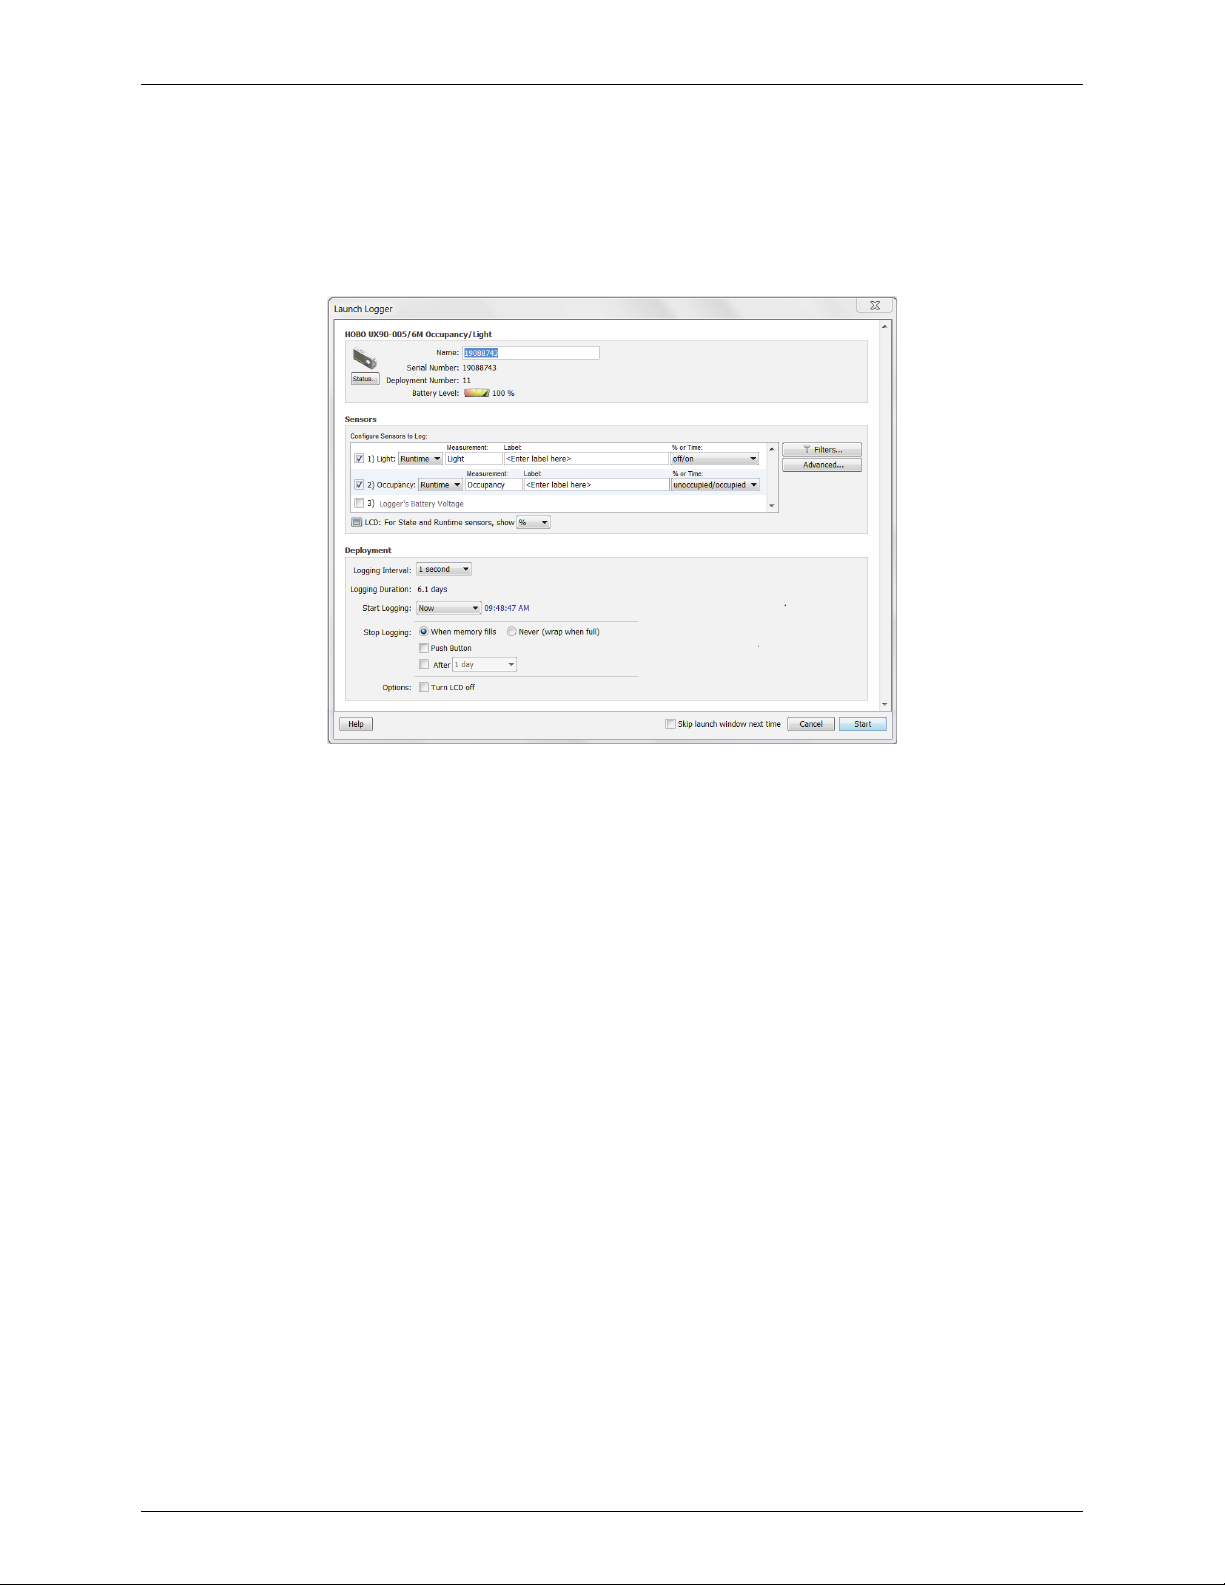
Launch Options for HOBO UX90 Series Loggers
The following launch options are available for HOBO UX90 series data loggers. Note that the Launch Logger
window may vary from the example shown below.
Logger Information
• Name.
Enter a name for the launch, up to 40 characters, in this field. This name is used as the default
file name when you read out and save the data recorded by the logger. It is also the default title of the
plot.
• Serial Number. This is the serial number for the logger. Note that some external sensors or devices
also have serial numbers, which are not listed here.
• Deployment Number. This is the number of times (including this time) the logger has been
launched. Each time you start a new launch, the deployment number increases by one.
• Battery Level. This shows the current battery level in the logger.
• Status. Click the Status button to check the logger settings from the previous launch.
Sensors
The Sensors List displays all internal and external sensors available for recording data. Choose the sensors, or
channels, that you wish to log in this deployment. To configure a sensor:
1. Select the sensor(s) you wish to log.
2. Choose the measurement to log (e.g. State, Runtime, etc.) from the drop-down list.
3. Type a label for the sensor, if desired.
4. Complete additional details for the sensor. This will vary depending on what the logger will be
measuring. For most sensors, type a name and select a description pair from the drop-down list. For
external Pulse channels, click the button for the corresponding channel in the sensor list to select the
sensor type as shown below. If you select Raw Pulse for the sensor type, you can use Data Assistants
to set up kWh (HOBOware Pro only) and pulse scaling information as necessary, which will also display
1-800-LOGGERS 18 www.onsetcomp.com
Page 19
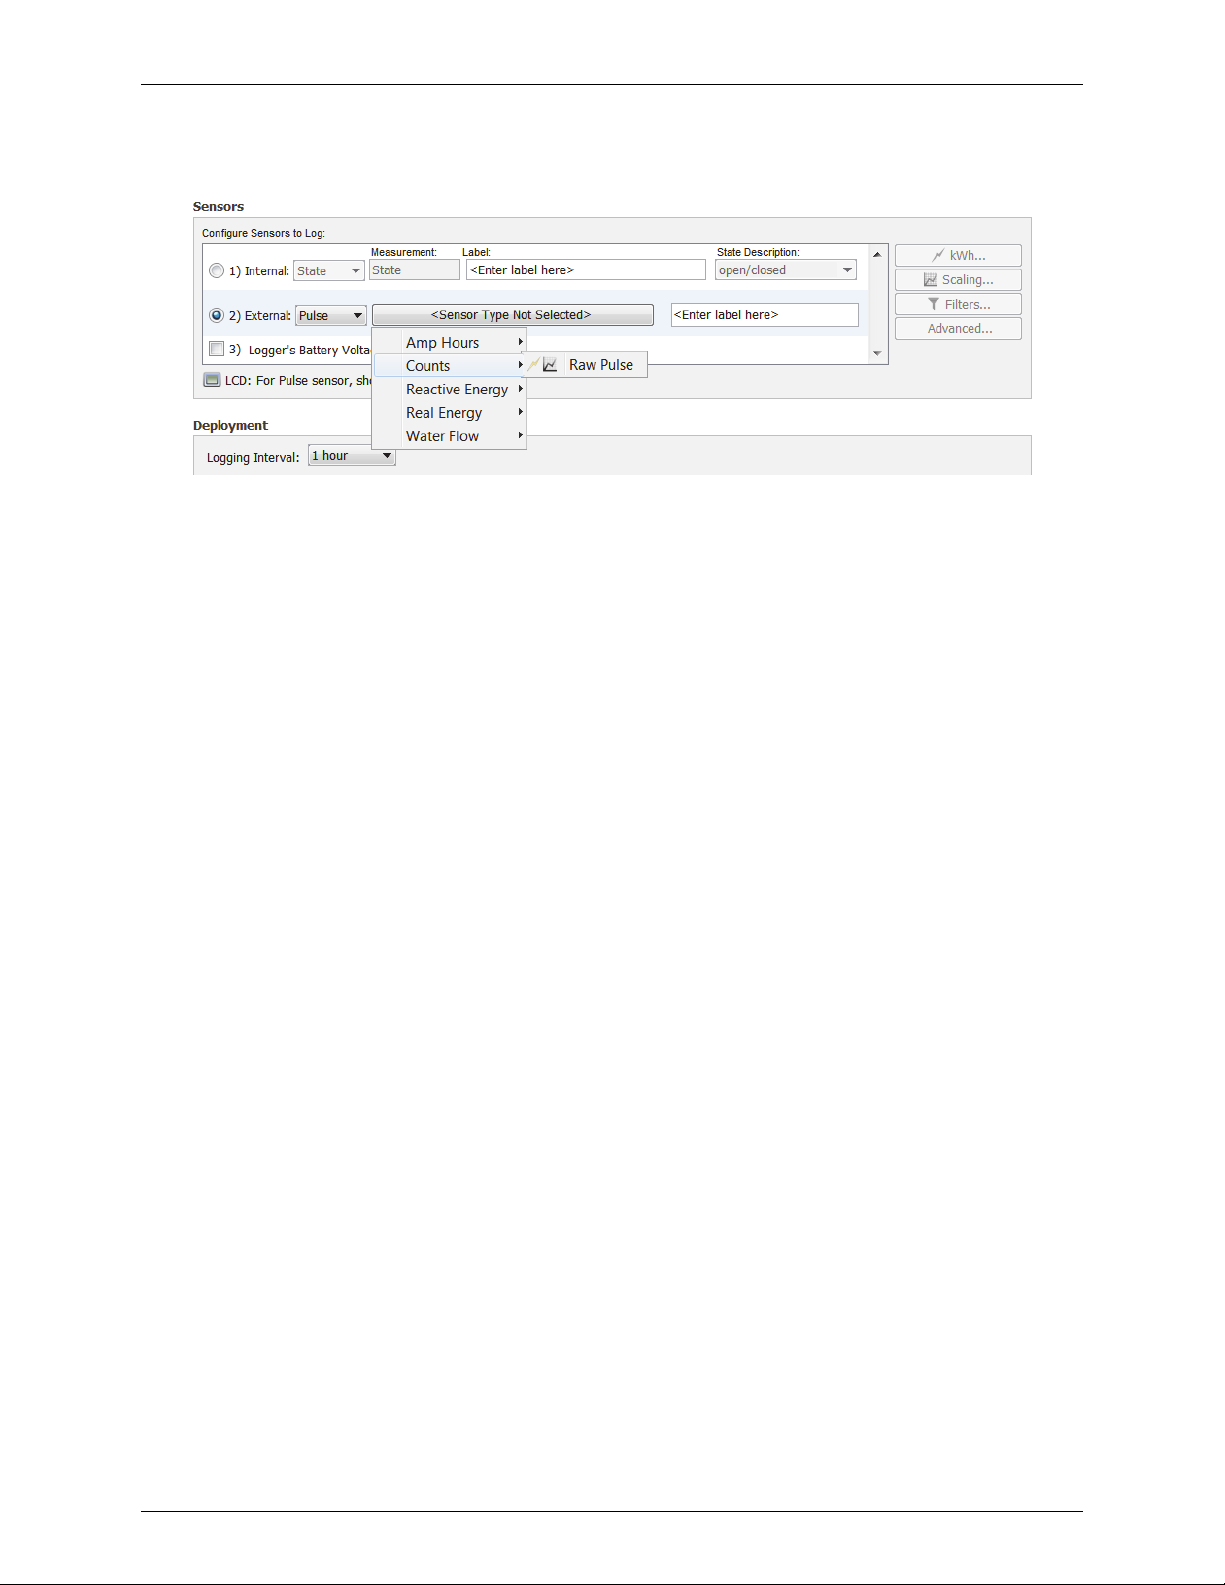
HOBOware User’s Guide
on the logger LCD screen. Note that sensors that support Data Assistants at launch time display the
kWh and/or scaling icon next to their name.
5. Repeat steps 1 through 4 if your logger supports multiple sensors.
6. Set the units that display on the logger's LCD screen. When the sensor is configured to log State or
Runtime, choose either:
• "Time" to show the total amount of time the switch has been closed or on since logging began,
ranging from seconds to days; or
• "%" to show the percentage of time the switch has been closed or on since logging began.
When the sensor is configured to log Pulse or Event, the LCD will display the units in three characters. Accept
either the default units or type your own three-character units.
Notes on configuring sensors:
• Click the Filters button to create additional filtered series for any of the channels you configured. The
filtered series will then be automatically calculated when you read out the logger and plot the data.
• Click the Advanced button to access the following settings specific to the logger: Pulse Frequency and
Lockout Time, Occupancy, and Calibration.
• When setting up a pulse sensor, consider setting up the launch for a delayed or push button start and
then connect the sensors/devices later before logging begins.
after logging begins may not log accurate data.
Important: Sensors that are connected
• The Occupancy/Light logger (UX90-005x/-006x) also automatically generates additional series upon
reading out the logger to give you combined statistics, such as how long the lights were left on while
the room was unoccupied. These series will be available in the Plot Setup dialog when opening the
datafile.
• You have the option to record the logger's battery voltage at each sample time; this is the last channel
in the sensors list. Like the other data channels, logging the internal battery channel consumes some
of the logger's memory. Unless you suspect abnormal battery performance, you do not need to log
the battery voltage. You can also hide the battery channel with Series preferences (in Preferences,
select Display, then Series).
• Note that labels do not apply to calculated or derived channels, such as filtered series.
Deployment
• Logging Interval.
to log Pulse or Runtime). You can choose either one of the preset logging intervals or specify a custom
logging interval. The minimum logging interval is one second and the maximum for most loggers is 18
1-800-LOGGERS 19 www.onsetcomp.com
Select how often the logger will record data (only available for sensors configured
Page 20

HOBOware User’s Guide
hours, 12 minutes, and 15 seconds. The shorter the logging interval, the more quickly memory fills
and battery power is consumed. See also Multiple Logging Intervals and Fast Logging Intervals.
• Logging Duration. This lists the approximate time it will take to fill the logger memory based on the
logging interval and sensors currently selected. This is a theoretical estimate only; battery life and
frequent state and event logging will affect your deployment. This estimate is only available when the
sensors are configured to log Pulse or Runtime. For estimates with State and Event logging, refer to
the logger documentation, also available at http://www.onsetcomp.com/support/manuals.
• Start Logging. Select when to launch the logger. This defaults to the setting for the logger's previous
launch (you can change this in HOBOware Pro with the Launch Time-Saving Options subcategory of
the General preferences). You can choose to launch this logger:
Now. Logging begins as soon as you click the Start button in the Launch Logger window.
At Interval. Logging will begin at an exact interval (for example 9:00:00 rather than 8:47:00 when
you choose a one-hour logging interval). The exact start time depends on the logging interval you
choose. This option is only available when the sensors are configured to log Pulse or Runtime.
Push Button. Logging will not start until you press the Start/Stop button on the logger and hold it
down for at least three seconds. The LCD screen on the logger will display "Start" until you press
the button.
On Date/Time. Logging will begin at a date and time you specify, up to approximately six months
from the present. The LCD screen will count down to that start date/time and then logging will
begin.
• Stop logging. Select when you want the logger to stop logging. You can choose:
When memory fills or Never (wrap when full). If you select "When memory fills," then the logger
will stop recording data once the memory is full. If you select "Never (wrap when full)," the logger
will record data continuously until either the logger battery runs out or you stop it. Once the
logger is full, the newest data will overwrite the oldest data. When wrapping, the memory
segment on the logger LCD screen will blink.
Push button. When this option is selected, the logger will stop recording data when you press the
Start/Stop button on the logger itself for 3 seconds. The LCD screen on the logger will display
"Stop" when this option has been selected.
Specific stop date. Select the date you want the logger to stop recording data. Choose either a
preset time or set your own custom date and time.
• Options. Select "Turn LCD off" if you want the logger to operate in "stealth mode" with the LCD
screen turned off. You can override this temporarily by pressing the Start/Stop button on the logger.
The LCD will then remain illuminated for 10 minutes.
Skip launch window next time (HOBOware Pro)
Check this box if you would like to bypass the Launch Window the next time you choose Launch from the Device
menu or click the Launch icon. This will cause the next logger to be launched with either the previous launch
settings or the current logger settings as set in Launch Time-Saving Options subcategory of the General
preferences.
1-800-LOGGERS 20 www.onsetcomp.com
Page 21
HOBOware User’s Guide
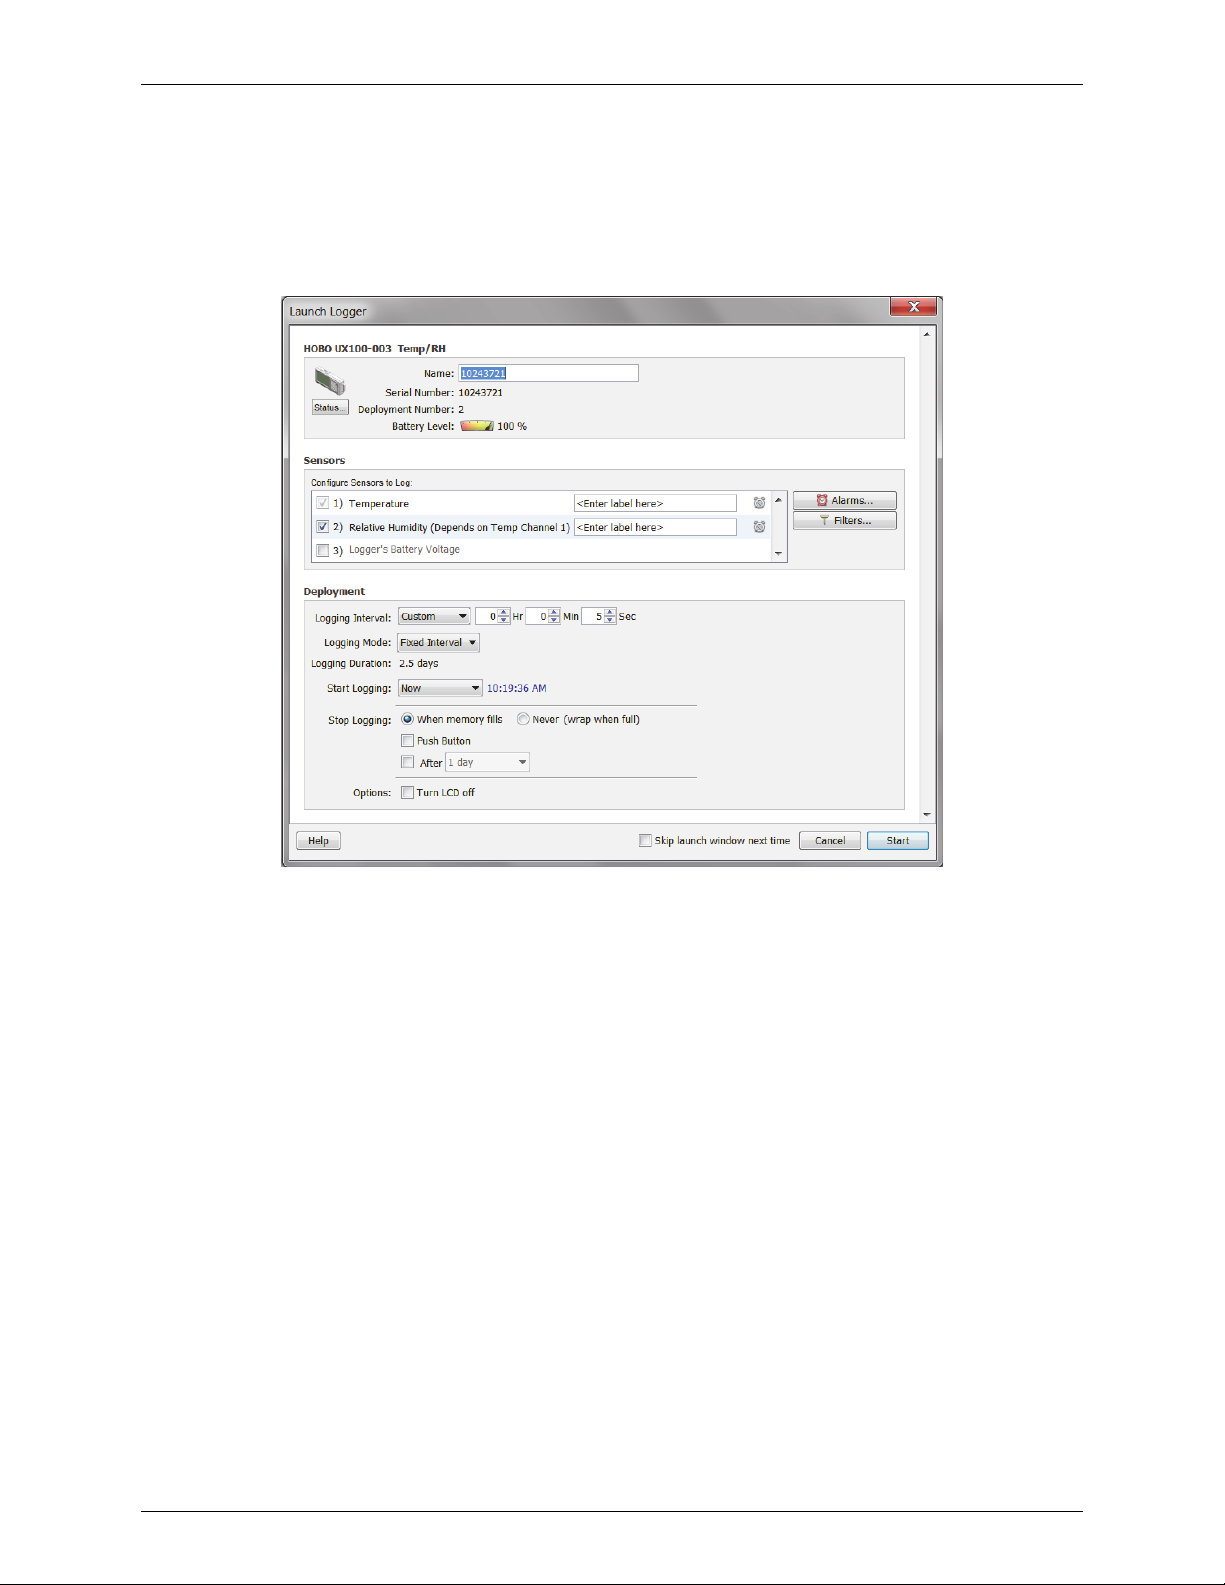
Launch Options for HOBO UX100 Series Loggers and the HOBO
4-Channel Thermocouple Logger (UX120-014M)
The following launch options are available for HOBO UX100 series data loggers and the HOBO 4-Channel
Thermocouple Logger (UX120-014M). Note that the Launch Logger window may vary from the example shown
below.
Logger Information
• Name.
Enter a name for the launch, up to 40 characters, in this field. This name is used as the default
file name when you read out and save the data recorded by the logger. It is also the default title of the
plot.
• Serial Number. This is the serial number for the logger. Note that some external sensors or devices
also have serial numbers, which are not listed here.
• Deployment Number. This is the number of times (including this time) the logger has been
launched. Each time you start a new launch, the deployment number increases by one.
• Battery Level. This shows the current battery level in the logger.
• Status. Click the Status button to check the logger settings from the previous launch.
Sensors
The Sensors List displays all sensors available for recording data. Choose the sensors, or channels, that you wish to
log in this deployment. If connecting a thermocouple, select the appropriate type from the drop-down list. Type a
label for the sensor, if desired.
Notes:
• Click the Alarms button to set an alarm for this logger. Note that the Logging Mode must be set to
Normal or Statistics to configure an alarm. For thermocouple loggers (UX100-014M and UX120-014M
1-800-LOGGERS 21 www.onsetcomp.com
Page 22

• Click the Filters button to create additional filtered series for any of the channels you configured. The
• You have the option to record the logger's battery voltage at each sample time; this is the last channel
• Note that labels do not apply to all calculated or derived channels, such as filtered series channels.
Deployment
HOBOware User’s Guide
models), alarms can only be configured on thermocouple channels; they are not available on the
internal 10K thermistor (temperature) channel.
filtered series will then be automatically calculated when you read out the logger and plot the data.
in the sensors list. Like the other data channels, logging the internal battery channel consumes some
of the logger's memory. Unless you suspect abnormal battery performance, you do not need to log
the battery voltage. You can also hide the battery channel with Series preferences (in Preferences,
select Display, then Series).
• Logging Interval.
preset logging intervals or specify a custom logging interval. The minimum logging interval is one
second and the maximum for most loggers is 18 hours, 12 minutes, and 15 seconds. The shorter the
logging interval, the more quickly memory fills and battery power is consumed.
Select how often the logger will record data. You can choose either one of the
• Logging Mode. Select the type of logging mode you wish to use: Fixed Interval, Burst Logging, or
Statistics. With Burst Logging mode, you can configure the logger to use a different logging interval
when specific conditions are met. With Statistics mode, you can configure the logger to calculate
maximum, minimum, average, and standard deviation for all enabled sensors (except battery voltage)
during logging at a sampling interval you specify. Keep in mind that the more statistics you record, the
shorter the logger duration and the more memory is required. Once you launch the logger, the
selected statistics will be displayed on the logger LCD. After you set up Burst or Statistics logging,
there will be an Edit button next to Logging Mode in the Launch Logger window to make additional
changes as necessary. Note that Fixed Interval or Statistics mode is required if you want to set up
alarms for the logger. On thermocouple loggers, burst logging and statistics are only available on
thermocouple channels and not on the internal temperature channel.
• Logging Duration. This lists the approximate time it will take to fill the logger memory based on the
logging interval, logging mode, and sensors currently selected. This is a theoretical estimate only;
battery life and other factors will also affect the deployment.
• Start Logging. Select when to launch the logger. This defaults to the setting for the logger's previous
launch (you can change this in HOBOware Pro with the Launch Time-Saving Options subcategory of
the General preferences). You can choose to launch this logger:
Now. Logging begins as soon as you click the Start button in the Launch Logger window.
At Interval. Logging will begin at an exact interval (for example 9:00:00 rather than 8:47:00 when
you choose a one-hour logging interval). The exact start time depends on the logging interval you
choose.
On Date/Time. Logging will begin at a date and time you specify, up to approximately six months
from the present. The LCD screen will count down to that start date/time and then logging will
begin.
Push Button. Logging will not start until you press the Start/Stop button on the logger and hold it
down for at least three seconds. The LCD screen on the logger will display "Start" until you press
the button.
• Stop Logging. Select when you want the logger to stop logging. You can choose:
When memory fills or Never (wrap when full). If you select "When memory fills," then the logger
will stop recording data once the memory is full. If you select "Never (wrap when full)," the logger
will record data continuously until either the logger battery runs out or you stop it. Once the
logger is full, the newest data will overwrite the oldest data. When "Never (wrap when full)" is
1-800-LOGGERS 22 www.onsetcomp.com
Page 23

HOBOware User’s Guide
selected, a wrap indicator icon will display on the logger LCD screen. Note: You cannot select
"Never (wrap when full)" on UX100 series loggers if Burst is selected for the Logging Mode.
Push button. When this option is selected, the logger will stop recording data when you press the
Start/Stop button on the logger for three seconds. The LCD screen on the logger will display
"Stop" when this option has been selected.
Allow button restart. This setting is available when "Push button" is selected as a "Stop Logging"
option. If you select this option, you can resume logging on the next even logging interval on a
stopped logger by pressing the Start/Stop button for three seconds. For example, press the
Start/Stop logging button on the logger once to stop logging. Then, a few minutes, hours, or even
days later when you are ready to continue logging, press the Start/Stop button on the logger again
and logging will resume at the next even logging interval (i.e. if the logging interval is set at 1 hour
and you press the button at 10:15 AM, logging will not resume until 11:00 AM, which is the next
even interval based on the 1-hour logging interval). You can then continue to start and stop
logging as often as you'd like during this same deployment. Any gaps between when you stopped
and restarted logging during this deployment will be reflected on the plotted data when you read
out the logger. Once you relaunch the logger, a new deployment and datafile will begin. The data
from the previous deployment will not be carried over to the new one.
Specific stop date. Select the date you want the logger to stop recording data. Choose either a
preset time or set your own custom date and time. Note: If you select a specific stop date and also
have the logger configured to resume logging on the next button push, then the logger will stop
logging at the date you select regardless of how many times you stop and restart the logger with
the Start/Stop button.
• Options. Select "Turn LCD off" if you want the logger to operate in "stealth mode" with the LCD
screen turned off. You can override this temporarily by pressing the Start/Stop button on the logger.
The LCD will then remain illuminated for 10 minutes.
Skip launch window next time (HOBOware Pro)
Check this box to bypass the Launch Window the next time you choose Launch from the Device menu or click the
Launch icon. This will cause the next logger to be launched with either the previous launch settings or the current
logger settings as set in the Launch Time-Saving Options subcategory of the General preferences.
Important: After you choose the launch settings in this window and click Start, the settings are then loaded into
the logger. The LCD screen on the logger will display "LOAD" during this process. If you disconnect the logger from
the USB cable before this process is finished, "Err" will appear on the LCD screen instead. If you see "Err" at any
point during launch configuration, check the USB connection between the computer and the logger, reopen the
Launch Logger window and click Start again.
1-800-LOGGERS 23 www.onsetcomp.com
Page 24
HOBOware User’s Guide
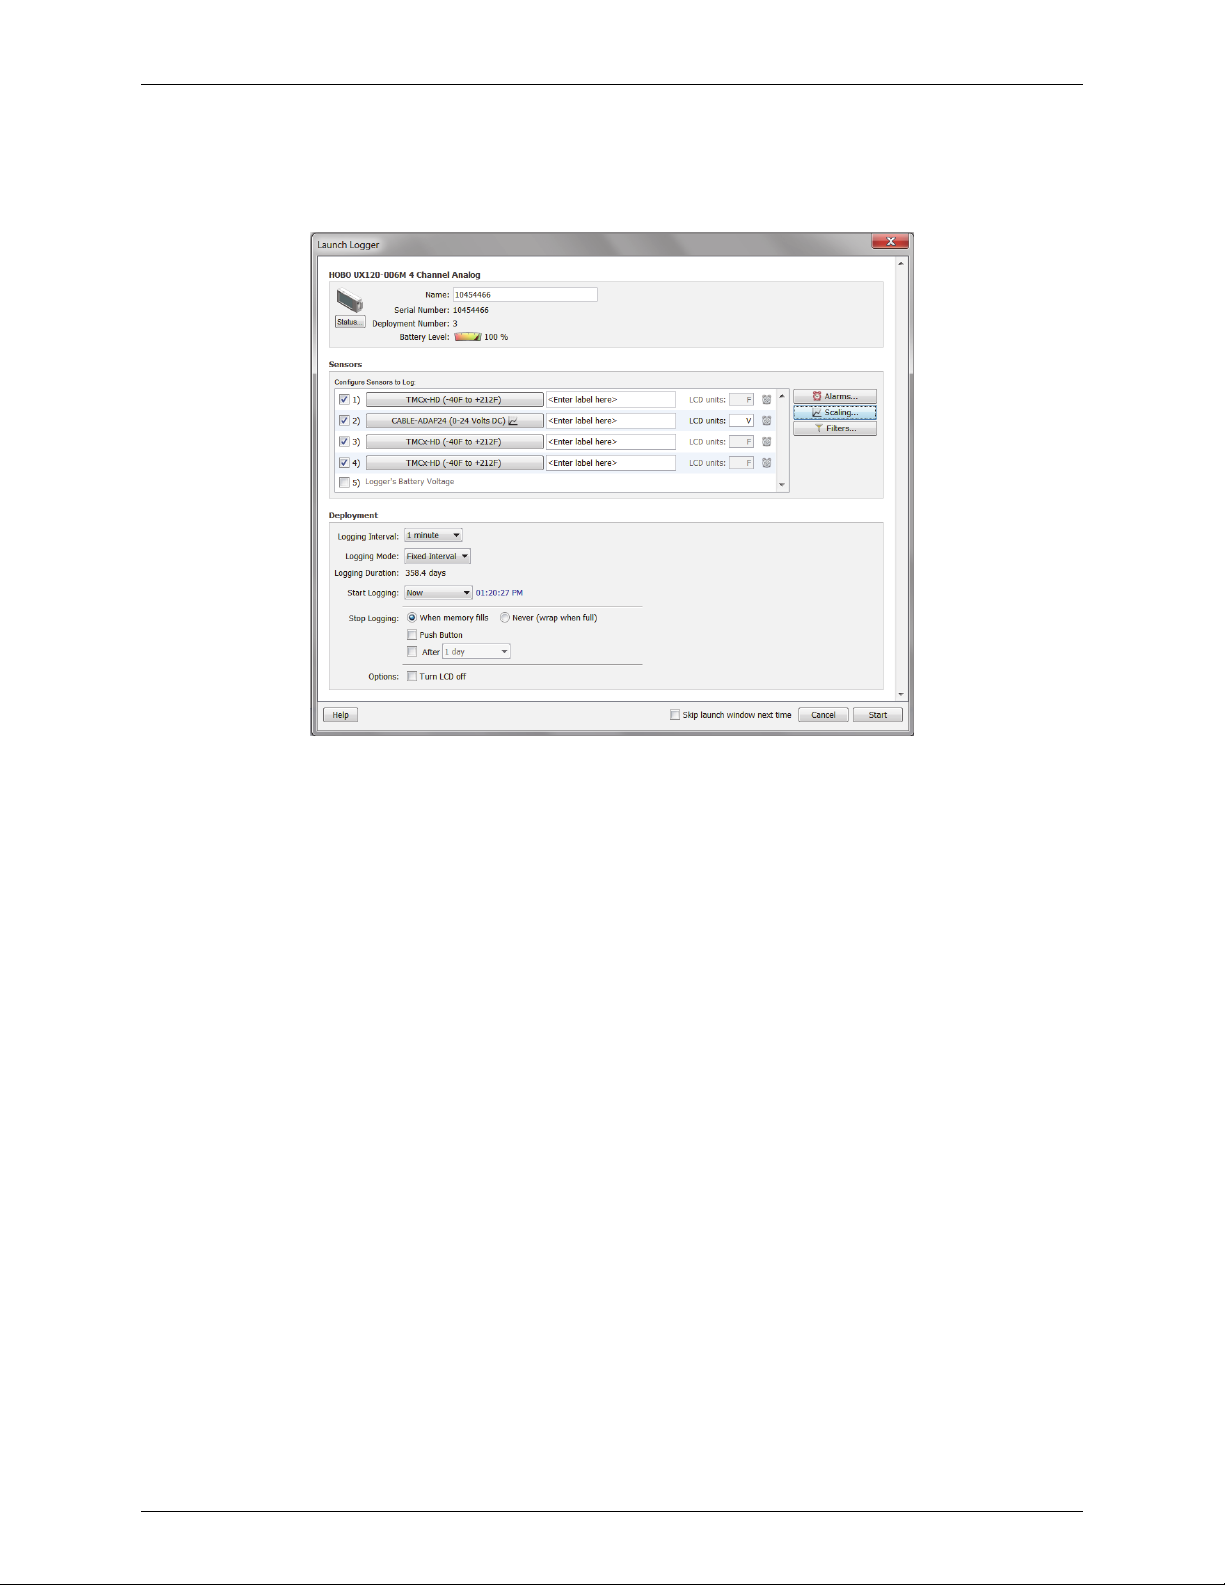
Launch Options for the HOBO 4-Channel Analog Logger (UX120-006M)
The following launch options are available for the HOBO 4-Channel Analog logger (UX120-006M). Note that the
Launch Logger window may vary from the example shown below.
Logger Information
• Name. Enter a name for the launch, up to 40 characters, in this field. This name is used as the default
file name when you read out and save the data recorded by the logger. It is also the default title of the
plot.
• Serial Number. This is the serial number for the logger. Note that some external sensors or devices
also have serial numbers, which are not listed here.
• Deployment Number. This is the number of times (including this time) the logger has been launched.
Each time you start a new launch, the deployment number increases by one.
• Battery Level. This shows the current battery level in the logger.
• Status. Click the Status button to check the logger settings from the previous launch.
Sensors
The Sensors list displays all internal sensors and external channels available for recording data. Choose the sensors,
or channels, that you wish to log in this deployment. To configure a sensor:
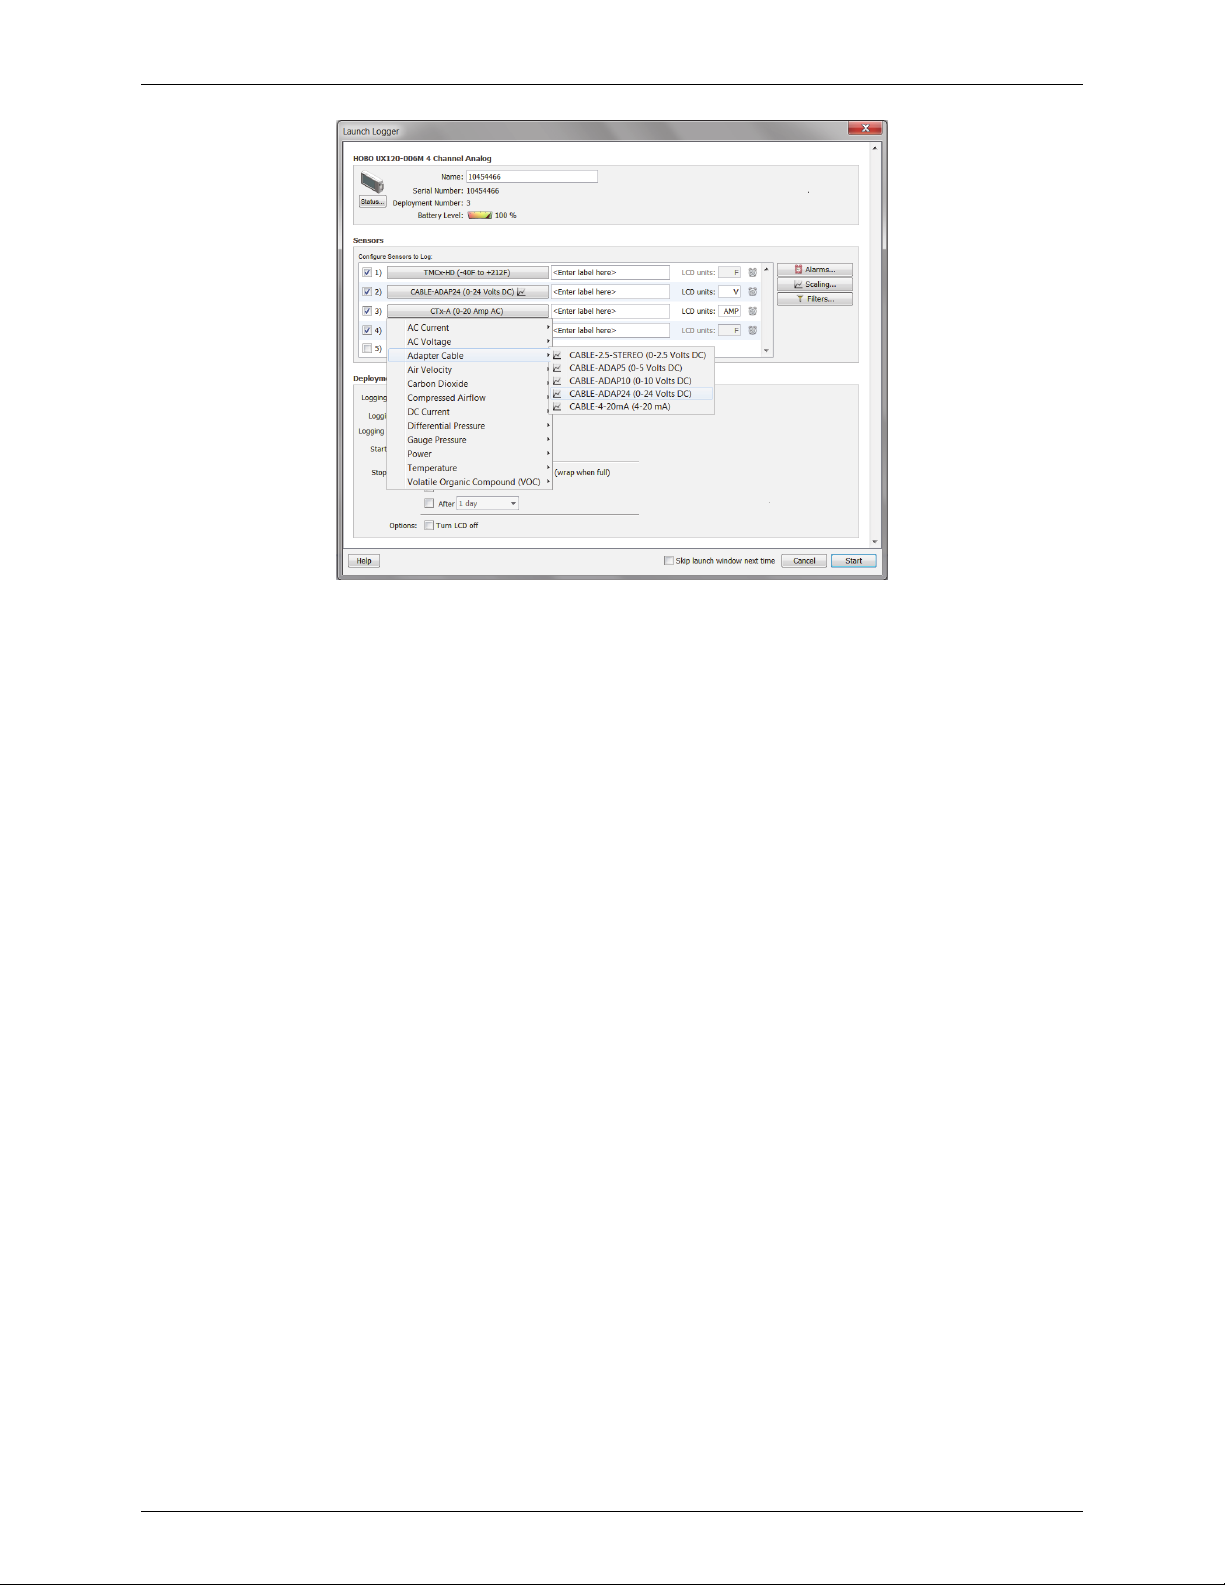
1. Select the checkbox next to the channel number to enable the sensor.
2. Select the type of sensor or cable that will be connected to that channel on the logger as shown in the
following example.
1-800-LOGGERS 24 www.onsetcomp.com
Page 25
HOBOware User’s Guide
3. Type a label for the sensor, if desired.
4. Type a 3-character description for the units that the LCD will display for that sensor or use the default
units.
5. Set up scaling for the sensor, if applicable. Click the Scaling button and enter the scaled values and
units as recommended in the sensor documentation.
6. Repeat steps 1 through 5 for each sensor you wish to configure.
Notes on configuring sensors:
• Although it is helpful to see the connected sensors/devices when setting up the launch, it is not
required that you physically connect them while selecting sensor type options. You may set up the
launch for a delayed or push button start, then connect the sensors/devices later, before logging
begins. Be sure to connect each sensor into the correct numbered jack based on you configured the
corresponding channel. Important: Sensors that are connected after logging begins may not log
accurate data.
• Click the Filters button to create additional filtered series for any of the channels you configured. The
filtered series will then be automatically calculated when you read out the logger and plot the data.
• You have the option to record the logger's battery voltage at each sample time; this is the last channel
in the sensors list. Like the other data channels, logging the internal battery channel consumes some
of the logger's memory. Unless you suspect abnormal battery performance, you do not need to log the
battery voltage. You can also disable the battery channel with Series preferences (in Preferences,
select Display, then Series).Note that labels do not apply to calculated or derived channels, such as
filtered series.
• Although it is possible to set up more than one scaling value for each sensor, only the first scaling value
for that sensor will be used.
Deployment
• Logging Interval. Select how often the logger will record data. You can choose either one of the preset
logging intervals or specify a custom logging interval. The minimum logging interval is one second and
the maximum for most loggers is 18 hours, 12 minutes, and 15 seconds. The shorter the logging
interval, the more quickly memory fills and battery power is consumed. If you did not select any
channels to log, this field will be disabled.
1-800-LOGGERS 25 www.onsetcomp.com
Page 26

HOBOware User’s Guide
• Logging Mode. Select the type of logging mode you wish to use: Fixed Interval, Burst Logging, or
Statistics. With Burst Logging mode, you can configure the logger to use a different logging interval
when specific conditions are met. With Statistics mode, you can configure the logger to calculate
maximum, minimum, average, and standard deviation for all enabled sensors (except battery voltage)
during logging at a sampling interval you specify. Keep in mind that the more statistics you record, the
shorter the logger duration and the more memory is required. Once you launch the logger, the
selected statistics will be displayed on the logger LCD. After you set up Burst or Statistics logging, there
will be an Edit button next to Logging Mode in the Launch Logger window to make additional changes
as necessary. Note that Fixed Interval or Statistics mode is required if you want to set up alarms for the
logger.
• Logging Duration. This lists the approximate time it will take to fill the logger memory based on the
logging interval and sensors currently selected. This is a theoretical estimate only; battery life and
other factors will affect your deployment.
• Start Logging. Select when to launch the logger. This defaults to the setting for the logger's previous
launch (you can change this in HOBOware Pro with the Launch Time-Saving Options subcategory of the
General preferences). You can choose to launch this logger:
Now. Logging begins as soon as you click the Start button.
At Interval. Logging will begin at an exact interval (for example 9:00:00 rather than 8:47:00 when
you choose a one-hour logging interval). The exact start time depends on the logging interval you
choose.
Push Button. Logging will not start until you press the button on the logger and hold it down for at
least three seconds. The Waiting LED will blink on the logger until you press the Start/Stop button.
On Date/Time. Logging will begin at a date and time you specify, up to approximately six months
from the present. The LCD screen will count down to that start date/time and then logging will
begin.
• Stop logging. Select when you want the logger to stop logging. You can choose:
When memory fills or Never (wrap when full). If you select "When memory fills," then the logger
will stop recording data once the memory is full. If you select "Never (wrap when full)," the logger
will record data continuously until either the logger battery runs out or you stop it. Once the logger
is full, the newest data will overwrite the oldest data.
Push button. When this option is selected, the logger will stop recording data when you press the
Start/Stop button on the logger itself for 3 seconds. If you also configured a Push Button start, then
you must wait 5 minutes after logging begins before you can use the button to stop logging.
Allow button restart. This setting is available when "Push button" is selected as a "Stop Logging"
option. If you select this option, you can resume logging on the next even logging interval on a
stopped logger by pressing the Start/Stop button for three seconds. For example, press the
Start/Stop logging button on the logger once to stop logging. Then, a few minutes, hours, or even
days later when you are ready to continue logging, press the Start/Stop button on the logger again
and logging will resume at the next even logging interval (i.e. if the logging interval is set at 1 hour
and you press the button at 10:15 AM, logging will not resume until 11:00 AM, which is the next
even interval based on the 1-hour logging interval). You can then continue to start and stop logging
as often as you'd like during this same deployment. Any gaps between when you stopped and
restarted logging during this deployment will be reflected on the plotted data when you read out
the logger. Once you relaunch the logger, a new deployment and datafile will begin. The data from
the previous deployment will not be carried over to the new one.
Specific stop date. Select the date you want the logger to stop recording data. Choose either a
preset time or set your own custom date and time.
1-800-LOGGERS 26 www.onsetcomp.com
Page 27
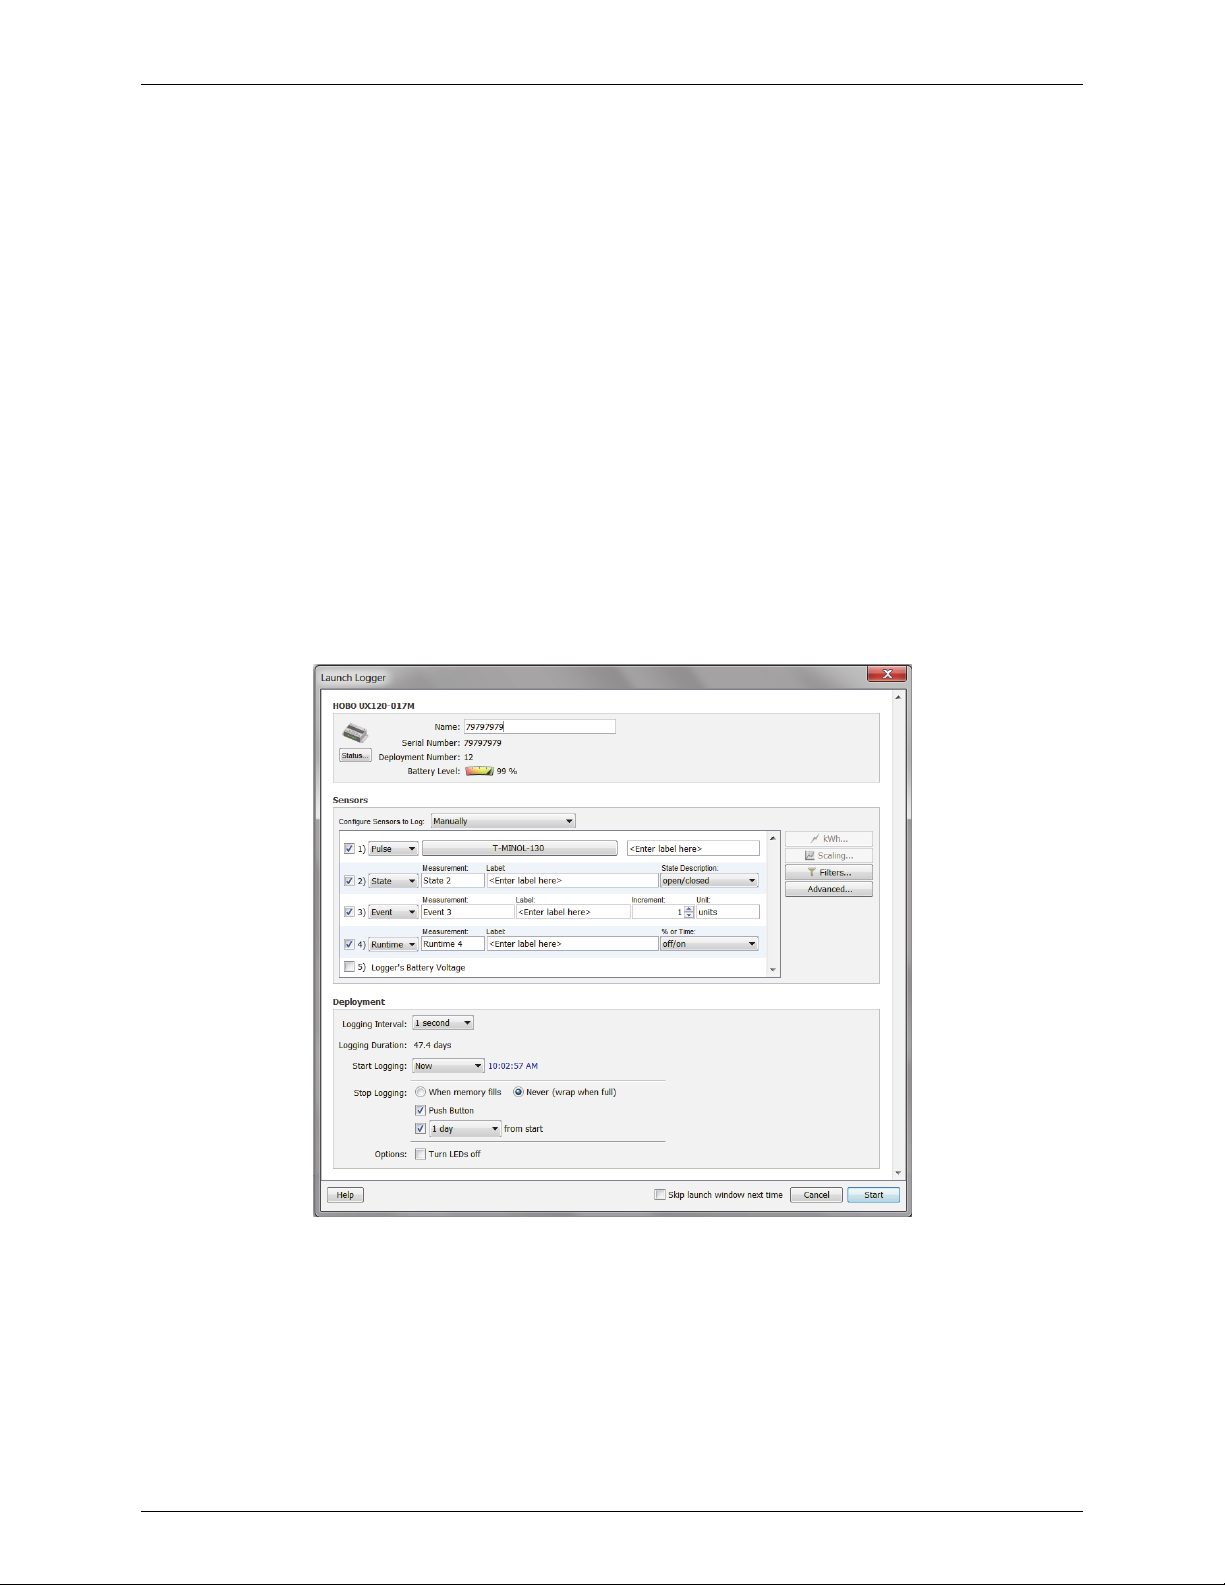
HOBOware User’s Guide
• Options. Select "Turn LCD off" if you want the logger to operate in "stealth mode" with the LCD screen
turned off. You can override this temporarily by pressing the Start/Stop button on the logger. The
LCD will then remain illuminated for 10 minutes.
Skip launch window next time (HOBOware Pro)
Check this box if you would like to bypass the Launch Window the next time you choose Launch from the Device
menu or click the Launch icon. This will cause the next logger to be launched with either the previous launch
settings or the current logger settings as set in the Launch Time-Saving Options subcategory of the General
preferences.
Important: After you choose the launch settings in this window and click Start, the settings are then loaded into
the logger. The LCD screen on the logger will display "LOAD" during this process. If you disconnect the logger from
the USB cable before this process is finished, "Err" will appear on the LCD screen instead. If you see "Err" at any
point during launch configuration, check the USB connection between the computer and the logger, reopen the
Launch Logger window and click Start again.
Launch Options for the HOBO 4-Channel Pulse Input Logger
(UX120-017x)
The following launch options are available for the HOBO 4-Channel Pulse Input Data Logger (UX120-017x). Note
that the Launch Logger window may vary from the example shown below.
Logger Information
• Name.
Enter a name for the launch, up to 40 characters, in this field. This name is used as the default
file name when you read out and save the data recorded by the logger. It is also the default title of the
plot.
• Serial Number. This is the serial number for the logger. Note that some external sensors or devices
also have serial numbers, which are not listed here.
• Deployment Number. This is the number of times (including this time) the logger has been
launched. Each time you start a new launch, the deployment number increases by one.
1-800-LOGGERS 27 www.onsetcomp.com
Page 28
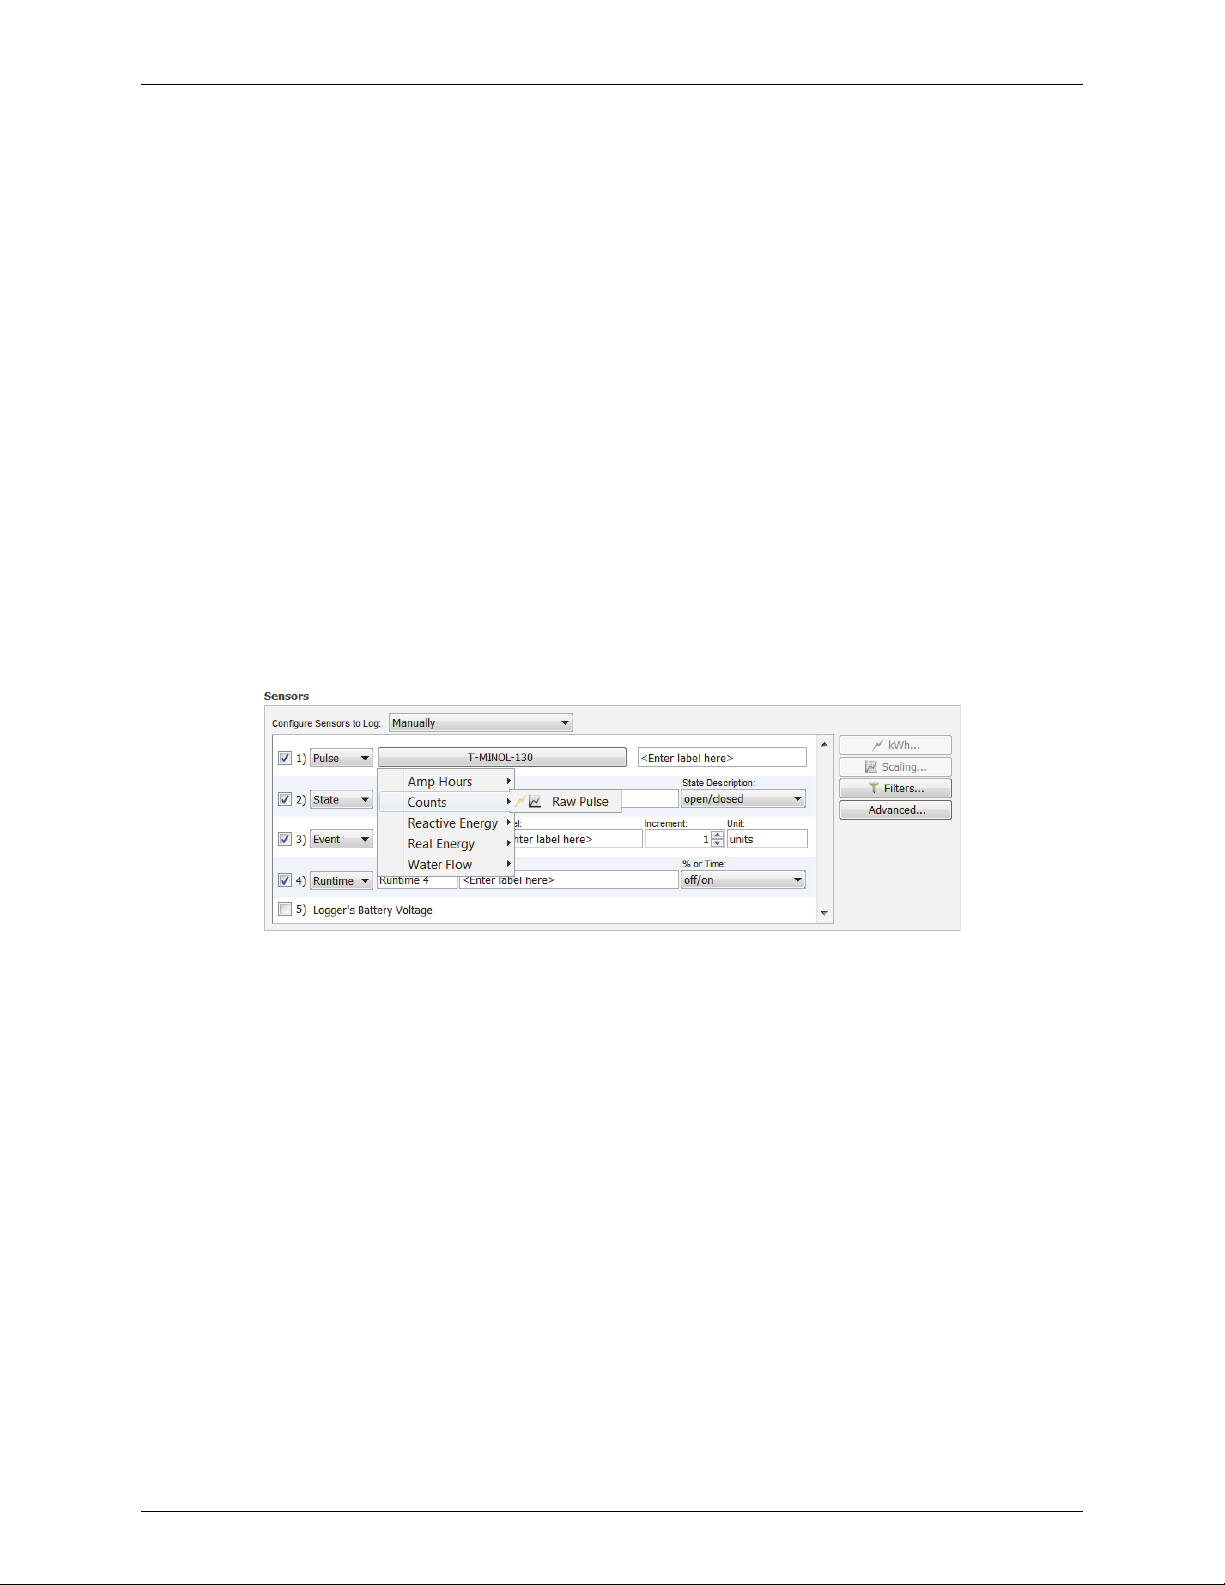
HOBOware User’s Guide
• Battery Level. This shows the current battery level in the logger.
• Status. Click the Status button to check the logger settings from the previous launch.
Sensors
The Sensors List displays all internal sensors and external channels available for recording data. Choose the
sensors, or channels, that you wish to log in this deployment. To configure a channel:
1. If you are using the logger with an E50B2 Power & Energy Meter, then select “for E50B2 Power
& Energy Meter” in the Configure Sensors drop-down list at the top of the Sensors pane. This will
automatically preselect the appropriate channels and pulse scaling factors, which you can then
customize further in the following steps.
For all other sensors/devices, select “Manually” in the Configure Sensors drop-down list.
2. Make sure the checkbox is enabled for the external channel you wish to log.
3. Choose either Pulse, State, Event, or Runtime from the drop-down list.
4. For Pulse channels, click the button for the corresponding channel in the sensor list to select the
sensor type as shown below. If you select Raw Pulse for the sensor type, you can use Data Assistants
to set up kWh (HOBOware Pro only) and pulse scaling information as necessary. You can also adjust
maximum pulse frequency and lockout time by clicking the Advanced button. Note that sensors that
support Data Assistants at launch time display the Scaling and/or kWh icon next to their name.
For State and Runtime channels, type a name and select a description.
For Event channels, type a name, adjust the increment, and type a unit description (or accept the
default "units" for the description).
5. Type a label for the sensor, if desired.
6. Repeat steps 1 through 5 for each channel you wish to configure.
Notes on configuring sensors:
• Although it is helpful to see the connected sensors/devices when setting up the launch, it is not
required that you physically connect them while selecting sensor type options. You may set up the
launch for a delayed or push button start, then connect the sensors/devices later, before logging
begins.
Important: Sensors that are connected after logging begins may not log accurate data.
• Click the Filters button to create additional filtered series for any of the channels you configured. The
filtered series will then be automatically calculated when you read out the logger and plot the data.
• You have the option to record the logger's battery voltage at each sample time; this is the last channel
in the sensors list. Like the other data channels, logging the internal battery channel consumes some
of the logger's memory. Unless you suspect abnormal battery performance, you do not need to log
1-800-LOGGERS 28 www.onsetcomp.com
Page 29

• Note that labels do not apply to calculated or derived channels, such as filtered series.
Deployment
HOBOware User’s Guide
the battery voltage. You can also disable the battery channel with Series preferences (in Preferences,
select Display, then Series).
• Logging Interval.
preset logging intervals or specify a custom logging interval. The minimum logging interval is one
second and the maximum for most loggers is 18 hours, 12 minutes, and 15 seconds. The shorter the
logging interval, the more quickly memory fills and battery power is consumed. If you did not select
any channels to log, this field will be disabled.
Select how often the logger will record data. You can choose either one of the
• Logging Duration. This lists the approximate time it will take to fill the logger memory based on the
logging interval and sensors currently selected. This is a theoretical estimate only; battery life and
frequent state and event logging will affect your deployment. If you are logging only state changes
and events, no estimation is possible.
• Start Logging. Select when to launch the logger. This defaults to the setting for the logger's previous
launch (you can change this in HOBOware Pro with the Launch Time-Saving Options subcategory of
the General preferences). You can choose to launch this logger:
Now. Logging begins as soon as you click the Start button.
At Interval. Logging will begin at an exact interval (for example 9:00:00 rather than 8:47:00 when
you choose a one-hour logging interval). The exact start time depends on the logging interval you
choose.
Push Button. Logging will not start until you press the button on the logger and hold it down for at
least three seconds. The Waiting LED will blink on the logger until you press the Start/Stop button.
On Date/Time. Logging will begin at a date and time you specify, up to approximately six months
from the present. The Waiting LED will blink on the logger until logging begins on the selected
date/time.
• Stop logging. Select when you want the logger to stop logging. You can choose:
When memory fills or Never (wrap when full). If you select "When memory fills," then the logger
will stop recording data once the memory is full. If you select "Never (wrap when full)," the logger
will record data continuously until either the logger battery runs out or you stop it. Once the
logger is full, the newest data will overwrite the oldest data.
Push button. When this option is selected, the logger will stop recording data when you press the
Start/Stop button on the logger itself for 3 seconds. If you also configured a Push Button start,
then you must wait 5 minutes after logging begins before you can use the button to stop logging.
Specific stop date. Select the date you want the logger to stop recording data. Choose either a
preset time or set your own custom date and time.
• Options. Select "Turn LEDs off" if you want the logger to operate in "stealth mode," which disables
the Logging LED on the logger. The Waiting LED and the Test button/Activity lights will still remain
operational when this option is selected.
Skip launch window next time (HOBOware Pro)
Check this box if you would like to bypass the Launch Window the next time you choose Launch from the Device
menu or click the Launch icon. This will cause the next logger to be launched with either the previous launch
settings or the current logger settings as set in the Launch Time-Saving Options subcategory of the General
preferences.
1-800-LOGGERS 29 www.onsetcomp.com
Page 30
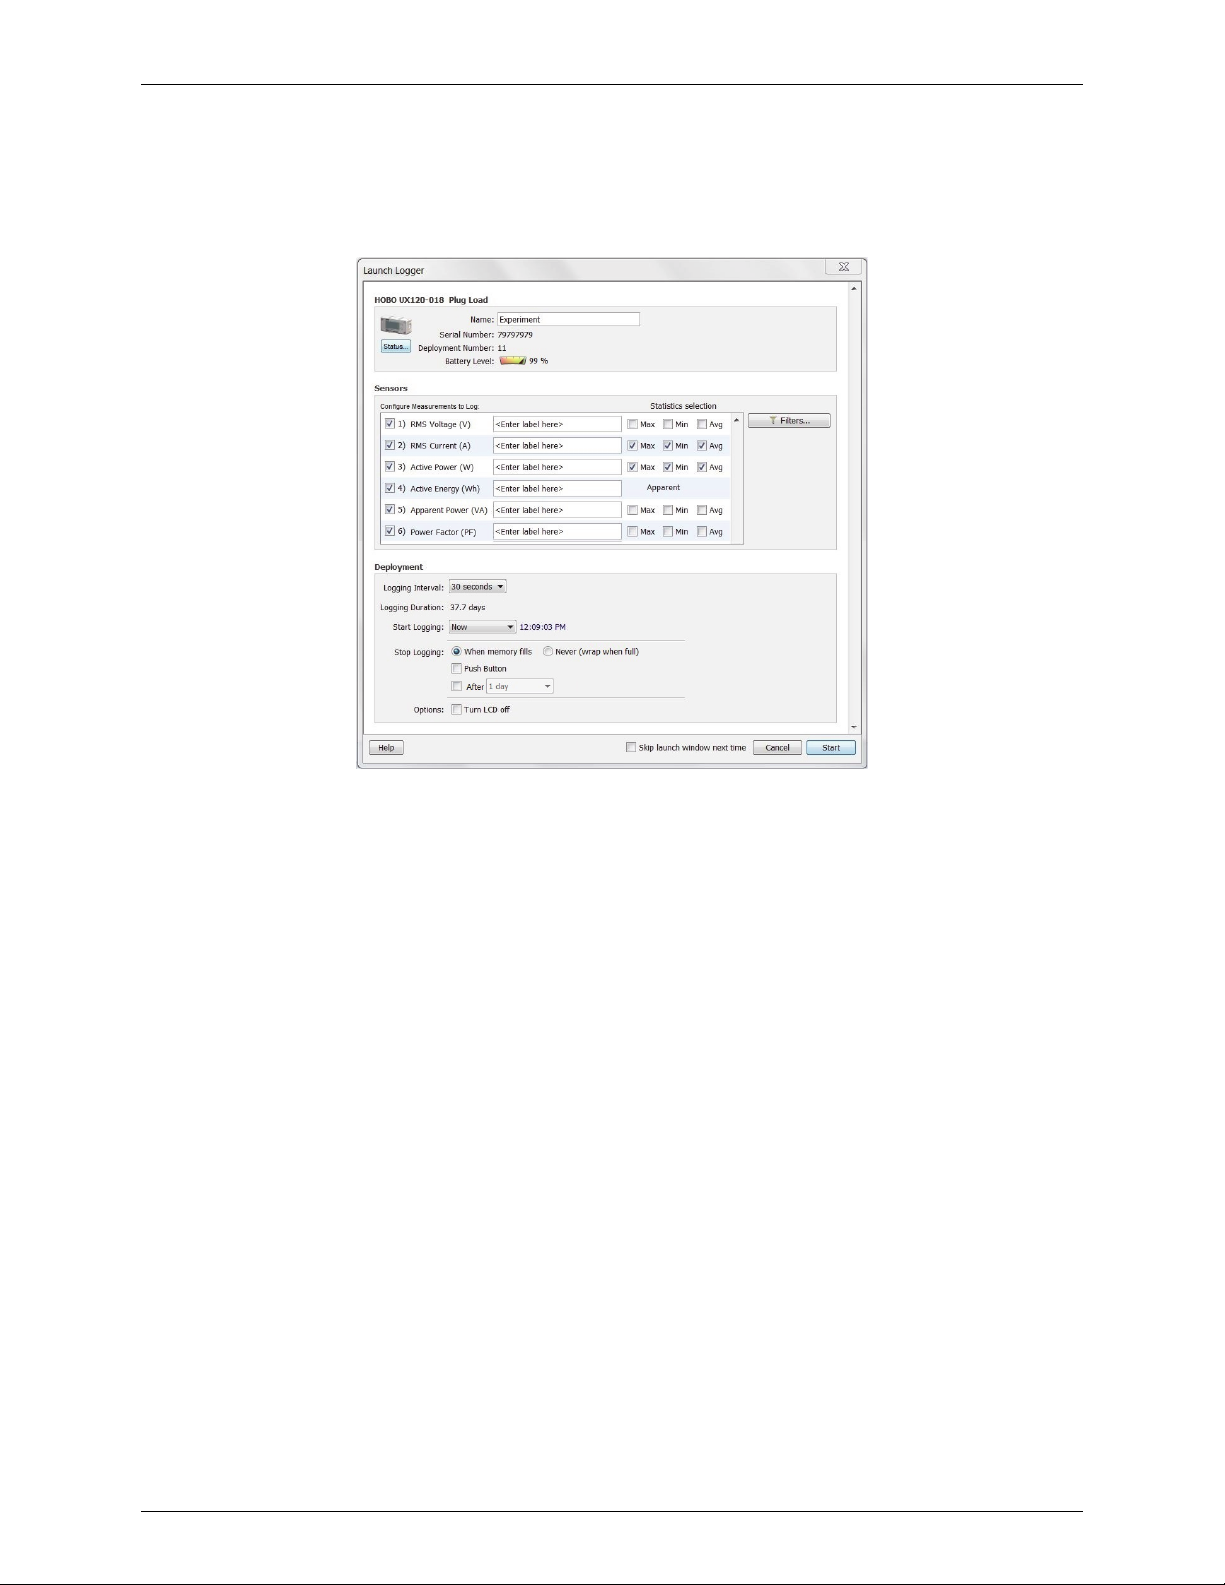
HOBOware User’s Guide
Launch Options for the HOBO Plug Load Logger (UX120-018)
The following launch options are available for the HOBO Plug Load logger (UX120-018). Note that the Launch
Logger window may vary from the example shown below. This logger also has the ability to operate in meter mode
without logging data. For details on that capability, refer to the logger manual.
Logger Information
• Name. Enter a name for the launch, up to 40 characters, in this field. This name is used as the default
file name when you read out and save the data recorded by the logger. It is also the default title of
the plot.
• Serial Number. This is the serial number for the logger.
• Deployment Number. This is the number of times (including this time) the logger has been launched.
Each time you start a new launch, the deployment number increases by one.
• Battery Level. This shows the current battery level in the logger.
• Status. Click the Status button to check the logger settings from the previous launch. You can also
check status on the logger LCD (see the logger manual for details).
Sensors
The Sensors list displays all measurements available to log with this logger. To configure measurements:
1. Select the checkbox next to each measurement you want to log. The available measurements to log are:
• RMS Voltage (V). RMS is root mean square. True RMS is the real or effective value of AC voltage for a
circuit.
• RMS Current (A). True RMS is the real or effective value of current for a circuit.
• Active Power (W). The capacity of the circuit for performing work in a particular time (also known as
real power).
• Active Energy (Wh or kWh). A watt-hour (Wh) is a unit of energy equivalent to one watt (1 W) of
power expended for one hour (1 h) of time. kWh is a unit of energy equal to 1,000 watt-hours.
• Apparent Power (VA). The product of the current and voltage of the circuit.
1-800-LOGGERS 30 www.onsetcomp.com
Page 31

HOBOware User’s Guide
• Power Factor (PF). The ratio of the active or real power flowing to the load to the apparent power in
the circuit. It is a dimensionless number between 0 and 1.
2. Type a label for each enabled measurement, if desired.
3. Select the Max, Min, or Avg checkboxes (if available) to log statistics for each enabled measurement. The
logger will calculate maximum, minimum, and average values at each logging interval based on the
logger's fixed single-cycle sampling rate of 60 Hz or 16.67 mS. For example, at a 1-minute logging interval,
the statistics would be based on 3,600 samples (60 Hz x 60 seconds). This will result in up to three
additional series per channel that record the following information at each logging interval:
• The maximum, or highest, sampled value,
• The minimum, or lowest, sampled value, and
• An average of all sampled values.
Statistics are not available for Active Energy (kWh).
Notes on configuring measurements:
• If statistics were configured, press the Next/Clear button on the logger for 1 second to cycle through
the maximum and minimum values (as applicable) on the LCD screen. Average is not available for
viewing on the LCD screen. Note that the maximum and minimum values displayed are not the values
recorded at the logging interval. They are based on samples taken every 16.67 mS during the entire
logging period. To reset the starting point used to determine the maximum and minimum values
shown on the LCD screen, press and hold the Next/Clear button for 3 seconds. See the logger manual
for more details.
• Statistics are not available in the HOBOware Status window. You can plot the statistics series once
• Click the Filters button to create additional filtered series for any of the measurements you
• You have the option to record the logger's battery voltage at each sample time. Logging the internal
• Note that labels do not apply to calculated or derived series, such as filtered series.
Deployment
• Logging Interval. Select how often the logger will record data. The shorter the logging interval, the
• Logging Duration. This lists the approximate time it will take to fill the logger memory based on the
• Start Logging. Select when to launch the logger. This defaults to the setting for the logger's previous
you read out the logger.
configured. The filtered series will then be automatically logged and available when you read out the
logger and plot the data.
battery channel consumes some of the logger's memory. Unless you suspect abnormal battery
performance, you do not need to log the battery voltage. You can enable or disable the battery
channel with Series preferences (in Preferences, select Display, then Series).
more quickly memory fills and battery power is consumed. If you did not select any channels to log,
this field will be disabled.
logging interval and sensors currently selected. This is a theoretical estimate only; battery life and
other factors will affect your deployment.
launch (you can change this in HOBOware Pro with the Launch Time-Saving Options subcategory of
the General preferences). You can choose to launch this logger:
Now. Logging begins as soon as you click the Start button.
At Interval. Logging will begin at an exact interval (for example 9:00:00 rather than 8:47:00 when
you choose a one-hour logging interval). The exact start time depends on the logging interval you
choose.
1-800-LOGGERS 31 www.onsetcomp.com
Page 32

Push Button. Logging will not start until you press the button on the logger and hold it down for
at least three seconds. The Waiting LED will blink on the logger until you press the Start/Stop
button.
On Date/Time. Logging will begin at a date and time you specify, up to approximately six months
from the present. The LCD screen will count down to that start date/time and then logging will
begin.
• Stop logging. Select when you want the logger to stop logging. You can choose:
When memory fills or Never (wrap when full). If you select "When memory fills," then the logger
will stop recording data once the memory is full. If you select "Never (wrap when full)," the
logger will record data continuously until either the logger battery runs out or you stop it. Once
the logger is full, the newest data will overwrite the oldest data.
Push button. When this option is selected, the logger will stop recording data when you press the
Start/Stop button on the logger itself for 3 seconds. If you also configured a Push Button start,
then you must wait 5 minutes after logging begins before you can use the button to stop logging.
Allow button restart. This setting is available when "Push button" is selected as a "Stop Logging"
option. If you select this option, you can resume logging on the next even logging interval on a
stopped logger by pressing the Start/Stop button for three seconds. For example, press the
Start/Stop logging button on the logger once to stop logging. Then, a few minutes, hours, or even
days later when you are ready to continue logging, press the Start/Stop button on the logger
again and logging will resume at the next even logging interval (i.e. if the logging interval is set at
1 hour and you press the button at 10:15 AM, logging will not resume until 11:00 AM, which is
the next even interval based on the 1-hour logging interval). You can then continue to start and
stop logging as often as you'd like during this same deployment. Any gaps between when you
stopped and restarted logging during this deployment will be reflected on the plotted data when
you read out the logger. Once you relaunch the logger, a new deployment and datafile will begin.
The data from the previous deployment will not be carried over to the new one.
HOBOware User’s Guide
Specific stop date. Select the date you want the logger to stop recording data. Choose either a
preset time or set your own custom date and time.
• Options. Select "Turn LCD off" if you want the logger to operate in "stealth mode" with the LCD screen
turned off. You can override this temporarily by pressing the Start/Stop button on the logger. The LCD will
then remain illuminated for 10 minutes.
Skip launch window next time (HOBOware Pro)
Check this box if you would like to bypass the Launch Window the next time you choose Launch from the Device
menu or click the Launch icon. This will cause the next logger to be launched with either the previous launch
settings or the current logger settings as set in the Launch Time-Saving Options subcategory of the General
preferences.
Important: After you choose the launch settings in this window and click Start, the settings are then loaded into
the logger. The LCD screen on the logger will display "LOAD" during this process. If you disconnect the logger from
the USB cable before this process is finished, "Err" will appear on the LCD screen instead. If you see "Err" at any
point during launch configuration, check the USB connection between the computer and the logger, reopen the
Launch Logger window and click Start again.
Launch Options for the HOBO MX CO2 Logger (MX1102)
The following launch options are available for the HOBO Temp/RH/CO2 logger (MX1102). Note that the Launch
Logger window may vary from the example shown below. This logger can be used with both HOBOware and the
HOBOmobile app. See the HOBOmobile User's Guide for details on that software.
Important note on battery life: Battery life for this logger is less than 6 months when logging CO
logging interval or statistics sampling interval faster than 5 minutes. It is recommended that you select logging and
1-800-LOGGERS 32 www.onsetcomp.com
and selecting a
2
Page 33

HOBOware User’s Guide
sampling intervals of 5 minutes or greater when the CO2 sensor is enabled to prolong battery life. If you select
intervals faster than 5 minutes, you will need to replace the batteries more frequently. If you require faster longer
intervals, you can also power the logger via USB cable. For specifications and complete logger details, refer to the
product manual at www.onsetcomp.com/manual/mx1102.
Logger Information
• Name. Enter a name for the launch, up to 40 characters, in this field. This name is used as the default file
name when you read out and save the data recorded by the logger. It is also the default title of the plot.
• Serial Number. This is the serial number for the logger.
• Deployment Number. This is the number of times (including this time) the logger has been launched.
Each time you start a new launch, the deployment number increases by one.
• Battery Level. This shows the current battery level in the logger.
• Status. Click the Status button to check current settings.
Sensors
The Sensors list displays all sensors available for recording data. Choose the sensors, or channels, that you wish to
log in this deployment and type a label if desired.
Notes:
• Click the Alarms button to set an alarm for this logger. Note that the Logging Mode must be set to Fixed
Interval or Statistics to configure an alarm.
• Click the Filters button to create additional filtered series for any of the channels you configured. The
filtered series will then be automatically calculated when you read out the logger and plot the data.
• Click the CO
dioxide sensor. See Carbon Dioxide Sensor Settings for more details.
Settings button to select calibration and altitude compensation settings for the carbon
2
• Labels do not apply to all calculated or derived channels, such as filtered series channels.
1-800-LOGGERS 33 www.onsetcomp.com
Page 34

HOBOware User’s Guide
Deployment
• Logging Interval. Select how often the logger will record data. You can choose one of the preset logging
intervals or specify a custom logging interval. The minimum logging interval is one second and the
maximum is 18 hours, 12 minutes, and 15 seconds. The shorter the logging interval, the more quickly
memory fills and battery power is consumed. Note: Battery life for this logger is less than 6 months when
logging CO
logging interval of 5 minutes or slower when the CO
• Logging Mode. Select the type of logging mode you wish to use: Fixed Interval, Burst, or Statistics. With
Fixed Interval logging, the logger records data points for enabled sensors at each logging interval. With
Burst logging mode, the logger can use a different logging interval when specific conditions are met. With
Statistics mode, the logger can calculate maximum, minimum, average, and standard deviation for all
enabled sensors during logging at a sampling interval you specify. Keep in mind that the more statistics
you record, the shorter the logger duration and the more memory is required. It is recommended that
you select a sampling interval of 5 minutes or slower when the CO
life. Once you launch the logger, the selected statistics will be displayed on the logger LCD. After you set
up Burst or Statistics logging, there will be an Edit button next to Logging Mode in the Launch Logger
window to make additional changes as necessary. Note that Fixed Interval or Statistics mode is required if
you want to set up alarms for the logger.
• Logging Duration. This lists the approximate time it will take to fill the logger memory based on the
logging interval, logging mode, and sensors currently selected. This is a theoretical estimate only; battery
life and other factors will also affect the deployment.
and selecting a logging interval faster than 5 minutes. It is recommended that you select a
2
sensor is enabled to prolong battery life.
2
sensor is enabled to prolong battery
2
• Start Logging. Select when to launch the logger. This defaults to the setting for the logger's previous
launch (you can change this in HOBOware Pro with the Launch Time-Saving Options subcategory of the
General preferences). You can choose to launch this logger:
Now. Logging begins 15 seconds after you click the Start button in the Launch Logger window.
At Interval. Logging will begin at an exact interval (for example 9:00:00 rather than 8:47:00 when you
choose a one-hour logging interval). The exact start time depends on the logging interval you choose.
On Date/Time. Logging will begin at a date and time you specify, up to approximately six months
from the present. The LCD screen will count down to that start date/time and then logging will begin.
Push Button. Logging will begin 15 seconds after you press the Start/Stop button on the logger for 3
seconds. The LCD screen on the logger will display "Start" until you press the button.
• Stop Logging. Select when you want the logger to stop logging. You can choose:
When memory fills or Never (wrap when full). If you select "When memory fills," then the logger will
stop recording data once the memory is full. If you select "Never (wrap when full)," the logger will
record data continuously until either the logger battery runs out or you stop it. Once the logger is full,
the newest data will overwrite the oldest data. When "Never (wrap when full)" is selected, a wrap
indicator icon will display on the logger LCD screen.
Push button. When this option is selected, the logger will stop recording data when you press the
Start/Stop button on the logger for three seconds. The LCD screen on the logger will display "Stop"
when this option has been selected.
After a specific stop date.
Select the date you want the logger to stop recording data. Choose either a
preset time or set your own custom date and time.
• Options. Select "Turn LCD off" if you want the logger to operate in "stealth mode" with the LCD screen
turned off. You can override this temporarily by pressing the Start/Stop button on the logger. The LCD will
then remain illuminated for 10 minutes.
1-800-LOGGERS 34 www.onsetcomp.com
Page 35

HOBOware User’s Guide
Skip launch window next time (HOBOware Pro)
Check this box to bypass the Launch Window the next time you choose Launch from the Device menu or click the
Launch icon. This will cause the next logger to be launched with either the previous launch settings or the current
logger settings as set in the Launch Time-Saving Options subcategory of the General preferences.
Important: After you choose the launch settings in this window and click Start, the settings are then loaded into
the logger. The LCD screen on the logger will display "LOAD" during this process. If you disconnect the logger from
the USB cable before this process is finished, "Err" will appear on the LCD screen instead. If you see "Err" at any
point during launch configuration, check the USB connection between the computer and the logger, reopen the
Launch Logger window and click Start again.
Launch Options for Other U-Series Loggers
The following launch options are available for USB U-Series loggers other than the UX90, UX100, and UX120-017x.
Note that the Launch Logger window may vary from the example shown below.
Logger Information
• Description.
used as the default file name when you read out and save the data recorded by the logger. It is also
the default title of the plot.
Enter a description for the launch, up to 40 characters, in this field. This description is
• Serial Number. This is the serial number for the logger. Note that some external sensors also have
serial numbers, which are not listed here.
• Deployment Number. This is the number of times (including this time) the logger has been
launched. Each time you start a new launch, the deployment number increases by one.
• Battery Level or State. This shows the current battery level in the logger or whether the battery
state is good or bad (depending on the logger model).
• Status. Click the Status button to check the logger settings used in the previous launch.
Sensors
The Sensors List displays all internal sensors and external channels available for recording data. Choose the
sensors, or channels, you wish to log in this deployment. To configure an external sensor:
1. Make sure the checkbox is enabled for the external channel you wish to configure.
2. Click the button for the corresponding channel in the sensor list to select the sensor type as shown
below. If the external sensor has not been configured, the button reads <Sensor Type Not Selected>.
Otherwise, the previous sensor type selected will be displayed on the button.
1-800-LOGGERS 35 www.onsetcomp.com
Page 36

3. Select the measurement category and then the specific sensor part number and range (if applicable).
Note that the sensor part number must match the part number listed on the shrink tube on the sensor
cable to record accurate data.
4. Type a label for the sensor, if desired.
5. Repeat steps 1 through 4 for each additional external sensor you wish to configure.
Notes on configuring sensors:
• Although it is helpful to see the connected sensors when setting up the launch, it is not required that
you connect the sensors during launch set-up. You may set up the launch for a delayed or push button
start, then connect the sensors later, before logging begins.
after logging begins will not log any data. Alternatively, if you select an external channel, but do not
plug the sensor in, false data will be recorded for that channel.
• Some loggers with RH or pressure sensors require that you also select the internal temperature sensor
to log relative humidity or pressure. The dependency may be noted in the sensors list (see Relative
Humidity channel in the example above). Refer to the manual that came with your logger for
additional information.
• When both the internal temperature and RH sensors are selected, dew point will be calculated
automatically.
HOBOware User’s Guide
Important: Sensors that are connected
• If external events or states are available for your logger, you can enter names to identify the event
and state channels that are in use. You can also rename the Open and Closed descriptions for each
state, and enter increments and units for each event channel.
• Data Assistants let you create new data series by combining data recorded by the logger with
additional data. When you use a Data Assistant from the Launch Logger window, the parameter set is
saved and applied to data every time you read out a logger or open the resultant data file. The derived
data is also shown when you check the latest readings in the Status window. Click the Scaling button
to access the Data Assistants window and choose the Linear Scaling or Pulse Scaling Assistant. Click
the Create button to run the assistant. After you enter values, click Save. Sensors that support Data
Assistants at launch time display the Scaling icon next to their name.
• Some loggers have alarm functionality. Click the Alarms button, if available, to set alarms as desired.
Sensors that have alarm functionality display the Alarms icon next to their name.
• Click the Filters button to create an additional filtered series, such as average temperature per day,
automatically when you read out the logger and plot the data.
• You have the option to record the logger's battery voltage at each sample time; this is the last channel
in the sensors list. Like the other data channels, logging the internal battery channel consumes some
of the logger's memory. Unless you suspect abnormal battery performance, you do not need to log
the battery voltage. You can also disable the battery channel with Series preferences (in Preferences,
select Display, then Series).
• Note that labels do not apply to calculated or derived channels, such as filtered series.
Deployment
• Logging Interval.
preset logging intervals or specify a custom logging interval. The shorter the logging interval, the more
quickly memory fills and battery power is consumed. If you did not select any channels to log, this
field will be disabled. See also Multiple Logging Intervals and Fast Logging Intervals.
Select how often the logger will record data. You can choose either one of the
• Logging Duration. This lists the approximate time it will take to fill the logger memory based on the
logging interval and sensors currently selected. This is a theoretical estimate only; battery life and
1-800-LOGGERS 36 www.onsetcomp.com
Page 37

HOBOware User’s Guide
frequent state and event logging will affect your deployment. If you are logging only state changes
and events, no estimation is possible.
• DO Sensor Cap Expires (HOBO U26 Dissolved Oxygen logger only). If a DO sensor cap is
installed on the U26 logger, the date the cap expires is listed. The logger will not collect any data after
the cap expires. For more details on the DO sensor cap, see Working with the HOBO U26 Dissolved
Oxygen Logger.
• Start Logging. Select when to launch the logger. This defaults to the setting for the logger's previous
launch (you can change this in HOBOware Pro with the Launch Time-Saving Options subcategory of
the General preferences). For U-Series loggers, you can choose to launch the logger:
Now. Logging begins as soon as you click the Start button.
At Interval. Logging will begin at an exact interval (for example 9:00:00 rather than 8:47:00 when
you choose a one-hour logging interval). The exact start time depends on the logging interval you
choose.
Push Button/Using Coupler. (Available only on certain loggers.) Logging will not start until you
press the button on the logger and hold it down for at least three seconds, or return the logger to
the coupler without the base station for at least three seconds (refer to your logger manual for
more information). If the logger has a light, it will flash quickly when logging begins.
On Date/Time. Logging will begin at a date and time you specify, up to approximately six months
from the present.
Skip launch window next time (HOBOware Pro)
Check this box if you would like to bypass the Launch Window the next time you choose Launch from the Device
menu or click the Launch icon. This will cause the next logger to be launched with either the previous launch
settings or the current logger settings as set in the Launch Time-Saving Options subcategory of the General
preferences.
1-800-LOGGERS 37 www.onsetcomp.com
Page 38

HOBOware User’s Guide
Launch Options for the HOBO U30 and Other Station Loggers
The following launch options are available for Station loggers, which connect to the computer via serial cable
instead of USB cable. Note that the Launch Logger window may vary from the example shown below.
Logger Information
• Name.
Enter a name for the launch, up to 40 characters, in this field. This name is used as the default
file name when you read out and save the data recorded by the logger. It is also the default title of the
plot.
• Serial Number. This is the serial number for the logger. Note that some external sensors also have
serial numbers, which are listed in the Sensors pane.
• Deployment Number. This is the number of times (including this time) the logger has been
launched. Each time you start a new launch, the deployment number increases by one.
• Battery Level. This shows the current battery level in the logger.
• User Notes. Click this button to type up to 2000 characters of information about the deployment.
This text will be displayed in the Details pane after you read out the logger and plot the data.
• Status. Click the Status button to check the logger settings from the previous launch.
Sensors
Only the sensors that are currently plugged in or built into the logger are listed. Sensors are listed in ascending
order by serial number, regardless of their physical position in the logger. If you add or remove sensors, click the
Refresh button to make sure your changes are seen by the logger and displayed in this list.
1-800-LOGGERS 38 www.onsetcomp.com
Page 39

HOBOware User’s Guide
You can assign a name to each sensor (up to 30 characters). This is helpful if you want to specify a location where
the sensor will be placed or if you need to differentiate multiple sensors of the same type.
Sensors must be connected prior to launching if you will be entering a name for the sensor or configuring
FlexSmart modules or Analog Sensor Ports (use the Configure button to the right of the Label field). Otherwise,
sensors do not have to be connected when setting up the launch. You may set up the launch for a delayed or push
button start, then connect the sensors later before logging begins.
Notes about configuring sensor channels:
• Do not attach more than 15 channels of sensors. The logger cannot accommodate more than 15
channels.
• In addition to logging up to 15 channels, the HOBO Energy Logger and HOBO U30 Station can record
their internal battery channel (other sensors must be attached; the logger cannot log battery alone).
When enabled, the logger's battery voltage is recorded at each interval. The battery voltage is logged
by default for the U30-GSM, U30-WIF, and U30-ETH and is an option for other logger models.
• Always enable the logger's internal battery channel when logging with excitation power. This will help
you determine whether and when excitation power was turned off during a deployment.
• HOBOware Pro Data Assistants let you create new data series by combining data recorded by the
logger with additional data. When you use a Data Assistant from the Launch Logger window, the
parameter set is saved and applied to data every time you read out a logger or open the resultant
data file. The derived data is also shown when you check the latest readings in the Status window. You
can use the following Data Assistants from the Launch window (others can only be used from the Plot
Setup window): Pulse Scaling, Linear Scaling, and kWh (HOBOware Pro only). This feature is available
for the HOBO U30, the HOBO H21 (Weather Station and Micro Station) and the HOBO H22 (Energy
Logger) loggers. Click the kWh or Scaling button to access the Data Assistants window. Select the
desired assistant and click the Create button to run the selected assistant. After you enter values, click
Save. Sensors that support Data Assistants at launch time display the Scaling and/or kWh icon next to
their name.
• Click the Filters button to create an additional filtered series, such as average temperature per day,
• Note that labels do not apply to calculated or derived channels, such as filtered series.
Deployment
• Logging Interval.
• Sampling Interval. The sampling interval allows you to take multiple measurements within the
• Logging Duration. This lists the approximate time it will take to fill the logger memory based on the
automatically when you read out the logger and plot the data.
Select how often the logger will record data. You can choose either one of the
preset logging intervals or specify a custom logging interval. The minimum logging interval is one
second and the maximum for most loggers is 18 hours, 12 minutes, and 15 seconds. The shorter the
logging interval, the more quickly memory fills and battery power is consumed. Some sensors
(specifically, the FlexSmart TRMS modules) require a logging interval of two seconds or greater. If you
choose a faster logging interval, erroneous data will be logged on these channels.
logging interval, then average them together to create a single logged measurement. The sampling
interval is optional and is valid only for sensors that support measurement averaging. Refer to the
sensor's user manual to determine whether measurement averaging is available on the sensor. If you
have at least one sensor that supports measurement averaging, click the Enable button, then set the
sampling interval at less than or equal to the logging interval (up to four minutes). Rapid sampling
(faster than one minute) will reduce the logger's battery life. If you do not have any sensors with
measurement averaging or wish to turn off the sampling interval, click the Disable button.
logging interval and sensors currently selected. This is a theoretical estimate only; battery life and
frequent state and event logging will affect your deployment. If you are logging only state changes
1-800-LOGGERS 39 www.onsetcomp.com
Page 40

HOBOware User’s Guide
and events, no estimation is possible. If you add or remove sensors while viewing the Launch window,
click the Refresh button to get an updated Logging Duration.
• Start Logging. Select when to launch the logger. This defaults to the setting for the logger's previous
launch (you can change this in HOBOware Pro with the Launch Time-Saving Options subcategory of
the General preferences). You can choose to launch the logger:
Now. Logging begins as soon as you click the Start button. If you do not have at least one sensor
attached, the logger will not launch.
At Interval. Logging will begin at an exact interval (for example 9:00:00 rather than 8:47:00 when
you choose a one-hour logging interval). The exact start time depends on the logging interval you
choose.
Push Button. Logging will not start until you press the button on the logger and hold it down for at
least three seconds. If the logger has a light, it will flash quickly when logging begins. This is not
available for the U30 Station.
On Date/Time. Logging will begin at a date and time you specify, up to approximately six months
from the present.
Save Settings in Logger. Logging will not start, but the launch settings will be saved so that you do
not have to re-enter them when you are ready to launch at a later time. The next time you view
the Launch window for this logger, the settings you entered will still be in place.
• Stop Logging. There are two options for stopping the logger: either "when memory fills" or "never
(wrap when full)." If you select "when memory fills," then the logger will stop recording data once the
memory is full. If you select "never (wrap when full)," the logger will record data continuously until
either the logger battery runs out or you stop it. Once the logger is full, the newest data will overwrite
the oldest data.
Skip launch window next time (HOBOware Pro)
Check this box if you would like to bypass the Launch Window the next time you choose Launch from the Device
menu or click the Launch icon. This will cause the next logger to be launched with either the previous launch
settings or the current logger settings as set in the Launch Time-Saving Options subcategory of the General
preferences.
Note: For additional details on launching the HOBO U30 Station, see Working with the HOBO U30 Station.
Multiple Logging Intervals
Some loggers can be configured with multiple logging intervals, which allow you to define separate intervals for
different phases of the deployment.
To configure multiple logging intervals:
1. From the Device menu, select Launch.
2. In the Launch Logger window, click the Add New Interval button for each interval you wish to add (the
maximum number of intervals allowed varies by logger model). If there is no Add New Interval button,
then the logger does not support multiple logging intervals.
3. Set the hours, minutes, and seconds for each interval, and the number of samples you want the logger
to record at each interval.
4. Use the Start and End times in the Duration column to decide how many samples to record at each
interval.
logger's memory, the number of samples and end times are only estimates. Frequent events will
cause the logger to fill up sooner.
1-800-LOGGERS 40 www.onsetcomp.com
Note: Because internal logger events, such as coupler events, do take up some of the
Page 41

HOBOware User’s Guide
5. Set any other launch options and click Start.
To delete an interval, click the Remove button next to the interval in the Launch Logger window.
Fast Logging Intervals
Some loggers can be configured with fast logging intervals, which allow you to log more than once per second, up
to 100 measurements per second (hertz).
To use fast logging intervals:
1. From the Device menu, select Launch.
2. In the Launch Logger window, click the Fast button. If there is no Fast button, then the logger does not
support fast logging intervals.
3. Choose a logging frequency from the Hertz drop-down list or enter the logging interval in decimal
form in the Sec field.
4. Set any other launch options and click Start.
Notes:
•
A logger cannot communicate with a computer or shuttle while it is logging at a fast interval. The
logger will stop logging if you connect the logger to a computer, base station, or shuttle while it is
logging in fast interval mode.
• Be aware that a fast logging interval typically means a very short logging duration. Make sure the
logger will run long enough to collect the data you need. Disabling unnecessary channels can extend
the logging duration and help to compensate for decreased duration while operating in fast interval
mode.
• Because fast logging deployments are so brief, the logger must be launched with a coupler or button
start. Follow the instructions that came with your logger for a trigger (coupler or button) start. If the
logger has a light, it will flash quickly when logging begins.
Setting a Default Action on Multiple U-Series Devices
By default, HOBOware does not take any action when you connect a device. You can change this behavior by
setting a default action to Launch, Readout, or Get Status. This can save you time when working with multiple
loggers of the same type. Note: This feature is only available with HOBOware Pro and U-Series loggers.
To set a default action:
1. From the Device menu, select Default Action.
2. Select Launch, Readout, or Get Status.
If you set the default action to launch, you can also change the preferences to automatically populate the Launch
Logger window with the same settings as the previous launch. This is helpful if you are launching numerous loggers
of the same type with the same settings. To set this preference:
1. Select Preferences from the File menu in Windows or the HOBOware menu in Macintosh.
2. Select General and then select Launch Time-Saving Options.
3. For the "Fill launch window with contents of" setting, select Previous Launch.
4. Click OK.
1-800-LOGGERS 41 www.onsetcomp.com
Page 42

HOBOware User’s Guide
When a device is connected, the default action you set will take place automatically. For example, if you chose
Readout, HOBOware Pro will read out the logger immediately. You can then disconnect that logger, connect
another logger, and the next logger will be read out automatically. If you connect a shuttle, the shuttle's new files
will be offloaded automatically. Similarly, if you chose Launch for the Default Action, the Launch Logger window
will open automatically when you connect the logger. The next time you connect a logger of the same time, the
Launch Logger window will open automatically and be populated with the previous launch settings if you
configured the Launch Time-Saving Options in the Preferences. A note will appear in the Launch Logger window
when this preference is in use.
Important Note for Windows: The first time you connect a device, the Default Action may not be triggered. After
the device has been connected to the computer and disconnected at least once, the Default Action should then be
triggered.
Using Launch Utilities
There are several utilities available from the Launch Logger window for setting up customized data series,
configuring alarms, and setting advanced logger options. These utilities vary depending on the type of logger you
are using. They include:
• Scaling
• Filters
• Alarms
• Advanced Sensor Properties: Pulse Frequency and Lockout Time
• Advanced Sensor Properties: Calibration
• Advanced Sensor Properties: Occupancy
• Statistics: Maximum, Minimum, Average, and Standard Deviation
• Filtered Series vs Statistics Logging
• Burst Logging
Filter Series at Launch
As part of the launch setup, you can create a filtered series that automatically calculates additional values, such as
maximum, minimum, average, or total, for a set interval upon readout of the logger. The filtered series is saved as
an additional series in the datafile so it is always available when plotting your data. This saves you the time of
manually filtering data for each series after readout using the regular HOBOware filter tool, although this tool is
still available should you need to further filter data later.
To set up a filtered series at launch:
1. Select the channel, or sensor type, you wish to filter.
2. Select the type of filter and the interval you wish to use. If you select an interval of week or month,
select "First data point" for the filter to start on the date and time of the first logged data point or
select the day of the week or month you want the filter to start (the filter will start at midnight on the
1-800-LOGGERS 42 www.onsetcomp.com
Page 43

HOBOware User’s Guide
day selected). In this example, the type of filter is "Average Temperature" in each month starting with
the first data point. Note that filters vary depending on the channel's measurement type.
3. Edit the Resultant Series Name as desired. Click
4. The newly created series is added to the Filtered Series list as shown below. To make a change to a
filtered series, either double-click the series name or select the series name and click Edit. To delete a
filtered series, select the series name and click Delete.
Create New Series.
5. Repeat steps 1 through 4 to create additional filtered series. Not only can you create filtered series for
all channels, but you can also create multiple filtered series on a single channel (for example, you can
show the maximum, minimum, and average temperature for a single temperature channel).
6. Click
7. After you launch the logger and read it out, the filtered series will automatically be listed in the Plot
Notes:
Done when finished. The number of filtered series that you created is displayed on the Filter
button in the Logger Launch window.
Setup dialog, from which you can select the series you wish to plot.
GMT offset for the filtered series, the data points will not reflect that change. They will continue to be
filtered based on times within the original GMT offset at launch.
Note: If you change the
• Loggers launched in HOBOware 3.2 with series created by the Pulse Scaling, Linear Scaling, and kWh
Data Assistants or with filtered series cannot be read out in earlier versions of HOBOware.
1-800-LOGGERS 43 www.onsetcomp.com
Page 44

HOBOware User’s Guide
• Filtered series created at launch time are not available for use with the Barometric Compensation,
Grains Per Pound, Conductivity, or Dissolved Oxygen Data Assistants.
See also:
• Filtered Series vs. Statistics Logging
Data Assistants Window (Scaling)
When you run a Data Assistant from the Launch Logger window, you can create a derived series, which is an
additional data series automatically calculated each time you read out the logger. The Data Assistants window lists
only those assistants available for the currently selected sensor and logger at launch time. There may be other
Data Assistants available for use after reading out the logger.
To set up a derived series with a Data Assistant:
1. Select the Data Assistant you wish to use and click Create.
2. Select the information, or scaling parameters, you want the series to contain and click Save.
3. The new series appears in the My Derived Series list. Create additional series as desired.
To make a change to a derived series, either double-click the derived series name or select it and then
click Edit.
To delete a derived series, select the series and then click Delete.
4. After you have finished creating or editing the derived series, click Done. Depending on the type of
logger you are using, the total number of derived series created appears on the kWh and/or Scaling
buttons in the Launch Logger window. Derived series are also listed in the Status window.
After you launch the logger and read it out, the derived series will automatically be listed in the Plot Setup
dialog, from which you can select the series you wish to plot.
Notes:
• Loggers launched in HOBOware 3.2 with series created by the Pulse Scaling, Linear Scaling, and kWh
Data Assistants or with filtered series cannot be read out in earlier versions of HOBOware.
• When setting up kWh or scaling for UX90 series loggers, the scaled series information will appear on
the LCD screen on the logger. In addition, only the Energy series appears on the LCD screen when
configuring kWh. Average power and cost series will not display on the screen; they are available in
HOBOware only.
• Although it is possible to set up more than one scaling value for each sensor on the HOBO 4-Channel
Analog logger (UX120-006M), only the first scaling value for that sensor will be used.
Configure Alarms
You can set an alarm to trip when a sensor reading rises above or falls below a specified value on certain logger
models. Note: The U30 Station also has alarms capability; see Setting Alarms on a HOBO U30 Station for more
details.
To set an alarm:
1. If the Alarms window is not already open, click the Alarms button from the Launch Logger window. If
there is no Alarms button, then the logger does not have alarm capability. If the Alarms button is
disabled, be sure you have enabled logging on a sensor that supports alarms. If the Alarms button is
disabled for MX, UX100, or UX120 series loggers, make sure the Logging Mode is not set to Burst.
1-800-LOGGERS 44 www.onsetcomp.com
Page 45

HOBOware User’s Guide
Alarms are not available for these loggers when the Logging Mode is set to Burst in the Launch Logger
window.
2. In the Alarms window, select the sensor that you want to have an alarm. Note: The example below is
for a UX100 series logger. Any differences for other logger models are noted in these steps.
3. Select the High Alarm checkbox if you want an alarm to trip when the sensor reading rises above the
high alarm value. Type the reading next to the High Alarm checkbox or drag the red upper slider. In
this example, we've set an alarm to trip when the temperature rises above 85°F.
4. Select the Low Alarm checkbox if you want an alarm to trip when the sensor reading falls below the
low alarm value. Type in the reading next to the Low Alarm checkbox or drag the blue lower slider. In
this example, we've set an alarm to trip when the temperature falls below 32°F.
Note: The actual values for the high and low alarm limits are set to the closest value supported by the
logger. For example, the closest value to 85°F that the UX100 series logger can record is 84.990°F and
the closest value to 32°F is 32.043°F. In addition, alarms can trip or clear when the sensor reading is
within the logger specifications of 0.02°C resolution. This means the value that triggers the alarm may
differ slightly than the value entered. For example, if the High Alarm is set to 75.999°F, the alarm can
trip when the sensor reading is 75.994°F (which is within the 0.02°C resolution).
5. Set the duration for out-of-range samples before an alarm is tripped.
6. Select either Cumulative or Consecutive for the Sensor Alarm Mode (select logger models only). If you
select Cumulative, then the alarm will trip when the time the sensor is out of range over the course of
the deployment is equal to the selected duration. If you select Consecutive, then the alarm will trip
when the time the sensor is continuously out of range is equal to the selected duration. For example,
the high alarm for temperature is set to 85°F and the duration is set to 30 minutes. If Cumulative is
selected, then an alarm will trip once a sensor reading has been at or above 85°F for a total of 30
minutes since the logger was configured; specifically, this could be 15 minutes above 85°F in the
morning and then 15 minutes above 85°F again in the afternoon. If Consecutive is selected, then an
alarm will trip only if all sensor readings are 85°F or above for a continuous 30-minute period.
7. Choose how long the logger should maintain the sensor or visual alarm once it has tripped (select
logger models only). Select "Host has relaunched logger" if you want the alarm to remain visible on the
LCD until the next time you relaunch the logger. Select "Sensor reading within limits" if you want the
1-800-LOGGERS 45 www.onsetcomp.com
Page 46

HOBOware User’s Guide
alarm to clear once the sensor reading returns to the normal range between the high and low alarm
limits. Select "Cleared with button press" if you want the alarm to remain on and visible on the LCD
until you press the Alarm button on the logger (select logger models only).
8. U14-00x loggers only: You can set the Relay Contacts to Normally Open or Normally Closed as
described in the logger manual. Click the Test Set Alarm button to test the relay switches. Deselect the
"Set Alarm on Low Battery" checkbox if you do not want an alarm to trip when the logger's battery is
running low.
9. MX1102 loggers only: You can select Use Audible Alarm if you want a beep to sound on the logger
every 30 seconds when the sensor alarm trips. The beeping will continue until the alarm is cleared
from the software, a button on the logger is pressed, or 7 days have passed. Battery life will be slightly
reduced when this setting is enabled. It is recommended that you only enable this feature if you have
regular access to the logger so that you can easily turn off the beeping.
10. Click OK to save the alarm settings and return to the Launch Logger window.
Once the logger is launched, alarms will trip as determined by these settings. For UA-001 loggers, a "high" or
"low" LED will blink when an alarm is tripped; alarms are checked at every logging interval. For other models,
logger alarms will display on the LCD screen. The alarm limits are checked when the logger's LCD screen
refreshes. See the logger manual for details on LCD screen refresh rates.
When you read out the logger, high and low alarm levels will be displayed on the plot. In the example below,
the temperature rose above 85°F so those readings are in the red, or high alarm, portion of the plot. The
temperature never fell below the low alarm limit, which is the blue portion at the bottom of the plot. Some
logger models also display alarm events showing when the alarm tripped (and cleared if applicable). In this
example, there are "Chan 1 Alarm Tripped" and "Chan 1 Alarm Cleared" events showing when the temperature
alarm tripped and cleared. The "Chan 1 Alarm Cleared" event contains the value that was furthest out of range
for the sensor before the alarm cleared (see the Points table for the actual value).
Advanced Sensor Properties: Pulse Frequency and Lockout Time
Use the Advanced Sensor Properties window to set the maximum pulse frequency for raw pulse channels and to
specify a lockout time for raw pulse and event channels, which prevents false readings from mechanical sensors as
their relay state changes.
Setting maximum pulse frequency is not required, but it can help optimize logging duration. The maximum pulse
frequency, multiplied by the logging interval, determines the maximum count of pulses possible within each
interval. The logger then can use this value to adjust the amount of memory (bits) used to log each data point. This
means the logger uses memory as efficiently as possible, which in turn maximizes logging duration.
1-800-LOGGERS 46 www.onsetcomp.com
Page 47

To configure maximum pulse frequency and lockout time:
1. Select the sensor that corresponds with the pulse channel you wish to configure.
2. Set the maximum pulse frequency, which controls how many pulses per second can be processed by
the logger on a single pulse channel. The option to set the maximum pulse frequency is only available
for raw pulse channels (sensors for which you have selected Raw Pulse as the sensor type in the
Launch Logger window). Refer to the specifications in your sensor or device documentation for
recommended maximum pulse frequency values. In general, the larger the maximum pulse frequency,
the shorter the logging duration will be for the deployment. Note that the pulse frequency ranges in
this window vary depending on the logger model.
HOBOware User’s Guide
3. Click the "Apply lockout time" checkbox if you wish to specify a time period when pulses will be
ignored. Select the lockout time value from 1 to 10. On sensors with both pulse frequency and lockout
time settings, lockout time will affect the maximum pulse frequency: the higher the lockout time, the
lower the maximum pulse frequency will be.
Notes:
• If the logger has multiple sensors, then all sensors will have the same lockout time. This means if
you are using multiple sensors with different lockout time requirements, this may result in lost
pulses or false pulses.
• Lockout time is only available for raw pulse channels and event channels.
• When lockout time is enabled, you can specify a value from 1 to 10 (with a default of 5), which is
then multiplied by 100 milliseconds for a range of 0.1 to 1 second. The available range for the
maximum pulse frequency is automatically recalculated based on the lockout time. For
example, if the lockout time is set to 2, the maximum pulse frequency range changes to 0.01 to
5 Hz. The maximum pulse frequency also varies depending on the logger model. Refer to the
specifications in the logger documentation for maximum pulse frequency (documentation is
also available at http://www.onsetcomp.com/support/manuals).
4. Click Save. Note that the selections will not take effect in the logger until you launch it.
Advanced Sensor Properties: Calibration
Use the Advanced Sensor Properties window to set the calibration method used for internal light or motor sensors
in UX90 series data loggers. The default calibration method is to "calibrate from logger," which is an autocalibration procedure using the Calibrate button on the logger. Alternatively, you can set the calibration method to
a maximum or minimum sensitivity level as defined by HOBOware. To change the calibration method:
1. Select the sensor that corresponds with the internal light/motor channel you wish to configure.
2. Select "Calibrate from logger" to use auto-calibration or select "Set to maximum or minimum
sensitivity" to use HOBOware for calibration. See below for more details on both procedures.
1-800-LOGGERS 47 www.onsetcomp.com
Page 48

HOBOware User’s Guide
3. Click Save. Note that the selections will not take effect in the logger until you launch it.
Calibrate from Logger
Calibrating from the logger with the calibration button, also called auto-calibration, is used to calibrate the ON and
OFF threshold of the logger to achieve reliable readings in an environment where motor or light levels are
unknown prior to deployment or where logger light levels are variable. In the auto-calibration process, the light
level or the AC magnetic field for a motor sensor is measured via a built-in analog-to-digital converter and the
resulting value is used to generate a calibration threshold.
The logger has a built-in hysteresis level of approximately 12.5% for the light sensor and 6.25% for the motor
sensor to prevent the sensor from toggling between ON and OFF when the signal level is near the calibration
threshold. This plot shows how the logger handles hysteresis. The logger interprets the signal as ON until it drops
below the lower level of the calibration threshold. Once it switches to off, the signal will not switch back to ON
until it bypasses the upper limit of the calibration level.
When auto-calibrating from the logger (button calibrating):
1. Deploy the logger near the light/motor to be monitored. Turn the light or motor on.
2. Press the Calibrate button for 1 second. The LCD screen will display the signal strength of the
light/motor. The signal strength should ideally be at least 3 bars. Orient the logger as necessary to
increase the signal strength. The signal strength indicator will remain on the display for ten minutes or
until calibration is complete.
3. Press the Calibrate button for 3 seconds while “HOLD” appears on the LCD screen. For the light sensor,
move your hand away from the logger to prevent shadowing. The logger will count down to the autocalibration and then display either “PASS” or “FAIL” after calibration is complete.
1-800-LOGGERS 48 www.onsetcomp.com
Page 49

HOBOware User’s Guide
4. If the auto-calibration fails, point the sensor directly at the light or position it closer to the motor
source and then repeat these steps.
Set to Maximum/Minimum Sensitivity
If you cannot manipulate the light source or access the motor, you can set the calibration level in this window. The
lower the light/magnetic field level, the higher the sensitivity needs to be to record changes between ON and OFF
conditions. For light sensors, the maximum sensitivity is approximately 100 lux (for rooms with low light levels,
such as residential environments) and the minimum sensitivity is approximately 500 lux (for rooms with high light
levels, such as retail environments). For motor sensors, the maximum sensitivity is approximately 40 mG (for a
weak magnetic field) and the minimum sensitivity is set to approximately 100 mG (for a strong magnetic field).
Advanced Sensor Properties: Occupancy
Use the Advanced Sensor Properties window to set the timeout value for an occupancy sensor (UX90-005x/006x
models). The timeout value is the period of inactivity required for the sensor to consider the area unoccupied. The
timeout value is set to 1 minute by default. You can change this to one of the preset values or enter a custom
value.
To change the timeout value for an occupancy sensor:
1. Select the sensor that corresponds with the occupancy channel you wish to configure.
2. Select a preset timeout value as shown in the example below or select Custom and enter your own
value in minutes and seconds.
3. Click Save. Note that the selections will not take effect in the logger until you launch it.
Statistics: Maximum, Minimum, Average, and Standard Deviation
You can configure UX100 series and some UX120 series loggers to calculate maximum, minimum, average, and
standard deviation statistics for all enabled sensors during logging at each logging interval based on samples taken
at a rate you specify. This will result in up to four additional series per sensor that record the following information
at each logging interval:
• The maximum, or highest, sampled value,
• The minimum, or lowest, sampled value,
• An average of all sampled values, and
• The standard deviation from the average for all sampled values.
For example, let’s say both the temperature and RH sensors have been enabled, the logging interval is set to 5
minutes and the sampling interval is set to 30 seconds (with maximum, minimum, average, and standard deviation
all enabled). Once logging begins, the logger will measure and record the actual temperature and RH sensor values
every 5 minutes. In addition, the logger will take a temperature and RH sample every 30 seconds and temporarily
1-800-LOGGERS 49 www.onsetcomp.com
Page 50

HOBOware User’s Guide
store them in memory. The logger will then calculate the maximum, minimum, average, and standard deviation
using the samples gathered over the previous 5-minute period and log the resulting value(s). When reading out the
logger, this would result in 10 data series (not including any derived series, such as dew point): two sensor series
(with temperature and RH data logged every 5 minutes) plus eight maximum, minimum, average, and standard
deviation series (four for temperature and four for RH with values calculated and logged every 5 minutes based on
the 30-second sampling).
Notes:
• Statistics are not available for logging if Normal or Burst has been chosen as the Logging Mode in the
Launch Logger window.
• On thermocouple loggers, statistics are only available on thermocouple channels and not on the
internal temperature channel.
• Maximum, minimum, and average statistics can be logged for a HOBO Plug Load logger (UX120-018),
but they are configured differently than the following steps for the UX100 series and other UX120
series loggers. In addition, average statistics are not displayed on the LCD screen for this logger. The
maximum and minimum values displayed are based on the entire deployment. See Launch Options for
a HOBO Plug Load logger (UX120-018) for details.
To configure statistics:
1. If the Statistics window is not already open, select Statistics from the Logging Mode drop-down menu
in the Launch Logger window. Or, if Statistics has already been configured, click the Edit button.
2. Click the Maximum, Minimum, Average, and Standard Deviation checkboxes for each of the statistics
you want to calculate during logging. Note that Average is automatically selected when selecting
Standard Deviation.
calculated for all sensors (except battery voltage). For example, if both the temperature and RH
sensors have been selected in the Launch Logger window and you select Average, then the average
will be calculated for both temperature and RH. In addition, the more statistics you record, the shorter
the logger duration and the more memory is required. For MX1102 loggers: You can also select
Current Reading if you want to log the sensor readings at each logging interval.
3. Set the sampling interval, which must be less than and a factor of the logging interval. Choose either a
preset sampling interval or select Custom and enter your own sampling interval. Keep in mind that the
more frequent the sampling rate, the greater the impact on battery life.
Important: Statistics apply to all enabled sensors; every selected statistic will be
4. Click OK when done. This will return you to the Launch Logger window. Click the Edit button next to
Logging Mode in the Launch Logger window to make additional changes.
1-800-LOGGERS 50 www.onsetcomp.com
Page 51

HOBOware User’s Guide
Once logging begins, press the Alarm/Stats button on the logger for 1 second to cycle through the current
maximum, minimum, average, and standard deviation data (as applicable) on the LCD screen (it is not available in
the HOBOware Status window). You can plot the statistics series once you read out the logger.
Filtered Series vs. Statistics Logging
Some logger models support filtered series and statistics logging, both of which involve calculating maximum,
minimum, and average values that you can plot after the logger is read out. Both are accessed from the Launch
Logger window (for filtered series, click the Filters button; for statistics logging, select Statistics as the Logging
Mode or for a UX120-018 logger, select the Max, Min, and Avg checkboxes for each sensor). However, there are
some key differences between the two features. Essentially, statistics logging is performed at the sampling interval
of the logger while filters include data accumulated from a series of logged data points.
The following table compares filtered series to statistics logging so that you can choose the best solution for your
deployment. Note: There is also another filtering option available after you read out the logger, which is available
from the Filter button on the toolbar. This allows you to create filtered series based on the data in the plotted
datafile. For more information on filtering after reading out a logger, see Filtering a Series.
Filtered Series Statistics Logging
What logger models work
with this feature?
Which sensors does this
apply to?
Which measurement types
are compatible?
Can I view the data on the
logger's LCD screen (if
available)?
What kind of data can be
calculated with this feature?
How often can data be
calculated?
All logger models. Only UX100, MX, and some UX120
series loggers.
Only those that you select; you must set up
individual filters for each sensor.
All measurement types, including state,
event, pulse, and runtime.
No, filtered series are only available after
the logger is read out.
Maximum, minimum, and average;
standard deviation is not available.
By day, hour, minute, or second using
samples taken at the logging interval. The
filter interval should be greater than the
logging interval. It is also recommended
that it is a multiple of the logging interval
so that every filter interval has an equal
number of samples.
Automatically calculated for all
enabled sensors (each sensor
selected in the Launch Logger
window except for Battery if
applicable)
loggers, which require selecting
Max, Min, or Avg for each sensor.
Those supported by the individual
logger.
Yes, you can press a button on the
logger to cycle through each of the
enabled statistics.
Maximum, minimum, average, and
standard deviation (the UX120-018
does not support standard
deviation).
For UX100, MX, UX120-006M, and
UX120-014M: Data is calculated at
each logging interval using samples
taken at the sampling interval. The
sampling interval must be less than
and a factor of the logging interval
(i.e., if the logging interval is set to
10 minutes, statistics cannot be
calculated every hour; the sampling
interval would have to be less than
and a factor of 10 minutes).
For UX120-018: Data is sampled at
an internal logger rate of 16.67 mS
and statistics are logged at each
logging interval.
except for UX120-018
1-800-LOGGERS 51 www.onsetcomp.com
Page 52

HOBOware User’s Guide
Filtered Series Statistics Logging
Can I select different
intervals for each calculated
series?
How is the data recorded? Sensor data is recorded at every logging
Yes, you can select a different interval for
each filter you set up.
interval and filtered data points are
calculated at the rate you specified (for
example, the average temperature is
calculated every hour). This requires more
memory as every sample is recorded.
No, the intervals apply to all
selected statistics.
For UX100, MX, UX120-006M, and
UX120-014M: The logger takes a
sample at every sampling interval,
but only records statistics data at
the logging interval. This requires
less memory as every sample is not
recorded.
For UX120-018: Data is sampled at
an internal logger rate and statistics
are logged at each logging interval.
Burst Logging
Burst logging is a logging mode available for UX100, MX, and some UX120 series loggers that allows you to set up
more frequent logging when a specified condition is met. For example, let's say the logger is recording data at a 5minute logging interval and burst logging is configured log every 10 seconds when the temperature goes above
85°F (the high limit) or falls below 32°F (the low limit). This means the logger will record data every 5 minutes as
long as the temperature remains between 85°F and 32°F. Once the temperature reaches 90°F, for example, the
logger will switch to the faster logging rate and record data every 10 seconds until the temperature falls back
below the high limit (or 85°F in this case). At that time, logging then resumes every 5 minutes at the normal logging
interval. Similarly, if the temperature falls to 30°F, for example, then the logger would switch to burst logging
mode again and record data every 10 seconds. Once the temperature rises back to 32°F, the logger will then return
to normal (fixed interval) mode, logging every 5 minutes.
Notes:
• Burst logging is not available if alarms have been enabled for the logger.
• The Stop Logging option "Never (wrap when full)" is not available when burst logging is configured.
• The actual values for the burst logging limits are set to the closest value supported by the logger. For
example, the closest value to 85°F that the logger can record is 84.990°F and the closest value to 32°F
is 32.043°F.
• Burst logging mode can begin or end when the sensor reading is within the logger specifications of
0.02°C resolution. This means the value that triggers burst logging may differ slightly than the value
entered. For example, if the High Limit for a temperature alarm is set to 75.999°F, burst logging can
start when the sensor reading is 75.994°F (which is within the 0.02°C resolution).
• Once the high or low condition clears, the logging interval time will be calculated using the last
recorded data point in burst logging mode, not the last data point recorded in normal or fixed interval
mode. For example, let's assume the logger has a 10-minute logging interval and logged a data point
at 9:05. Then, the high limit was surpassed and burst logging began at 9:06. Burst logging then
continued until 9:12, when the sensor reading fell back below the high limit. Now back in normal
(fixed interval) mode, the next logging interval will be 10 minutes from the last burst logging point, or
9:22 in this case. If burst logging had not occurred, the next data point would have been at 9:15.
• A New Interval event will appear on the plot (if you select events for plotting in the Plot Setup
window) each time the logger enters or exits burst logging mode.
• On thermocouple loggers, burst logging is only available on thermocouple channels and not on the
internal temperature channel.
1-800-LOGGERS 52 www.onsetcomp.com
Page 53

To set up burst logging:
1. If the Burst Logging window is not already open, select "Burst logging" from the Logging Mode dropdown menu in the Launch Logger window. Or, if Burst logging has already been configured, click the
Edit button.
2. Select the sensor you want to configure for burst logging.
3. Select the High Limit checkbox if you want to set up a condition in which burst logging will occur when
the sensor reading rises above the high limit value. Type in the value or drag the red upper slider.
4. Select the Low Limit checkbox if you want to set up a condition in which burst logging will occur when
the sensor reading falls below the low limit value. Type in the value or drag the blue lower slider.
In this example, both the high and low limits were selected. You may choose only one if you wish.
HOBOware User’s Guide
5. Set the burst logging interval, which must be less than the logging interval. Select either a preset burst
logging interval or select Custom and enter your own interval. Keep in mind that the more frequent
the burst logging rate, the greater the impact on battery life and the shorter the logging duration.
6. Click OK when done. This will return you to the Launch Logger window. Click the Edit button next to
Logging Mode in the Launch Logger window to make additional changes.
Once the logger is launched, the high and low burst logging levels are only checked when the logger's LCD screen
refreshes once every 15 seconds. Therefore, if you set the logging interval to less than 15 seconds and the sensor
reading falls outside the levels, the burst logging will not log until the next 15-second refresh cycle.
Important: If high and/or low limits have been configured for more than one sensor, then burst logging will begin
when any high or low condition goes out of range. Burst logging will not end until all conditions on all sensors are
back within normal range.
Carbon Dioxide Sensor Settings
The CO2 sensor in the HOBO MX CO2 logger (MX1102) requires altitude compensation and regular calibration to
ensure accurate readings are being taken in the location where it is deployed. Both auto and manual calibration
are selected by default when first configuring the logger. Altitude compensation should be used if you are
1-800-LOGGERS 53 www.onsetcomp.com
Page 54

HOBOware User’s Guide
monitoring CO2 at elevations above or below 305 meters (1,000 feet). A manual calibration immediately after
logging begins is recommended for best accuracy.
The following CO
settings are available:
2
• Use manual calibration. Manual calibration is the best way to calibrate your logger. Select this option if
you want to manually calibrate the logger to 400 ppm using the Calibrate button on the logger. This
requires taking the logger outside in fresh air on a dry day or to an indoor location that is unoccupied and
has no connection to a ventilation system for five minutes on a regular basis. This is recommended if the
logger is deployed in a building that is always occupied, if you want the logger to be calibrated more
frequently than every eight days (the normal auto calibration schedule), or if you want to calibrate the
logger immediately after logging begins. Note: Once a manual calibration is performed, the 24-hour auto
calibration is canceled and an auto calibration will be performed eight days from the time the manual
calibration occurred. (Relaunching the logger resets the 24-hour/8-day auto calibration routine).
• Use auto calibration. Select this option if you want the logger to automatically calibrate within the first 24
hours after logging begins and then every eight days thereafter. The logger will be calibrated based on the
average of the three CO
measurements that follow the lowest CO2 value identified during the 24-hour or
2
8-day time period as applicable. Important: Accurate auto calibration requires the building or location
where the logger is deployed to be empty at least once during the eight-day period (for example, an
empty office building during the weekend or overnight will typically have background CO
levels of 400 to
2
450 ppm).
If the logger is deployed in an area where the CO
level does not go down to 400 ppm during the eight-
2
day time period, then manual calibration should be performed regularly instead or inaccurate CO
readings will be reported. If you plan on using auto calibration but the building will be occupied during the
first day after logging begins, then you can use the manual calibration option as well. You can manually
calibrate the logger immediately after logging begins and use auto calibration thereafter. Note: Every time
the logger is launched, auto calibration will occur after 24 hours and then again after eight days unless a
manual calibration is performed first.
2
• Use Carbon Dioxide sensor altitude compensation. Select this option if the logger is deployed at a
location above or below 305 meters (1,000 feet). Type the altitude above or below sea level in either
meters or feet. In normal use, the CO
measurement will vary by approximately 0.135% of the reading for
2
each mbar change in barometric pressure (the sensor is calibrated at 1,013 mbar). Use altitude
compensation when deploying the logger for the best CO
accuracy possible.
2
After you have selected the carbon dioxide sensor settings, click Save. The settings will take effect once the logger
is launched.
Notes:
• If both auto calibration and manual calibration are selected, the logger will automatically calibrate within
24 hours after logging begins unless a manual calibration occurs during that time period. In addition,
when both calibration settings are selected, the eight-day calibration cycle will be reset any time a manual
calibration is performed.
• When the logger is calibrated, a Manual Calibration or Automatic Calibration event is logged and available
in the data file for plotting with a date and time stamp of when the calibration took place.
1-800-LOGGERS 54 www.onsetcomp.com
Page 55

HOBOware User’s Guide
How to manually calibrate the logger:
1. Take the logger outside in fresh air on a dry day where the carbon dioxide level is 400 ppm. You can also
use an indoor location for manual calibration if it is unoccupied and is not exposed to a ventilation
system.
2. Press the Calibrate button on the logger for 5 seconds until it beeps. The logger will then calibrate for 5
minutes. The CO
and Calibrate symbols on the LCD will flash while the calibration is underway. A time-
2
and date-stamped manual calibration event is logged in the data at the end of the 5-minute calibration
sequence.
3. Once the Calibration process is complete, return the logger to its deployment location. Repeat this
process at least once every eight days for best accuracy.
For information about launching the logger, see Launch Options for the HOBO MX CO
Logger (MX1102).
2
For specifications and complete logger information, including additional details on calibration, refer to the product
manual at www.onsetcomp.com/manual/mx1102.
Checking Device Status
The Status window displays real-time information about the attached logger, including the current state of the
logger, logging start time, current readings, and memory used. You can check the status for a logger whether it is
waiting for logging to begin, actively logging (unless it is logging at a fast logging interval), or stopped.
To check the status of a logger:
1. Connect the logger to the computer.
2. Click the Status icon on the toolbar, or select Status from the Device menu. You can also check
the status by clicking the Status button on the Launch window, but this will show details from the
previous launch.
This is an example of the Status window. The information displayed varies depending on the logger that is
connected. See Status window for details on the type of information displayed.
1-800-LOGGERS 55 www.onsetcomp.com
Page 56

HOBOware User’s Guide
Important: Battery power is drained more rapidly while checking status. Keep this in mind when frequently
checking status during a deployment. You can significantly reduce the demand on the battery by adjusting the
Screen Refresh Interval to five seconds or higher (not available on all loggers).
The Status Window
The Status window displays the current status of the logger. If you clicked Status from the Launch Logger window,
then details from the previous launch is displayed. The Status window is divided into three panes: Device
Identification, Device Details, and Current Readings.
Device Identification
The Device Identification pane shows the logger selected for status. It lists the device name and model number,
description entered when the logger was last launched (which is also used as the default file name and title in the
plot), serial number, and firmware number.
Device Details
The Device Details pane shows detailed information about the logger deployment including the following items.
Note that not all of these items are displayed for every logger model.
• Battery Level/Battery State. This is the condition of the battery. Consult the logger documentation
for specifics on battery capacity.
• Memory Used. This is the percentage of logger memory used so far in the deployment. Consult the
logger documentation for specifics on memory capacity. Note that if the battery died during logging,
the Memory Used will be 100% even if only a small amount of the memory was used.
• Stops Logging. This displays the date/time or the condition under which the logger will stop logging.
• Last Launched. This is the date and time, including the offset to Greenwich Mean Time (GMT), when
the logger was last launched. This is not necessarily the time when the first sample was recorded; it is
the time all the launch settings were loaded in the logger.
• Delayed Start (if applicable). If the logger has been launched, but is waiting to start on a particular
date/time or at the next interval, the scheduled start time is shown here in local time.
• Deployment Number. This is the number of times the logger has been launched, including the most
recent launch.
• Logging Interval (if applicable). This is the rate at which the logger was set up to record data. If
multiple logging intervals are available, the interval currently in use (if the logger is logging) will be
shown in bold.
• Sampling Interval (if applicable). This is the rate at which sensors are sampling data in between
the logging interval.
• DO Sensor Cap Information (HOBO U26 Dissolved Oxygen logger only). For HOBO U26
Dissolved Oxygen loggers, the DO sensor cap expiration date, initialization date, and manufactured
date is shown. For more details about the DO sensor cap, see Checking Dates for the HOBO U26
Dissolved Oxygen Logger Sensor Cap.
• Current Status. This is a message that describes the state of the logger. Messages include:
Awaiting Button/Coupler Start. The logger has been launched with a coupler or push button start
(if available). Press and hold down the button on the logger for three seconds to begin logging, or
follow the instructions that came with your logger if it offers a triggered (coupler) start but does
not have a button.
1-800-LOGGERS 56 www.onsetcomp.com
Page 57

HOBOware User’s Guide
Awaiting Delayed Start. The logger will begin recording data at a specific time because the logger
was configured to start on a specific date/time or at the next interval.
Launched, Logging. The logger has been launched is actively recording data.
Logger Is Full. The logger has reached its memory capacity and is no longer recording data.
Logger Is Stopped. The logger is not logging, is not full, and is not awaiting a start.
On Hold for Later Launch. The logger has been launched with a Save Settings start (if available).
Logging is not scheduled to begin, but the launch settings have been entered and saved.
Relay is open/Relay is closed. For the HOBO U30 Station, the current state of the relay is also
displayed.
• Current States, if applicable. This is the current condition of the logger button(s). Refer to the
logger documentation for details on logger operation, buttons, and interval events.
Current Readings
The Current Readings pane lists the latest measurement for each data series. Sensors that measure state changes
do not show current readings. To change the order of series displayed in the Status window, go to the Preferences
and select Display and then Series.
You can also set the Screen Refresh Interval for some loggers. This is the frequency the current readings are
updated, up to 3,600 seconds (one hour). A higher number results in less drain on the logger's battery.
A Contact HOBOlink button also appears at the bottom of the Status window for the HOBO U30 Station only. Click
this button when you want the HOBO U30 Station to connect to HOBOlink. When you click Contact HOBOlink, a
confirmation message is displayed. Once you click Yes, the Status screen will close and then the HOBO U30 Station
will attempt to connect to HOBOlink within 30 seconds. A warning may appear in the event that a live connection
with HOBOlink is already underway.
Notes:
• Readings are displayed for all available sensors, even if they are not being logged. Sensors not being
logged are dimmed.
• If a logger has channels for external sensors, a description and reading will be given for the external
channels even if no sensors are plugged in.
• For event loggers, the event count displayed in Current Readings will always start at zero, even if many
events have already been logged.
• Sensor labels (if applicable) are displayed following the sensor name.
• For station loggers, the location (if defined) is displayed next to the reading.
• If a HOBO U30 Station has an Analog Sensor Port, readings for one or both channels are displayed.
• When a Station logger is logging, the last sample taken by the logger at the last interval will be
displayed.
• The RSSI (Signal Level) is displayed for the HOBO U30/GSM Station. This helps you determine if there
is enough signal strength in the current location for the HOBO U30 Station to contact a cellular tower
for connecting with HOBOlink. Signal level is measured on a scale of 0 to 10, with 0 being no signal, 1
being a weak signal, and 10 being a strong signal
• Battery voltage is displayed for some loggers.
• For acceleration loggers only, color-coded tilt meters display X, Y, and Z-axis tilt graphically (relative to
vertical, assuming that the only acceleration force on the logger is gravity).
1-800-LOGGERS 57 www.onsetcomp.com
Page 58

HOBOware User’s Guide
Stopping a Device
A logger automatically stops recording data when the memory is full (unless it has been configured to never stop
logging) or when the battery runs down. Depending on the launch settings selected, you can also press the
Start/Stop Logging button to stop logging on certain logger models. In addition, you can use HOBOware to stop the
logger manually at any time.
To stop a logger:
1. Connect the logger to the computer.
2. Click the Stop icon
After the logger has been stopped, the data remains in the logger until the next launch. Be sure to read out the
logger before setting up the next launch.
on the toolbar, or select Stop from the Device menu.
1-800-LOGGERS 58 www.onsetcomp.com
Page 59

HOBOware User’s Guide
Chapter 3
Reading Out, Plotting, and Analyzing Data
After a logger has recorded data, you can then do the following:
• Read out the data from the logger
• Plot the data
• Modify the plot if desired
• Use Data Assistants
• Export the data
• Import data
Reading Out Data
To retrieve data recorded by a logger, you must read out the logger. Reading out the logger copies data from the
logger to your computer, allowing you to save the data and plot it. During readout, the logger continues to record
data unless you have stopped it or it is full.
You can also read out many logger types to a shuttle and then offload the datafiles from the shuttle to your
computer. See Offloading and Saving Shuttle Files for more details.
To read out a logger to the computer:
1. Connect the logger to the computer.
2. Click the Readout icon
logging, confirm whether to stop the logger. Click either Don't Stop or Stop as desired.
3. A progress bar displays while the data is being read out. Once the readout is complete, choose a
location and/or a new filename or accept the default location and name to save the data. The default
location is:
• C:\Documents and Settings\<user>\My Documents\HOBOware
(for Windows XP)
• C:\Users\<user>\Documents\HOBOware
(for Windows 7, Windows 8, or Windows 10)
• Users/<user>/Documents/HOBOware
(for Macintosh OS X)
on the toolbar or select Readout from the Device menu. If the logger is still
If you save the file to a different folder, that folder will be the new default save location for future
readouts.
4. Click Save. Most datafiles have a .hobo extension, but station loggers have a .dtf extension. If you are
using HOBOware Pro in secure mode, the file extensions will be .hsec (U-Series loggers) or .dsec
(Station loggers).
5. After saving the data, select the sensors and/or events you wish to display in a graph and click Plot.
See Plotting Data for more details on the options available when plotting.
1-800-LOGGERS 59 www.onsetcomp.com
Page 60

HOBOware User’s Guide
Notes:
• If you elected to not save the data upon reading out, you can still plot the data. However, this plotted
data will not be saved automatically. You will be prompted to save the datafile upon closing the plot if
desired. Or, select Save Datafile from the File menu if you now want to save the data.
• Once a logger is read out, the data will remain in the logger memory until the next time the logger is
launched. Logger memory will automatically be erased once the logger is launched again.
• You can read out some U-Series loggers when the batteries are low if the logger can be powered by a
USB cable. In this case, a warning appears before the readout begins indicating the battery is very low
and that you may experience communications problems. Once the readout is complete, be sure to
replace the batteries as suggested.
• You can bypass the Save window during the readout process by setting the Readout Time-Saving
Options in the General subcategory of Preferences.
Plotting Data
After you read out a logger or open a saved file, you can plot the data with the Plot Setup window like the
following example.
To plot the data:
1. Use the existing description or type a new one. The default description matches the one used when
launching the logger and will be used for the plot title.
1-800-LOGGERS 60 www.onsetcomp.com
Page 61

HOBOware User’s Guide
2. Select the series you wish to view on the plot. Click the All or None button to select or deselect all
series, or click the checkboxes to select or deselect individual series. Series types can include:
• Logged data series, which is a series containing the sensor measurements, state changes, or
statistics (select loggers only) recorded by the logger.
• Derived series, which is a series calculated based on one or more logged data series. This could
be an automatically generated series for a measurement type, such as Dew Point when
temperature and RH is logged. Or, it could be a filtered or scaled series if you configured a
filters or scaling with a data assistant in the Launch Logger window (select loggers only).
• Battery voltage, which lists the logger battery voltage recorded at each logging interval.
3. Change the default units for selected series if desired. You can also change the units for a series after
it is plotted.
4. Select the internal logger events to view on the plot. Click the All or None button to select or deselect
all events, or click the checkboxes to select or deselect individual events. Internal logger events are
individually logged occurrences that can be recorded at any time during deployment, regardless of the
logging interval. These events can include started or stopped logging, low battery, or an alarm trip.
Refer to the logger manual for a complete list of internal events if applicable.
5. Adjust the time zone offset, if necessary. By default, data is shown in the offset used to launch the
logger with HOBOware (not a shuttle). To select a different offset, enter the hours offset from GMT
(UTC) in decimal form. You may find this useful if you logged in multiple time zones, or if you took the
logger to a different time zone after launching it.
6. If data assistants are available, you can use them to create additional series. Select an assistant from
the list and click Process to create a new series.
7. Click the Plot button to generate a plot. The plot is drawn and includes a title, a time axis (x-axis), one
or more value axes (y-axis), and a legend. The data for each series are listed in a points table above
the plot. Details about each series, such as the type of logger and deployment information are listed in
the Details pane to the left of the plot. You can show or hide these elements using the View menu. To
organize several plots, use the Window menu to switch between Tabbed View, Tile Horizontally, or
Tile Vertically.
1-800-LOGGERS 61 www.onsetcomp.com
Page 62

Notes:
HOBOware User’s Guide
• To change the order of series displayed in the Plot Setup window, open the Preferences, select Display
and then Series.
• To change the series and events that are selected by default in the Plot Setup window or to control
whether four possible Light/Occupancy series are derived on supported loggers, open the
Preferences, select Plotting and then Plot Setup.
• To bypass the Plot Setup window when opening a datafile, open the Preferences, select General and
then select Open File Time-Saving Options.
• If a pie chart icon appears in the Plot Setup window, this means the data in the file you are plotting
can also be plotted in a pie chart. See Viewing a Pie Chart for more details.
• On some loggers, the Started and Stopped internal events can only occur once. However, UX100 series
loggers can start and stop logging multiple times in a single deployment (as configured in the Launch
Logger window). Multiple stopped and started events in a single file are not only displayed on the plot
if selected in the Plot Setup window, but the resulting gap that occurs in the data is also represented
in the series. In this example, the logger was stopped at 1:19 and then started again at 2:35; both
events are on the plot. The temperature series shows a break between those two times. That
represents the gap between when logging was stopped and when it resumed, both using the button
on the logger.
Opening Files
HOBOware can open .hobo files from HOBO data loggers, .hproj HOBOware project files, and .dtf files from the
HOBO U30 Station, Weather Station, Micro Station, or Energy Logger. The following files can be opened by
HOBOware Pro:
• .hsec, which are secure files (21 CFR Part 11 Conformance) from U-Series loggers.
• .hproj, which is HOBOware Project file.
• ..dsec, which are secure files (21 CFR Part 11 Conformance) from Station loggers.
1-800-LOGGERS 62 www.onsetcomp.com
Page 63

• .txt, .csv, and most ASCII files can be imported.
To open a file:
1. Double-click a compatible file from Windows Explorer or Mac Finder. Or in HOBOware, click the Open
HOBOware User’s Guide
icon
on the toolbar or select Open Datafile from the File menu.
2. Select one or more files and click Open.
3. Select the series and/or events you wish to view in the plot and click the Plot button. If you selected
multiple files to open, you will be prompted with a Plot Setup window for each file (unless you have
set the preference to automatically plot data as described in General Preferences).
To open a project file:
1. From the File menu, select Open Project.
2. Select a project (.hproj) file and click Open.
Recently opened files are listed in the File menu. From the File menu, select Recent Files and then choose the file
you wish to open. To empty the recent file list, select Recent Files from the File menu and then select Clear Recent
Files.
Opening Files from Unsupported Loggers
Although the following loggers cannot be launched or read out using HOBOware, datafiles from these loggers can
be opened and plotted. All graphing tools, filters, and Data Assistants can be used with the files and data can be
exported to text and project files.
H08 (8-bit)
•
• H08-002-04
• H08-003-04
• H08-004-04
• H08-006-04
• H08-008-04
TBI/WTA
•
• TBI32-20+50
• WTA08-05+37
• WTA08-39+75
• WTA32-05+37
• WTA32-39+75
H08 (12-bit)
•
• H08-031-08
H08-001-04
TBI32-05+37
H08-030-08
• H08-032-08
1-800-LOGGERS 63 www.onsetcomp.com
Page 64

H20
H06
H07
H14
H20-001
•
H06-001-02
•
• H06-002-02
• H06-003-02
• H06-004-02
H07-001-02
•
• H07-001-04
H14-001
•
• H14-002
HOBOware User’s Guide
H12
H12-001
•
• H12-002
• H12-003
Working with Plots
There are several tools available for working with plots.
Tools
There are five tools available on the toolbar for viewing the plot and isolating data.
• Use the Arrow tool to point to and select items on the graph to edit their properties (through a right-
click menu).
• Use the Crosshair tool to zero in on a specific date and time in the plot and any data points associated
with that date and time. Click the Crosshair icon and then place your cursor anywhere on the plot to
draw a red vertical line at a particular point.
• Use the Hand Drag tool to move different areas of the graph into view (panning) or adjust the position
of one series so it can be viewed more easily. This is particularly useful when you are zoomed into the
1-800-LOGGERS 64 www.onsetcomp.com
Page 65

graph and want to see another section of the graph without zooming out and then zooming back in on
the new location.
• Use the Zoom tool to focus on one area of the graph, allowing you to see more detail.
• Use the Subset Statistics tool to view statistics for a particular time span (HOBOware Pro only).
Actions
Use the Actions buttons on the toolbar to perform a number of actions on a plot or a series.
• Use the Zoom In/Zoom Out buttons to keep the plot centered as you zoom.
• Click the Grow Graph at Full Scale button to return to the original, full-scale version of the plot when
the datafile was first opened.
HOBOware User’s Guide
• Click the Open Properties button to open the properties window the plot element that is currently
selected, such as axis, series, legend, or title.
• Use the Gridline buttons to toggle all horizontal or vertical gridlines on and off. You can also toggle
gridlines on and off for each axis individually. Using the arrow tool, double-click an axis to get the Axis
Properties window. Select or deselect the Show Gridlines checkbox to toggle the gridlines for that
axis.
• Click the Point Markers button to toggle the point markers for all series on and off. To show or hide
markers for an individual series, right-click the series to open the Series Properties window. Select or
deselect the Mark Points checkbox to toggle the markers for that series.
• Click the Convert Units button to open the Convert Plot window, which allows you to convert the units
on certain series on the plot to other units (for example, from degrees Fahrenheit to degrees Celsius).
• Click the Filter Series button the Filter Series window, which allows you to add a statistical series to
the plot.
• Click the Pie Charts button if a pie chart is available for the plot (only available on loggers that support
state series)
• Click the Add Graph Label button to open the Graph Label Properties window.
Menus
Use the Edit and View menus to access various controls when working with a plot. You can also right-click an
element in the plot to access many of the same options available from the Edit and View menu and to open
properties windows.
Using the Arrow Tool
Use the Arrow tool to select items on the plot. Click the Arrow icon on the toolbar or press A to select the arrow
tool.
1-800-LOGGERS 65 www.onsetcomp.com
Page 66

HOBOware User’s Guide
If you are currently using another tool and do not want to switch tools, press N on your keyboard to select each
graph item (including hidden items, such as value axes for states or events) in sequence.
The selected item (if visible) is shaded or boxed. You can then right-click the selected item, double-click it, or press
the Enter key on your keyboard to open the Properties window for that item.
To deselect, click an area within the axes that does not have series data. Click the View menu and choose Select
None or press D.
Using the Crosshair Tool
Use the crosshair tool to zero in on a specific date and time in the plot and any data points associated with that
date and time. To use the crosshair:
1. Click the Crosshair icon
2. Click a point on the graph to mark it.
3. Click another point to move the marker.
When you click on a graph, the nearest data point is selected. When series are very close together and the location
you click is between two points, it is possible that the nearest point is not on the series you clicked.
You can also mark the point on the graph by clicking the corresponding cell in the Points table. If you are zoomed
in and click a point in the Points table that is outside the zoom area, the plot will scroll to that area of the graph. To
prevent scrolling in this situation, go to the Preferences, select Plotting and then Points Table & Details Pane.
Deselect the "When selected value in table is out of plot range, drag series to that value.
The plot changes in several ways when the crosshair is in use. The Points table shifts to the row that contains the
data point. Where the crosshair intersects a data point, a square surrounds the data point. The intersection points
are also marked by small color-coded arrows on the left and right value axes.
If the legend is displayed next to the graph, the point values for each series are updated to reflect the crosshair
location. Values are listed in the legend differently depending on whether the data is a logged sample, state, or
event:
on the toolbar or press C.
• Values that are not in parentheses are actual data points logged at the time selected by the crosshair.
• Values in parentheses are estimated because there were no exact values for the series at the time
selected by the crosshair. Zoom in or move the crosshair to see actual values.
• A value of "…" indicates that there is no series data during the time selected. This is seen most
frequently for events. If the time selection falls within an event series, but does not contain an event,
parentheses surround the "…" value.
• A value of "logged" indicates an internal logger event happened at the selected time.
The legend must expand in height to list the point values. If your application window is too small to accommodate
the expanded height, the values will not be added to the legend. You can still refer to the Points table to find the
values of the selected points.
To remove the crosshair from the graph, right-click the plot and select Remove Crosshair or choose remove
Crosshair from the View menu.
Zooming, Panning, and Smart Scaling Plots
You can adjust the viewing area of the plot by zooming, panning, and smart scaling.
1-800-LOGGERS 66 www.onsetcomp.com
Page 67

HOBOware User’s Guide
Zooming
There are two ways to zoom: either by using the zoom tool (or pressing Z) or by selecting Zoom In or Zoom
Out
clicking the right-mouse button to zoom in or out. Use the Zoom In/Zoom Out icons to keep the plot centered as
you zoom.
When zooming:
from the toolbar or the View menu. Use the zoom tool to zoom anywhere on the plot that you select,
• Right-click to toggle between zoom in and zoom out.
• Check the symbol inside the zoom tool to determine the direction you are zooming. A plus sign (+) or
arrows pointing outward will zoom in, while a minus sign (-) or arrows pointing in will zoom out.
• Click an area on the graph inside the axes to zoom one level (a factor of two). Continue clicking to
zoom multiple levels.
• Hold down the left mouse button in one location to zoom continuously. Release the mouse button to
stop zooming.
• Hold down the left mouse button while drawing a rectangle around the area you wish to zoom in on,
then click inside the rectangle. The area inside the rectangle expands to fill the whole graph.
• To constrain the zoom to horizontal or vertical zooming, place the cursor over the axis you want to
zoom and click the mouse button. Hold the mouse button down to continue to zoom. Or, press the X
key while zooming to restrict motion horizontally and press the Y key while zooming to restrict motion
vertically.
• If you are currently working with the crosshair, arrow, or hand tool, you can click the Zoom In/Out
icons on the toolbar to quickly zoom into and out of the middle of the display without changing tools.
• Zooming will not work on an axis that is locked. To unlock an axis, double-click the axis with the arrow
tool and deselect the Lock Axis Scaling and Tick Marks in the Axis Properties window.
Panning
Use the hand drag tool or press H to pan the graph, which is dragging the plot viewing area along the x- or yaxis. Panning is especially helpful when you are zoomed into a detailed plot and want to focus on a different area
without zooming out. Click within the graph and hold down the left mouse button to pan a different section of the
graph into view. The graph follows the movement of the mouse, and the axes are continuously updated in
response to the movement. To stop dragging, release the left mouse button.
To limit dragging to horizontal or vertical panning, place the cursor over the axis you want to drag, hold down the
mouse button, and drag in the direction you want the plot to move. Or, press the X key will dragging to restrict
motion horizontally and press the Y key while dragging to restrict motion vertically. Similarly, click the axis
associated with a series and hold down the left mouse button. Only the series connected with the axis will follow
the movement of the mouse.
Use the hand tool to move different areas of the graph into view or adjust the position of one series so it can be
viewed more easily. This is particularly useful when you are zoomed into the graph and want to see another
section of the graph without zooming out and then zooming back in on the new location.
Panning will not work on an axis that is locked. To unlock an axis, double-click the axis with the arrow tool and
deselect the Lock Axis Scaling and Tick Marks in the Axis Properties window.
Smart Scaling
When you first display a graph, the numerical bounds of the axes are on tick marks. After you have panned or
zoomed, this may no longer be the case. Use smart scaling to correct that. With the hand drag, arrow, or crosshair
1-800-LOGGERS 67 www.onsetcomp.com
Page 68

HOBOware User’s Guide
tool, right-click anywhere on the graph and select SmartScale Graph. This will automatically adjust the axes to end
on tick marks.
Note: You can always return to the original plot view by clicking the View at Full Scale
View menu.
from the toolbar or the
Copying Data Points and the Plot
To copy the data points from the Points Table to paste into other software:
1. Select the data you wish to copy in the Points Table.
2. Press Ctrl+C in Windows or Command-C in Macintosh to copy the data.
Windows: press Ctrl + C
Mac: press Command - C
3. Open any text editor, word processor, or spreadsheet software.
4. Press Ctrl+V in Windows or Command-V in Macintosh to paste the data into the other application.
Fields are delimited by tabs, and records are separated by paragraph returns.
You can also copy the plot as a bitmap for pasting into other programs and documents. To copy the plot:
1. From the Edit menu, select Copy Graph to Clipboard.
2. Go to the other application and paste the plot.
Closing a Plot
To close a single plot, click the on the tab or toolbar, or choose Close from the File menu. On Macintosh, click
the red button in the upper-left corner of the internal frame containing the plot when in Tabbed View. To close all
open plots, select Close All from the File menu.
Important: Any changes you made to the plot are not saved when you close the datafile. You must save the plot as
a project file to preserve the changes. Either select Save Project from the File menu before closing the plot or close
the file and click Save when prompted. If you only want to save an image of the plot, you can paste a bitmap of the
graph into another program and save it there.
Note: If you do not want HOBOware to prompt you to save the plot as a project file when you close it, open the
Preferences. Select Warnings and then select General. Deselect the "Prompt me if there is any remaining unsaved
data when closing plot or application" checkbox.
Viewing a Pie Chart
Pie charts are available in HOBOware Pro for plotted state series, such as those from the UX90 data loggers. This
provides you with a graphical representation of the data for viewing, saving, and printing in addition to the default
line graph. This is particularly useful for the UX90 Occupancy/Light Data Logger (UX90-005x/-006x) because it
allows you to quickly compare when the:
• Lights were on and the room was unoccupied
• Lights were on and the room was unoccupied
• Lights were off and the room was occupied
• Lights were off and the room was unoccupied
1-800-LOGGERS 68 www.onsetcomp.com
Page 69

To view a pie chart:
1. Open a file from a logger with state series and plot the state series and derived series (as applicable)
that you want to view in the pie chart. Note that a pie chart icon appears in the Plot Setup window if
the file you are opening can be plotted in pie chart.
2. Click the Pie Chart button on the toolbar.
3. A pie chart is drawn based on the selected series. In this example, light & occupancy are plotted in the
pie chart. The legend at the bottom of the chart indicates what series each piece of the pie
represents. Percentages for each pie wedge are shown in the yellow boxes.
HOBOware User’s Guide
• To change the series used to generate the pie chart, click the "Select a Series" drop-down
arrow and then click the Update Chart button.
• To change the timeframe used to create the pie chart, change the Start and End Date/Time as
necessary and then click the Update Chart button.
• To reset the pie chart to use the Start and End Date/Time for the current selected series, click
the Reset/Show at Full Scale
button.
• To save the pie chart as an image (.png file), click the Save button.
• To print the pie chart, click the Print button.
1-800-LOGGERS 69 www.onsetcomp.com
Page 70

4. When you are done viewing pie charts, click the Close button.
Notes:
• The pie chart button on the toolbar will only be enabled when one or more state series is plotted. If
you have plotted data and the pie chart button is not enabled as expected, close the plot. Reopen the
file and make sure you select the state series from the Plot Setup window. Note that if the sensor
channels were configured as runtime instead of state, then pie charts will not be available.
• If you merge datafiles, pie charts may not function properly if the time overlaps between merged
series. If you are having difficulty viewing a pie chart for a merged file, try returning to the original
separate files to view the individual pie charts from each file.
• If you are working with a plot that has two series, such as Light and Occupancy and you crop one of
those series, the time range for the pie chart data will be constrained to the shorter of the two series.
• If you paste a new state series into the plot, it will also be available from the Select a Series pull-down
list. You will need to select the series to view it in a pie chart; it will not display automatically.
Printing Plot Elements
Printing a Graph
HOBOware User’s Guide
You can simply print the graph, or you can set up the page and preview it before printing.
To set up the paper for printing the graph:
1. From the File menu, choose Page Setup.
2. Change the paper type, orientation, and margins as necessary and click OK.
3. From the File menu, choose Print Preview.
4. Zoom as necessary.
5. Click the Print icon
without printing.
To print the graph:
1. From the File menu, select Print or click the Print icon
2. Select the appropriate printer, if applicable, and click OK.
to print directly from Print Preview. Or, click Close to exit the preview window
on the toolbar.
Printing Points and Details
You can print all the data in the Points or Details panes. From the File menu, select Print Points (available only with
Java 1.5 or higher) or Print Details.
If you highlight a selection of points with your mouse before choosing Print Points, you will also be given the
option to print only the selected points.
1-800-LOGGERS 70 www.onsetcomp.com
Page 71

HOBOware User’s Guide
Chapter 4
Modifying a Plot
Once data is plotted, there are many things you can do to further refine the plot. This includes:
• Setting Properties for Plot Elements
• Adding a Graph Label
• Selecting a Subset of the Plot (Subset Statistics Tool)
• Moving a Series from Front to Back on a Plot
• Filtering a Series
• Cropping a Series
• Hiding/Showing or Removing a Series from the Plot
• Copying a Series to Another Plot
• Merging Files
• Converting Units
• Undoing or Redoing Plot Changes
• Saving Project Files
Setting Properties for Plot Elements
You can set the properties for all the plot elements, including the axes, series, title, and legend. You can access the
properties window for a plot element by selecting the Arrow tool and then right-clicking that element. Or, rightclick anywhere on the plot and select Other Graph Items and then choose a particular item.
• Setting Axis Properties
• Setting Series Properties
• Setting Legend Properties
• Setting Title Properties
• Setting View Properties
There are also plotting preferences that control the global properties for all plots. To modify these settings, open
the Preferences and select Plotting. With Plotting preferences, you can:
• Show or hide the Points table by default
• Show or hide the Details pane by default
• Include the sensor label in the Points table and Details pane by default
• Customize series lines for specific measurement types
• Set default minimum and maximum values for specific series types on the Value Axis
1-800-LOGGERS 71 www.onsetcomp.com
Page 72

HOBOware User’s Guide
• Enable auto-scrolling to keep marked points in view while zooming
• Automatically select all data series and/or events
• Automatically label the time axis
• Mark all points in a plot by default
• Include the sensor label in the legend
• Control whether horizontal and/or vertical gridlines are displayed automatically
• Set the font style and point size used in plots
• Enable or disable the undo/redo feature
You can also use the Display preferences to set the default unit types and date/time format.
Setting Axis Properties
You can change the appearance of the time axis (x axis) and the value axis (y axis) on the plot. You can customize
the axis name, change the location, bounds, tick marks, color, and more.
To change the axis properties:
1. Double-click the axis in the plot with the arrow tool, or select the axis and click the Properties icon
to open the Axis Properties window.
2. In the Name field, enter up to a 40-character name for the axis. The default name for a value axis is
the unit type (for example, "°F" is the name for a temperature axis and "%" is the name for an RH
axis). The time axis does not have a default name. To add "Time" as the default name for this axis,
open Preferences. Select Plotting and then select Other Options. Enable the "Label the time axis"
checkbox.
3. Change the location of the axis. The value axis can be located on the left or right while the time axis
can be located at the top or bottom
4. By default, tick marks are auto-calculated. Numbers or values are listed next to major tick marks and
minor tick marks are not numbered. To change the default tick marks, select Custom Tick Marks and
then choose the values for Major and Minor tick marks as desired.
1-800-LOGGERS 72 www.onsetcomp.com
Page 73

5. Change the default bounds used on each axis. For the time axis, select the dates and times you want
the axis to display. For the value axis, type the minimum and maximum value you want the axis to
display.
6. You can also modify the appearance of the axis with these options:
• Show Gridlines. This toggles whether gridlines are displayed in the background. Gridlines are
shown by default for the time axis, but not for the value axis.
• Hide Axis. This controls whether the axis is displayed or temporarily hidden.
• Lock Axis Scaling and Tick Marks. This controls whether the axis and associated tick marks
remain in their original position when zooming or navigating with the hand tool. Locking the
axis and tick marks helps to avoid inadvertently zooming or navigating to an area on the graph
without data.
• Color. Black is the default color for the time axis. The color of the value axis matches the series
color by default. You can change the color for either axis as desired.
7. Click Apply to update the plot and keep the Axis Properties window open. Click Done to update the
plot and close the window.
Setting Series Properties
HOBOware User’s Guide
A series is the group of data points you selected to display in the plot. You can change the appearance of a series
on the plot including the line style, point marker, alarm values, associated axes, and color.
To change series properties:
1. Double-click the series you wish to modify or select the series and click the Properties icon
open the Series Properties window.
to
2. Change the default description. Type up to a 40-character name for the series. The series name will be
updated in the legend, series pane, and details pane to the new name you entered.
3. Change the default units. Enter a different unit type as needed. The unit type will be updated in the
legend, series pane, and details pane to the new unit type. Note that if you subsequently convert the
units while viewing the plot, your custom unit type will no longer be displayed. For example, let's say
you change the unit type for a temperature series from °F to "degrees." Then, while viewing the plot,
1-800-LOGGERS 73 www.onsetcomp.com
Page 74

HOBOware User’s Guide
you decide to convert the data points to Celsius. The unit type for the temperature series
automatically changes to °C instead of the custom "degrees" unit that you had entered.
4. Adjust the appearance of the lines with the following options:
• Connect Points. This controls whether the plotted data points in the series are connected with
a line.
• Style. This changes the appearance of the line used to connect the points in a series.
• Width. This changes the width of the line used to connect the points in a series.
• Connect as Steps. This controls whether the lines between the points in a series are connected
as a curve or a step. When this option is selected, the line drawn between points keeps the
value of the previous point until the next point in the series. Connecting as steps is useful
when plotting state or event series.
5. Set High Alarm and/or Low Alarm thresholds. Enabling alarms will show lines on the plot for the series
to indicate a visual threshold over or under which data may be falling (for example, if you want to
quickly see how many points fall below 32 degrees). Alarms are available for sensor measurement
series only, not for state or event series. Select the High Alarm checkbox and type a value relative to
the series where you want the maximum (red) alarm line to appear. Select the Low Alarm checkbox
and type a value relative to the series where you want the minimum (blue) alarm line to appear.
6. Select the Mark Points checkbox to add a marker for each data point in the series. To avoid cluttering
the plot, this option is only enabled by default for series with event data or that have only one data
point. If you enable Mark Points, you can change the shape of the marker and the point size.
7. You can also modify the following:
• Time Axis. This allows you to create an additional time axis for this series. This is useful for
comparing data from two different time periods.
• Value Axis. This changes the axis being used for the series. Choose one of the axes already in
view or select New Value Axis from the dropdown list to create your own.
• Color. This changes the color used for the series.
8. Click Apply to update the plot and keep the Series Properties window open. Click Done to update the
plot and close the window.
Setting Legend Properties
You can modify the Legend displayed on the plot. To change the Legend properties:
1. Double-click the Legend or right-click the plot with the arrow tool and select Other Graph Items >
Legend Properties.
2. In the Legend Properties window, type a name for the Legend if desired.
1-800-LOGGERS 74 www.onsetcomp.com
Page 75

3. Set the location to either the left or right of the plot.
4. Select the Show Border checkbox to have a box around the legend. Deselect this if you do not want
the box around the legend.
5. Click Apply to update the plot and keep the Legend Properties window open. Click Done to update the
plot and close the window.
Setting Title Properties
You can modify the title displayed on the plot. To change the Title properties:
1. Double-click the plot title or right-click the plot with the arrow tool and select Other Graph Items >
Title Properties.
2. In the Title Properties window, change the default name if desired. The name originated from the Plot
Setup window.
HOBOware User’s Guide
3. Set the location of the title to either the top or bottom of the plot.
4. Adjust the font, point size, and style.
5. Click Apply to update the plot and keep the Title Properties window open. Click Done to update the
plot and close the window.
Setting View Properties
You can show or hide certain plot elements. To change the View properties for the plot:
1. Right-click the plot and select View Properties.
2. In the View Properties window, select the Show Legend checkbox if you want the Legend to be
displayed on the plot. Deselect this checkbox if you do not want to see the Legend on the plot.
3. Select the Show Title checkbox if you want a title to be displayed on the plot. Deselect this checkbox if
you do not want to see a title.
4. Select the Show Border checkbox if you want a border to be drawn around the plot. Deselect this
checkbox if you do not want a border around the plot.
5. Click Apply to update the plot and keep the Title Properties window open. Click Done to update the
plot and close the window.
1-800-LOGGERS 75 www.onsetcomp.com
Page 76

HOBOware User’s Guide
Adding a Graph Label
You can add multiple labels to a graph to identify specific points or call attention to a region of the graph. To add a
graph label:
1. Right-click the graph at the desired location and choose Add Graph Label from the pop-up menu to
open the Graph Label Properties window. Or, select Add Graph Label from the Edit menu.
Note: To
change an existing label, double-click the label or select the label and click the Properties
the toolbar.
icon on
2. Type up to a 24-character name for the label.
3. Select the Attach to Series checkbox to attach the label to a point on the series. Choose the name of
the series to attach it to from the drop-down list. Select the Include Data Value in Label checkbox to
display the value of the point in the label. Select the compass point to described the preferred
location of the label relative to the labeled point.
the label (space permitting) with respect to the data point it references. This is only available when
the label is attached to a series.
4. Adjust the appearance of the label with these options:
Important: This indicates the preferred location of
• Draw Label Over Colored Background. Select this option if you want the label to appear in a
box with a colored background.
• Label Color Background. If you chose to give the label a colored background, click this button
to select a background color.
• Label Color Text. Click this button to select a color for the label text.
• % Transparency. Adjust the label's transparency, which refers to the ability to see the graph
through the label. At 0%, the label is opaque and you cannot see the graph through it. At
100%, the label is invisible and only the graph can be seen.
• Font. Select a font for the label text.
1-800-LOGGERS 76 www.onsetcomp.com
Page 77

HOBOware User’s Guide
• Font Size. Select a font size for the label text.
5. Click Apply to update the plot and keep the Graph Label Properties window open. Click Done to
update the plot and close the window.
Use the hand tool
drag the label to attach it to any other point on the graph. (The hand tool must be close enough to a point to
attach the label.) Labels that are attached to a point will move with that point during zooming and panning. Freefloating labels do not move during zooming and panning.
To delete a label from the graph, select the label you wish to remove and press the Delete key, or right-click the
label and choose Remove from the menu that appears.
to drag the label to another location if necessary. If the label is attached to a series, you can
Selecting a Subset of the Plot (Subset Statistics Tool)
The Subset Statistics tool allows you to select a subset, or a range of data, of a graph, and display the maximum,
minimum, average, and standard deviation for the measurements in that range (HOBOware Pro only).
To use the Subset Statistics tool:
1. Select the Subset Statistics tool
Statistics Tool icon
.
2. Draw the subset on the plot. With the left mouse button, click within the graph to define the start
time of the subset and drag to the right. Release the mouse button when you reach the end time of
the subset.
The graph subset appears in the graph and the subset statistics pane appears beneath the Details pane as in the
example below. Two black vertical indicators appear on the graph to show the range of the subset with date/time
labels marking the start and end of the range. To move the vertical indicators and date/time labels, press the up or
down arrow keys (make sure the Subset Statistics Tool is selected first).
from the toolbar. The mouse cursor will change to the Subset
A subset bar is added to the time axis. Double-click this bar to toggle between showing and hiding the vertical
indicators and date/time labels. If the plot has one than more time axis, this bar is attached to the one that was
created when you first displayed the plot. Click inside the subset bar to drag it to a different time axis.
To quickly adjust the start or end of the subset, click and drag the left or right end of the subset bar on the time
axis (make sure the Subset Statistics Tool is selected first). You can also use the arrow keys to move the left
boundary and Ctrl+arrow key (or Command-arrow key on Mac) to move the right boundary. Place the cursor in the
middle of the subset bar and drag it to move the entire range left or right.
1-800-LOGGERS 77 www.onsetcomp.com
Page 78

To further refine the subset range:
HOBOware User’s Guide
1. Click the checkmark icon
in the Subset Statistics pane.
2. The two checkboxes are enabled by default. Deselect "Show subset statistics for time bounds below"
if you want to remove the subset from the current time axis. Note that only one time axis can have a
subset. If you enable subset statistics for one time axis when another time axis already has a subset,
the other time axis's subset will be removed.
Deselect the "Show times, duration, & vertical indicators on graph" checkbox to toggle the display of
subset indicators and labels on the plot. If you disable this option, the Subset Statistics pane and the
shaded subset statistics bar on the time axis will still remain visible.
3. The easiest method to set a range for the subset is to indicate a fixed Start Date/Time or End
Date/Time and then indicate the duration. Alternatively, you can enter both a Start Date/Time or End
Date/Time without specifying a duration.
For example, to set a range beginning at 8:00 a.m. on 3/18/13 with a duration of 2 hours, set the Start
Date to 3/18/13 and the Start Time to 8:00:00.000 AM. Select the Anchor Start Point checkbox and set
the Duration to 2 hours as shown below.
1-800-LOGGERS 78 www.onsetcomp.com
Page 79

As another example, to set a range of 1 day ending at 10:00 PM on 3/18/13, set the End Date to
3/18/13 and the End Time to 10:00:00.000 PM. Select the Anchor End Point checkbox and set the
Duration to 1 day.
To remove the subset and related elements:
• Right-click the plot and select Remove Subset Stats,
• From the View menu, select Remove Subset Stats, or
• Click the X icon in the upper-right corner of the Subset Statistics pane.
HOBOware User’s Guide
Moving a Series from Front to Back on the Plot
You can shuffle the order of series by moving a series to the front or back on the plot. This is helpful if one series is
hidden behind another. It also changes the order of series in the Details pane, Points table, and the legend.
To change the order of the series:
1. Select the arrow tool
2. Select the series you wish to move.
3. Right-click and select either Bring Series to Front or Send Series to Back.
.
Filtering a Series
You can filter data from existing series in the plot to create a new statistical series showing calculated data such as
average, minimum, and maximum values over a specified period of time. This filter applies to existing data files
only; there is an additional filter tool available when launching most loggers.
To filter a series in a plot:
1. Select the series with the arrow tool
select Filter Series.
2. Select the statistic to use for the filter and the interval. If you select an interval of week or month,
select "First data point" for the filter to start on the date and time of the first logged data point or
select the day of the week or month you want the filter to start (the filter will start at midnight on the
day selected). In the following example, "Maximum Temp" in each month is selected starting with the
first data point. Note that the options available vary depending on the series type.
, right-click it and select Filter Series. Or from the Edit menu,
1-800-LOGGERS 79 www.onsetcomp.com
Page 80

HOBOware User’s Guide
3. Type a Resultant Series Name or use the default name entered based on the filter type.
4. Click OK. The new series is added to the graph, the Details pane, and the Points table. Note that when
you apply a filter, the graph rescales to accommodate all the displayed data.
Cropping a Series
You can crop one or more series in a plot to focus on a particular date/time range instead of the default range in
HOBOware Pro. To crop a series:
1. With the arrow tool
series, right-click anywhere in the plot (without a series selected).
2. In the Crop Series window, make sure the series you want to crop is selected. Deselect any series you
do not want to crop.
3. Enter the new Start Date/Time and End Date/Time for the series. The boundaries are limited to the
minimum and maximum date/time of the Time Axis. If subset statistics have been added to the plot,
the start and end points on the subset will be redefined automatically based on how it is affected by
cropping.
, right-click the series you wish to plot and select Crop Series. To crop multiple
4. Click the Crop button. The plot displays the cropped series. The Details pane and Points table are both
updated to reflect the new cropped series.
Hiding/Showing or Removing a Series from a Plot
You can hide or show a series in the plot and in the Points table. This is helpful if the datafile contains multiple
series and you cannot easily view them all together. You can then show or hide each series as you wish.
You can hide a series by:
• Right-clicking the series in the Details pane and selecting Hide Series.
• Selecting the series and then selecting Hide Series from the Edit menu.
• Selecting the series, right-clicking the plot, and then selecting Hide Series.
Press and hold the Shift key while hiding the series to prevent the plot from rescaling.
Once a series is hidden, it is grayed out in the Details pane. You can show the series again by:
• Right-clicking the series in the Details pane and selecting Show Series.
• Selecting the series in the Details pane and then selecting Show Series from the Edit menu.
• Selecting the series in the Details pane, right-clicking the plot, and then selecting Show Series.
1-800-LOGGERS 80 www.onsetcomp.com
Page 81

HOBOware User’s Guide
To show all previously hidden series, right-click a series in the Details pane, right-click the Plot, or select the Edit
menu and then select Show All Hidden Series.
You can also completely remove a series from the Details pane as well as the plot and the Points table. If you
remove a series, it can only be recovered by reopening the original datafile or a saved project file that contains
that series. To remove a series:
1. Select the arrow tool
2. Click the series you wish to remove and press the Delete key or select Remove from the Edit menu.
You can also right-click the series in the plot and click Remove or right-click the series in the Details
pane and select Remove Series.
from the toolbar.
Copying a Series to Another Plot
To copy a series from one plot to another:
1. Open the source plot (the plot that includes the series you want to copy) and the destination plot (the
plot where you want to paste the series).
2. In the source plot, choose the arrow tool
menu, select Copy Series or right-click the series and select Copy Series. Or, press Ctrl+C on Windows
or Command-V on Macintosh.
3. Switch to the destination plot. From the Edit menu, select Paste Series or right-click the plot with the
arrow tool and select Paste Series. Or, press Ctrl+V on Windows or Command-V on Macintosh.
The new series is added to the graph, the Details pane, and the Points pane.
Overlaying Series
If the series you want to copy to the plot was logged at a different time, you will need to make some adjustments
to the plot in order to view the series together.
and select the series you want to copy. From the Edit
1. Display the source plot(s) and the destination plot.
2. On the destination plot, choose the arrow tool
3. Double-click the time axis to access the Axis Properties window.
4. In the Axis Properties window, time a unique name in the Name field and click Done.
5. Copy a series from a source plot (right-click the series and select Copy Series).
6. Paste the series into the destination plot (from the Edit menu, select Paste Series).
7. Double-click the new time axis for the pasted series to open the Axis Properties window.
8. Type a unique name in the Name field, different than the name used in step 4, and click Done.
9. Repeat steps 5 through 8 for each series you want to paste.
10. Identify the periods of interest in each series you want to combine and note the times for each. Also,
determine which period is the longest; this should be the length of time shown on each axis.
11. Double-click a time axis and adjust its Min and Max bounds. The new bounds should include the
period of interest for the series, and be the same length as the longest period identified in the original
time axis in the destination plot. Repeat for each time axis.
12. Use the hand tool
on each time axis to adjust the series horizontally as needed.
1-800-LOGGERS 81 www.onsetcomp.com
Page 82
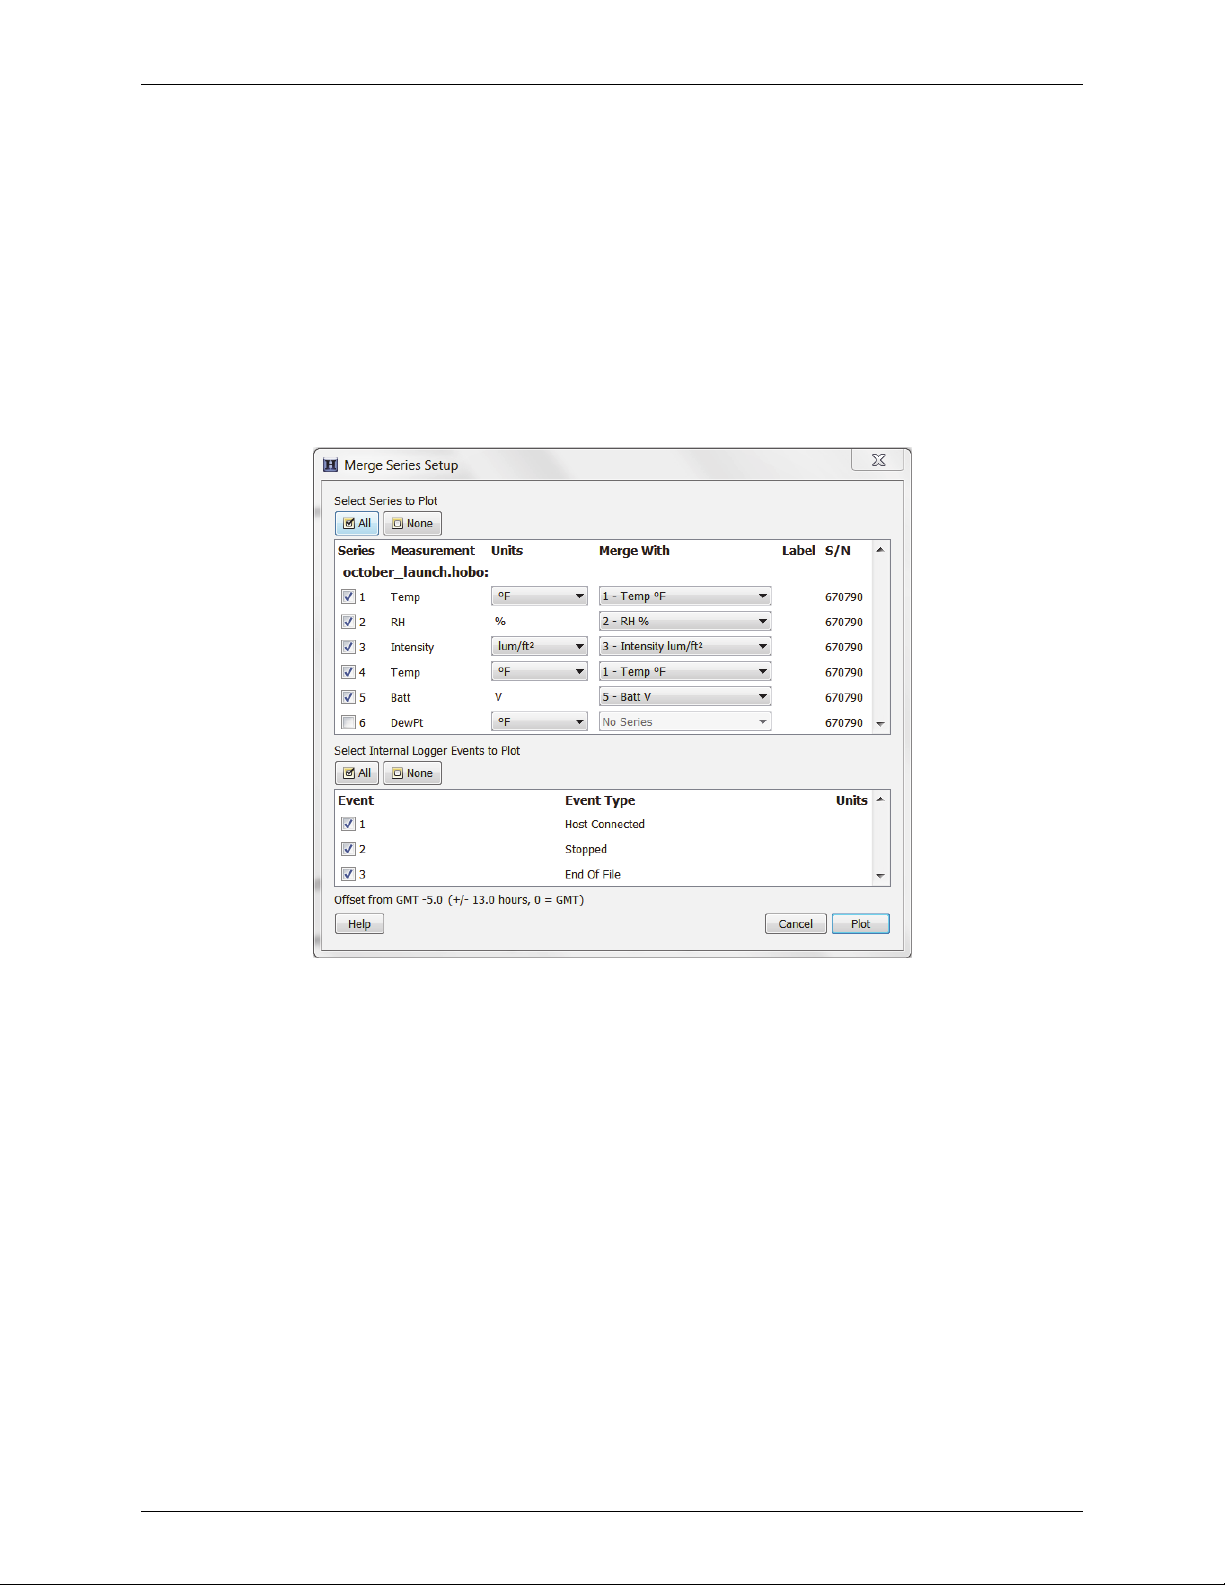
HOBOware User’s Guide
Merging Files
This feature allows you to combine multiple datafiles one file. Note that only series of the same type and name can
be merged and there cannot be an overlap in the time in the series.
1. Open the first file (oldest).
2. From the File menu, select Merge Datafile(s).
3. Select the datafiles you want to merge and click Open.
4. Select the series to plot. All series available in the selected datafiles are listed in the Select Series to
Plot section. Click the checkbox to add or remove series as necessary, or select the All or None
buttons in that section to select all series or no series accordingly.
5. All matching series available in the selected series will be populated with the corresponding series
listed in the Merge With column. Each new series can only be merged with the series of the same
measurement type and units. If no matching series is available in the plot, the Merge With column will
display No Series for that series. If a matching series is found, you can still append the series without
merging by choosing No Series from the corresponding drop-down list in the Merge With column. The
series will be appended to the plot without being merged with any series.
6. Select any internal logger events to plot, if applicable. Click the checkbox to add or remove each event
as necessary, or select the All or None buttons in that section to select all events or no events
accordingly.
7. Click the Plot button to merge the selected series with their matching series. Save the new plot as a
project file if desired.
1-800-LOGGERS 82 www.onsetcomp.com
Page 83

HOBOware User’s Guide
There will be a gap between the last sample in the older series and the first sample in the next series as shown
here in both the Temperature and RH series.
After the series have been merged, the Details Pane will be regenerated and the Series Statistics will be
recalculated. The Points Table will be regenerated and will show samples of both series in one column. The new
logger information is added to the Details Pane, showing the specific information about the different loggers that
collected the data samples.
Converting Units
Plots display data points in either SI or US units as defined within the Preferences (select Display and then Default
Unit System). You can switch between SI and US units on a single series or an entire plot without changing the
overall system preferences.
To change the units for a single series, right-click the series with the arrow tool and select Convert Series Units and
then select the unit you want to use.
To change the units for multiple series within the plot, click the Units icon
from the Edit menu.
If a series can be configured with multiple units, there will be drop-down list in the units field as in the example
below. Select the desired units from the drop-down list for all the series you wish to change and then click Convert.
This changes the units displayed on the axis, in the legend, in the Details pane, and in the Points table.
on the toolbar or select Convert Units
1-800-LOGGERS 83 www.onsetcomp.com
Page 84

HOBOware User’s Guide
1. For each series that supports unit options, select the desired units from the drop-down list
2. Click
This changes the units displayed on the axis, in the legend, in the Details pane, and in the Points table.
Convert.
Undoing and Redoing Plot Changes
You can undo and redo changes made to the plot display, including zooming, panning, crosshair placement, graph
and axis properties modifications, and more.
To undo the most recent change, click the Undo Action
menu.
To redo the most recent change that had previously been undone, click the Redo Action
select Redo Action from the Edit menu.
When using the Edit menu for Undo or Redo, the most recent change is listed with the menu choice. In the
following example, the most recent change that can be undone is to "Zoom Out."
icon on the toolbar or select Undo Action from the Edit
icon on the toolbar or
HOBOware keeps track of the changes that you make within each plot window and temporarily stores them as
"undoable actions." To see a complete list of all the actions that can be undone or redone, click the down arrow to
the right of either icon on the toolbar.
The number of undoable actions stored is set within the plot preferences. You can configure HOBOware to either
store a specific number of undoable actions or an unlimited number. In addition, you can enable or disable the
feature altogether. Note that storing an unlimited number of actions can impact HOBOware performance on
slower computers.
Saving Project Files
A project file (.hproj) is a plot that you have customized using the various features and tools of HOBOware. When
you open a project file, the plot appears as it did when you saved the project file and contains all of the same data.
To save your current data with a customized view of the plot, click the Save icon
Save Project from the File menu. To open an existing project file, choose Open Project from the File menu.
on the toolbar, or choose
Using Data Assistants
With Data Assistants, you can create new series by combining data recorded by the logger with additional data for
analysis. For example, the kWh Assistant converts logged pulse data from an energy transducer to kWh, average
kW, and energy cost.
1-800-LOGGERS 84 www.onsetcomp.com
Page 85

HOBOware User’s Guide
When you read out a logger or open a datafile, all available assistants are listed in the Data Assistants section at
the bottom of the Plot Setup window. To use a Data Assistant, click the assistant name to select it, and then click
the Process button.
For some data loggers, you can also run the Linear Scaling, Pulse Scaling, and kWh Data Assistants from the Launch
Logger window to create additional data series that are automatically available each time you read out the logger
and open the resultant data file. To use an assistant from the Launch Logger window, click the Scaling or kWh
button and then double-click the desired assistant, or select the assistant and click the Create button.
The following Data Assistants are available in both HOBOware and HOBOware Pro:
• Linear Scaling Assistant. Use the Linear Scaling Assistant to convert a data series from a compatible
sensor to some other measurement. You enter two raw values and their corresponding measurement
values. The conversion must be based on a linear relationship. Nonlinear scaling is not available.
• Pulse Scaling Assistant. Use the Pulse Scaling Assistant to convert a data series from a compatible
sensor to some other measurement. You enter a raw value and its corresponding measurement value.
The Pulse Scaling Assistant can be run during Plot Setup or at Launch.
These Data Assistants are available in HOBOware Pro only:
• Barometric Compensation Assistant. Use the Barometric Compensation Assistant to compensate
for barometric pressure and create a water level or sensor depth series. The BCA uses water pressure
data from a HOBO U20 or U20L Water Level logger and additional information you provide.
• Conductivity Assistant. Use the Conductivity Assistant to apply compensation to absolute
conductance data from a HOBO U24 Conductivity logger.
• Dissolved Oxygen Assistant. Use the Dissolved Oxygen Assistant to generate a series adjusted for
salinity and a series for percent saturation based on data from a HOBO U26 Dissolved Oxygen logger.
Also use this assistant to enter field calibration readings to compensate for fouling.
• Grains Per Pound Assistant. Use the Grains Per Pound Assistant to calculate the absolute amount
of water in the air, based on temperature, humidity, dew point, and altitude. You can also create an
altitude-corrected dew point series.
• Growing Degree Days Assistant. Use the Growing Degree Days Assistant to calculate growing
degree days based on temperature data spanning at least one full calendar day (midnight to
midnight). Growing degree days are used for agricultural and turf management applications, such as
estimating harvest time or pest growth.
• kWh Assistant. Use the kWh Assistant to convert logged pulse data from a WattNode, Veris, or other
energy transducer to kWh, average kW, and energy cost. The kWh Assistant can be run during Plot
Setup or at Launch.
Default Settings
The parameters last entered into any given Data Assistant will be the default used the next time the Data Assistant
is run, unless it is being used to edit existing series. If you run a Data Assistant at Plot Setup time and then later you
run it from the Launch Logger window, the default values are the value you entered at Plot Setup time.
Hiding Assistants
To prevent unwanted assistants from appearing in the Plot Setup window, or to bring back assistants that you have
previously hidden, click the Manage button. This will open the Preferences window to allow you to change these
settings.
1-800-LOGGERS 85 www.onsetcomp.com
Page 86

HOBOware User’s Guide
Software Updates
If you have an Internet connection, HOBOware can periodically check the Onset website for software updates. This
includes updates to your data assistants.
The default is to check once per week, but you can configure HOBOware to check daily or monthly. In Preferences,
go to the General pane and select Startup. In the Check for HOBOware Updates drop-down list, select how
frequently you want the software to check for updates.
You may also check for updates manually at any time. Choose Check for Updates from the Help menu.
Installing a Data Assistant
Data Assistants are installed automatically. There may also be times when a new Data Assistant is available
between HOBOware releases and needs to be installed manually. To do this, click the Load button on the Plot
Setup window and select the assistant's .jar file. Note: On Windows, you must be an administrator to load a new
Data Assistant. To temporarily run HOBOware as an Administrator, right-click the HOBOware icon and select Run
as Administrator. Enter the Administrator name and password as prompted.
License Agreement
This software is furnished in accordance with a separate license agreement included with the software, and
subject to any restrictions set forth therein. For more information about Onset's licensing terms and policies,
contact Onset Customer Service at 1 800 LOGGERS, or visit http://www.onsetcomp.com/corporate/legal.
Linear Scaling Assistant
The Linear Scaling Assistant converts a data series from a compatible sensor to some other measurement when
you enter two raw values and their corresponding measurement values. The conversion must be based on a linear
relationship. Nonlinear scaling is not supported.
Supported Sensors
This assistant is available for the following sensors:
• CABLE-2.5-STEREO Voltage Input Cable
• CABLE-4-20-mA Input Cable
• CABLE-ADAPx
• S-CIA-xxxx 12-bit 4-20mA Input Adapter
• S-VIA-xxxx 12-bit Voltage Input Adapter
• S-FS-CVIA FlexSmart™ Analog Module
• S-FS-TRMSA FlexSmart TRMS Module
• U30 Analog Sensor Port
• S-LWA-xxxx Leaf Wetness
• S-SMx-xxxx Soil Moisture
The Linear Scaling Assistant can be applied only to logged data from these sensors.
Other Types of Scaling
There are also other types of scaling available that may apply to your configuration:
1-800-LOGGERS 86 www.onsetcomp.com
Page 87

• FlexSmart™ modules are set up for scaling prior to launch, as part of the module configuration
process. You can later rescale these scaled series using the Linear Scaling Assistant if you need to
create a different measurement. See Configuring an Analog Module/Port.
• The Pulse Scaling Assistant is similar to the Linear Assistant, but only allows scaling of pulse data.
Using the Linear Scaling Assistant
1. At launch time: Using a logger with a sensor that supports scaling at launch time, click the Launch
icon on the toolbar. Click the Scaling button. Double click the assistant name or select the assistant
and click the Create button.
At plot setup: Read out a logger or open a file that supports linear scaling. Select the Linear Scaling
Assistant and click the Process button.
2. In the Linear Scaling Assistant window, choose the data series you want to convert from the Raw
Series drop-down list.
HOBOware User’s Guide
3. In the Scaled column of the Parameters panel, type the units name for the scaled series and enter the
scaled values in the Scaled column to correspond with the numbers in the Raw column. (The default
values in the Raw column are based on the high and low values supported by the sensor, but you may
use different values, as long as those values fall within the sensor's range.) These numbers establish a
linear relationship between raw and scaled values.
4. In the Resultant Series Name field, keep the default name or type a new one.
5. Type any User Notes concerning the series you are creating (optional).
6. Click the Create New Series button.
7. If you ran the assistant from the Launch window, the Scaling button displays the number of newly
created series. If using this assistant while plotting, the new series is listed and selected in the Plot
Setup dialog. Click the Plot button to display the series.
1-800-LOGGERS 87 www.onsetcomp.com
Page 88

HOBOware User’s Guide
8. The scaled series will appear in the plot immediately or when you read out the logger if configuring
this at launch time. The settings for the scaled series are listed in the Details pane of the plot:
After the plot is displayed, you may apply minimum, maximum, and average filters to the scaled series as you
would for any sensor data series.
Pulse Scaling Assistant
The Pulse Scaling Assistant converts a data series from a compatible sensor to some other measurement when you
enter a raw value and its corresponding measurement value. The conversion must be based on a linear
relationship. Nonlinear scaling is not supported
The Pulse Scaling Assistant can be run from the Launch window (Pre-set Parameters) or from the Plot Setup
window. If you run the assistant from the Plot Setup window, you must run the assistant each time you readout
the logger or open a datafile.
Supported Sensors
This assistant is available for the following sensors:
• S-UCA-xxxx and S-UCC-xxxx Electronic Switch Pulse Input Adapter
• S-UCB-xxxx and S-UCD-xxxx Contact Closure Pulse Input
• Raw Pulse sensors connected to HOBO UX series loggers that support pulse logging
Other Types of Scaling
There are also other types of scaling available that may apply to your configuration:
• FlexSmart™ modules are set up for scaling prior to launch, as part of the module configuration
process. See Configuring an Analog Module/Port.
• The Linear Scaling Assistant is similar to the Pulse Scaling Assistant, but has slightly different input
options and is compatible with a different group of sensors. See the Linear Scaling Assistant for more
information.
Using the Pulse Scaling Assistant
1. At launch time: Using a logger with a sensor that supports scaling at launch time, click the Launch
icon on the toolbar. Click the Scaling button. Double click the assistant name or select the assistant
and click the Create button.
At plot setup: Read out a logger or open a file that supports pulse scaling. Select the Pulse Scaling
2.
Assistant and click the Process button.
1-800-LOGGERS 88 www.onsetcomp.com
Page 89

HOBOware User’s Guide
3. In the Pulse Scaling Assistant window, choose the data series you want to convert from the Raw Series
drop-down list.
4. In the Scaled column of the Parameters panel, enter the units name for the scaled series and enter a
scaled value in the Scaled box to correspond with the number in the Raw box. These numbers
establish the relationship between the raw and scaled values.
5. In the Resultant Series Name field, keep the default name or type a new one.
6. Type any User Notes concerning the series you are creating (optional).
7. Click the Create New Series button.
8. If you ran the assistant from the Launch window, the Scaling button displays the number of newly
created series. If using this assistant while plotting, the new series is listed and selected in the Plot
Setup window. Click the Plot button to display the series.
9. The scaled series will appear in the plot immediately or when you read out the logger if configuring
this at launch time. The settings for the scaled series are listed in the Details pane of the plot:
After the plot is displayed, you may apply filters to the scaled series as you would for any other series. In addition
to the minimum, maximum, and average filters that are available for most series, the scaled pulse series allows you
to create a new series showing totals over a period of time.
Barometric Compensation Assistant
The Barometric Compensation Assistant uses water pressure data from a HOBO U20 or U20L Water Level Logger
and additional information from you to compensate for barometric pressure and create a water level or sensor
depth series.
After you use the assistant and display the plot, you may apply filters to the new series.
To create a water level or sensor depth series:
1-800-LOGGERS 89 www.onsetcomp.com
Page 90

HOBOware User’s Guide
1. Read out a logger or open a datafile that contains water pressure data from a U20 or U20L Water
Level Logger.
2. From the Plot Setup window, select Barometric Compensation Assistant and click Process.
3. Provide Fluid Density information by choosing a water type (fresh, salt, or brackish), entering a specific
constant value, or using the temperature series (if logged) to use temperature-compensated density
assuming fresh water.
4. To enter a reference water level, check the Use a Reference Water Level box, enter the water level,
and indicate whether it is in feet or meters.
• Enter the water level as a positive number if it is measured upward from a reference point
below the water's surface, such as the water's height above sea level. This illustration shows
an example of when to enter the water level as a positive number.
1-800-LOGGERS 90 www.onsetcomp.com
Page 91

HOBOware User’s Guide
• Enter the water level as a negative number if it is measured downward from a reference point
above the water's surface, such as a well cap. This illustration shows an example of when to
enter the water level as a negative number.
Then, from the drop-down, select the logged time and value that is closest to the time when you measured
the water level.
• When selecting a logged value and time to link to the reference level, make sure the logger
readings have stabilized. When a logger is first deployed in water, it takes some time for its
temperature to reach equilibrium. You will get the best accuracy if you link your reference
reading to a stabilized logger reading.
• When using a reference water level, the resulting series data will contain water level values
relative to this reference level. If you do not use a reference water level, the resulting series
data will contain values for absolute sensor depth.
5. You can either use a barometric data file from another source, or enter a fixed barometric pressure. For
the most accurate water level results, use a reference water level and a barometric data file. The
barometric data can come from another HOBO U20 or U20L or U20L Water Level Logger in air; a HOBO
Weather Station, HOBO Micro Station, HOBO U30, or HOBO Energy Logger; or a text file from another
source.
• To use another file to provide barometric information, click the Use Barometric Datafile button
and enter (or browse to) the name of a .hobo, .hsec, .dtf, .dsec, .csv, or .txt file that contains a
barometric pressure series from an overlapping time period. You will have the option to
display this series on the plot. Important: Text files must follow specific requirements as
described in Import Text Files Requirements.
• To use a constant pressure value, click the Use Constant Barometric Pressure button. Enter the
constant value and indicate whether it is in psi or kPa. (You cannot use a constant pressure
value in combination with a reference water level.)
6. Keep the default Resultant Series Name, or enter a new one. You may also enter User Notes
concerning the series you are creating.
Note: Your settings are retained, so you do not need to re-select your density and barometric file each
time you use the Barometric Compensation Assistant as long as they still apply to the new water level
data set.
7. Click Create New Series. The new series is listed and selected in the Plot Setup window. You can click
Process on the Plot Setup window again to create another series using different barometric
compensation parameters.
1-800-LOGGERS 91 www.onsetcomp.com
Page 92

HOBOware User’s Guide
8. Click the Plot button. The scaled series will appear in the plot and the settings for the scaled series are
listed in the Details pane:
After the plot is displayed, you may apply minimum, maximum, and average filters to the new water level or
sensor depth series as you would for any sensor data series in HOBOware Pro.
Conductivity Assistant
The Conductivity Assistant converts raw conductivity data from a U24 logger to Specific Conductance and/or
Salinity. You can also use it to enter field calibration measurements recorded at the beginning and end of a
deployment for calibration and to compensate for drift and sensor fouling effects.
1. Read out a U24 series logger or open a datafile from a U24 logger.
2. From the Plot Setup window, select the Conductivity Assistant and click the Process button.
3. In the Conductivity Assistant window, select the conductivity series that corresponds to the range of
your data.
Note: If you only selected one range at launch time, only one series will be listed.
• For the U24-001 logger, select either Conductivity Low Range when the data is always less than
1,000 µS/cm or select Conductivity Full Range (default) when the data goes above 1,000 µS/cm
as shown below.
• For the U24-002-C logger, select either Conductivity Low Range when the data is always less
than 10,000 µS/cm or select Conductivity High Range (default) when the data goes above
10,000 µS/cm as shown below.
1-800-LOGGERS 92 www.onsetcomp.com
Page 93

4. Select your desired Temperature Compensation method.
• Use "Non-linear, Natural Water Compensation per EN27888" for freshwater lakes and streams.
• Use "Linear compensation default at 2.1 %/°C" or "Linear compensation at <your own value>"
for NaCl solutions or other linear solutions.
HOBOware User’s Guide
• Use "Non-linear, Sea Water Compensation based on PSS-78" for salt water or salt marshes.
5. Select a Calibration Method. By default, data is calibrated using the factory calibration. To enter your
own calibration values, select "Use measured points for calibration" and then enter temperature and
actual conductivity (not specific conductance) values from your calibration readings taken with a field
meter. These field measurements will be used to provide calibrated conductivity and salinity data
series by adjusting the data as a percentage of the reading. See
information.
Calibration below for more
• Starting and Ending Value: This method calibrates your data and adjusts for sensor drift or
fouling. This assumes there is a linear change in calibration adjustment required.
• Starting value only: All readings are adjusted up or down by a fixed percentage of the reading
based on this calibration point.
• Ending Value Only: The factory calibration value is used as the starting point. This assumes
there is a linear change in calibration adjustment required.
Note: You cannot use a zero-point calibration solution for starting and ending values. The first data
point cannot be used as the ending value; consider using that as the starting value instead.
6. Select the Only Report Data Between the Selected Points checkbox if you want readings from before
or after the calibration points to be removed from the resulting series.
7. In the Series Name field, keep the default name or type a new one.
8. Type any User Notes concerning the series you are creating (optional).
9. Click the Create New Series button.
10. The Plot Setup dialog lists a series called Specific Conductance (or the name you entered for Series
Name). The default units are microSiemens/cm (µS/cm). You can change the units to milliSiemens/cm
(mS/cm) if desired. The default units for salinity are ppt (parts per thousand) and this cannot be
changed.
1-800-LOGGERS 93 www.onsetcomp.com
Page 94
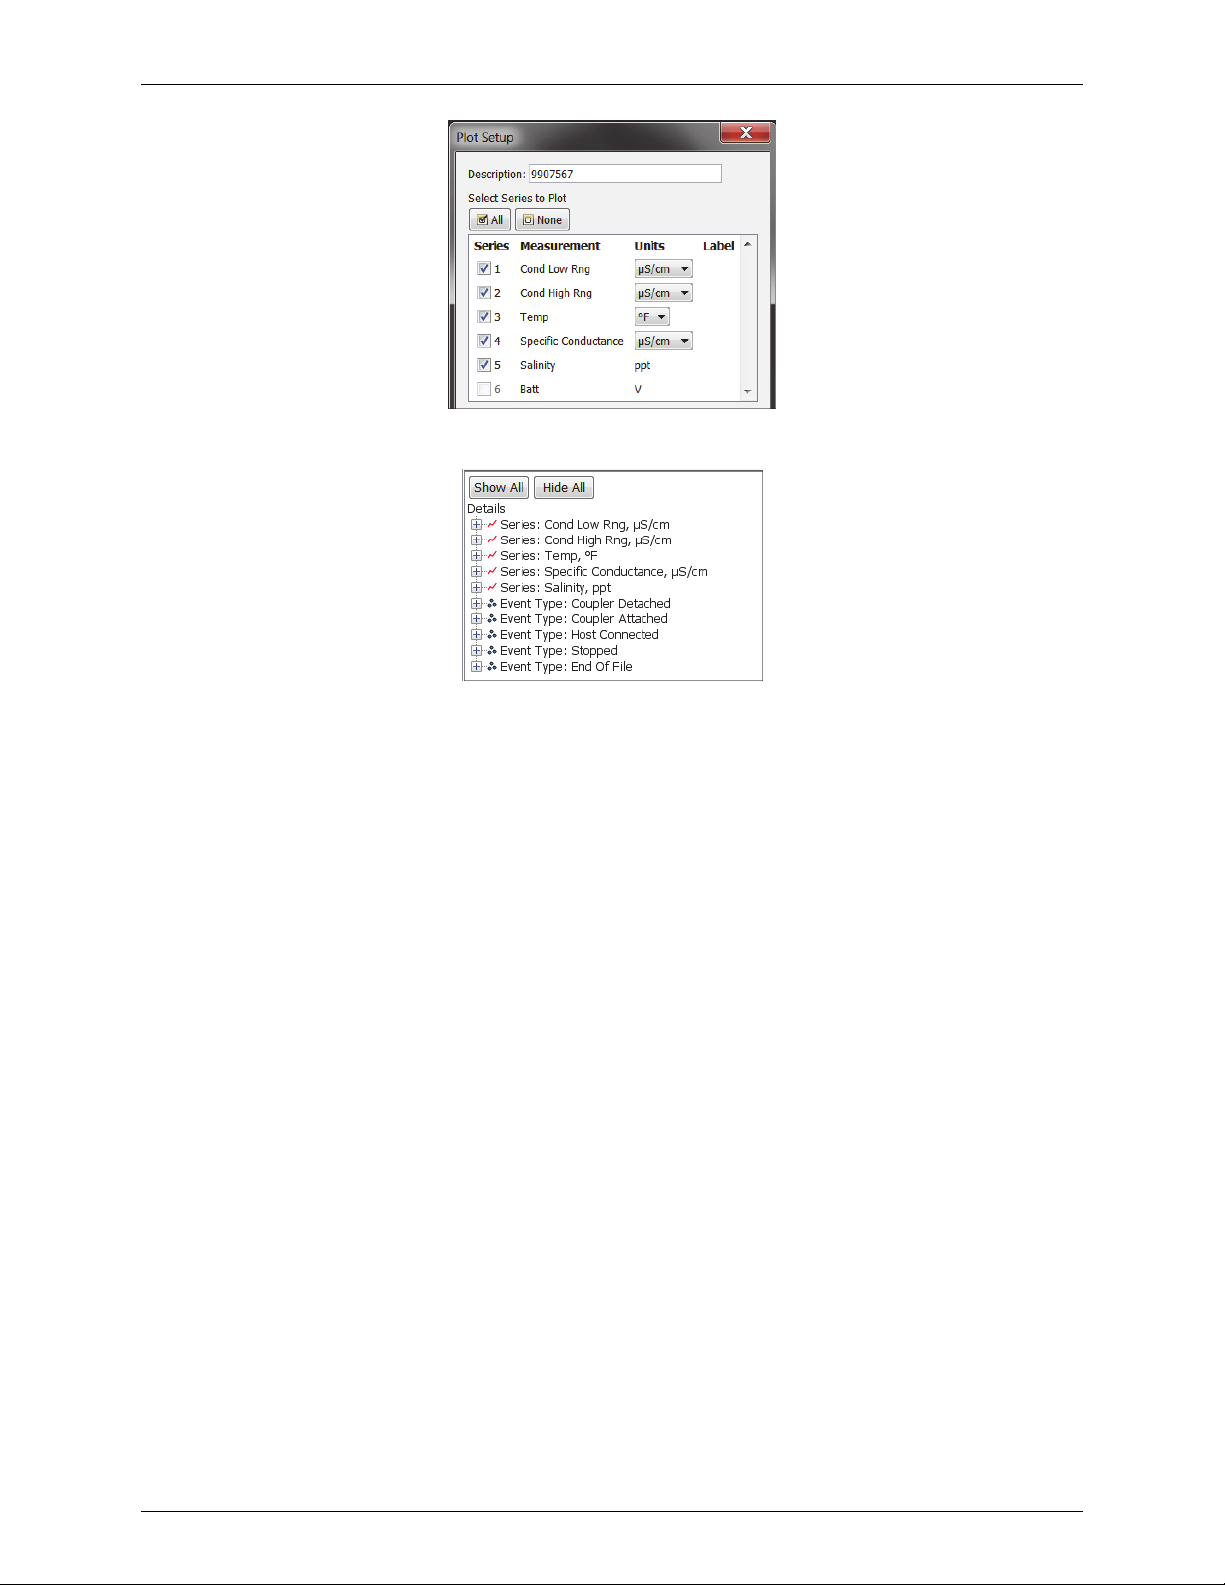
HOBOware User’s Guide
11. Click the Plot button to plot the data. The Details Pane will show the series selected in the Plot Setup:
After the plot is displayed, you may apply minimum, maximum, and average filters to the scaled series
as you would for any sensor data series in HOBOware Pro.
12. Save this plot as a Project to preserve this processed data.
Calibration
It is important to take temperature and conductivity calibration readings with a portable conductivity meter at
both the beginning (launchtime) and end of a deployment (readout) because these readings are necessary for data
calibration and to compensate for any measurement drift during deployment. The temperature and conductivity
calibration readings should be the actual conductivity values (not in specific conductance at 25°C), and should be
recorded in a notebook with the time and location of the reading. See the logger manual for details on different
methods of obtaining water samples to record these values.
1. Once the logger is deployed and logging, record in a notebook the temperature and actual
conductivity meter readings along with the date and time which will be entered into the Conductivity
Assistance to correct the field data.
2. Before you remove the logger and read out its data, take another temperature and conductivity
reading with the meter and record the exact date and time.
3. Enter these values under the "Use measured points for calibration" option in the Conductivity
Assistant.
Notes:
• Whenever a logger is removed for downloading data, clean the sensor window using a cotton swab
with a mild detergent and rinse.
• If the water in the field is not accessible to the conductivity meter sensor, such as in a deep well, a
bailer can be used to fetch a water sample for testing. See the logger manual for more details.
1-800-LOGGERS 94 www.onsetcomp.com
Page 95

HOBOware User’s Guide
Dissolved Oxygen Assistant
The Dissolved Oxygen Assistant corrects for measurement drift from fouling and provides salinity-adjusted DO
concentration as well as percent saturation data.
1. Read out a U26 series logger or open a datafile from a U26 logger.
2. From the Plot Setup window, select the Dissolved Oxygen Assistant and click the Process button.
3. With the Dissolved Oxygen Data Assistant, you can adjust the data for salinity (step 4), enter
barometric pressure information for percent saturation calculation (step 5), select the resultant series
you wish to generate (step 6), and enter field calibration data (step 7).
4.
Adjust for salinity. If you deployed the logger in saltwater, you must adjust for salinity to get either
a DO concentration or percent saturation. To do this, select the "Adjust for Salinity" checkbox (you will
also need to select the checkboxes under Resultant Series Information for the series you would like).
Select whether the series should be adjusted based on salinity or specific conductance.
• If you chose salinity: Select "Salinity value" if you have a specific value from a conductivity
meter reading or other source; type the value in ppt as shown below. This works well if the
salinity is constant during the deployment. If the salinity changes during the deployment,
select "Salinity datafile" to use a data file from a U24 conductivity logger or a text file. Click the
Choose button and select the file. (See the Important note for more details about using files.)
• If you chose specific conductance: Select "Sp. cond. value" if you have a specific conductance
value from a meter reading or other source; type the value in either µS/cm or mS/cm as shown
below. This works well if the specific conductance is constant during the deployment. If it is
not constant, select "Specific conductance datafile" to use a data file from a U24 conductivity
1-800-LOGGERS 95 www.onsetcomp.com
Page 96

HOBOware User’s Guide
logger or a text file. Click the Choose button and select the file. (See the Important note for
more details about using files.)
Important: When using a file for salinity or specific conductance data, you can select either a .hobo
file from a HOBO U24 Conductivity Logger or a .txt file from a U24 logger after it has been calibrated
with the Conductivity Assistant. Using a U24 .hobo file is the easiest while a calibrated U24 text file
provides the highest accuracy. Follow these steps to create a text file from a U24 Conductivity Logger
in the proper format:
A. Click Cancel to close the DO Assistant and Plot Setup windows if they are open.
B. From the File menu, select Preferences.
C. In the General Preferences, select Export Settings.
D. Click the "Use default BoxCar Pro export settings" button and click OK. This will ensure the text
file you create is the proper format for the Dissolved Oxygen Assistant.
E. From the File menu, select Open Datafile and select the U24 .hobo file.
F. In the Plot Setup window, select the Conductivity Assistant and click Process.
G. In the Conductivity Assistant, create a calibrated specific conductance or salinity data series.
H. Back in the Plot Setup window, select the specific conductance or salinity series only. Click
None under Select Internal Events to Plot so that no events are plotted.
I. Click the Plot button.
J. From the File menu, select Export Table Data. Choose "Export to single file" if prompted.
K. To use the calibrated conductivity file, open the DO file again. In the Plot Setup window, select
the Dissolved Oxygen Assistant and click Process. Select the text file you just created in the
previous step for the salinity or specific conductance datafile. This file will be used to generate
the series adjusted for salinity.
Use barometric pressure (for percent saturation). Check the "Use barometric pressure (for
5.
percent saturation)" box if you want to generate a DO percent saturation series (you will also need to
select the DO Percent Sat. checkbox under Resultant Series Information). For the best accuracy, use a
data file from a HOBO Water Level logger deployed in the air or a nearby weather station. Select
"Barometric Datafile" and click the Choose button to select the .hobo or .txt file.
Important: If you
are using a .txt file from a non-HOBO device, it must follow specific requirements as described in
Import Text File Requirements.
If you do not have a barometric pressure file, then select "Barometric data value" and type in the
average barometric pressure during your deployment in one of the five available units.
If the barometric pressure readings are from barometric data that has been adjusted to sea level
readings (such as those taken from a National Weather Service weather station), then you must also
select the "For sea level barometric pressures, enter elevation" checkbox and type the elevation
where the logger was deployed in either meters or feet. Absolute pressure values, such as those
obtained from a HOBO Water Level logger, do not need to be adjusted for elevation.
1-800-LOGGERS 96 www.onsetcomp.com
Page 97

HOBOware User’s Guide
6.
Resultant Series Information. Make sure the series you want to plot are selected in the Resultant
Series Information pane. To generate a series for adjusted DO concentration, check the "DO Adj
Conc." box. To generate a series for percent saturation, check the "DO Percent Sat." box. The default
series names display automatically to the right of the selected series. Edit those series names as
needed. You can also type up to 250 characters of optional user notes.
7.
Perform Field Calibration. Use field calibration to compensate for measurement drift due to fouling
or if the logger was not lab calibrated. (Lab calibration typically remains accurate for the full 6-month
life of the sensor cap if there is no fouling.) Check the "Perform field calibration" checkbox and select
the type of field calibration: either "Using Dissolved Oxygen Meter or Dissolved Oxygen Titration" or
"Using 100% Water-Saturated Air."
• For calibration using a dissolved oxygen meter or titration: Select the "Starting calibration
point" checkbox and select the date/time of the calibration reading. View the logged data
values shown in the drop-down box to be sure that the logger readings have stabilized. It is
more important that you use a good stabilized logger reading than exactly matching the times.
Type in the Meter/Titration DO Measurement in mg/L taken at that date/time. If using an
ending calibration reading, or, if desired, select the "Ending calibration point" checkbox and
select the date/time of that calibration reading. Make sure the logger reading you use for
calibration is one from when the logger was in the water, keeping in mind that the logger time
may be slightly different from the time used for your field readings. You can usually see the
data points that were recorded when the logger was out of the water. Type in the
Meter/Titration DO Measurement in mg/L for this ending calibration point.
1-800-LOGGERS 97 www.onsetcomp.com
Page 98

HOBOware User’s Guide
Note: If only an “Ending calibration point” is entered (“Starting calibration point” not checked),
then the assistant will use the logger calibration for the starting calibration. This assumes you are
starting with an accurately calibrated logger and saves you from having to do your own starting
point calibration. However, if you select a “Starting calibration point” and no “Ending calibration
point,” the series will be adjusted for the one calibration point. This may be accurate enough for
applications where there is no significant fouling during the deployment time.
• For calibration using 100% water-saturated air: Select the "Starting calibration point"
checkbox and the "Ending calibration point" checkbox and select the date/time for the first
calibration reading. View the values shown in the drop-down list to be sure the readings are
stable at this calibration point (using a calibration point from when the logger is in air or has
not reached temperature equilibrium will result in incorrect calibration). Select the source of
the barometric pressure readings. From the Barometric Pressure drop-down list, select "from
the left" to use the barometric pressure data file already entered in the assistant or select
"entered here" to enter a specific barometric pressure value in one of five available units. If
you are using an ending calibration reading, select the “Ending calibration point” checkbox and
select the date/time of that calibration reading following the same guidelines as you did for
the starting calibration point. For the ending point, enter the barometric pressure information
(select “from the left” or “entered here” as described above).
1-800-LOGGERS 98 www.onsetcomp.com
Page 99

HOBOware User’s Guide
Check the "Only report data between selected points" if you want the new series to only include data
between the selected calibration points. Leave this option unchecked to include all data.
8. Click the Create New Series button when finished entering information in the data assistant.
9. Depending on which series you selected to add, the Plot Setup dialog lists two news series: DO Adj
Conc and DO Percent Sat (or the names you entered for Series Names). The default units for the
DO Adj Conc series are mg/L. You can change the units to ppm if desired.
10. Click the Plot button to plot the data. After the plot is displayed, you may apply minimum, maximum,
and average filters to the scaled series as you would for any sensor data series in HOBOware Pro.
11. Save this data and plot setup as a Project to preserve the new series you created for future use.
1-800-LOGGERS 99 www.onsetcomp.com
Page 100

HOBOware User’s Guide
Field Values
These are the minimum and maximum values allowable in the fields in this assistant.
Measurement, Units Minimum Maximum
pressure, mm Hg 380.00 836.00
pressure, in Hg 14.9700 32.9100
pressure, millibars 507.0 1,114.0
pressure, kPa 51.000 112.000
pressure, Pa 51,000 112,000
pressure, psi 7.3480 16.1600
elevation, m -304.80 2 2,438.40
elevation, ft -1000.00 8,000.00
salinity, ppt 0.0000 42.0000
sp. cond., µs/cm 0.0 65,000.0
sp. cond., ms/cm 0.0000 65.0000
meter/titration DO conc, mg/L 0.00 30.00
Grains Per Pound Assistant
The Grains Per Pound Assistant calculates the absolute amount of water in the air, based on temperature,
humidity, dew point, and altitude. You can also create an altitude-corrected dew point series.
To create a grains per pound and altitude-corrected dew point series:
1. Read out a logger or open a datafile that contains temperature, humidity, and dew point series.
2. From the Plot Setup window, select the Grains Per Pound Assistant and click the Process button.
3. In the Grains Per Pound Assistant window, choose the data series you want to convert from the
Temperature, Relative Humidity, and Dew Point Series drop-down lists.
4. To correct for the Altitude above Sea Level (optional), enter the altitude and use the drop-down menu
to indicate whether this number is in feet or meters.
5. Select the Add Altitude-Corrected Dew Point Series to Graph checkbox to plot an altitude-corrected
dew point series.
6. In the Resultant Series Name field, keep the default name or type a new one.
7. Type any User Notes concerning the series you are creating (optional).
8. Click the Create New Series button. The new grains per pound series (and altitude-corrected dew
point series, if applicable) is listed and selected in the Plot Setup window.
1-800-LOGGERS 100 www.onsetcomp.com
 Loading...