

Page 1
Getting Started with
Omron WebMonitor
User Manual
84-9111024-02 Rev E
Page 2

Copyright ©2020
Omron Microscan Systems, Inc.
Tel: +1.425.226.5700 / 800.762.1149
Fax: +1.425.226.8250
All rights reserved. The information contained herein is proprietary and is provided solely for the purpose of
allowing customers to operate and/or service Omron Microscan-manufactured equipment and is not to be
released, reproduced, or used for any other purpose without written permission of Omron Microscan.
Throughout this manual, trademarked names might be used. We state herein that we are using the names to the
benefit of the trademark owner, with no intention of infringement.
Disclaimer
The information and specifications described in this manual are subject to change without notice.
Latest Manual Version
For the latest version of this manual, see the Download Center on our web site at:
www.microscan.com.
Technical Support
For technical support, e-mail: helpdesk@microscan.com.
Warranty
For current warranty information, see: www.microscan.com/warranty.
Omron Microscan Systems, Inc.
United States Corporate Headquarters
+1.425.226.5700 / 800.762.1149
United States Northeast Technology Center
+1.603.598.8400 / 800.468.9503
European Headquarters
+31.172.423360
Asia Pacific Headquarters
+65.6846.1214
Page 3

Contents
PREFACE
CHAPTER 1
CHAPTER 2
Welcome v
Purpose of this Guide v
Omron WebMonitor Overview 1-1
Introduction 1-2
Requirements 1-2
Connecting 1-3
Application Overview 1-4
Application Bar 1-5
Pages, Panels, and Widgets 1-6
Data Event Identifiers 1-9
Live and Review Modes 1-10
Omron WebMonitor Web HMI Storage Limits 1-11
Layout Editing 2-1
Layout Edit Mode 2-2
Creating, Editing, and Removing Pages 2-3
Inserting and Configuring a Widget 2-4
The Widget Settings Panel 2-7
CHAPTER 3
Getting Started with Omron WebMonitor iii
Tags 3-1
Omron WebMonitor Tags 3-2
Page 4

Contents
CHAPTER 4
CHAPTER 5
Widgets 4-1
Read Value Widget 4-2
Write Value Widget 4-7
Chart Widget 4-14
Log of Values Widget 4-16
Single Image Widget 4-18
Image Filmstrip Widget 4-22
Header Widget 4-26
Inspection Counters Widget 4-28
Device Control Widget 4-30
REST APIs 5-1
REST APIs 5-2
command 5-5
data 5-6
stats 5-7
record 5-9
filters 5-12
image 5-13
svg 5-14
file 5-15
CHAPTER 6
Installing and Updating Omron WebMonitor on a
Smart Camera 6-1
Installing Omron WebMonitor on a Smart Camera 6-2
Updating Omron WebMonitor on a Smart Camera 6-6
APPENDIX A
Changing the Omron WebMonitor HTTP Port for
PC-Based Systems A-1
Changing the Omron WebMonitor HTTP Port A-2
APPENDIX B
iv Getting Started with Omron WebMonitor
Omron WebMonitor Localization B-1
Omron WebMonitor Localization B-2
Page 5

Preface
PREFACE Welcome
Purpose of This Guide
This guide describes how to use Omron Microscan’s Omron WebMonitor
to visualize Omron Microscan Link values and images from compatible
Omron Microscan smart cameras and vision systems. Omron
WebMonitor runs on the web browser of your choice, including those
found on tablets and smart phones.
Getting Started with Omron WebMonitor v
Page 6

Preface
vi Getting Started with Omron WebMonitor
Page 7

1
CHAPTER 1 Omron WebMonitor
Overview
This section provides a general description of the Omron WebMonitor
interface.
1
Overview
Omron WebMonitor
Getting Started with Omron WebMonitor 1-1
Page 8

Chapter 1 Omron WebMonitor Overview
Introduction
Omron WebMonitor allows you to visualize Omron Microscan Link values and images
from compatible Omron Microscan smart cameras and vision systems. Omron
WebMonitor runs on the web browser of your choice, including those found on tablets
and smart phones.
Requirements
Omron WebMonitor supports Windows 7 (32-bit and 64-bit) and Windows 10.
Omron WebMonitor requires an HTML5-compatible browser:
• Internet Explorer 11 or later
• G
oogle Chrome
• Firefox
• Mobile Safari (iPhone / iPad)
• Mobile Chrome on Android devices
The following browswers were explicitly tested for compatibility:
• Internet Explorer 11.0.2
• Google Chrome 33.0
• Firefox 28.0
Additional Notes:
• Safari for Windows is
• Internet Explorer 11 or later and Google Chrome 33 or later are recommended for
extended Omron WebMonitor sessions.
1-2
not supported.
Getting Started with Omron WebMonitor
Page 9
Connecting
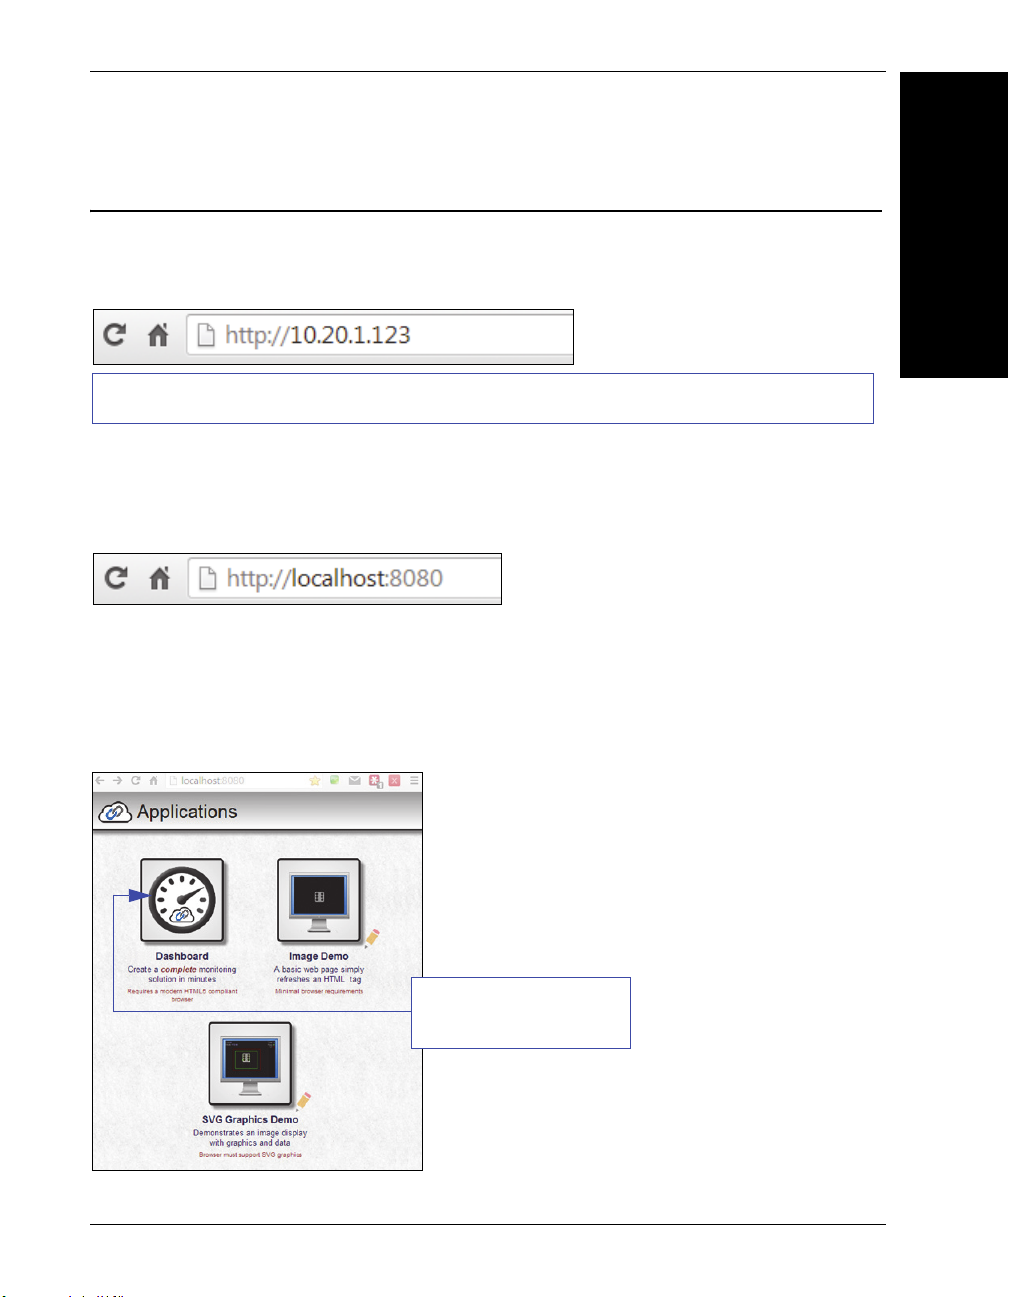
If using a HAWK MV-4000, you can also type the name of the device, as in the example http://HAWK5E7420.
Click the Dashboard icon
to launch the application.
Connecting
To launch Omron WebMonitor, use your favorite web browser and enter the address of
your device in the browser’s address bar. For example, if you have a Omron Microscan
smart camera on your network at address 10.20.1.123, you would enter:
1
Overview
Omron WebMonitor
Omron WebMonitor also works with
To connect to a software-based job running in FrontRunner or AutoVISION:
First, be sure the job is running, and then type the following into your browser’s address bar:
Note: You must specify port 8080 for a PC-based connection. If you are connecting to a
PC-based system from a different machine on the network, use the IP address or name of
the PC instead of the local host. For example, use http://10.20.1.234:8080 if the PC’s IP
address is 10.20.1.234.
Once you press the Enter key, you should see the following home page:
Visionscape Software
and with
AutoVISION
’s Emulator.
Getting Started with Omron WebMonitor 1-3
Page 10
Chapter 1 Omron WebMonitor Overview
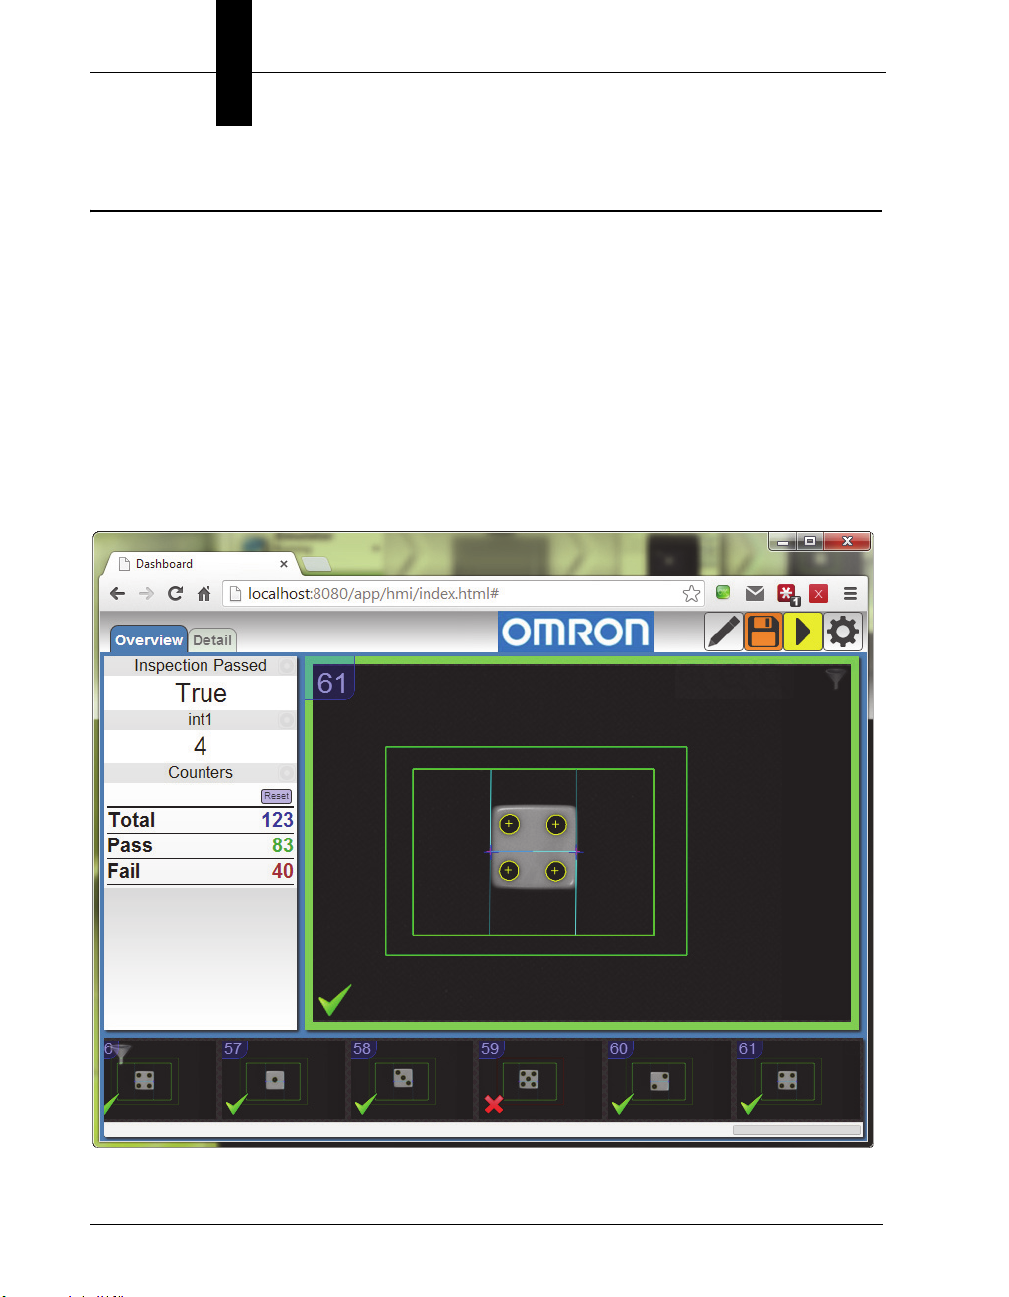
Application Overview
The Omron WebMonitor Dashboard user interface is a single page web app-style
application. Most web pages show information that can typically extend beyond the
bottom of the browser window, requiring the user to scroll to see it. They typically contain
links to other pages, which is how the user navigates around a web site.
In contrast, Omron WebMonitor behaves more like an application, expanding to fill the
browser window, and automatically adapting to any changes in the dimensions of the
window. Although Omron WebMonitor allows you to define and use multiple display
pages, they are all contained within a single web page.
The browser stores a maximum of 50 images. The camera stores images, image
thumbnails, and data records that can be requested via the web page or API. When
memory is full, the camera will first delete full-size images, then thumbnails, and ultimately
the data records on a first in-first out basis.
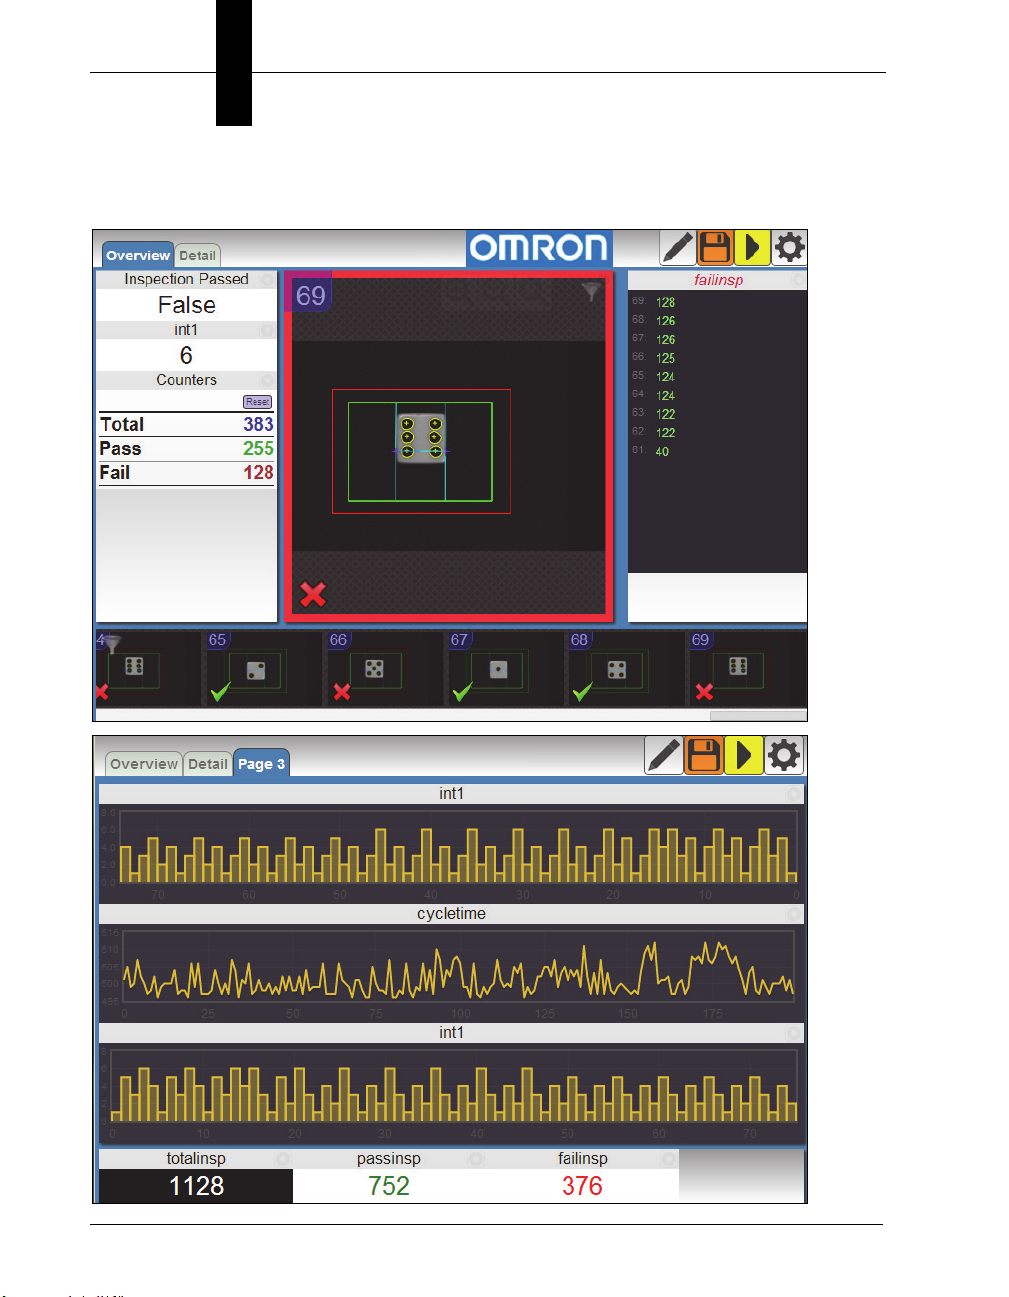
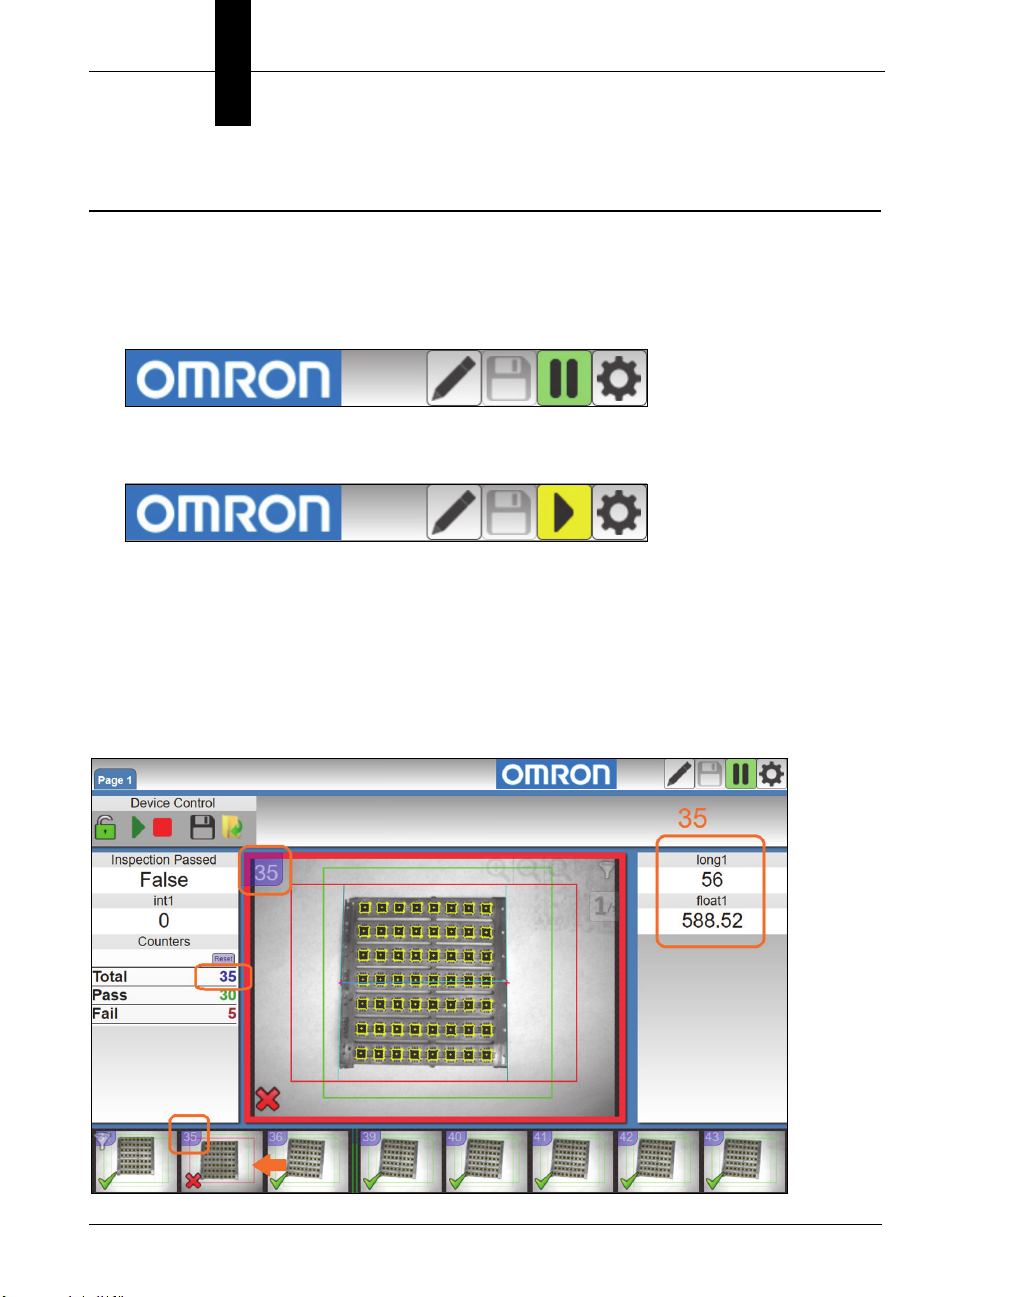
This is a typical view of a Omron WebMonitor page.
1-4
Getting Started with Omron WebMonitor
Page 11
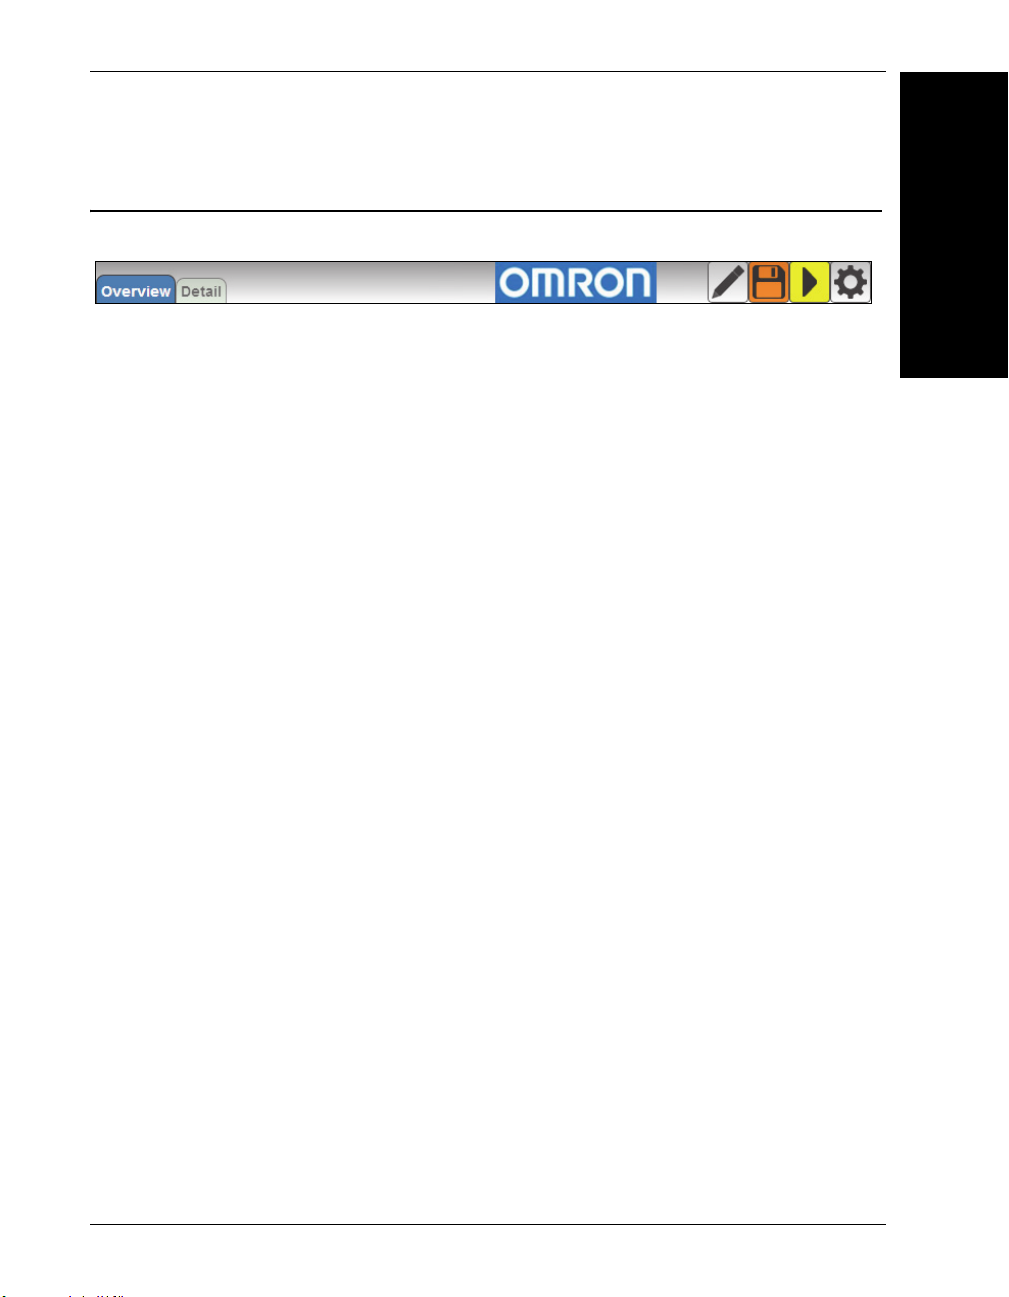
Application Bar
Application Bar
The Application Bar is located at the top of the Omron WebMonitor interface.
1
Overview
There are three components to the Appplication Bar:
• A set of page selection buttons. In the example above they appear as tabs, but the
style can be customized if necessary.
• A logo. The position and contents of the logo can be customized.
• A toolbar. The toolbar provides access to various Omron WebMonitor settings and
modes. The position and size of the toolbar can be customized.
Omron WebMonitor
Getting Started with Omron WebMonitor 1-5
Page 12
Chapter 1 Omron WebMonitor Overview
Pages, Panels, and Widgets
The main area of Omron WebMonitor displays one of a number of pages. If there is more
than one page defined, you can switch between them by using the page selection
buttons on the application bar, or by using the arrow keys on your keyboard.
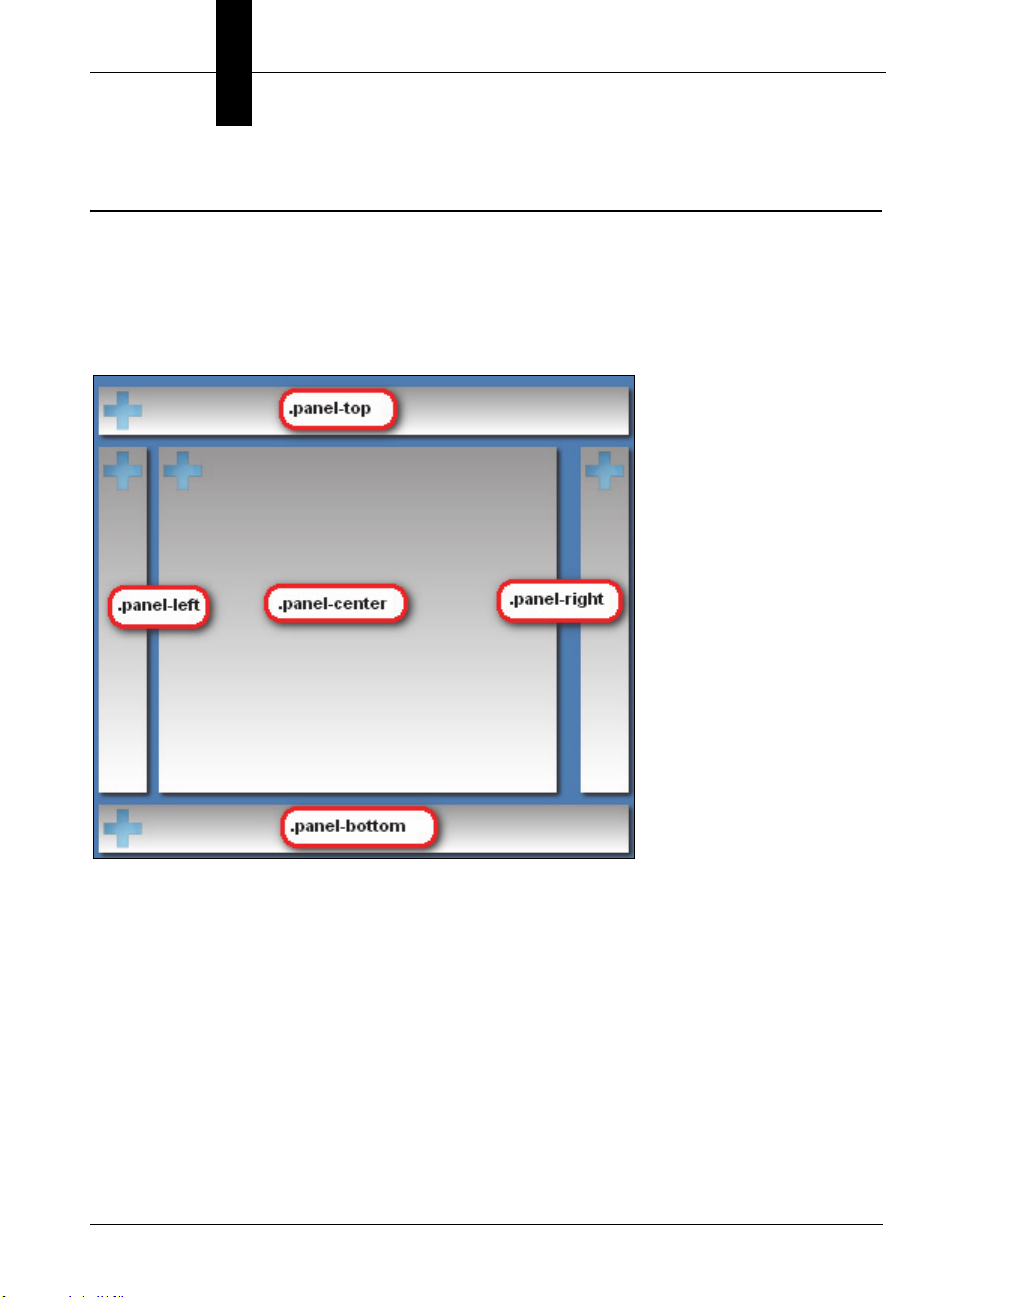
Each page is organized into a set of regions called panels. The following image shows an
empty page to demonstrate the arrangement of the panels on a page.
Note the names, which start with .panel-. It is not necessary to know these names to use
Omron
customization. Customizing Omron WebMonitor requires the modification of CSS
(Cascading Style Sheets). The names shown correspond to the CSS class selector for
that panel.
The purpose of the panels is to act as containers for a number of widgets. Each widget
has the ability to visualize and interact with one or more items of inspection data such as
Omron Microscan Link values, inspection counters, timing information, or images.
1-6
WebMonitor; however they do have significance if there should be need for
Getting Started with Omron WebMonitor
Page 13
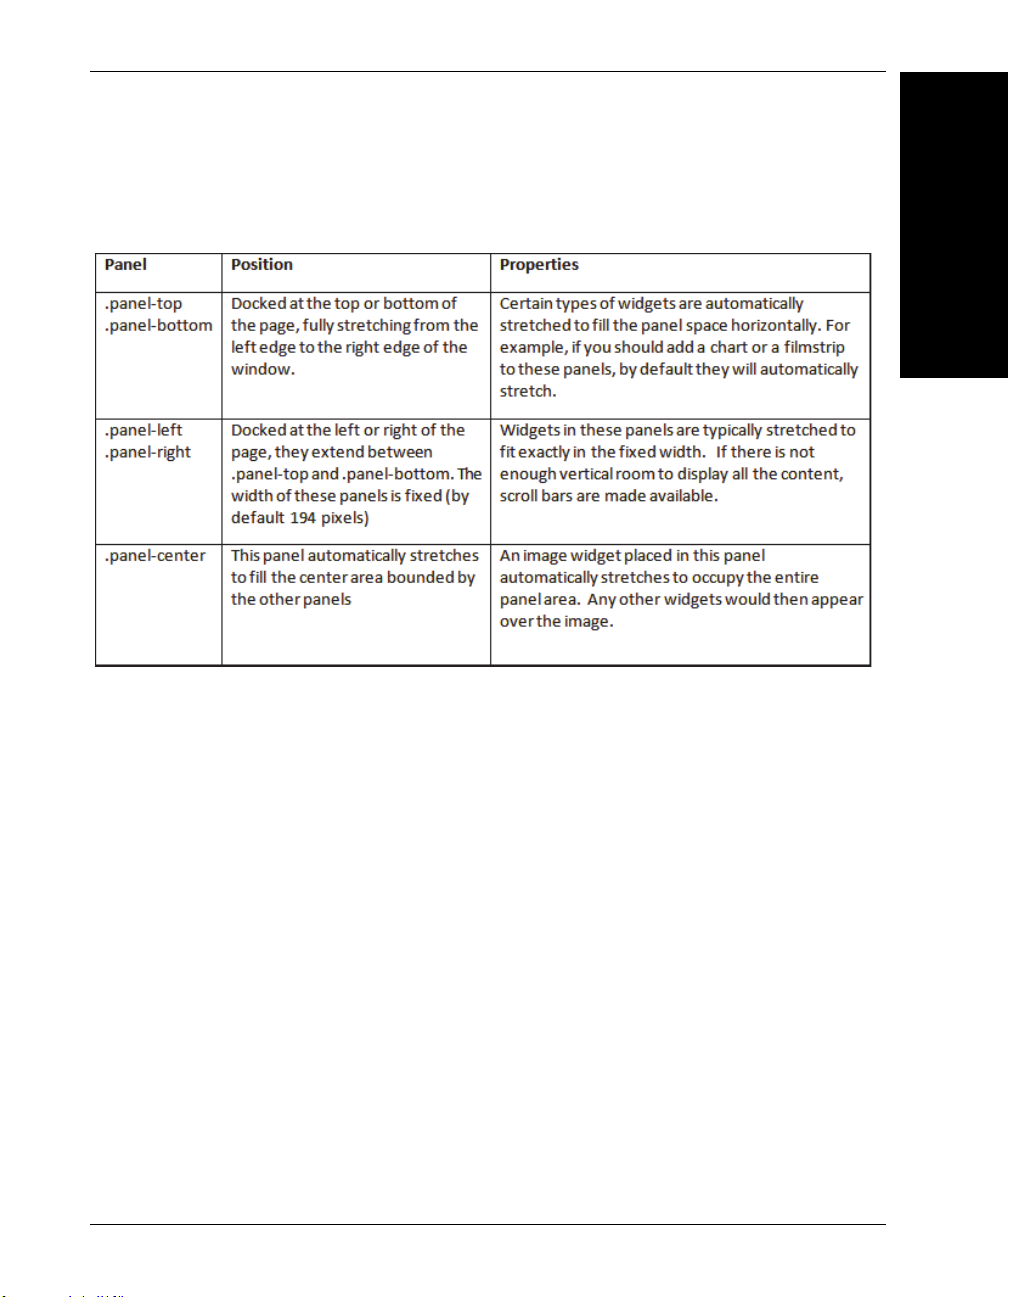
Pages, Panels, and Widgets
Each panel has special layout and behavior properties that can be exploited to create a
wide variety of different layouts. The following table summarizes the position and
properties of each panel:
1
Overview
Omron WebMonitor
Getting Started with Omron WebMonitor 1-7
Page 14
Chapter 1 Omron WebMonitor Overview
If a panel does not have content (i.e. no widgets are placed in it), it is hidden from view, with
the other panels adjusted to occupy the available space. Examples of possible page layouts:
1-8
Getting Started with Omron WebMonitor
Page 15
Data Event Identifiers
Data Event Identifiers
At the end of each inspection cycle, the relevant result data is collected into a record. This
data is coherent, meaning that all the values are part of the same result, and therefore
represent a snapshot of information as it was at that particular point in time. When Omron
WebMonitor fetches this data, it associates each of the data records with a unique Data
Event Identifier. This identifier is visible in various Omron WebMonitor widgets, and can
help when making correlations between various pieces of data. It is also used internally,
for example to highlight all items related to the same event when hovering over a
displayed value or image.
1
Overview
Omron WebMonitor
Getting Started with Omron WebMonitor 1-9
Page 16
Chapter 1 Omron WebMonitor Overview
Live and Review Modes
Omron WebMonitor has the following two fundamental modes of operation:
• Live Mode: In this mode, Omron WebMonitor is continuously fetching new data from
the connected device. The amount and frequency of data received is balanced by
bandwidth and performance constraints.
• Review Mode: In this mode, Omron WebMonitor is not receiving new data. Instead,
you can view and analyze already captured historical data.
To switch between Live Mode and Review Mode, use the appropriate toolbar button in
the Application Bar, or press CTRL-R on the keyboard.
When in review mode, clicking on one of the items in a historical widget (for example, a
filmstrip, log, or chart) will automatically load all the other widgets with data with the same
Data Event Identifier. Clicking on Filmstrip Entry will load the image into the image widget,
and display the inspection counts, Omron Microscan Link values, and other elements as
they were at that time. Likewise, you can click on a log entry with similar results.
1-10 Getting Started with Omron WebMonitor
Page 17

Omron WebMonitor Web HMI Storage Limits
Omron WebMonitor Web HMI Storage Limits
Up to the last 100 records are stored on the camera, including at least one failure record.
If the last failure record is older than the most recent 100 records, that record plus the
latest 99 passing records are stored for a total of 100 records.
1
Overview
Up to 100 of the latest SVG records are stored on the camera.
The number of images stored on the system is dependent on the camera configuration’s
buffer count. At most this will be the buffer count as defined in the system’s Camera
Definition and Buffer Counts setting. This count is reduced by buffers being processed or
waiting for triggers in a pipeline mode. For example, a camera with 16 buffers in pipeline
triggering mode with one image in process would have a maximum of 14 of the most
recent image records saved for retrieval.
Note: Pipeline Mode is automatically enabled when the job is triggered so the acquisition
of the next cycle can be overlapped with the processing of the current cycle.
Omron WebMonitor
Getting Started with Omron WebMonitor 1-11
Page 18

Chapter 1 Omron WebMonitor Overview
1-12
Getting Started with Omron WebMonitor
Page 19

2
CHAPTER 2 Layout Editing
This section describes how to optimize the layout of the Omron
WebMonitor interface for your application.
2
Layout Editing
Getting Started with Omron WebMonitor 2-1
Page 20
Chapter 2 Layout Editing
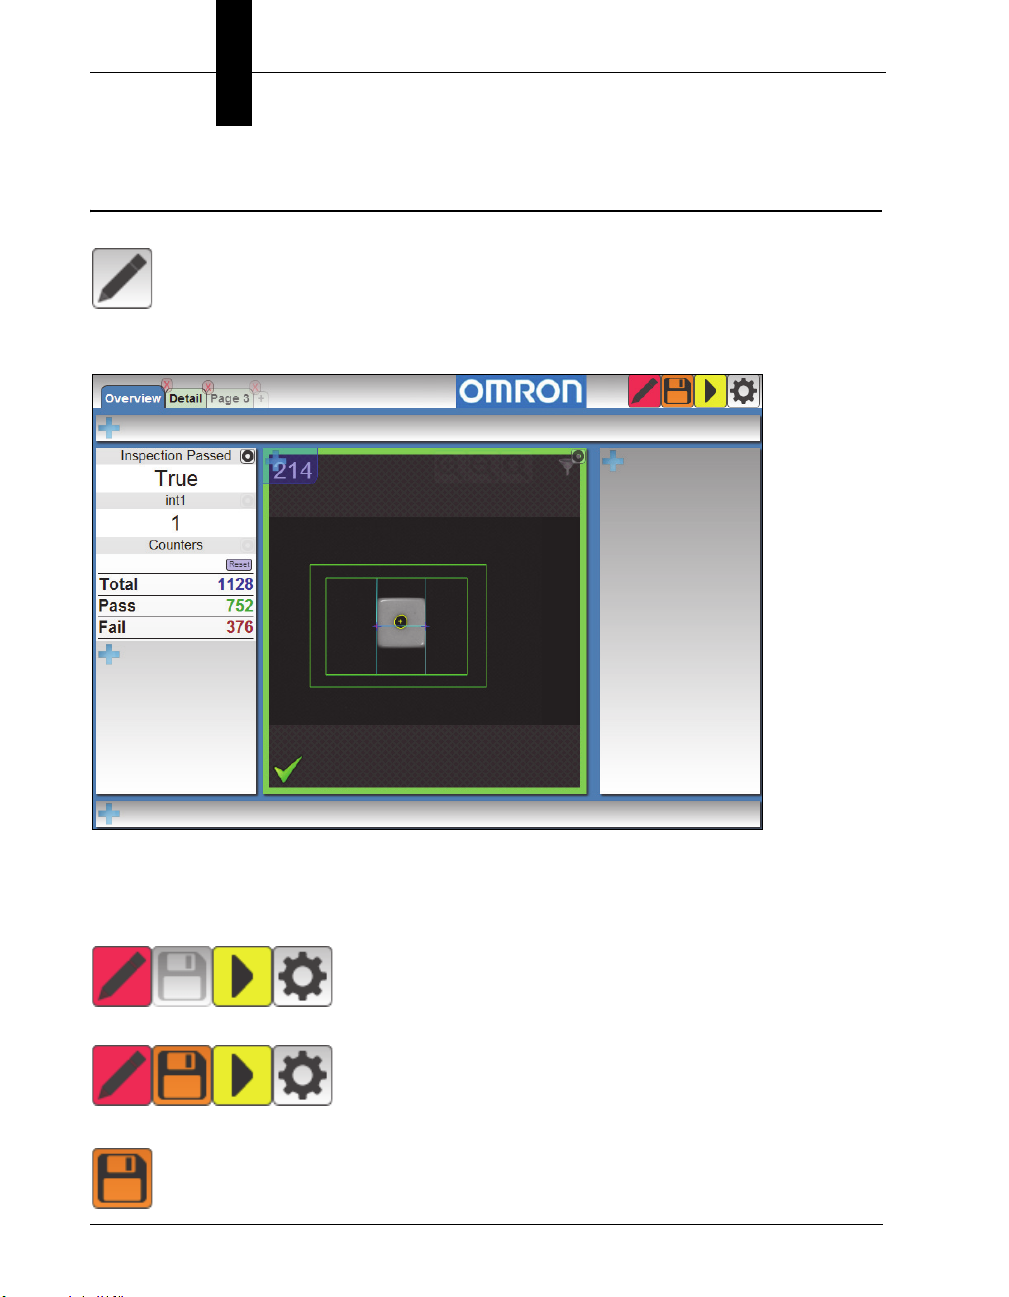
Layout Edit Mode
Layout Edit Mode can be toggled at any time by pressing this toolbar button:
or by pressing F10 on the keyboard.
In Layout Edit Mode, all panels are visible even if they are empty of widgets:
Notice that the top, right, and bottom panels can now be seen even though they are empty
of widgets.
When a change is made to the layout, the Save icon in the toolbar will be highlighted.
Before Change:
After Change:
Clicking the Save button will save the layout changes to the camera.
2-2
Getting Started with Omron WebMonitor
Page 21
Creating, Editing, and Removing Pages
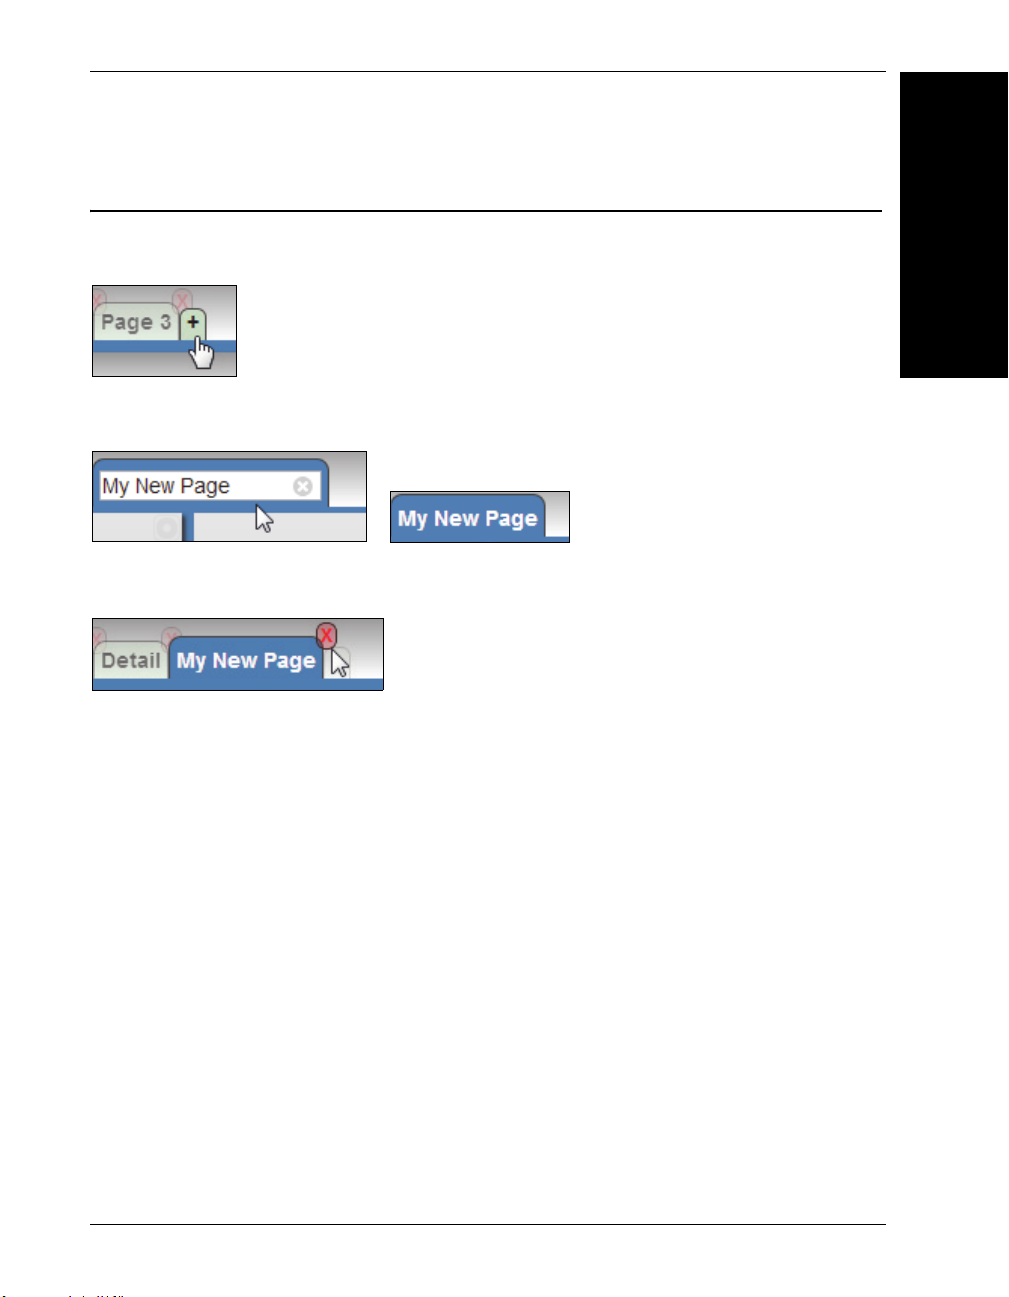
Creating, Editing, and Removing Pages
When in Layout Edit Mode, an extra button appears to the right of any existing page
selector buttons. Pressing this button will create a new empty page.
To change the title of a page, double-click the title (or long-press on a touchscreen
device). Type a new title and press Enter to accept or Esc to cancel.
To delete a page, click on the X that appears in the upper right corner of the page selector
button. Note that this is only available when in Layout Edit Mode.
2
Layout Editing
Getting Started with Omron WebMonitor 2-3
Page 22
Chapter 2 Layout Editing
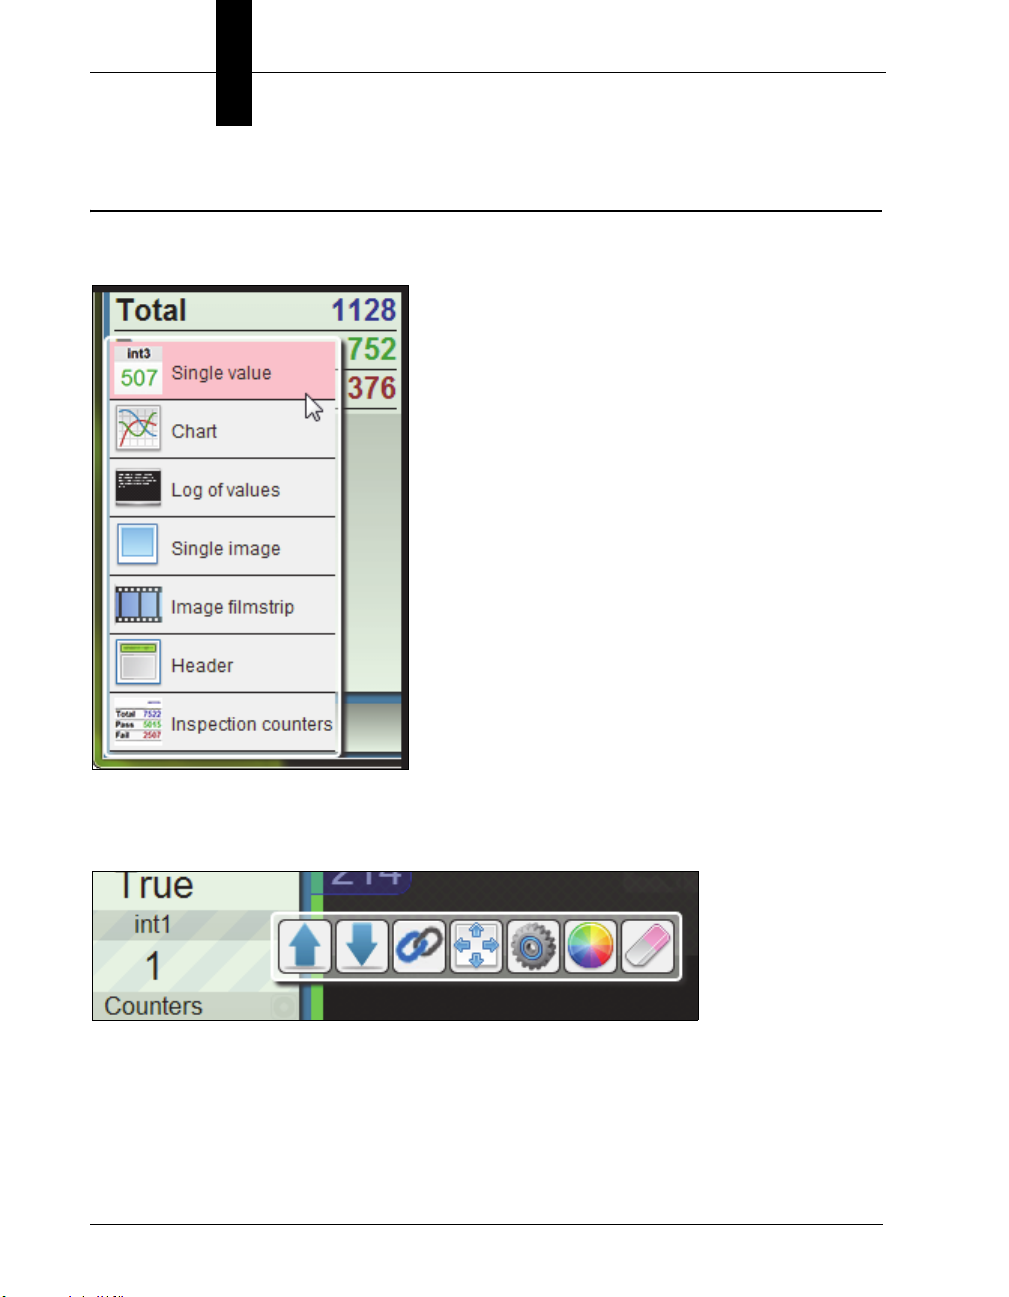
Inserting and Configuring a Widget
When in Layout Edit Mode, note the + buttons in each panel. Pressing one of these
buttons will bring up a menu of available widgets to insert.
Clicking Single Value, for example, will insert a widget that displays one Omron
Microscan Link value. The settings panel for the newly inserted widget is shown
automatically:
2-4
Getting Started with Omron WebMonitor
Page 23
Inserting and Configuring a Widget
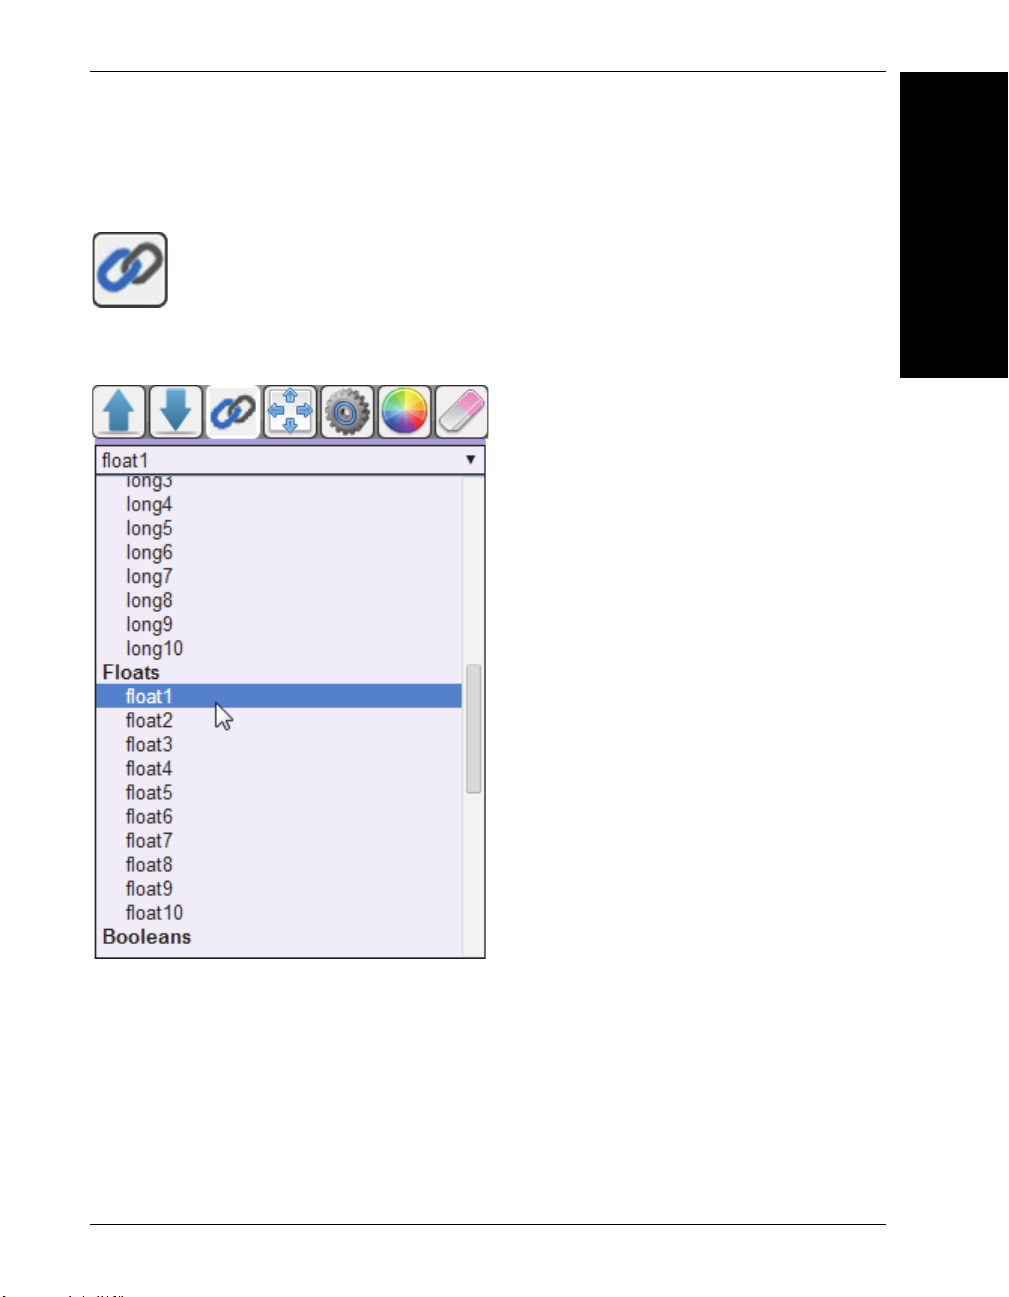
Buttons on the settings panel may vary from widget to widget. Clicking on the Omron
Microscan Link icon:
2
will show a combo box selector allowing a choice of Omron Microscan Link tags to monitor in the
widget.
Layout Editing
Getting Started with Omron WebMonitor 2-5
Page 24
Chapter 2 Layout Editing
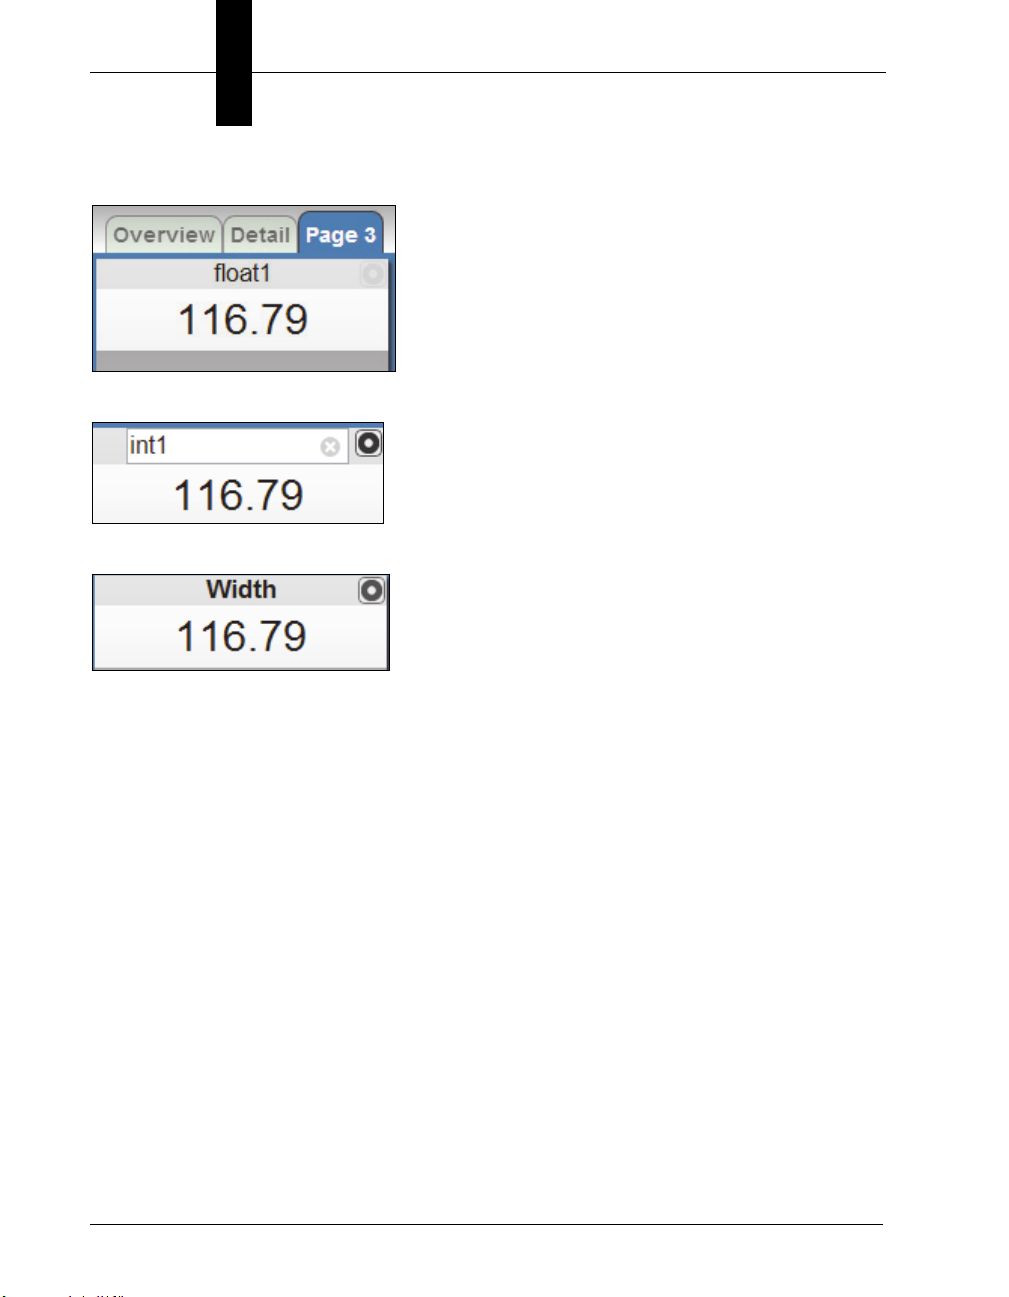
Selecting float1 in this example will “link” the widget to the Omron Microscan Link tag float1:
To change the title of the widget, double-click the header (or long-press on a touchscreen device).
Type a new title and press Enter to accept or Esc to cancel.
Note: Omron Microscan Link tags such as "int1" or "float1" must first be assigned in
AutoVISION by linking a value in the job to the link tag of a compatible type.
2-6 Getting Started with Omron WebMonitor
Page 25
The Widget Settings Panel
The Widget Settings Panel
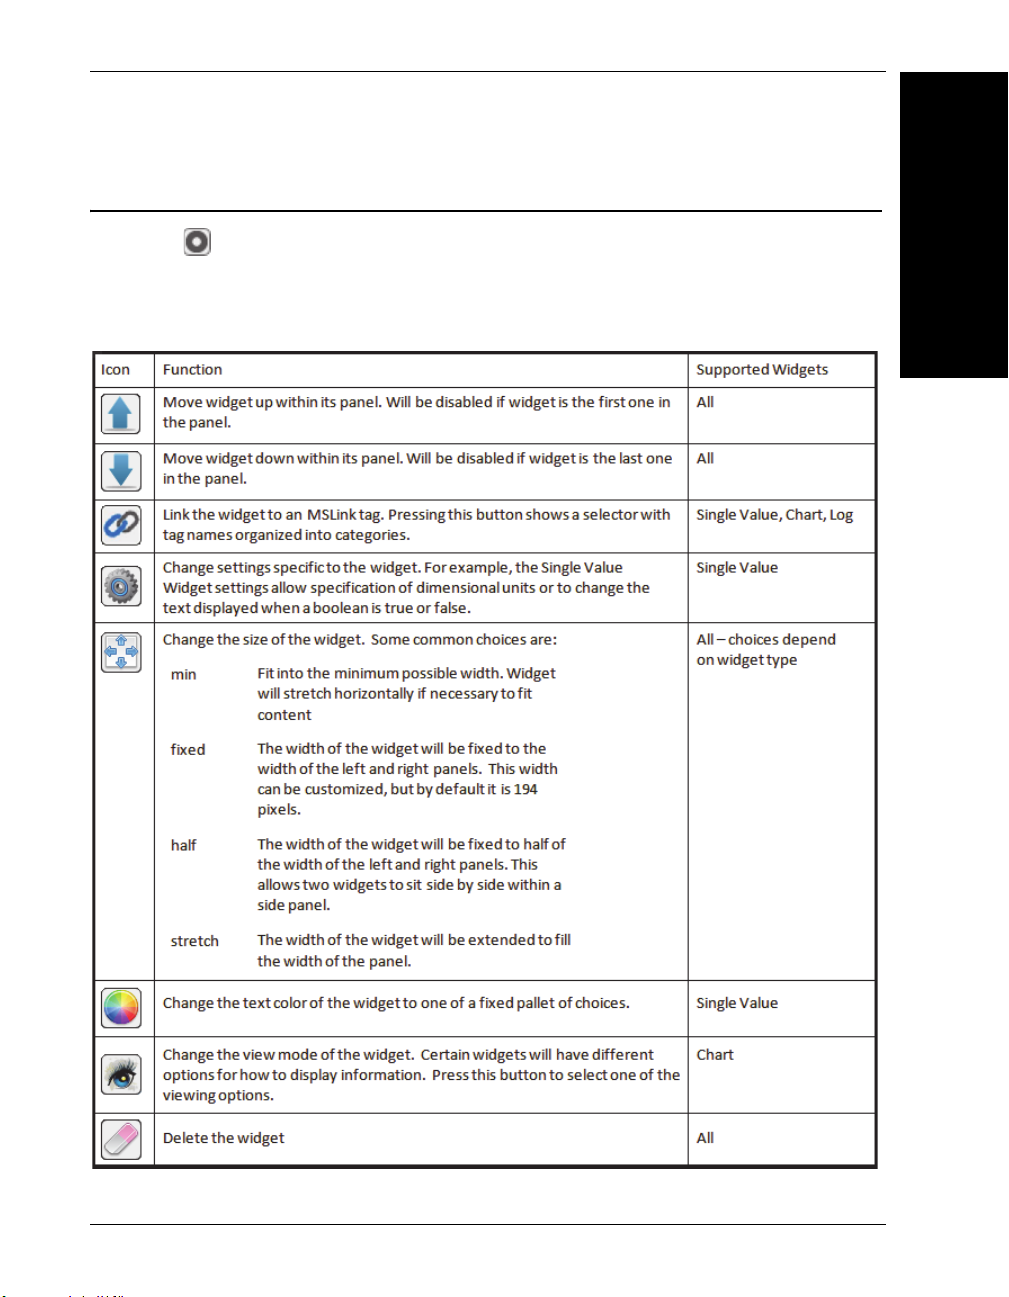
Notice the button in the upper right corner of the widget. This button appears on all
widgets (but is nearly invisible unless you hover over the widget). Pressing the button will
show the settings panel for that widget.
The buttons you will see on the settings panel include the following:
2
Layout Editing
Getting Started with Omron WebMonitor 2-7
Page 26

Chapter 2 Layout Editing
2-8
Getting Started with Omron WebMonitor
Page 27

3
CHAPTER 3 Tags
This section provides a list of tags and describes their functions.
3
Tags
Getting Started with Omron WebMonitor 3-1
Page 28
Chapter 3 Tags
Omron WebMonitor Tags
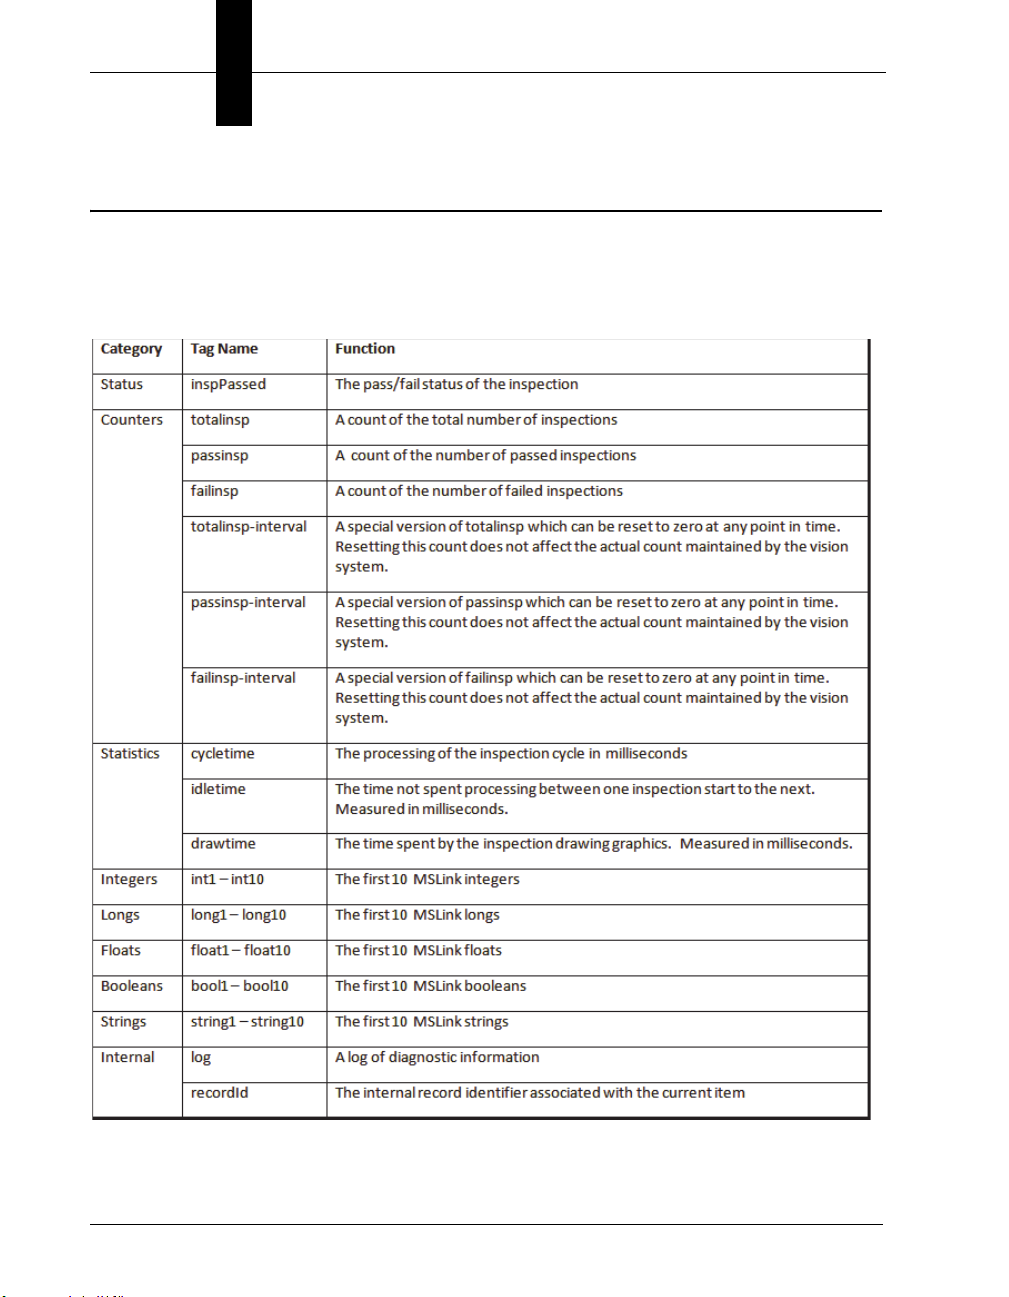
Omron WebMonitor widgets can be “linked” or associated with a number of data sources.
These mostly correspond to Omron Microscan Link tags, but Omron WebMonitor offers
additional items that are not strictly Omron Microscan Link tags. This document will refer
to all of these items as tags. The tags available are:
3-2
Getting Started with Omron WebMonitor
Page 29
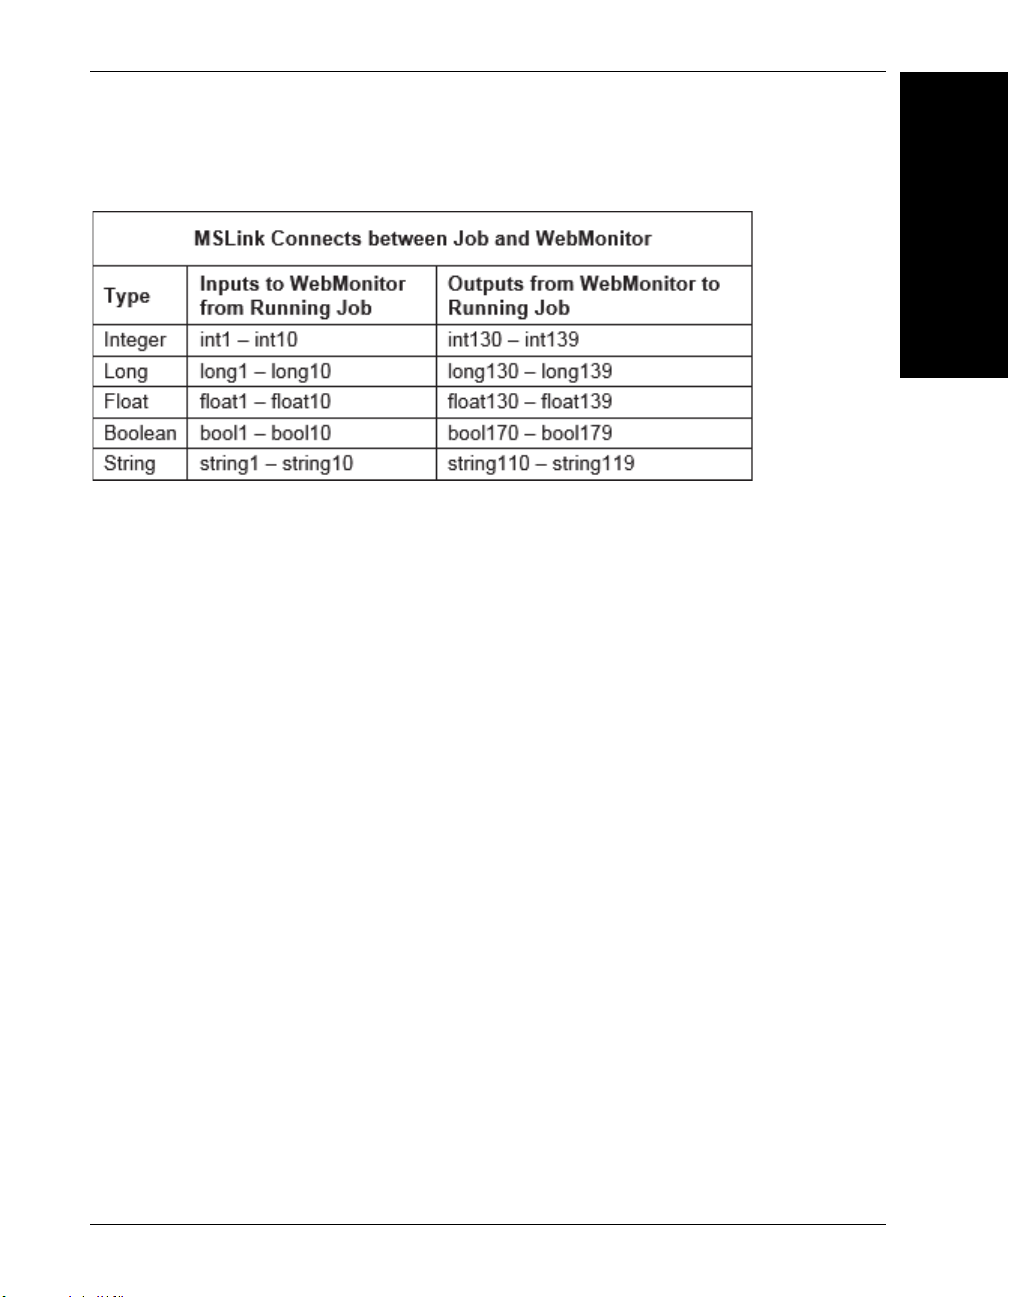
MSLink Connects between Job and WebMonitor
Omron WebMonitor Tags
3
Tags
Getting Started with Omron WebMonitor 3-3
Page 30

Chapter 3 Tags
3-4 Getting Started with Omron WebMonitor
Page 31

4
CHAPTER 4 Widgets
This section gives a detailed description of each widget available in the
Omron WebMonitor interface.
4
Widgets
Getting Started with Omron WebMonitor 4-1
Page 32

Chapter 4 Widgets
Read Value Widget
The Read Value widget shows a user-defined title and a value.
4-2
Getting Started with Omron WebMonitor
Page 33

Read Value Widget
An example of a user-defined title and value is shown below.
The title can be edited by double-clicking on it (or long-pressing on a touchscreen device).
To link the displayed value to a tag, use the settings button:
and select the Omron Microscan Link tag selector:
from the settings panel. Select the color selector:
to select a different text color for the displayed value.
4
Widgets
Getting Started with Omron WebMonitor 4-3
Page 34

Chapter 4 Widgets
With the Linked Status option set to no link, you can use the Text Color and
Background Color color options to change the colors of the Read Value widget.
The color picker allows you to select colors in several different ways. You can click on the
spectrum or specify a hex color value. Previous color choices are also available as a palette.
4-4
Getting Started with Omron WebMonitor
Page 35

Read Value Widget
It is also possible to change the colors based on the true / false value of an additional
linked status item. For example, you can change the look of a displayed measurement
based on whether the inspection has passed or failed. Selecting inspPassed for a Linked
Status will show additional color options.
4
Widgets
Getting Started with Omron WebMonitor 4-5
Page 36

Chapter 4 Widgets
The specified colors will now be used depending on the value of inspPassed.
Selecting the widget options button:
will display additional setup options.
If desired, text representing the units to display can be specified. This will only apply if the
value displayed is a number.
If the value displayed is boolean, the text to display for True / False can be changed. For
example you may want to change this to Passed / Failed.
4-6
Getting Started with Omron WebMonitor
Page 37

Write Value Widget
Write Value Widget
4
Widgets
The Write Value widget allows you to connect to an Omron Microscan Link tag and then
modify the value of that tag by typing a new value in a text box, or, in the case of a
StatusDm, by using a dropdown to switch between True and False options. This widget
can then be used to make changes to settings in your job, such as thresholds or match
strings, as long as the datums in question have been linked to Omron Microscan Link
tags that are accessible by Omron WebMonitor.
Getting Started with Omron WebMonitor 4-7
Page 38

Chapter 4 Widgets
After inserting a Write Value widget in your layout, the widget will be displayed with the
options toolbar opened, as shown here:
The widget will always default to using tag int130, but you can click the link icon to select
a different tag:
4-8
Getting Started with Omron WebMonitor
Page 39

Write Value Widget
Similar to the Read Value widget, the Write Value widget gives you a list of Integer, Long,
Float, Boolean, and String tags to choose from. But while the Read Value widget allows
you to select tags 1 through 10 for each data type (int1 – int10, float1 – float10, etc.), the
Write Value widget allows you to select the following tag ranges:
Integers: 130 – 139
Longs: 130 – 139
Floats: 130 – 139
Booleans: 170 – 179
Strings: 110 – 119
The reason for these ranges is that the numeric tags from 101 to 124, the boolean tags
from 101 to 164, and the string tags from 101 to 107 are part of the output assemblies for
PLC communications. This means that you cannot write to any tags in those ranges when
using a PLC. To be consistent for all users – regardless of whether you are connected to a
PLC or not – you can only connect to tags that are outside the control of the PLC.
Also note that any tags linked to datums in the currently running job are identified by listing
the name of the step and the datum to which the tag is linked:
4
Widgets
In the above example, the tag int130 is linked to the datum High Threshold of the step
named Blob Tool. int131 is linked to the datum Maximum Blob Size of the step Blob
Tool. The tags int132 and int133 are not linked to anything in the job.
Getting Started with Omron WebMonitor 4-9
Page 40

Chapter 4 Widgets
Once a Write Value widget has been added and you have selected the tag to which you
want to write, the widget will look similar to this:
The text box shows the current value of the tag.
the High Threshold datum of a Count Tool, and that threshold value is 122. To change
the value, type the new value and then Enter to send it to the camera. You can also force
a send by clicking the blue right arrow button shown above.
In the above example, int130 is linked to
Setting Up Links in a Job
Adding a Write Value widget to the Omron WebMonitor layout allows you to modify the
value of a datum in the job. For this to work, you must be sure to link the datum in
question to a tag with which Omron WebMonitor can communicate.
For example, assume you want to control the Match String of a Symbology Tool. You
would Link the Datum in the Job and Connect the Write Value Widget in Omron
WebMonitor.
Link the Datum in the Job
Open the Job in AutoVISION, go to the Decode Tool, and open the Match String editor:
Click the link icon to open the link editor.
4-10
Getting Started with Omron WebMonitor
Page 41

Notice that the link category combo box defaults to EIP Out.
These tags are reserved for use by PLCs.
Instead, use the combo box to switch to the Generic category:
Write Value Widget
4
Widgets
Getting Started with Omron WebMonitor 4-11
Page 42

Chapter 4 Widgets
This gives you access to the full range of available tags. The Write Value widget can
connect to string110 through string120. For this example, select string110. Now switch to
the Run view in AutoVISION.
Connect the Write Value Widget in Omron WebMonitor
Now you have a job on the camera with a Decode Tool that has its Match String datum
linked to string110. You can now add a Write Value widget to the Omron WebMonitor
layout, and configure it to write to string110, allowing you to set the Match String of the
Decode Tool.
• In Omron WebMonitor, click the Edit Layout button in the top-right corner.
• In the right-most panel, click the Add Widget button.
• Then select the Write Value option from the dropdown. The newly-added widget
connects to int130 by default. For this example, change the tag to string110 by
clicking the link button to open the list of available tags, and then scrolling down until
you are able to select string110.
4-12
Getting Started with Omron WebMonitor
Page 43

The widget should now look similar to this:
Write Value Widget
4
Widgets
• The text box shows the existing Match String value, if any. Type your new match stri
here. To send the new Match String to the camera, either type Enter or click the blue
arrow button.
ng
Getting Started with Omron WebMonitor 4-13
Page 44

Chapter 4 Widgets
Chart Widget
The Chart widget shows a chart of tag values over time.
4-14
Getting Started with Omron WebMonitor
Page 45

Chart Widget
There are two types of charts available: Bar and Line.
The chart is automatically scaled so that the minimum and maximum values are contained
on the chart, and the amount of data shown corresponds to the available history depth.
Data on the Chart widget reads from right to left, with the most recent values on the right.
When a data event is hovered over, the corresponding chart value is highlighted.
4
Widgets
The chart title can be edited by double-clicking on it (or long-pressing on a touchscreen
device). To link the chart to a tag, use the settings button:
and select the Omron Microscan Link tag selector:
from the settings panel.
To select a different chart type, select the View Mode button:
from the settings panel.
Getting Started with Omron WebMonitor 4-15
Page 46

Chapter 4 Widgets
Log of Values Widget
The Log of Values widget shows the values of the linked tag as a historical list.
4-16
Getting Started with Omron WebMonitor
Page 47

Log of Values Widget
The most recent value is at the top, and older values are listed in descending order below.
4
Widgets
To the left of each displayed value is a number representing the corresponding Data Event
Identifier. This corresponds to similar values seen in other widgets. Hovering over one of
the values higlights all values that correspond to the same event.
For example, if a filmstrip is displayed, the image that corresponds to the highlighted value
will also be highlighted.
The title can be edited by double-clicking on it (or long-pressing on a touchscreen device).
To link the log values to a tag, use the settings button:
and select the Omron Microscan Link tag selector:
from the settings panel.
Getting Started with Omron WebMonitor 4-17
Page 48

Chapter 4 Widgets
Single Image Widget
The Single Image widget represents the most central function of Omron WebMonitor. It
shows an image and its associated graphics.
Note: Omron WebMonitor does not currently support display of color images from color
cameras.
4-18
Getting Started with Omron WebMonitor
Page 49

Single Image Widget
The Single Image widget also permits zooming and panning to support pinch gestures on
touchscreen devices. The graphics are rendered as vector graphics, so zooming shows
more detail instead of making the lines thicker.
Note: If using Internet Explorer, the lines will appear thicker as you zoom in.
When added to the center panel, the Single Image widget automatically expands to
occupy the full area. Any other widgets added will appear over the image.
4
Widgets
The Single Image widget also displays a thick border whose color represents the
inspection status (green = pass, red = fail). In the bottom left corner either a green check
or red X is displayed, corresponding to the inspection status indicators within the Image
Filmstrip Widget.
Getting Started with Omron WebMonitor 4-19
Page 50

Chapter 4 Widgets
The Data Event Identifier is displayed in the upper left corner.
A zoom toolbar appears when hovered over.
Click to zoom in and to zoom out. The button zooms and centers the
image to be contained completely within the widget. If using a mouse, the scroll wheel can
be used to zoom in and out. If using a touchscreen device, pinch gestures can be used.
4-20
Getting Started with Omron WebMonitor
Page 51

Single Image Widget
Refresh Rate Selection
Omron WebMonitor has an internal timer that is used to refresh the image and data in the
dashboard. The Single Image Widget provides a dropdown control that can be used to
control the image and data refresh rate. It defaults to 1 refresh per second, but it can be
changed to 2/s, 4/s, 8/s or max, where “max” means it will refresh the data on the page as
fast as it can. The control for refresh rate is in the upper-right corner of the widget, next to
the zoom buttons:
Placing your mouse over this button will cause a button dropdown to pop up, and this will
present you with all available refresh rate options, including max, which is indicated by the
red-lined speedometer icon:
4
Widgets
The top-most button indicates the current selection and is used to open up the dropdown.
In the dropdown list, the current selection is highlighted blue. Click the refresh rate option
you want and the dropdown will close, while the new selection will be displayed in the
main button as shown above. So, if you clicked the 8/s button, the dropdown will close and
the main button will show the 8/s icon:
Getting Started with Omron WebMonitor 4-21
Page 52

Chapter 4 Widgets
Image Filmstrip Widget
The Image Filmstrip widget shows a history of images.
4-22
Getting Started with Omron WebMonitor
Page 53

Image Filmstrip Widget
Images are displayed from right to left, with the most recent images appearing on the right.
4
Widgets
Each filmstrip entry shows the inspection status by displaying eith
X in the lower right corner. The data event ID is shown in the upper left corner.
It is important to note that not every image can be captured by Omron WebMonitor. The
number of images available depends on bandwidth and timing considerations.
Therefore, it is likely that some images will be missing (even though the rest of the data
for that inspection is available). Any missing images are represented in the filmstrip by
vertical bars colored red for failed inspections or green for passed inspections.
Hovering over an item in the filmstrip will highlight all data corresponding to the same data
event. You can also hover over the missing image bars.
er a green check or red
Getting Started with Omron WebMonitor 4-23
Page 54

Chapter 4 Widgets
Clicking the filmstrip entry will select that item for review. This will load the widgets with the
data as it was at the time the event was recorded. If the image is missing, any image
widgets will display a missing image placeholder.
In the upper left corner of the Image Filmstrip widget is a filter button. Clicking this
button will filter what is shown in the filmstrip.
When the filter button is first clicked, only failed items will be displayed.
4-24
Getting Started with Omron WebMonitor
Page 55

Image Filmstrip Widget
Clicking the filter button again will change the filter so that only passed items are displayed.
Since it is permitted to have multiple instances of widgets, you can sort pass and fail
images into two groups.
4
Widgets
Getting Started with Omron WebMonitor 4-25
Page 56

Chapter 4 Widgets
Header Widget
The Header widget displays a user-configurable header.
4-26
Getting Started with Omron WebMonitor
Page 57

Header Widget
The header can be used to identify a group of widgets if necessary.
The title can be edited by double-clicking it or by long-pressing on a touchscreen device.
4
Widgets
Getting Started with Omron WebMonitor 4-27
Page 58

Chapter 4 Widgets
Inspection Counters Widget
The Inspection Counters widget displays the values of the interval version of the
inspection counts (totalinsp-interval, passinsp-interval, failinsp-interval).
4-28
Getting Started with Omron WebMonitor
Page 59

Inspection Counters Widget
Displaying the values of the interval version of inspection counts allows the counters to be
reset to zero without affecting the vision system’s actual counts.
The title can be edited by double-clicking it or by long-pressing on a touchscreen device.
4
Widgets
Getting Started with Omron WebMonitor 4-29
Page 60

Chapter 4 Widgets
Device Control Widget
The Device Control widget allows you to start and stop inspections, and to change the
currently loaded job.
4-30
Getting Started with Omron WebMonitor
Page 61

Device Control Widget
When you insert a Device Control widget into your layout, you will see something similar to
the following:
No configuration or set up of the Device Control widget is necessary. The widget is ready
to use as soon as you insert it.
Note: You should only insert one Device Control widget into your layout. Inserting two or
more could result in interface functionality errors.
Take Control Button
To start / stop or change jobs on your device, you must first take control of the device.
When you see the yellow lock icon at the left end of the widget, the device is locked (not
under your control).
Click the Take C o n trol button to enter the username and password as shown below.
4
Widgets
Getting Started with Omron WebMonitor 4-31
Page 62

Chapter 4 Widgets
If you enter the correct username and password, you will be granted control of the device.
The button will change to a green unlocked icon to indicate that the device is now under
your control, and all of the buttons in the widget will be enabled, as shown below.
If the device is already being controlled by another PC, or by AutoVISION or FrontRunner,
the lock icon on the Take Control button will be red.
This indicates that you cannot take control of the device until it is released by the other user.
Start Button
Clicking the Start button puts the inspections into Run mode on the device. This button is
highlighted in light blue when inspections are already running.
Stop Button
Clicking the Stop button takes all inspections out of Run mode. This button is highlighted
in light blue when inspections are already stopped.
4-32
Getting Started with Omron WebMonitor
Page 63

Device Control Widget
Save Job Button
If you are using the Write Value widget to make changes to values in the job, you can
click the Save Job button to re-save that job to its current slot or to a new slot. A context
menu will appear when you click the Save Job button.
This menu shows that the current job, LinkTest.avp, is saved to slot 2, and another job
named BlobTest.avp is saved to slot 1. You would choose 2: LinkTest.avp to re-save
the job to the same slot. Or you can choose New Slot (3), which will save the job to the
next available slot on the device, which, in this case, is slot 3.
4
Widgets
Job Change Button
Clicking the
the device. Clicking this button will cause a popup menu to appear that shows a list of all jobs
loaded on the device.
Getting Started with Omron WebMonitor 4-33
Job Change
button will switch between the jobs that are saved in flash memory on
Page 64

Chapter 4 Widgets
Click on the job to which you want to switch, and it will be loaded. The name of the
currently loaded job is always displayed to the right of the Job Change button. In this
example, if you click on slot2: SymbTest.avp, then the text Changing... would be
displayed to the right while the job change is happening. When the changeover was
complete, you would see the following:
If the job change fails, a short error message will be displayed instead of the AVP name.
Save Slot As
When you save a job to a slot, you will be asked to enter a job name. Enter a job name of
your choice and click OK to save the job to the specified slot.
4-34 Getting Started with Omron WebMonitor
Page 65

5
CHAPTER 5 REST APIs
This section describes how to use REST (Representational State
Transfer) APIs to access data from the camera.
5
REST APIs
Getting Started with Omron WebMonitor 5-1
Page 66

Chapter 5 REST APIs
REST APIs
REST APIs allow you to access data from the camera over the web standard HTTP
protocol.
Using a web browser, requests to the camera are made using the IP address of the
camera as the URL root. Version 1 of the APIs are accessed using the path prefix of
/api/v1/.
For example, to access the SVG API of a camera at IP address 192.168.188.2, the URL
to the REST service would be: http://192.168.188.2/api/v1/svg.
5-2 Getting Started with Omron WebMonitor
Page 67

REST APIs
REST APIs are also used to exchange data with the camera. To interact with the camera’s
APIs using a standard web browser, a REST client browser add-on can be used. There
are a variety of REST clients available for most browsers.
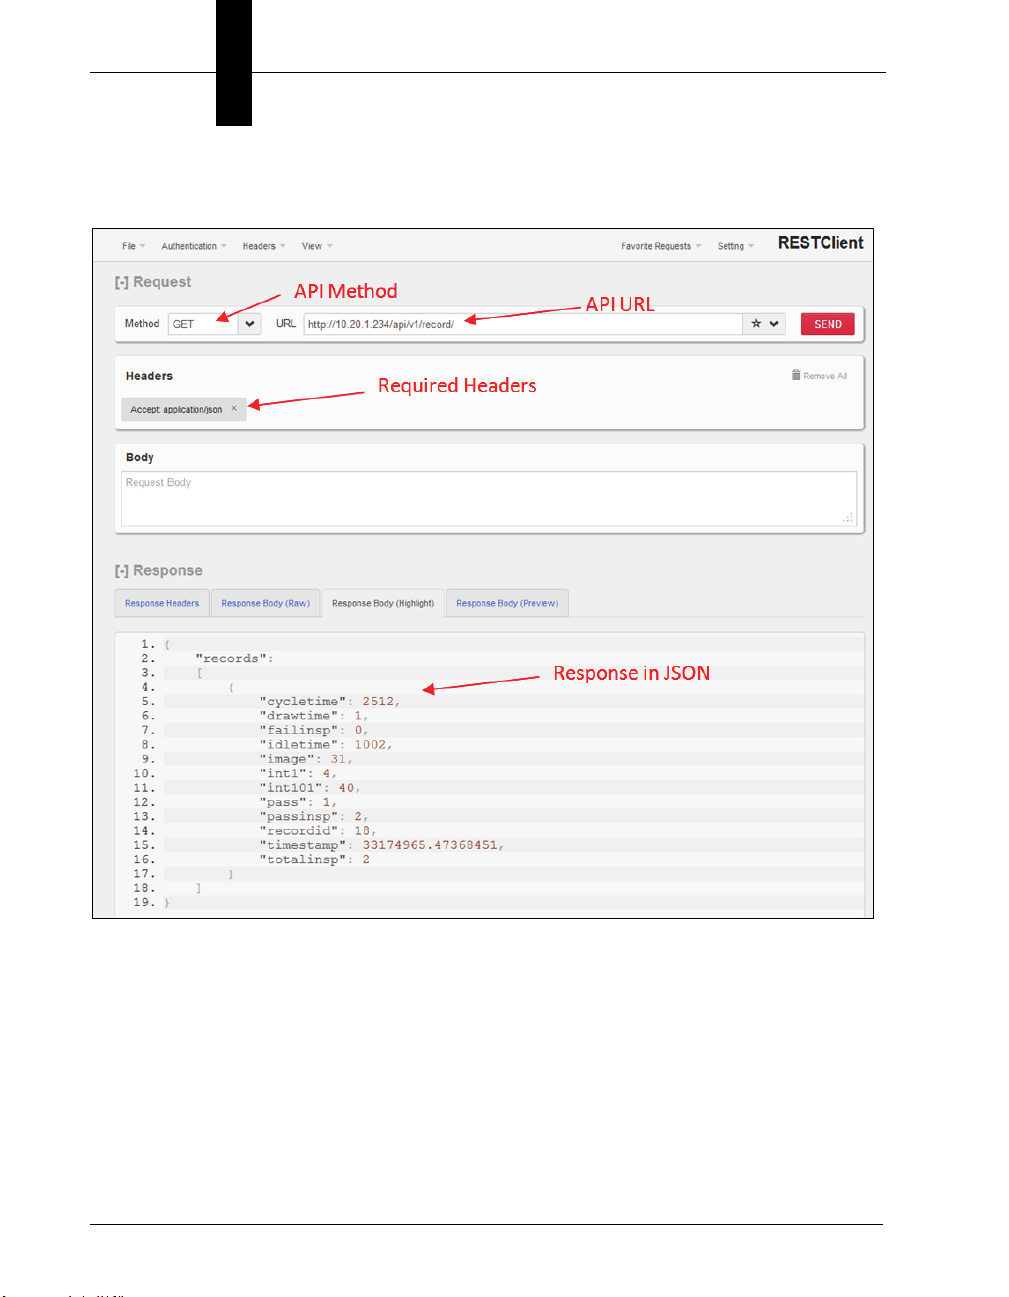
The following example shows RESTClient for the Firefox browser.
5
REST APIs
Getting Started with Omron WebMonitor 5-3
Page 68
Chapter 5 REST APIs
Using a REST client, a request to receive data in JSON format can be made to the
camera and viewed in the browser.
5-4
Getting Started with Omron WebMonitor
Page 69

command
Resource URL
Response Body
command
This API passes the body of the message to the serial command
processor. The result string from the serial command processor is
returned as the body of the response message.
The body of the message is a command string just as it would be typed
into a serial terminal to the camera, with no extra quotes or delimiters. A
terminating CR or LF is not necessary.
PUT /api/v1/command
Content-Type: text/plain
Accept: text/plain
Body: “command text”
5
REST APIs
Command response as text
Example
PUT /api/v1/command
Content-Type: text/plain
Accept: text/plain
jobinfo
Response Body
slot4=EIP_demo.avp?
Getting Started with Omron WebMonitor 5-5
Page 70

Chapter 5 REST APIs
data
This API sets or retrieves the value of a tag, tag array or all tags in a service. The
response is in JSON and the header must declare it is accepted. When setting data, the
body must be in JSON with a top level element named “data” with the values to be set.
Resource URL
GET /api/v1/data/<service>
Accept: application/json
GET /api/v1/data/<tag>
Accept: application/json
GET /api/v1/data/<tag><n>
Accept: application/json
Examples
URL
GET /api/v1/data/float1?count=2
Response Body
{ “data” : [1.234, 5.678] }
URL
PUT /api/v1/data/int5
Body
{ “data” : “123” }
5-6
Getting Started with Omron WebMonitor
Page 71

stats
This API retrieves the inspection statistics for up to 10 inspections or
resets the counters. The response is in JSON.
Resource URL
GET /api/v1/stats
Accept: application/json
PUT /api/v1/stats
A PUT clears the inspection counters. No other arguments are needed.
Examples
URL
GET /api/v1/stats
stats
5
REST APIs
Response Body
{
"totalinsp" : [ 19, 0, 0, 0, 0, 0, 0, 0, 0, 0] ,
"passinsp" : [ 19, 0, 0, 0, 0, 0, 0, 0, 0, 0] ,
"failinsp" : [ 0, 0, 0, 0, 0, 0, 0, 0, 0, 0] ,
"trigover" : [ 0, 0, 0, 0, 0, 0, 0, 0, 0, 0] ,
"procover" : [ 0, 0, 0, 0, 0, 0, 0, 0, 0, 0] ,
"fifoover" : [ 0, 0, 0, 0, 0, 0, 0, 0, 0, 0] ,
"timeout" : [ 0, 0, 0, 0, 0, 0, 0, 0, 0, 0]
}
totalinsp: Total inspections
passinsp: Passed inspections
Getting Started with Omron WebMonitor 5-7
Page 72

Chapter 5 REST APIs
failinsp: Failed inspections
trigover: Trigger overruns
procover: Process overruns
fifoover: FIFO overruns
timeout: Inspection Timeouts
URL
PUT /api/v1/stats
5-8
Getting Started with Omron WebMonitor
Page 73

record
record
This API retrieves an inspection record result. With no report index, the
latest report is returned. A specific inspection record can be retrieved by
appending the index to the URI. Arguments can be added in the form of
argument=value to filter the return set of records that match the filter
requirements.
Inspection records will contain the following data in addition to any global
data values in use by Omron Microscan Link within that inspection.
5
REST APIs
Resource URL to Get Last Record
GET /api/v1/record
Accept: application/json
Response Body
The last completed record in a json array called “records”
Example
GET /api/v1/record
Accept: application/json
Getting Started with Omron WebMonitor 5-9
Page 74

Chapter 5 REST APIs
Response Body
{
"records":
[
{
"cycletime": 475,
"drawtime": 1,
"failinsp": 2,
"idletime": 1084,
"image": 0x00011eed000a1e1f,
"int1": 1,
"int101": 40,
5-10
"pass": 1,
"passinsp": 3,
"recordid": 21,
"timestamp": 8895730.13184849,
"totalinsp": 5
}
]
}
Getting Started with Omron WebMonitor
Page 75

Resource URL to Get a Specific Record
GET /api/v1/record/<recordid>
Accept: application/json
Response Body
A single record with the matching record I.D. if it
exists; an empty array if it does not.
record
5
REST APIs
Getting Started with Omron WebMonitor 5-11
Page 76

Chapter 5 REST APIs
filters
Records can be filtered by the contents of the record by appending the
filter requirements as arguments to the request. A specific value can be
specified (eg. int1=4). The symbols (a,b) [a,b] can be used to specify a
range of values to include () for a non-inclusive range, [] for inclusive. (
and [ can be used independently on either end of the range (eg. (4,10] or
[5,11) for values 5,6,7,8,9,10 )
For example, to include all inspections from record I.D. 5 to 10:
GET /api/v1/record?recordid=[5,10]
To include recordids from 5 to 10, not including 5:
GET /api/v1/record?recordid=(5,10]
To include all record I.D.s following record I.D. 5 to an unbounded limit,
omit the second argument.
GET /api/v1/record?recordid=(5,]
5-12
Filters can be combined to further limit the returned results. To get all the
records between 100 and 200 inclusive that failed only:
GET /api/v1/record?recordid=[100,200]&pass=0
Special filters to limit the number of returned results start with ‘!’ include
!count and !last. When used with a filter range request !count=<x> can
limit the number of results returned to x. To return up to the first 5 record
starting at record 100:
GET /api/v1/record?recordid=[100,]&!count=5
Instead of returning the first 5 records matching the filter conditions
!last=1 can be used to return the last set of matching records. To return
the last failed record only from all records:
GET /api/v1/record?recordid=[1,]&!count=1&!last=1
Getting Started with Omron WebMonitor
s
Page 77

image
image
This API retrieves an image with a default type of PNG. Buffer can be either from an index
or most recent.
5
Note: Image ID is found via the record command.
Resource URL
camera URL /api/v1/image
retrieves the most recent acquired image.
camera URL /api/v1/image/<id>
retrieves image for the buffer id.
returns an image object of type PNG by default.
Examples
URL
10.20.1.191 /api/v1/image/0x00011eed000a1e1f
Response Image
REST APIs
Getting Started with Omron WebMonitor 5-13
Page 78

Chapter 5 REST APIs
svg
This API retrieves the SVG graphics for a given image ID.
Note: Image ID is found via the record command.
Resource URL
camera URL /api/v1/svg/<id>
Examples
URL
10.20.1.191 /api/v1/svg/0x00011eed000a1e1f
Response Image
5-14
Getting Started with Omron WebMonitor
Page 79

file
This API retrieves a directory listing for the web server directory or sub
directory of the web server using a GET request. It also allows for
uploading of files via a POST request. If the file uploaded ends with the
extension .zip the file will be unzipped in the specified folder.
Resource URL
GET /api/v1/file
Accept: application/json
retrieves the root file directory of the web server.
GET /api/v1/file/<path>
Accept: application/json
retrieves image for the sub directory <path>.
Returned Data Values
file
5
REST APIs
name Directory or file name
dir True if a directory, false if a file
size File size if object is a file, in bytes
POST /api/v1/file
Content-Type: multipart/form-data
uploads a file to the root folder of the web server.
POST /api/v1/file/<path>
Content-Type: multipart/form-data
uploads the attached file to the sub directory <path>.
Getting Started with Omron WebMonitor 5-15
Page 80

Chapter 5 REST APIs
GET Example
URL
GET /api/v1/file/app
Reply
{
"data": [
{
"name": "hmi",
"dir": true,
"size": 0
},
{
5-16
"name": "img_demo",
"dir": true,
"size": 0
},
{
"name": "svg_demo",
"dir": true,
"size": 0
}
]
}
Getting Started with Omron WebMonitor
Page 81

POST Example HTML Form File Selector
<form method="POST" action="/api/v1/file/app/myapp"
enctype="multipart/form-data">
file
5
<input type="file" name="file" />
<input type="submit" value="Upload" />
</form>
POST Example jQuery Ajax Call Using FormData from an HTML Form File Selector
<form id="target" enctype="multipart/form-data">
<input id="file" type="file" name="file" />
<input type="submit" value="Upload" /> <br/>
</form>
var fdata = new FormData($('form')[0]);
$.ajax({
url: '/api/v1/file/app/myapp',
type: 'POST',
data: fdata,
REST APIs
cache: false,
contentType: false,
processData: false,
success: function(data, textStatus, jqXHR){
}
});
Getting Started with Omron WebMonitor 5-17
Page 82

Chapter 5 REST APIs
5-18
Getting Started with Omron WebMonitor
Page 83

6
CHAPTER 6 Installing and Updating
Omron WebMonitor on a
Smart Camera
This section describes how to install and update Omron WebMonitor on a
smart camera for use with AutoVISION and Visionscape.
6
Updating
WebMonitor
Installing and
Getting Started with Omron WebMonitor 6-1
Page 84

Chapter 6 Installing and Updating Omron WebMonitor on a Smart Camera
Installing Omron WebMonitor on a Smart Camera
The Omron WebMonitor web interface can be installed on Omron Microscan smart
cameras using the Smart Camera Firmware Update Tool.
A .zip file containing Omron WebMonitor files is placed on the PC during AutoVISION
installation, and that .zip file is pushed to the camera during a firmware upgrade using the
Smart Camera Firmware Update Tool.
The Smart Camera Firmware Update Tool sends the. zip file by FTP along with the other
firmware files. The camera extracts the files from the .zip file as part of the upgrade process.
Note: The Omron WebMonitor .zip file is sent by FTP only when the smart camera is
being upgraded.
Firmware and Omron WebMonitor install in six stages:
• Transfer;
• Prepare;
• Apply DSP Update;
• Apply Kernel Update;
• Apply Web Interface Update (Omron WebMonitor Update);
• Reboot.
The images on the following pages show examples of a simultaneous Omron WebMonitor
and firmware
6-2
installation process.
Getting Started with Omron WebMonitor
Page 85

Apply DSP Update
Installing Omron WebMonitor on a Smart Camera
6
Updating
WebMonitor
Installing and
Getting Started with Omron WebMonitor 6-3
Page 86

Chapter 6 Installing and Updating Omron WebMonitor on a Smart Camera
Apply Kernel Update
6-4
Getting Started with Omron WebMonitor
Page 87

Installing Omron WebMonitor on a Smart Camera
Apply Web Interface Update (Omron WebMonitor Update)
6
Updating
WebMonitor
Installing and
Getting Started with Omron WebMonitor 6-5
Page 88

Chapter 6 Installing and Updating Omron WebMonitor on a Smart Camera
Updating Omron WebMonitor on a Smart Camera
Omron WebMonitor is automatically updated as part of any camera firmware upgrade. It
is also possible to update Omron WebMonitor by itself without updating other camera
firmware. This is done by pressing the Control-W key combination while selecting the
camera to update from the dropdown list.
Once the camera has been selected, choose the desired version of Omron WebMonitor in
Select the Firmware Version dropdown menu and then click the Update Firmware
the
button. A camera reboot is not necessary after the update and the unpacked Omron
WebMonitor files are immediately ready for use.
6-6
Getting Started with Omron WebMonitor
Page 89

A
APPENDIX A Changing the Omron
WebMonitor HTTP Port
for PC-Based Systems
This section contains information about how to change the Omron
WebMonitor HTTP port for PC-based systems.
A
Port
Changing
WebMonitor HTTP
Getting Started with Omron WebMonitor A-1
Page 90

Appendix A Changing the Omron WebMonitor HTTP Port for PC-Based Systems
Changing the Omron WebMonitor HTTP Port
The Omron WebMonitor HTTP port for PC-based systems can be changed to a value
other than 8080 by adding a registry key. This is useful when software is installed on PCs
that are already using port 8080 for an application other than Omron WebMonitor.
Important: This function is for PC-based systems only. Cameras are fixed at port 80.
For 32-Bit Systems
To change the Omron WebMonitor HTTP port to a value other than 8080, add the following
registry key:
HKEY_LOCAL_MACHINE\SOFTWARE\Visionscape\Network\[HttpPort]
The [HttpPort] value must be a string containing the desired port number.
You must also cycle the Visionscape Backplane when changing the server setting.
The example below shows the HTTP Port changed from 8080 to 8888. Notice that the
localhost address now shows 8888 as the port number.
For 64-Bit Systems
To change the Omron WebMonitor HTTP port to a value other than 8080, add the following
registry key:
HKEY_LOCAL_MACHINE\SOFTWARE\Wow6432Node\Visionscape\Network\[HttpPort]
The [HttpPort] value must be a string containing the desired port number.
You must also cycle the Visionscape Backplane when changing the server setting.
As in the example above, the localhost address will show the new port number.
A-2 Getting Started with Omron WebMonitor
Page 91

B
APPENDIX B Omron WebMonitor
Localization
This section contains information about how to translate and localize
the Omron WebMonitor user interface.
B
Localization
Omron WebMonitor
Getting Started with Omron WebMonitor B-1
Page 92

Appendix B Omron WebMonitor Localization
Omron WebMonitor Localization
Omron WebMonitor can display text in multiple languages. A language resource file must
be added to the device for each supported language.
Switching Between Languages
Change languages in Omron WebMonitor from the settings menu in the upper-right corner:
Note: Only English and Japanese are currently installed by default.
Any languages that have been added to the device are automatically added to the end of
the menu shown above. A check mark is displayed next to the currently active language.
Click the language you wish to use, and the Omron WebMonitor page will be re-loaded in
that language.
B-2 Getting Started with Omron WebMonitor
Page 93

Omron WebMonitor Localization
Language Resource Files
Location: The language files must be located here on the device:
\http_mv\app\hmi\locales
Naming Convention: The name of the file should be <country code>_resources.json,
where <country code> refers to the 2-digit country code designation for the language.
For example, German is de, English is en, Chinese is zh, etc. The resource file for
German would be named de_resources.json.
Contents: A language resource file is a .json file that must have the following contents:
{
"name": "English",
"countryCode": "en",
"data": {
"KEY_INSP_PASSED": "Inspection Passed",
"KEY_COUNTERS": "Counters",
"KEY_ACTION": "Action",
…
name: This is the text that you want to be displayed in the Settings menu of Omron
WebMonitor for this language.
countryCode: This is the 2-digit code for your language, the same code with which you
named your file. These codes can be found here:
https://en.wikipedia.org/wiki/List_of_ISO_639-1_codes
data: This is where the key / value pairs are stored. Omron WebMonitor uses the keys in
this section to look up the correct strings to display.
Adding a New Language
1. Always start with the English resource file, "en_resources.json". Make a copy of this
file, and rename it using the country code of your new language. For this example,
let's assume that we are creating a new file with German translations, so the name
would be "de_resources.json".
2. Open the file in any text editor (Notepad++ works well), and change the following:
• name: Change this to "Deutsche".
• countryCode: Change this to "de".
3. Now send this updated file to your translation house. They should translate all of the
English strings in the "data" section into German. Note: It is imperative that the key
values in this section NOT be changed, only the values should be translated.
4. When your translated file is returned to you, simply copy it to your camera, putting it in
the \http_mv\app\hmi\locales folder.
5. Now reload Omron WebMonitor, and your language will be automatically detected,
and offered as an option in the settings menu.
B
Localization
Omron WebMonitor
Getting Started with Omron WebMonitor B-3
Page 94

Authorized Distributor:
© OMRON Corporation 2020 All Rights Reserved.
In the interest of product improvement,
specifications are subject to change without notice.
Cat. No. 84-9111024-02
OMRON Corporation Industrial Automation Company
OMRON ELECTRONICS LLC
2895 Greenspoint Parkway, Suite 200
Hoffman Estates, IL 60169 U.S.A.
Tel: (1) 847-843-7900/Fax: (1) 847-843-7787
Regional Headquarters
OMRON EUROPE B.V.
Wegalaan 67-69, 2132 JD Hoofddorp
The Netherlands
Tel: (31)2356-81-300/Fax: (31)2356-81-388
Contact: www.ia.omron.com
Kyoto, JAPAN
OMRON ASIA PACIFIC PTE. LTD.
No. 438A Alexandra Road # 05-05/08 (Lobby 2),
Alexandra Technopark,
Singapore 119967
Tel: (65) 6835-3011/Fax: (65) 6835-2711
OMRON (CHINA) CO., LTD.
Room 2211, Bank of China Tower,
200 Yin Cheng Zhong Road,
PuDong New Area, Shanghai, 200120, China
Tel: (86) 21-5037-2222/Fax: (86) 21-5037-2200
1220 (1119)
 Loading...