

Page 1
User's Guide
Shop online at
omega.com
email: Info@omega.com
For latest product manuals:
omegamanual.Info
FMG-1000-DLAUNL Version 2
Software Guide for the FMG-1000-DLA Data Logger
Page 2

Servicing North America:
U.S.A.: One Omega Drive, P.O. Box 4047
ISO 9001 Certified
Stamford, CT 06907-0047
TEL: (203) 359-1660 FAX: (203) 359-7700
e-mail: info@omega.com
Canada: 976 Bergar
Laval (Quebec) H7L 5A1, Canada
TEL: (514) 856-6928 FAX: (514) 856-6886
e-mail: info@omega.ca
For immediate technical or application assistance:
U.S.A. and Canada: Sales Service: 1-800-826-6342 / 1-800-TC-OMEGA
®
Customer Service: 1-800-622-2378 / 1-800-622-BEST
®
Engineering Service: 1-800-872-9436 / 1-800-USA-WHEN
®
TELEX: 996404 EASYLINK: 62968934 CABLE: OMEGA
Mexico: En Espan˜ol: (001) 203-359-7803 e-mail: espanol@omega.com
FAX: (001) 203-359-7807 info@omega.com.mx
Servicing Europe:
Benelux: Postbus 8034, 1180 LA Amstelveen, The Netherlands
TEL: +31 (0)20 3472121 FAX: +31 (0)20 6434643
Toll Free in Benelux: 0800 0993344
e-mail: sales@omegaeng.nl
Czech Republic: Frystatska 184, 733 01 Karviná, Czech Republic
TEL: +420 (0)59 6311899 FAX: +420 (0)59 6311114
Toll Free: 0800-1-66342 e-mail: info@omegashop.cz
France: 11, rue Jacques Cartier, 78280 Guyancourt, France
TEL: +33 (0)1 61 37 2900 FAX: +33 (0)1 30 57 5427
Toll Free in France: 0800 466 342
e-mail: sales@omega.fr
Germany/Austria: Daimlerstrasse 26, D-75392 Deckenpfronn, Germany
TEL: +49 (0)7056 9398-0 FAX: +49 (0)7056 9398-29
Toll Free in Germany: 0800 639 7678
e-mail: info@omega.de
United Kingdom: One Omega Drive, River Bend Technology Centre
ISO 9002 Certified
Northbank, Irlam, Manchester
M44 5BD United Kingdom
TEL: +44 (0)161 777 6611 FAX: +44 (0)161 777 6622
Toll Free in United Kingdom: 0800-488-488
e-mail: sales@omega.co.uk
OMEGAnet®Online Service Internet e-mail
omega.com i n f o @ o m e g a . c o m
It is the policy of OMEGA Engineering, Inc. to comply with all worldwide safety and EMC/EMI
regulations that apply. OMEGA is constantly pursuing certification of its products to the European New
Approach Directives. OMEGA will add the CE mark to every appropriate device upon certification.
The information contained in this document is believed to be correct, but OMEGA accepts no liability for any
errors it contains, and reserves the right to alter specifications without notice.
WARNING: These products are not designed for use in, and should not be used for, human applications.
Page 3

TABLE OF CONTENTS
Install Software ....................................................................................................................................................................... Page 1
Hardware/Software Requirements
Installation Instructions
Set Up Your Logger .................................................................................................................................................................. Page 2
First Time Logger Setup
Initialize Logger
Download Data From the Logger ............................................................................................................................................ Page 5
Customize Display Variables .................................................................................................................................................. Page 6
Selecting Units
Selecting Time Period
Averaging Filter
View and Print Data ................................................................................................................................................................ Page 9
Manage Files .......................................................................................................................................................................... Page 10
Selecting Files
Naming Files
Appending Files
Export and Analyze Data ......................................................................................................................................................Page 11
Page 4

INSTALL SOFTWARE
FMG-1000-DLAUNL V.2 software is designed as part of the Omega FMG-1000-DLA DataLogger system. The software is used
to set up the Logger, to download and manage data les, and to analyze and export data.
HARDWARE/SOFTWARE REQUIREMENTS
Use of the Version 2 software requires the following hardware/software:
• FMG-1000-DLA DataLogger
• Omega data cable
• PC computer with Windows 98, NT, 2000, XP, or Vista
• CD-ROM drive
• 0.5 MB disk pace
• Serial connection port or USB-to-Serial adapter*
*Four adapters have been tested for compatibility:
• IO Gear UC-232A
• Keyspan USA-19HS
• Airlink101 AC-USBS
• Goldx GXMU-1200
INSTALLATION INSTRUCTIONS
1. Close all other programs running on your computer.
2. Insert the software CD in your CD-ROM drive. The program should begin auto-loading within about 30
seconds. (If it does not automatically start loading, open the CD drive on your desktop and click
on setup.exe.)
3. When the “Welcome…Wizard” screen opens, click Next.
4a. If this is your rst installation of the version 2 software, read the License Agreement, select “I accept”’ and
click Next.
4b. If you have an earlier copy on your computer, follow instructions to Uninstall it.
Begin again at Step 1 to install the new copy.
5. Input User Name and Organization, select desired access level, and click Next.
6. At the “Ready to Install” screen, review your selections, use Back to make corrections as necessary.
Make note of the target location of your FI Program. Click Install.
7. At “Completed” screen, click Finish.
After installation is complete, it will be stored in a folder under the All Programs list in your computer’s Start menu.
Page 1
Page 5
SET UP YOUR LOGGER
FIRST-TIME LOGGER SET-UP
The following instructions apply to first-time set-up only. Re-setting procedures are the same except that you must rst
download any data you wish to save.
CAUTION. To prevent data loss, if you are re-setting
a Logger that has been previously used, follow the
procedure for rst time set-up EXCEPT that you must
rst download any data you wish to save. Any prior data
will be erased during set-up.
Open Software
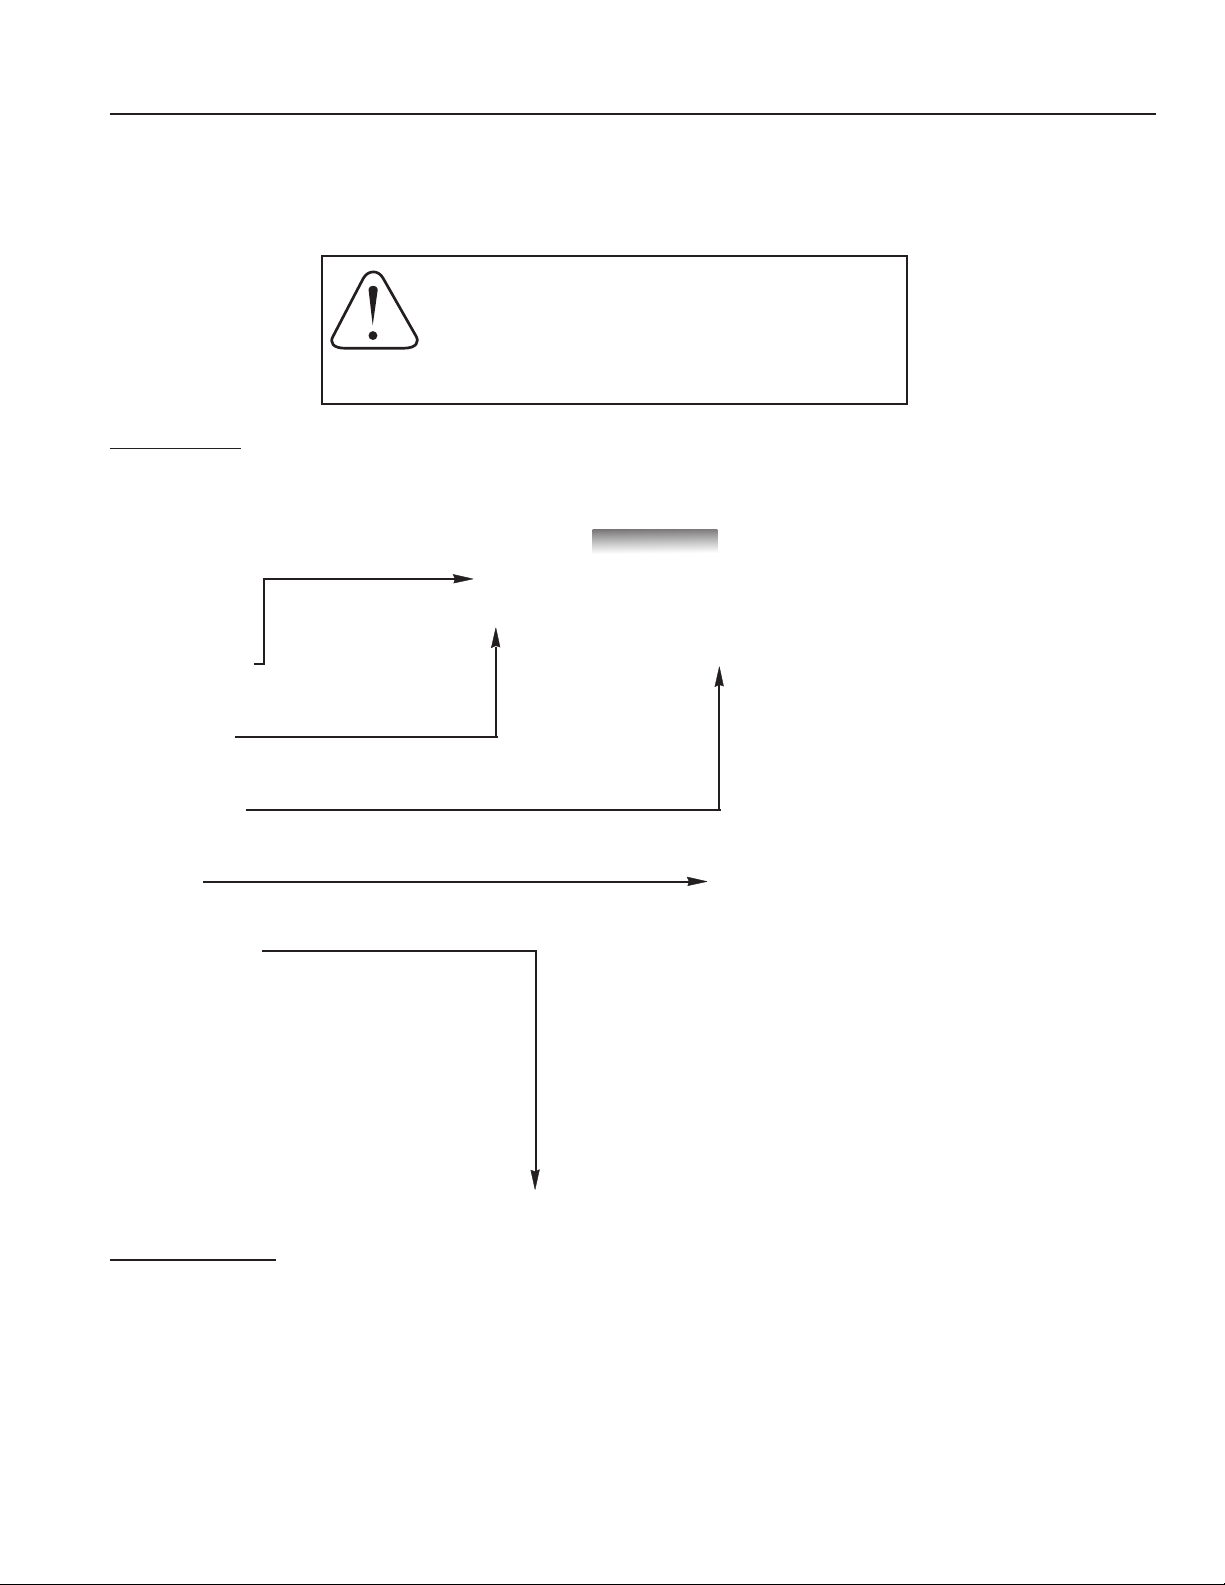
To open the software, double click on the icon on your computer desktop or in the Programs in your Start menu. The
Main Screen will open.
• Menu bar
• Tool bar
• Time bar
• Grid
selected time period)
• Status bar
(File, Show, View, Help)
(commonly-used functions)
(for setting the period for analysis)
(displays graphic information in
(shows current status)
Connect Hardware
Connect the three-pin end of your Omega data cable to the matching black socket
on the face of your DataLogger (open the protective cover to insert the cable).
Connect the serial connector end of the data cable to your computer. If your
computer does not have a serial port, use a compatible USB-to-serial adapter to
connect to your USB port (see Hardware/Software Requirements).
Page 2
Page 6

SET UP YOUR LOGGER
INITIALIZE LOGGER
With the version 2 software open and the data cable connected, click on File, and Setup DataLogger…
(or if you are using a logging meter, click on Set Up Meter...)
...to open up the Initialization screen.
Start Date / Star t Time
The date/time that the Logger was initialized is based on the real time clock of the computer used, formatted according to
its regional date/time conventions (e.g., month/day/year vs. day/month/year and 12-hour vs. 24-hour clock). Date and
time cannot be changed manually, but will be automatically updated when you “save settings” at the end of the set-up
procedure.
K-Factor, or Meter Output
K-Factor (applies to standalone DataLoggers only): The K-Factor is the number of pulses per gallon produced by the
meter your DataLogger is reading from. Find the number below that matches your selection. Enter this number into the
Initialize DataLogger screen. You will still be able to select other units for viewing and analyzing the data if you wish.)
High Frequency Output/K-Factor
Meter Size Pulses per Gallon Pulses per Liter
4” 16.362 4.323
6” 6.307 1.666
8” 3.344 0.883
10” 2.150 0.568
Meter Output (applies to Logging Meters only): Meter output of Logging Meters is factory pre-set in customer-selected
units (e.g., gallons-per-pulse, liters-per-pulse) and displayed here. Meter Output units can only be changed by an authorized
individual.
Page 3
Page 7

SET UP YOUR LOGGER
DL Number
The DL Number you assign here will be included in the Logger le name to differentiate it from other Loggers when you analyze your data. Assign any number you choose, up to six digits.
ID
This is an optional eld in which you may enter an alphanumeric string that will help to easily differentiate one Logger from
another during data analysis (e.g., Pump Station 3).
Cycle Time / Storage Time
There is an inverse relationship between the frequency of data collection (cycle time) and maximum capacity (storage time).
Shorter cycle times provide a more detailed ow curve but shorten the number of days until the logger memory is full. Longer cycle times give less detailed data over a longer time period. Select the cycle time and storage time best suited to
your application.
Cycle Time Storage Time
(in seconds) (in days)
15 11
30 22
60 44
240 180
480 360
1450 1080
Stop When Full
When the Logger’s memory is full, it can either 1) stop recording data, or 2) return to the beginning of the recorded data and
begin overwriting the earliest measurement data points. In the rst case, the total will stop accumulating until the Logger
has been manually cleared and reset. In the second case, the running total will continue to accumulate even though the
earlier specic data points are overwritten. Choose which condition you prefer by checking or unchecking the “Stop
When Full” box.
Clear Memory and Save Settings to Logger
Clicking this button will save your chosen settings and end Setup.
WARNING! Clicking this button will
erase all previous data in the Logger
and reset the totalizer. Be sure you
have downloaded any stored data you
wish to preserve before clicking Clear.
Click Cancel if you wish to abort the
set-up operation without saving settings.
Cancel
Click this button to exit the screen without saving changes to your Logger settings. Use this button when you have changed
your mind about resetting your Logger.
Page 4
Page 8

DOWNLOAD DATA FROM THE LOGGER
DOWNLOAD DATA
Open Software and Connect Hardware as described in Set-Up section. On the Main Screen, click on File, then Download from
DataLogger (or Download from Meter if you are using a Logging Meter.) The software automatically names your le (see Naming Convention, in File Management section). If you download twice from the same Logger on the same date, you will have a
choice of overwriting the rst data set or incrementing the le name to save both data sets.
When your download is complete, a graph line will appear on the empty grid.
Page 5
Page 9

CUSTOMIZE DISPLAY VARIABLES
CUSTOMIZE VARIABLES
With your software, you can customize the variables displayed on your ow graph, including the ow rate units (displayed on
the X axis), the ow total units, and the portion of the data collection period that you wish to view (displayed on the Y axis).
Selecting Flow Rate and Total Units
The Flow Rate is expressed as a volume of ow over a period of time. The software allows you to choose from a list of
volume units, and a list of time units, to express your ow rate in the most useful format for your application. From the Main
Screen, click on Show, then Units (or click the button on the Tool Bar), to bring up this screen:
U
Units screen, showing Flow Rate setting of Gal/Min and Total Flow in Gallons.
On the Units screen, select Units, referring to the abbreviations below.
Rate Units Total Units
Volume Time
mL milliliters S Seconds
L Liters M Minutes
G Gallons H Hours
IG Imperial Gallons D Days
CF Cubic Feet
M3 Cubic Meters
MG Million Gallons
Volume
L Liters
G Gallons
IG Imperial Gallons
CF Cubic Feet
M3 Cubic Meters
MG Million Gallons
AF Acre-Feet
AI Acre-Inches
ML MegaLiters
Gk Gallons x 1000
When your Flow Rate and Flow Total units have been selected, Click OK. Your data will now display in the rate and total
units you have selected. At any time, these choices can be changed and the data viewed with different units of your choice.
If you wish to exit the screen without selecting or changing units, Click Cancel. No data will be lost.
Page 6
Page 10

CUSTOMIZE DISPLAY VARIABLES
Selecting a Time Period to View
There are several ways to select and rene the desired portion of your collected data to view.
Viewing the Entire Time Period: When you download your data, a graph line will appear on the empty grid. On the Time
Bar, click on Show Original to be sure that the entire le is displayed.
Depending on how much data was collected over what time period, the graph may have a spiky appearance and be difcult
to read. If more detail is desired, it will be important to select a smaller portion of the data to view, by one of the methods
described on the following page.
If your data is too condensed to read...
Zoom in on a time period for improved readability.
Page 7
Page 11

CUSTOMIZE DISPLAY VARIABLES
Shortening Time Period (Selecting by Zoom): The simplest and most intuitive way to select a smaller time period is by
using the Zoom feature. Choose the approximate start date and time desired, position your cursor at that point on the baseline of the main grid, left-click the mouse and hold the button down as you drag to the right. As you drag the mouse, a blue
line will expand until you reach the desired end point, then release. The time period dened by the blue line will expand
to ll the entire grid. You can repeat this process several times, to narrow your view to as short a time period as you wish
(down to a minimum of two data points). [NOTE: You may return to the full time period by clicking on Show Original at any
time.]
Shortening Time Period (Selecting by Date/Time Entry): This is the preferred method if the desired time period is known
precisely. Locate the date and time boxes at the top of the screen. Dene the period you want to view in the Start and End
Date/Time boxes, and click the Show Period button on the Time Bar. The software will select data collection points nearest
your chosen Start and End selections, and the selected time period will appear on the main grid. The software will prevent
you from selecting a date/time outside of your data set. [NOTE: Use Show Original to return to the full time period.]
Averaging Data Points (Filtering)
When it is more important to see trends than details, the Averaging Filter can be employed. With the lter turned on, a selected time period can be viewed with individual data points averaged to create a smoother curve. The user can choose the
“smoothness” of the curve by selecting the number of data points that are averaged together.
To use the lter, select the Show menu, then Averaging Filter. Choose the number of data points you wish to average together, click OK. (You may need to adjust this number a few times to achieve the best curve for your purposes.) The graph
will adjust accordingly. Note that the Filter button on the main screen now appears activated; clicking on this button will
turn the lter off and on, toggling between the raw data and the averaged data.
Averaging Filter “Off” Averaging Filter “On”
Before Averaging After Averaging (20 data points)
Page 8
Page 12

VIEW AND PRINT DATA
Viewing Current Values
If all you need is a quick look at the current status of your Logger, click Show/Current Data Logger Values to view real-time
ow rates and totals. This feature allows you to read data in the
eld without downloading rst. See illustration at right.
Viewing Raw Data Table
To view the raw data that underlies the graphic presentation,
click on Show/Data Logger Info (or the button on the Tool
Bar). This brings up a box that displays the set-up parameters
(upper left), ow statistics (upper right), and individual data
points (bottom window) over the time period currently displayed
on the graph. Click OK to close window.
i
[NOTE: The version number on this screen refers to the logging
device, not to the software.]
Viewing Day Report
The Day Report shows daily ow totals and maximum rates. Access the screen by clicking on Show/Day Report (or the button on the Tool Bar). Use the “From” and “To” boxes to change
the time period you wish to view. The data can be printed or
exported as a .csv or .txt le.
Printing Day Report
The Day Report can be printed in table form, showing daily total,
daily maximum ow rate, and accumulated total ow to date.
With the Day Report on the screen, click Print Report.
Printing Graphed Data
The graphed data from the main screen can be printed using the
File/Print menu or the printer icon on the Tool Bar. This graphic
representation also includes the time period; cycle time; total ow;
and maximum, minimum and average ow rates.
Page 9
Page 13

MANAGE FILES
SELECTING A FILE TO VIEW
Unless you have instructed it otherwise, the software has automatically saved your data in a folder called FIWORK on your C
drive. From the main screen, click on File, then Open. The FIWORK folder will open and you will see all your data les. Select the le you wish to work with, click Open. When it opens, click on the Show/Original menu to assure that you are viewing
the complete le.
Naming Convention
DLNum49_070921_D_00.dlf
Understanding the le naming convention will allow you to easily select the le you wish to view. See diagram at right.
DataLogger #
you assigned
at Set-Up
File Type either
DataLogger (D),
Logging Meter (M),
or Appended (A)
Date of Data
Download
[YY/MM/DD]
Increment # (00 except
when multiple les downloaded on same date)
Datalogger le
extension,
always .dlf
APPENDING A FILE
Sometimes it is convenient to combine two or more data les from the same Logger to create a single continuous data set over
a long period of time.
1. From a clear graph screen (use File/Clear or the button on the Tool Bar if necessary), click
on File/Open to select the oldest le you wish to combine (either the older date, or if same date,
earlier increment – see le naming convention above). Click Open. The rst data set appears as
a graph on your main screen.
2. Now open the next le you wish to combine, using the File/Append menu. Select the le, click
Open. The graph will include both data sets.
3. You may continue to append additional les in the same way. When you have appended all the
les you wish, click on the Show/Original menu to be certain you are viewing the entire le.
The resulting graph contains all the data points from the appended les, with at lines in the interim periods when no data was
being recorded. At the top of the graph, notice that the Logger number is now followed by a plus sign (+), indicating that
this is an appended file.
The newly appended le will be automatically saved in the FIWORK folder, with a new le name that includes the date of the
last appended le, and File Type A (appended). NOTE that it can infrequently happen that appended le names might duplicate
each other; in this case, you can manually change the increment number in the le name. (See Naming Convention, above.)
If you do not wish to save the Appended le, you may delete it after you are done working with the data. It can always be recreated as long as you save the original Logger les from which it was constructed. If you do save the Appended le, you may add
another Logger le to it in the future.
Page 10
Page 14

EXPORT AND ANALYZE DATA
EXPORTING THE DATA FOR ANALYSIS
Sometimes it is desirable to create a spreadsheet using the raw ow readings; data exported to a spreadsheet can be
manipulated to produce a wide variety of reports. You can export data in two formats: 1) .csv (automatically recognized by
Excel) or 2) .txt (read by Notepad or convertible to Excel or other spreadsheet programs).
Exporting the Day Repor t (i.e., saving it with a different le extension)
1. Start with the main screen open to the graphed data that you want to capture and export.
2. Click Show/Day Report.
3. Click Export button. The FIWORK folder will open to the data le you are working with.
4. The “File Name” box will be auto-lled with a le named according to the convention described earlier, with the
word “day” inserted into the name to indicate “day report”.
5. In the “Save as Type” box at the bottom of the screen, use the arrow to select either .csv or .txt.
[NOTE: In .csv, if the le contains more than 65536 data points (the maximum allowed by Excel), you will receive a pop-up message that your
le is too large. Click OK if you wish to continue exporting the le in full, realizing that when the le is opened in Excel, only the rst 65536
records will be there. Alternatively, click CANCEL, use the Averaging Filter to reduce the number of data points in your le, and try exporting
the le again.]
6. Click Save. Your data le is now saved to your computer in the format you chose.
Exporting the Graphed Data (i.e., saving it with a different le extension)
1. Start with the main screen open to the graphed data that you want to capture and export.
2. Click on the File/Export menu.
3. The “File Name” box will be auto-lled with a le named according to the convention described earlier.
4. In the “Save as Type” box at the bottom of the screen, use the arrow to select either .csv or .txt.
5. Click Save. Your data le is now saved to your computer in the format you chose.
OPENING EXPORTED FILES
Opening .csv Files
Open your copy of Excel. Using the Excel File/Open menu, locate your exported .csv le in the FIWORK folder on the C drive
of your computer. Select the le you wish to analyze, click Open. The .csv le will open directly in Excel.
Opening .txt Files
To open the .txt le in Notepad, locate the le in the FIWORK folder on your C drive; doubleclick on the le name.
To open the .txt le in Excel or another spreadsheet, rst open your spreadsheet program. Using the spreadsheet’s File/
Open menu, locate your exported .txt le in the FIWORK folder on the C drive of your computer. Select the le you wish
to analyze, click Open. A Text Import Wizard box will open. You will need to navigate through a series of screens. The only
change you need to make to the defaults on these screens is to select the “Comma” box at one point. Only experienced
spreadsheet users should use the .txt option.
ANALYZING THE DATA
The spreadsheet will format in columns (date, time,
ow rate, incremental volume, totalized volume). All
normal spreadsheet functions can be used on this
data, for instance, custom averaging and oddtime
totalization (average ow rate and multiple by time
span). Refer to Excel instructions on performing
various functions. A representative spreadsheet
page appears at right.
Page 11
Page 15

WARRANTY/DISCLAIMER
OMEGA ENGINEERING, INC. warrants this unit to be free of defects in materials and workmanship for a
period of 13 months f rom date of purchase. OMEGA’s WARRANTY adds an additional one (1) month
grace period to the normal one (1) year product warranty to cover handling and shipping time. This
ensures that OMEGA’s customers receive maximum coverage on each product.
If the unit malfunctions, it must be re t u rned to the factory for evaluation. O M E G A’s Customer Serv i c e
D e p a rtment will issue an Authorized Return (AR) number immediately upon phone or written re q u e s t .
Upon examination by OMEGA, if the unit is found to be defective, it will be re p a i red or replaced at no
c h a rge. O M E G A’s WARRANTY does not apply to defects resulting from any action of the purc h a s e r,
including but not limited to mishandling, improper interfacing, operation outside of design limits,
i m p roper re p a i r, or unauthorized modification. This WARRANTY is VOID if the unit shows evidence of
having been tampered with or shows evidence of having been damaged as a result of excessive corro s i o n ;
or current, heat, moisture or vibration; improper specification; misapplication; misuse or other operating
conditions outside of OMEGA’s c o n t rol. Components in which wear is not warranted, include but are not
limited to contact points, fuses, and triacs.
OMEGA is pl eased to offer suggestions on the use of its various products. However,
OMEGA neither assumes responsibility for any omissions or errors nor assumes liability for any
damages that result from the use of its products in accordance with information provided by
OMEGA, either verbal or written. OMEGA warrants only that the parts manufactured by the
company will be as specified and free of defects. OMEGA MAKES NO OTHER WARRANTIES OR
R E P R E S E N TATIONS OF ANY KIND WHATSOEVER, EXPRESSED OR IMPLIED, EXCEPT THAT OF
TITLE, AND ALL IMPLIED WARRANTIES INCLUDING ANY WARRANTY OF MERCHANTA B I L I T Y
AND FITNESS FOR A PA RTICULAR PURPOSE ARE HEREBY DISCLAIMED. LIMITATION OF
L I A B I L I T Y: The remedies of purchaser set forth herein are exclusive, and the total liability of
OMEGA with respect to this ord e r, whether based on contract, warr a n t y, negligence,
indemnification, strict liability or otherwise, shall not exceed the purchase price of the
compone nt upon which liabi lity is bas ed. In no event sh all OM EGA be liable for
consequential, incidental or special damages.
CONDITIONS: Equipment sold by OMEGA is not intended to be used, nor shall it be used: (1) as a “Basic
Component” under 10 CFR 21 (NRC), used in or with any nuclear installation or activity; or (2) in medical
applications or used on humans. Should any Product(s) be used in or with any nuclear installation or
a c t i v i t y, medical application, used on humans, or misused in any way, OMEGA assumes no re s p o n s i b i l i t y
as set forth in our basic WA R R A N TY/ D ISCLAIMER language, and, additionally, purchaser will indemnify
OMEGA and hold OMEGA h a rmless from any liability or damage whatsoever arising out of the use of the
P roduct(s) in such a manner.
RETURN REQUESTS/INQUIRIES
Direct all warranty and repair requests/inquiries to the OMEGA Customer Service Department. BEFORE
RETURNING ANY PRODUCT(S) TO OMEGA, PURCHASER MUST OBTAIN AN AUTHORIZED RETURN
(AR ) N U MBER F R OM OMEG A’S CUSTO MER SERVIC E D E PA RT MENT (I N O R DER TO AV O I D
PROCESSING DELAYS). The assigned AR number should then be marked on the outside of the return
package and on any correspondence.
The purchaser is responsible for shipping charges, freight, insurance and proper packaging to prevent
breakage in transit.
FOR WARRANTY RETURNS, please have the
following information available BEFORE
contacting OMEGA:
1 . P u rchase Order number under which the pro d u c t
was PURCHASED,
2. Model and serial number of the product under
warranty, and
3. Repair instructions and/or specific problems
relative to the product.
FOR NON-WARRANTY REPAIRS,
consult OMEGA
for current repair charges. Have the following
information available BEFORE contacting OMEGA:
1. Purchase Order number to cover the COST
of the repair,
2. Model and serial number of the product, and
3. Repair instructions and/or specific problems
relative to the product.
OMEGA’s policy is to make running changes, not model changes, whenever an improvement is possible. This affords
our customers the latest in technology and engineering.
OMEGA is a registered trademark of OMEGA ENGINEERING, INC.
© Copyright 2005 OMEGA ENGINEERING, INC. All rights reserved. This document may not be copied, photocopied,
reproduced, translated, or reduced to any electronic medium or machine-readable form, in whole or in part, without the
prior written consent of OMEGA ENGINEERING, INC.
Page 16

W h e re Do I Find Eve rything I Need for
P rocess Measurement and Control?
OME GA…Of Cours e !
Shop online at omega.com
T E M P E R AT U R E
Thermocouple, RTD & Thermistor Probes, Connectors, Panels & Assemblies
Wire: Thermocouple, RTD & Thermistor
Calibrators & Ice Point References
Recorders, Controllers & Process Monitors
Infrared Pyrometers
PRESSURE, STRAIN AND FO RC E
Transducers & Strain Gages
Load Cells & Pressure Gages
Displacement Transducers
Instrumentation & Accessories
F LOW / L E V E L
Rotameters, Gas Mass Flowmeters & Flow Computers
Air Velocity Indicators
Turbine/Paddlewheel Systems
Totalizers & Batch Controllers
p H / C O N D U C T I V I TY
pH Electrodes, Testers & Accessories
Benchtop/Laboratory Meters
Controllers, Calibrators, Simulators & Pumps
Industrial pH & Conductivity Equipment
DATA AC Q U I S I T I O N
Data Acquisition & Engineering Software
Communications-Based Acquisition Systems
Plug-in Cards for Apple, IBM & Compatibles
Datalogging Systems
Recorders, Printers & Plotters
H E AT E R S
Heating Cable
Cartridge & Strip Heaters
Immersion & Band Heaters
Flexible Heaters
Laboratory Heaters
E N V I RO N M E N TA L
M O N I TORING AND CONTRO L
Metering & Control Instrumentation
R e f r a c t o m e t e r s
Pumps & Tubing
Air, Soil & Water Monitors
Industrial Water & Wastewater Treatment
pH, Conductivity & Dissolved Oxygen Instruments
PL-OM-65200295-041111
4/11/11
M-4406/0411
 Loading...