

Page 1
omega.com
e-mail: [email protected]
For latest product manuals:
omegamanual.info
Shop online at
User’s Guide
eZ-PostView
and eZ-Analyst
OMB-1086-0928 rev 1.0
Post Acquisition Analysis Applications
Page 2
OMEGAnetSM On-Line Service
http://www.omega.com
Servicing North America:
Internet e-mail
USA:
One Omega Drive, Box 4047
Stamford, CT 06907-0047
Tel: (203) 359-1660
FAX: (203) 359-7700
e-mail: [email protected]
Canada:
976 Berger
Laval (Quebec) H7L 5A1
Tel: (514) 856-6928
FAX: (514) 856-6886
e-mail: [email protected]
For immediate technical or application assistance:
USA and Canada:
Mexico and
Latin America:
Sales Service: 1-800-826-6342 / 1-800-TC-OMEGA
Customer Service: 1-800-622-2378 / 1-800-622-BEST
Engineering Service: 1-800-872-9436 / 1-800-USA-WHEN
TELEX: 996404 EASYLINK: 62968934 CABLE: OMEGA
Tel: (95) 800-TC-OMEGA
En Espanol: (95) 203-359-7803
SM
FAX: (95) 203-359-7807
e-mail: [email protected]
SM
SM
SM
Servicing Europe:
Benelux:
Czech Republic:
France:
Germany/Austria
United Kingdom:
It is the policy of OMEGA to comply with all worldwide safety and EMC/EMI regulations that
apply. OMEGA is constantly pursuing certification of its products to the European New Approach
Directives. OMEGA will add the CE mark to every appropriate device upon certification.
The information contained in this document is believed to be correct but OMEGA Engineering, Inc. accepts
no liability for any errors it contains, and reserves the right to alter specifications without notice.
WARNING: These products are not designed for use in, and should not be used for, patient-connected applications.
Postbus 8034, 1180 LA Amstelveen, The Netherlands
Tel: (31) 20 6418405
FAX: (31) 20 6434643
Toll Free in Benelux: 06 0993344
e-mail: [email protected]
ul. Rude armady 1868
733 01 Karvina-Hranice
Tel: 420 (69) 6311899
FAX: 420 (69) 6311114
e-mail:[email protected]
9, rue Denis Papin, 78190 Trappes
Tel: (33) 130-621-400
FAX: (33) 130-699-120
Toll Free in France: 0800-4-06342
e-mail: [email protected]
Daimlerstrasse 26, D-75392 Deckenpfronn, Germany
:
Tel: 49 (07056) 3017
FAX: 49 (07056) 8540
Toll Free in Germany: 0130 11 21 66
e-mail: [email protected]
25 Swannington Road,
Broughton Astley, Leicestershire,
LE9 6TU, England
Tel: 44 (1455) 285520
FAX: 44 (1455) 283912
P.O. Box 7, Omega Drive,
Irlam, Manchester,
M44 5EX, England
Tel: 44 (161) 777-6611
FAX: 44 (161) 777-6622
Toll Free in England: 0800-488-488
e-mail: [email protected]
Page 3

eZ-PostView
Time-Domain Post-Data Acquisition View Application
User’s Guide
(p/n 1086-0926, rev 2.0)
eZ-PostView User’s
eZ-Analyst Series
for Users of
eZ-Analyst
eZ-TimeView
eZ-FrequencyView
Users of these Applications
Click Here
Software Reference
Click Here
(p/n 1086-0922, rev 6.0)
June 2002 Printed in the United States of America
Page 4

Contents
Introduction
Ch 1 – Getting Started with eZ-PostView
Ch 2 – eZ-PostView Menus and Windows
Ch 3 – Interactive Features of eZ-PostView’s Plot Display Window
System Requirements …… 1-1
Software Installation …… 1-2
Features of eZ-PostView …… 2-1
File Menu …… 2-3
Edit Menu …… 2-4
Window Menu …… 2-11
How to Change Plot Display Characteristics ……3-2
How to Change “Focus” …… 3-2.
How to Add and Remove Channels …… 3-2
Other Features …… 3-3
Appendix A – Keyboard Controls
eZ-PostView
06-17-02
Contents iii
Page 5

iv
06-17-02
eZ-PostView
Page 6
Introduction
eZ-PostView is a time-domain post-acquisition data
viewing application that has been integrated with
primary data acquisition software, including
DaqView, Personal DaqView, ChartView, LogView,
and WaveView.
eZ-PostView Can Be Used without the Presence of Acquisition Hardware
The eZ-PostView application provides easy-to-use
post-acquisition analysis capability, and is included
free of charge as a part of product support. From
this application you can display up to 8 timedomain function windows and display up to 16
channel traces per window. Data is automatically
scaled to optimize its fit in the window.
From eZ-PostView you can customize window,
channel trace, and cursor colors.
Once installed, eZ-PostView can be launched from the data-acquisition program by a simple click of the
<View Data> button. As an alternative, the application can be launched independent of the acquisition program and
supported data files can be loaded for viewing.
eZ-PostView includes the following features:
• File Input Format Support for: DaqView, WaveView, Personal DaqView, ChartView,
Universal File Format UFF-58B.
• Can show 8 Display Windows simultaneously
• Can show 16 Channel Traces per Display Window
• Includes Automatic Data Scaling
• User-Configurable Data Display is provided for channels and trace colors
• Allows for multiple Tiling, or Cascading, of display windows
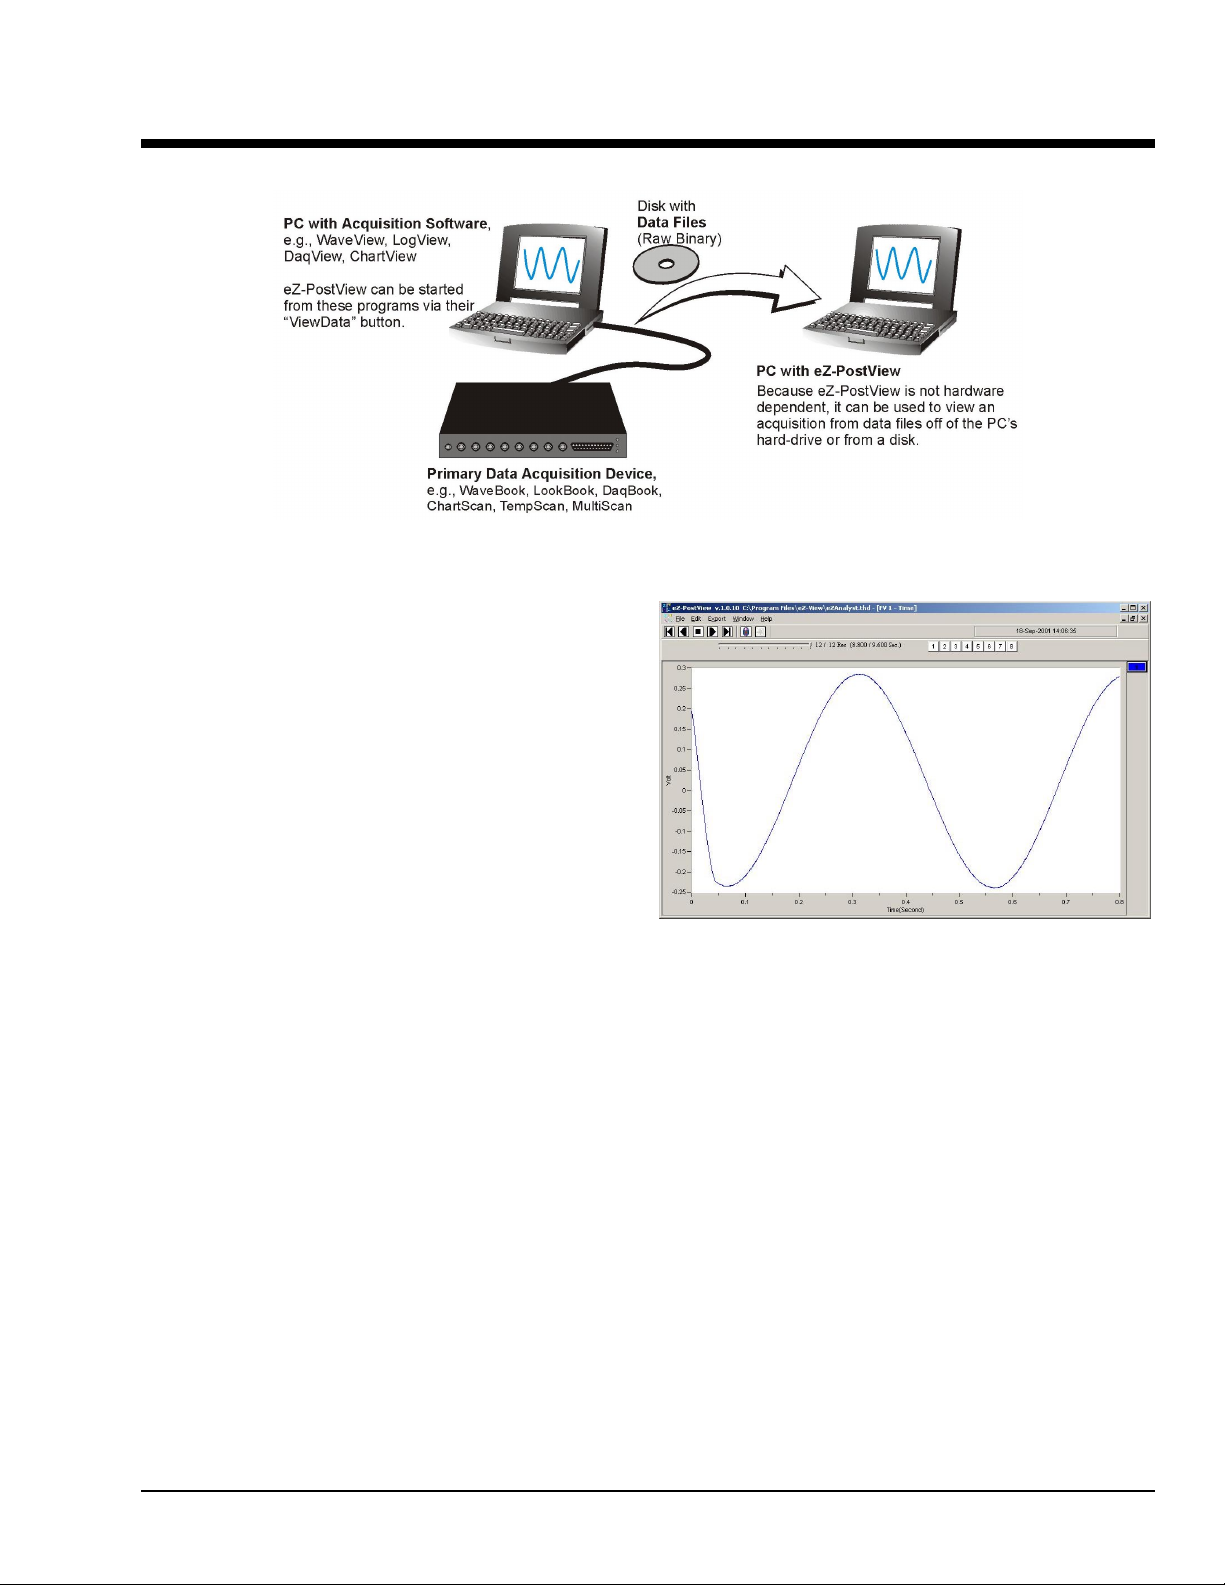
A Screen Capture from eZ-PostView
eZ-PostView
09-06-02
Introduction v
Page 7
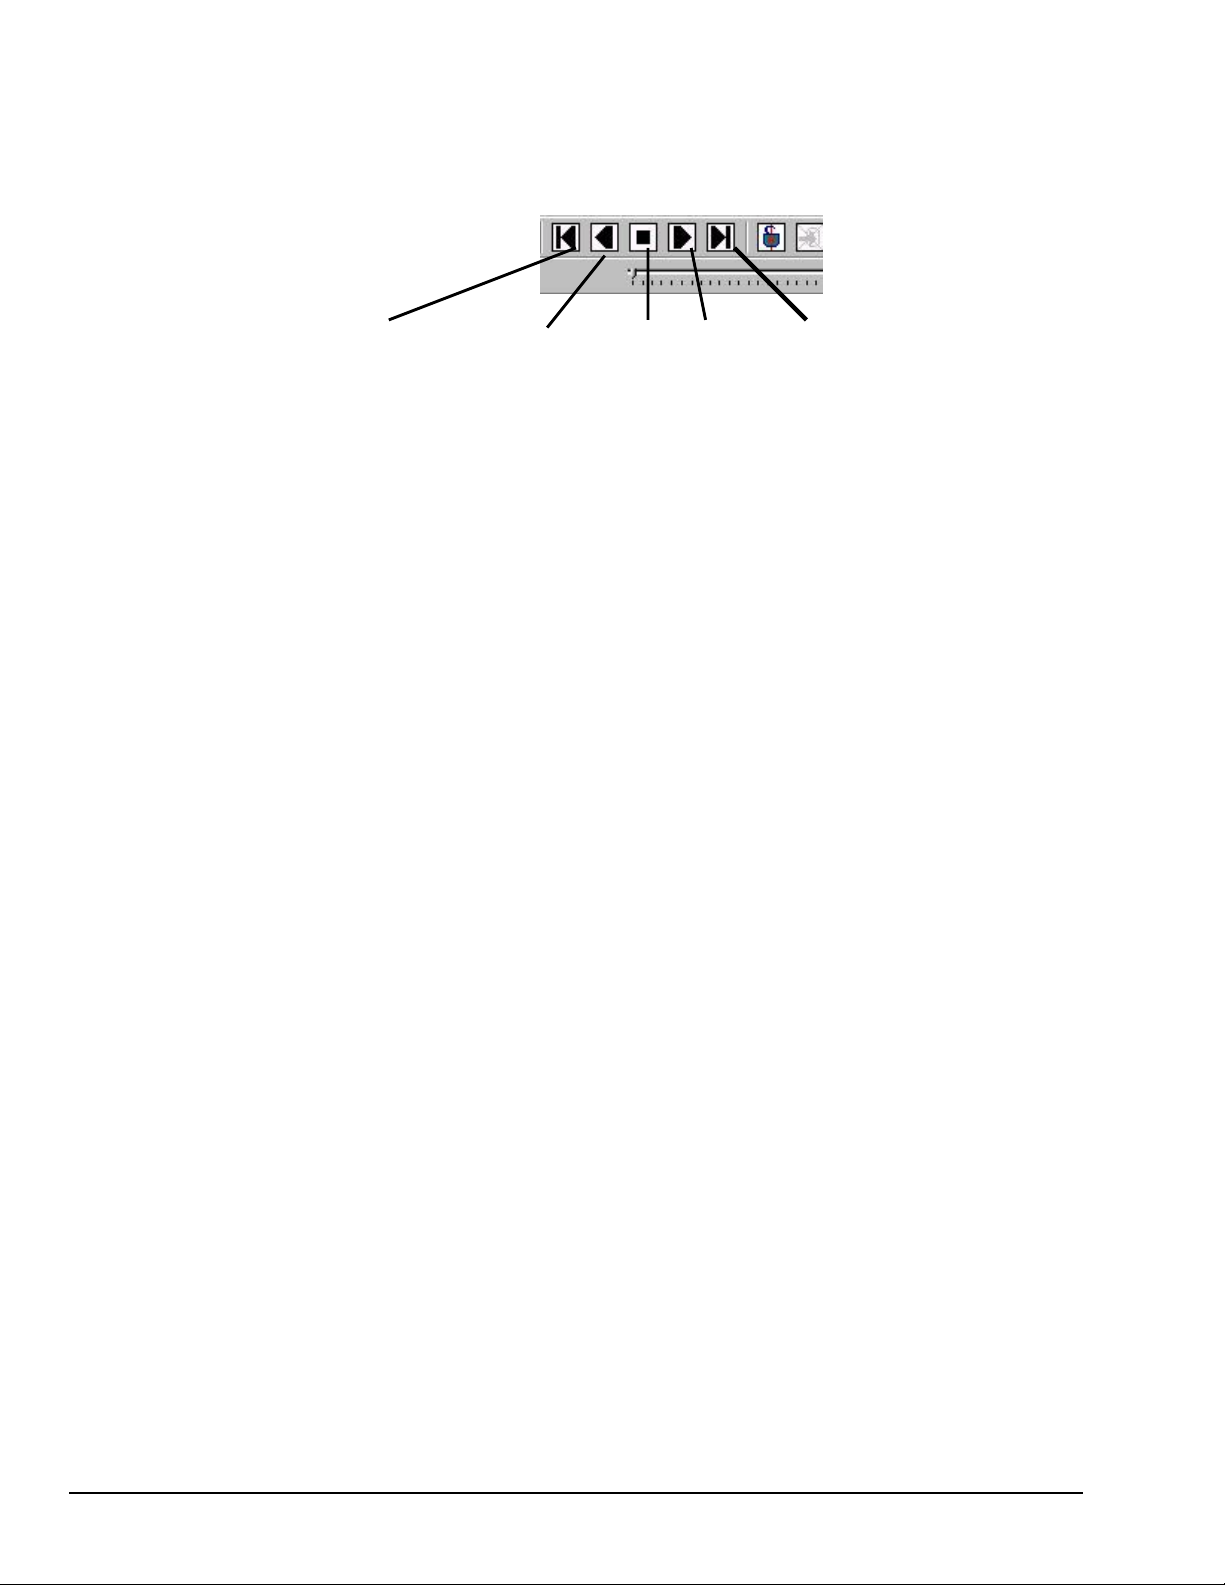
eZ-PostView makes use of buttons similar to those found on VCRs. As indicated by the following figure,
you can select to play the data display forward, backward, or frame by frame in either direction. The
playback task bar is located just below the menu bar, which is detailed in chapter 2.
Play Backward, Play Backward Stop Play Play Forward
One Frame at a Time One Frame at a Time
Playback Task Bar
vi, Introduction
09-06-02
eZ-PostView
Page 8

Getting Started with eZ-PostView 1
System Requirements …… 1-1
Software Installation …… 1-2
System Requirements
Your computer should meet the following minimum requirements.
™
•
• 64 MB Memory
• 100 MB Hard Disk space
• Monitor: SVGA, 800 x 600 resolution
• One of the following Microsoft
, Pentium 90 MHz or equivalent
Intel
Windows 98
Windows Me
Windows NT
Windows 2000
Windows XP
®
Windows Operating Systems:
If you purchased software, associated authorization codes will accompany your
installation CD. If this is the case, keep your codes in a safe place. You will need to enter
them once, during an actual run of the purchased software.
Note that no authorization code or password is needed to run eZ-PostView.
eZ-PostView
09-05-02
Getting Started 1-1
Page 9
Software Installation
Before installing a version of our data-acquisition software, remove all
previous versions of that software.
Reference Notes:
➣
Adobe Acrobat PDF versions of documents pertaining to your system hardware and
software are automatically installed onto your PC’s hard-drive as a part of product
support at the time of software installation. The default location is the Programs group,
which can be accessed via the Windows Desktop Start Menu.
➣
PDF versions of documents can be read directly from the data acquisition CD.
➣
After your software is installed you can setup your data acquisition device, e.g.,
WaveBook, DaqBook, LogBook, and connect it to the host computer. Instructions for
hardware setup are included in your device user’s manual, which is included on the CD.
When you first install software for your acquisition device, eZ-PostView will automatically be selected for
installation along with the primary acquisition software application. For example, when a WaveBook is selected,
both WaveView and eZ-PostView will show as pre-selected software options.
To install eZ-PostView …
1. Start Windows.
2. Close all running applications.
3. Insert the Data Acquisition CD into your CD-ROM drive and wait for the CD to auto-run.
If the CD does not start on its own:
(a) click the desktop’s <Start> button
(b) choose the Run command
(c) select the CD-ROM drive, then select the setup.exe file
(d) click <OK>
An Opening Screen will appear.
4. Click the <ENTER SETUP> button.
5. On the hardware selection screen [which follows a licensing agreement], select your hardware from the
drop-down list.
6. On the resulting software options screen, select the software that is applicable to your system.
Note that eZ-PostView is already selected by default.
7. Click the <Install> button; then follow the screen prompts to complete the installation.
1-2 Getting Started
09-05-02
eZ-PostView
Page 10
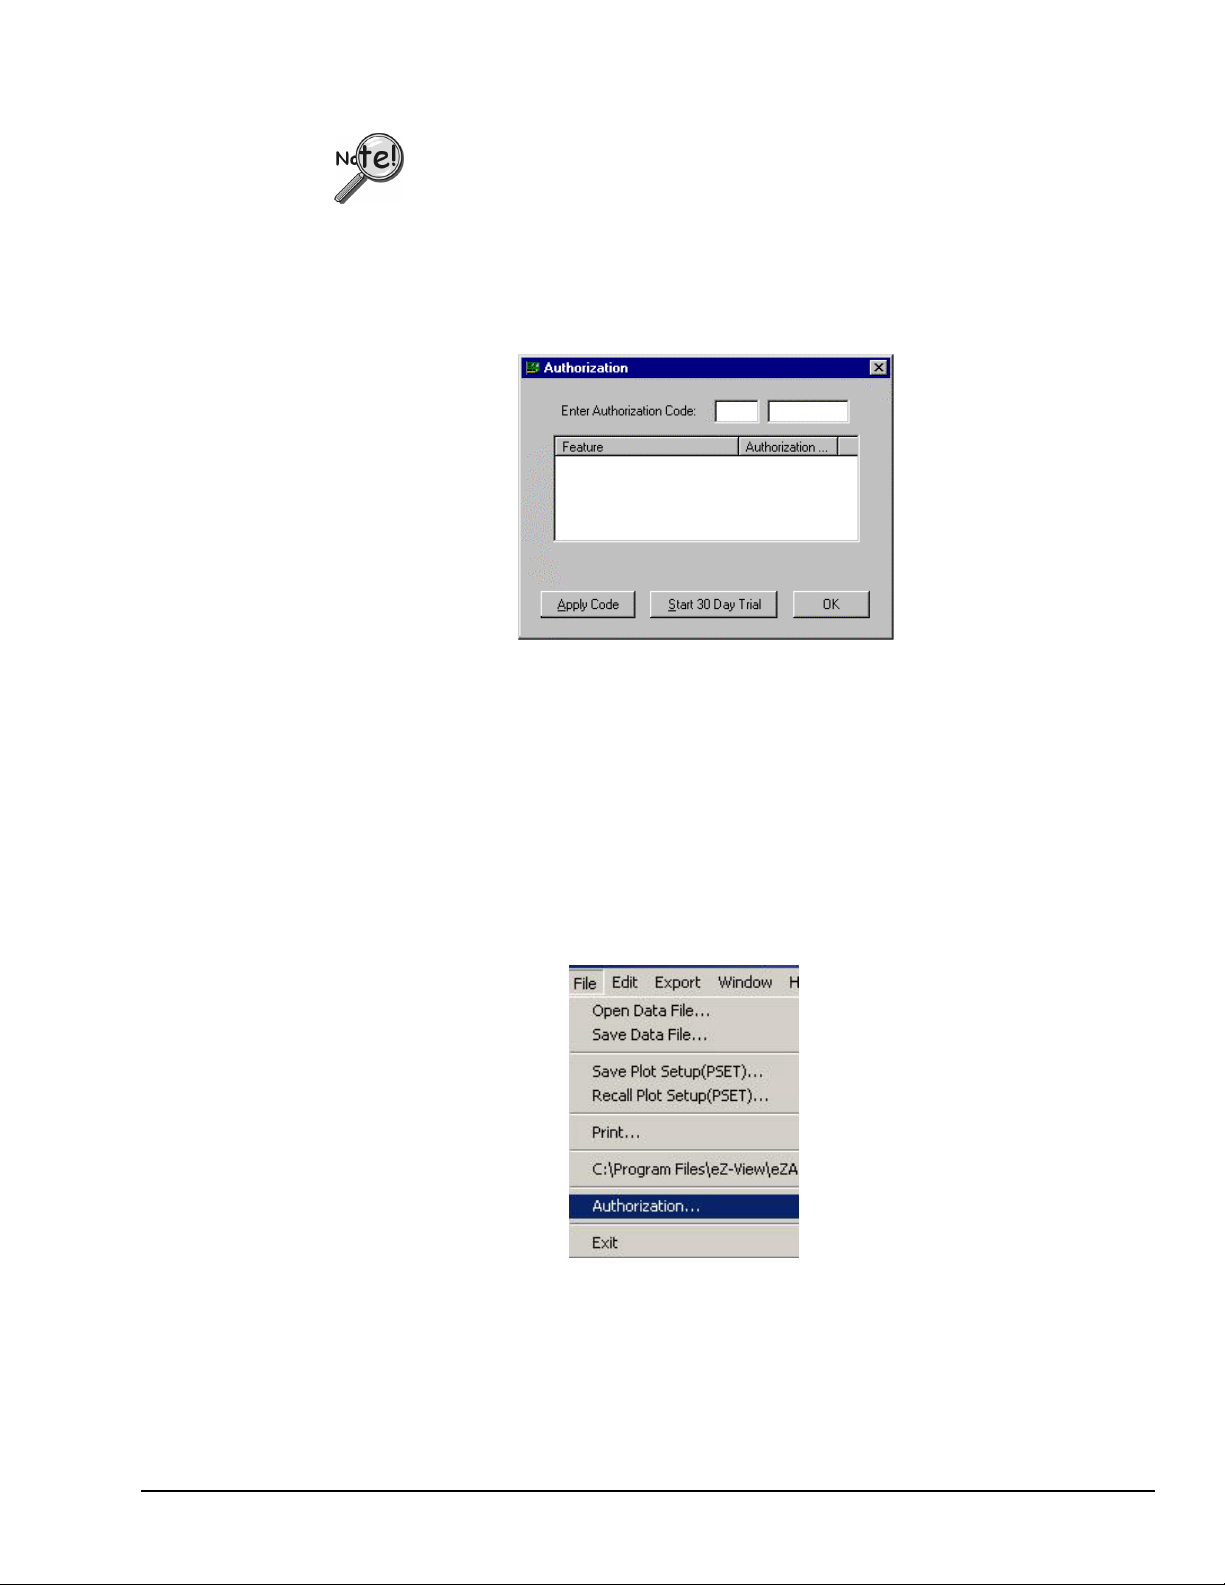
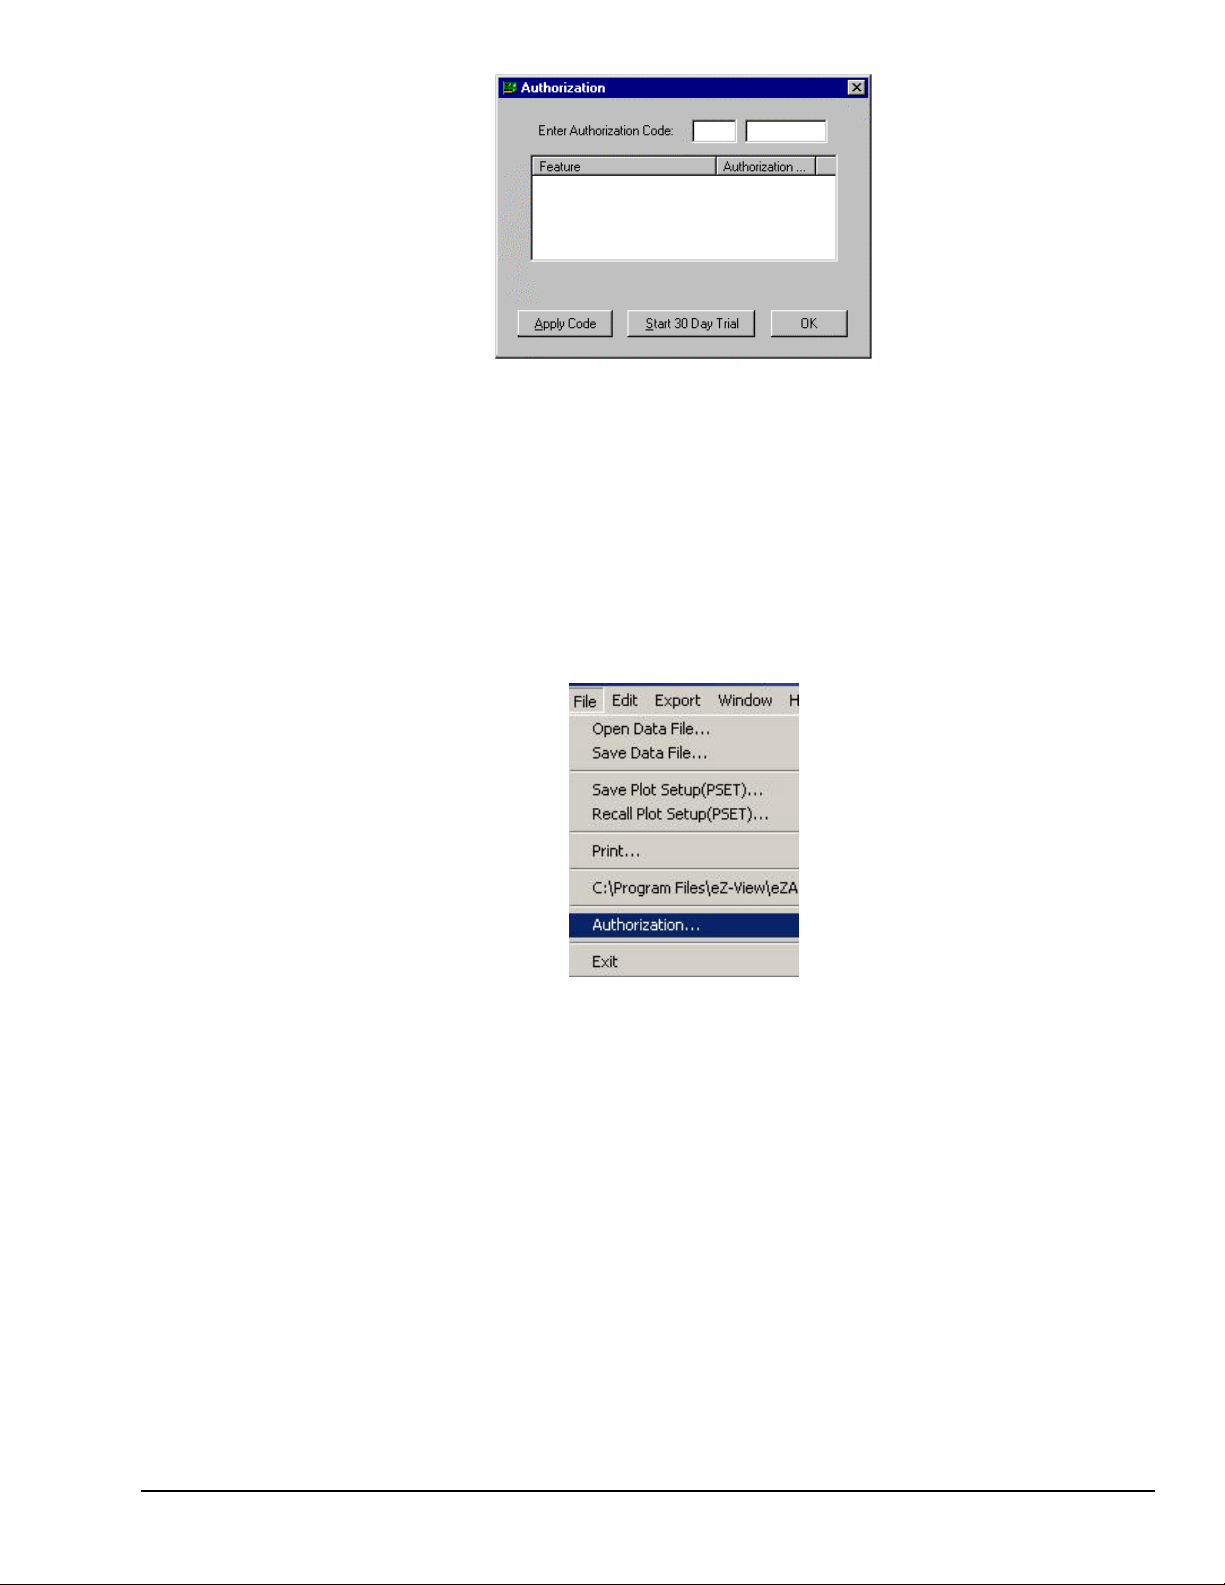
You will be prompted to enter an Authorization Code.
If you purchased eZ-TimeView or eZ-FrequencyView enter the code for the
➣
associated application; then click the <Apply Code> button.
If you are installing eZ-PostView [which requires no code], simply click the
➣
<OK> button or, if you prefer, click the <Start 30 Day Trial> button to try out
the more powerful eZ-FrequencyView Application.
Authorization Dialog Box
Note: Entry of your Authorization Code is only required once. However, you can enter a new code
at a future date, for example, if you wanted to upgrade from eZ-PostView to eZ-FrequencyView.
To open the Authorization Dialog Box:
1. Open eZ-PostView. You can open eZ-PostView by clicking the <ViewData> button
in your primary data acquisition program, e.g. WaveView, DaqView, LogView, etc.
2. From eZ-PostView’s File Pull-Down menu, select Authorization (following figure).
The Authorization dialog box appears.
To enter a code:
1. Type-in the code, as it appears on your Authorization Sheet.
File Menu
eZ-PostView
2. Click the <Apply Code> button.
09-05-02
Getting Started 1-3
Page 11

1-4 Getting Started
09-05-02
eZ-PostView
Page 12

eZ-PostView Menus and Windows 2
Contents
Features of eZ-PostView …… 2-1
File Menu …… 2-3
Edit Menu …… 2-4
Configuration Window …… 2-4
Acquisition Tab…… 2-5
Channels Tab …… 2-6
Playback Setup Window …… 2-7
Window Colors Window…… 2-8
Preferences Window …… 2-9
Window Menu …… 2-11
Add Function View (FV) …… 2-11
Delete Window …… 2-11
Channel Buttons …… 2-11
Cascade …… 2-12
Tile Vertically …… 2-12
Tile Horizontally …… 2-13
Refresh Windows …… 2-13
Features of eZ-PostView
The free eZ-PostView application includes the following features.
•
File Input Format Support for: DaqView, WaveView, Personal DaqView, ChartView, UFF-58B.
• 8 Display Windows
• 16 Channel Traces per Display Window
• Automatic Data Scaling
•
Configurable Data Display for channels and trace colors
•
Multiple Tiling of display windows
Note that eZ-PostView was derived from a much more versatile eZ-Analyst program. A comparison of
eZ-PostView features to those of eZ-Analyst and 2 other derived applications appears on page 2-2.
As indicated by the following table, many features do not apply to eZ-PostView. In the screen images, both those of
the actual application and those presented as figures in this manual, information that does not apply to eZ-PostView
is either “grayed-out” or “hidden.” The same applies to functions of the pull-down menus.
Reference Note:
The document, eZ-Analyst Series Software Reference, p/n 1086-0922 contains information that is
applicable to the higher-level “view” programs eZ-TimeView and eZ-FrequencyView, and to eZ-Analyst.
The eZ-Analyst Series document includes information regarding the Miscellaneous and the Octave Tabs,
which do not apply to eZ-PostView.
eZ-PostView
09-05-02
Menus and Windows 2-1
Page 13
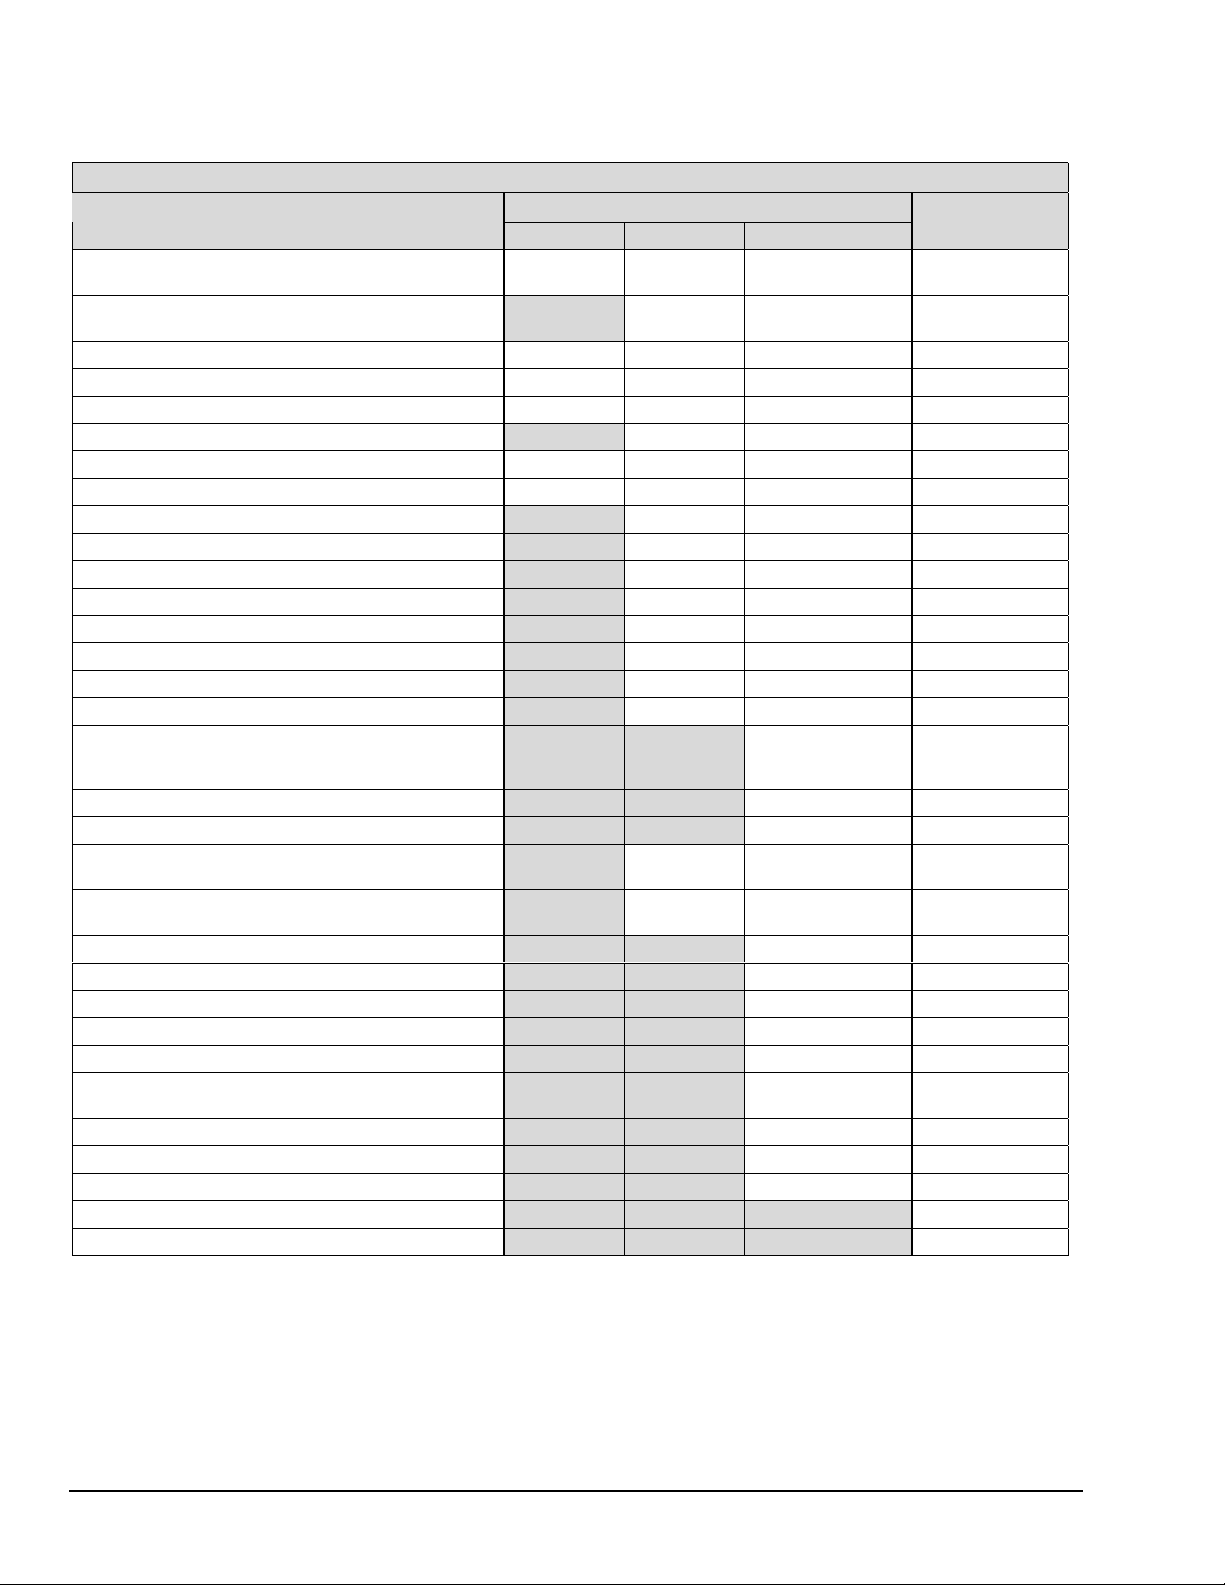
Comparing eZ-PostView to other eZ-Analyst Series Applications
eZ-Analyst Series Comparison Matrix
Feature
File Input Format Support for: DaqView, WaveView,
Personal DaqView, ChartView, UFF-58B.
File Export to: ME’Scope and SMS Modal, Microsoft
Excel, Binary Universal File, and ASCII text files.
Display Windows, number of 8 8 8 8
Channel Traces per Display Window 16 16 16 16
Automatic Data Scaling Yes Yes Yes Yes
Simulated Data Playback ----- Yes Yes Yes
Configurable Data Display for channels and trace colors Yes Yes Yes Yes
Multiple Tiling of display windows Yes Yes Yes Yes
Cursor Support - for both Single Cursor and Band Cursor ----- Yes Yes Yes
Data Strip Chart Display ----- Yes Yes Yes
Peak-to-Peak Calculations ----- Yes Yes Yes
Peak Searching, minimum and maximum ----- Yes Yes Yes
Mean Calculations ----- Yes Yes Yes
RMS Calculations ----- Yes Yes Yes
Zooming [of the data display] ----- Yes Yes Yes
Windowed Time Display Function ----- Yes Yes Yes
Cross Channel Support ----- ----- FFT, FRF, Cross,
Transfer Function Display Types ----- ----- Note 1 Note 1
Complex Function Display Types ----- ----- Note 2 Note 2
Scale Types ----- RMS, Peak,
Function Display Types ----- Time, Strip
Octave Types ----- ----- 1/3, Full 1/3, Full
Octave Weighting ----- ----- Linear, A, B, C Linear, A, B, C
Waterfall Plots ----- ----- Yes Yes
Integration/Differentiation (Single/Double) ----- ----- Yes Yes
Response Channel FFT Windows ----- ----- Note 4 Note 4
Reference Channel FFT Windows ----- -----
Low-Pass DC Noise Filtering ----- ----- Yes Yes
Spectral Strip Chart Display Synchronization ----- ----- Yes Yes
Octave Strip Chart Display Synchronization ----- ----- Yes Yes
Record and Save Data to Disk ----- ----- ----- Yes
“Real Time” Data Display ----- ----- ----- Yes
Post-Acquisition Viewing Package
eZ-PostView eZ-TimeView eZ-FrequencyView
Yes Yes Yes Yes
----- Yes Yes Yes
Coherence,
Transfer Function
Peak-to-Peak
Chart
RMS, Peak,
Peak-to-Peak
Note 3 Note 3
Rectangular,
Cosine Taper
eZ-Analyst
FFT, FRF, Cross,
Coherence,
Transfer Function
RMS, Peak,
Peak-to-Peak
Rectangular,
Cosine Taper
Notes: 1) eZ-Analyst and eZ-FrequencyView - each offers the following Transfer Function Display Types: Inertance, Mobility,
2-2 Menus and Windows
Compliance, Apparent Mass, Impedance, and Dynamic Stiffness.
2) eZ-Analyst and eZ-FrequencyView - each offers the following Complex Function Display Types: Magnitude, Phase, Real,
Imaginary, Nyquist, Magnitude and Phase, and Real and Imaginary.
3) eZ-Analyst and eZ-FrequencyView - each offers the following Function Display Types: Spectrum, Auto-Spectrum,
PSD (Power Spectral Function), Strip Chart.
4) eZ-Analyst and eZ-FrequencyView – each offers the following Response Channel FFT Windows: Hanning, Flat Top,
Exponential, and Blackman-Harris.
09-05-02
eZ-PostView
Page 14
File Menu
The File Menu provides a means to print plotted data, as well as open and save data files.
Open Data File … (.thd or .dsc)
Used to locate and open saved files. ZonicBook uses files with .thd extensions. View applications, i.e.,
WaveView, DaqView, Personal DaqView, LogView, and ChartView use files with .dsc extensions.
Save Plot Setup (PSET) …
These two menu items provide a means of saving [or opening] function files. Time and auto-spectrum data
is saved. If there is any reference channel cross-spectrum is saved for all channel pairs. The file extension is
.mds.
Recall Plot Setup (PSET) …
These two menu items provide a means of saving [or recalling] the current plot condition, such as window
locations and window content, including: channel numbers, function type, axis-type, and range. These files
can be recalled at a later date to process customized plot conditions.
Without user intervention, the plot setup file is automatically saved with .mds, .dsc, and .thd files.
You can have plot setups automatically recalled whenever you recall data files. To select this
option, open the Preferences window [accessed through the Edit pull-down menu] and check
the box labeled “Recall Plot Setup When Recall Data Files.”
The standard print window associated with your specific computer will open. Select a printer and the
number of copies needed before clicking <OK>.
Authorization
Exit
Note:
In regard to printing, black plot backgrounds changed to white.
Provides a means of enabling additional view features that are available with purchased software, i.e.,
eZ-TimeView and eZ-FrequencyView. Aside from a trial period, an authorization code is required to enable
the applications available features. eZ-TimeView, eZ-FrequencyView, and the eZ-Analyst program from
which they were derived are discussed in the document, eZ-Analyst Series Software Reference,
p/n 1086-0922.
This menu item closes the eZ-PostView application.
eZ-PostView
09-05-02
Menus and Windows 2-3
Page 15

Edit Menu
The Edit Menu provides a means of configuring eZ-PostView in regard to both functionality and
appearance. The menu contains the following selections, each of which is detailed in the subsequent
sections:
Configuration Window…… 2-4
Playback Setup Window…… 2-7
Window Colors Window…… 2-8
Preferences Window…… 2-9
Edit Menu >
Configuration Window
The Configuration item provides a means of changing the majority of eZ-PostView settings in regard to
determining how the data is manipulated. The Configuration selection displays the Configuration Window
with one of several tab dialogs displayed. Selectable tabs are:
Acquisition Tab…… 2-5
Input Channels Tab …… 2-6
Octaves Tab (the tab is present, but does not apply to eZ-PostView)
Miscellaneous Tab (the tab is present, but does not apply to eZ-PostView)
2-4 Menus and Windows
09-05-02
eZ-PostView
Page 16
Edit Menu
> Configuration >
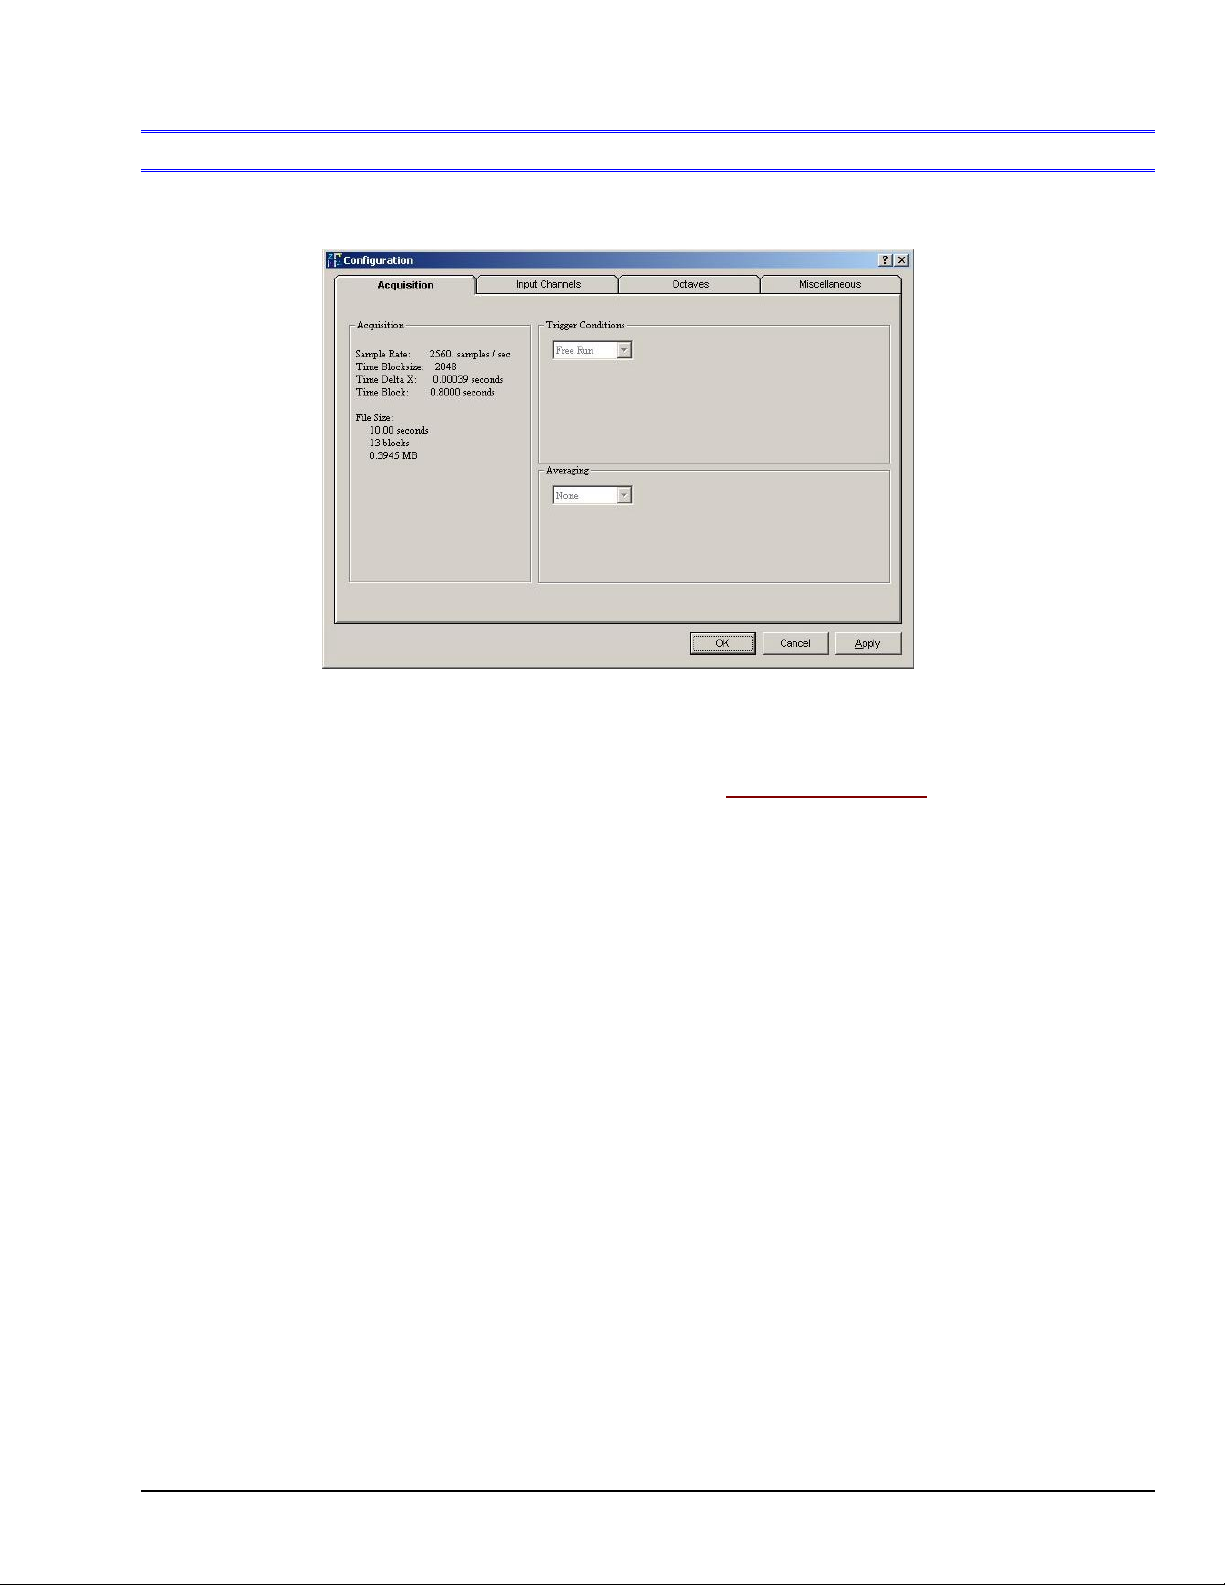
eZ-PostView’s Acquisition Setup Tab
Acquisition Tab
Edit Menu > Configuration >
With respect to eZ-PostView, the Acquisition Panel provides “read-only” text pertaining to the following:
Sample Rate (samples per second)
Time Blocksize (Acceptable blocksizes range from 128 to 16384 data points).
Time Delta X
Time Block
File Size in:
seconds
blocks
disk space in MB
Acquisition Tab: Acquisition Panel
eZ-PostView
09-05-02
Menus and Windows 2-5
Page 17
Edit Menu
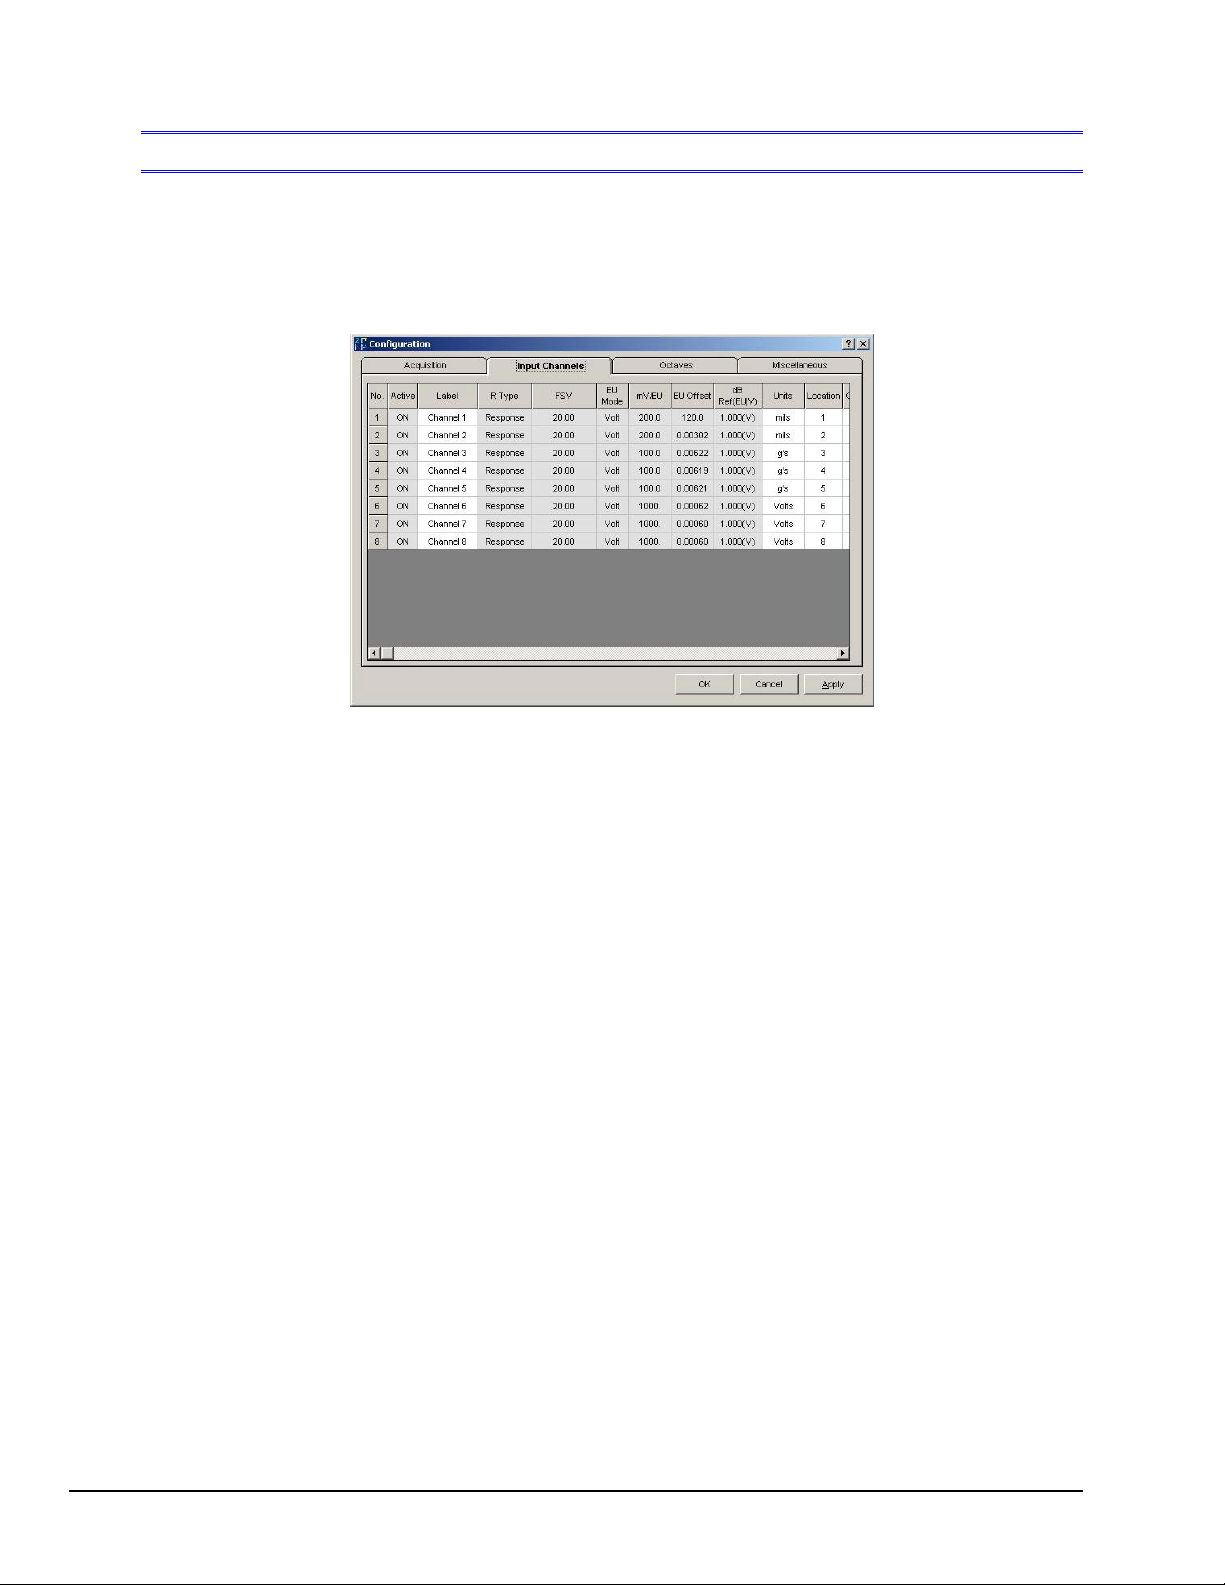
The Input Channels tab displays the setup conditions of the input channels as they were when the
acquisition was saved-to-disk. Actual hardware setup can not be changed from eZ-PostView. The grayed-
out columns, in the following figure, can not be changed from eZ-PostView.
> Configuration >
Input Channels Tab Selected
Input Channels Tab
No.: This column lists all available channels. It can not be edited.
Active:
Shows “ON” for input channels that were active during the acquisition.
The column can not be edited in eZ-PostView.
Label: This should be a meaningful channel name. Highlight a cell before typing a label.
When you press the Enter key, the label is accepted.
Response
Reference
FSV:
There are two types of channels, Response and Reference. All channels are initialized as
Response channels. The column can not be edited in eZ-PostView.
Full-Scale Voltage. The cells in this column are used to set the FSV value in Volts.
This column can not be edited in eZ-PostView.
EU Mode: E(ngineering) U(nits): Select EU or Volt.
This column can not be edited in eZ-PostView.
Units: Enter the measurement units you will be using.
Location: This is a simple numbering system. The channel number is the default value for location.
However, you can highlight a cell and type a different location number. When you press the
Enter key, the value is accepted.
Coord:
This is the axial direction of the transducer that was connected to the channel.
This column can not be edited in eZ-PostView.
Input Type: This is the type of instrument that was attached to the channel. Menu selections include:
Acceleration, Velocity, Displacement, Force, Pressure, Stress, Strain, General, and Tach
(Tachometer). This column can not be edited in eZ-PostView.
2-6 Menus and Windows
09-05-02
eZ-PostView
Page 18
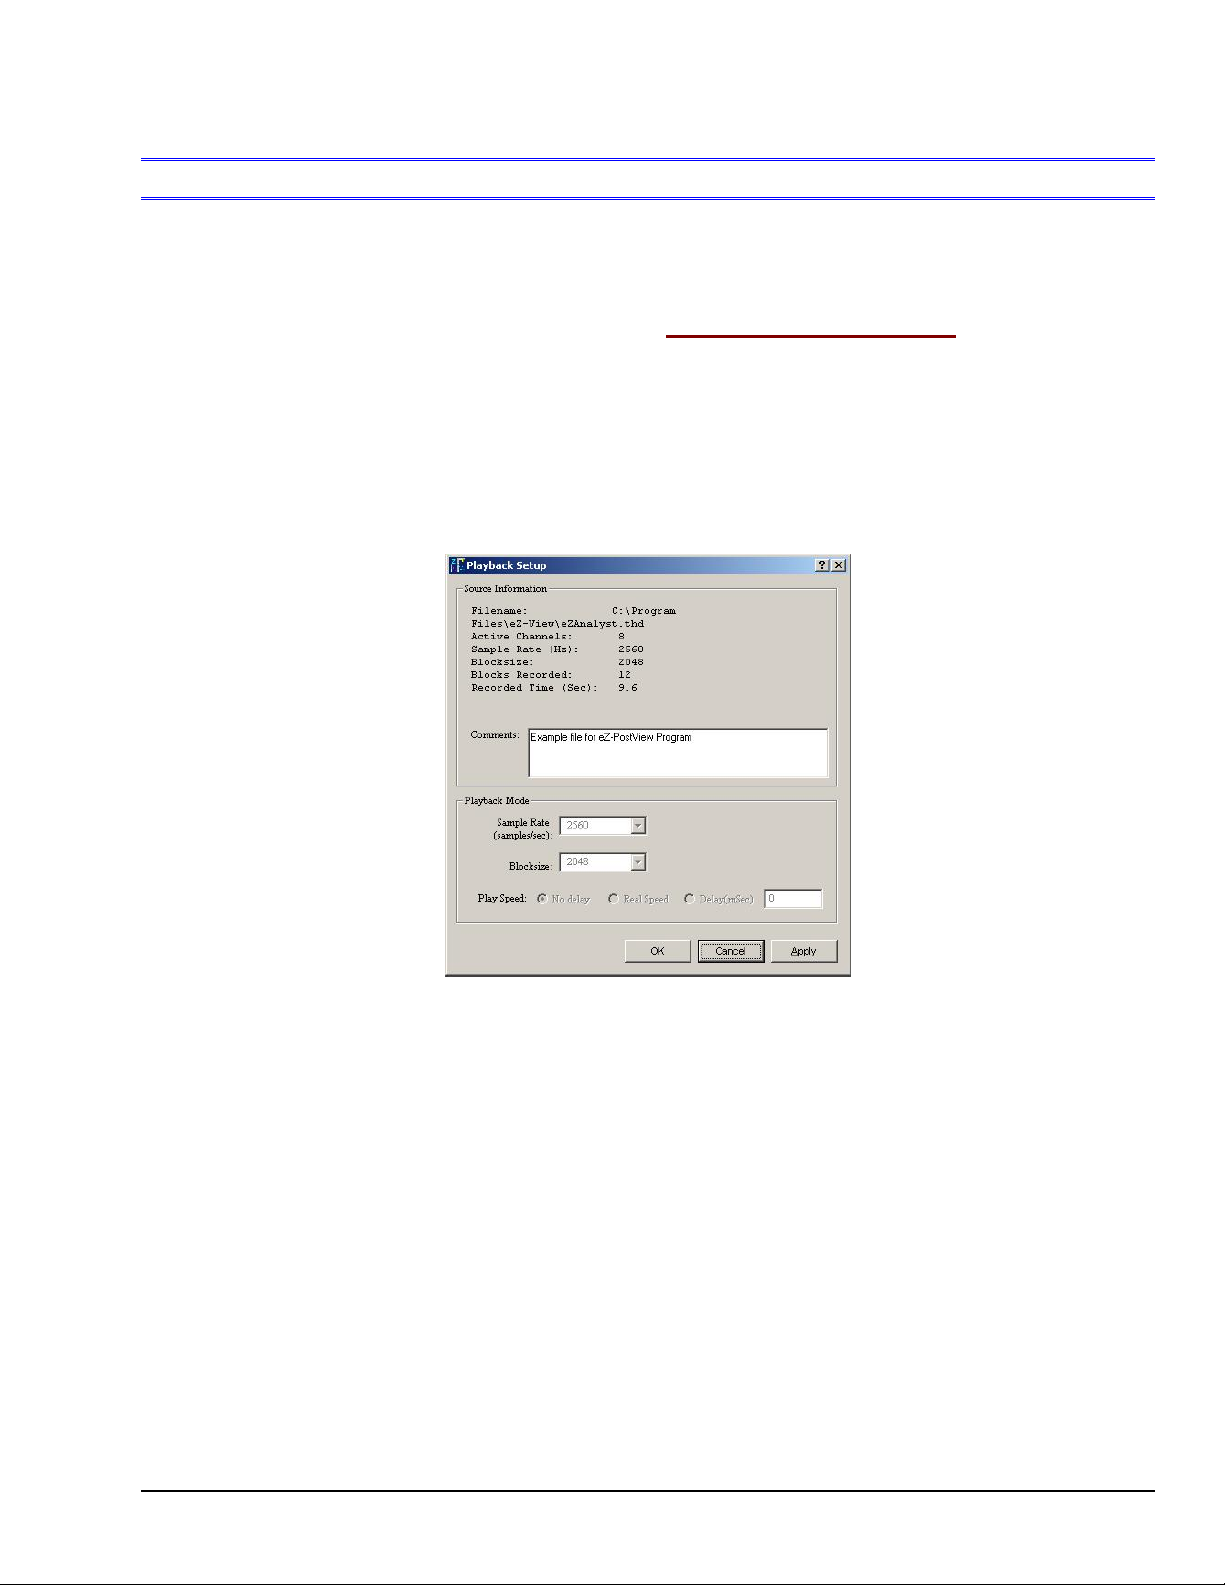
Edit Menu > Playback Setup Window
Edit Menu >
Playback Setup Window: Source Information Panel
There are no playback functions that can be setup from within the eZ-PostView application.
However, the window’s Source Information panel does provide general file related information
such as filename, file location, the number of active channels, sample rate, block size, the
number of blocks recorded, and recorded time.
The panel includes a Comments box for user remarks.
eZ-PostView
Playback Setup Window
09-05-02
Menus and Windows 2-7
Page 19
Edit Menu > Window Colors
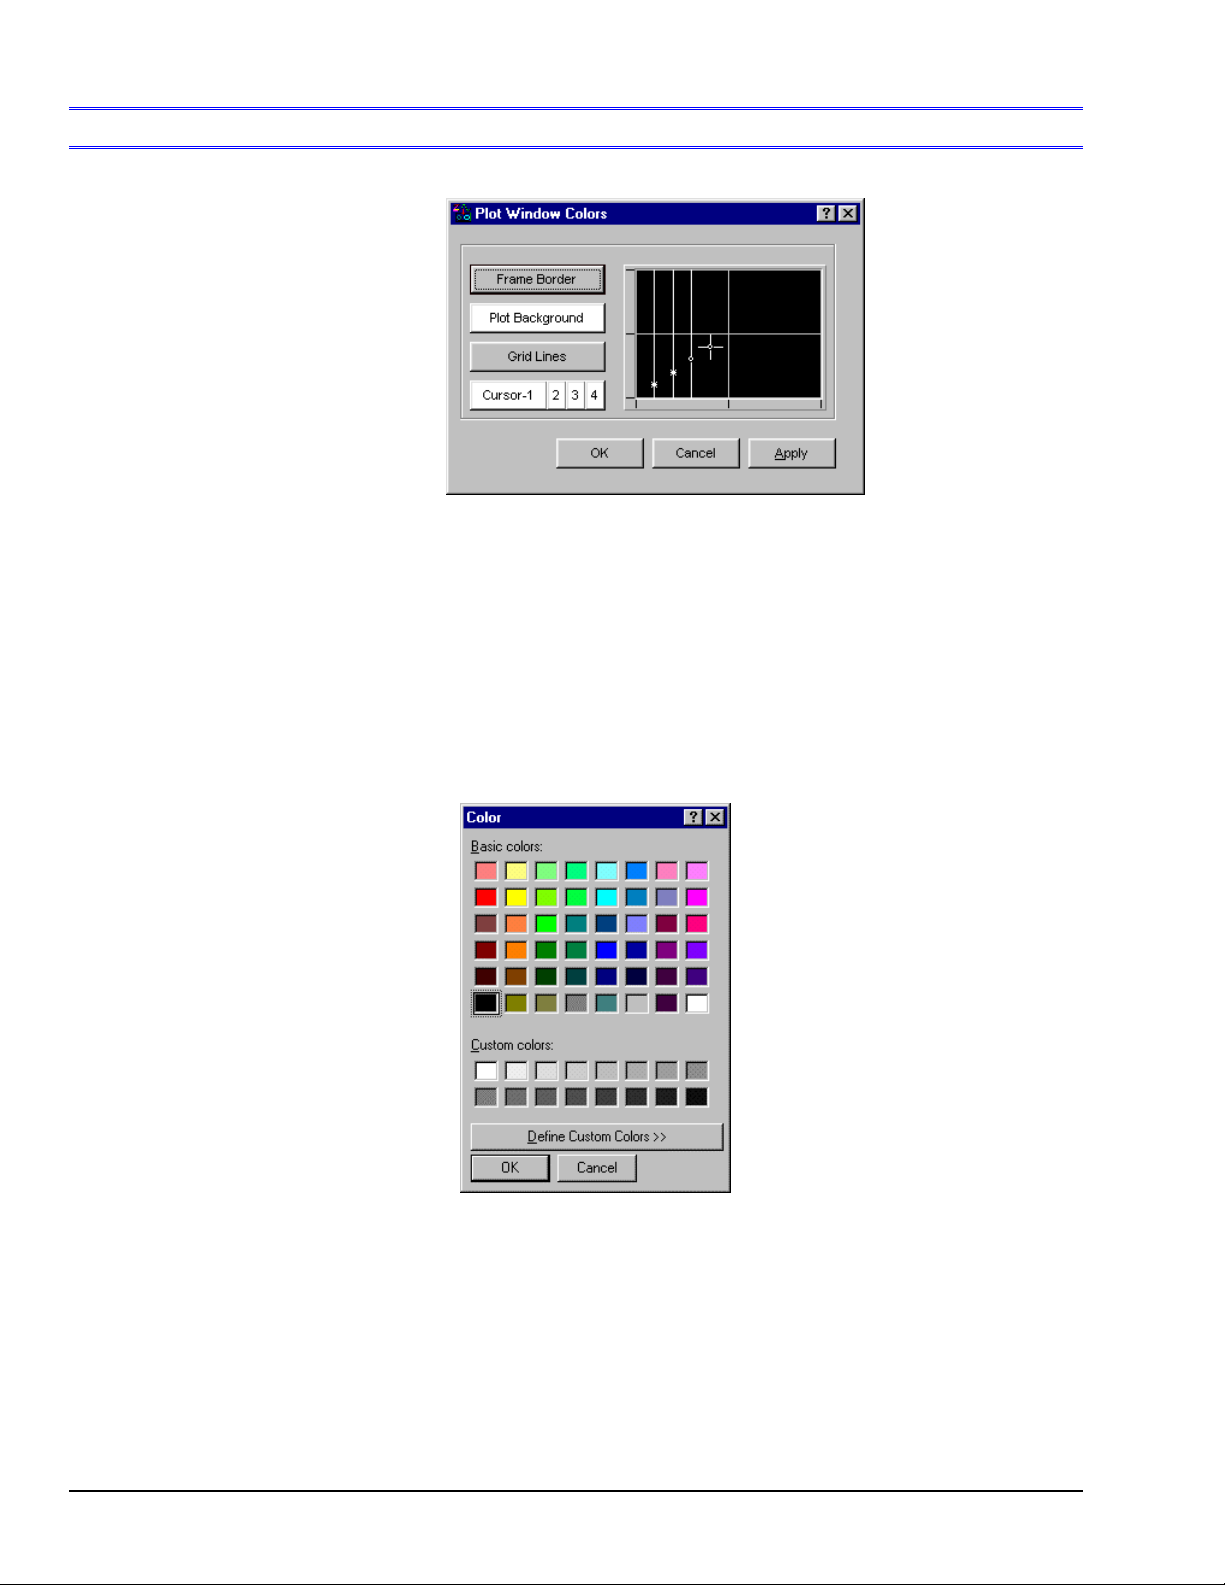
Plot Window Colors
Plot window defaults are:
Frame Border = Grey
Plot Background = Black
Grid Lines = Grey
Cursor = White
The four possible types of cursor are:
Single cursor
Second cursor of band cursors
Peak Search cursor
Data List
1. To change a Plot Window display color, click on the button that applies to the display characteristic,
for example, <Plot Background>.
2. Click <OK>. The Color Palette will open.
3. Select a color by clicking on a color square, or by defining a Custom Color.
4. Click <OK>.
5. Repeat steps 1 through 4 for each Plot Window color that you want to change.
6. When finished, click <OK> in Colors [Color Palette] window.
2-8 Menus and Windows
Color Palette
09-05-02
eZ-PostView
Page 20
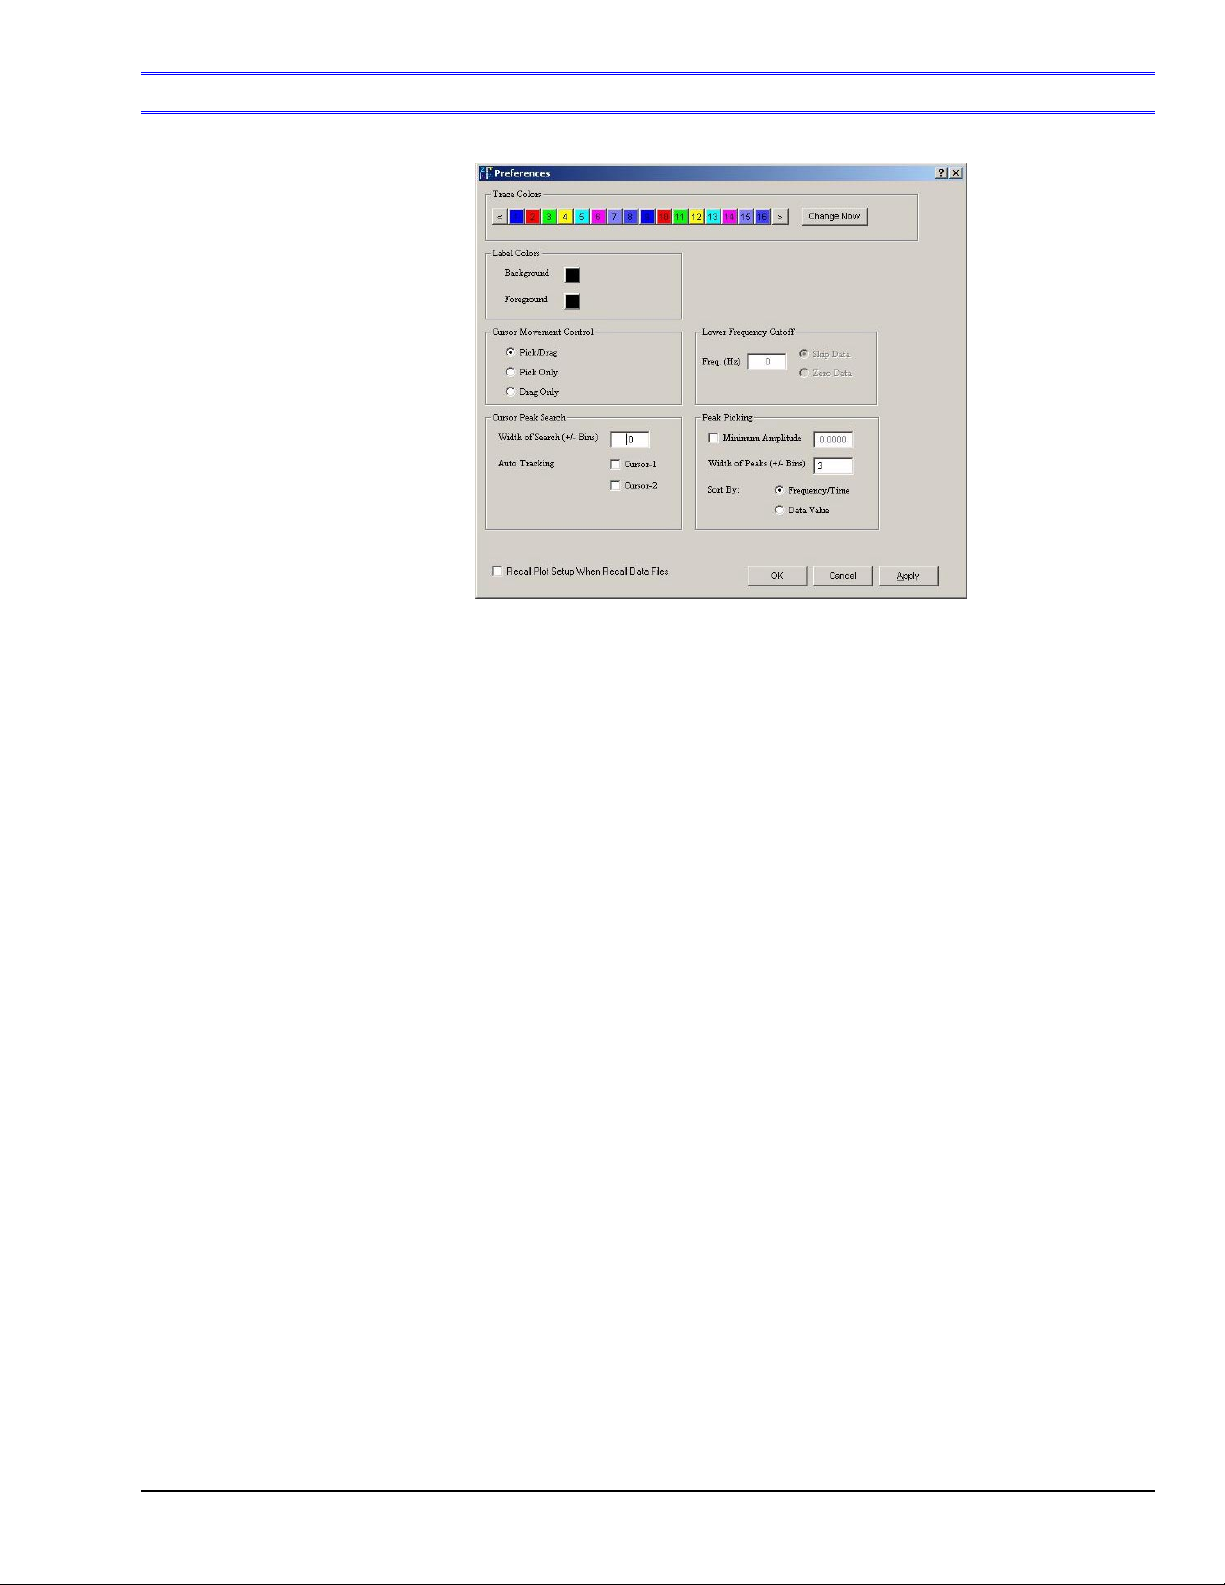
Edit Menu > Preferences Window
The Preferences window provides a mean of setting several acquisition-related processing options.
Preferences
Trace Colors:
Defines colors for traces. Click on a channel’s color chip to open a color palette.
Pick a new color, then click <OK>.
Labels Colors:
Defines colors for on-plot text labels. Click on a color chip to open a color palette.
Pick a new color, then click <OK>.
Cursor Movement
Control:
Sets the cursor’s action. Options are: Pick/Drag, Pick Only, and Drag Only.
Pick/Drag: Makes use of both the Pick Mode and the Drag Mode.
Pick Only: Clicking the left mouse button allows the cursor to move
instantaneously with the band cursor. The chosen cursor moves to the location
when the mouse is clicked.
Drag Only: Move the mouse pointer to the cursor location. The pointer will
change to a “Left and Right Arrow.” Click and drag the cursor to the designated
location.
Cursor Peak Search:n/a
Peak Picking:
Recall Plot Setup. . .
n/a
If the box is checked, the custom plot setup will be saved (recalled) and will be
applied when the next time the associated data file is opened.
eZ-PostView
09-05-02
Menus and Windows 2-9
Page 21

2-10 Menus and Windows
09-05-02
eZ-PostView
Page 22
Window Menu
Menu Items
Add Function View (FV) …… 2-11
Delete Window …… 2-11
Channel Buttons ……2-11
Cascade …… 2-12
Tile Vertically ……2-12
Tile Horizontally …… 2-13
Refresh Windows …… 2-13
Reference Note:
For information regarding the interactive features of Plot Display Windows, refer to chapter 3.
The interactive features are not selected from the Window Menu, but are accessed via mouse
buttons and/or hotkeys.
Window Menu
Window Menu
Window Menu
> Add Function View (FV)
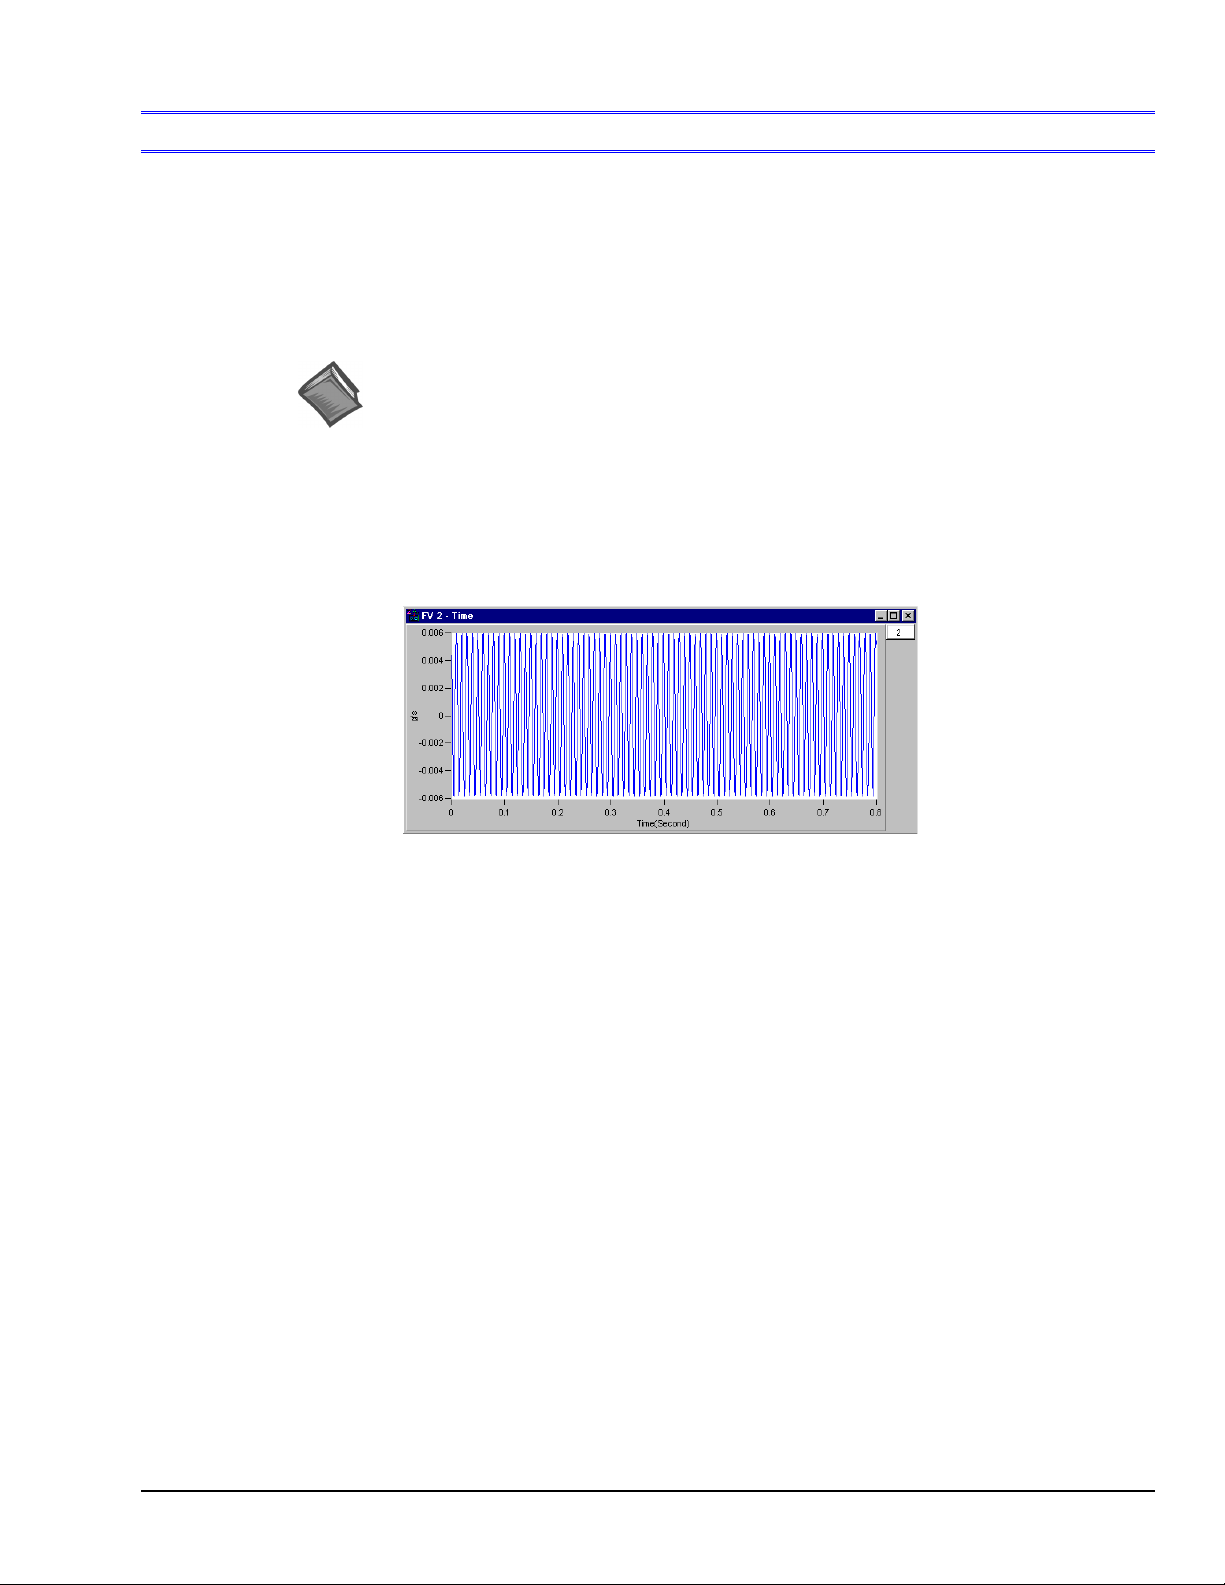
This menu selection opens an additional plot window.
Example of an Added Function View
> Delete Window
Deletes the window that is currently in focus. When multiple plot windows are open, one is always the
“focus window. When a window does not have focus, its title bar is dimmed. To change the “focus
window,” simply click on top or side border of the window of interest.
> Channel Buttons
Brings up a display showing squares for all channel buttons. The buttons are used in the exact same
manner as the 16 channel buttons that are located on eZ-PostView’s main window, just below the
Date/Time region.
eZ-PostView
• To add a channel: use the mouse to click and drag a channel box from the complete channel button
display into the plot area.
• To remove a channel: use the mouse to click and drag a channel box (from the right-side of the plot)
into the plot area.
09-05-02
Menus and Windows 2-11
Page 23
Window Menu
> Cascade
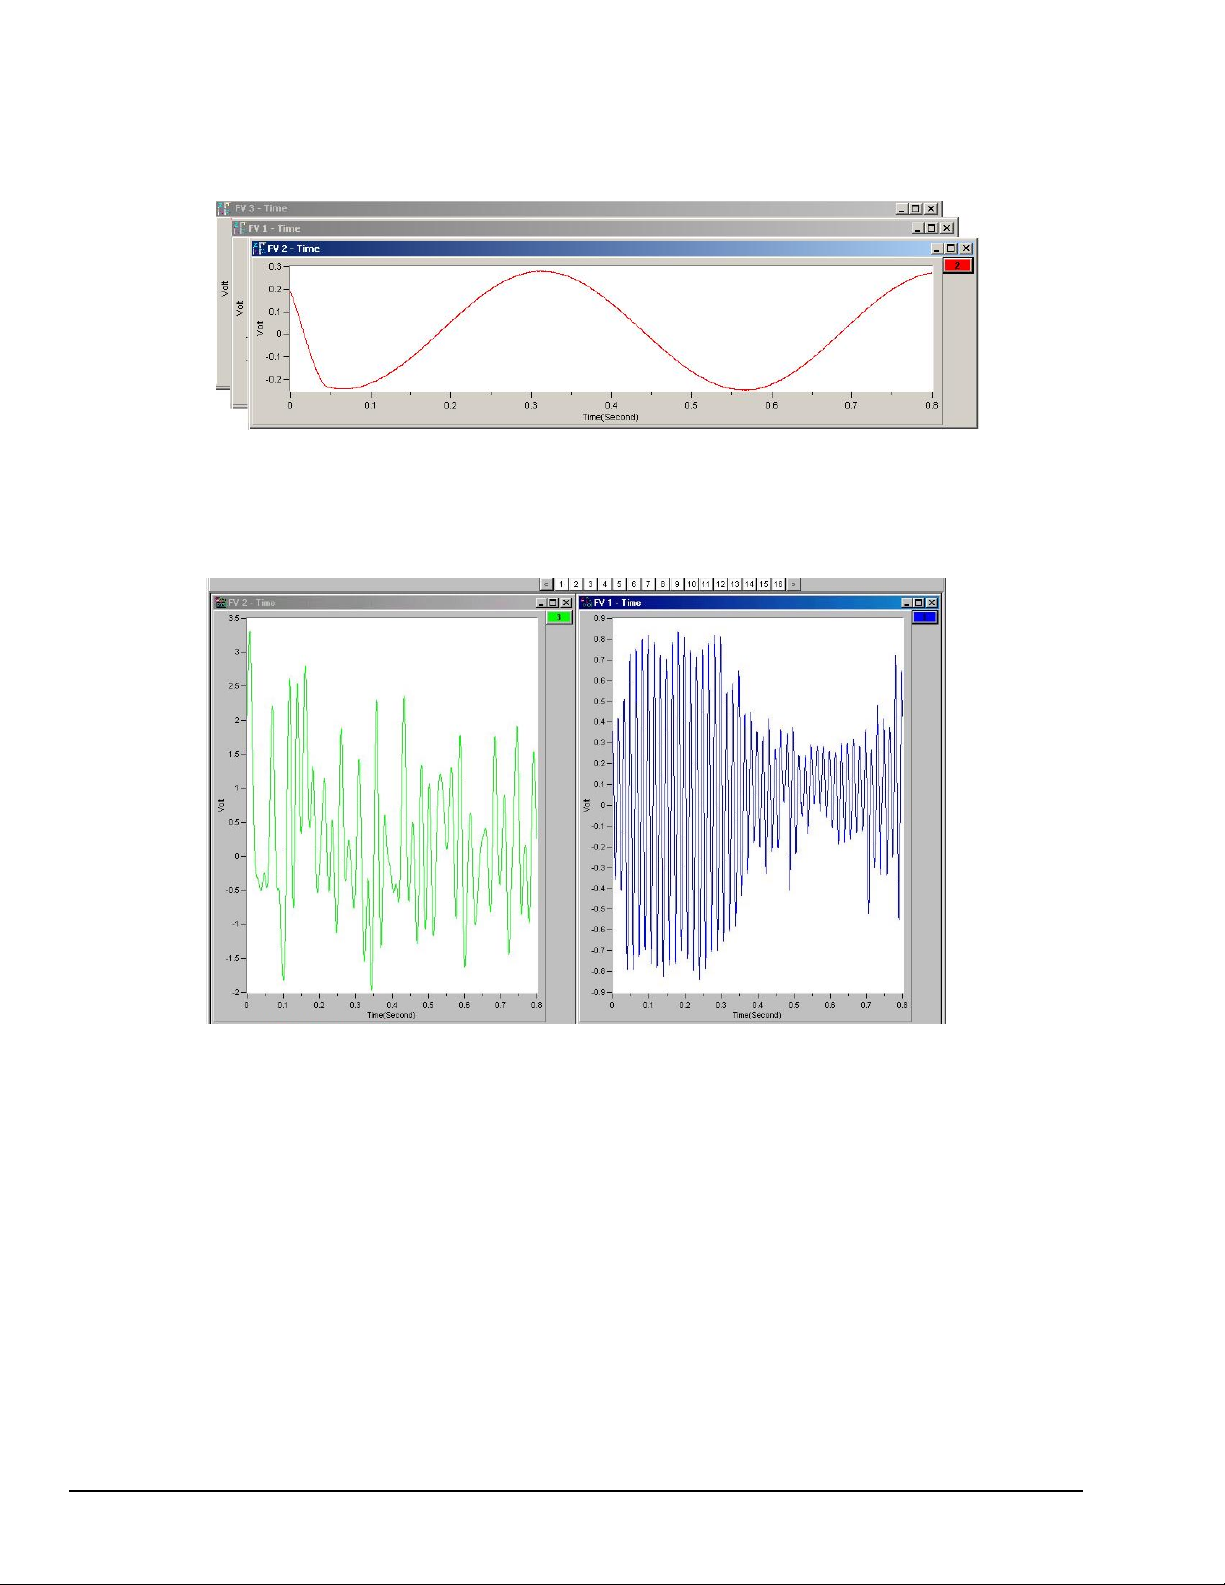
When you have multiple plot windows open, this menu selection arranges them on you screen as shown.
Example of using Cascade with three Plot Windows
Window Menu
> Tile Vertically
When you have multiple plot windows open, this menu selection arranges them on your screen as shown.
Example of using Vertical Tile with two Plots
Each plot is longer in the “vertical” direction.
2-12 Menus and Windows
09-05-02
eZ-PostView
Page 24
Window Menu
> Tile Horizontally
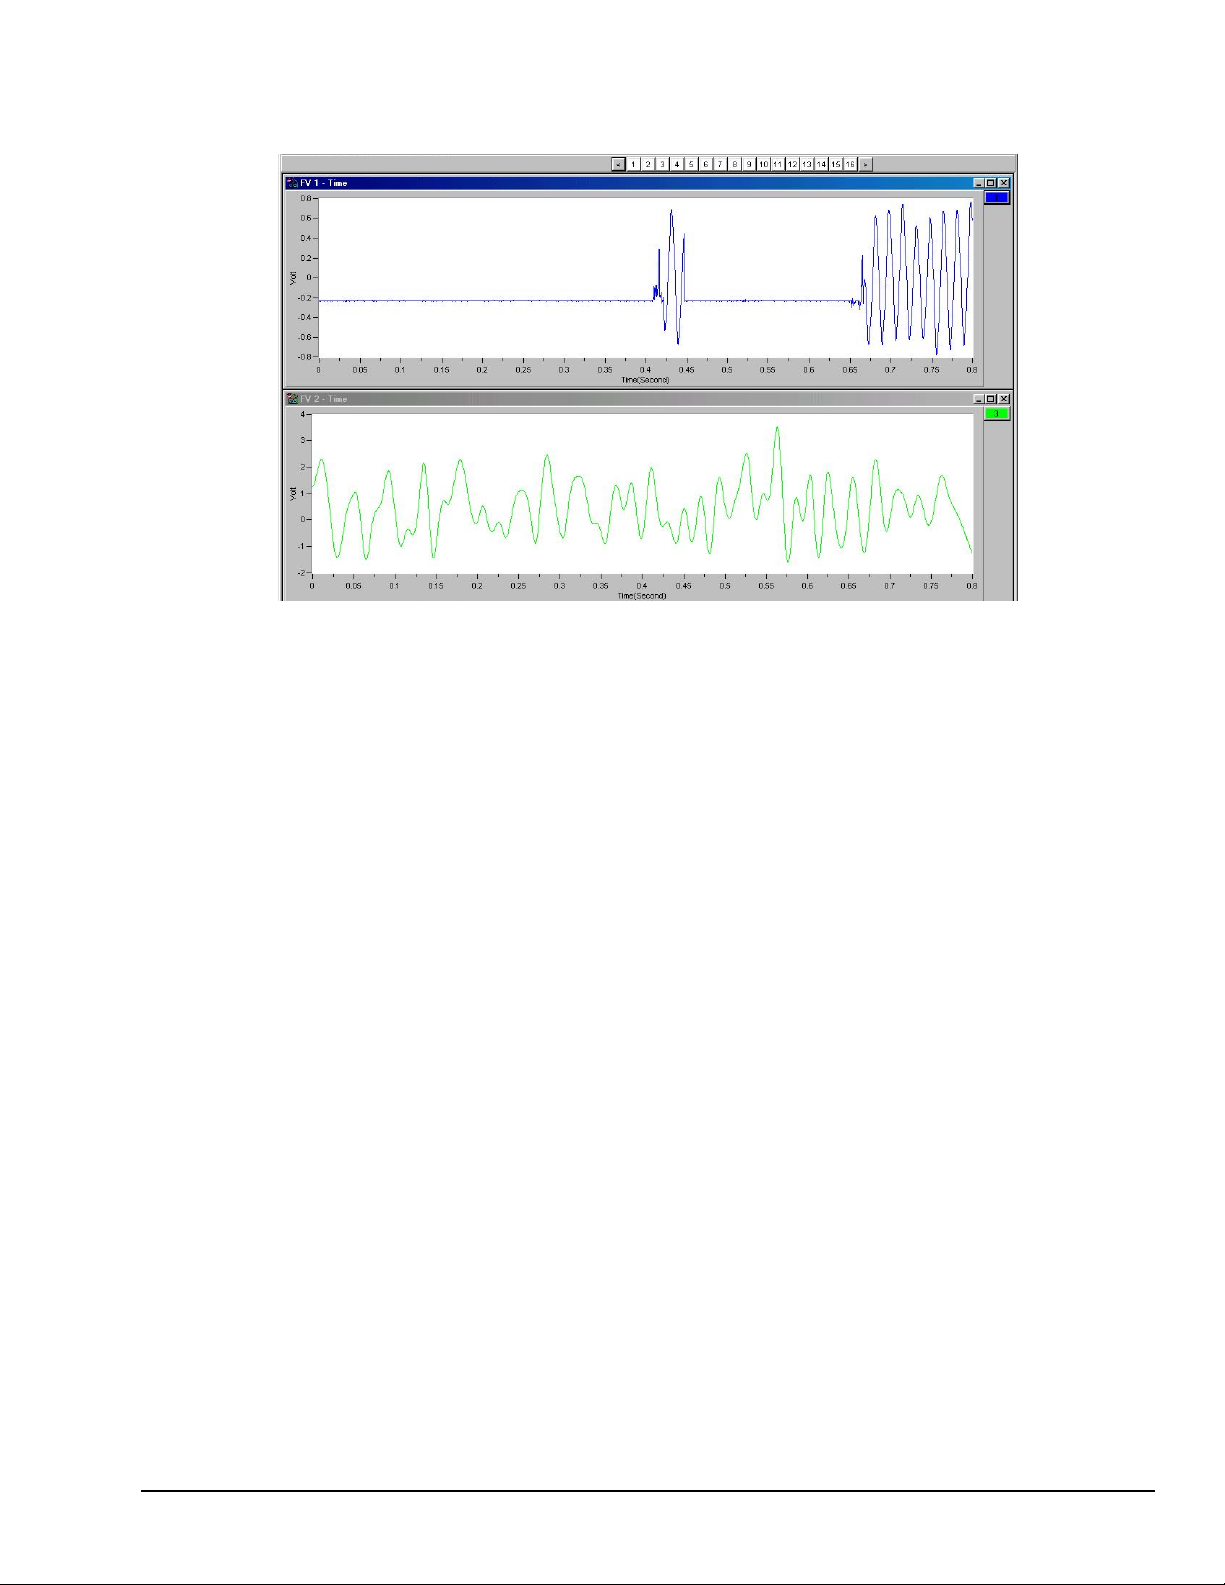
When you have multiple plot windows open; this menu selection arranges them on your screen as shown.
Example of using Horizontal Tile with two Plots
Each plot is longer in the “horizontal” direction.
Window Menu
> Refresh Windows
Used to refresh a window; for example, to refresh a Strip Chart. In this case, the refresh function blanks
out the present Strip Chart, essentially providing you with a new, clean window.
eZ-PostView
09-05-02
Menus and Windows 2-13
Page 25

2-14 Menus and Windows
09-05-02
eZ-PostView
Page 26

Interactive Features of eZ-PostView’s Plot Display Window
How to Change Plot Display Characteristics ……3-2
How to Change “Focus” …… 3-2
How to Add and Remove Channels …… 3-2
Other Features …… 3-3
Copy …… 3-3
Cursor …… 3-3
Label / List …… 3-4
Changing the Display Range …… 3-5
Changing the Plot’s Format / Scale / Grid …… 3-6
3
eZ-PostView
08-30-022
Interactive Plot Display 3-1
Page 27
How to Change Plot Display Characteristics
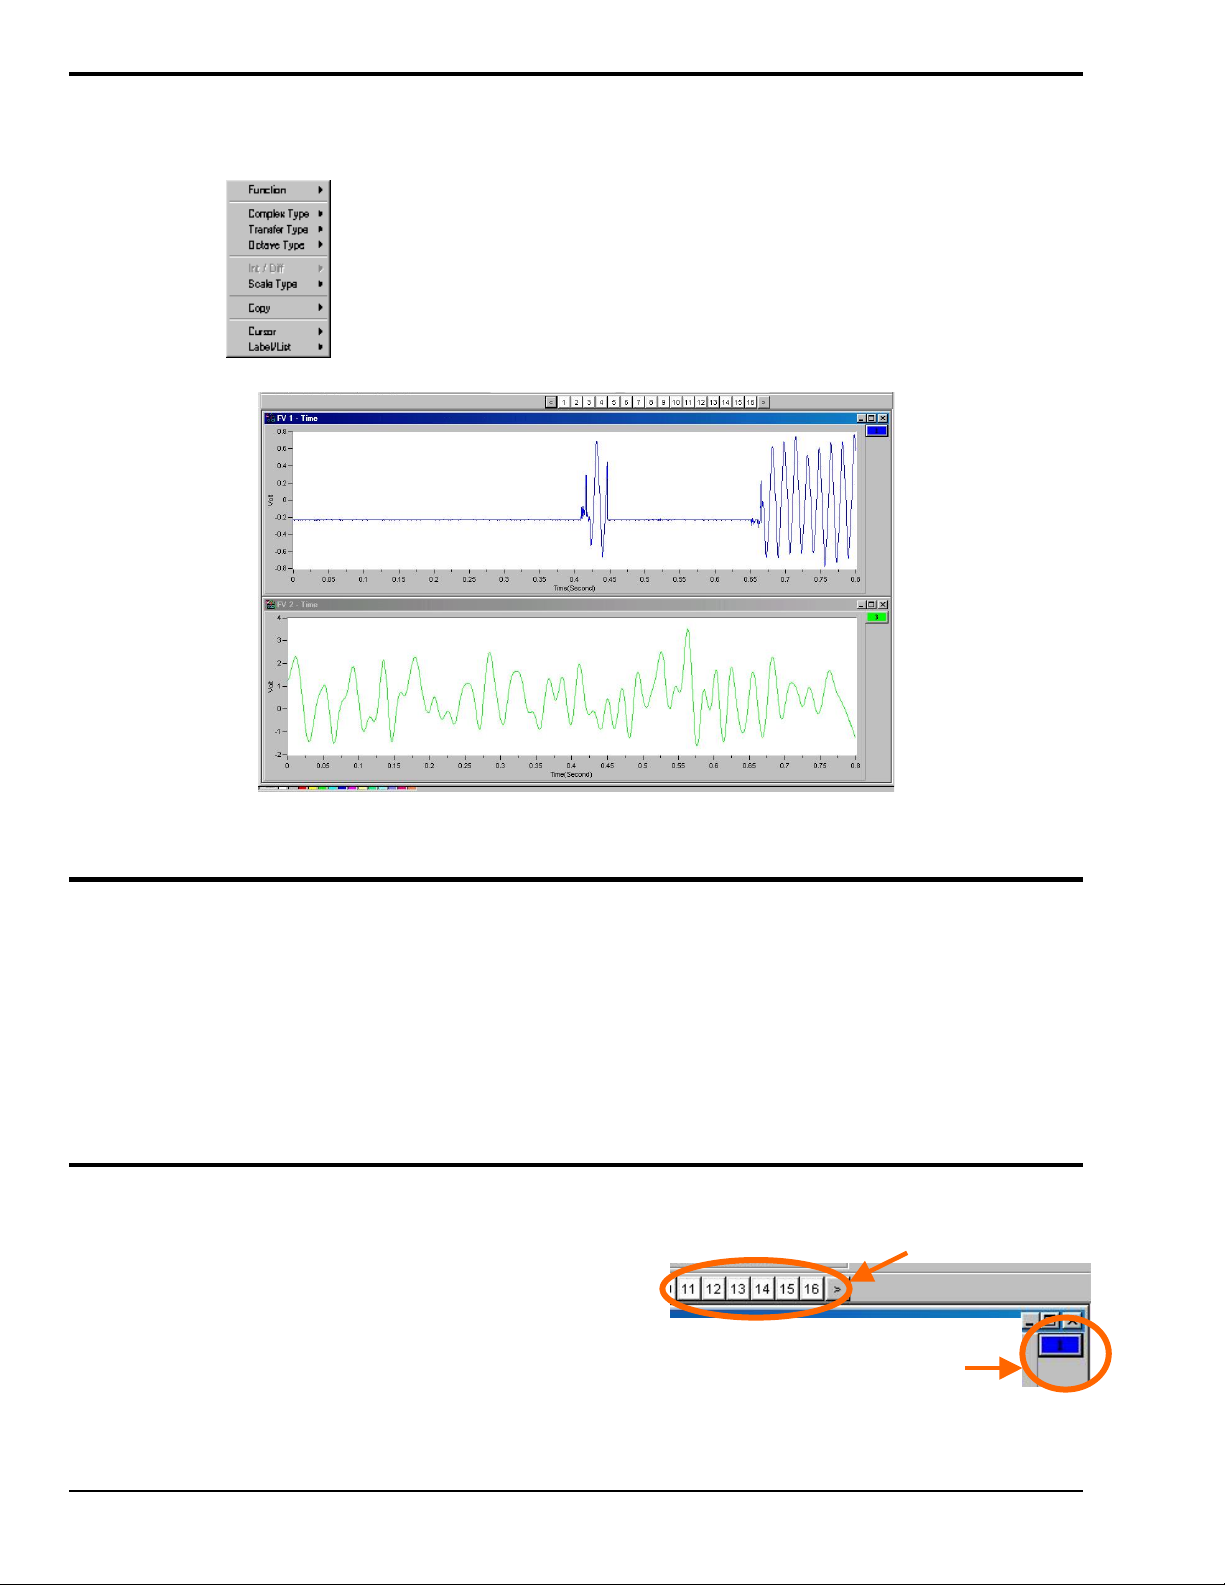
To change a plot’s display characteristics; it must be the “focus plot.” Then, you can either use the mouse
or key commands to make changes. “Focus” is explained in the following section.
Open Plot Display Characteristics Menu: Press “D” or right click with the cursor
hovering over the plotted data.
Use the down arrow key to highlight a menu option, then press “Enter”. Note that in
some cases you can press the first letter of an option to open its sub menu, for example,
pressing the “S” key opens the Scale Type sub menu.
Two Plot Windows
In this figure, the upper plot has the “focus.”
How to Change “Focus”
Focus can refer to the window that is in focus, as well as to a plot that is in focus. When multiple plot
windows are open, one is always the “focus window. ” In the following figure, the window with the dark
title bar (top window) is the window that currently has “focus.” When a window does not have focus, its
title bar is dimmed. To change the “focus window,” simply click on top or side border of the window
of interest.
When multiple plot windows are open, a plot other than the one in the “focus” window can be the “focus
plot.” You would typically do this when you want to change a plot’s characteristics. To change the “focus
plot,” click in the plotted area of the window of interest. Note that the window must be in focus at the
time.
How to Add and Remove Channels
To add a channel to a plot . . .
With your mouse, click and drag a channel box
from above the plot to the plot area.
To remove a channel from a plot . . .
With your mouse, click and drag a channel box
from the right of the plot into the plot area.
To ADD a channel, click-on the desired “channel box”
in this area and drag it into the plot region.
To REMOVE a channel, click on the
desired “channel box” in this area and
drag it into the plot region.
3-2 Interactive Plot Display
08-30-02
eZ-PostView
Page 28
Other Features
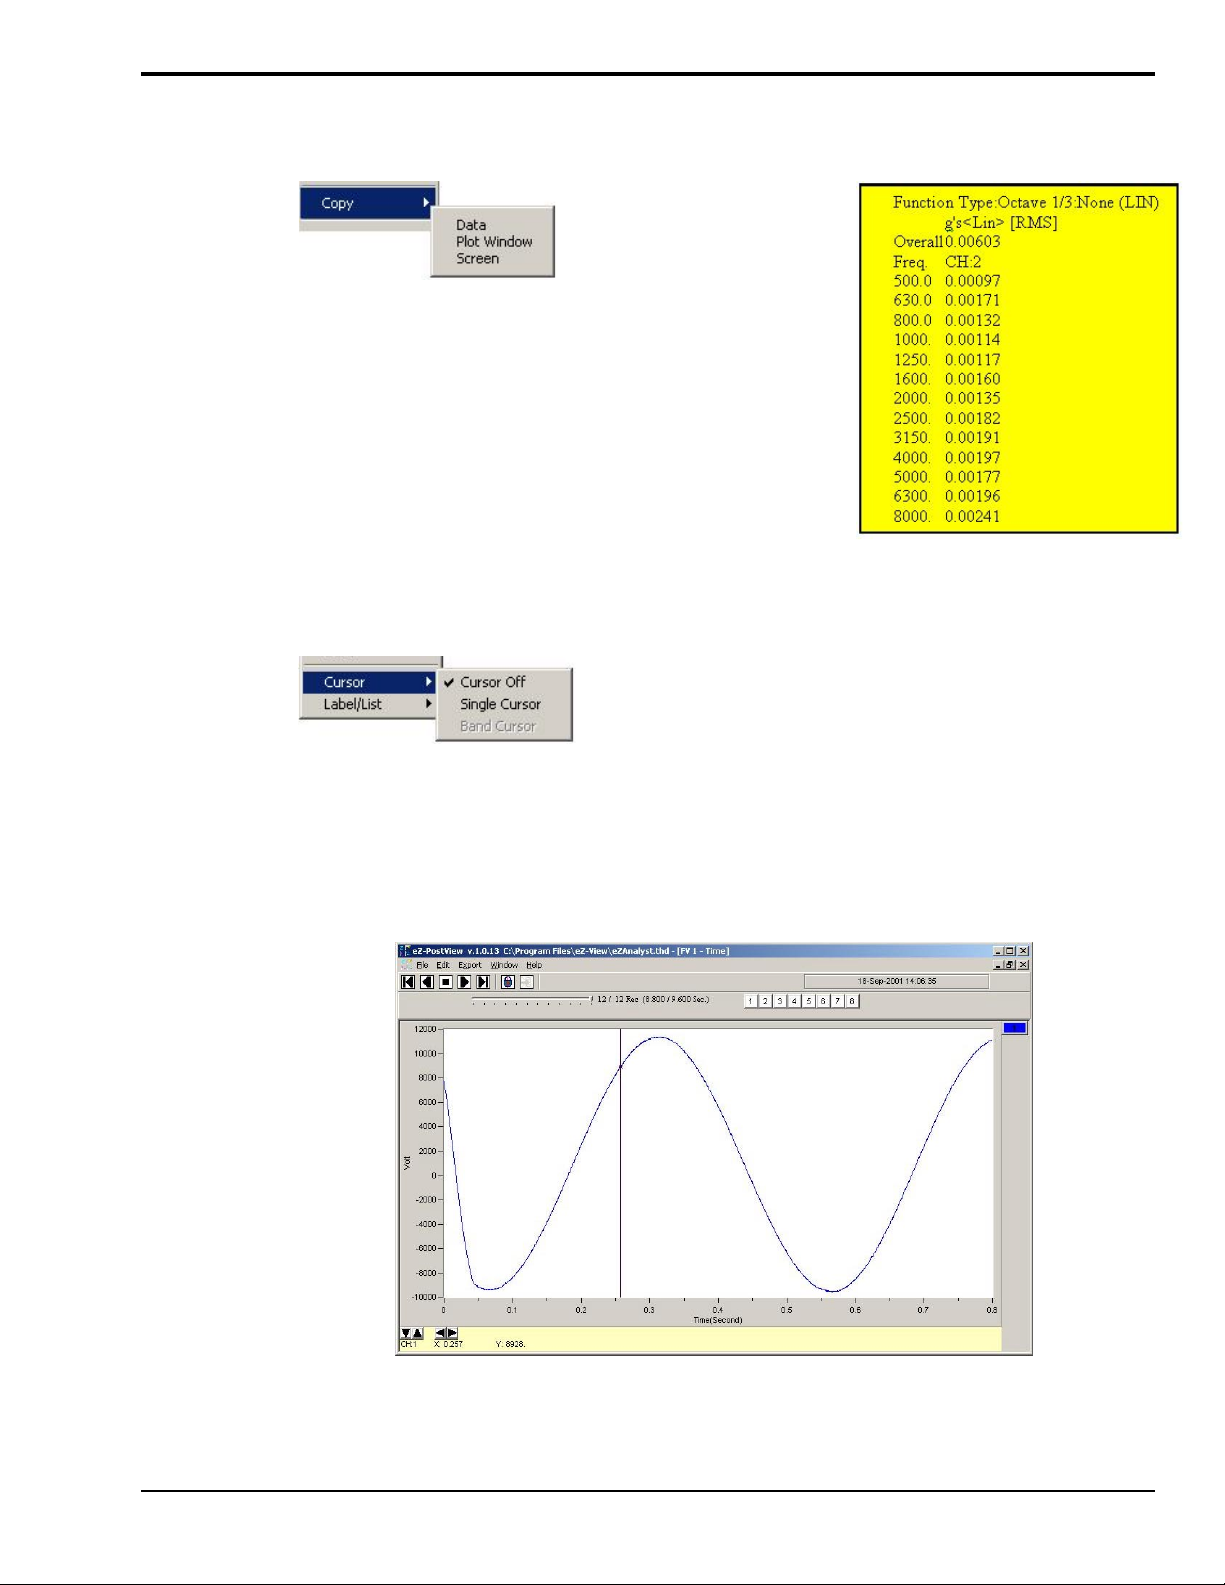
Copy
To Open the Copy Menu: Press “D” + “C,” then release the keys.
The Copy selection will be highlighted. Press “Enter.”
Next, use the down arrow key to select the item you desire to
copy: Data, Plot Window, or Screen, then press “Enter.”
You can paste the copied item into other applications. For
example, plotted data can be copied into Notepad, Word, or Excel
for use in reports or in the case of Excel further calculations.
The plot window and full screen can be copied and then pasted
into any application that accepts graphics, such as MSPaint or
Word.
Cursor
Plot Window Data
Copied and Pasted into Word
To Open the Cursor Menu: Press “D” + “C,” then release the
keys. Then use the down-arrow key to highlight Cursor and press
“Enter.”
Next use the down arrow key to select, Cursor Off or Single
Cursor, then press “Enter.”
When Single Cursor is selected, a cursor appears at the far left of the plot and cursor controls and cursor
information are added below the plot. Click on the plot where you want the cursor. To fine-tune the cursor
location, use the right and left arrows at the bottom. Use the X and Y information for additional help. If
you have multiple channels in the graph, use the up and down arrows to move the cursor from plot to plot.
Press “C” to toggle the cursor on and off.
eZ-PostView
Plot Window with Single Cursor
08-30-022
Interactive Plot Display 3-3
Page 29
Label / List
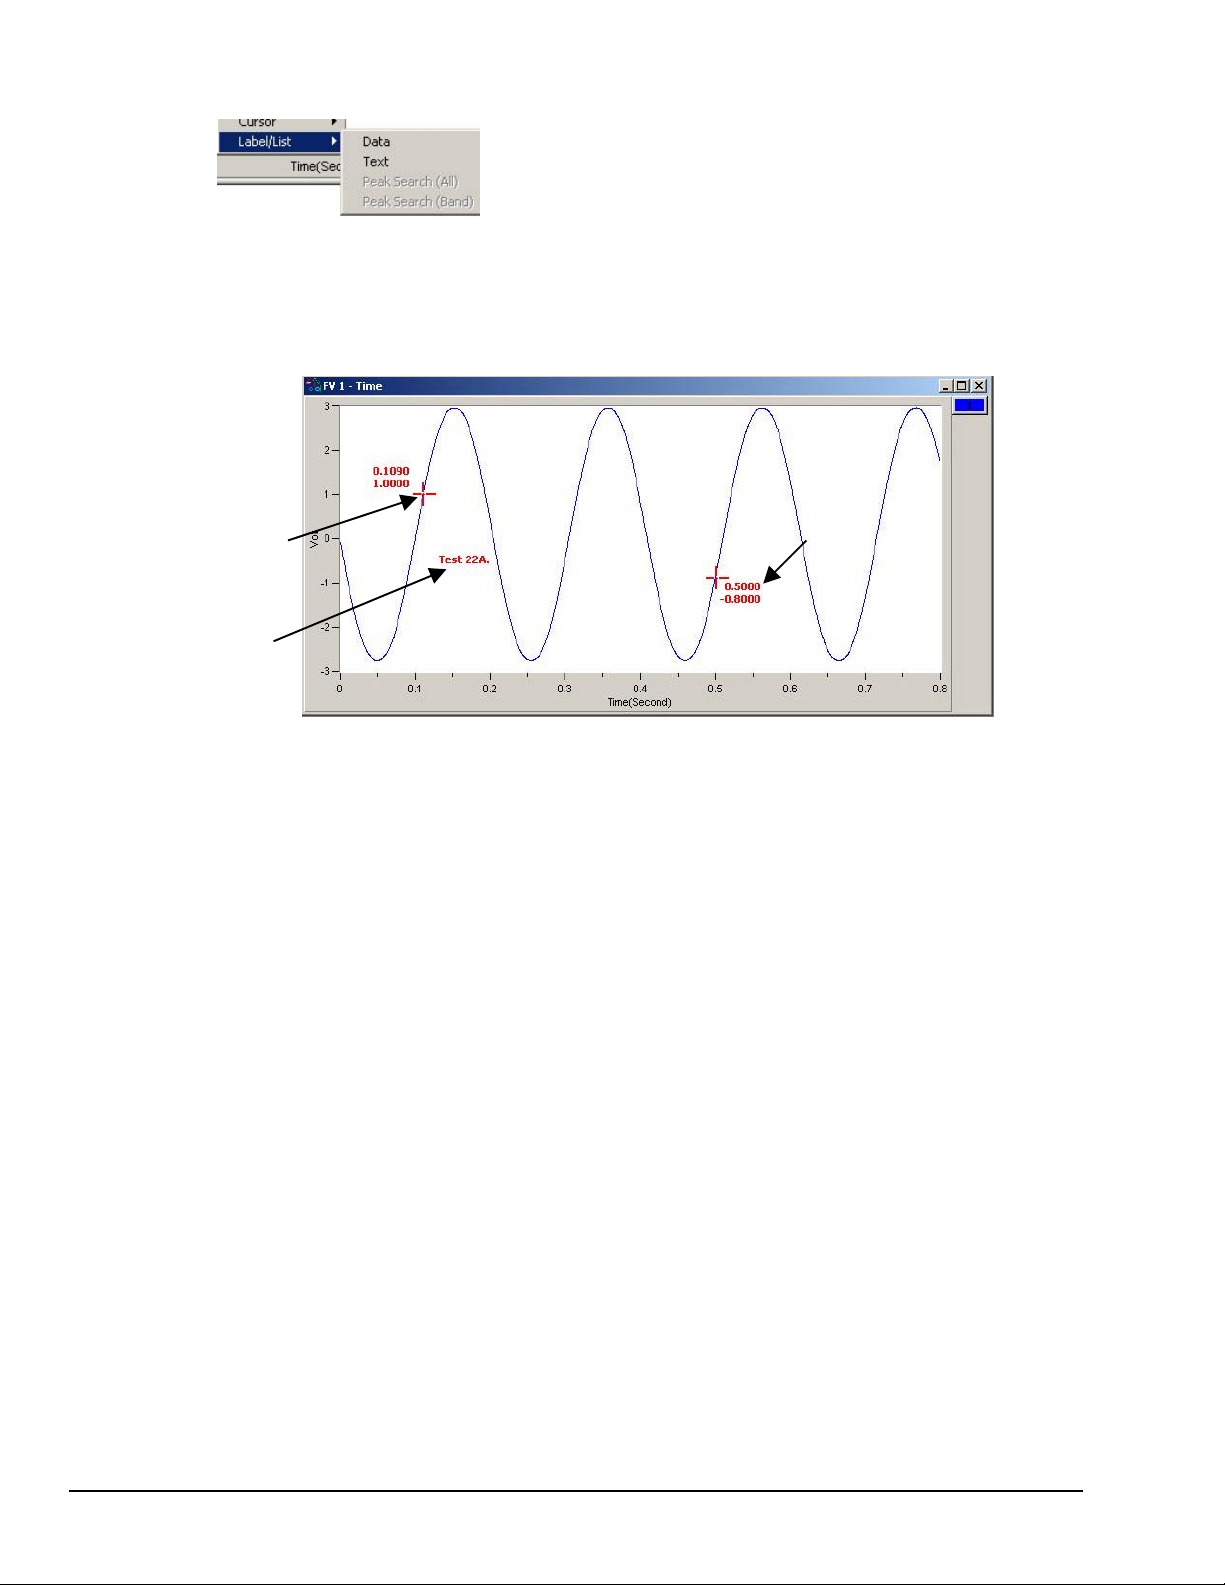
To Open the Label/List Menu press “D” + “L,” then release the keys.
Label/List will be highlighted. Press “Enter.”
Using the down arrow key, select Data or Text. Then press “Enter.”
Data places up to 10 cursor values on your plot. After you select data, a temporary cursor is placed on the
plot and the x, y data values are shown for that location. As you move your mouse, the temporary cursor
will move across the plot with data values continuously updated. When you have the cursor where you
want it, click on the mouse to place the label. Another temporary cursor immediately appears. When you
are finished labeling values, right-click and select Pointer to return to a normal state.
Data
x and y
Data
Cursor
Text
values
Adding Data Point Cursors and Text
Text places a comments text box on the plot. After you select text, click on the plot and start typing. You
are limited to 26 character places. Click on the right corner of the text box to move it anywhere on the plot
window.
3-4 Interactive Plot Display
08-30-02
eZ-PostView
Page 30
Changing the Display Range
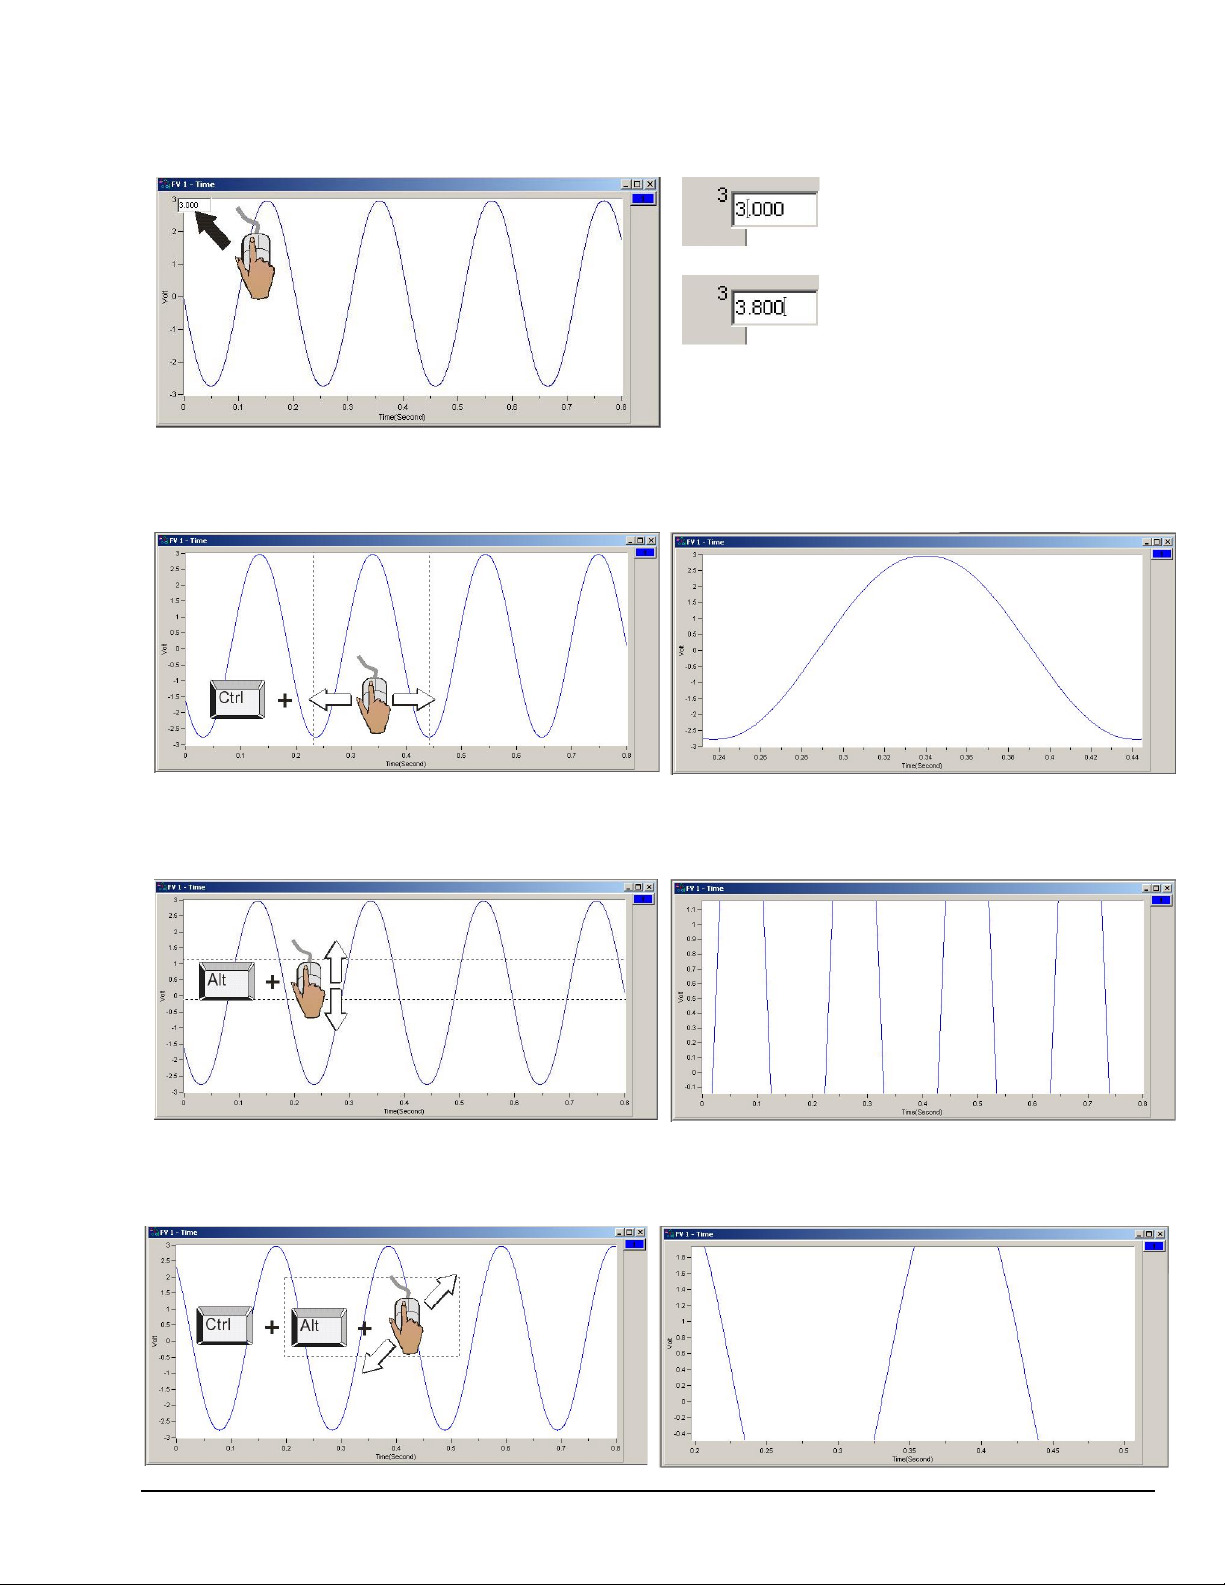
To change the maximum or minimum range value: Left-click on upper or lower scale value that is to be changed, then
enter the new value. An example follows.
In this example, the cursor and PC
keyboard were used to change the
maximum scale value from 3.000 volts
to 3.800 volts.
To change the X-Axis: Hold down the <Ctrl> key, at the same time, left-click and drag the mouse cursor horizontally on
the plot. Two vertical cursor lines will define the new x-axis end points.
To change the Y-Axis: Hold down the <Alt> key, at the same time, left-click and drag the mouse cursor vertically on the
plot. Two horizontal cursor lines will define the new Y-axis end-points.
To simultaneously change the X & Y Axes: Hold down the <Ctrl> and <Alt> keys, at the same time, left-click and drag
the mouse cursor diagonally on the plot. A rectangle will define the new area of the plot.
eZ-PostView
08-30-022
Interactive Plot Display 3-5
Page 31
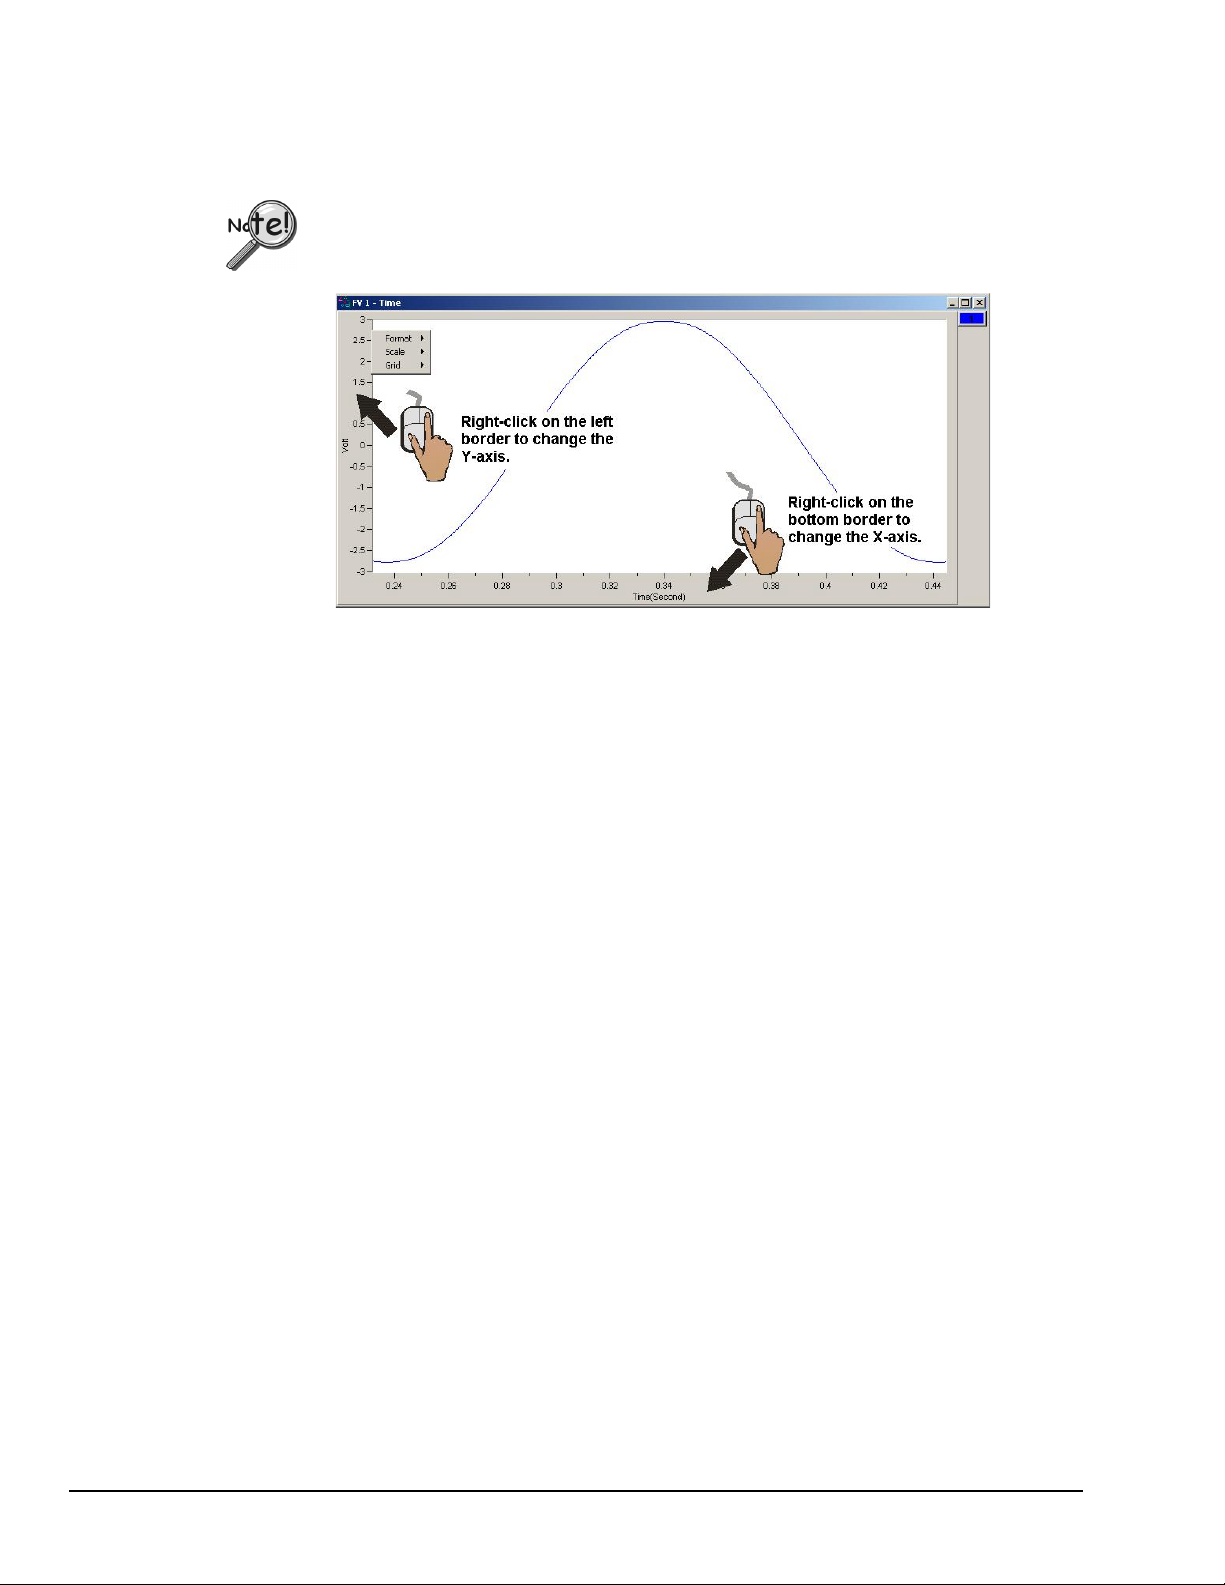
Changing the Plot’s Format / Scale / Grid
Right-Click on the plot’s border to open a popup menu (see figure). If you want to change the y-axis, rightclick on the plots left border. If you want to change the x-axis, right-click on the plot’s bottom border.
Changing the plot Format, Scale, or Grid affects the display only.
It does not change the real data.
Format
The Format menu allows you to change the axis format of the plotted data.
Scale
The Scale menu allows you to change the plot scale to AutoScale, FixedScale, or Manual.
Autoscale ensures that all the captured data is visible on the plot.
Grid
The Grid menu allows you to place and remove grid lines from the graph of plotted data. You can also turn
the grid on and off by pressing the “G” hot key.
3-6 Interactive Plot Display
08-30-02
eZ-PostView
Page 32

Note:
Appendix A, taken from the eZ-Analyst Series Software Reference Manual, p/n 1086-0922, consists of
several hot key tables for the benefit of those who prefer to use keys in place of mouse/cursor interaction
with a GUI.
Although eZ-PostView was derived from eZ-Analyst, certain key functions will not apply, for example,
the keys perta ining to Measurement, Scope, and Generator Contro l .
eZ-PostView Note Regarding Appendix A
05-28-02
Keyboard Controls A-
i
Page 33

A-ii Keyboard Controls
04-24-02
Appendix A
Page 34
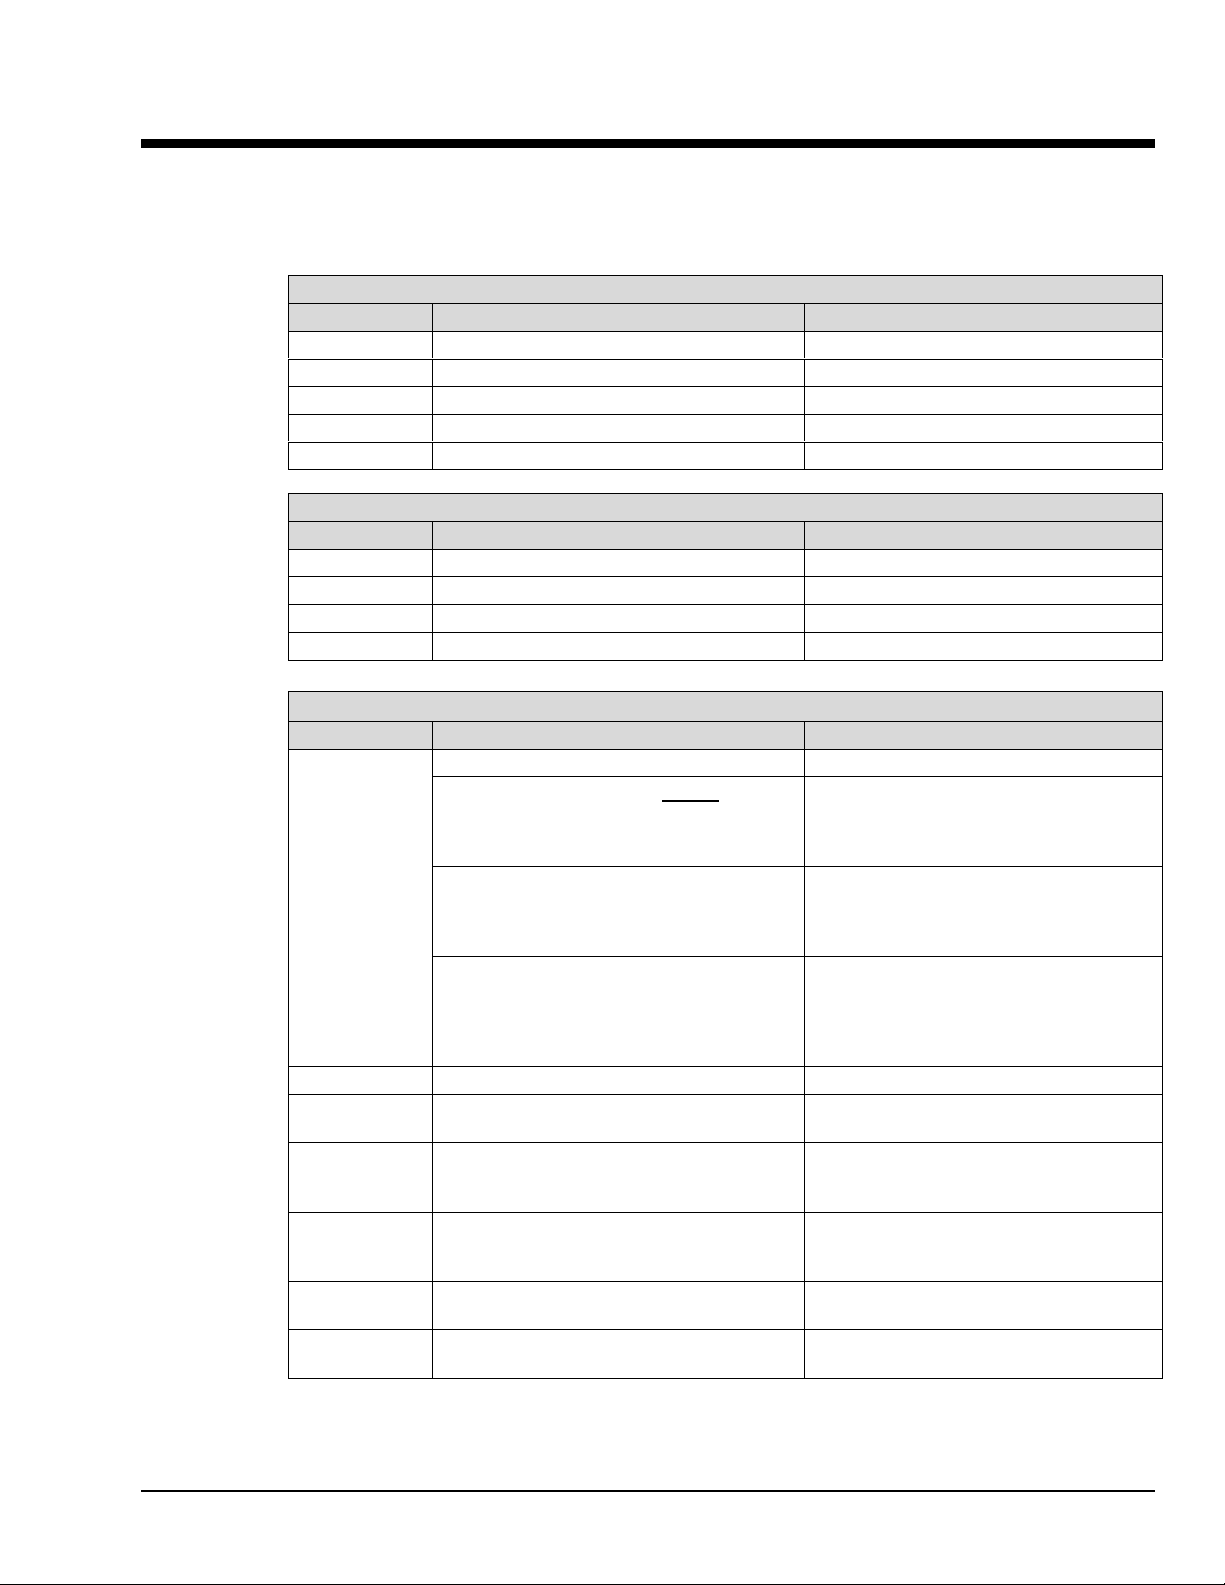
Appendix A
- Keyboard Controls for eZ-Analyst A
This appendix consists of several hot key tables for the benefit of those who prefer to use keys in place of
mouse/cursor interaction with a GUI. However, for certain functions, such as changing axis scales, a
mouse will be needed. Mouse use is pointed out in the tables, when applicable.
Record / Playback Control
Keys Function Comments
p
<Shift> + p
o
<Shift> + o
H
Play Forward
Play Backward
Step Forward and Record
Step Backward and Record
Halt Playback
Measurement, Scope, and Generator Control
Keys Function Comments
H
R
S
W
Halt the measurement
Start recording
Start Scope Mode (Measurement)
Turn the signal generator On
-----
-----
-----
-----
-----
-----
-----
-----
-----
Menu and Window Control
Keys Function Comments
Alt + E …
… C
… M
… P
Alt + F
Alt + W
Ctrl + M
Ctrl + O
Ctrl + P
D
Presents the
Presents the
Presents the
Presents the
Presents the
Presents the
Presents the
Presents the
Presents the
Presents the
to as the Plot Display Characteristics Menu.
Edit Menu
.
Plot Window Colors
Configuration
Playback Setup
File Menu
Window Menu
Configuration
Open File Dialog
Print Dialog
Display Menu
window.
window. After pressing
.
.
window.
window.
window.
, also referred
window.
After pressing
Menu, press C to get the Colors Window.
Use the Tab key to select a characteristic,
then hit <Enter>.
After pressing
Menu, press M to get the Configuration
Window. You will need a mouse to access
all panels. Also, see Ctrl + M.
Menu, press P to get the Playback Setup
Window. Use the Tab and arrow keys to
make selections within this window. Then
hit <Enter>.
You will need a mouse to make
selections.
You will need a mouse to access all
panels. An alternative to Ctrl + M is to
press M when the Edit Menu is open.
From within the window, use the Tab and
arrow keys. An alternative to Ctrl + O is to
press O when the File Menu is open.
An alternative to Ctrl + P is to press P
when the File Menu is open.
Refer to the following table for control
options related to the Display Menu.
-----
Alt + E
to access the Edit
Alt + E
to access the Edit
Alt + E
to access the Edit
-----
Appendix A
04-24-02
Keyboard Controls A-1
Page 35
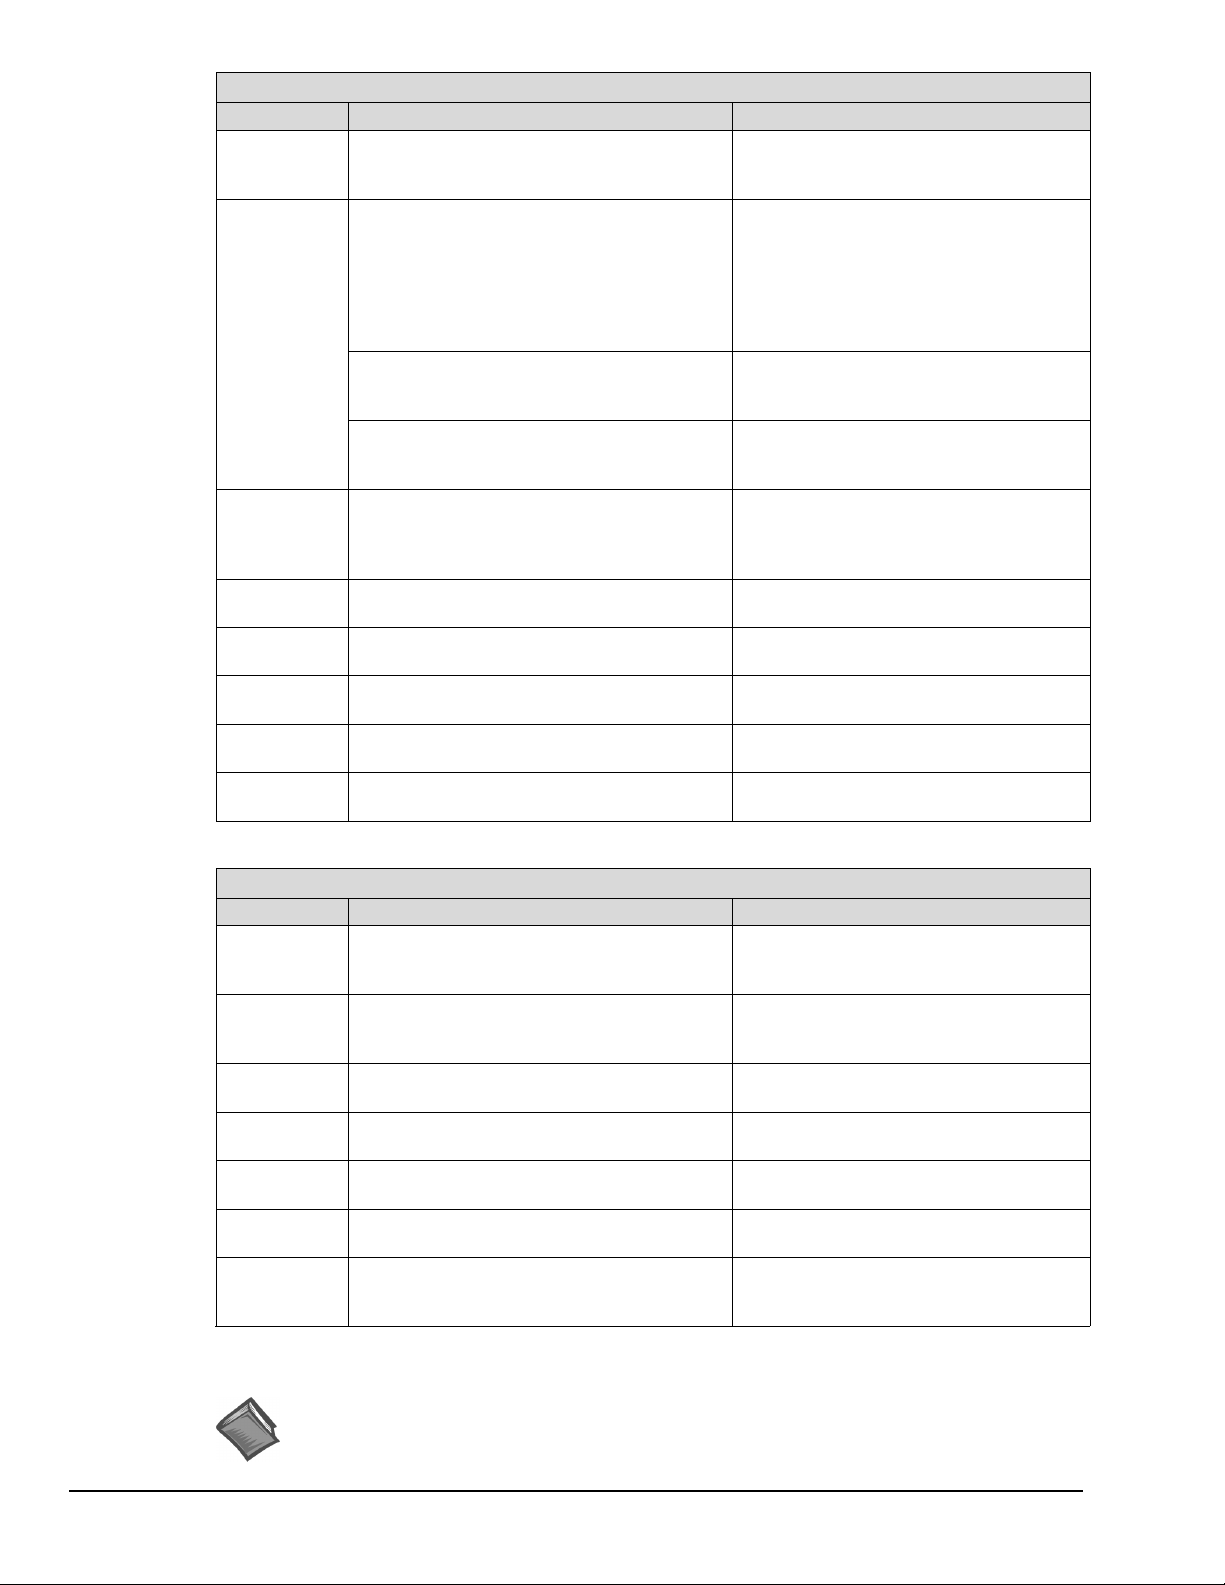
Display Menu Control
Keys Function Comments
D
D + C
(3 functions)
D + F
D + I
D + L
D + O
D + S
D + T
Opens the
Plot Display Characteristics Menu
Used to open the
Complex Type Display Menu
This option is only available when a function
with complex data is displayed. Menu
choices are: Magnitude, Phase, Real,
Imaginary, Magnitude + Phase,
Real + Imaginary, and Nyquist
Used to open the
Menu choices are: Data, Plot Window,
Screen.
Used to open the
Menu choices are: Single Cursor,
Band Cursor, or Cursor Off.
Opens the
Note that right-clicking on the plot will also
open this menu.
Opens the
Integration/Differentiation Menu
Opens the
Opens the
Opens the
Menu choices are RMS, Peak, Pk-Pk.
Opens the
Copy Menu
Cursor Menu
Display Functions Menu
Label / List Menu
Octave Menu
Scale Type Menu
Transfer Type Menu
.
.
.
.
.
.
.
.
.
Option: “Right-clicking” the mouse, while
the cursor is over the plot will also open
this menu.
Press D + C; release, then press <Enter>.
The Complex Type Display Menu will
open. Use the arrow keys to highlight the
type of display, then press <Enter>.
Press D + C; release, then use the arrow
key to select Copy. After selecting Copy,
press <Enter>.
Press D + C; release, then use the arrow
key to select Cursor. After selecting
Cursor press <Enter>.
Use arrow keys to highlight your selection,
then press <Enter>. In some cases you
can select the first letter of an option to
select it.
Use arrow keys to highlight your selection,
then press <Enter>.
Use arrow keys to highlight your selection,
then press <Enter>.
Use arrow keys to highlight your selection,
then press <Enter>.
Use arrow keys to highlight your selection,
then press <Enter>.
Use arrow keys to highlight your selection,
then press <Enter>.
Plot Display Controls
Keys Function Comments
Mouse-Click
Bottom
Border
Mouse-Click
Left Border
,
.
<
>
<shift>
: Also see the Display Menu Control Table.
Note
Change the
and grid.
Change the
and grid.
Moves the primary cursor left along the trace.
Moves the primary cursor right along the
trace.
Moves the secondary cursor left along the
trace.
Moves the secondary cursor right along the
trace.
Peak search. Press the <shift> key while depressing the
(Note)
X-axis
Y-axis
in regard to format, scale,
in regard to format, scale,
Right-click on the plot’s bottom border to
access a menu for changing the X-axis in
regard to Format, Scale, and Grid.
Right-click on the plot’s left border to
access a menu for changing the Y-axis in
regard to Format, Scale, and Grid.
When in Band Cursor mode, the comma
moves the primary cursor to the left.
When in Band Cursor mode, the period
moves the primary cursor to the right.
When in Band Cursor mode, the “<”
moves the secondary cursor to the left.
When in Band Cursor mode, the “>”
moves the secondary cursor to the right.
left mouse button to search for peaks
along the trace.
Reference Note: For more detailed information, which includes graphics, refer to
chapter 3, Interactive Features of the Plot Display Window.
Continued
A-2 Keyboard Controls
04-24-02
Appendix A
Page 36
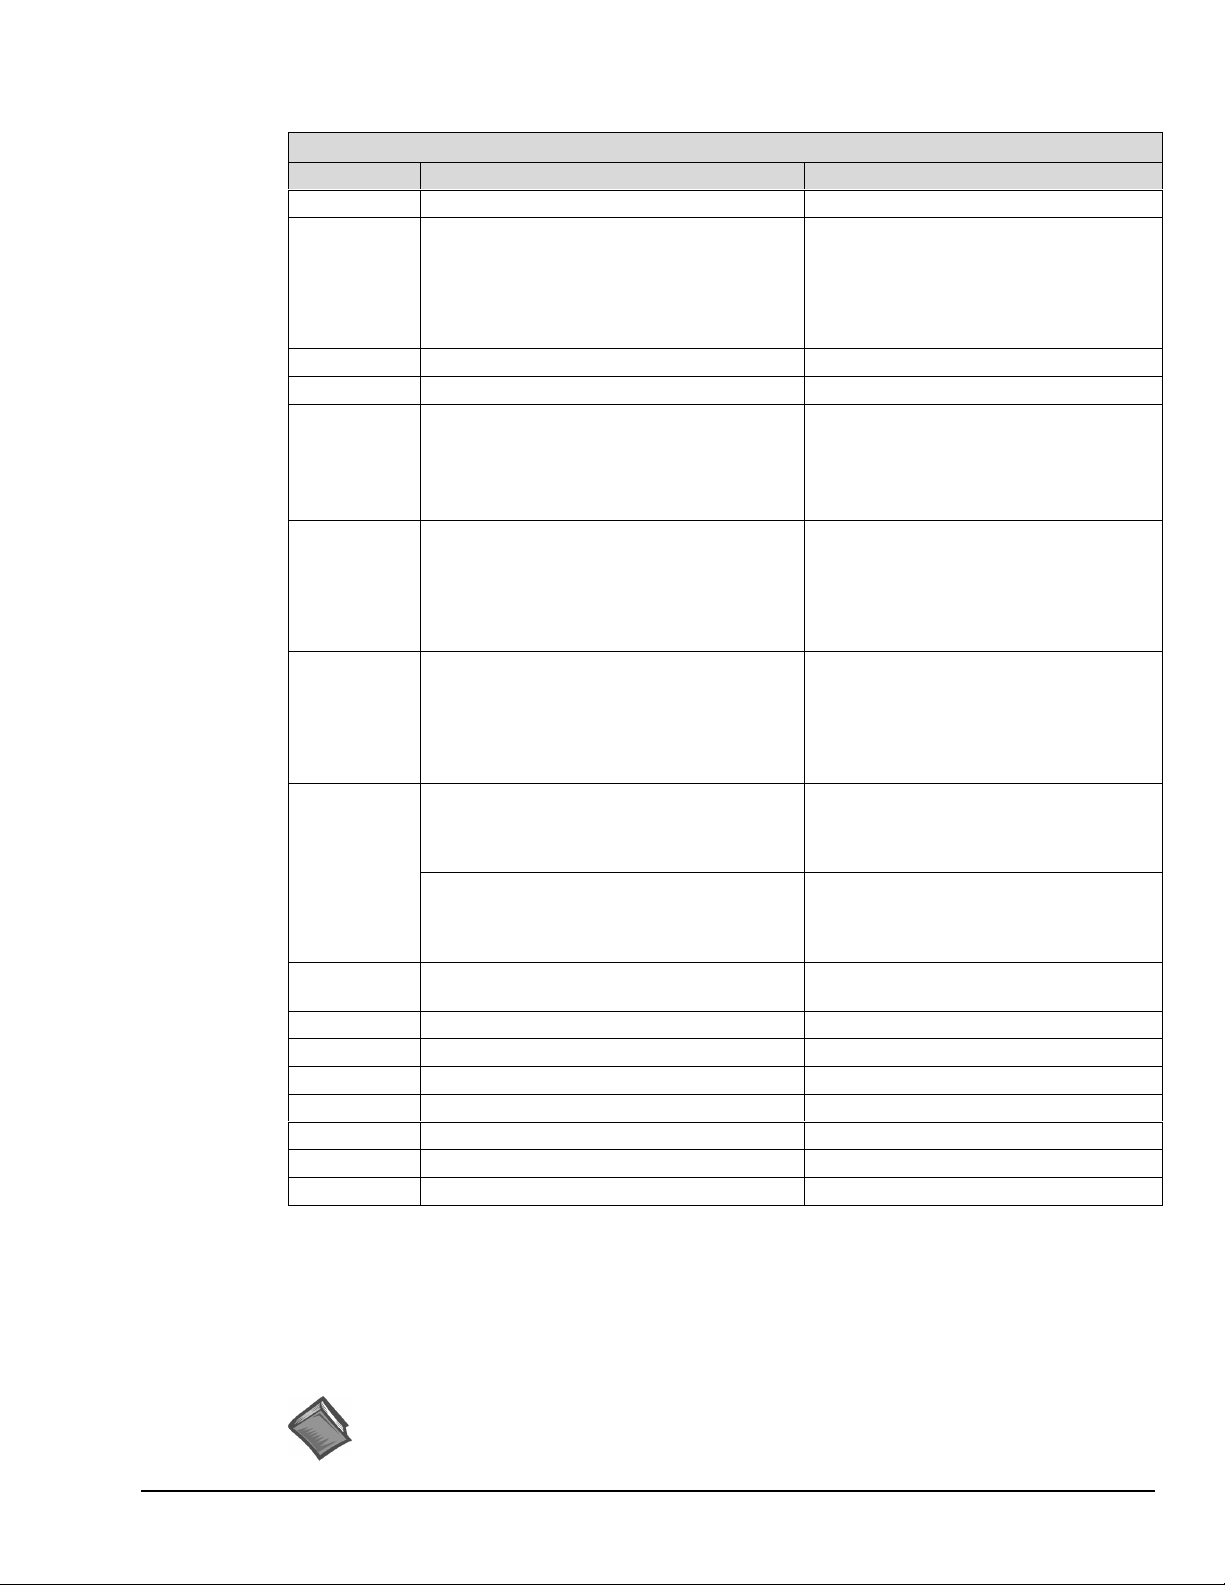
(continued)
Plot Display Control
(Note)
Keys Function Comments
A
Alt
Turns Auto-scale On.
Expands or contracts the
Y-Axis
.
(a) While holding down the <Alt> key,
place the cursor at the desired start point
of the Y-axis, (b) click the left mouse
button, (c) drag the mouse vertically until
the cursor is at the new end point of the
scale.
b
<shift> + b
C
Bank up.
Bank down.
Toggles the cursor On or Off; or cycles the
cursor options as follows (if Band Cursor is
selected): Adds a Cursor, Adds a second
When Band Cursor is selected, the “C”
key cycles through On (add a cursor), add
a second cursor, and Off.
Cursor, turns both cursors Off.
Ctrl
Expands or contracts the
X-Axis
.
(a) While holding down the <Ctrl> key,
place the cursor at the desired start point
of the X-axis, (b) click the left mouse
button, (c) drag the mouse horizontally
until the cursor is at the new end point of
the scale.
Ctrl + Alt
Simultaneously expands [or contracts]
both the X and
Y axes
.
(a) While holding down both the <Ctrl>
and <Alt> keys, place the cursor at the
desired start point on the plot, (b) click the
left mouse button, (c) drag the mouse
diagonally until the cursor is at the new
end point of the scale.
Zooms in or out. When you depress one of these keys,
F2 or Z
(2 functions)
while dragging with the right mouse
button depressed, you will zoom in or out,
according to the cursor-defined region.
Pan along the X-axis, Y-axis, or both. By depressing one of these keys, while
dragging with the left mouse button
depressed, you can pan in the direction of
the drag.
F3
Zoom in or out.
Use F3 with the left mouse button to zoom
in our out.
G
L
R
S
X
Y
Z
F2
or
: Also see the Display Menu Control Table.
Note
Turns Plot
Changes the
Start Recording
Start Scope Mode (Measurement)
Presents the
Presents the
Zooming or Panning.
Grid
On or Off.
Scale
to
X-Axis Menu
Y-Axis Menu
Linear
or to
Log
Toggles the grid to On or Off.
.
Toggles the scale to Linear or to Log.
See “F2.”
-----
-----
-----
-----
-----
-----
-----
Appendix A
Reference Note: For more detailed information, which includes graphics, refer to
chapter 3,
04-24-02
Interactive Features of the Plot Display Window
.
Keyboard Controls A-3
Page 37

A-4 Keyboard Controls
04-24-02
Appendix A
Page 38

eZ-Analyst Series
Software Reference
October 2002
p/n
1086-0922,
Rev
7.0
Page 39
OMEGAnetSM On-Line Service
http://www.omega.com
Servicing North America:
Internet e-mail
USA:
One Omega Drive, Box 4047
Stamford, CT 06907-0047
Tel: (203) 359-1660
FAX: (203) 359-7700
e-mail: [email protected]
Canada:
976 Berger
Laval (Quebec) H7L 5A1
Tel: (514) 856-6928
FAX: (514) 856-6886
e-mail: [email protected]
For immediate technical or application assistance:
USA and Canada:
Mexico and
Latin America:
Sales Service: 1-800-826-6342 / 1-800-TC-OMEGA
Customer Service: 1-800-622-2378 / 1-800-622-BEST
Engineering Service: 1-800-872-9436 / 1-800-USA-WHEN
TELEX: 996404 EASYLINK: 62968934 CABLE: OMEGA
Tel: (95) 800-TC-OMEGA
En Espanol: (95) 203-359-7803
SM
FAX: (95) 203-359-7807
e-mail: [email protected]
SM
SM
SM
Servicing Europe:
Benelux:
Czech Republic:
France:
Germany/Austria
United Kingdom:
It is the policy of OMEGA to comply with all worldwide safety and EMC/EMI regulations that
apply. OMEGA is constantly pursuing certification of its products to the European New Approach
Directives. OMEGA will add the CE mark to every appropriate device upon certification.
The information contained in this document is believed to be correct but OMEGA Engineering, Inc. accepts
no liability for any errors it contains, and reserves the right to alter specifications without notice.
WARNING: These products are not designed for use in, and should not be used for, patient-connected applications.
Postbus 8034, 1180 LA Amstelveen, The Netherlands
Tel: (31) 20 6418405
FAX: (31) 20 6434643
Toll Free in Benelux: 06 0993344
e-mail: [email protected]
ul. Rude armady 1868
733 01 Karvina-Hranice
Tel: 420 (69) 6311899
FAX: 420 (69) 6311114
e-mail:[email protected]
9, rue Denis Papin, 78190 Trappes
Tel: (33) 130-621-400
FAX: (33) 130-699-120
Toll Free in France: 0800-4-06342
e-mail: [email protected]
Daimlerstrasse 26, D-75392 Deckenpfronn, Germany
:
Tel: 49 (07056) 3017
FAX: 49 (07056) 8540
Toll Free in Germany: 0130 11 21 66
e-mail: [email protected]
25 Swannington Road,
Broughton Astley, Leicestershire,
LE9 6TU, England
Tel: 44 (1455) 285520
FAX: 44 (1455) 283912
P.O. Box 7, Omega Drive,
Irlam, Manchester,
M44 5EX, England
Tel: 44 (161) 777-6611
FAX: 44 (161) 777-6622
Toll Free in England: 0800-488-488
e-mail: [email protected]
Page 40

Note: As this document goes to press, eZ-Analyst can only be used with WaveBook or ZonicBook type
Manual Layout
This document is a reference manual for eZ-Analyst and its related series of “view” applications.
It is intended for use with the following:
The document is a reference to Menu options, associated Toolbar buttons, and resulting GUI screen
images. Where deemed beneficial, examples were placed to supplement the primary material. For
example, after describing the entry fields for "Double-Hammers," an example demonstrates a typical setup.
The document discusses eZ-Analyst in relation to both ZonicBook and WaveBook applications. It should
be noted that certain eZ-Analyst functions that apply to ZonicBook, do not apply to WaveBook, and visa
versa. These differences are pointed out in the document, when applicable.
The document is arranged as follows:
devices. Other devices, such as LogBook, DaqBook, and MultiScan, are, at present, not compatible
with eZ-Analyst. However, they can make use of the derived “view” applications (eZ-PostView,
eZ-TimeView, or eZ-FrequencyView.)
• eZ-Analyst
• eZ-FrequencyView
• eZ-TimeView
An Introduction to eZ-Analyst Series Software – compares eZ-PostView, eZ-TimeView, and
eZ-FrequencyView to the eZ-Analyst program and discusses how the manual relates to each.
Installing the “View” Applications provides instructions for installing eZ-PostView,
eZ-TimeView, and eZ-FrequencyView.
Ch 1 – Getting Started with eZ-Analyst briefly explains what eZ-Analyst is and provides instructions for
installing eZ-Analyst software for ZonicBook and WaveBook applications.
Ch 2 – Menus and Windows explains the Menus, software buttons, and windows that are part of
eZ-Analyst’s Graphical User Interface (GUI).
Ch 3 – Interactive Features of the Plot Display Window explains how to change plot display
characteristics, including display functions, by using the interactive features of the display window.
Appendix A – Keyboard Controls for eZ-Analyst identifies keys for controlling plot display, menus,
windows, and record/playback functions.
Appendix B – Using Banks and Function Files discusses simultaneous measurement of signal groups,
automatic and manual incrementing of banks, and skip factor.
Appendix C – Screen Images in “View” Applications provides screen images and text pertaining to the
Miscellaneous Tab, Window Colors and Preferences Windows. The material applies to one or more
of the derived “view applications,” but does not apply to eZ-Analyst.
Glossary
* Though this document can be used with eZ-PostView, we recommend that eZ-PostView users refer to the PDF document,
eZ-Analyst Series
Check the README.TXT file, if present, for information that may not have been
available at the time this manual went to press.
eZ-PostView User’s Guide (p/n 1086-0926). The reason is that most of the material in this document does not apply to
eZ-PostView. Refer to the table on page 0-2 in regard to application features that do apply.
09-20-02
iii
Page 41

iv
06-18-02
eZ-Analyst Series
Page 42

Table of Contents
Manual Layout …… iii
An Introduction to eZ-Analyst Series Software
Installing the “View” Applications
Ch 1 – Getting Started with eZ-Analyst
An Introduction to eZ-Analyst …… 1-1
ZonicBook, eZ-Analyst Install …… 1-5
WaveBook, eZ-Analyst Install …… 1-11
Ch 2 – Menus and Windows
Comparing the “View” Applications to eZ-Analyst …… 2-2
Task Menu
(eZ-Analyst Only)
File Menu …… 2-11
Edit Menu …… 2-13
Configuration Window …… 2-13
Analyzer Tab…… 2-15
Input/Output Channels Tab…… 2-21
Recording Setup Tab (eZ-Analyst Only)…… 2-25
Block Rejection Tab (eZ-Analyst Only) …… 2-29
FFT Setup Tab …… 2-31
Octave Setup Tab …… 2-35
Playback Setup Window …… 2-37
Display Preferences Window …… 2-39
Export Menu …… 2-41
Window Menu …… 2-43
Add Function View (FV) …… 2-43
Add Strip Chart …… 2-43
Delete Window …… 2-44
Channel Buttons …… 2-44
Modal Locations …… 2-44
Input Channels …… 2-45
Measurement Panel …… 2-46
Tachometer …… 2-47
Cascade …… 2-47
Tile Vertically …… 2-47
Tile Horizontally …… 2-48
Refresh Windows …… 2-48
…… 2-3
Ch 3 – Interactive Features of the Plot Display Window
How to Change Plot Display Characteristics ……3-1
How to Change “Focus” …… 3-1
How to Add or Remove Channels …… 3-2
How to Change Display Functions …… 3-3
Appendix A – Keyboard Controls for eZ-Analyst
Appendix B – Using Banks and Function Files
Appendix C – Screen Images in “View” Applications
Glossary
eZ-Analyst Series
09-20-02
v
Page 43

vi
06-18-02
eZ-Analyst Series
Page 44
An Introduction to eZ-Analyst Series Software
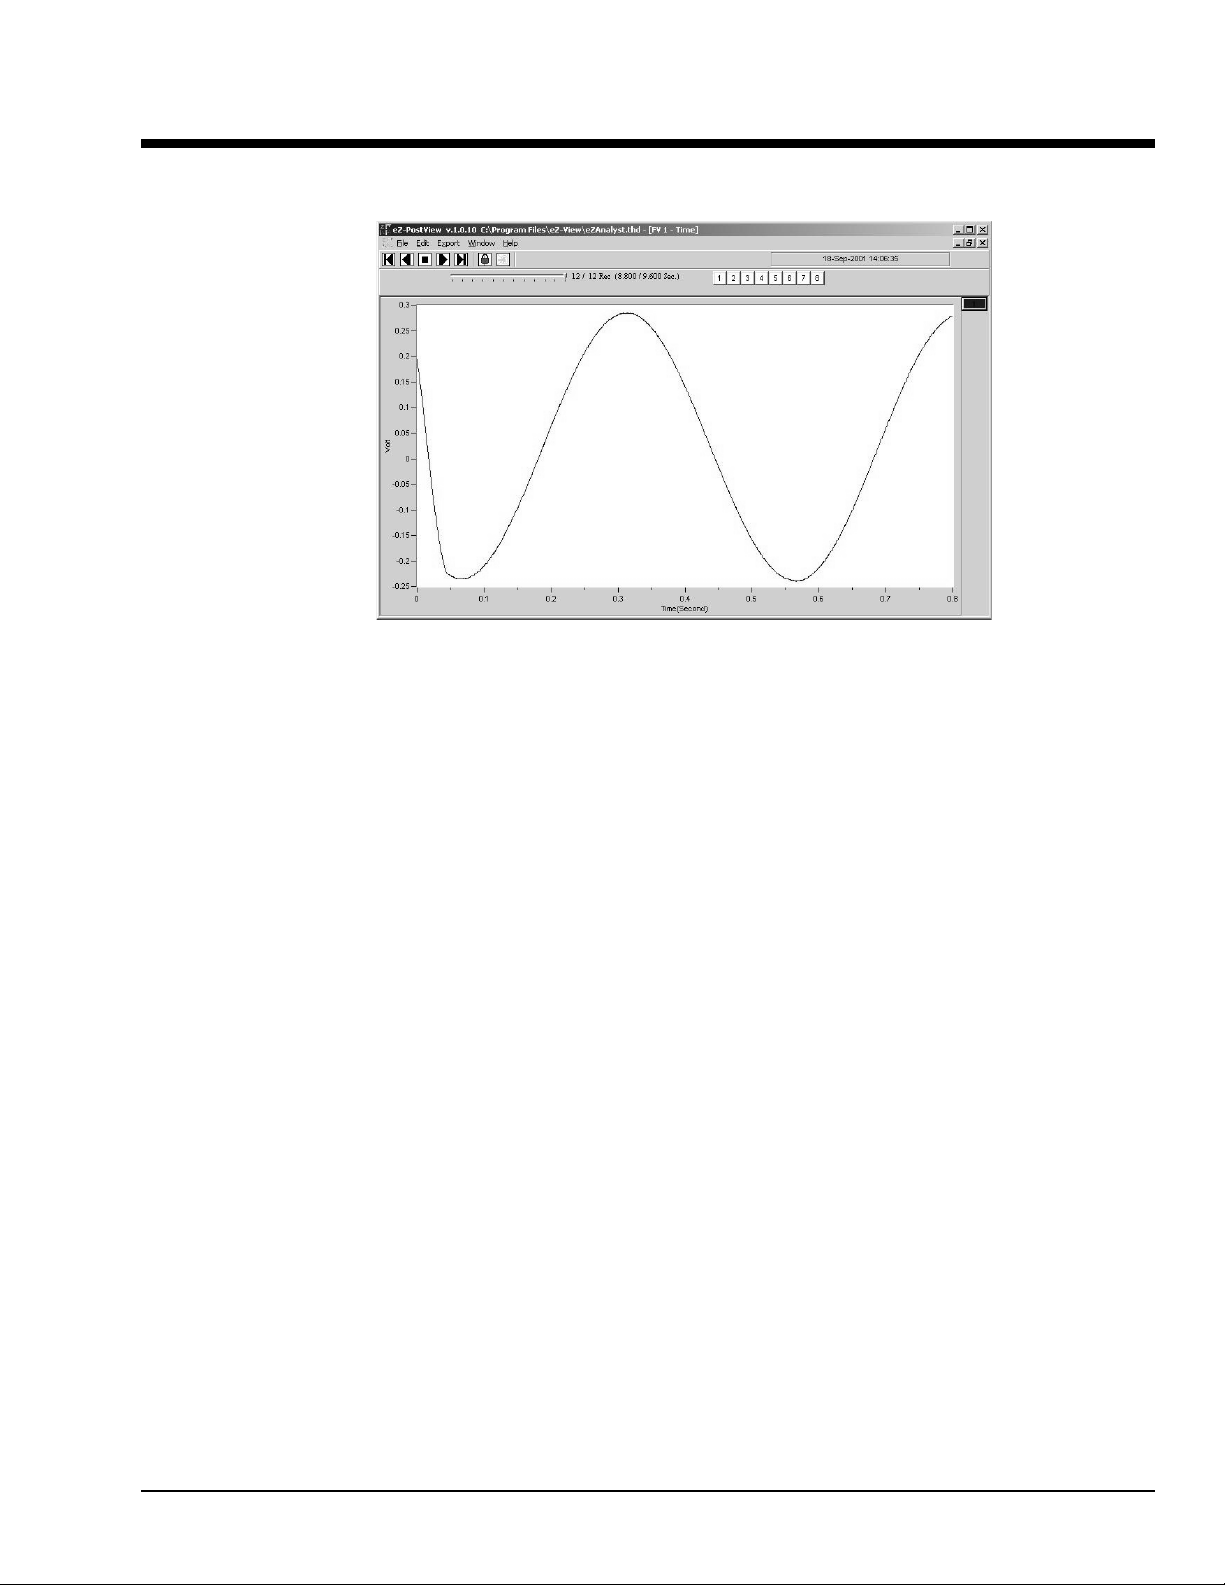
A Screen Capture from eZ-PostView
eZ-PostView, eZ-TimeView, and eZ-FrequencyView are part of the eZ-Analyst “series” software. Each is
a post-acquisition analysis application that was derived from the more powerful eZ-Analyst program. The
later is given an overview in chapter 1 and is detailed throughout the rest of the manual.
Features of the view applications vary from one application to another, and are listed in the comparative
table on the following page.
The “view” applications are integrated with the primary data acquisition software, including DaqView,
Personal DaqView, ChartView, LogView, and WaveView. The eZ-PostView application provides easy-touse post-acquisition analysis capability, and is included free of charge as a part of product support. The
other two view programs (eZ-TimeView and eZ-FrequencyView) have additional features and are available
for purchase. These more versatile “view” applications are initially accessed via an authorization-code.
Note that the code is only required to “unlock” the application for its first run and is not r e quired for
subsequent star tup s.
The following table compares the “view” applications to the eZ-Analyst program, from which they were
derived. At present, the eZ-Analyst program is only compatible with WaveBook and ZonicBook devices.
eZ-Analyst Series
05-29-02
Introduction 0-1
Page 45
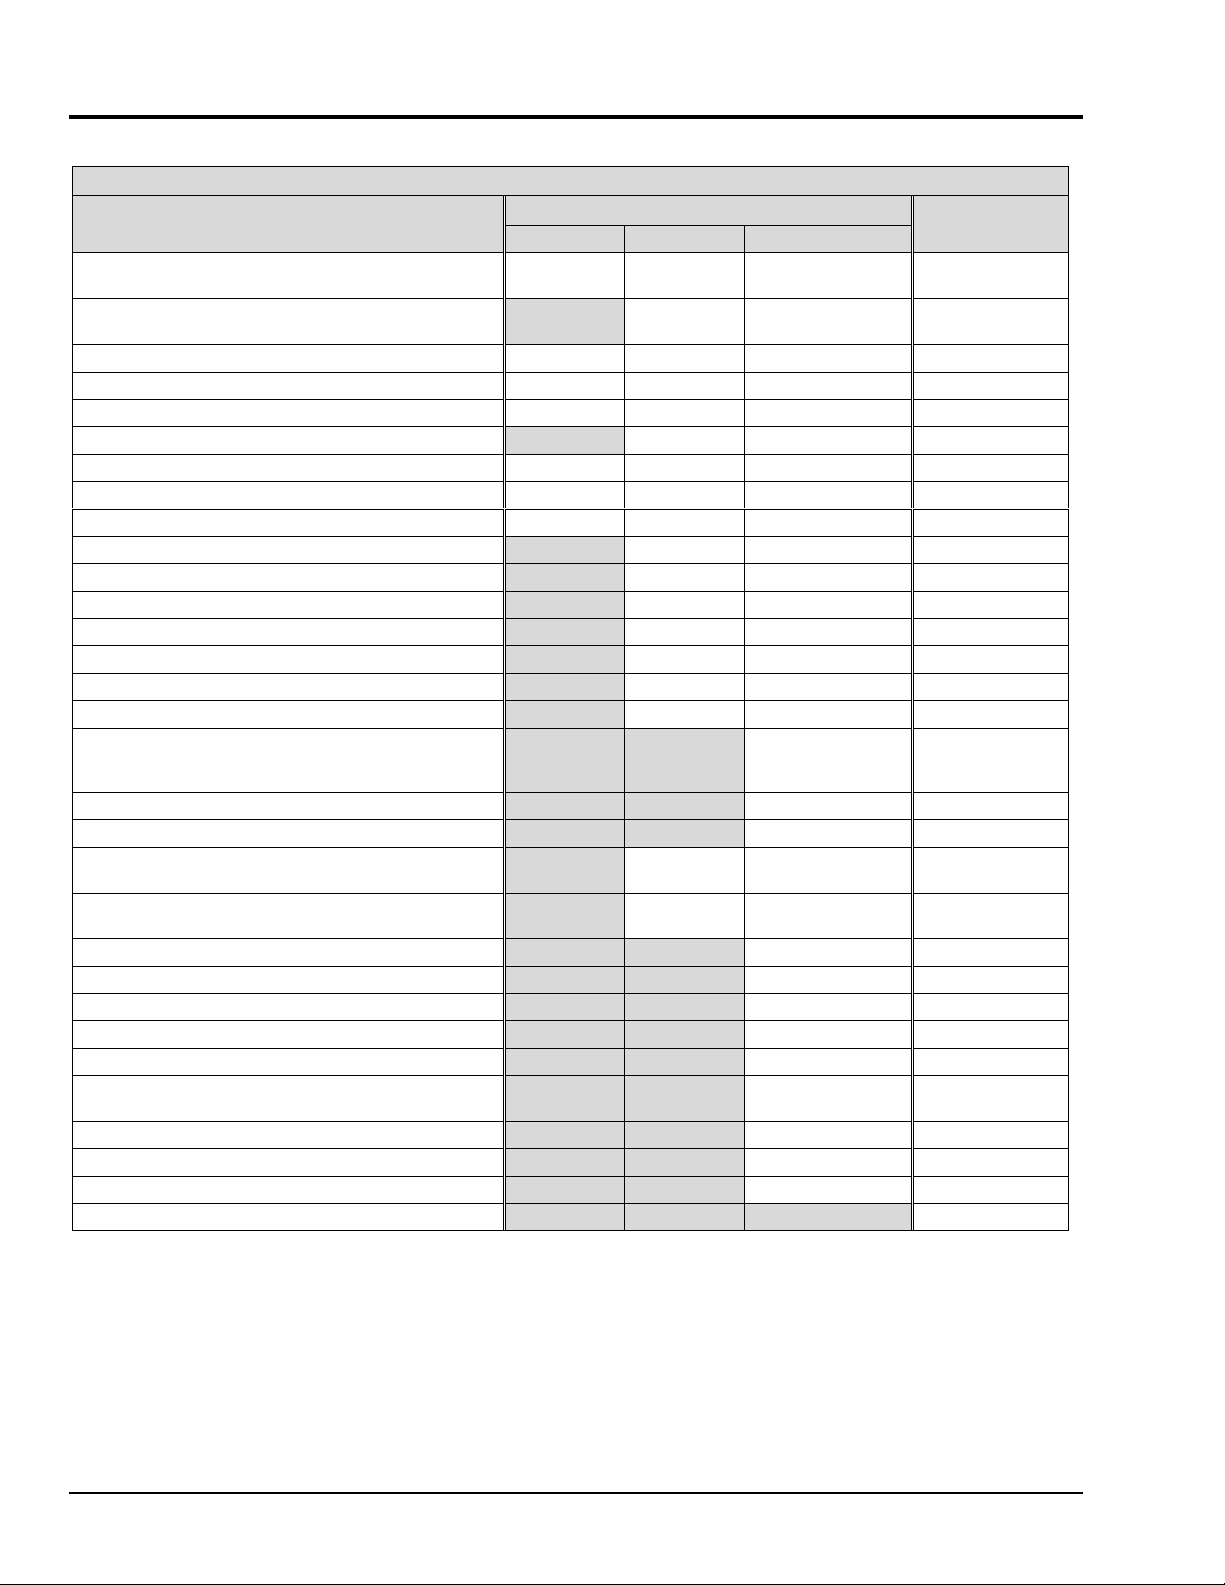
Comparing the “View” Applications to eZ-Analyst
eZ-Analyst Series Comparison Matrix
Feature
File Input Format Support for:
Personal DaqView, ChartView
File Export to: ME’Scope and SMS Modal, Microsoft
Excel, Binary Universal File, and ASCII text files.
Display Windows, number of 8 8 8 8
Channel Traces per Display Window 16 16 16 16
Automatic Data Scaling Yes Yes Yes Yes
Simulated Data Playback ----- Yes Yes Yes
Configurable Data Display for channels and trace colors Yes Yes Yes Yes
Multiple Tiling of display windows Yes Yes Yes Y es
Cursor Support - for both Single Cursor and Band Cursor Yes Yes Yes Yes
Data Strip Chart Display ----- Yes Yes Yes
Peak-to-Peak Calculations ----- Yes Yes Yes
Peak Searching, minimum and maximum ----- Yes Yes Yes
Mean Calculations ----- Yes Yes Yes
RMS Calculations ----- Yes Yes Yes
Zooming [of the data display] ----- Yes Yes Yes
Windowed Time Display Function ----- Yes Yes Yes
Cross Channel Support ----- ----- FFT, FRF, Cross,
Transfer Function Display Types ----- ----- Note 1 Note 1
Complex Function Display Types ----- ----- Note 2 Note 2
Scale Types ----- RMS, Peak,
Function Display Types ----- Time, Strip
Octave Types ----- ----- 1/3, Full 1/3, Full
Octave Weighting ----- ----- Linear, A, B, C Linear, A, B, C
Waterfall Plots ----- ----- Yes Yes
Integration/Differentiation (Single/ Double) ----- ----- Yes Yes
Response Channel FFT Windows ----- ----- Note 4 Note 4
Reference Channel FFT Windows ----- ----- Rectangular,
Low-Pass DC Noise Filtering ----- ----- Yes Yes
Spectral Strip Chart Display Synchronizati on ----- ----- Yes Yes
Octave Strip Chart Display Synchronization ----- ----- Yes Yes
Record and Save Data to Disk ----- ----- ----- Yes
DaqView, WaveView,
, UFF-58B.
Post-Acquisition Viewing Package
eZ-PostView eZ-TimeView eZ-FrequencyView
Yes Yes Yes Yes
----- Yes Yes Yes
Coherence,
Transfer Function
Peak-to-Peak
Chart
RMS, Peak,
Peak-to-Peak
Note 3 Note 3
Cosine Taper
eZ-Analyst
FFT, FRF, Cross,
Coherence,
Transfer Function
RMS, Peak,
Peak-to-Peak
Rectangular,
Cosine Taper
Notes: 1)
0-2, Introduction
eZ-Analyst
Compliance, Apparent Mass, Impedance, and Dynamic Stiffness.
eZ-Analyst
2)
Imaginary, Nyquist, Magnitude and Phase, and Real and Imaginary.
eZ-Analyst
3)
PSD (Power Spectral Function), Strip Chart.
eZ-Analyst
4)
Exponential, and Blackman-Harris.
and
eZ-FrequencyView
and
eZ-FrequencyView
and
eZ-FrequencyView
and
eZ-FrequencyView
- each offers the following
- each offers the following
- each offers the following
– each offers the following
05-29-02
Transfer Function Display Types
Complex Function Display Types
Function Display Types:
Response Channel FFT Windows
Spectrum, Auto-Spectrum,
: Inertance, Mobility,
: Magnitude, Phase, Real,
: Hanning, Flat Top,
eZ-Analyst Series
Page 46
The eZ-Analyst Series “view” programs make use of eZ-Analyst’s Playback Mode and, therefore, do not
P
O
require the presence of physical hardware. In fact, when eZ-Analyst is in Playback Mode, it is functioning
in the exact manner as eZ-FrequencyView. In other words, when in PlayBack Mode, eZ-Analyst is strictly
a post-acquisition display and analysis program.
Raw time-domain data, that has been recorded-to-disk, can be played back for analysis repeatedly. For
example, a raw signal could be played back several times, each time using a different filtering algorithm to
manipulate the original signal. Once the desired results have been achieved the new data can be exported in
a new format and to a different file. The original file can remain unchanged, and kept for future analysis.
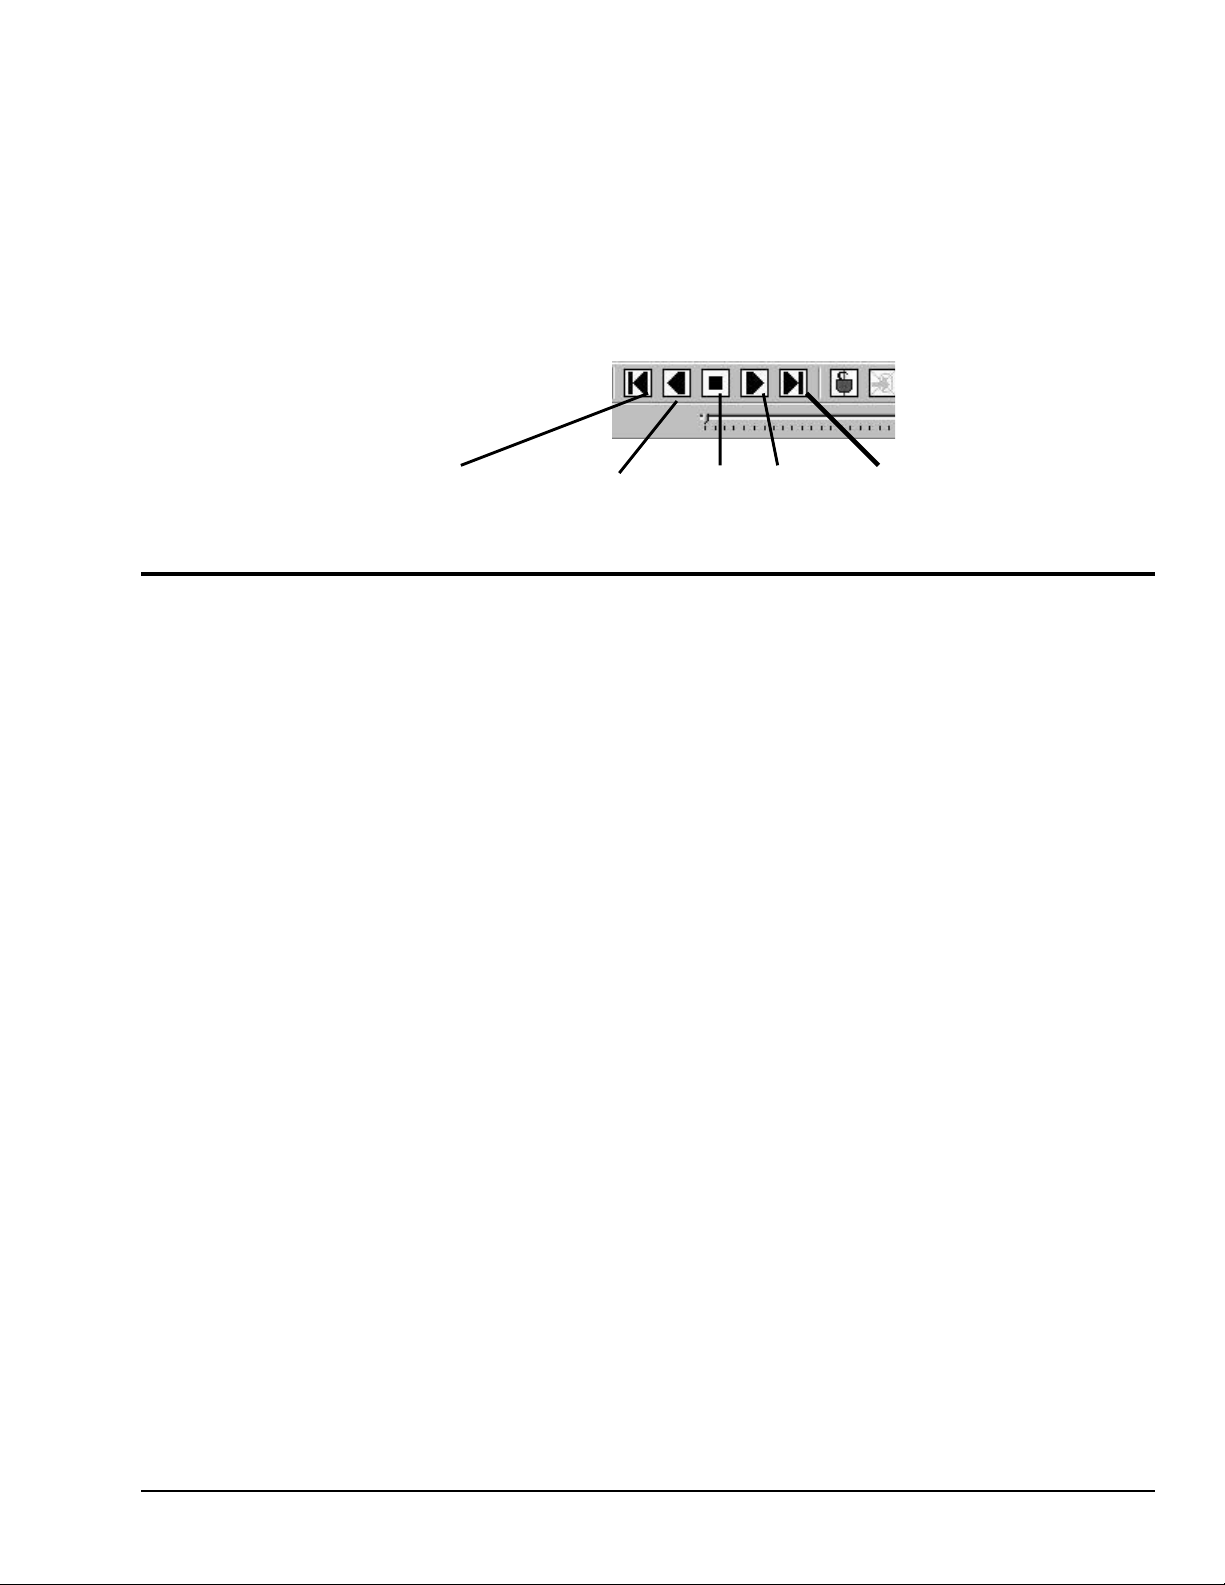
The “view” programs make use of a Play Task Bar, as depicted in the following figure.
lay Backward, Play Backward Stop Play Play Forward
ne Frame at a Time One Frame at a Time
Playback Task Bar
How the Rest of this Manual Relates to the “View” Applic ations
This manual was original written as a reference guide for users of eZ-Analyst prior to the development of the “view”
applications. However, since the post-acquisition “view” programs were derived directly from eZ-Analyst, it is easy
to apply the appropriate sections of the manual to your specific “view” application, i.e., to eZ-PostView, to
eZ-TimeView, or to eZ-FrequencyView. Of course, if you are making use of the actual eZ-Analyst program, simply
use the manual in its entirety.
eZ-FrequencyView
When you are using eZ-FrequencyView, you are essentially running eZ-Analyst in its Playback Mode. The table on
the page 2 indicates the applicable features. You can not record data from eZ-FrequencyView.
eZ-FrequencyView is supported by the primary data acquisition programs, for example, DaqView, LogView, and
WaveView. It can be accessed through the primary application’s View Data button, or accessed independently from
your program files directory (where you installed your software).
The first time you run eZ-FrequencyView, you will need to enter an authorization code. The code is supplied when
the package is purchased.
eZ-TimeView
When you are using eZ-TimeView, you are essentially running eZ-Analyst in its Playback Mode, minus several
analysis features that are available in eZ-FrequencyView and eZ-Analyst. For example, when using eZ-TimeView
there are no Transfer Function Display Types, Co mplex Function Display Types, or FFT Windows available.
However, the application does provide calculation options pertaining to peak-to-peak, mean, RMS, and does allow
for data zooming. Refer to the table on page 2 for a complete list of the applicable features. Note that you can not
record data from eZ-TimeView.
eZ-TimeView is supported by the primary data acquisition programs, for example, DaqView, LogView, and
WaveView. It can be accessed through the primary application’s View Data button, or accessed independently from
your program files directory (where you installed your software).
The first time you run eZ-TimeView, you will need to enter an authorization code. The code is supplied when the
package is purchased.
eZ-Analyst Series
05-29-02
Introduction 0-3
Page 47

eZ-PostView
eZ-PostView provides simple “time-domain” viewing. From this applicat ion you can display up to 8 time-domain
function windows and display up to 16 channel traces per window. Data is automatically scaled to optimize its fit in
the window. Window, channel trace, and cursor colors can be customized.
eZ-PostView is a free “view” program. The application has no Transfe r Function Disp lay Types, Complex Function
Display Types, or FFT Windows available. Refer to the table on page 2 for a complete list of the applicable
features. Note that you can not record data from eZ-PostView.
eZ-PostView is supported by the primary data acquisition programs, for example, DaqView, LogView, and
WaveView. It can be accessed through the primary application’s View Data button, or accessed independently from
your program files directory (where you installed your software).
You do not need to enter an authorization code to run eZ-PostView.
Reference Note:
Although this document can be used for eZ-PostView, a great deal of the material does not
apply, as can be seen from the table on page 2. If you are only making use of eZ-PostView
you may want to refer to the eZ-PostView User’s Guide, p/n 1086-0926. A PDF version of
that document is installed onto your hard-drive as a part of product support.
0-4, Introduction
05-29-02
eZ-Analyst Series
Page 48
Installing the “View” Applications
Reference Notes:
➣
If you purchased eZ-Analyst for use with a ZonicBook, skip this section and proceed to
chapter 1, Getting Started with eZ-Analyst.
➣
If you purchased eZ-Analyst for use with a WaveBook device, and will not be using
WaveView, skip this section and proceed to chapter 1, Getting Started with eZ-Analyst.
➣
If you will be using WaveView and desire post-data analysis capability, install one of the
three view applications as discussed in this section.
System Requirements …… 0-5
Software Installation …… 0-6
System Requirements
Before setting up the hardware or installing the software, verify that you have the following items.
• Data Acquisition System, for example,
WaveBook, DaqBook, Personal Daq, LogBook.
•
Power Supply with cord
• Data Acquisition CD
• Authorization Code for eZ-TimeView or eZ-FrequencyView, if applicable.
Both are options that can be purchased.
In addition, verify that your computer meets the following minimum requirements.
• Intel
•
• 100 MB Hard Disk space
•
•
Note that no authorization code is required to run eZ-PostView.
™
, Pentium 90 MHz or equivalent
64 MB Memory
Monitor: SVGA, 800 x 600 resolution
One of the following Microsoft
Windows 98
Windows Me
Windows NT
Windows 2000
Windows XP
Optional, but recommended:
EPP (Enhanced Parallel Port), or
ECP (Extended Capabilities Port)
If you purchased software, associated authorization codes will accompany your
installation CD. If this is the case, keep your codes in a safe place. You will need
to enter them once, during an actual run of the purchased software.
®
Windows Operating Systems:
eZ-Analyst Series
09-05-02
Installing “View” Applications 0-5
Page 49
Software Installation
Before installing a version of our data-acquisition software, remove all
previous versions of that software.
Reference Notes:
➣
Adobe Acrobat PDF versions of documents pertaining to your system hardware and
software are automatically installed onto your PC’s hard-drive as a part of product
support at the time of software installation. The default location is the Programs group,
which can be accessed via the Windows Desktop Start Menu.
➣
PDF versions of documents can be read directly from the data acquisition CD.
➣
After your software is installed you can setup your data acquisition device, e.g.,
WaveBook, DaqBook, LogBook, and connect it to the host computer. Instructions for
hardware setup are included in your device user’s manual, which is included on the CD.
When you first install software for your acquisition device, eZ-PostView will automatically be selected for
installation along with the primary acquisition software application. For example, when a WaveBook is selected,
both WaveView and eZ-PostView will show as pre-selected software options.
To install one of the three view applications …
1. Start Windows.
2. Close all running applications.
3. Insert the Data Acquisition CD into your CD-ROM drive and wait for the CD to auto-run.
If the CD does not start on its own:
(a) click the desktop’s <Start> button
(b) choose the Run command
(c) select the CD-ROM drive, then select the setup.exe file.
(d) click <OK>.
An Opening Screen appears.
4. Click the <ENTER SETUP> button.
5. On the hardware selection screen [which follows a licensing agreement], select your hardware from the
resulting drop-down list
6. On the resulting software options screen, select the software options that are applicable to your system.
If you purchased eZ-TimeView or eZ-FrequencyView, select that application, then de-select
eZ-PostView.
7. Click the <Install> button and follow the screen prompts.
You will be prompted to enter an Authorization Code.
If you purchased eZ-TimeView or eZ-FrequencyView enter the code for the
➣
associated application; then click the <Apply Code> button.
0-6 Installing “View” Applications
If you are installing eZ-PostView [which requires no code], simply click the
➣
<OK> button or, if you prefer, click the <Start 30 Day Trial> button to try out
the more powerful eZ-FrequencyView Application.
09-05-02
eZ-Analyst Series
Page 50
Authorization Dialog Box
Note: Entry of your Authorization Code is only required once. However, you can enter a new code
at a future date, for example, if you wanted to upgrade from eZ-PostView to eZ-FrequencyView.
To open the Authorization Dialog Box:
1. Open eZ-PostView. You can open eZ-PostView by clicking the <ViewData> button
in your primary data acquisition program, e.g. WaveView, DaqView, LogView, etc.
2. From eZ-PostView’s File Pull-Down menu, select Authorization (following figure).
The Authorization dialog box appears.
eZ-Analyst Series
To enter a code:
1. Type-in the code, as it appears on your Authorization Sheet.
2. Click the <Apply Code> button.
09-05-02
File Menu
Installing “View” Applications 0-7
Page 51

0-8 Installing “View” Applications
09-05-02
eZ-Analyst Series
Page 52
Getting Started with eZ-Analyst 1
An Introduction to eZ-Analyst …… 1-1
ZonicBook, eZ-Analyst Install …… 1-5
WaveBook, eZ-Analyst Install …… 1-11
At present, eZ-Analyst can only be installed as software support for ZonicBook and
WaveBook devices. If your system is making use of another type of data acquisition device,
e.g., DaqBook, DaqBoard, or LogBook, you can not install eZ-Analyst, but can install one of
its related “view” programs. To install eZ-PostView, eZ-TimeView, or eZ-FrequencyView,
refer to the section, Installing the “View” Applications, which begins on page 0-5.
Reference Note:
This chapter applies to eZ-Analyst. If you are using a “view” application, and not eZ-Analyst,
be sure to read the two previous sections, An Introduction to eZ-Analyst Series Software and
Installing the “View” Applications. If you are not using eZ-Analyst, you should skip this chapter
and continue with chapter 2.
An Introduction to eZ-Analyst
Averaging
Status
Plot for Channel 3
Plot for Channel 4
Playback / Record
Status
Acquisition Status
Date/Time
Channel
Identifiers
eZ-Analyst
Recording while in Measurement Mode
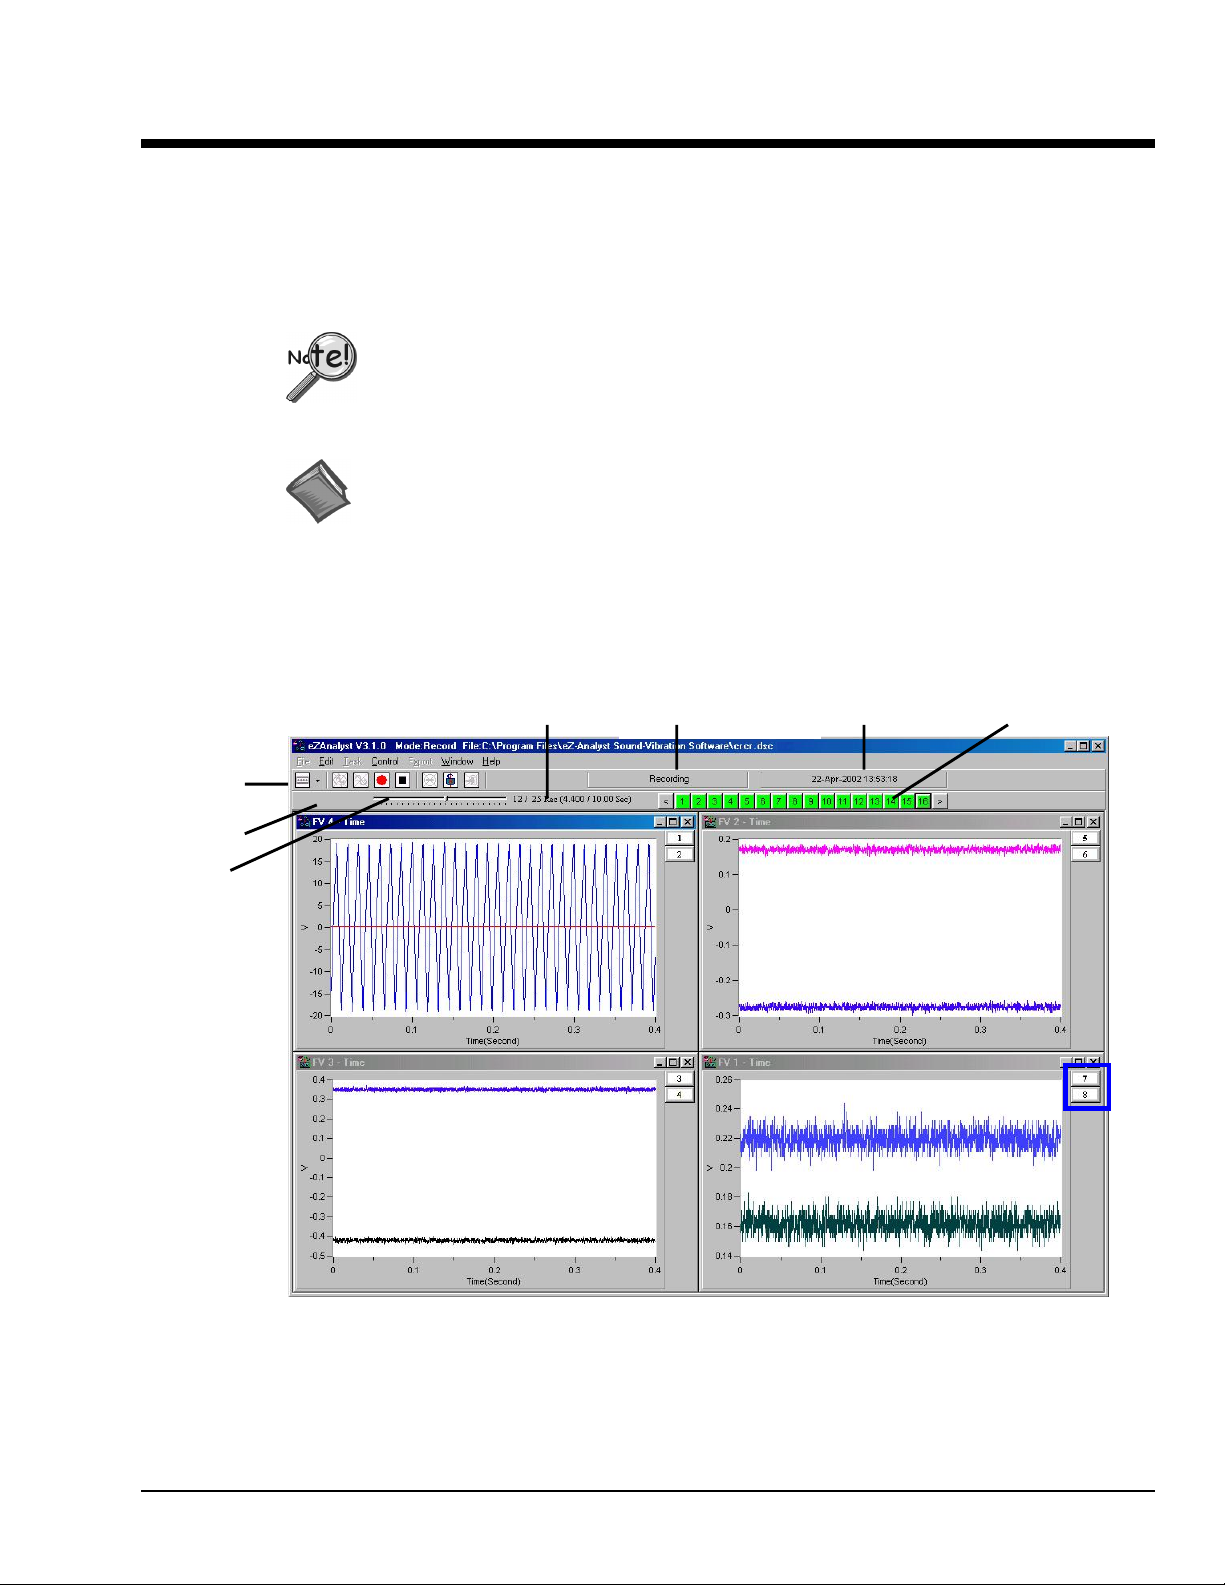
eZ-Analyst is a graphical analysis application that can be used to collect, analyze, record, and play back
recorded data. Using ZonicBook or WaveBook hardware systems, ez-Analyst can collect and display
multiple channels of data in real-time. The graphical displays can consist not only of the raw time-domain
data, but also plots of frequency domain data. For example, real time FFT (Fast Fourier Transform) plots.
06-18-02
Getting Started 1-1
Page 53
Data that is recorded to disk-file is in the raw time domain and can be played back for additional analysis
time and time again. For example, a raw signal can be played back over-and-over using different filtering
algorithms to manipulate the signal. Once the desired results have been achieved, the new data can be
exported to a different file and format, while preserving the original file. In addition, the playback
capability does not require the presence of a ZonicBook or WaveBook system.
From the Task Menu, the user selects either the Measurement Mode or the Playback mode. The Task Tool
Bar automatically changes to accommodate the selected mode.
Measurement Mode
The Measurement Mode is an active data-collecting mode, which, for that reason, requires the use of data
acquisition hardware. The Measurement Mode can only be selected if a ZonicBook or WaveBook is
available; otherwise, eZ-Analyst will run in the Playback Mode only.
The Measurement Mode can run in one of three sub-modes, Scope-Continuous, Scope-Single, or Record.
The first two sub-modes are simple displays that do not log data and are most useful for signal validation
and checkout. The Record mode is the same as the two Scope modes, but has the added feature of logging
data-to-disk based on additional start and stop criteria.
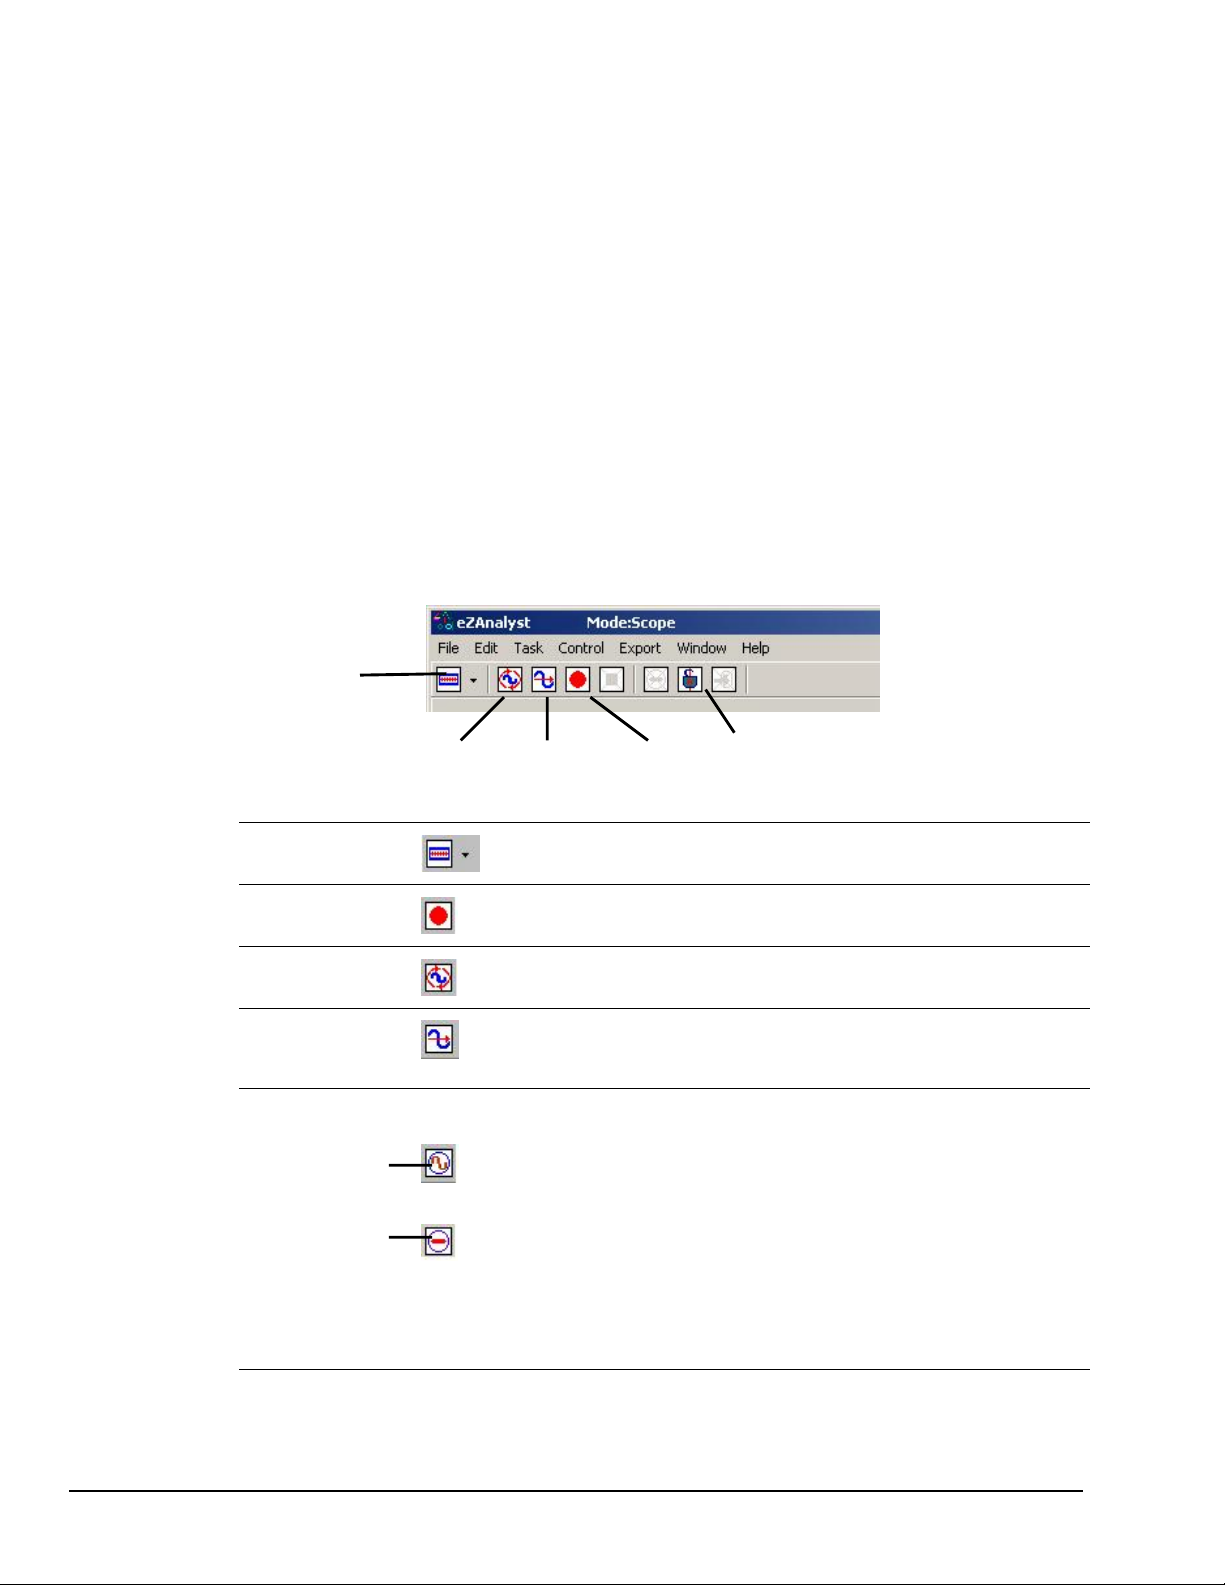
In addition to being selected from the Task Menu, the Measurement Mode can be selected from the Task
Tool Bar by clicking the <Change Task Mode> button while in the Playback Mode. Clicking this button
from Measurement Mode will change the task mode tool bar to Playback.
Change
Task Mode
Scope-Continuous Scope-Single Record Cursor Lock
Measurement Mode Task Bar
ote that grayed-out buttons indicate that the associated function is not available due to a prerequisite not being met.
N
Change Task Mode
Record
Scope-Continuous
Scope-Single
Signal Generator
Indicates that
the Generator
is turned ON
Indicates that
the Generator
is turned OFF
Changes the task from Measurement Mode to Playback Mode.
The Task Bar buttons will change accordingly.
Starts recording data-to-disk. Note that a ZonicBook or WaveBook must be used
to acquire data.
Starts a continuous-time acquisition in Scope mode. This mode does not record
data to disk. Note that a ZonicBook or WaveBook must be used to acquire data.
Starts a single-time run data acquisition in the scope mode. This mode does not
record data to disk. Note that a ZonicBook or WaveBook must be used to
acquire data.
The Signal Generator button toggles between two images and is only active
when hardware is present.
The sign wave button indicates that the generator is ON. Clicking on it will turn
the generator OFF and the button image will change to a circled red line,
indicating that the generator is OFF.
Clicking the button, while the “Off Status” image is present, will turn the Signal
Generator back ON, and will change the button to show the sign wave image.
Note: For WaveBook applications you must set the applicable output channel
(that is to generate the signal) to “Active.” See, Output Channel Setup Tab,
WaveBook Applications, page 2-24.
1-2, eZ-Analyst
09-05-02
Getting Started
Page 54
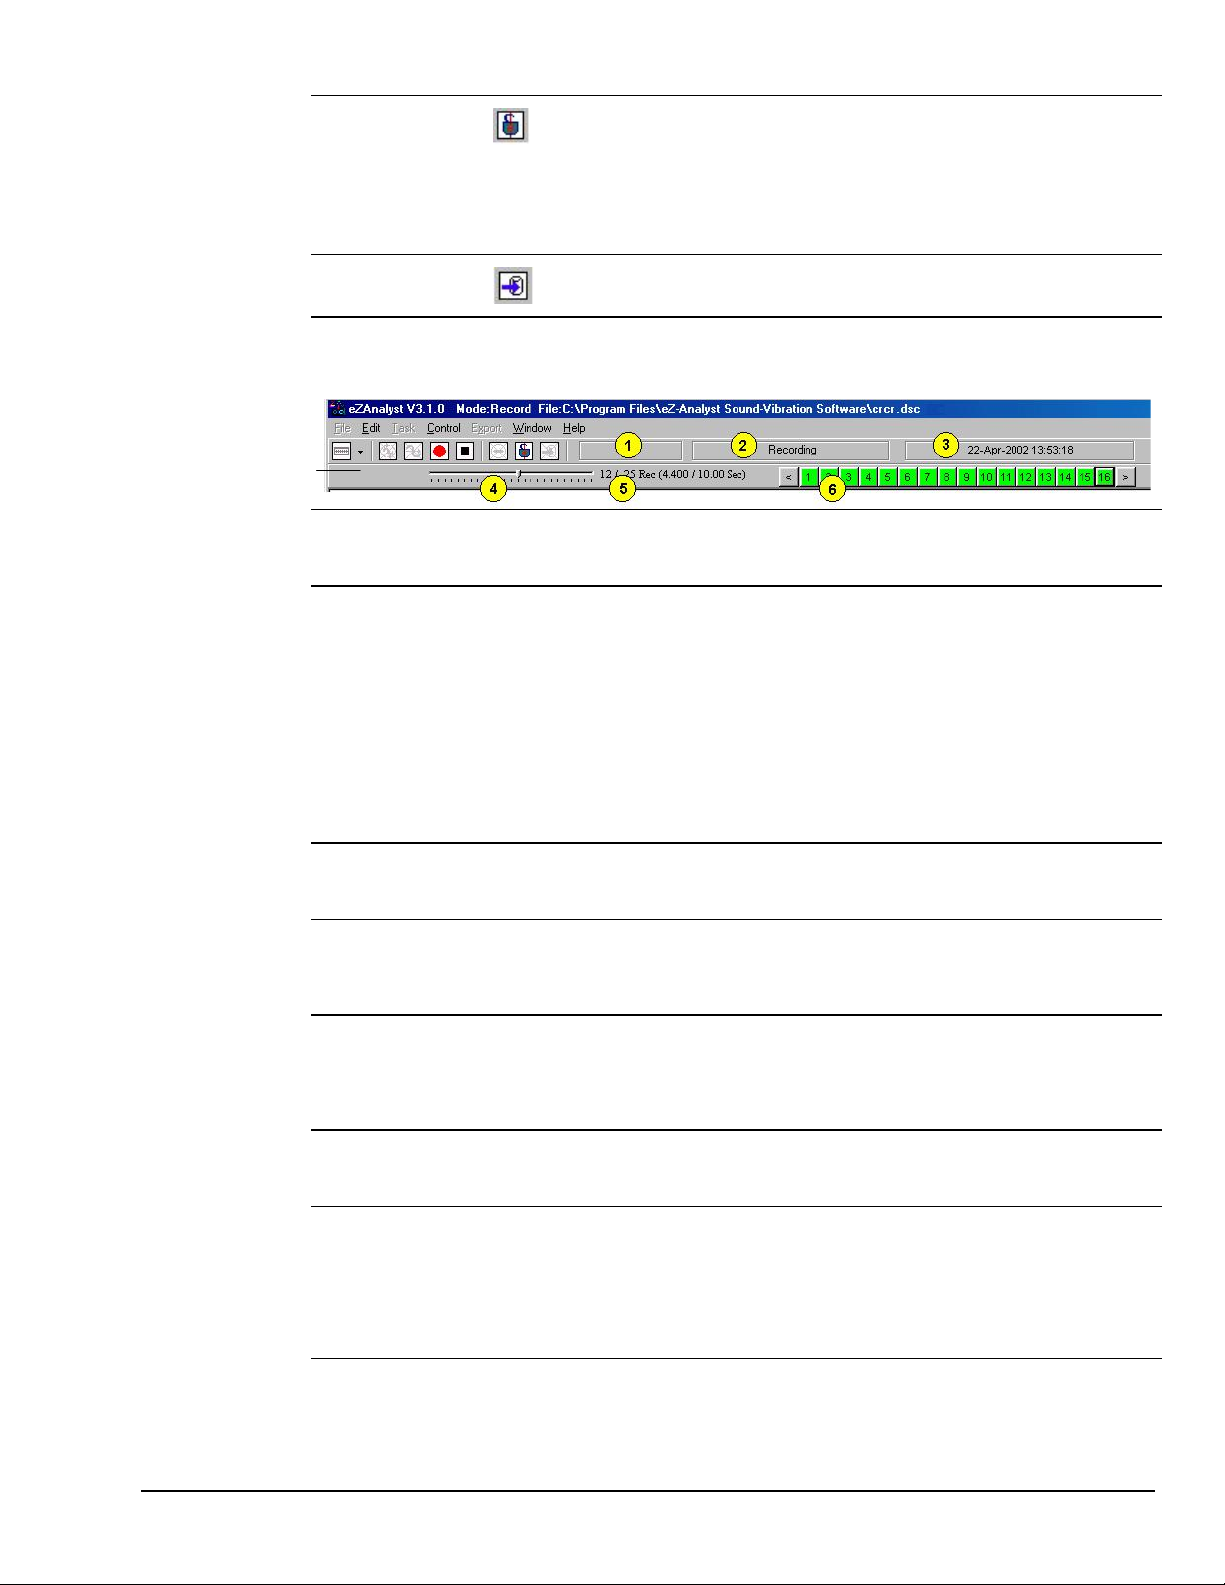
Cursor Lock
An active cursor lock button will have the image of an opened or locked padlock.
When the padlock is locked (closed), cursors in multiple windows will be
synchronized and locked, providing that the windows are of the same time
domain, frequency domain, or have the same octave band data.
An opened padlock image indicates that cursors in multiple windows have
independent cursor movement, i.e., they are unsynchronized.
Export
Regions of the Upper Main Window
Averaging Status
Status
1
2
Message
Acquisition
Status
A message regarding the status, if applicable, will be displayed in this area. Examples of
possible messages are: Double Hammer Rejected, Overload Rejected, Reject (Manual
Reject Mode), and GAP.
Indicates the status of the acquisition.
Waiting Trigger indicates that a trigger has not been recognized since the Acquire button
Triggered indicates eZ-Analyst is capturing and processing data based on the setup
Acquiring indicates that data is being acquired, but is not being recorded to disk.
Recording indicates that data is being recorded-to-disk, as it is being acquired.
Completed indicates eZ-Analyst has finished processing the frame of data.
This button exports data, if export conditions are set. For details, see the section,
Export Menu> Save Export Function Data, in chapter 2.
was clicked.
conditions.
The “Averages Count” increments by 1 at this time.
3
4
5
6
Date/Time
Slider Bar
Playback /
Recording
Status
Averaging
Status
Channels
Provides time in the following format: Day-Month-Year, Hour: Minutes: Seconds.
When in Record Mode the current time is displayed.
When in Playback Mode the measured time is displayed.
The sliding bar indicates the relative location of the displayed data. The record number and
the number of records in the file are listed to the right. The slider can be used to quickly
locate a specific record. Note that both the Record and the Playback mode make use of the
slider bar.
Displays the current record and the total number of records to be collected. Time equivalents
are included in parenthesis
th
Example, 12/25 means that the record currently displayed is the 12
record, out of a total of
25 records.
This field shows when the Averaging Mode is used, during the Scope Mode or the Playback
Mode. A display of 2/5 would indicate that 2 averages have been performed out of a total of
5 averages to be performed.
Each numbered box represents a channel. Drag a channel [channel-box] to the plot area to
have its data displayed. That channel’s data is plotted in a distinct color and a color-coded
channel button is displayed to the right of the plot.
Reference channels are bold and italic. The underlined channel is the current reference
channel. Use the right mouse button to select current reference channel. Reference
channels are specified in the Configuration accessed via the Edit Menu.
eZ-Analyst
09-05-02
Getting Started 1-3
Page 55
Playback Mode
The Playback Mode does not require the presence of physical hardware. When in Playback, eZ-Analyst is
strictly a post-acquisition display and analysis program. Raw time-domain data, that has been recorded-todisk, can be played back for analysis repeatedly. For example, a raw signal could be played back several
times, each time using a different filtering algorithm to manipulate the original signal. Once the desired
results have been achieved the new data can be exported in a new format and to a different file. The
original file can remain unchanged, and kept for future analysis.
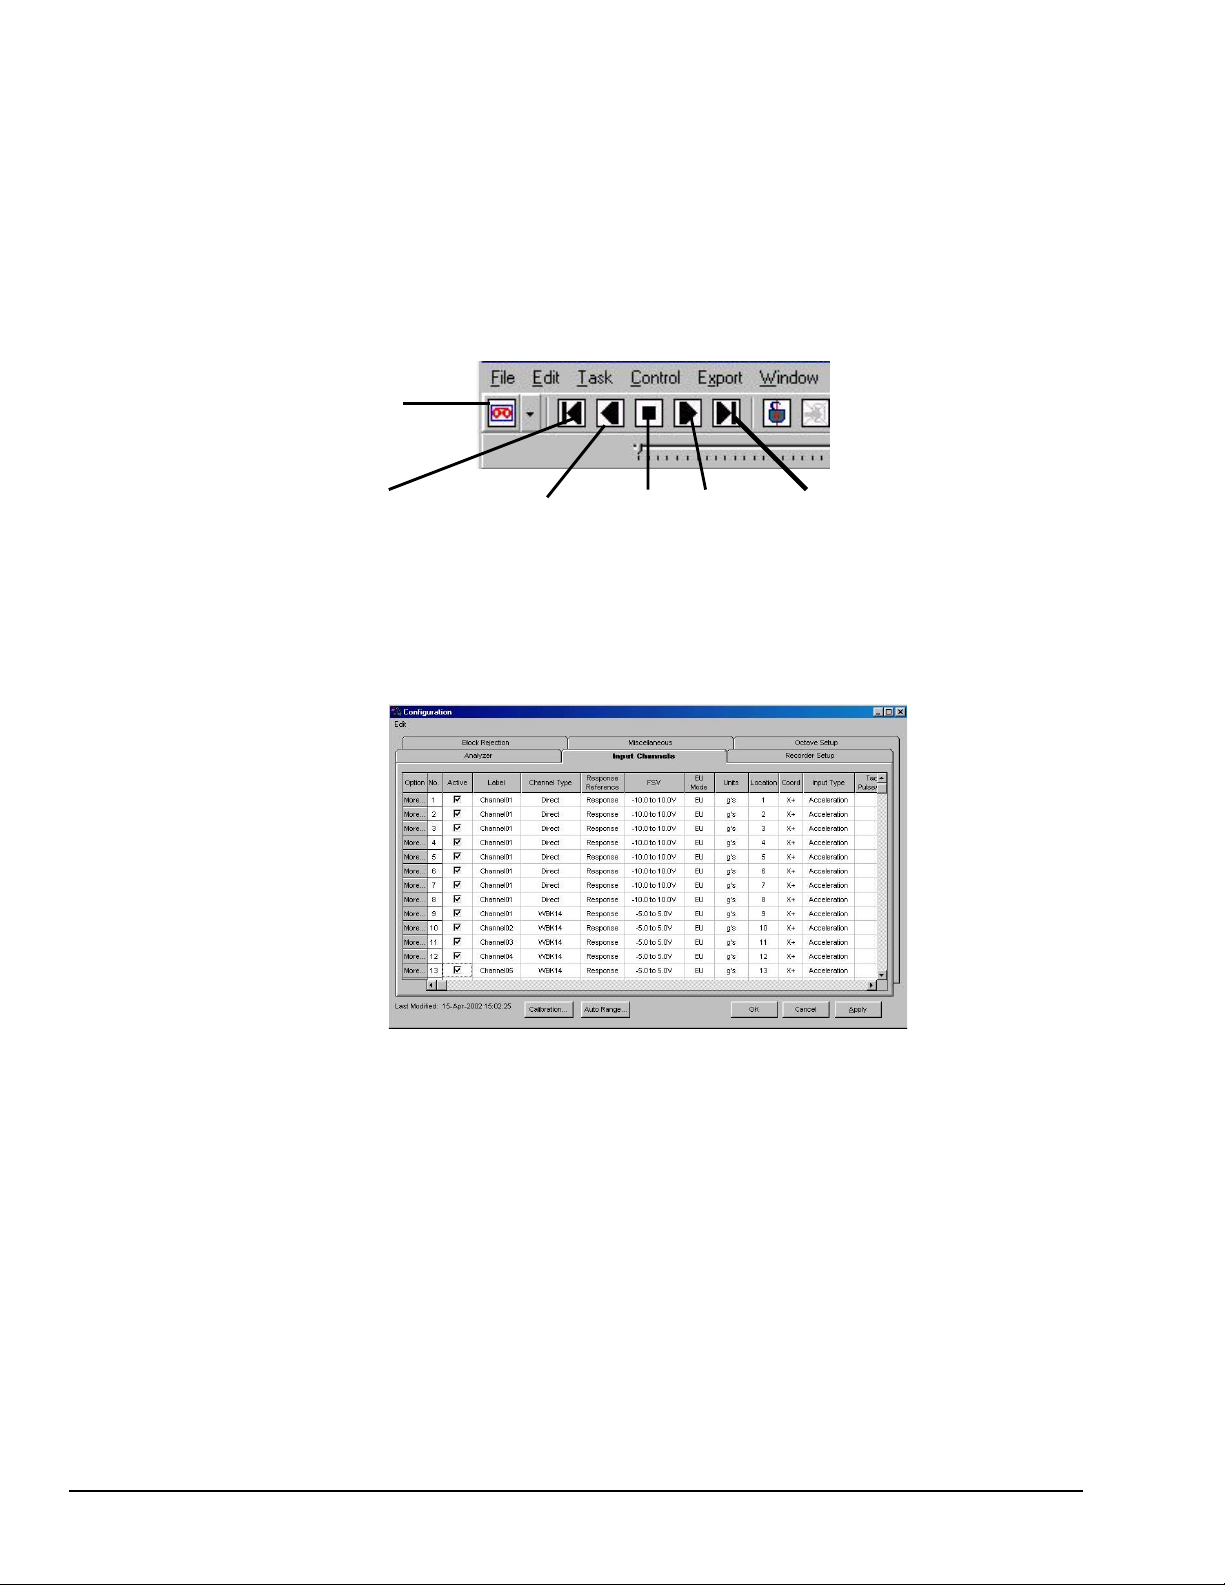
To activate the Playback Mode, select Playback/Review on the Task Menu. An option is to click the
<Change Task Mode> button (the first button in the tool bar) while in the Measurement Mode. Also, note
that when a WaveBook or ZonicBook is not available, eZ-Analyst will automatically enter the Playback
mode and will display the data that was most recently recorded to disk.
Change
Task Mode
Play Backward, Play Backward Stop Play Play Forward
One Frame at a Time One Frame at a Time
A Word About Configuration
Playback Mode Task Bar
1-4, eZ-Analyst
Configuring Input Channels
eZ-Analyst makes use of various Windows and menus for the purpose of configuration. Chapter 2,
Menus and Windows, is the heart of this document and should be referred to in regard to the various
configuration aspects.
09-05-02
Getting Started
Page 56
ZonicBook, eZ-Analyst Install
Introduction…… 1-5
System Requirements …… 1-6
Software Installation for Windows 98/Me/2000/XP/NT …… 1-6
A Special Note for Windows NT Users …… 1-8
Hardware Setup and DSP-Card Installation…… 1-9
Verifying DSP-Card Installation …… 1-9
Introduction
ZonicBook 4, 8, and 16-channel data acquisition modules are built to take advantage of PCs running under
Windows operating systems.
Inside each ZonicBook is an analog to digital converter with anti-aliasing filters for each channel.
Synchronous sampling of all channels ensures accurate phase relationships and the correlation of data.
The interface between the ZonicBook and the host PC is a type III PCMCIA card, which we will refer to as
a “DSP Card” (Digital Signal Processing Card). A proprietary chip set on the card provides the digital
signal processing of both time history and Fast Fourier Transform (FFT) analysis data. A four-megabyte
buffer is used to ensure gap-less data, independent of available processor memory.
Machine conditions and analysis solutions can be shared instantaneously with associates, providing that
ZonicBook’s host PC is connected to an Ethernet LAN, file server, internet, or intranet.
The ZonicBook is operated via Graphical User Interface (GUI). Prior to using a ZonicBook system, it is
essential that:
Note: This section
does not apply to the
“View” applications.
• the DSP program has been loaded into the DSP Card
•
the ZonicBook is initialized
• system communications are working properly
This document discusses the installation of eZ-Analyst software. Be sure to install the
software prior to performing the hardware installation. In regard to hardware
installation, refer to your ZonicBook User’s Manual, p/n 1086-0901.
Reference Note:
Adobe Acrobat PDF versions of documents pertaining to ZonicBook are automatically
installed onto your PC’s hard-drive as a part of product support at the time of software
installation. The default location is the Program Files directory, which can be accessed via
the Windows Desktop Start Menu.
eZ-Analyst
09-05-02
Getting Started, ZonicBook 1-5
Page 57
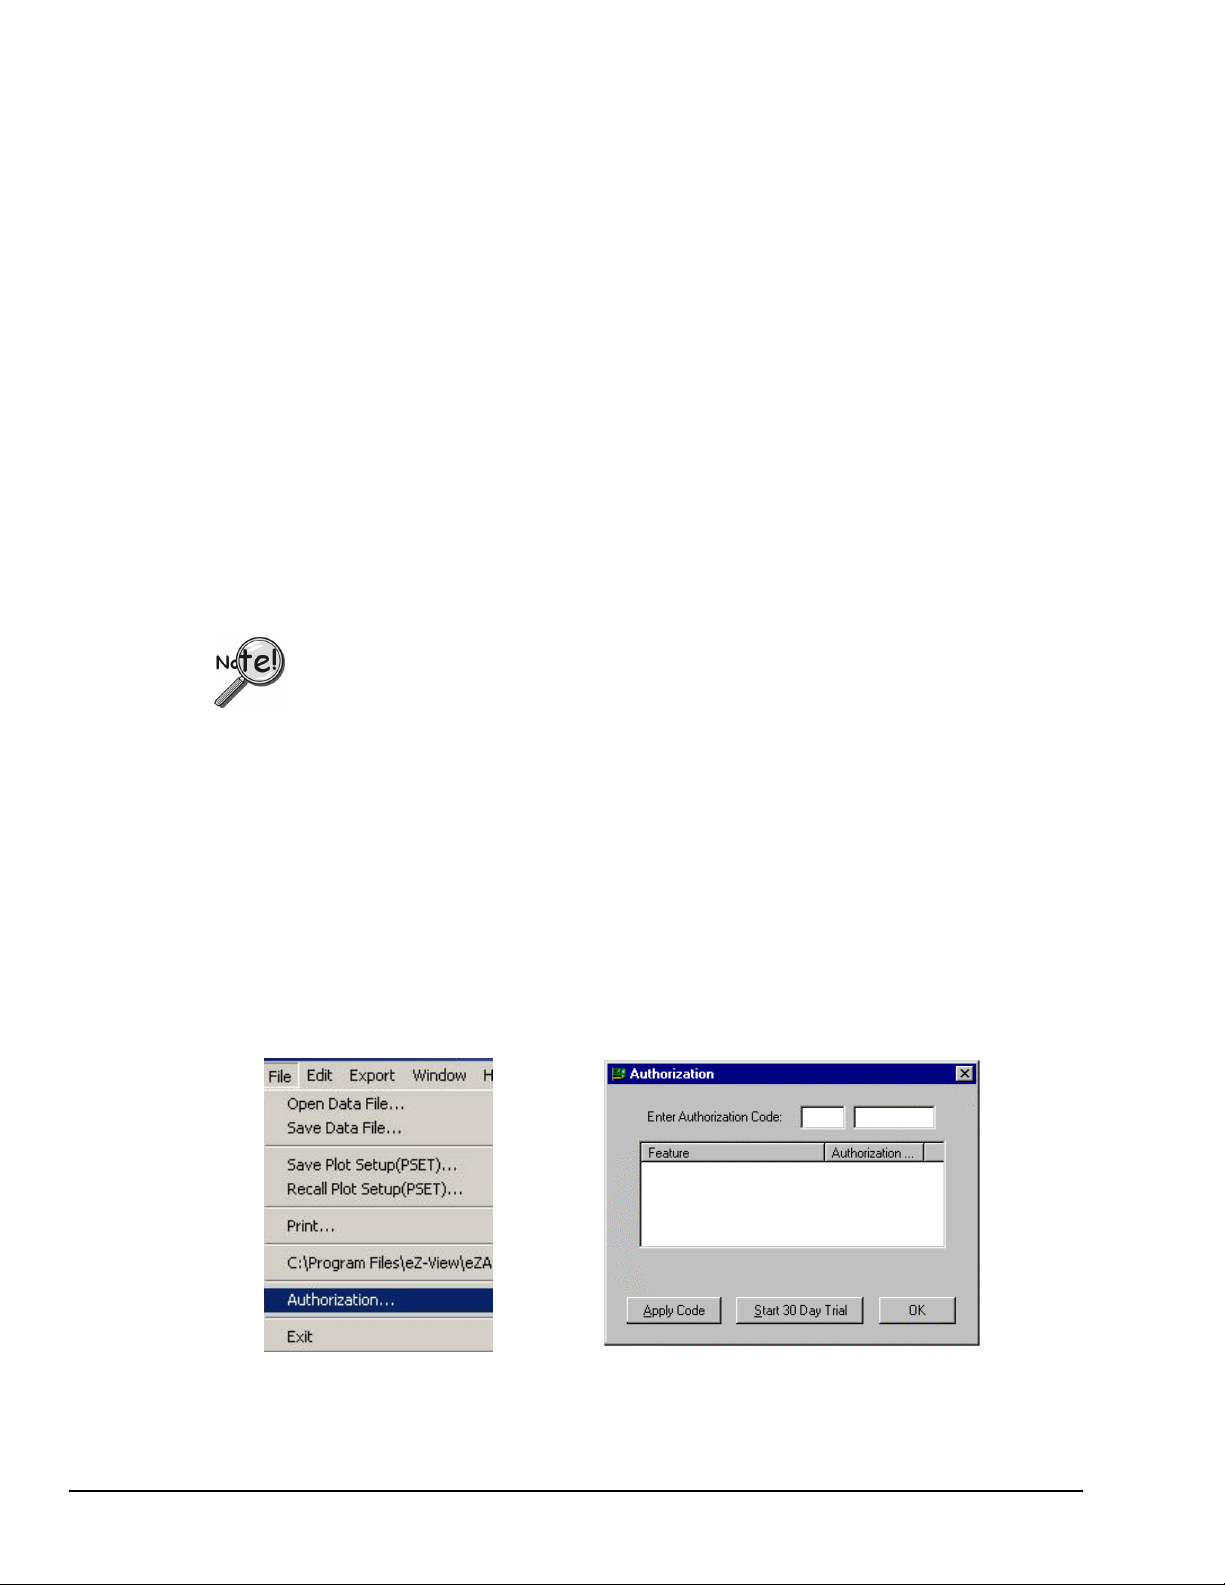
ZonicBook Applications
System Requirements
Before setting up the hardware or installing the software, verify that you have the following items.
• ZonicBook Data Acquisition Module
• ZonicBook DSP-Card
• Universal Power Supply with cord (U.S.)
•
• Passwords for purchased software
In addition, verify that your computer meets the following minimum requirements.
• Intel
•
•
• 100 MB Hard Disk space
• Monitor: SVGA, 800 x 600 resolution
• One of the following Microsoft
If you purchased software, associated passwords will accompany your installation CD.
If this is the case, keep your passwords in a safe place. You will need to enter them once,
during an actual run of eZ-Analyst.
Data Acquisition CD
™
, Pentium 90 MHz or equivalent
a slot for a Type III PCMCIA Card
64 MB Memory
®
Windows Operating Systems:
Windows 98
Windows Me
Windows NT
Windows 2000
Windows XP
Note that entry of your Authorization Code is only required once. You can enter the code from the eZ-Analyst
application during its initial run.
Complete these simple steps to enter the code:
1. Open eZ-Analyst.
2. From the File Pull-Down menu, select Authorization.
The Authorization dialog box appears (see figure).
3. Enter your Authorization Code from the code sheet that was included with your purchase.
4. Click the <Apply Code> button to enable your new software features.
1-6 Getting Started, ZonicBook
File Menu
09-05-02
Authorization Dialog Box
eZ-Analyst
Page 58

Software Installation for Windows 98/Me/2000/XP/NT
1. Start Windows.
2. Close all running applications.
3. Insert the Data Acquisition CD into your CD-ROM drive and wait for the CD to auto-run.
If the CD does not start on its own:
(a) click the desktop’s <Start> button
(b) choose the Run command
(c) select the CD-ROM drive, then select the setup.exe file
(d) click <OK>
An Opening Screen will appear.
4. Click the <ENTER SETUP> button.
5. On the hardware selection screen [which follows a licensing agreement], select
ZonicBook Systems from the drop-down list.
6. On the resulting software options screen you will see that eZ-Analyst Real-Time FFT Analyzer
Software has been automatically selected. If applicable to your ZonicBook System, select other
install options.
ZonicBook Applications
7. Click the <Install> button; then follow the on screen prompts to complete the installation.
If you purchased software, associated authorization codes will accompany your
installation CD. If this is the case, keep your codes in a safe place. You will need to
enter them once, during an actual run of eZ-Analyst.
eZ-Analyst
09-05-02
Getting Started, ZonicBook 1-7
Page 59

ZonicBook Applications
A Special Note for Windows NT Users Windows NT
If your PC is using Windows NT, perform the following after you have installed the software.
1. Verify that you are logged on with Administrator capabilities.
2. Verify IRQ and I/O Port availability. This is done as follows:
(a) From the Start menu, navigate as follows:
Program ⇒⇒⇒⇒ Windows NT Diagnostics ⇒⇒⇒⇒ Resources
(b) Verify and write down the I/O Port Address; for example: 0110-011F
(c) Verify and write down available IRQs; for example: 9, 10, 11.
3. Open the Control Panel.
4. Double-click the CACDSP icon. This opens the CAC API Configuration Utility window.
5. In the data entry box, enter the I/O Port Address [from step 8b].
Typically the I/O Port is either 0x0110 or 0x0120.
6. In the data entry box, enter an available interrupt (IRQ) for your system [from step 8c].
Typically this is 10 or 11.
7. Click the DSP Tab.
8. Select PCMCIA.
9. Click the <ADD> button.
Note: For Windows NT operating systems, the I/O Port Address and IRQ values do not
show up in the menus after you close the window. They are; however, stored in
memory.
10. Click <OK.>
11. Restart your computer.
Your computer is now ready to run ZonicBook software and communicate with the
ZonicBook module.
If the DSP-Card does not respond in Windows NT, try the following:
1. From the desktop, open the Control Panel. This is done by navigating as follows:
Start ⇒⇒⇒⇒ Settings ⇒⇒⇒⇒ Control Panel ⇒⇒⇒⇒ System ⇒⇒⇒⇒ Device Manager ⇒⇒⇒⇒ CACDSP
Note: “CACDSP” represents the DSP-Card device
2. Double-click the “CACDSP” (DSP-Card) device.
3. Click the <Start> button. This starts the DSP-Card without the need to reboot the computer.
4. To enable or disable the DSP-Card, click the <Startup> button, then click the <Enable> or the
<Disable> button as applicable.
5. Click the <HW Profiles> button.
6. If the Startup method is not set to “Automatic,” set the DSP-Card for “Automatic” startup.
1-8 Getting Started, ZonicBook
09-05-02
eZ-Analyst
Page 60
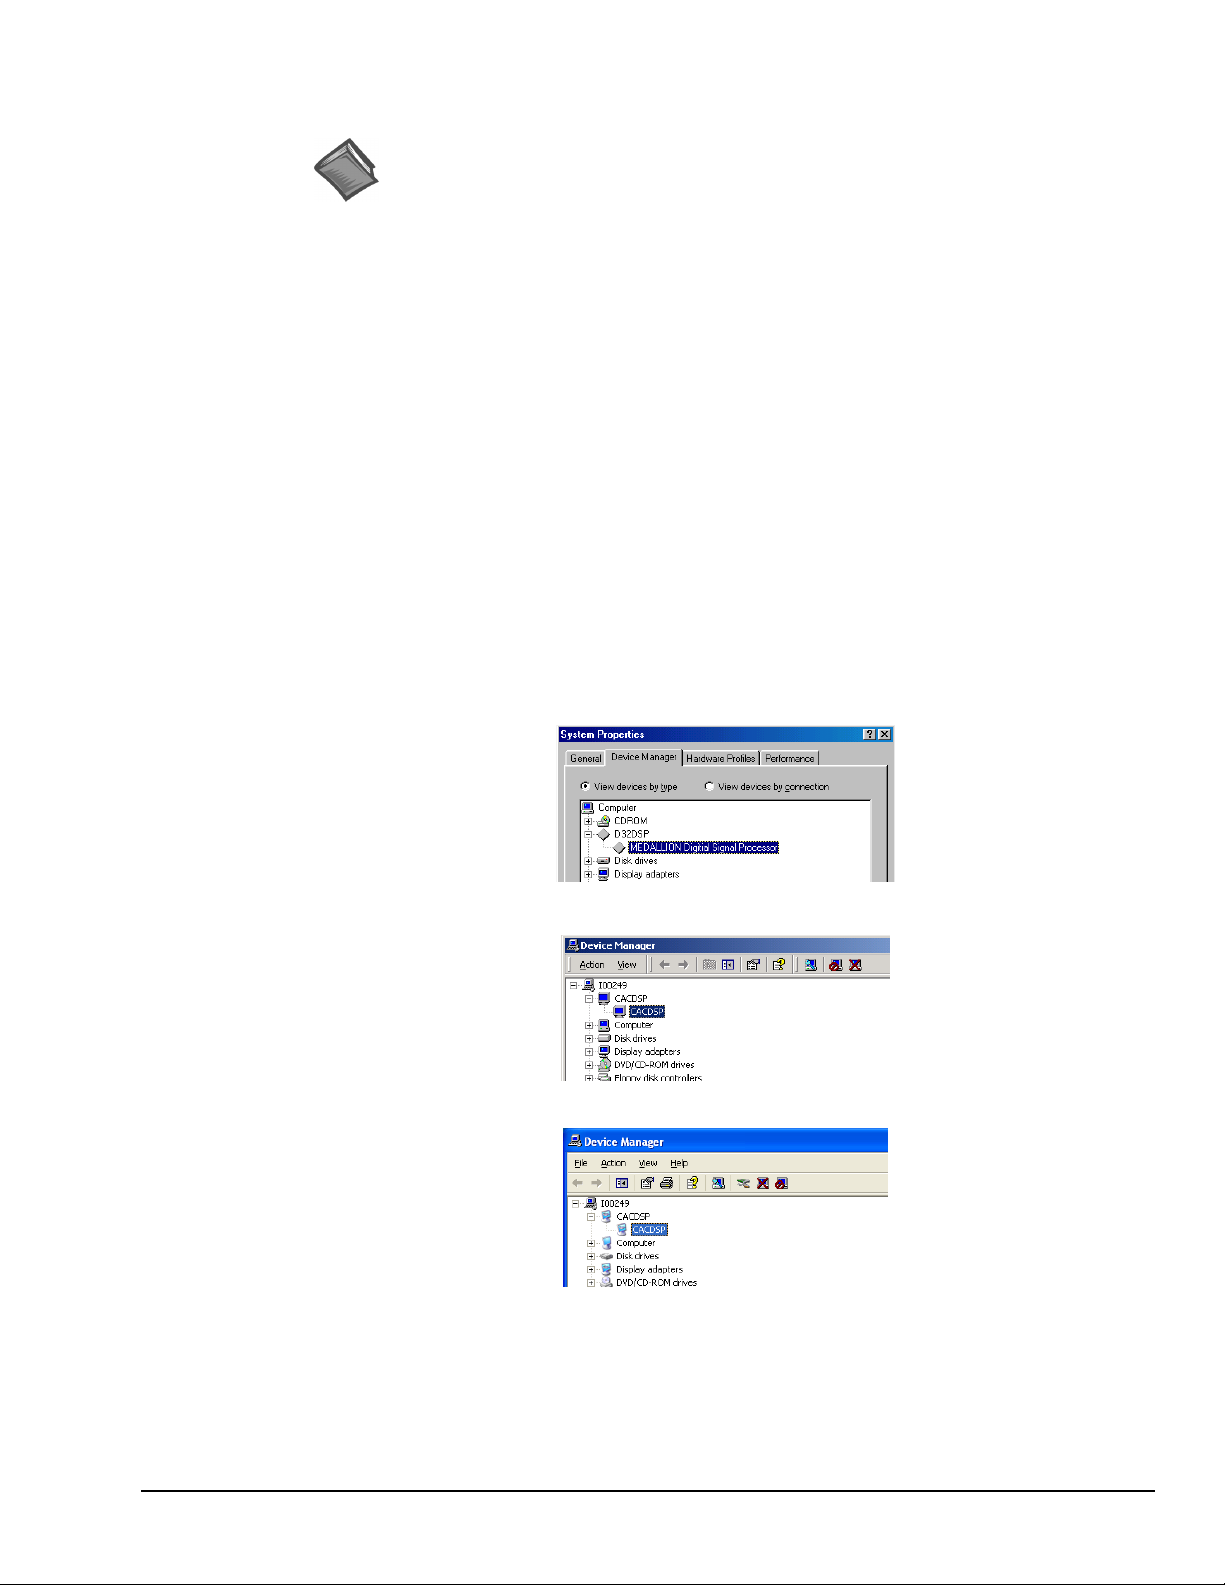
ZonicBook Applications
Hardware Setup and DSP-Card Installation
Reference Note:
If you have not already set up your hardware and installed your DSP-card, refer
to your ZonicBook User’s Manual (p/n 1086-0901), and do so at this time.
Verifying DSP-Card Installation
You can use the Window’s Device Manager to verify that the DSP-card has been properly installed.
The steps for this method are as follows.
1. From the Windows Desktop, click <Start>.
2. Click Settings.
3. Click Control Panel.
4. Click the System icon.
5. Click the “Device Manager” tab.
6. Locate one of the following nodes, as applicable to you Window’s operating system.
•
Windows 98 and Windows Me users should locate a node called D32DSP.
•
Windows 2000, Windows XP, Windows NT users should locate a node
called CACDSP.
7. Expand that node by clicking on the “+” symbol.
At this point you should see a screen similar to one of the following, depending on which
operating system your PC is using.
(All Windows Systems)
DSP Verification, Windows 98 and Windows Me
DSP Verification, Windows 2000
DSP Verification, Windows XP
Note: A screen image is not shown for Windows NT. However, Windows NT makes
use of a CACDSP node, as do Windows 2000 and Windows NT.
eZ-Analyst
09-05-02
Getting Started, ZonicBook 1-9
Page 61

ZonicBook Applications
1-10 Getting Started
09-05-02
eZ-Analyst
Page 62
WaveBook Applications
WaveBook, eZ-Analyst Install
Introduction…… 1-11
System Requirements …… 1-11
Software Installation …… 1-12
Using the Daq Configuration Applet to Check Connections …… 1-13
eZ-Analyst will only work with one WaveBook installed in the
Daq Configuration Control Panel.
Introduction
WaveBooks are 1MHz portable data acquisition devices that can be used in a variety of applications, such
as testing engine strain, multi-channel acoustics, mechanical integrity, and vibration/shock/strain. With
WaveBook, eZ-Analyst offers a channel count of up to 64 channels, relatively high frequency analysis
capabilities, and a selection of input channel types, including Analog filtering, Strain Gage, and ICP.
System Requirements
Before setting up the hardware or installing the software, verify that you have the following items.
•
WaveBook Data Acquisition System
• Power Supply with cord
• Data Acquisition CD
• Passwords for purchased software
Note: This section
does not apply to the
“View” Applications.
In addition, verify that your computer meets the following minimum requirements.
• Intel
™
, Pentium 90 MHz or equivalent
• 64 MB Memory
• 100 MB Hard Disk space
• Monitor: SVGA, 800 x 600 resolution
•
One of the following Microsoft
®
Windows Operating Systems:
Windows 98
Windows Me
Windows NT
Windows 2000
Windows XP
Optional, but recommended:
EPP (Enhanced Parallel Port), or
ECP (Extended Capabilities Port)
If you purchased software, associated passwords will accompany your installation CD.
If this is the case, keep your passwords in a safe place. You will need to enter them once,
during an actual run of eZ-Analyst.
eZ-Analyst
09-05-02
Getting Started, WaveBook 1-11
Page 63
WaveBook Applications
Software Installation
Remove any previous-installed versions of WaveBook software before installing a new version.
1. Start Windows.
2. Close all running applications.
3. Insert the Data Acquisition CD into your CD-ROM drive and wait for the CD to auto-run.
If the CD does not start on its own:
(a) click the desktop’s <Start> button
(b) choose the Run command
(c) select the CD-ROM drive, then select the setup.exe file.
(d) click <OK>.
An Opening Screen will appear.
4. Click the <ENTER SETUP> button.
5. From the hardware selection screen [which follows a licensing agreement], select
WaveBook Systems from the drop-down list.
6. On the resulting software options screen you will see that WaveView and eZ-PostView have
been automatically selected. If you plan to use eZ-Analyst in place of WaveView, de-select
WaveView and eZ-PostView; otherwise, keep both options selected.
7. Select eZ-Analyst Real-Time FFT Analyzer Software.
If you purchased software, associated authorization codes will accompany your
installation CD. If this is the case, keep your codes in a safe place. You will need to
enter them once, during an actual run of eZ-Analyst.
8. If applicable, select other install options.
9. Click the <Install> button.
10. Follow the on-screen prompts to complete the installation process.
Note that the eZ-Analyst authorization code is entered via an Authorization Dialog Box, which is
accessed from eZ-Analyst’s File pull-down menu. This is described in the Authorization
Certificate that is included with your purchase of eZ-Analyst. Page 1-6 of this chapter contains
additional information.
Reference Notes:
➣
Adobe Acrobat PDF versions of documents pertaining to WaveBook are
automatically installed onto your PC’s hard-drive as a part of product
support at the time of software installation. The default location is the
Programs group, which can be accessed via the Windows Desktop Start
Menu.
1-12 Getting Started, WaveBook
➣
After your software is installed you can setup your WaveBook device and
connect it to the host computer. Instructions for Hardware Setup are
included in your WaveBook User’s Manual.
09-05-02
eZ-Analyst
Page 64
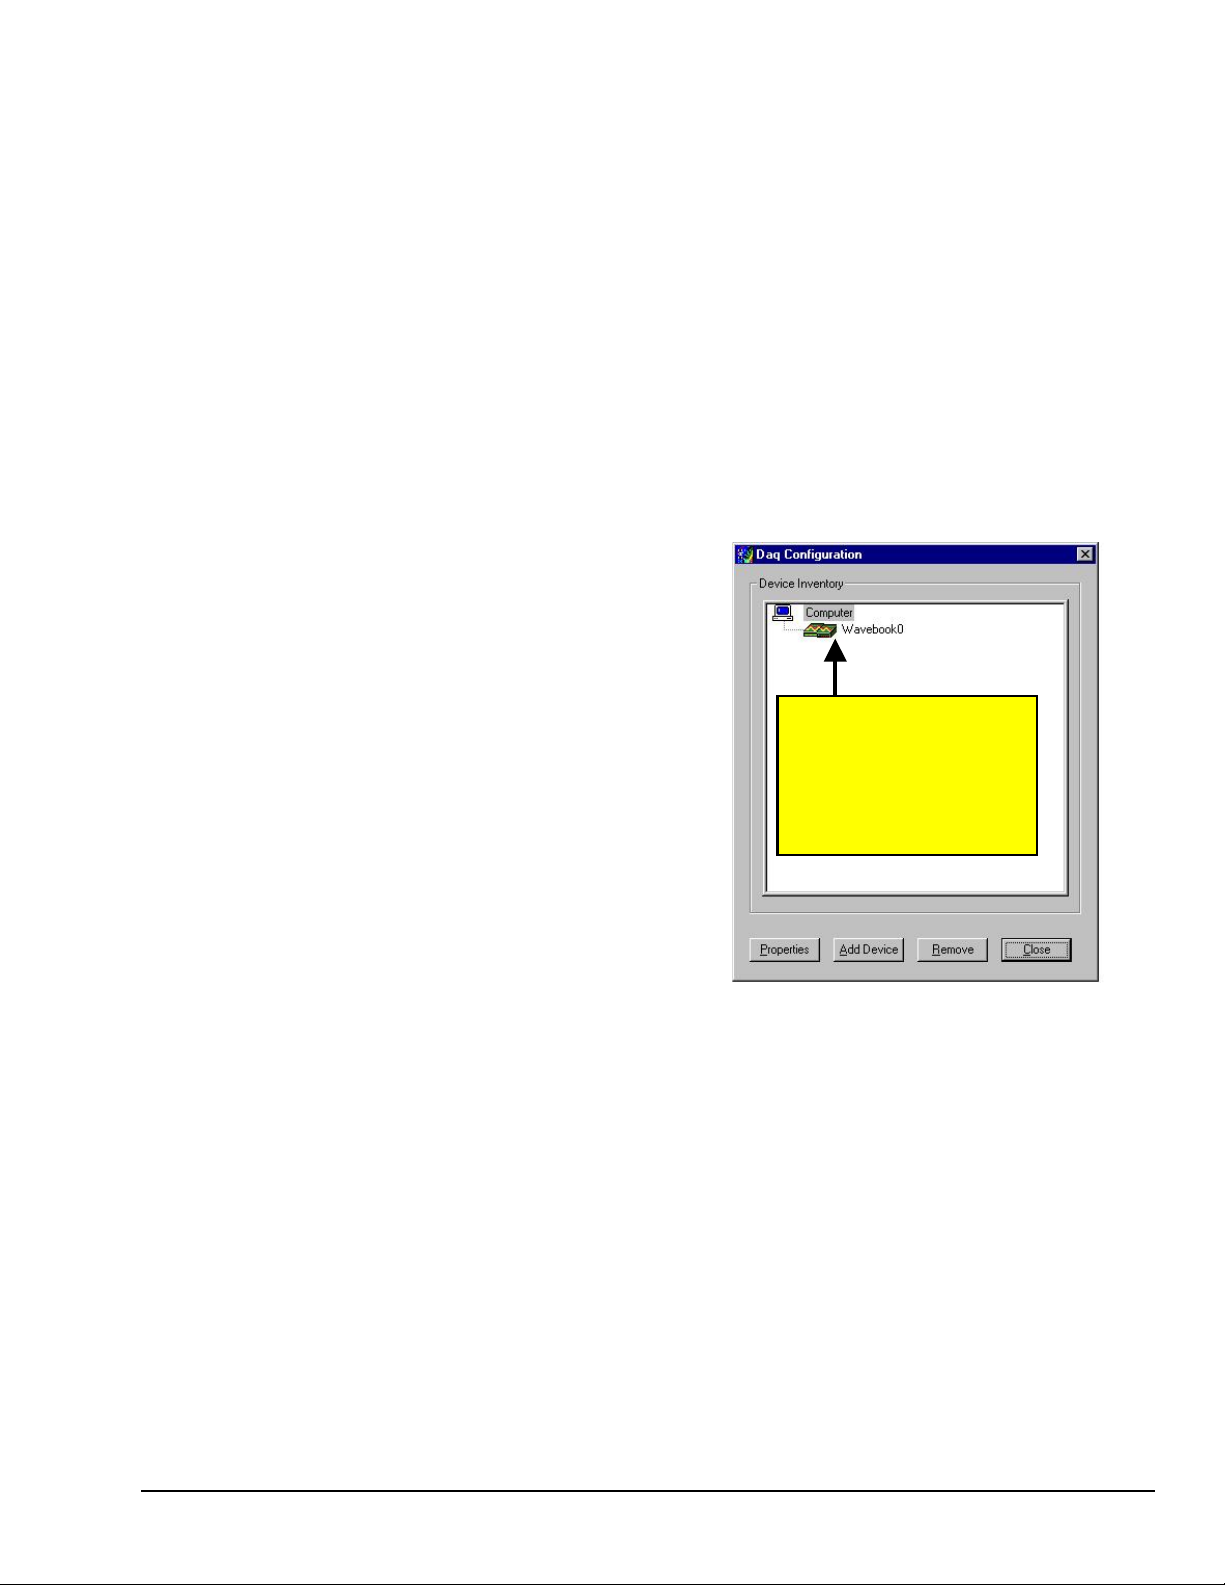
Using the Daq Configuration Applet to Check Connections
The Daq Configuration applet, designed for 32-bit Windows 95/98/Me/NT/2000/XP systems, is located in
the Windows Control Panel. It allows you to add or remove a device and change configuration settings.
The included test utility provides feedback on the validity of current configuration settings, as well as
performance summaries.
Device Inventory Dialog Box
Run the applet by double-clicking on the Daq Configuration icon in the Windows Control Panel.
The Device Inventory dialog box will open, displaying all currently configured devices. Displayed devices
show their name and an icon to identify the device type. If no devices are currently configured, no devices
will appear in this field.
The four buttons across the bottom of the dialog box are used as follows:
• Properties: Current configuration settings for a device can be changed by first bringing up the
corresponding Properties dialog box. Open the Properties dialog box by double-clicking on the device
icon or selecting the device and then clicking on the Properties button.
• Add Device: The Add Device button is
used to add a device configuration
whenever a new device is added to the
system. Failure to perform this step will
prevent applications from properly
accessing the device. Clicking on the Add
Device button will open the Select Device
Type dialog box.
• Remove: The Remove button is used to
remove a device from the configuration.
A device may be removed if it is no
longer installed, or if the device
configuration no longer applies. Since
eZ-Analyst will only work with one
WaveBook in device inventory, if
applicable, you will need to remove
other WaveBooks.
Note: eZ-Analyst will only work
with 1 WaveBook detected in
the device inventory.
If applicable, you will need to
remove other WaveBooks from
the device inventory.
WaveBook Applications
eZ-Analyst
Note: If a device is removed, applications
may no longer access the device.
However, the device can be
re-configured at any time using the
Add Device function described above.
• Close: The Close button may be used at
any time to exit the Daq Configuration
applet.
09-05-02
Daq Configuration - Device Inventory Dialog Box
Getting Started, WaveBook 1-13
Page 65
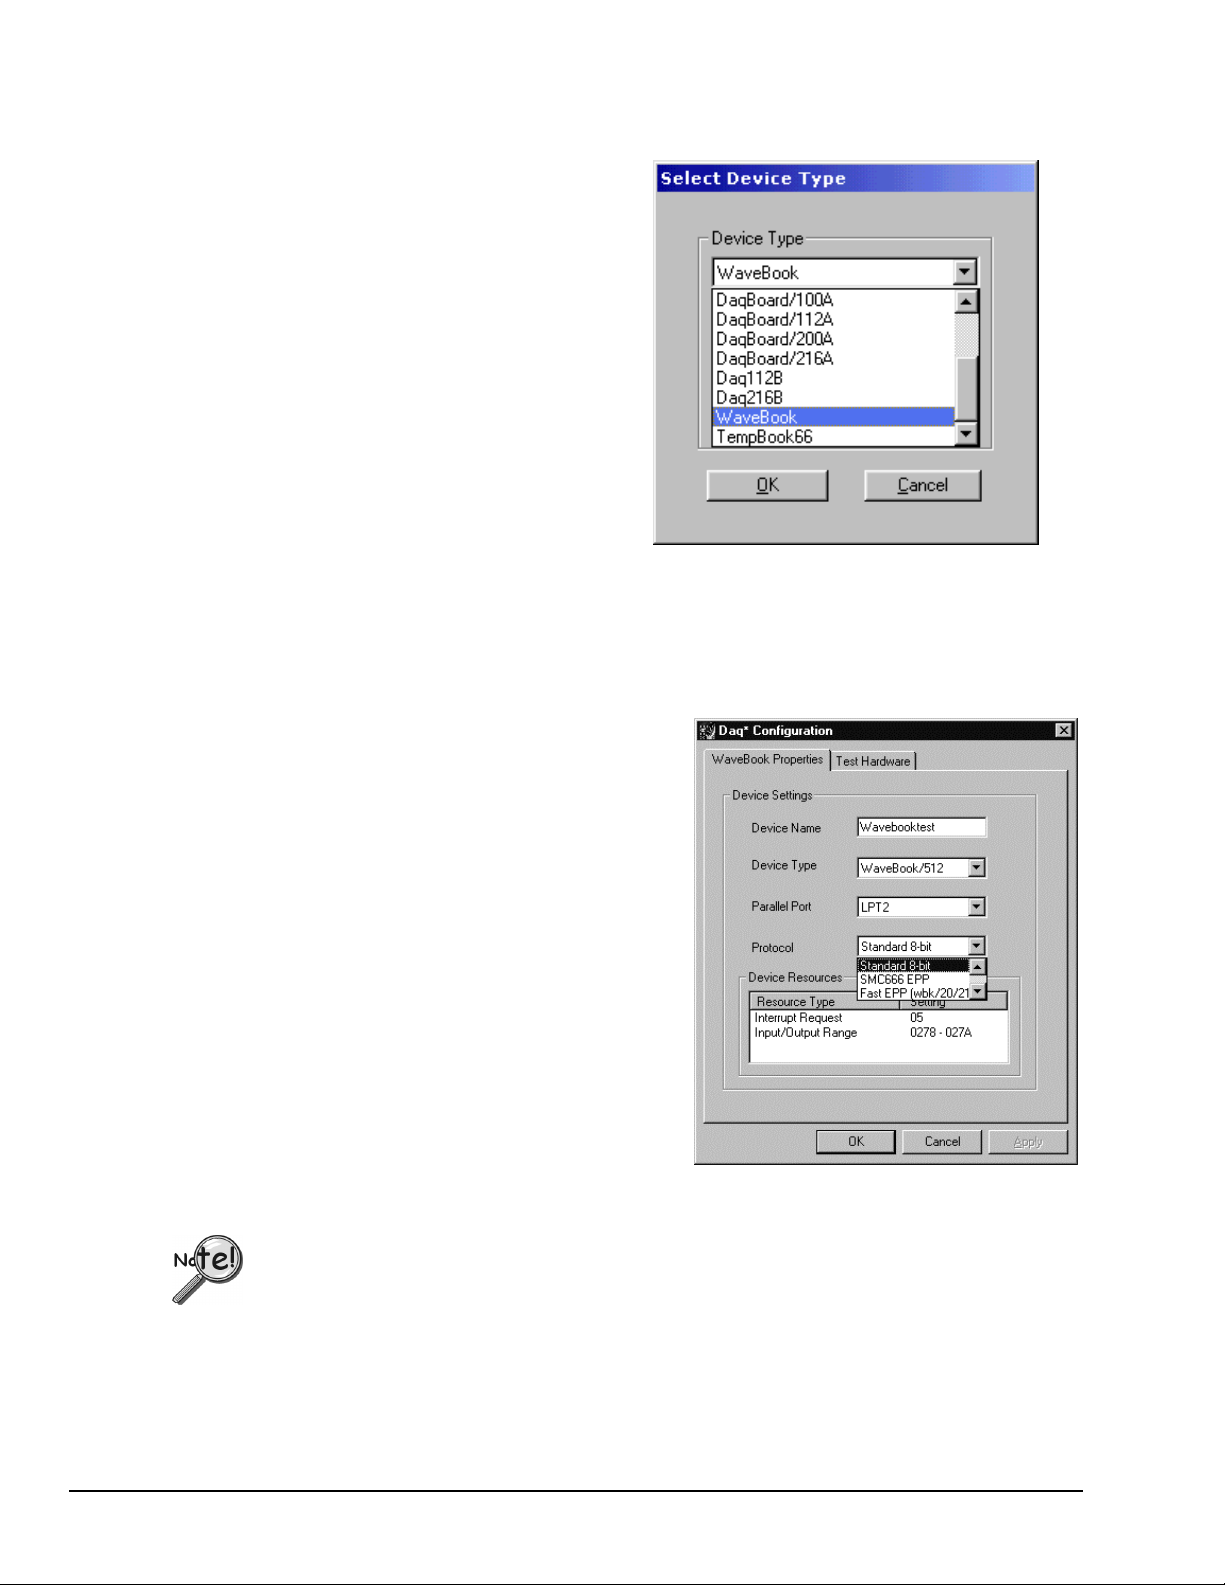
WaveBook Applications
Select Device Type Dialog Box
This dialog box opens when the Add Device
button of the Device Inventory dialog box is
selected.
The device type you select for configuring
will appear in the main edit box. Clicking on
the OK button will then open the Properties
dialog box (following figure).
Properties Dialog Box
This dialog box opens when the Properties button of the Device Inventory dialog box is selected, or when
the OK button of the Select Device Type dialog box is selected. It displays the properties for the WaveBook
device with the default configuration settings. The fields include:
Daq Configuration - Select Device Type Dialog Box
• Device Name: The Device Name field is displayed
with the default device name. As shown, this field
can be changed to any descriptive name as desired.
This device name is the name to be used with the
daqOpen function to open the device. This name
will also be displayed in the device lists for opening
the device in the WaveView and WaveCal
applications.
• Device Type: The Device Type field indicates the
device type that was initially selected. However, it
can be changed here if necessary.
• Parallel Port: The Parallel Port field is used to set
the parallel port for communicating with the
WaveBook.
• Protocol: The Protocol field is used to set the
parallel port protocol for communicating with the
WaveBook. Depending on your system, not all
protocols may be available. (See following Note).
Daq Configuration - Properties Dialog Box
In regard to Protocol – If you are using a WBK20A or WBK21, you must select
“Fast EPP (wbk/20/21)” to achieve the best performance.
1-14 Getting Started, WaveBook
09-05-02
eZ-Analyst
Page 66
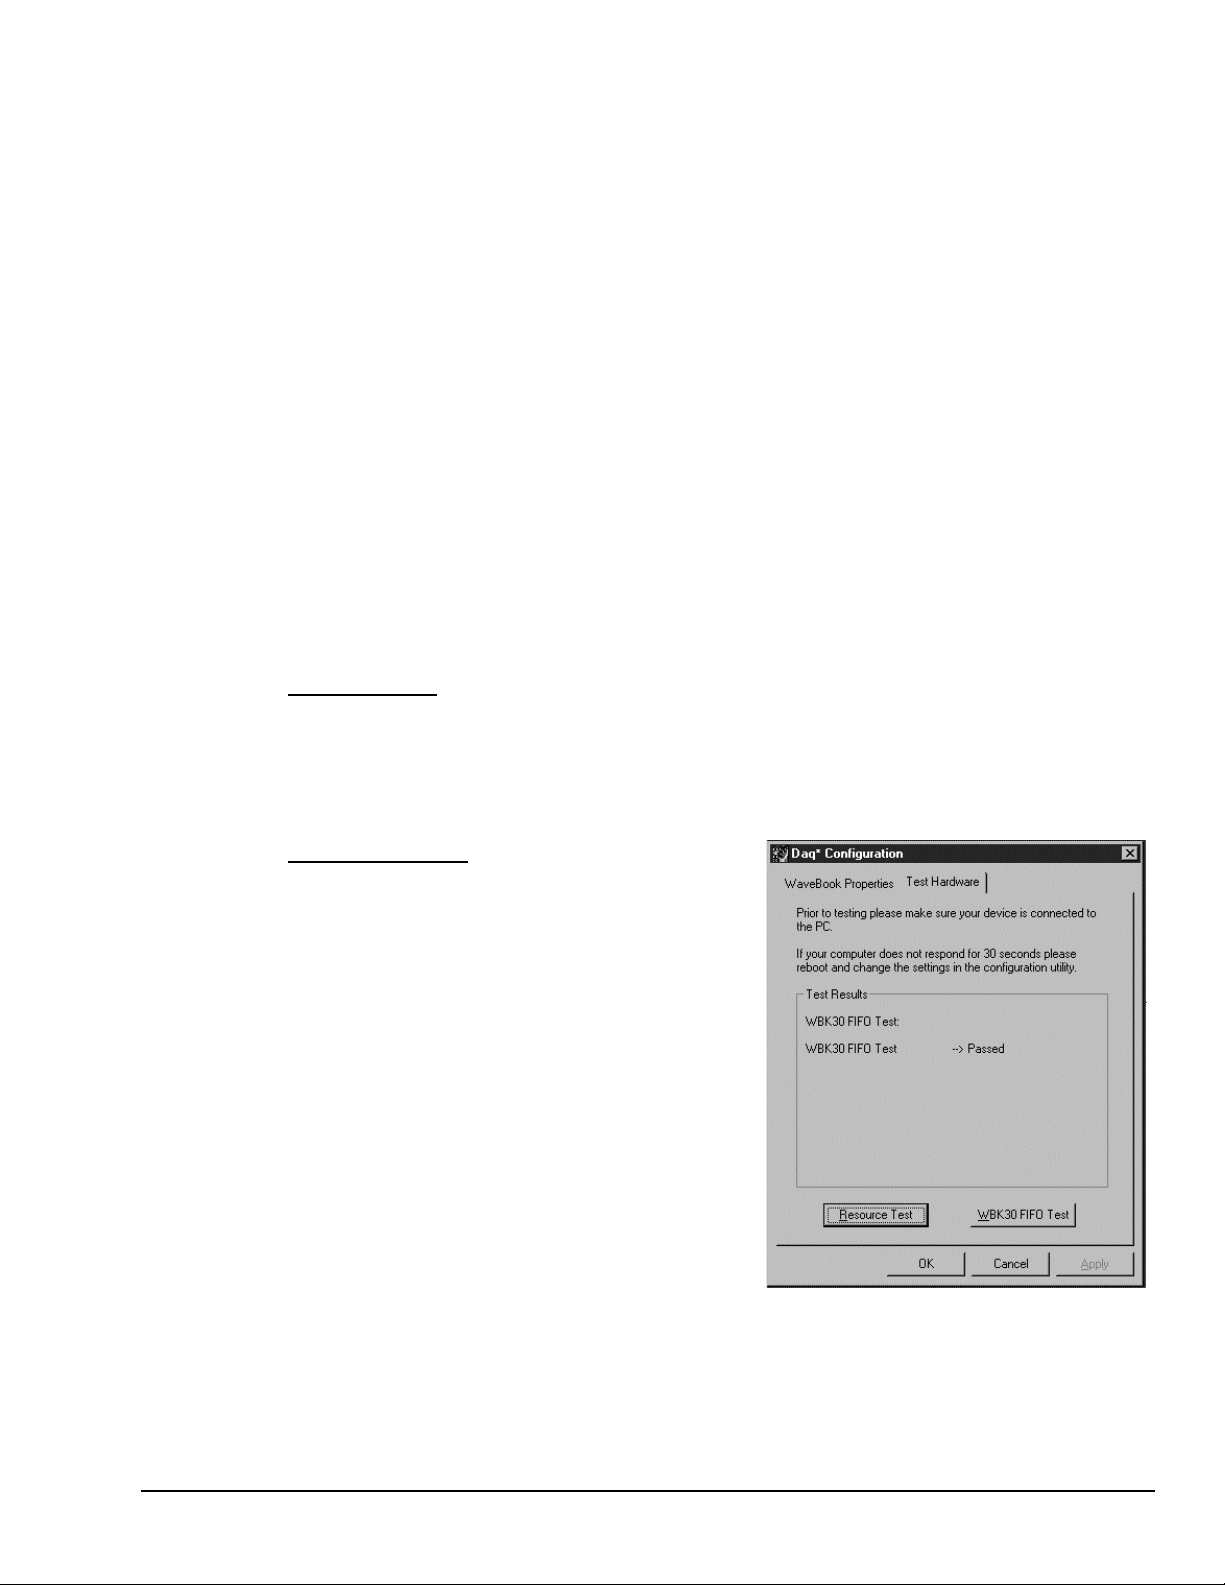
WaveBook Applications
• Device Resources: The Device Resources field lists settings for various resources, among them Interrupt
Request, Input/Output Range, and Direct Memory Access.
• OK: Click on the OK button to store the configuration and exit the current dialog box.
• Cancel: Click on the Cancel button to exit the current dialog box without storing any changes.
• Apply: Click on the Apply button to store the configuration. Or you can click the following tab:
• Test Hardware: Click on the Test Hardware tab to test the current stored configuration for the device.
This selection will open the Test Hardware dialog box.
Test Hardware Dialog Box
Before testing WaveBook, make sure the device has been properly installed and powered-on. Make sure
the parallel port cable is firmly in place on both the WaveBook and the proper LPT port in the computer.
When testing WaveBook, if the unit does not respond within 30 seconds perform the following
steps:
1) reboot the system
2) upon power-up, re-open the Daq Configuration applet
3) select another configuration setting
4) reinitiate the test
To test the currently stored configuration for the WaveBook device, click the Test button. Results should be
displayed in a few seconds. The test results have two components: Resource Tests and Performance Tests.
Resource Tests. The resource tests are intended to test system capability for the current device
configuration. Resource tests are pass/fail. Test failure may indicate a lack of availability of the resource,
or a possible resource conflict.
Base Address Test. This resource test checks the base address for the selected parallel port. Failure of this
test may indicate that the parallel port is not properly configured within the system. See relevant operating
system and computer manufacturer’s documentation to correct the problem.
Performance Tests. These types of tests are intended
to check various WaveBook functions, using the current
device configuration. Performance tests provide
quantitative results for each supported functional group.
Test results represent maximum rates the various
operations can be performed. The rates depend on the
selected parallel port protocol, and vary according to
port hardware capabilities.
WBK30 FIFO Test. This performance test checks the
data-storing capabilities of the optional, WBK30
memory card.
Note that the figure to the right represents results from a
previous test. Initially, the screen shows no test results.
eZ-Analyst
Daq Configuration - Test Hardware Dialog Box
When the test is completed successfully, the Daq Configuration Test Dialog Box indicates a passed
condition. For example, in the above figure:
WBK30 FIFO Test ÆÆÆÆ Passed.
“Passed” messages indicate that you can exit the test program and run your application.
09-05-02
Getting Started, WaveBook 1-15
Page 67

WaveBook Applications
1-16 Getting Started, WaveBook
09-05-02
eZ-Analyst
Page 68

Menus and Windows 2
Foreword
In addition to use as a reference for eZ-Analyst, this chapter can also be used for eZ-PostView,
eZ-TimeView, and eZ-FrequencyView. However, there are many cases where a menu or window does
not apply to one or more of these “view” applications. In these instances, functions or selection
options that can not be used will be either “grayed-out” or hidden in the actual application. The table
on page 2-2 can be used as a quick reference as to what features apply to a particular application.
The menus, with exception of the Task Menu, are presented in the order that they appear on
eZ-Analyst’s main window. The Task Menu is discussed first since it is from this menu that the user
(1) selects Measurement Mode or Playback Mode and (2) makes use of the Auto-Ranging feature
for input channels.
Note that the “view” programs have no Task Menu. This is because they actually have only one task,
“Playback Mode.”
Contents
Comparing the “View” Applications to eZ-Analyst …… 2-2
Task Menu
Measurement Mode…….2-3
Playback Mode…….2-4
Input Range (Auto/Manual)……..2-4
Calibration………..2-7
(eZ-Analyst Only
File Menu …… 2-11
Edit Menu …… 2-13
Configuration Window …… 2-13
Playback Setup Window …… 2-37
Display Preferences Window …… 2-39
Export Menu …… 2-41
Window Menu …… 2-43
)
…… 2-3
Notes:
In the View-applications, the “Miscellaneous” tab corresponds to eZ-Analysts “FFT Setup” tab.
➣
Appendix C contains a screen shot of the “Miscellaneous” tab.
In the View-Applications Edit menu, there are two windows that are not seen in eZ-Analyst. These are
➣
(a) Window Colors Window and (b) Preferences Window. In eZ-Analyst, the Display Preferences Window
covers the functions of these other two windows. View-application users can refer to Appendix C for additional
information.
At present, eZ-Analyst only applies to ZonicBook and WaveBook devices.
➣
Our other acquisition devices, e.g., LogBooks, DaqBoards, DaqBooks, ChartScans, etc., can not currently use
➣
eZ-Analyst, but can make use of one of its derived “view” applications.
The operational differences between the use of eZ-Analyst in ZonicBook and the WaveBook are minor. However, the
➣
differences are noted. For example, the discussion of Autorange is broken down into two sections, one sub-titled
"ZonicBook Applications" and the other "WaveBook Applications."
eZ-Analyst
09-19-02
Menus and Windows 2-1
Page 69
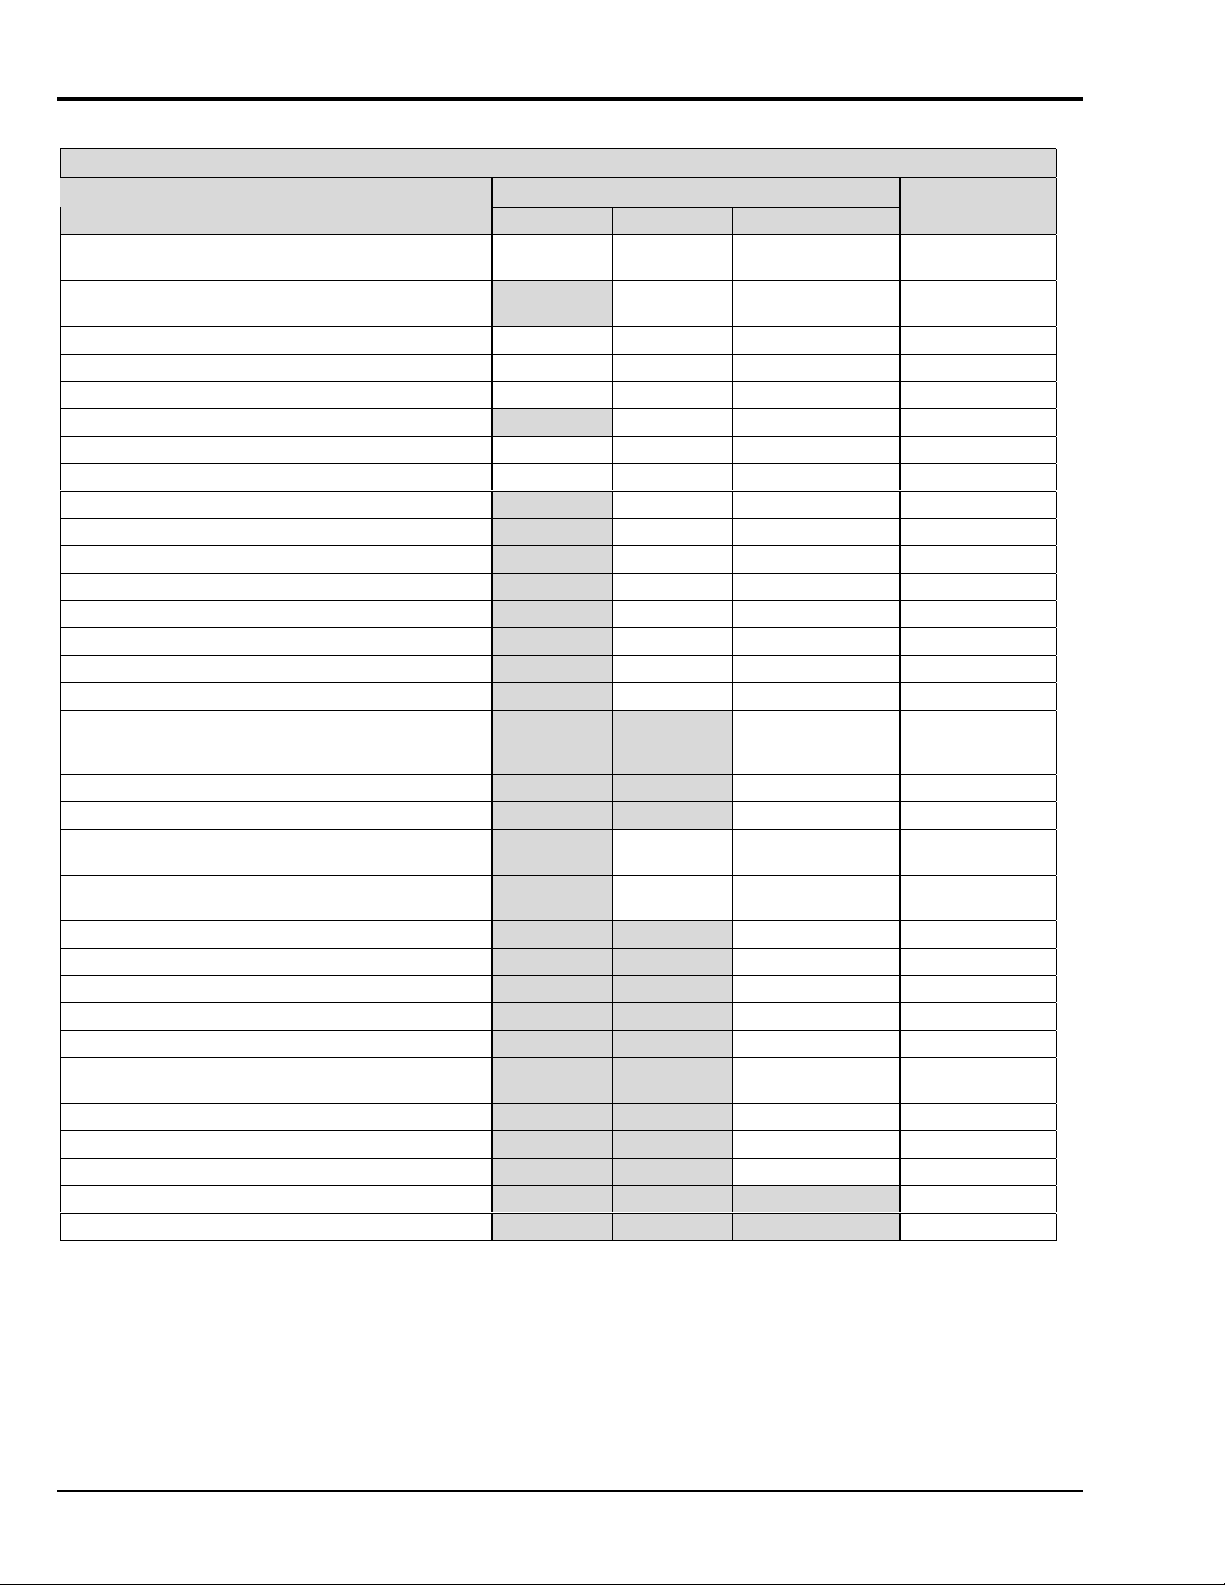
Comparing the “View” Applications to eZ-Analyst
eZ-Analyst Series Comparison Matrix
Feature
File Input Format Support for: DaqView, WaveView,
Personal DaqView, ChartView, UFF-58B.
File Export to: ME’Scope and SMS Modal, Microsoft
Excel, Binary Universal File, and ASCII text files.
Display Windows, number of 8 8 8 8
Channel Traces per Display Window 16 16 16 16
Automatic Data Scaling Yes Yes Yes Yes
Simulated Data Playback ----- Yes Yes Yes
Configurable Data Display for channels and trace colors Yes Yes Yes Yes
Multiple Tiling of display windows Yes Yes Yes Yes
Cursor Support - for both Single Cursor and Band Cursor ----- Yes Yes Yes
Data Strip Chart Display ----- Yes Yes Yes
Peak-to-Peak Calculations ----- Yes Yes Yes
Peak Searching, minimum and maximum ----- Yes Yes Yes
Mean Calculations ----- Yes Yes Yes
RMS Calculations ----- Yes Yes Yes
Zooming [of the data display] ----- Yes Yes Yes
Windowed Time Display Function ----- Yes Yes Yes
Cross Channel Support ----- ----- FFT, FRF, Cross,
Transfer Function Display Types ----- ----- Note 1 Note 1
Complex Function Display Types ----- ----- Note 2 Note 2
Scale Types ----- RMS, Peak,
Function Display Types ----- Time, Strip
Octave Types ----- ----- 1/3, Full 1/3, Full
Octave Weighting ----- ----- Linear, A, B, C Linear, A, B, C
Waterfall Plots ----- ----- Yes Yes
Integration/Differentiation (Single/Double) ----- ----- Yes Yes
Response Channel FFT Windows ----- ----- Note 4 Note 4
Reference Channel FFT Windows ----- ----- Rectangular,
Low-Pass DC Noise Filtering ----- ----- Yes Yes
Spectral Strip Chart Display Synchronization ----- ----- Yes Yes
Octave Strip Chart Display Synchronization ----- ----- Yes Yes
Record and Save Data to Disk ----- ----- ----- Yes
“Real Time” Data Display ----- ----- ----- Yes
Post-Acquisition Viewing Package
eZ-PostView eZ-TimeView eZ-FrequencyView
Yes Yes Yes Yes
----- Yes Yes Yes
Coherence,
Transfer Function
Peak-to-Peak
Chart
RMS, Peak,
Peak-to-Peak
Note 3 Note 3
Cosine Taper
eZ-Analyst
FFT, FRF, Cross,
Coherence,
Transfer Function
RMS, Peak,
Peak-to-Peak
Rectangular,
Cosine Taper
Notes: 1) eZ-Analyst and eZ-FrequencyView - each offers the following Transfer Function Display Types: Inertance, Mobility,
2-2 Menus and Windows
Compliance, Apparent Mass, Impedance, and Dynamic Stiffness.
2) eZ-Analyst and eZ-FrequencyView - each offers the following Complex Function Display Types: Magnitude, Phase, Real,
Imaginary, Nyquist, Magnitude and Phase, and Real and Imaginary.
3) eZ-Analyst and eZ-FrequencyView - each offers the following Function Display Types: Spectrum, Auto-Spectrum,
PSD (Power Spectral Function), Strip Chart.
4) eZ-Analyst and eZ-FrequencyView – each offers the following Response Channel FFT Windows: Hanning, Flat Top,
Exponential, and Blackman-Harris.
09-19-02
eZ-Analyst
Page 70
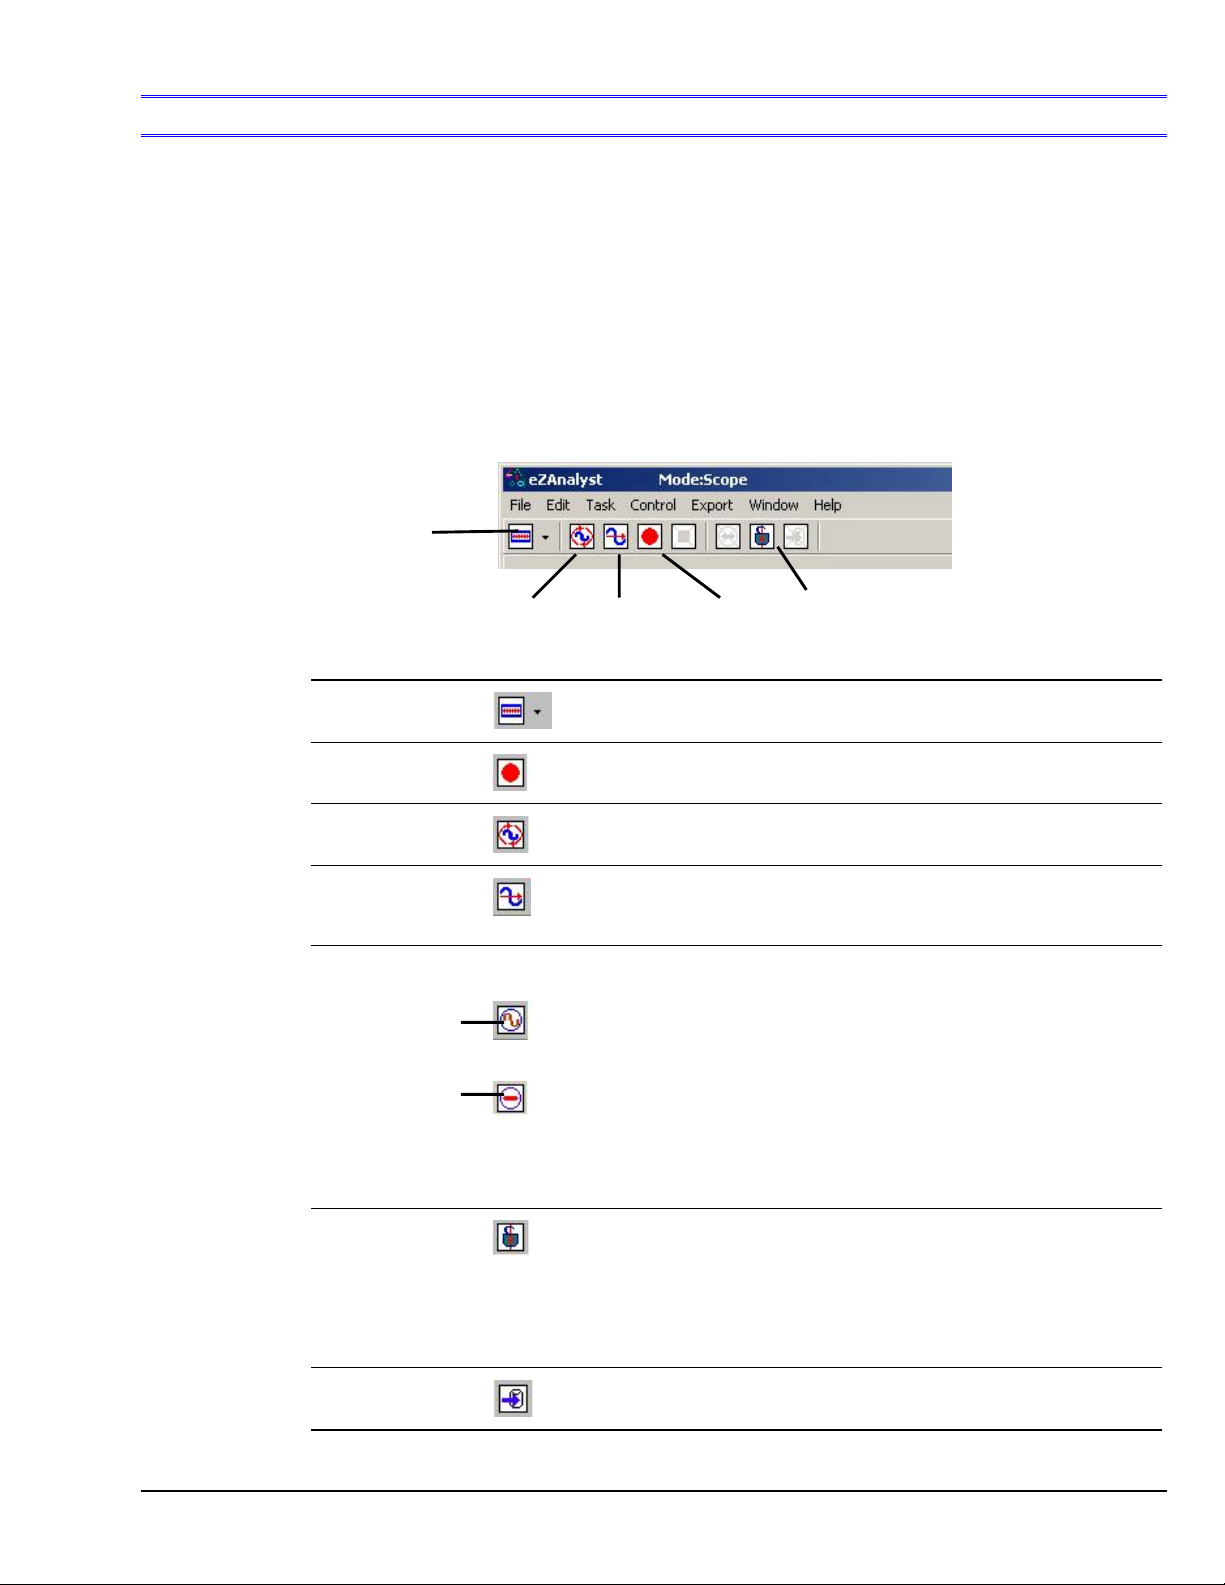
Task Menu
eZ-Analyst Only
Task Menu
> Measurement Mode
The Measurement Mode is an active data-collecting mode, which, for that reason, requires the use of data
acquisition hardware. The Measurement Mode can only be selected if a ZonicBook or WaveBook is
available; otherwise, eZ-Analyst will run in the Playback Mode only.
The Measurement Mode can run in one of three sub-modes, Scope-Continuous, Scope-Single, or Record.
The first two sub-modes are simple displays that do not log data and are most useful for signal validation and
checkout. The Record mode is the same as the two Scope modes, but has the added feature of logging datato-disk based on additional start and stop criteria.
In addition to being selected from the Task Menu, the Measurement Mode can be selected from the Task
Tool Bar by clicking the <Change Task Mode> button while in the Playback Mode. Clicking this button
from Measurement Mode will change the task mode tool bar to Playback.
Change
Task Mode
Scope-Continuous Scope-Single Record Cursor Lock
Measurement Mode Task Bar
ote that grayed-out buttons indicate that the associated function is not available due to a prerequisite not being met.
N
Change Task Mode
Changes the task from Measurement Mode to Playback Mode.
The Task Bar buttons will change accordingly.
Record
Scope-Continuous
Scope-Single
Signal Generator
Indicates that
the Generator
is turned ON
Indicates that
the Generator
is turned OFF
Cursor Lock
Starts recording data-to-disk. Note that a ZonicBook or WaveBook must be used
to acquire data.
Starts a continuous-time acquisition in Scope mode. This mode does not record
data to disk. Note that a ZonicBook or WaveBook must be used to acquire data.
Starts a single-time run data acquisition in the scope mode. This mode does not
record data to disk. Note that a ZonicBook or WaveBook must be used to
acquire data.
The Signal Generator button toggles between two images and is only active
when hardware is present.
The sign wave button indicates that the generator is ON. Clicking on it will turn
the generator OFF and the button image will change to a circled red line,
indicating that the generator is OFF.
Clicking the button, while the “Off Status” image is present, will turn the Signal
Generator back ON, and will change the button to show the sign wave image.
Note: For WaveBook applications you must set the applicable output channel
(that is to generate the signal) to “Active.” See, Output Channel Setup Tab, 2-24.
An active cursor lock button will have the image of an opened or locked padlock.
When the padlock is locked (closed), cursors in multiple windows will be
synchronized and locked, providing that the windows are of the same time
domain, frequency domain, or have the same octave band data.
An opened padlock image indicates that cursors in multiple windows have
independent cursor movement, i.e., they are unsynchronized.
eZ-Analyst
Export
This button exports data, if export conditions are set. For details, see the section,
Export Menu> Save Export Function Data.
09-19-02
Menus and Windows 2-3
Page 71
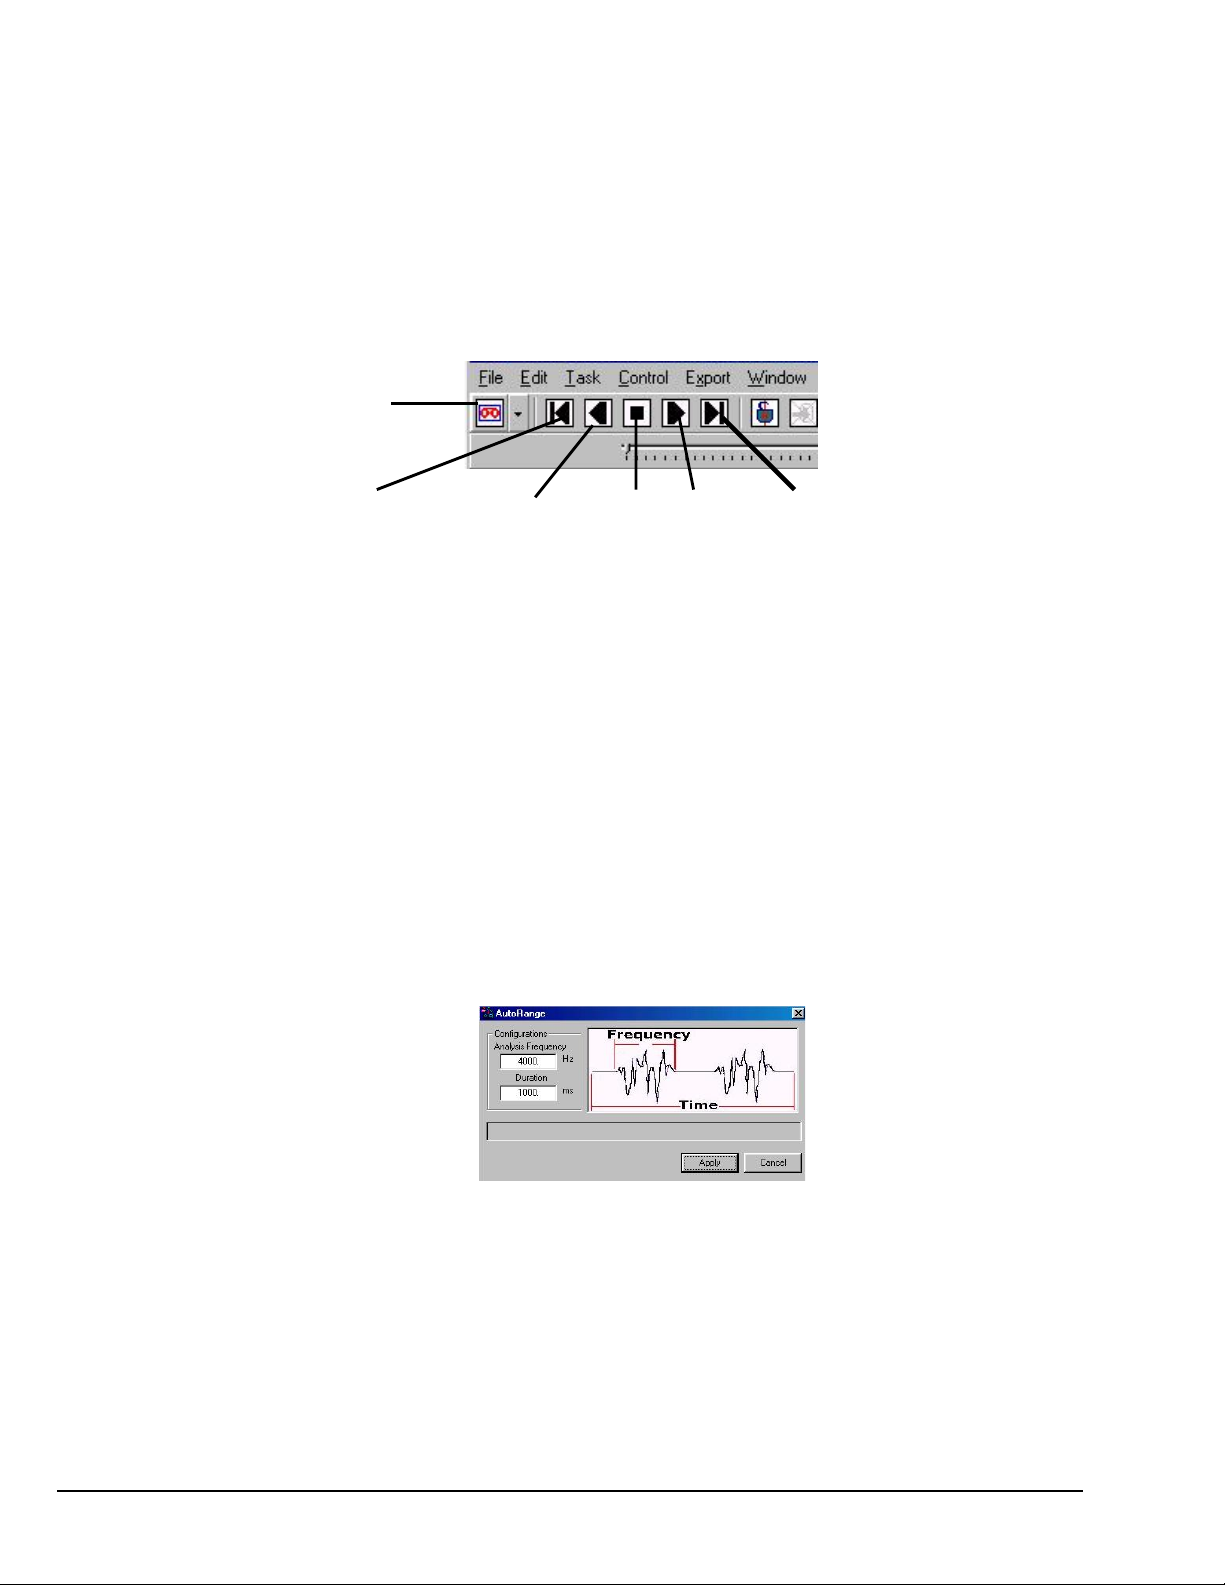
Task Menu
> Playback / Review Mode
The Playback Mode does not require the presence of physical hardware. When in Playback, eZ-Analyst is
strictly a post-acquisition display and analysis program. Raw time-domain data, that has been recorded-todisk, can be played back for analysis repeatedly. For example, a raw signal could be played back several
times, each time using a different filtering algorithm to manipulate the original signal. Once the desired
results have been achieved the new data can be exported in a new format and to a different file. The original
file can remain unchanged, and kept for future analysis.
To activate the Playback Mode, select Playback/Review on the Task Menu. An option is to click the
<Change Task Mode> button (the first button in the tool bar) while in the Measurement Mode. Also, note
that when a WaveBook or ZonicBook is not available, eZ-Analyst will automatically enter the Playback
mode and will display the data that was most recently recorded to disk.
Change
Task Mode
Play Backward, Play Backward Stop Play Play Forward
One Frame at a Time One Frame at a Time
Playback Mode Task Bar
Task Menu
WaveBook Applications
> Input Range (Auto/Manual)
Auto-ranging is a procedure that automatically sets the input full-scale voltage (FSV) range for input
channels. The FSV is set by measuring a representative sample of real-time data. Auto-ranging is only
performed on active channels.
Auto-ranging works best if you supply the same type of live data as that which will be captured during the
acquisition. Therefore, make the Auto Range Duration long enough to apply a typical signal. The maximum
duration is 65535 mSecond. Also, make sure that the Auto Range Analysis Frequency is fast enough to
capture the high frequency component. Typically the Analysis Frequency will be the same setting as eZ-
Analyst’s Acquisition Analysis Frequency.
Auto Range Dialog Box, WaveBook Applications
You can access the dialog box for WaveBook by clicking the <Auto Range> button, which is located on the
Input/Output Channels tab.
2-4 Menus and Windows
09-19-02
eZ-Analyst
Page 72
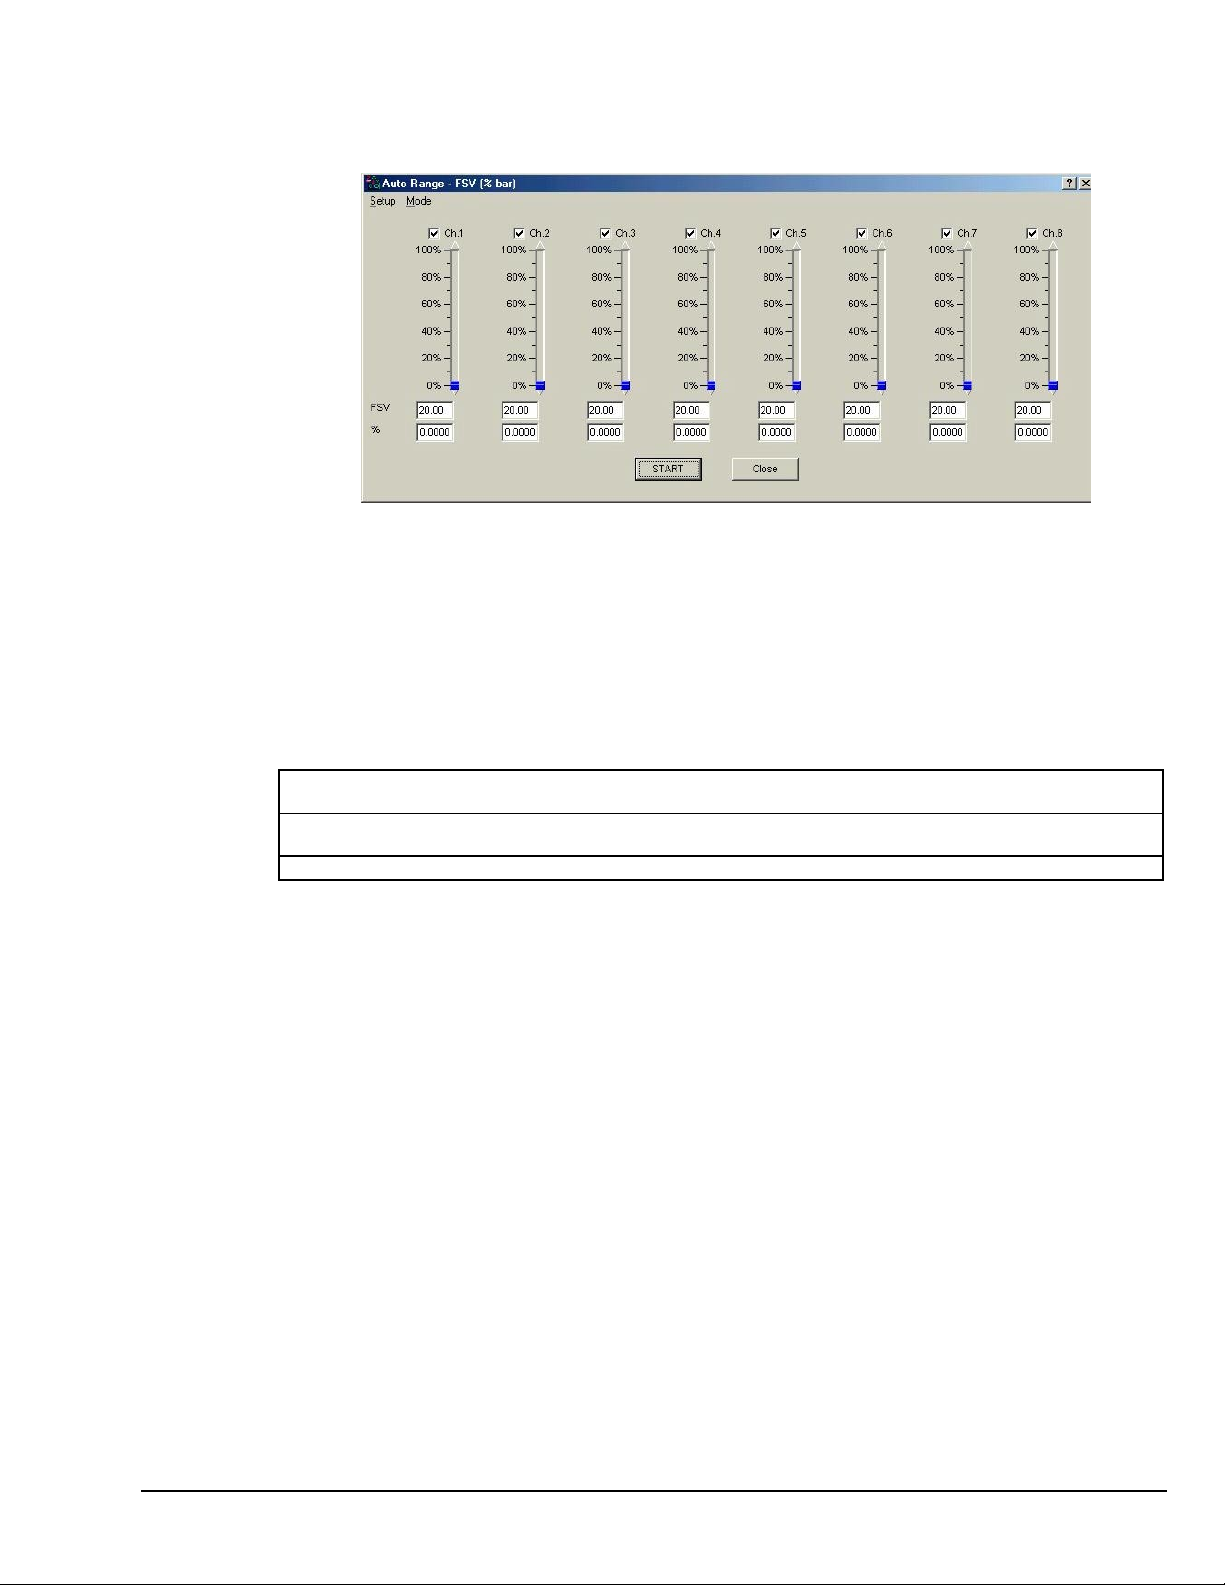
ZonicBook Applications
Auto-ranging works best if you supply the same type of live data as that which will be captured during the
acquisition.
Auto Range Display
When the Auto Range window opens, there are two numbers at the bottom of each column. The upper
number is the Current FSV (in volts) and the lower number is the % of the bar. These are the same values
that were entered in the Vpeak column in the Channel Setup window. The values are immediately replaced
when the Auto ranging process begins.
An example is included in the upcoming section, Setup Auto-ranging Parameters for ZonicBook.
Monitoring the Instantaneous Signal Level
The instantaneous peak value is graphically displayed in the vertical bars.
Yellow =
Green =
Red =
signal range is from 0 to the minimum Full-Scale Voltage set in the Auto-range Setup window.
signal range is from the minimum to the maximum of the Full-Scale Voltage set in the Auto-range Setup
window.
signal range is over the maximum of the Full-Scale Voltage set in the Auto-range Setup window.
eZ-Analyst
09-19-02
Menus and Windows 2-5
Page 73
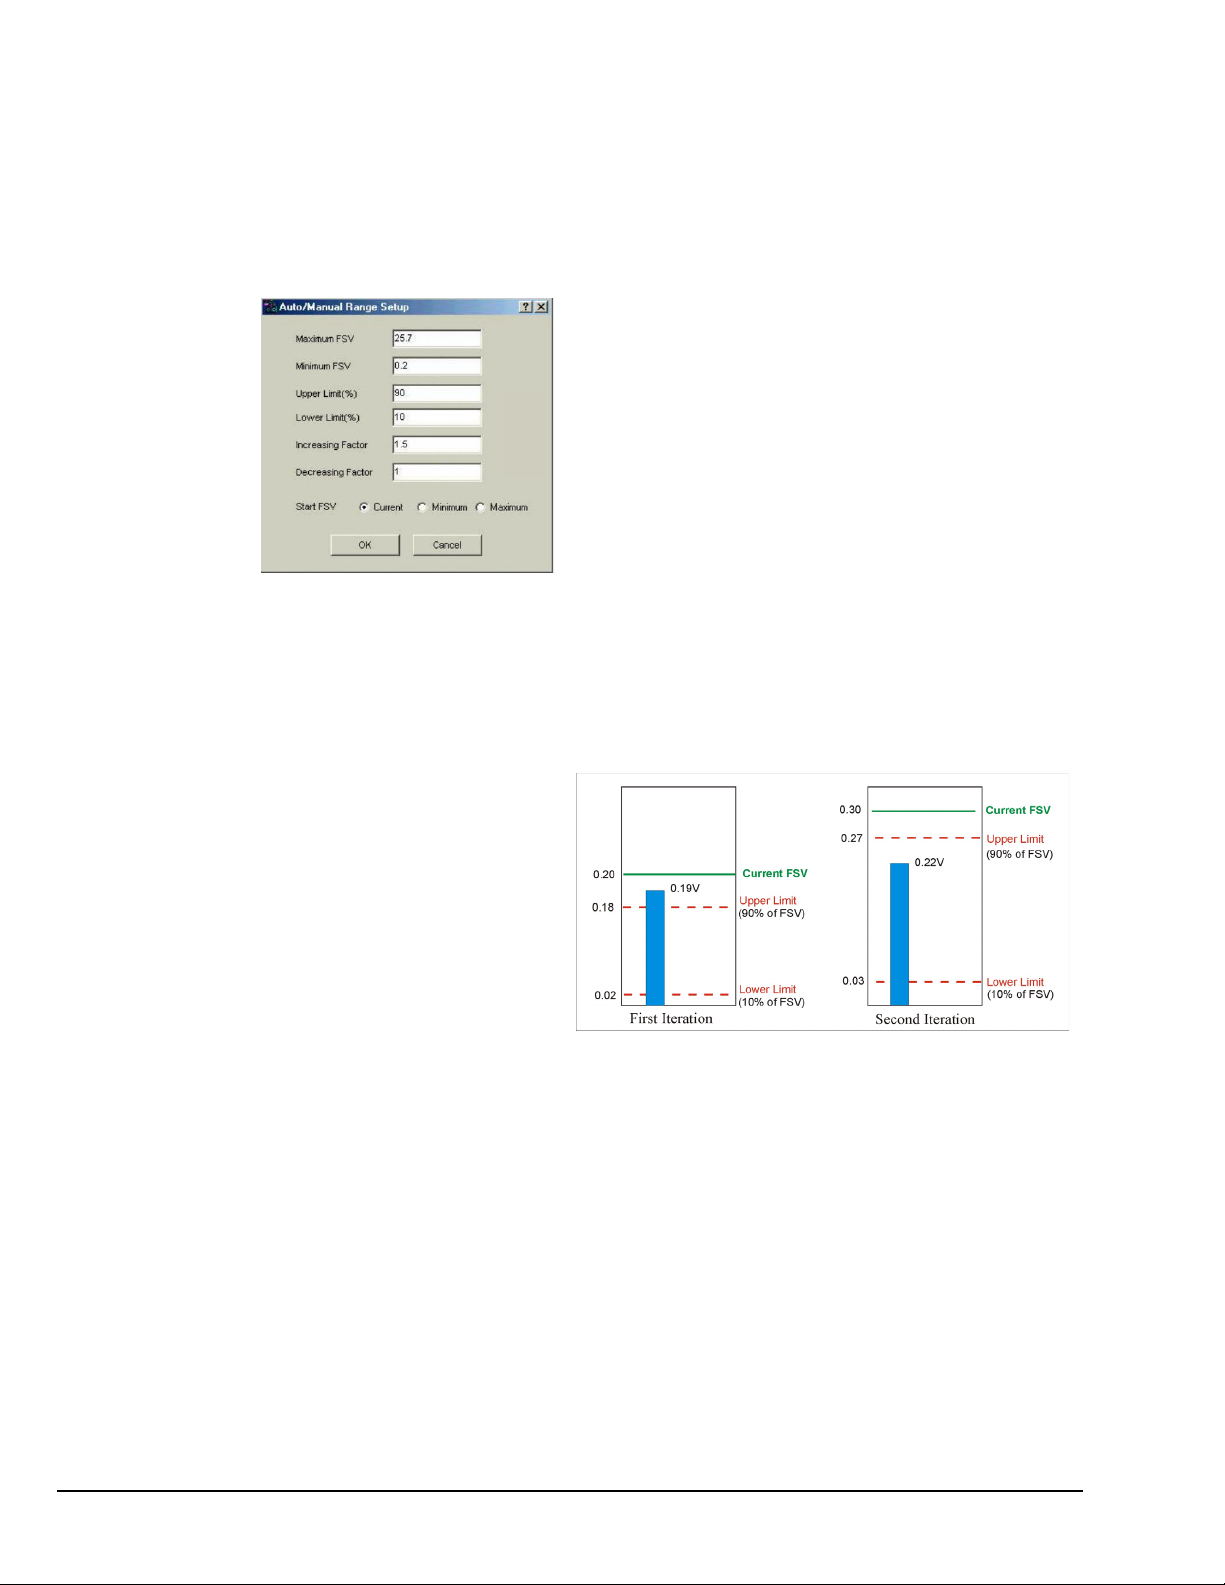
Setting Up Auto-Range Parameters for ZonicBook Applications
1. On the Task Menu select Input Range (Auto/Manual) to open the Auto Range Display. The previous
figure depicts the Auto Range Display.
2. Select the Setup Menu to open the Auto/Manual Range Setup window. Use this window when you
want to change the default values (following figure).
3. Enter the desired values and click the <OK> button (following figure).
Maximum FSV is the high-end limit for the input voltage.
Note that 25.7 V is the highest possible FSV for a ZonicBook.
Minimum FSV is the low-end limit for the input voltage.
Upper Limit (%) defines the highest acceptable peak input voltage
for the selected FSV, i.e., Current, Minimum, or Maximum. Thus, if
our selected FSV was 0.2 V and we had an upper limit of 90%; then
our upper limit in volts would be 0.18 V. An example follows as to
how exceeding this value causes a range adjustment.
Lower Limit (%) defines the lowest acceptable peak input voltage
for the selected FSV, i.e., (Current, Minimum, or Maximum). Thus,
if our selected FSV was 0.2 V and we had a lower limit of 10%;
then our actual low limit in volts would be .02 V.
Auto/Manual Range Setup
Example:
Maximum FSV set at 25.7 V
Minimum FSV set at 0.2 V
Upper Limit set at 90%
Lower Limit set at 10%
Increasing Factor set at 1.5
Decreasing Factor set at 1
Increasing Factor is the factor by which the Current FSV will
increase, should the peak exceed the upper limit.
Decreasing Factor is the factor by which the Current FSV will
decrease, should the peak not reach the lower limit. Keeping the
decrease factor as “1” will result in no decrease of the Current FSV.
Setting the Decrease Factor to 0.8 would cause the Current FSV to
decrease to 80% of its value if the peak fell short of the low limit.
In this example we have set the radio
button for Current FSV instead of
Minimum or Maximum (note 2). The
starting value, in the example,
is 0.20 V.
In the first iteration we see that we
have a peak of 0.19 V. This falls
outside of our band of 0.02 to 0.18 V
that was established by our upper and
lower limit percentages; i.e., 90% of
the Current FSV and 10% of the
FSV.
An Example of Auto-Ranging
As a result, the Current FSV is increased by a factor of 1.5 (our Increasing Factor) and the Current
FSV becomes 0.30 V. Our limits, in volts, also changed since we are now looking at percentages of
0.30 volts instead of the same percentages of 0.20 volts.
In the second iteration of our example, we see a 0.22 volt peak. This value is within our established
limits so the Current FSV does not change.
Note 1: If the Capture Mode is the Input Channel (Trigger Mode), the Auto Range process waits for a trigger.
Note 2: A Start FSV of Minimum or Maximum can selected instead of Current FSV, as in our example.
Minimum FSV is the default.
2-6 Menus and Windows
09-19-02
eZ-Analyst
Page 74
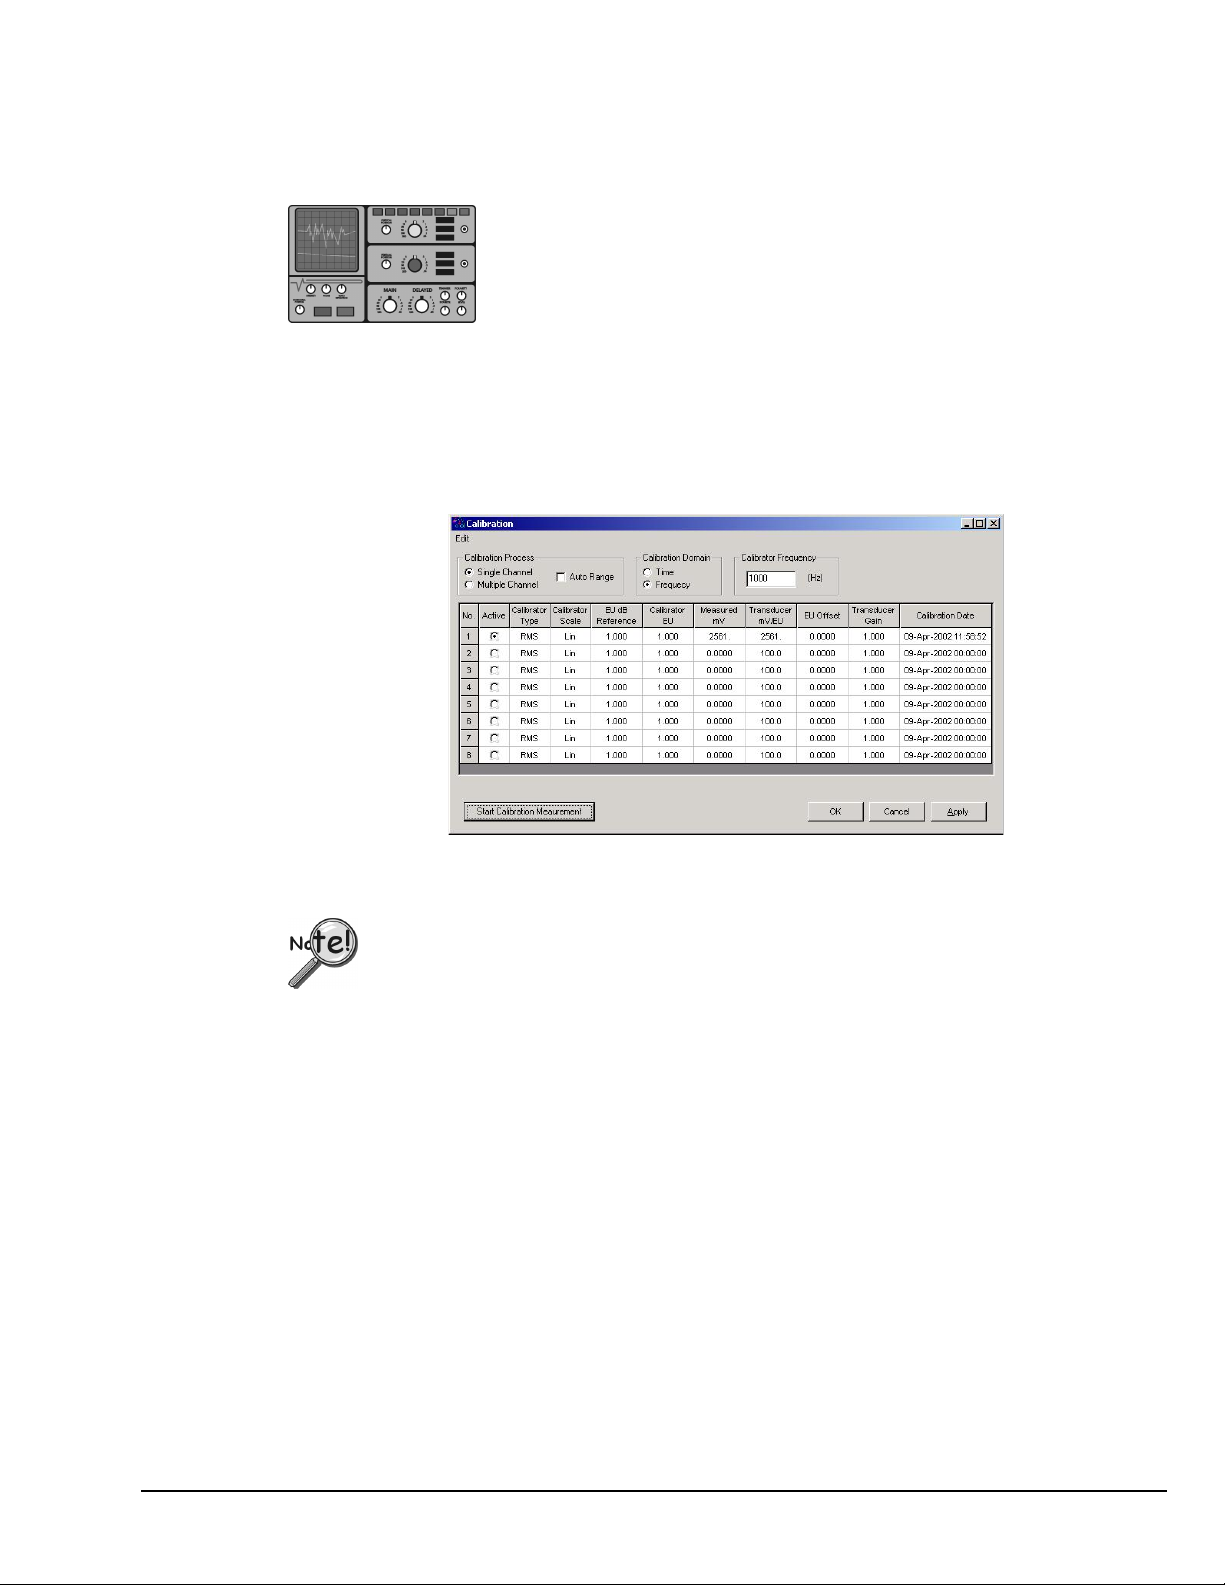
Task Menu > Calibration
When calibration is performed, a signal of known Peak level [or RMS value] is supplied to a transducer that
is connected to an active input channel. An accelerometer calibrator or piston phone is typically used to
generate the calibration signal for vibration sensors and microphones, respectively.
eZ-Analyst includes a Calibration window for selecting the channels to be calibrated and for entering several
signal-related parameters. In addition, the calibration is actually started from the window.
You can access the Calibration window from the Task Menu, as well as from the Input/Output Channels tab.
Examples:
Accelerometer calibrators typically make use of linear engineering units and, as
their name implies, are used for calibrating accelerometers.
Piston phones are most often used for calibrating microphones. Piston phones
typically make use of decibel (dB) engineering units.
Calibration Display Screen
When a channel is calibrated, the number of averages used will be 5, or the number
➣
that is designated in the “No. of Averages” field (located on the Analyzer Tab). The
greater of the two values will be used, automatically.
When a channel is calibrated, the blocksize of the acquisition will automatically be
➣
4096, or the blocksize value that is stated on the Analyzer Tab, providing it is 4096
or higher.
A discussion of the various regions of the Calibration window now follows.
The section concludes with an example.
eZ-Analyst
09-19-02
Menus and Windows 2-7
Page 75

Calibration Process
Single Channel
Used to select one active channel at a time. When the calibrator only has one
channel output, the Single Channel method must be used. When Single
Channel is selected, the “Active” column shows a radio button next to each
channel.
Multiple Channel
Used to select two or more channels for simultaneous calibration. This is
only an option when the calibrator offers more than one output. When
Multiple Channel is selected, the “Active” column shows a checkbox next to
each channel.
Auto Range
Auto-range sets the input full-scale voltage (FSV) range for the input
channels to be calibrated. FSV is determined by measuring a representative
sample of real-time data.
Calibration Domain
With the use of Fourier Transform, any signal can be viewed from a time domain or a frequency
domain. Either domain can be selected for use in the calibration process.
Time
Frequency
The overall value is computed using time domain data.
The overall value is computed with frequency domain data by summing up
frequency component of FFT spectrum.
Calibrator Frequency (Hz)
This field is used to enter the frequency setting of the calibrator. The analysis frequency, which is
twice this frequency, is used if possible. Otherwise, the maximum allowed analysis frequency is
used.
Columns on the Calibration Window
No.
This column displays channel numbers [1, 2, 3, … etc.] for easy reference to
their associated cells. The channel numbers, being for display indication
only, are fixed and can not be edited.
Active
When “Single Channel” is selected, you can click on a radio button in the
“Active” column to enable one channel for calibration. When the calibration
is complete, select the radio button for the next channel to be calibrated.
When “Multiple Channel” is selected, the radio buttons are replaced by
checkboxes. Ensure that each channel to be calibrated has the associated box
checked, and that the remaining channels remain unchecked. For multiple
channel applications note that you can click on the column label, i.e., the
word “Active” to simultaneously check or uncheck all channel checkboxes in
the column.
Note: The channel settings in the Calibration window are independent of the
selections that appear in the Input Channel Setup window. Only
active channel shows up at calibration window.
2-8 Menus and Windows
09-19-02
eZ-Analyst
Page 76

Calibrator Type
This column is used to select Peak or RMS* as the calibrator type. Highlight
a cell, or range of cells, in the grid, then select Peak or RMS from the popup
menu.
Calibrator
Scale
EU dB
Reference
Peak
Uses the peak amplitude of the spectrum around the specified frequency of
the calibration signal.
RMS
Uses a compensated overall level calculation to determine the RMS level of
the calibration signal, as specified in the Units field.
*RMS – Root-mean-square, is the square root of the arithmetic mean of the
squares of a set of numbers.
This column is used to select the calibrator scale to linear or to decibel.
Select Lin if the calibrator is in linear scale.
Lin
Select dB if the calibrator scale is dB.
dB
Note: While there are several definitions to dB, in our application we are using dB to
express the ratio of the magnitudes of two quantities equal to 20 times the
common logarithm of the ratio.
The formula for dB is:
dB = 20 log (x/dBEUref)
This field is used to enter the Engineering Units dB reference.
Calibrator
EU
Measured mV
Transducer
mV/EU
EU Offset
dB EU Reference is applied to displayed data when the Y-axis scale is set to dB.
This is valid only for frequency domain data.
Note: The dB Reference (Volt) can be changed simultaneously for all channels from the
associated entry box in the FFT Setup Tab, page 2-31.
The formula for dB display for Unaveraged Spectrum, Averaged Spectrum, and FRF is:
dB = 20 log (x/dBEUref)
The formula for dB display for Autospectrum, Cross Spectrum, and PSD is:
dB =10 log [x/((dBEUref)^2)]
This field is used to set the Calibrator’s Engineering Units.
Displays the measured value of the channel in milli-volts.
The Transducer mV/EU value can be entered manually, or by the measurement process.
Highlight a cell, or cells, in the grid before typing a value in the data entry box. Then
press the <OK> button to accept the value. All other fields linked to this value are
updated when the value is accepted.
mV/EU= Volts/Units * Transducer Gain
EU Offset is used for DC signal compensation. Offset is added to, or subtracted from
the measured EU value.
eZ-Analyst
Transducer
Gain
Transducer Gain is used as auxiliary scaling to compensate for the transducer amplifier
gain. Gain is a multiplied function.
09-19-02
Menus and Windows 2-9
Page 77

Calibration
Date
This column displays the date and time of the last calibration. If any channel value
changes, even if the original number is restored, the calibration date and time are
automatically removed for that channel.
Start
Calibration
Measurement
Clicking this button starts the calibration process for all selected channels. At the
completion of the calibration, the measured mV and the Transducer mV/EU value for
the applicable channels are automatically updated.
Calibration Procedure, an Example
Accelerometer type - Piezotronics 303A03
Calibrator - Piezotronics 394B05 - 1.02 G (RMS) at 80Hz
Unit of acceleration - in/sec^2
1.02 G RMS is equivalent to 393.811 in/sec^2 (1G=386.089in/sec^2).
Note:
This is a linear scale, thus we will be selecting Lin in the Calibrator Scale column.
In this example we will be calibrating channel 1.
1. Attach the accelerometer to the calibrator (signal source). Connect the other end of the accelerometer
cable to the channel 1.
2. Set the FSV into a proper range (i.e. 32.4 mV) in the Input Channels Setup window,
then click the <Apply> button.
3. Set the desired blocksize in the Analyzer Tab if a block size of greater than 4096 is desired.
4. Set the “No. of Averages” in the Analyzer Tab if an average count of greater than 5 is desired.
5. Open the Calibration Window from the Task Menu, or from the Input/Output Channels Tab.
6. Select “Single Channel.”
7. Select “Auto Range,” if desired.
8. Select a Calibration domain. In this case, either “Time” or “Frequency” can be selected.
9. Enter 80 Hz in the Calibrator Frequency field.
10. Ensure the radio button for Channel 1 is enabled (in the Active column.)
11. Select RMS for the Calibrator Type.
12. Select Linear in the Calibrator Scale field.
13. Leave EU dB Reference set at 1.000. Note that this step can be skipped when linear scale is used.
14. Set Calibrator EU at 1.02 ; implying an engineering unit of 1G.
15. Enter 393.811 in the Transducer mv/EU field.
16. Leave the EU Offset at 0.0000. We are assuming no offset in this example.
17. Leave 1.000 as the Transducer Gain. No amplifier or attenuator is being used in our example.
18. Click <Apply> so your new values will not be lost.
19. Click the <Start Calibration Measurement> button to begin calibration.
2-10 Menus and Windows
09-19-02
eZ-Analyst
Page 78

File Menu
The File Menu provides a means to print plotted data, as well as open, save, and export data files.
Open Time History Data (.thd or .dsc)
Used to locate and open saved files. ZonicBook uses files with .thd extensions. WaveBook uses files with
.dsc extensions.
Save [or Open] Multiple Data Set (.mds)
These two menu items provide a means of saving [or opening] function files. Time and auto-spectrum data is
saved. If there is any reference channel cross-spectrum is saved for all channel pairs. The file extension is
.mds.
Save [or Recall] Hardware Setup (.set)
These two menu items provide a means of saving [or recalling] current settings and processing conditions.
In addition, .thd files and .mds files can be used to recall setup conditions, because these file-types include
setup conditions in addition to measured data. Note that only the setup condition is recalled.
Save [or Recall] Plot Setup (.pset)
These two menu items provide a means of saving [or recalling] the current plot condition, such as window
locations and window content, including: channel numbers, function type, axis-type, and range. These files
can be recalled at a later date to process customized plot conditions.
Without user intervention, the plot setup file is automatically saved with .mds, .dsc, and .thd files.
You can have plot setups automatically recalled whenever you recall data files. To select this
option, open the Preferences window [accessed through the Edit pull-down menu] and check
the box labeled “Recall Plot Setup When Recall Data Files.”
Authorization*
Exit
The standard print window associated with your specific computer will open. Select a printer and the
number of copies needed before clicking <OK>.
Note:
In regard to printing, black plot backgrounds changed to white.
Opens an Authorization Dialog box that provides a means of entering an authorization code to enable the
features of purchased software, i.e., eZ-FrequencyView, eZ-TimeView, or eZ-Analyst. The dialog box
includes an option to run a 30-day trial version of eZ-Analyst.
*For eZ-Analyst, “Authorization” is located in the Help pull-down menu as this document goes to print.
This menu item closes the eZ-Analyst application.
eZ-Analyst
09-19-02
Menus and Windows 2-11
Page 79

2-12 Menus and Windows
09-19-02
eZ-Analyst
Page 80
Edit Menu
Edit Menu >
The Edit Menu provides a means of configuring eZ-Analyst in regard to both functionality and appearance.
The menu contains the following selections, each of which is detailed in the subsequent sections:
Configuration Window…… 2-13
Input/Output Channels …… 2-21
Playback Setup Window…… 2-37
Display Preferences Window…… 2-39
Configuration Window
The Configuration item provides a means of changing the majority of eZ-Analyst settings in regard to
collecting data and in determining how the collected data is manipulated. The Configuration selection
displays the Configuration Window with one of several tab dialogs displayed. Possible tab displays for
both eZ-Analyst and the “view” programs are as follows:
Edit Menu > Configuration Window
Tabs in eZ-Analyst Corresponding Tabs of the
“View” Programs
Analyzer Tab…… 2-15 Acquisition Setup Tab
Input/Output Channels Tab …… 2-21 Input Channels Tab
Recording Setup Tab…… 2-25 n/a
Block Rejection Tab……2-29 n/a
FFT Setup Tab……2-31 Miscellaneous Tab
Does not apply to eZ-PostView.
Octave Setup Tab …… 2-35 Octave Setup Tab
Does not apply to eZ-PostView.
Does not apply to eZ-TimeView.
eZ-Analyst
09-19-02
Menus and Windows 2-13
Page 81
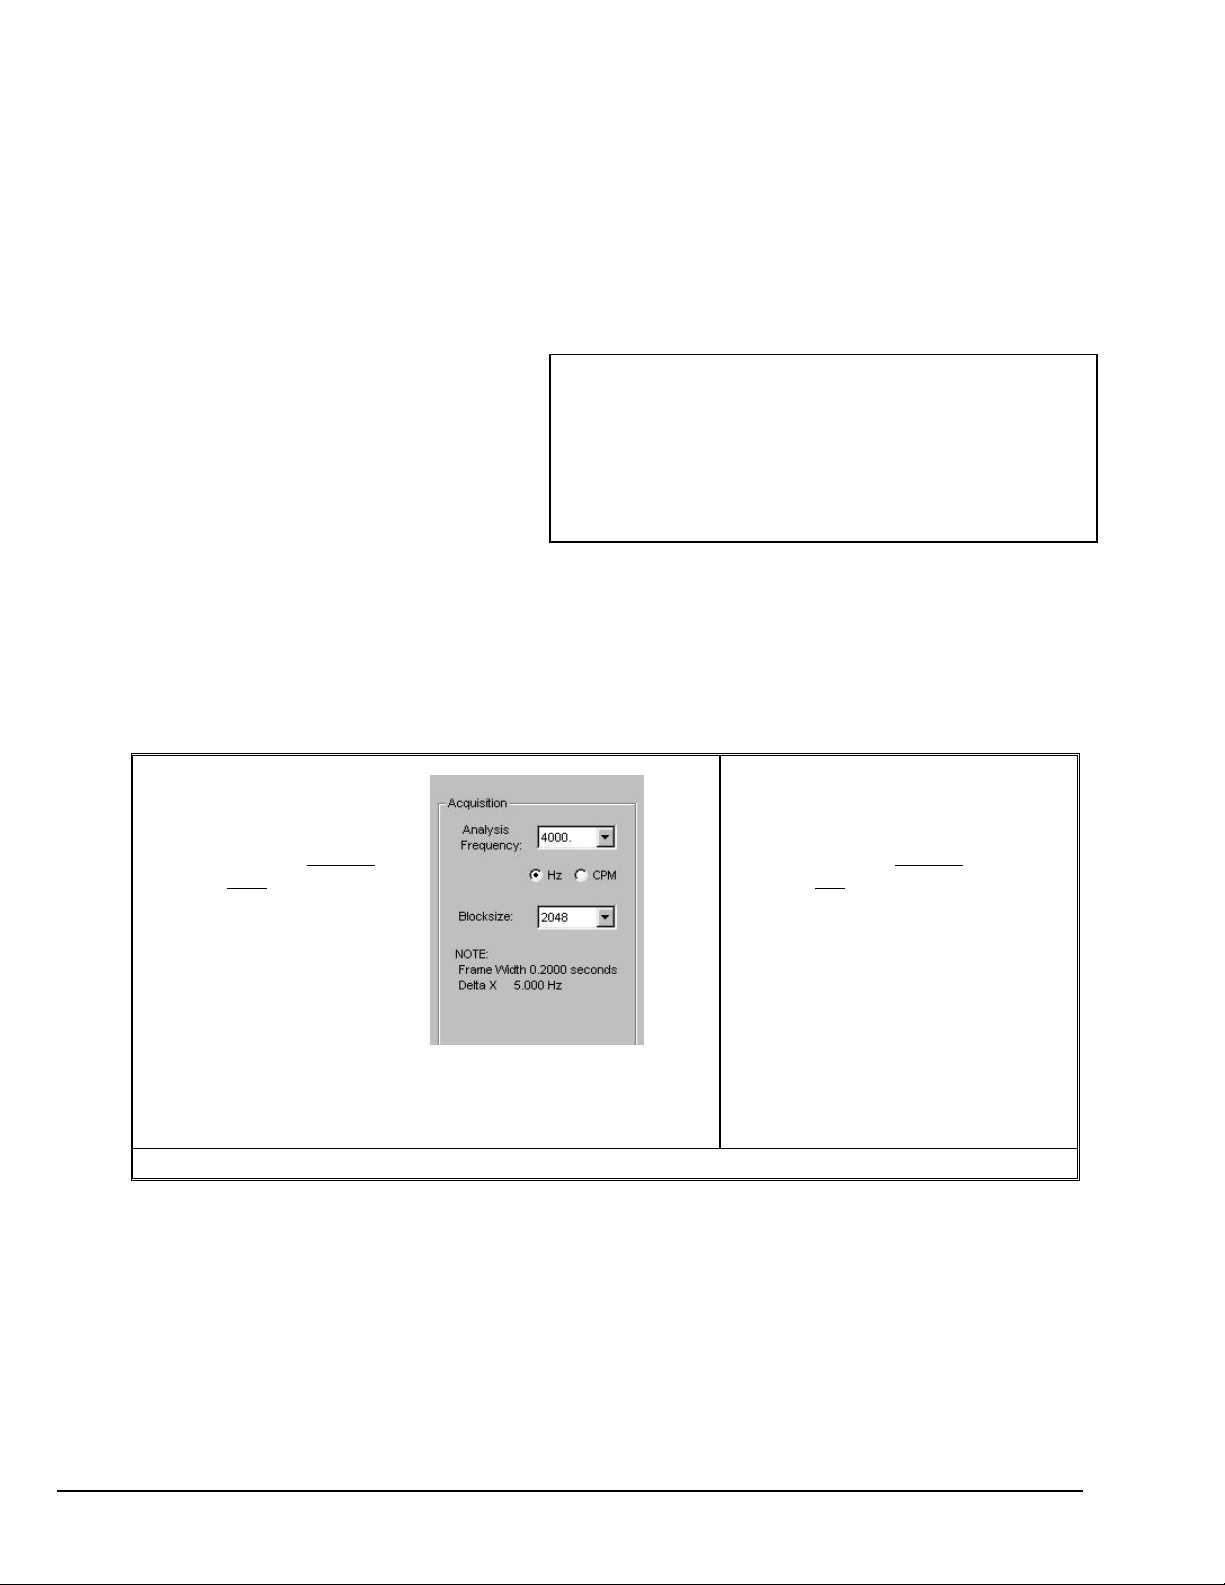
A Note Regarding Frequency Resolution
This note pertains to frequency resolution and is related to the values seen in the Analyzer Tab’s Acquisiton Panel
(next two figures). The frequency resolution is related to the Analysis Frequency (bandwidth) and the Blocksize (the
number of data points in one block of data). The following equations apply.
w = b / 2.56f
Where:
w = Frame Width
b = Blocksize
2.56 is a constant
f = Analysis Frequency
Note: With other factors unchanged –
Increasing Blocksize increases Frequency Resolution.
Increasing Analysis Frequency decreases Frequency Resolution.
The lower the “Delta X” frequency, the higher the
Frequency Resolution. Thus, a Delta X of 5 Hz indicates
a higher frequency resolution than does a Delta X of 80 Hz.
Delta X = 1/w
Where:
Delta X is the frequency resolution
w = Frame Width
the lower the Delta X, the higher the resolution.
With these equations we can see how the Frame Width and Delta X are calculated.
Example 1 (see figure)
Given:
Analysis Frequency 4000 Hz
Blocksize 2048
w = b / 2.56f
= 2048 / (2.56)(4000)
= 0.2 seconds
Example 2 (no figure)
Given:
Analysis Frequency 4000 Hz
Blocksize 128
w = b / 2.56f
= 128 / (2.56)(4000)
= 0.0125 seconds
Delta X = 1/w
= 1 / 0.2
= 5 Hz
Note: A Delta X of 5 Hz indicates a higher frequency resolution than does a Delta X of 80 Hz.
Higher frequency resolutions indicate that the signal trace will be based on more data points for a given time frame.
The higher the frequency resolution, the smoother the trace will be.
2-14 Menus and Windows
Acquisition Panel on
the Analyzer Tab
The values shown pertain to
example 1.
09-19-02
Delta X = 1/w
= 1 / 0.0125
= 80 Hz
eZ-Analyst
Page 82
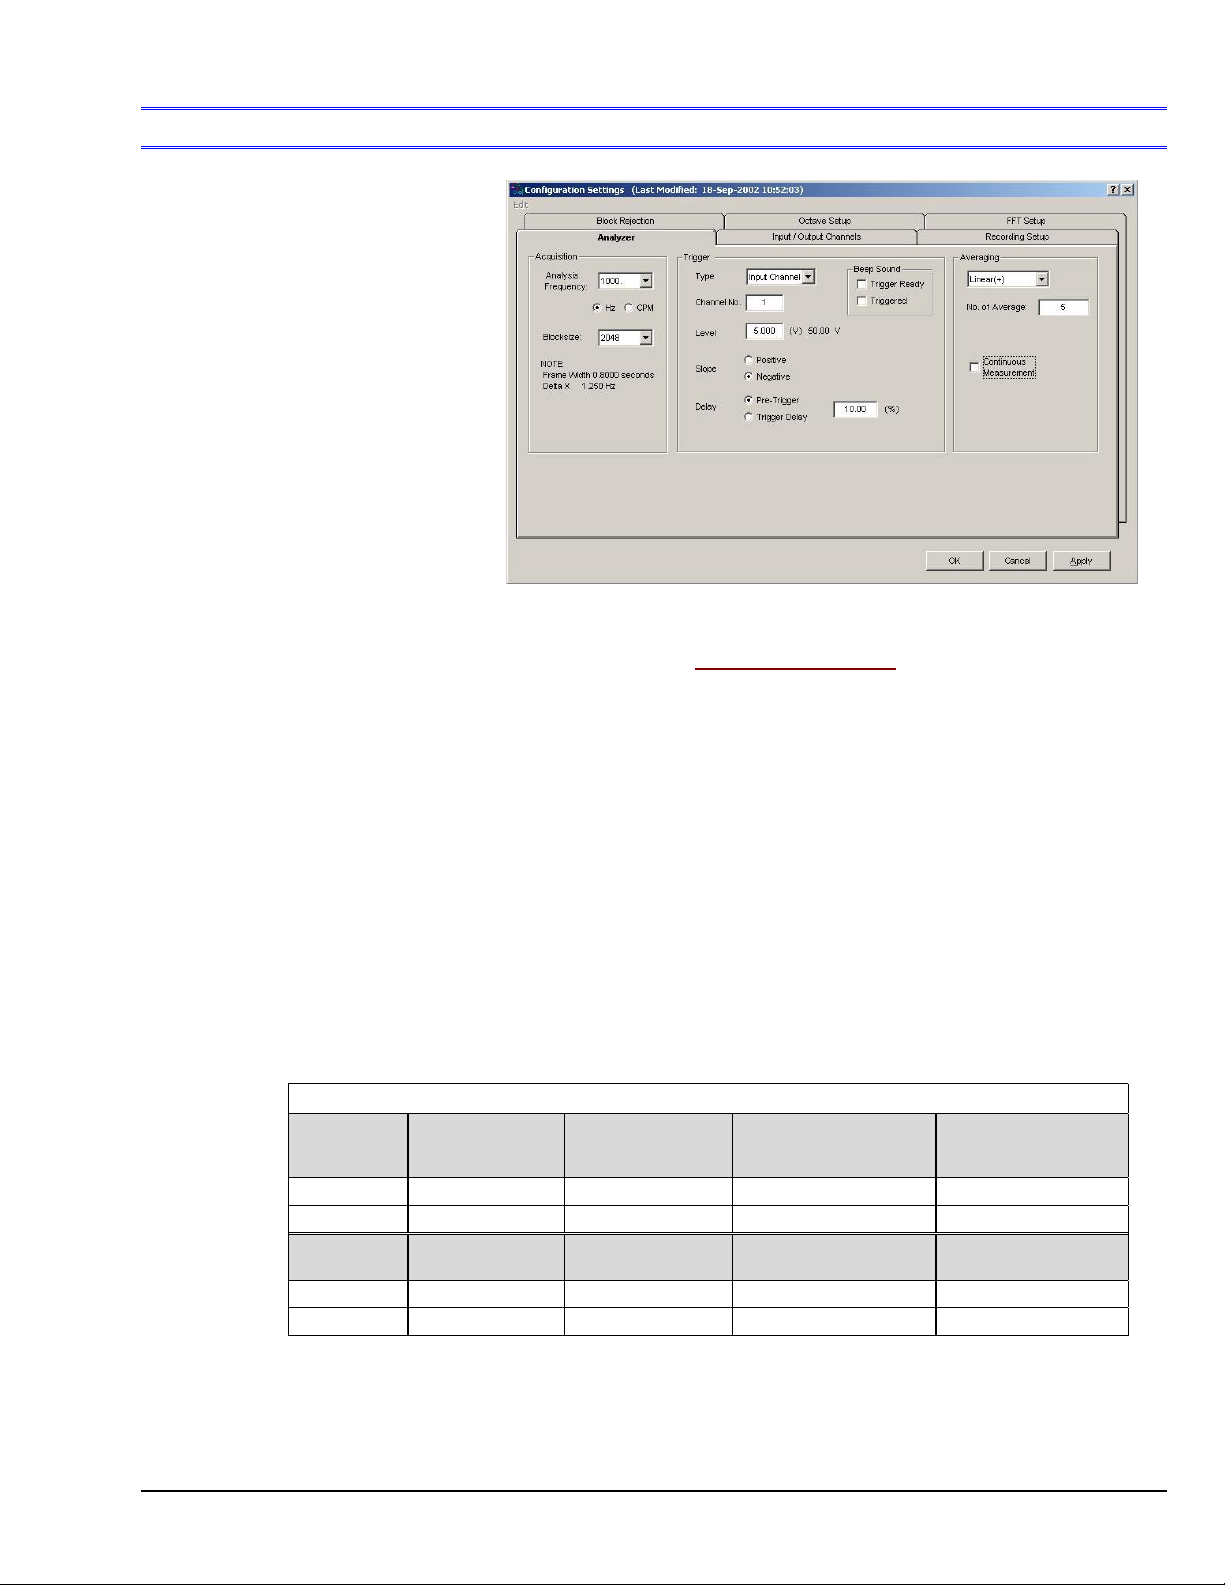
Edit Menu
> Configuration >
The Analyzer Tab
consists of three
panels:
Acquisition,
Trigger, and
Averaging
Analyzer Tab
Analyzer Tab
Edit Menu > Configuration >
Analyzer Tab: Acquisition Panel
The Acquisition Panel provides a means of setting Analysis Frequency and Blocksize. A note regarding the
relationship of Analysis Frequency and Blocksize, to Frame Width and Delta X, is located on the preceding
page.
Analysis Frequency: This section of the Acquisition Panel is used to set the maximum bandwidth for
analysis. Frequency components above the Analysis Frequency setting will result in aliasing errors in the
data. The bandwidth measurement can be set for Hertz (Hz) or Cycles Per Minute (CPM) by use of radio
buttons. Note that the processing time for a selected blocksize is fixed by CPU speed.
Increasing the analysis frequency results in: (a) the hardware streaming packets of data more frequently to
the software, (b) a greater demand placed on the software to process the data blocks, and (c) less time
between data blocks available for task performance
Blocksize: This section of the Acquisition Panel is used to set the number of data points in a frame or block
of data. Acceptable blocksizes range from 128 to 16384 data points.
Blocksize can be viewed as chunks, or packets of data, that move through eZ-Analyst’s software algorithms.
As blocksize increases, the amount of data increases, the time required to acquire a block of data increases,
and the amount of space required to save the data increases.
Effects of Changing Analysis Frequency or Blocksize
Changing:
Anal ysis
Frequency
Increase Larger disk file Faster Faster screen updates
Decrease Smaller disk file Slower Slower screen updates Higher
Changing:
Blocksize
Increase Larger disk file Slower Slower screen updates
Decrease Smaller disk file Faster Faster screen updates Lower (higher Delta X)
Note: The effects indicated by the table pertain to changing the Analysis Frequency while the Blocksize remains
unchanged, and visa versa. If both the Analysis Frequency and the Blocksize are changed [for the same
acquisition] the effect on the other variables can differ, depending on the magnitude and direction of change
that was made to Analysis Frequency and Blocksize.
Block Acquisition-Time: The time it takes to acquire one block of data.
*
File Size
(Recorded Data)
File Size
(Recorded Data)
Block
Acquisition-Time*
Block
Acquisition-Time*
(Note)
Data Displayed in
Scope Mode
Data Displayed in
Scope Mode
Frequency
Resolution
Lower
(higher Delta X)
(lower Delta X)
Frequency
Resolution
Higher (lower Delta X)
eZ-Analyst
09-19-02
Menus and Windows 2-15
Page 83
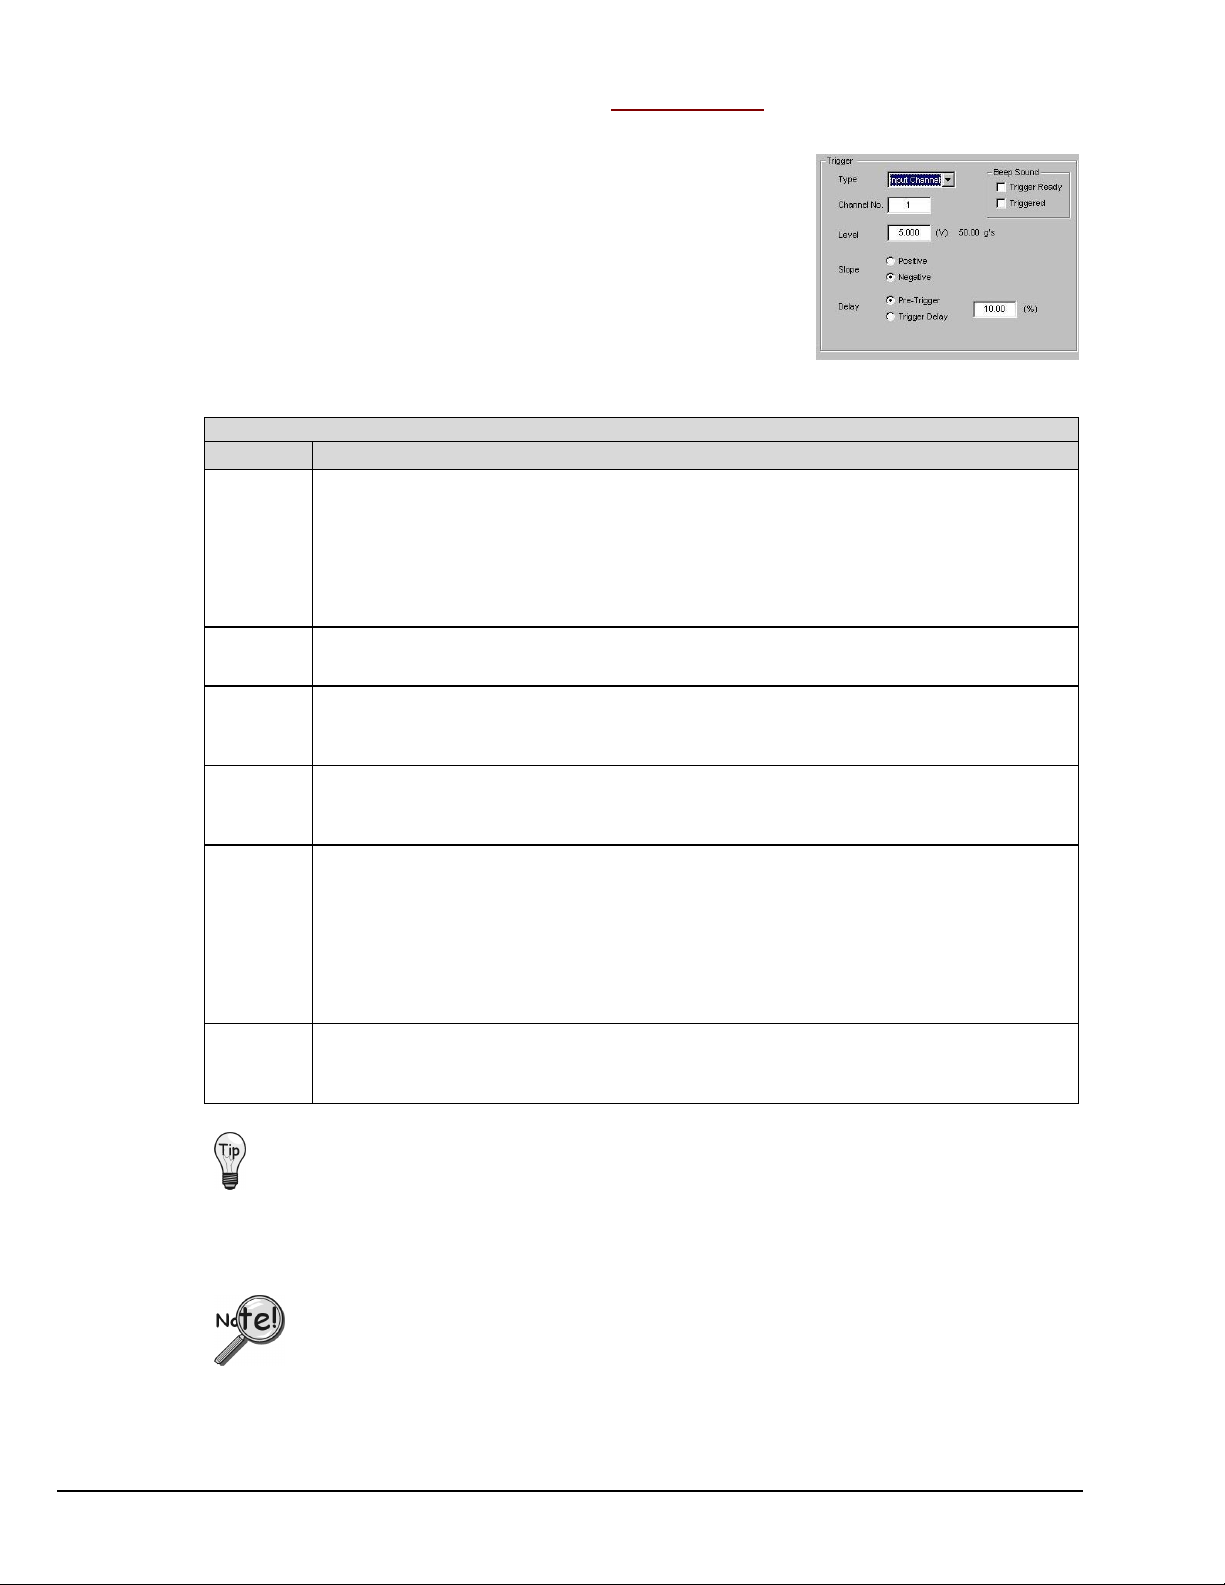
Edit Menu > Configuration >
The Trigger Panel provides a means of setting and defining trigger-related parameters.
Triggering defines how eZ-Analyst is to begin the task of capturing
and processing data.. To capture data without using a trigger, select
Free Run from the pull-down list. To capture transient data, select
Input Channel from the pull-down list [as indicated in the figure to
the right] and specify the applicable parameters.
A Breakdown of the Analyzer Tab’s Trigger Panel
Category Description
Type
If “Free Run” is selected as the Type, the data acquisition and processing will begin as soon
as the <Acquire> button is clicked. Select “Free Run” if you want to measure data in a
continuous or Scope mode manner [from an active system].
If “Input Channel” is selected as the Type, the data acquisition and processing begin after
the signal on the specified channel reaches the defined trigger conditions. Select “Input
Channel” if you want to capture transient data.
Analyzer Tab: Trigger Panel
Trigger Panel
on the Analyzer Tab
Channel
No.
Level
Slope
Delay
Beep
Sound
Specifies the channel that the trigger condition applies to.
This value is the point that the signal must pass through to be considered as a candidate for
a trigger. When using a ZonicBook this value is entered as a percentage of FSV. When using
the WaveBook this value is entered as volts and must be within the select FSV.
The slope radio buttons are used to selects the “
decreasing (falling) slope of the signal that defines a trigger condition. The signal must be on
the defined slope before it can be considered for use as a trigger
Selecting the ”
percentage of data [a specified percent of the frame size]
In the previous figure we see that “Pre Trigger” is selected for 10.00 (%).
Selecting the “
percentage of data [a specified percent of the frame size]
we selected “Trigger Delay” and entered 10.00 in the percent box, we would see 10% of the
data skipped, in relation to frame size.
If desired, check a box so a “beep” will sound when the Trigger is Ready, or when the
system has Triggered. If rapid triggering/acquiring data events are taking place in
succession, then the beep sound may become erratic.
Pre-Trigger”
Trigger Delay”
radio button instructs the system to
radio button instructs the system to
Positive
” increasing (rising), or “Negative”
skip
a specified
a specified
capture
to the start of trigger event.
prior
the start of trigger event. If
after
Select Free Run from the Analyzer Tab’s Trigger Panel if you want to measure data in a
continuous or Scope mode manner [from an active system].
To capture transient data, go to the Configuration dialog found under the Edit menu and on
the Analyzer tab select Input Channel and specify the applicable channel and conditions.
2-16 Menus and Windows
Trigger-related items [in the Analyzer Tab or Recording Setup Tab] being locked-out
indicates that the current mode is for playback operation. If so, perform the following:
(1) close the Configuration Window
(2) select “Measurement Mode” from the Task pull-down menu
(3) open the Configuration window
09-19-02
eZ-Analyst
Page 84
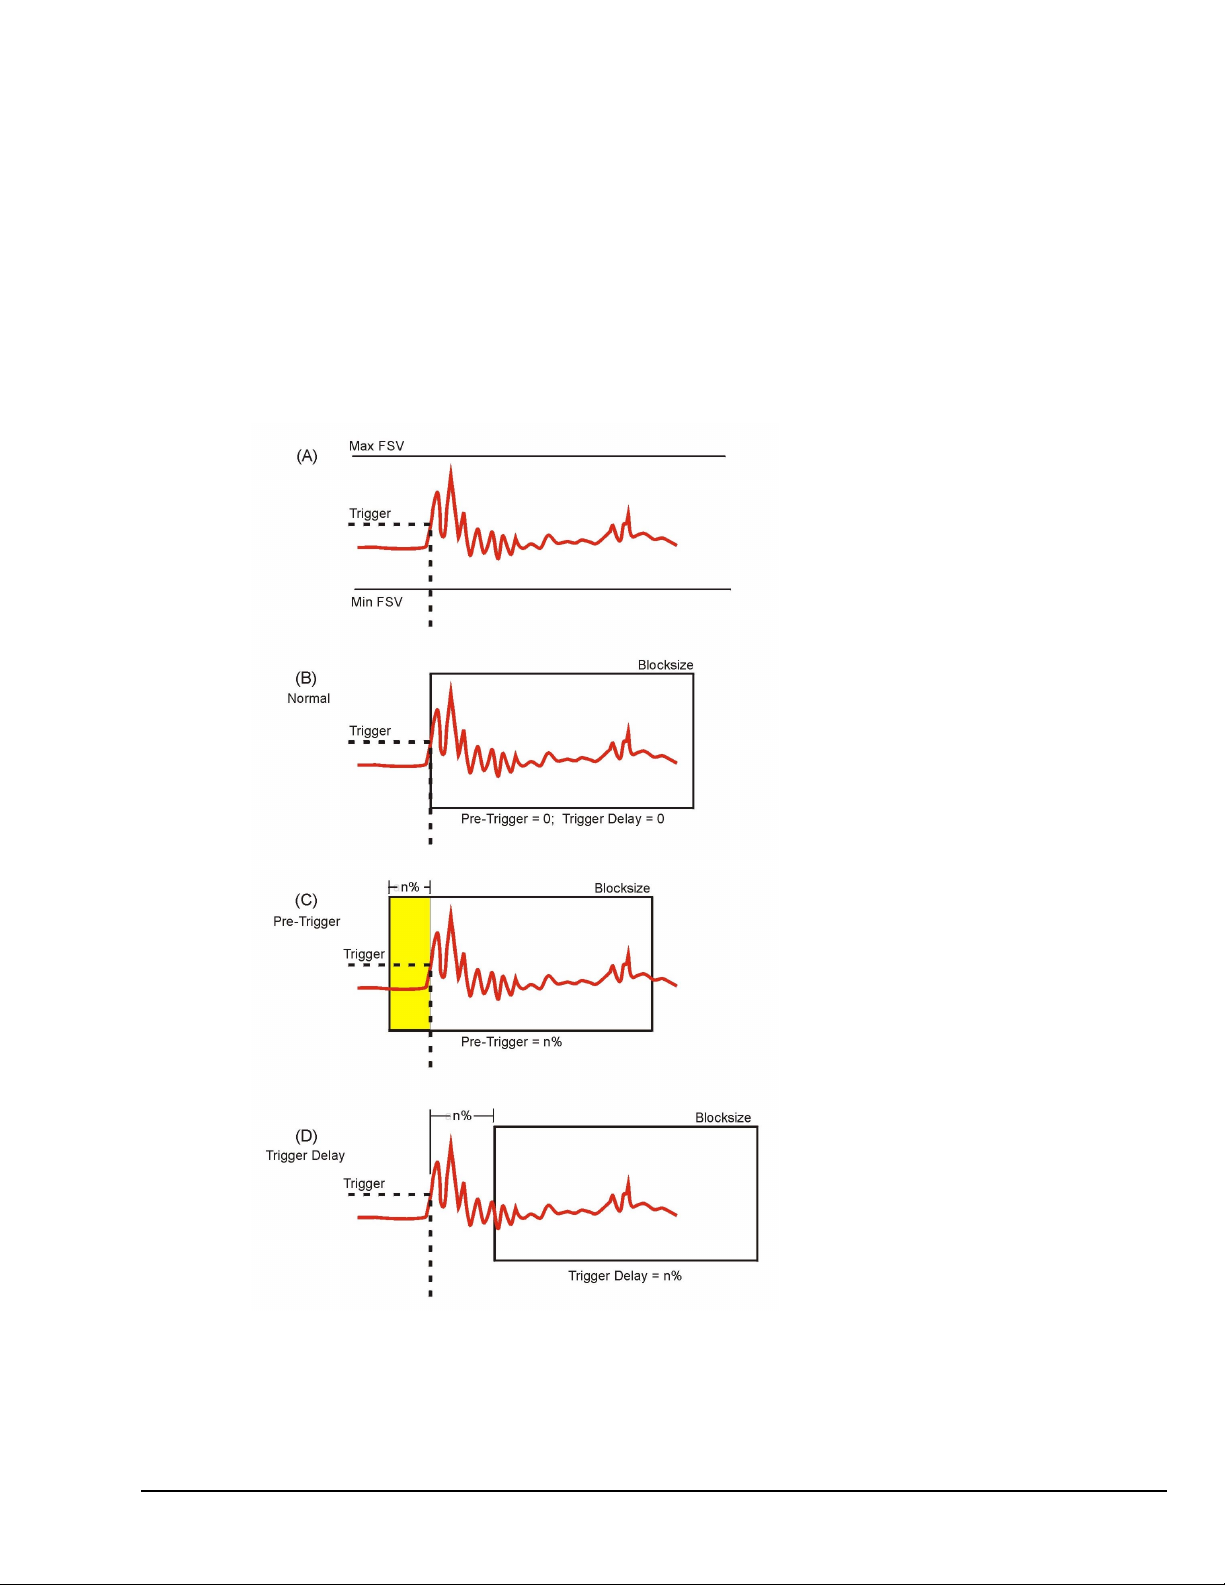
Capturing Transient Data
Setting eZ-Analyst to trigger on an Input Channel captures transient data when the associated parameters are
correctly specified. The following sections discuss the associate parameter and how they apply to a signal
such as an impact hammer striking an object. The signal show is from an accelerometer located in the
hammer’s head.
Set Trigger level:
The first and most important parameter is the trigger level. This parameter specifies the level in which the
signal must pass through in order for an acquisition process to begin. An ideal level will assure that the
signal is well above any noise or erroneous movement that will cause a trigger. An ideal level will also
assure that the level is not above the maximum output of the signal source. Violating these ideal conditions
can result in either a premature trigger or no triggering at all. For example, if a signal has a noise floor of 0.5
volts and the trigger level is set to 0.2 volts the acquisition will always trigger for obvious reasons.
Conversely, if the maximum signal output is 5.0 volts and the trigger is set to 5.5 volts the acquisition will
never trigger.
(A) Setting Signal Position
Once an acceptable trigger level has been
ascertained, positioning the signal within a
block of sampled data (and in the display
window) is the next consideration. Often it
is necessary to capture the events that lead
up to the trigger point. If this is the
situation then positioning should be set for
Pre-trigger capturing. On the other hand, if
the signal of interest occurs after the
trigger point, then positioning should be set
for Trigger-Delay capturing.
Shifting a Waveform with Pre-Trigger and Trigger Delay
(B) Normal Trigger
Normal Triggering is obtained by
specifying zero for the Pre-Trigger and
zero for the Trigger Delay; where the
trigger point occurs at the first sample
point as pictured in the figure to the left.
(C) Pre-Triggering
To capture information before the trigger
point, select Pre-Trigger and specify a
percentage of the blocksize (see note). For
example, if the blocksize was set at 1024
samples, then setting the Pre-Trigger to
10% would result in capturing 102 sample
points that exist prior to the trigger point.
This has the effect of shifting the
waveform to the right as pictured in the
figure.
(D) Trigger Delay
Trigger Delay is the opposite of PreTrigger. The Delay causes eZ-Analyst to
wait “n%” samples before it begins filling
a block of data. This has the effect of
shifting the signal to the left.
eZ-Analyst
Note: For ZonicBook applications, the trigger level is specified in percentage of full-scale voltage (FSV).
For WaveBook applications, the trigger level is an absolute signal level that must be within the
physical input range (also FSV).
09-19-02
Menus and Windows 2-17
Page 85
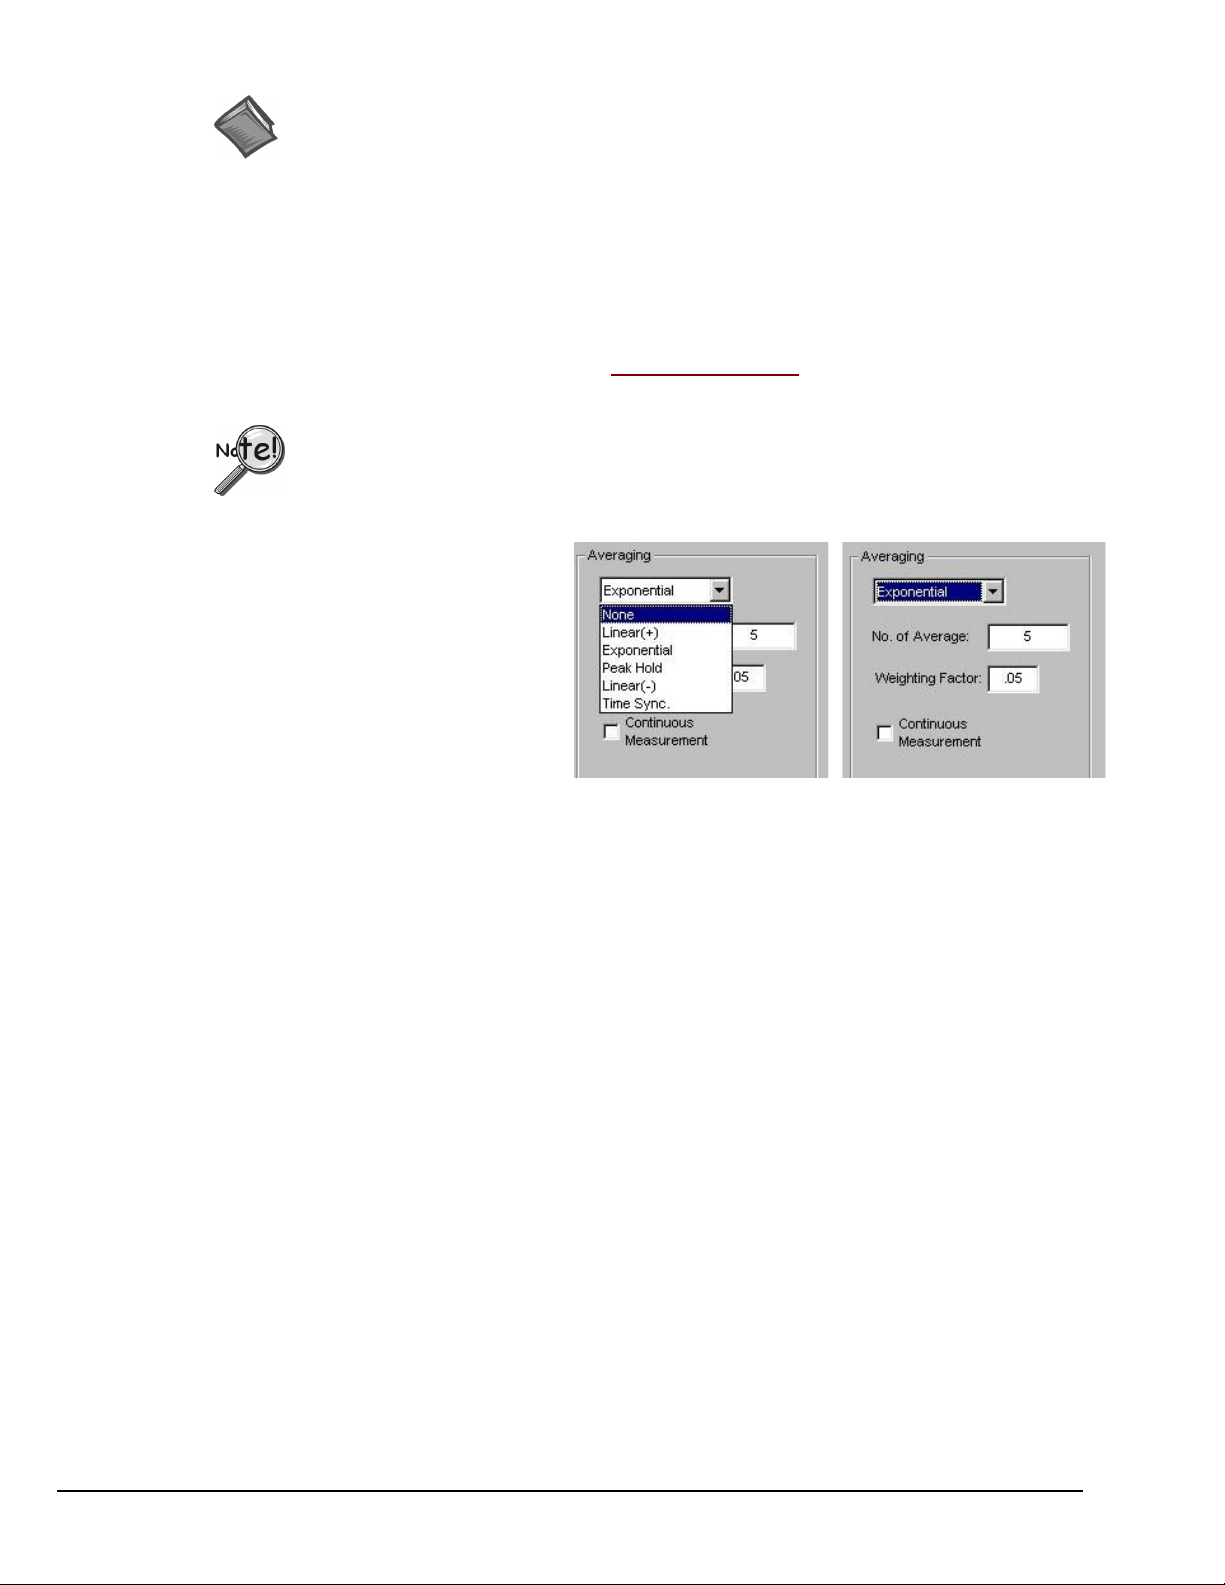
Reference Notes:
The following sections of this document contain information that closely relates to the subject of
Capturing Transient Data. Reading over the following material should improve your
understanding of the important concepts involved.
➣
Capturing Transient Data, page 2-17.
➣
Block Rejection Tab, page 2-29.
➣
Considerations Regarding Double Hammer Rejection, page 2-30.
➣
Recording Setup, page 2-25.
Edit Menu > Configuration >
The Averaging Panel is used to select the type of averaging that will be calculated during data acquisition.
To apply averaging to time-demand data, the Function View Window must be changed
➣
to a Windowed “Time Function,” otherwise all averaging will be applied to a spectral
date.
Averaging can be used to decrease the noise in a measurement.
➣
In the figure to the right, the first scenario
shows the pull-down menu expanded,
revealing the types of averaging that can be
selected. The second scenario shows that
“Exponential” has been selected.
Exponential makes use of a Weighting
Factor, which is not used by the other
averaging types.
A brief description of averaging types and other panel terms now follows.
Linear (+): All blocks of data are treated equally in terms of their effect on the averaged result.
Exponential: Similar to linear averaging, Exponential requires a weighting factor that either increases or
decreases the effect of each new data block on the resultant average.
Weighting Factor: The Weighting Factor either increases or decreases the effect of each new data block on
the resultant average when Exponential Averaging is used.
Analyzer Tab: Averaging Panel
Averaging Panel of Analyzer Tab (2 Scenarios)
Peak Hold: The resultant block of data is a collection of points that represent the peak amplitude for each
point in the block. With each new block of data, the current data is compared with the new data on a point
by point basis. The highest amplitude for each point in the block is retained.
Linear (-): Also known as Negative Averaging; Linear (-) Averaging is a technique used to identify the
natural frequencies of in-service machines that cannot be shut down for analysis. Linear (-) Averaging is a
two step process. First, a reference average is acquired. Second, a normal linear average is acquired for each
frame. The running average is subtracted from the reference average and the result is displayed. The first
time you attempt to start data acquisition after you select Linear (-) averaging, the Negative Averaging
Setup/ Measurement window opens.
Time Sync: Time synchronous averaging uses a keyway, or a similar point of reference, as a trigger. The
blocksize is set to allow enough time for at least one full revolution. This must be performed in Scope
Mode. Channel trigger mode should be used in conjunction with this selection.
Number of Averages: This number specifies the condition for terminating a data acquisition sample. After
the number of averages (blocks/frames of data) have been captured and averaged, the eZ-Analyst will
automatically stop taking new data. This sample can then be saved. If the number of averages is set to zero,
acquisition is continuous and must be halted by the user.
2-18 Menus and Windows
New Average = ((New Data) * A.W.F.) + (Old Average * (1-A.W.F))
09-19-02
eZ-Analyst
Page 86

Continuous Measurement: Checking this option restarts the averaging process without user intervention.
Note that the data itself is not continuous between measurements. This option is not meaningful for
non-averaging operations. The section entitled Measurement Panel, on page 2-46, contains additional
information.
Reference Notes:
The following sections of this document contain information that closely relates to the subject of
Averaging. Reading over the following material should improve your understanding of the
important concepts involved.
➣
Capturing Transient Data, page 2-17.
➣
Block Rejection Tab, page 2-29.
➣
Considerations Regarding Double Hammer Rejection, page 2-30.
➣
Recording Setup, page 2-25.
eZ-Analyst
09-19-02
Menus and Windows 2-19
Page 87

2-20 Menus and Windows
09-19-02
eZ-Analyst
Page 88
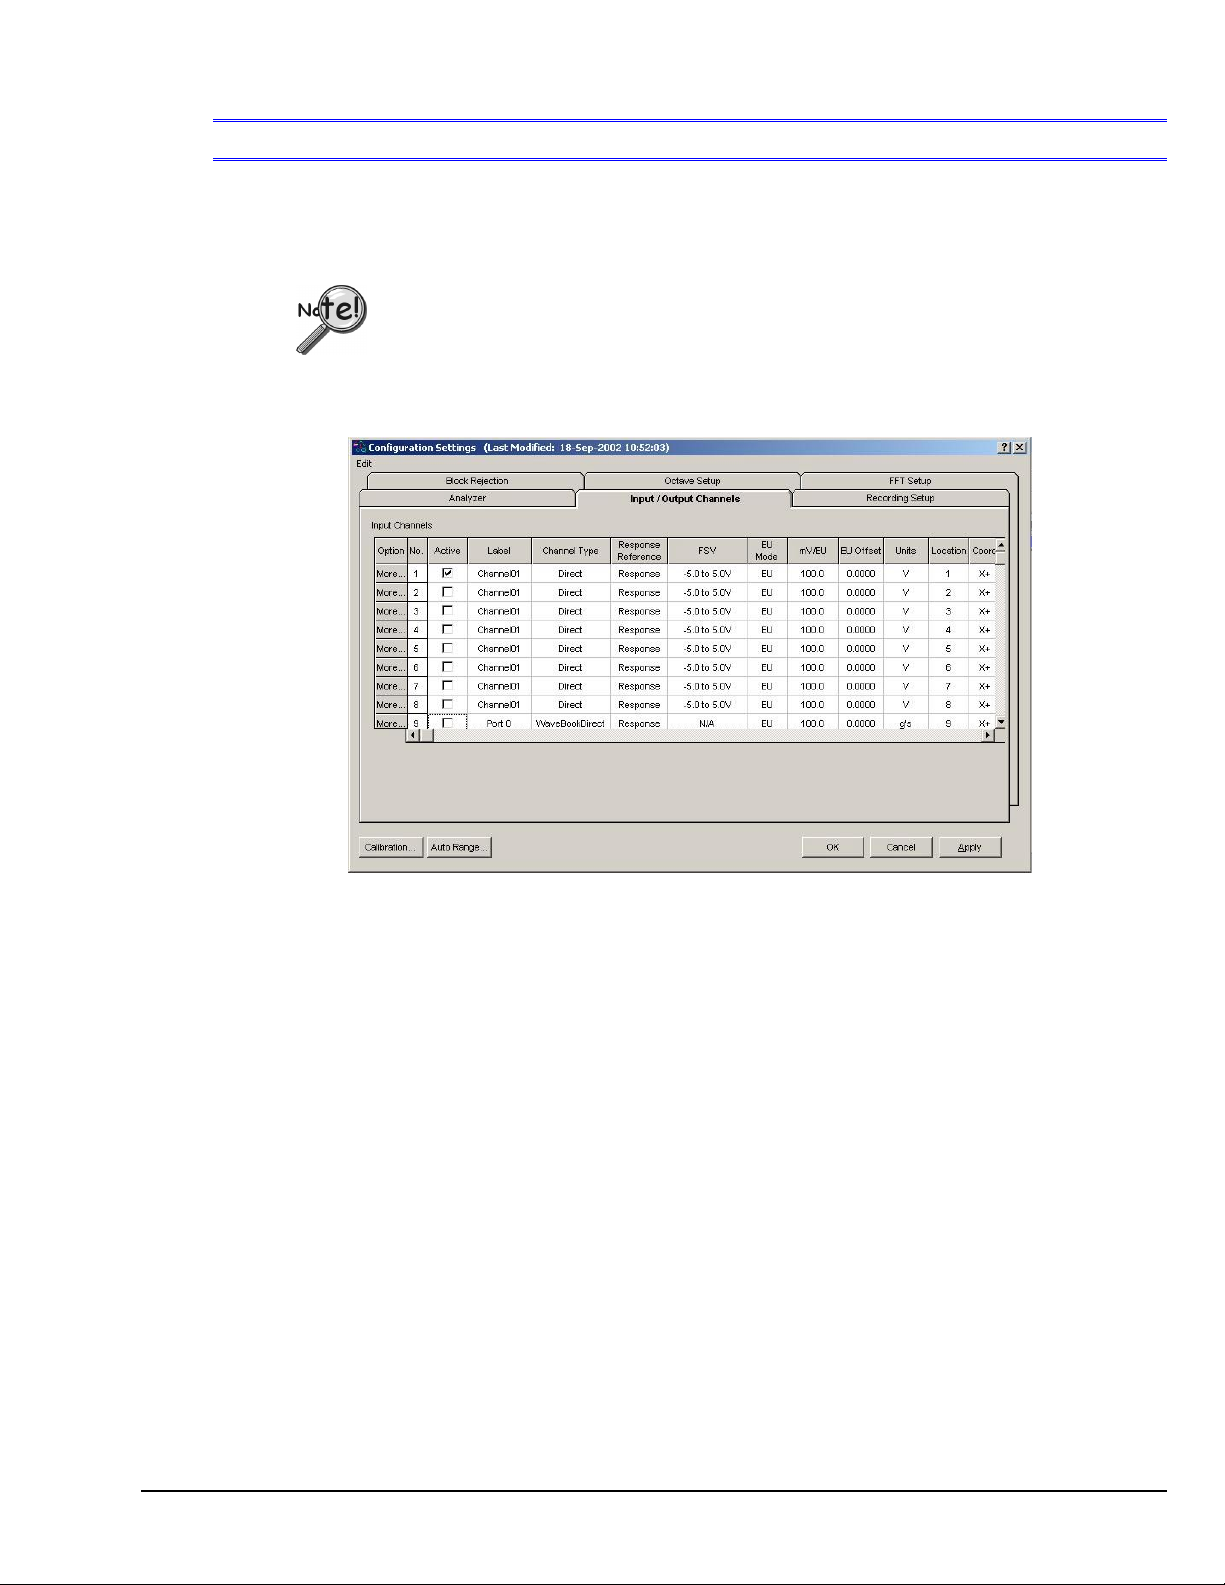
Edit Menu
The Input/Output Channels panel displays the current setup conditions of the input channels on a channel-bychannel basis. Changes are accepted as soon as they are applied or okayed. In addition, the Input/Output
Channels Tab provides a means of configuring outputs for ZonicBook and WaveBook applications.
The “Output” aspect of the tab only applies to eZ-Analyst.
> Configuration >
When using WaveBook hardware, eZ-Analyst supports up to 64 channels of input. If
your WaveBook’s hardware configuration has more than 64 channels, eZ-Analyst will
display an error message, then go to into the Playback mode. If you wish to run in the
Measurement mode you will have to reduce the channel count by removing expansion
modules. To remove the extra expansion modules you must physically disconnect them
from the WaveBook.
Input / Output Channels Tab
Input / Output Channels Tab Selected – WaveBook Application*
*Note: For a screen image of ZonicBook’s Input/Output Channels Tab, see page 2-23.
No.: This column lists all available channels.
Active: Initially all input channels are active. Set unused channels to OFF by removing the check
from the “Active” column’s checkbox.
Label: This should be a meaningful name that you assign to the signal received on a channel. The
channel number is automatically assigned. Highlight a cell before typing a label. When you
press the Enter key, the value is accepted.
Channel
Type
(WaveBook Only)
This column applies to WaveBook systems. It does not apply to ZonicBook applications.
The column consists of a fixed label, which indicates each channel’s parent hardware. Main
unit channels, i.e., those that connect directly to a WaveBook [as opposed to an expansion
module] are denoted by the label, “Direct”. Channel Type can not be edited.
Response
Reference
There are two types of channels, Response and Reference. All channels are initialized as
Response channels. If you are using a force channel, then (1) highlight that channel’s
Response/Reference cell, and (2) select Reference on the resulting popup menu.
FSV: Full-Scale Voltage. The cells in this column are used to set the FSV value in Volts.
EU Mode: E(ngineering) U(nits): Select EU or Volt.
eZ-Analyst
09-19-02
Menus and Windows 2-21
Page 89
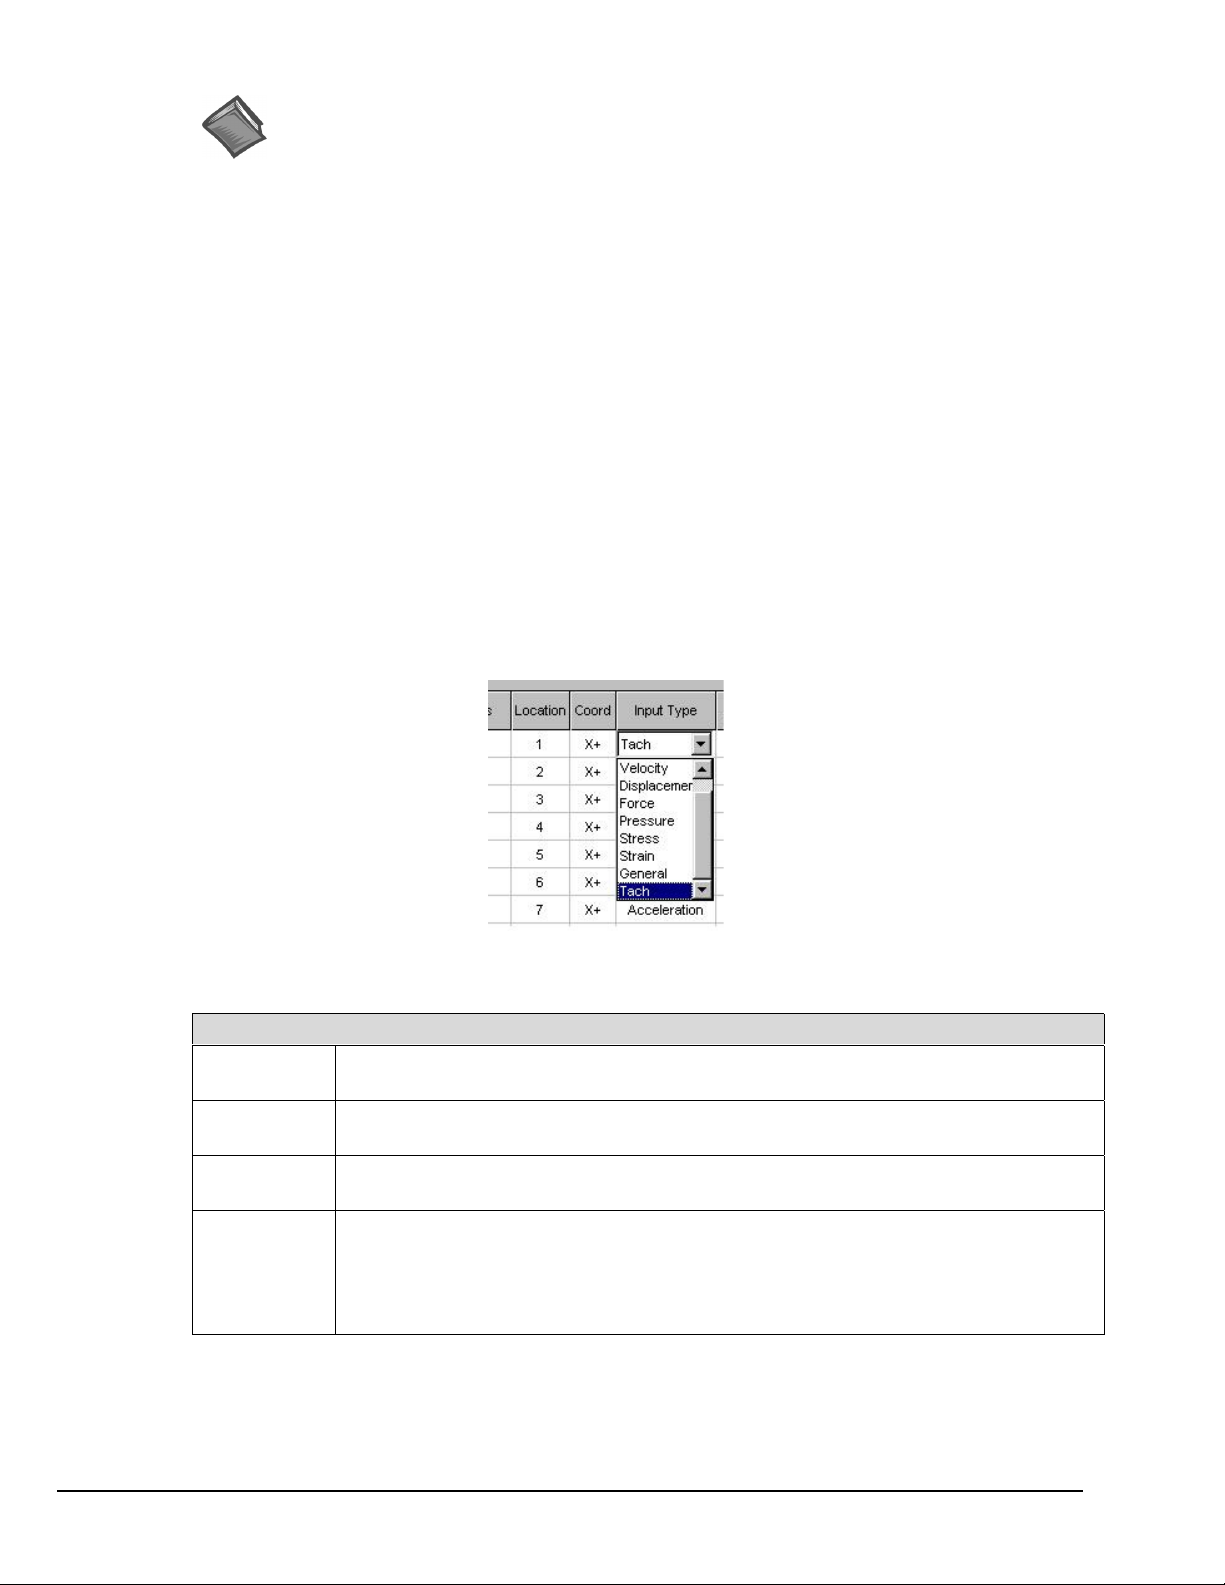
Units: Enter the measurement units you will be using.
Location:
Coord:
Input Type: This is the type of instrument attached to the channel. Menu selections include:
Tach Channel Setup
Tach Channels are selected by changing the Input Type to “Tach” on the Input/Output Channels tab.
Once the Tach Channel type is selected, columns are enabled for Pulses per Revolution, Trigger Level,
Trigger Slope, and Conversion. The table below explains each tachometer-related property that is displayed
by the Input/Output Channels tab.
Reference Note: Gain and offset adjustments are made from the Calibration display screen,
see page 2-7. The following parameters apply:
• mV/EU to set the scaling factor of millivolts to Engineering Units.
• EU Offset to set the offset factor that is to be applied to the Engineering Units.
• dB EU Ref: is applied to displayed data when the Y-axis scale is set to dB.
This is valid only for frequency domain data.
This is a simple numbering system. The channel number is the default value for location.
However, you can highlight a cell and type a different location number. When you press the
Enter key, the value is accepted.
This is the axial direction of the transducer connected to the channel. Make your selection
on the popup menu that appears after clicking in the applicable cell.
Acceleration, Velocity, Displacement, Force, Pressure, Stress, Strain, General, and Tach
(Tachometer). The later is detailed in the following sub-section, entitled, Tach Channel
Setup.
Tachometer Properties
TachPulse/Rev
TachTrigger Level
TachTrigger Slope
TachConversion
2-22 Menus and Windows
Selecting Tach Channel Setup
Displays the number of pulses per revolution.
Specifies the pulse level that the RPM algorithm considers valid.
Specifies whether counting is active on rising signal levels, or active on falling signal levels.
This column is used for entering a tachometer-conversion value for converting RPM into
other units. For example, you can enter a value to convert RPM to Miles per Hour,
Revolutions Per Second, or HZ. The desired conversion factor is entered as a multiplier.
To divide, you would simply enter an appropriate decimal, e.g., to divide by 2 you would
enter a value of 0.5.
09-19-02
eZ-Analyst
Page 90
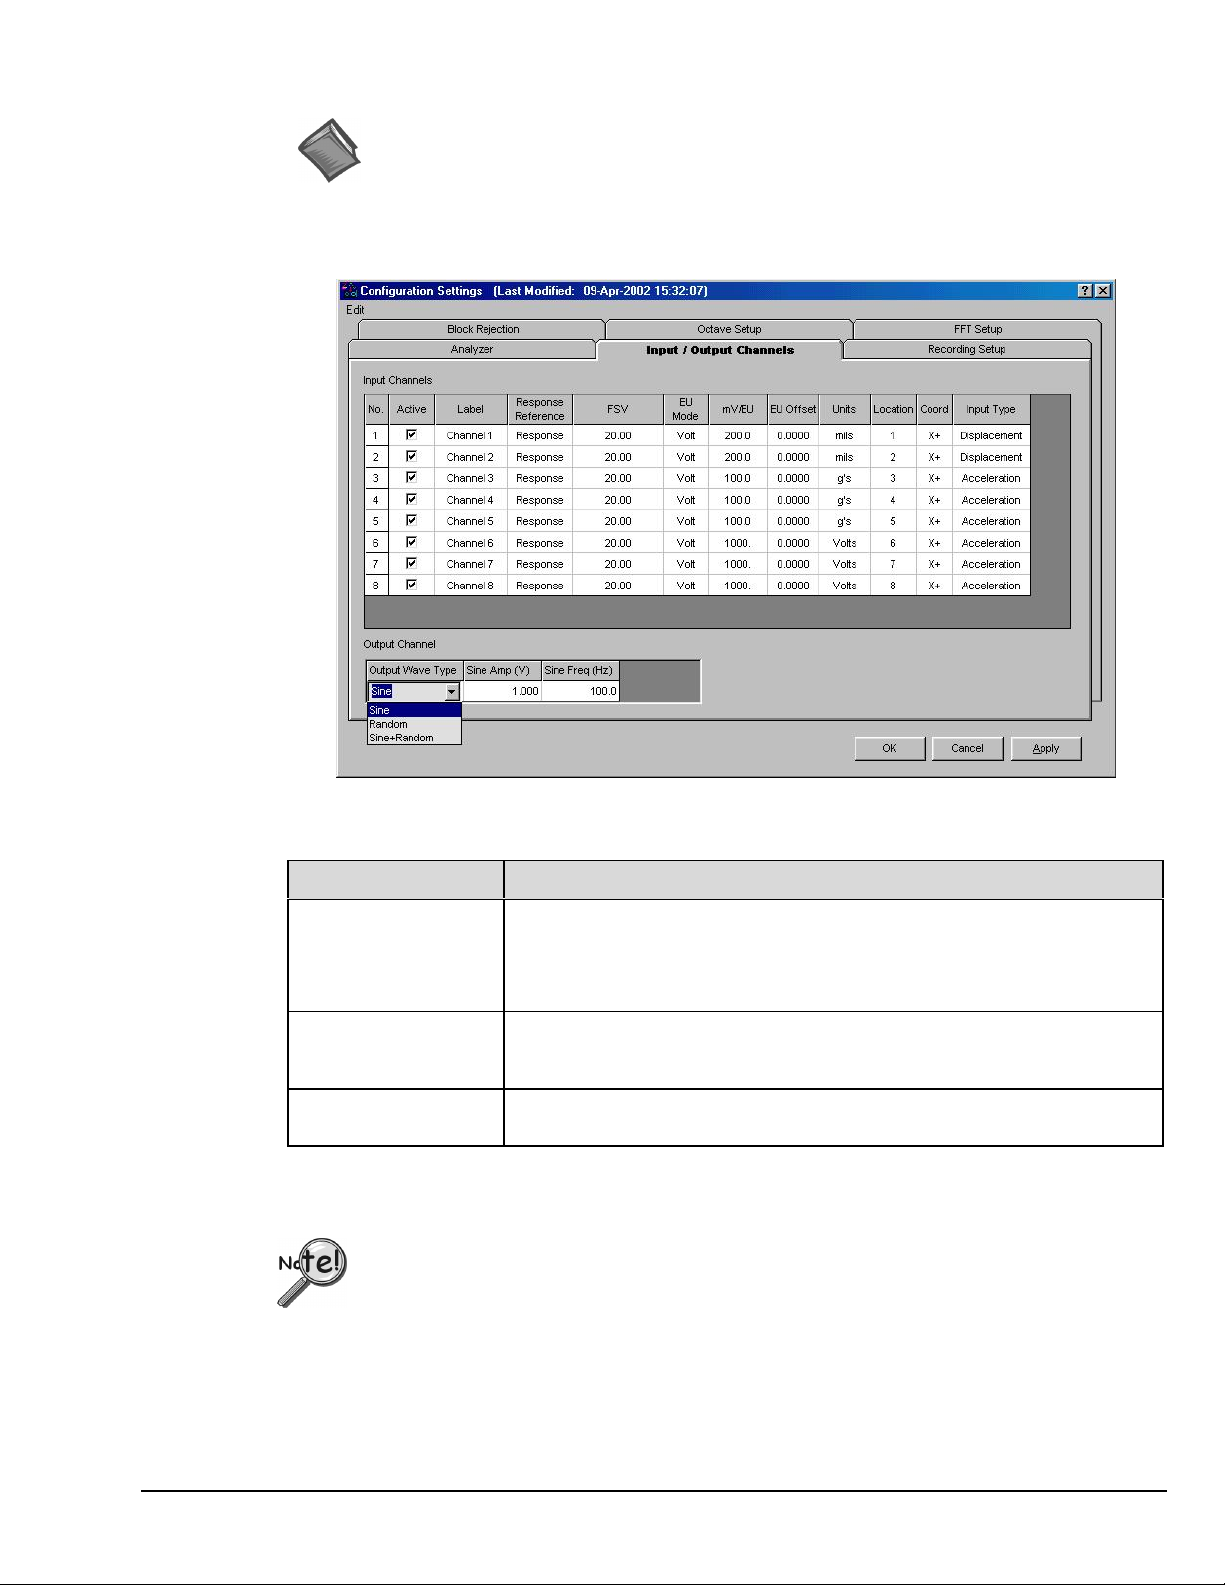
ZonicBook Applications
Reference Note: This section only pertains to ZonicBook applications.
For WaveBook applications refer to page 2-24.
In regard to ZonicBook, the Internal Signal Generator is set up in the Output Channel panel. The output
waveform (Sine, Random, or Sine+Random) is selected from the pull-down menu (see figure).
Input / Output Channels Tab – ZonicBook Applications
Output Wave Type Text Box Entries
Sine Waveform Amplitude:
The value is typed in the text-box. The units are volts.
Frequency: This is the frequency, in Hz, of a sine waveform. The maximum
value is 2000 Hz. The value is typed in the text-box.
Random Waveform Amplitude: This is the amplitude variance for the Random output signal. The
maximum value is 1.4 volts zero-to-peak. . The value is typed in the text-box.
The units are volts.
Sine + Random
Displays text box areas for the Sine Waveform and Random Waveform signal
types just described.
The maximum amplitude range is 1.4 volts zero-to-peak.
(see figure)
The signal output option is only valid when the analysis frequency is less than, or equal to,
4000Hz. Thus, whenever analysis frequency is set above 4000Hz, the signal generator
button is disabled.
eZ-Analyst
09-19-02
Menus and Windows 2-23
Page 91
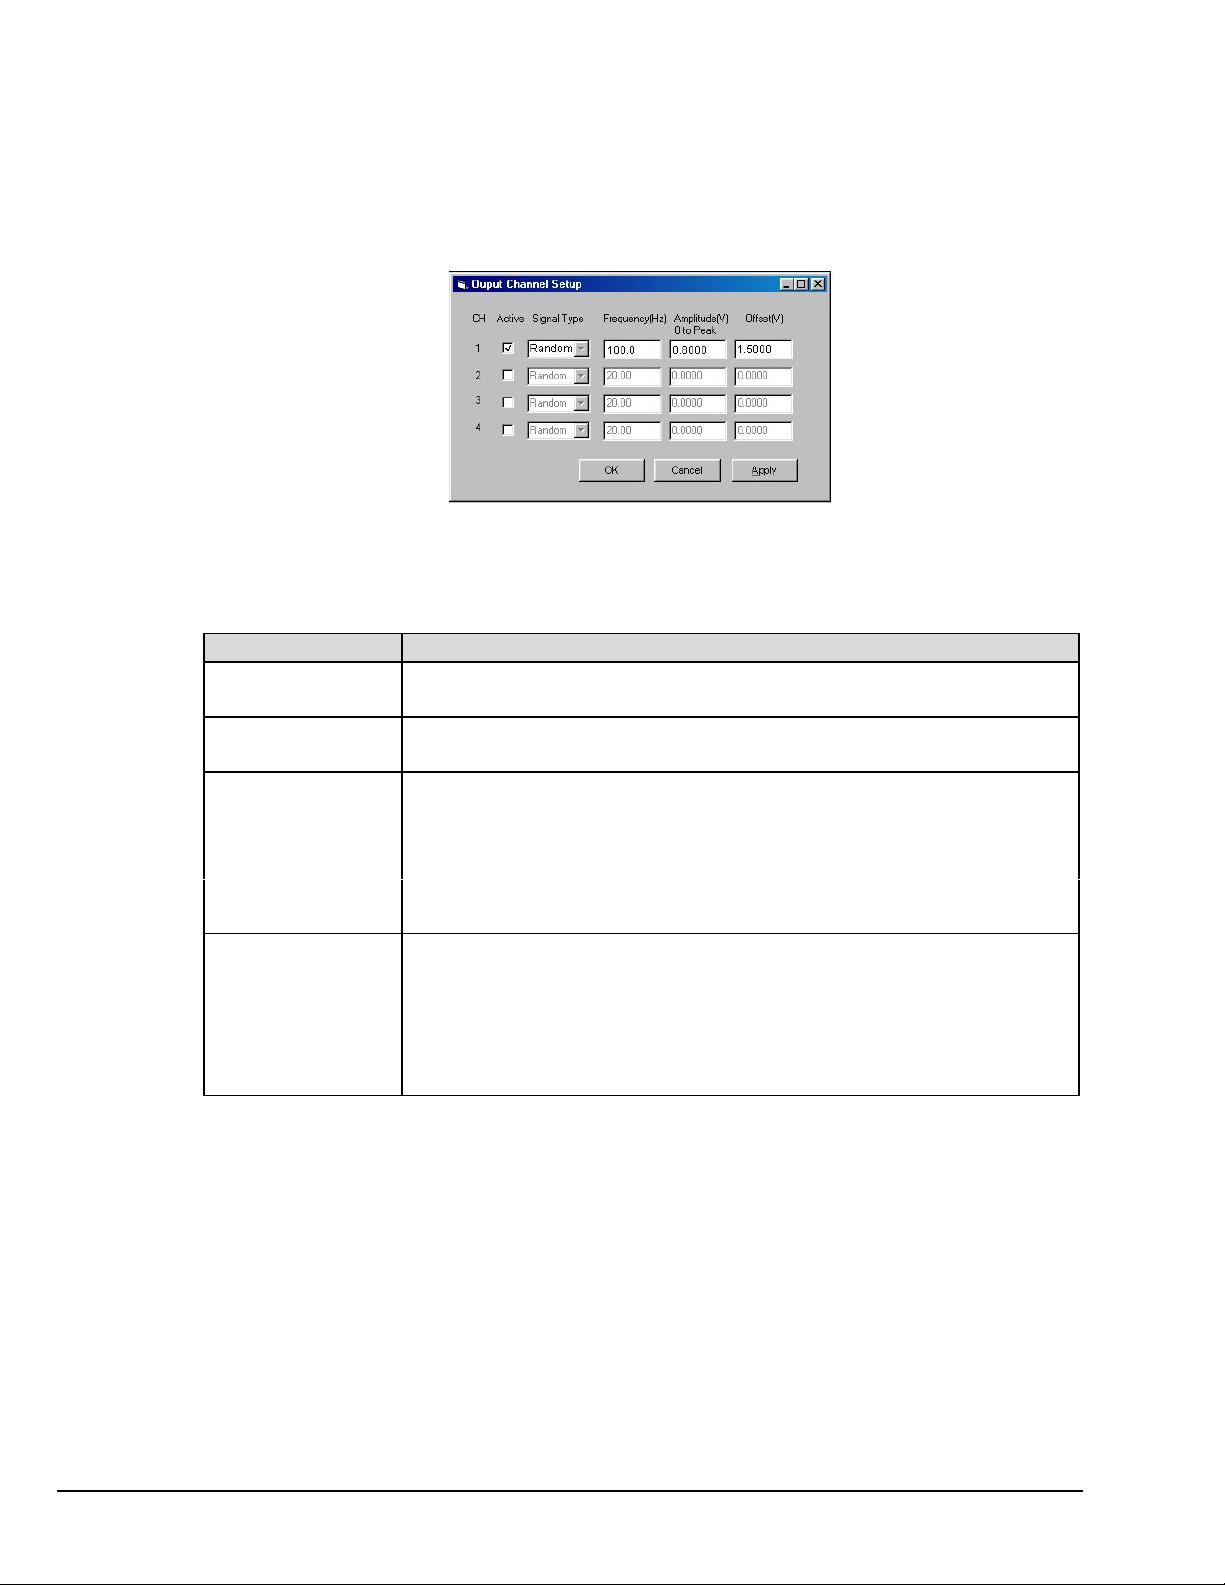
WaveBook Applications
In regard to WaveBook applications, Analog Output is only supported when eZ-Analyst detects a WBK14
expansion unit, and only one output is available from each WBK14. The Excitation Source can be for either
Random or Sine wave output. Instead of an Output Channel Tab, as seen in the previous figure,
eZ-Analyst brings up a Output Channel Setup box similar to that shown in the following figure.
Output Channel Setup
Channel 1 selected as an active output channel.
WaveBook applications Only. The figure does not apply to ZonicBook applications.
Setup Category Description
CH
Active
Signal Type
Sine
Signal Type
Random
Identifies the output channel. These numbers are a fixed part of the screen image
and can not be changed by the user.
Place a check in the “Active” box for each applicable output channel. In the above
example, only Channel 1 is “Active.”
Frequency (Hz)
The maximum value is 100000 Hz (100 kHz).
Amplitude (V) 0 to Peak
signal. The maximum value is 5.00 volts zero-to-peak.
Offset (V): This is the DC offset voltage that is applied to the output signal. The
maximum value is ±5.0 volts.
Frequency (Hz)
The maximum value is 100000 Hz (100 kHz).
Amplitude (V) 0 to Peak: This is the amplitude for the Random output signal.
The maximum value is 0.85 volts zero-to-peak.
Offset (V): This is the DC offset voltage that is applied to the output signal. The
maximum value is ±5.0 volts.
(see figures)
: This is the frequency, in Hz, for a Sine waveform.
: This is the amplitude for the Sine waveform output
: This is the frequency, in Hz, for a Sine waveform.
2-24 Menus and Windows
09-19-02
eZ-Analyst
Page 92
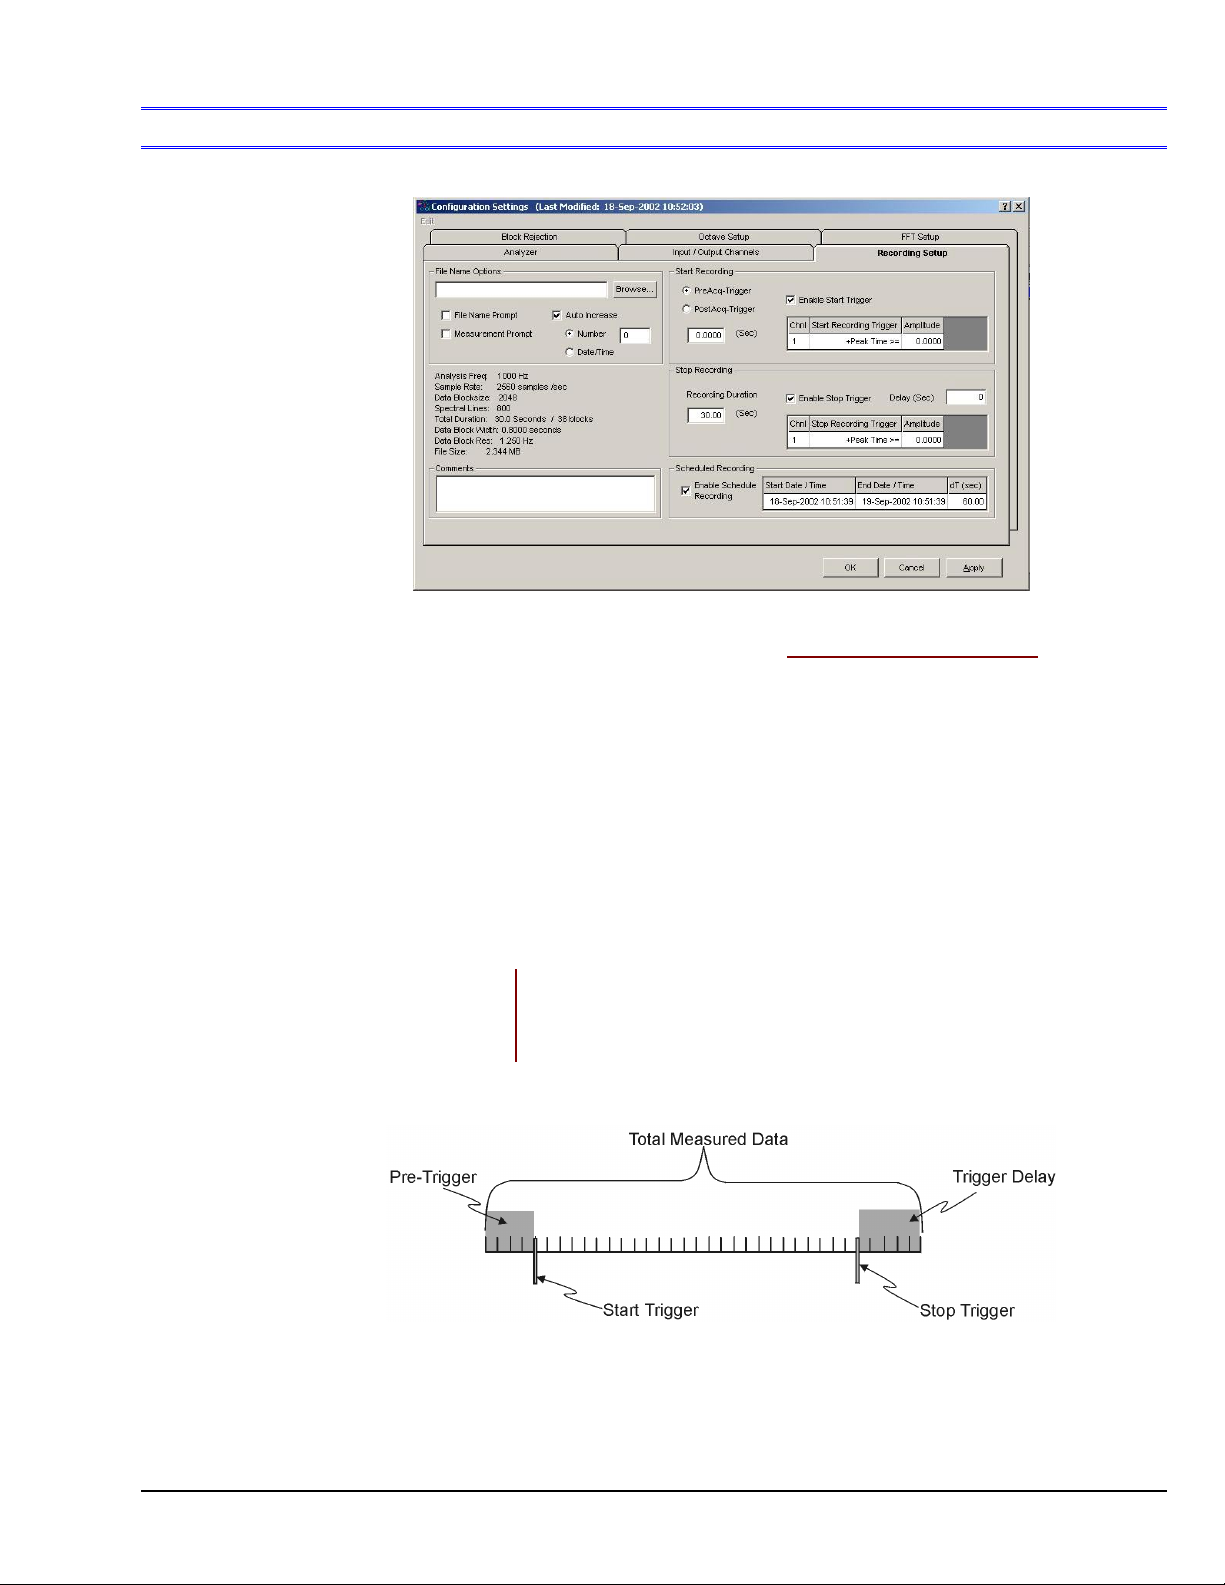
Edit Menu
> Configuration >
Recording Setup Tab
Recording Setup Tab
eZ-Analyst Only
Edit Menu > Configuration >
Recording Setup Tab: Start Recording Panel
Provide a means of setting the following parameters that pertain directly to the start condition.
Note that the Start Recording panel is not available for WaveBook applications.
PreAcq-Trigger – select this function to include [with the recording] data that precedes the trigger event by
the set number of seconds.
PostAcq-Trigger – select this function to exclude [from the recording] data that follows the trigger event by
the set number of seconds.
Note: You can not set a Start Delay for the start recording if PreAcq-Trigger is selected, and visa versa.
Enable Start Trigger – if the checkbox is checked, amplitude-based data can be set as a PreAcq-Trigger
condition to Start Recording. The following options are provided.
Amplitude-Based
Data Types
Peak Time >=
Peak Time <
Spectrum >=
Spectrum <
at specified frequency
eZ-Analyst
Understanding Total Measured Data
In this figure, the Start Recording panel’s PreAcq-Trigger data and the Stop Recording Panel’s Trigger
Delay data are both saved as part of the total measured data.
09-19-02
Menus and Windows 2-25
Page 93
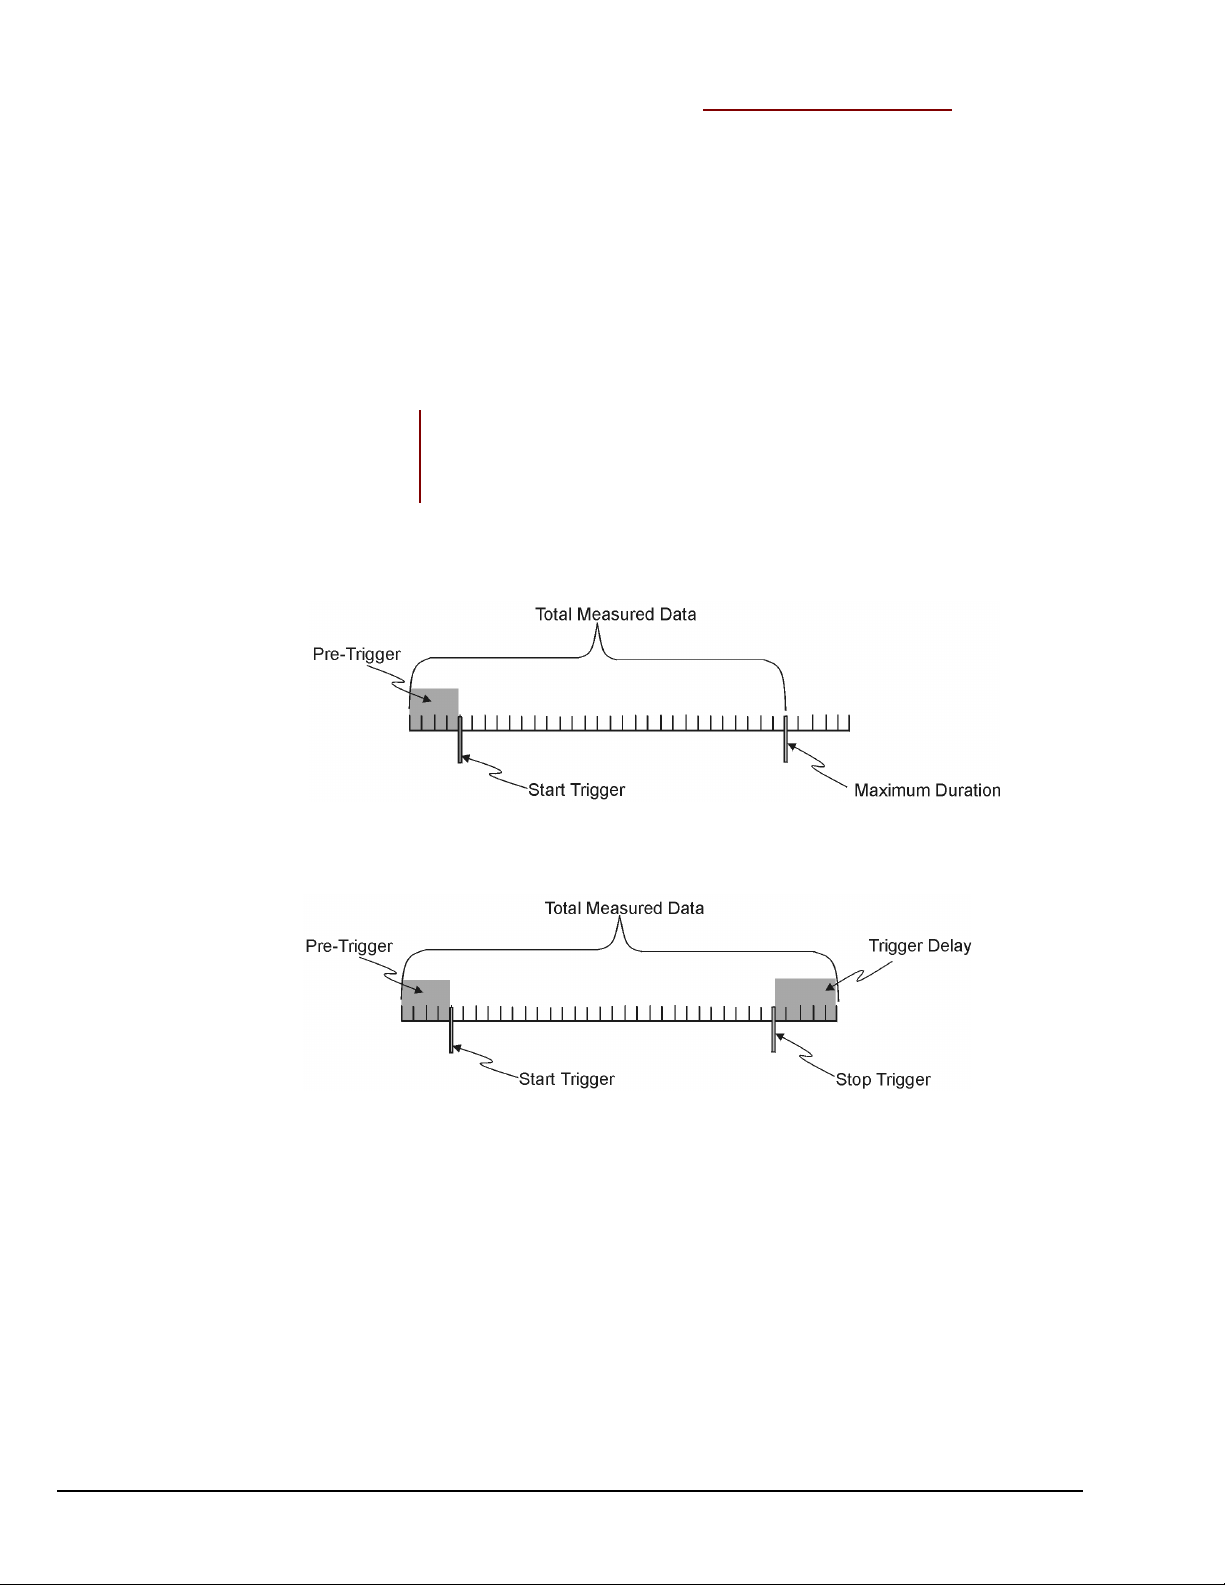
Edit Menu > Configuration >
Recording Setup Tab: Stop Recording Panel
Provide a means of setting the following parameters that pertain directly to stop recording:
Recording Duration sets a “time-out” option, for which the recording event is not to exceed. If an
acquisition has been triggered, the measurement will run until either (a) the amplitude-based Enable Stop
Trigger Condition is met, or (b) the Recording Duration is met, whichever occurs first. When the Recording
Duration value is met, the recording event is aborted.
Note: Entering a value of “0” in the Recording Duration block sets the duration to infinity.
Enable Stop Trigger – if the checkbox is checked, amplitude-based data can be set as a stop condition for
the recording. The following options are provided.
Amplitude-Based
Data Types
Peak Time >=
Peak Time <
Spectrum >=
Spectrum <
at specified frequency
Delay (sec) – this function is used to include [with the recording] data that follows the stop trigger event by
the set number of seconds, as specified by the delay.
Maximum Duration Limit Terminating a Measurement
In this figure, the Start Recording’s PreAcq-Trigger data and the Stop Recording’s Delay data are both
saved as part of the total measured data.
2-26 Menus and Windows
Understanding Total Measured Data
09-19-02
eZ-Analyst
Page 94
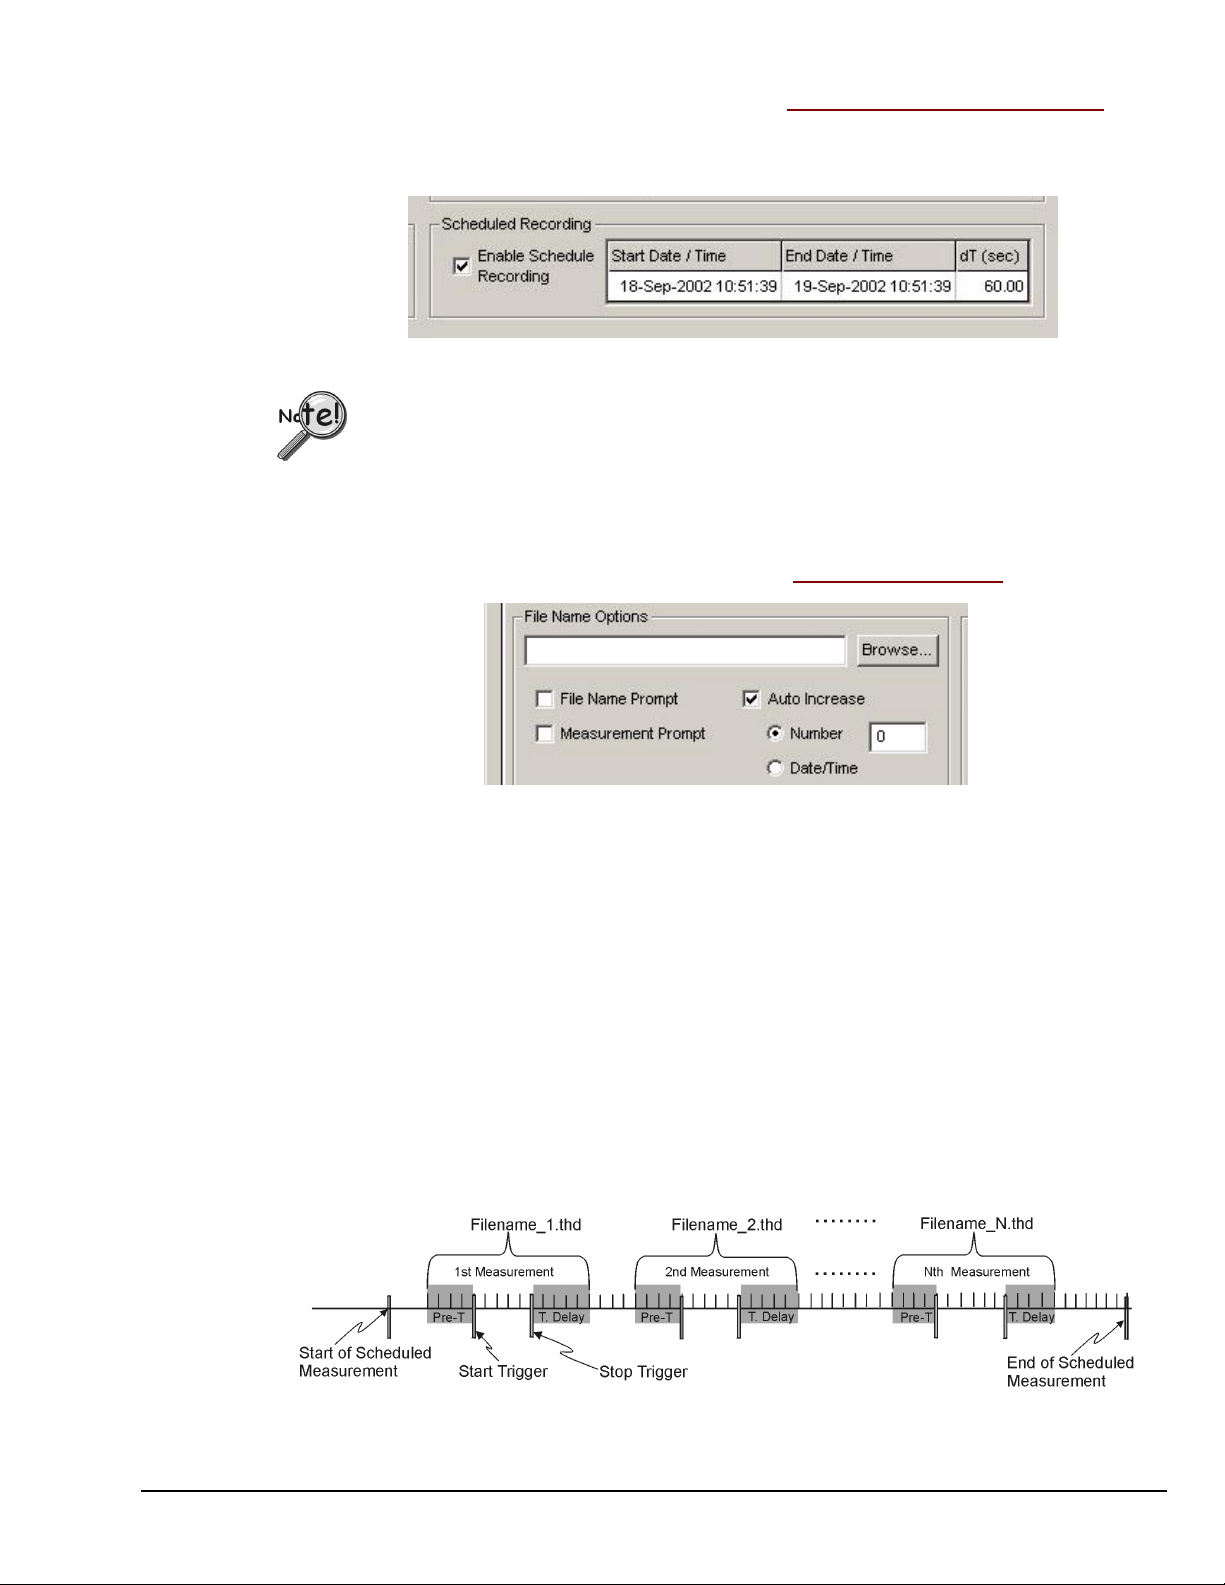
Edit Menu > Configuration >
The Scheduled Recording panel includes a checkbox to enable the “scheduled recording” function.
It also includes three text fields (see following figure). The panel provides a means of setting time
conditions for starting and stopping a recording. dT is the delay time in seconds.
When using Scheduled Recording, you need to set up the recording options for
➣
automatic .thd file creation. This is done in the Recording Setup Tab’s “File Name
Options” panel, discussed below.
When using WaveBook hardware, features of the Start Recording panel are not
➣
available.
Recording Setup Tab: Scheduled Recording Panel
Scheduled Recording Panel
Edit Menu > Configuration >
When using the Scheduled Recording feature the following steps should be taken to ensure that each file will
be automatically named by the program.
From the File Name Options panel, at the upper left of the Recording Setup Tab, verify that the following is
true. Make changes if needed.
• File Name Prompt – Not Checked
• Measurement Prompt – Not Checked
• Auto Increase – Checked
• Date/Time – Select the “Date/Time” radio-button if you want the Filenames to
• Number – Select the “Number” radio-button if you want the Filenames to
Recording Setup Tab: File Name Options
File Name Options Panel
automatically increase by a Date/Time convention, otherwise select “Number.”
automatically increase by a numerical sequence (1, 2, 3, ….N) convention, otherwise
select “Date/Time.”
eZ-Analyst
An Example of Filename Auto-Incrementing by Number
09-19-02
Menus and Windows 2-27
Page 95

Edit Menu > Configuration >
Recording Setup Tab: Comments Panel
The comments panel can be used to enter a variety of information regarding the recording. For example, you
may want to include the environmental conditions that existed at the time of the recording, the phase of the
project, or a problem that is being investigated. Note that the comments are saved as part of the data file.
2-28 Menus and Windows
09-19-02
eZ-Analyst
Page 96
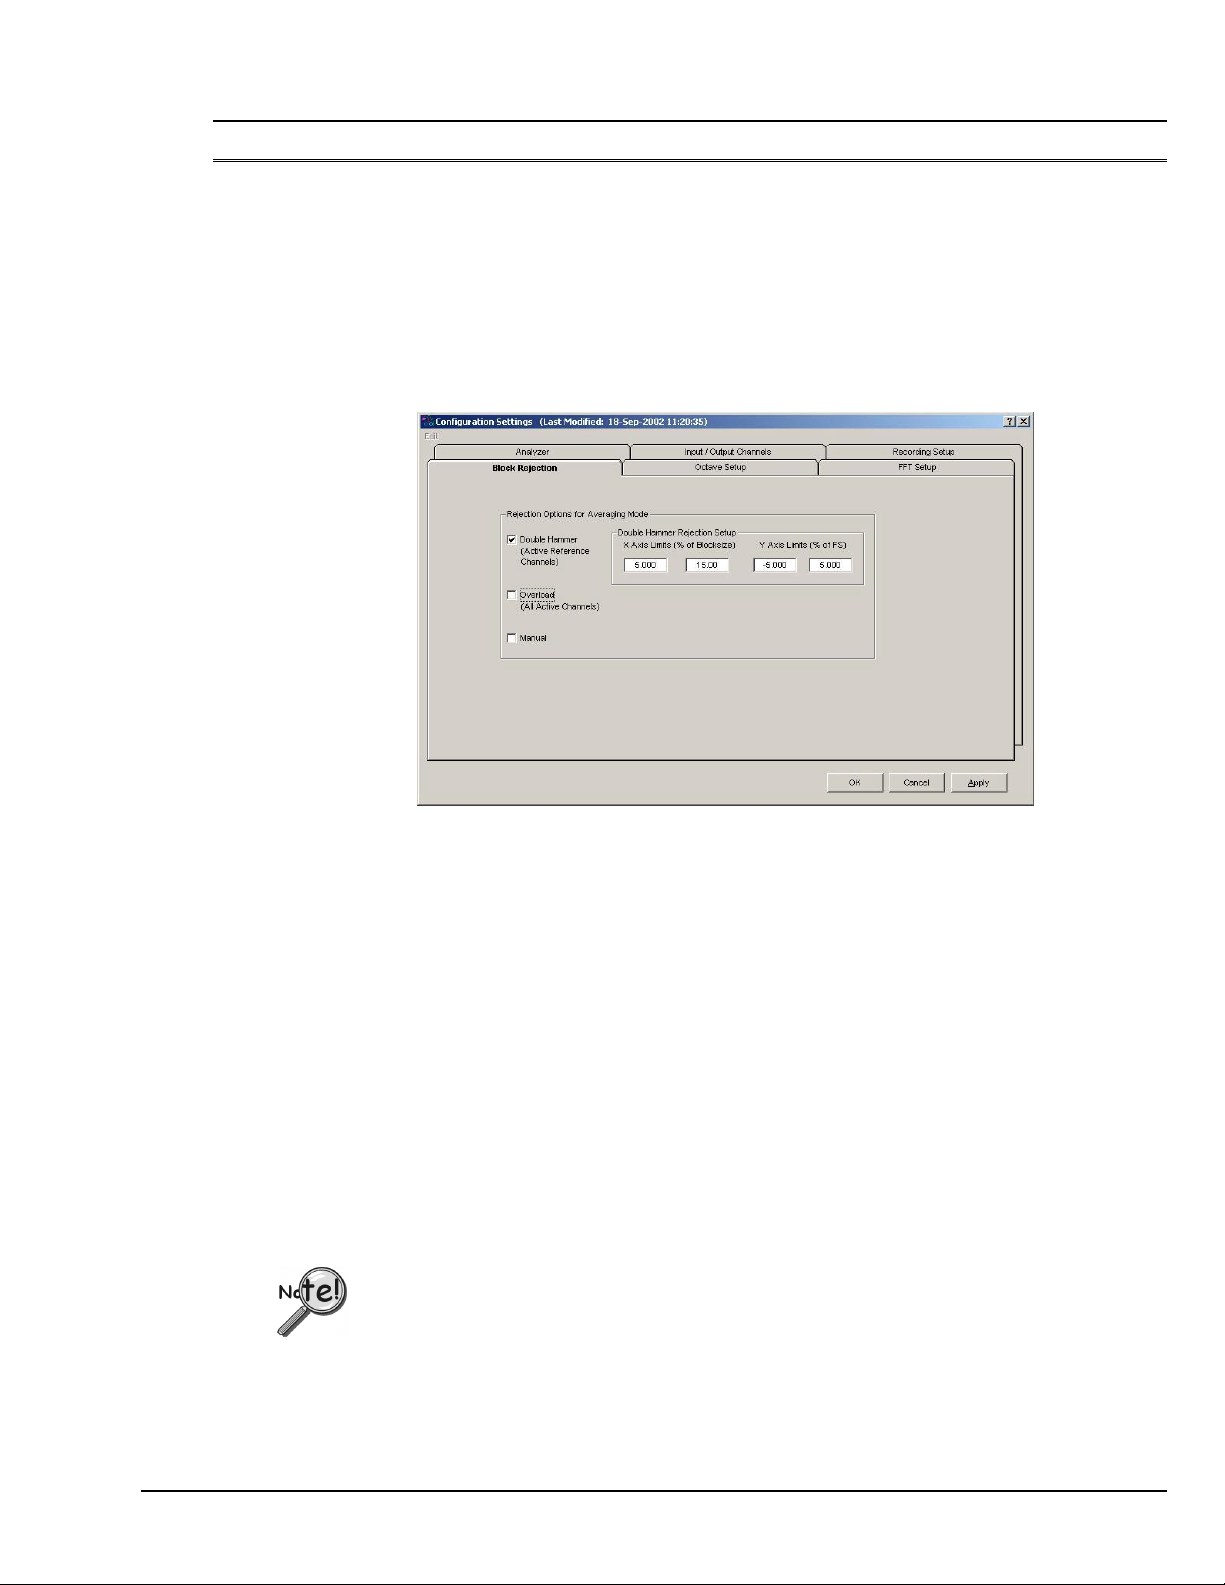
Edit Menu
The Block Rejection Tab exists to allow the software (or user) to reject blocks of data that result from
hammer double strikes, overloads, or simply because the data block “doesn’t look right.”
There are three block rejection modes: Double Hammer protects measurements against double hammering.
Overload protects the measurement by automatically rejecting overloaded data, and Manual allows you to
inspect a measurement and optionally reject it. You can select any or all of the rejection modes. Also see:
Considerations Regarding Double Hammer Rejection, page 2-30.
Note: The Block Rejection panel is only active when “Measurement Mode” is selected from the
> Configuration >
Task menu.
Block Rejection Tab
eZ-Analyst Only
Block Rejection Tab
Block rejection looks at the acceptable parameters for a block, and rejects blocks that do not meet those
parameters.
Double
Hammer:
A double hammer occurs when a signal goes outside of the acceptable range that is set up in
the Hammer Rejection section. Click in the Double Hammer box to turn the Double
Hammer option ON and OFF. When the box is checked, the option is ON.
Overload: An overload is any input signal that reaches or exceeds the specified input Full Scale range.
Click in the Overload box to turn the Overload Rejection option ON and OFF. When the
box is checked, the option is ON.
Manual: This option allows you to review each block of data before acquiring the next block. When
manual rejection is selected, a <Reject?> button is activated in the main window. At the
end of each average, if you want to reject that measurement, click on the <Reject?> button.
eZ-Analyst will then reject the current frame of data. The data and average counter will go
back to the previous measurement. Click in the Manual box to turn the Manual option ON
or OFF. When the box is checked, the option is ON.
Block Rejection is used in conjunction with Capturing Transient Data (Input Channel
triggering) and Averaging. These topics are discussed on pages 2-17 and 2-18, respectively.
eZ-Analyst
09-19-02
Menus and Windows 2-29
Page 97
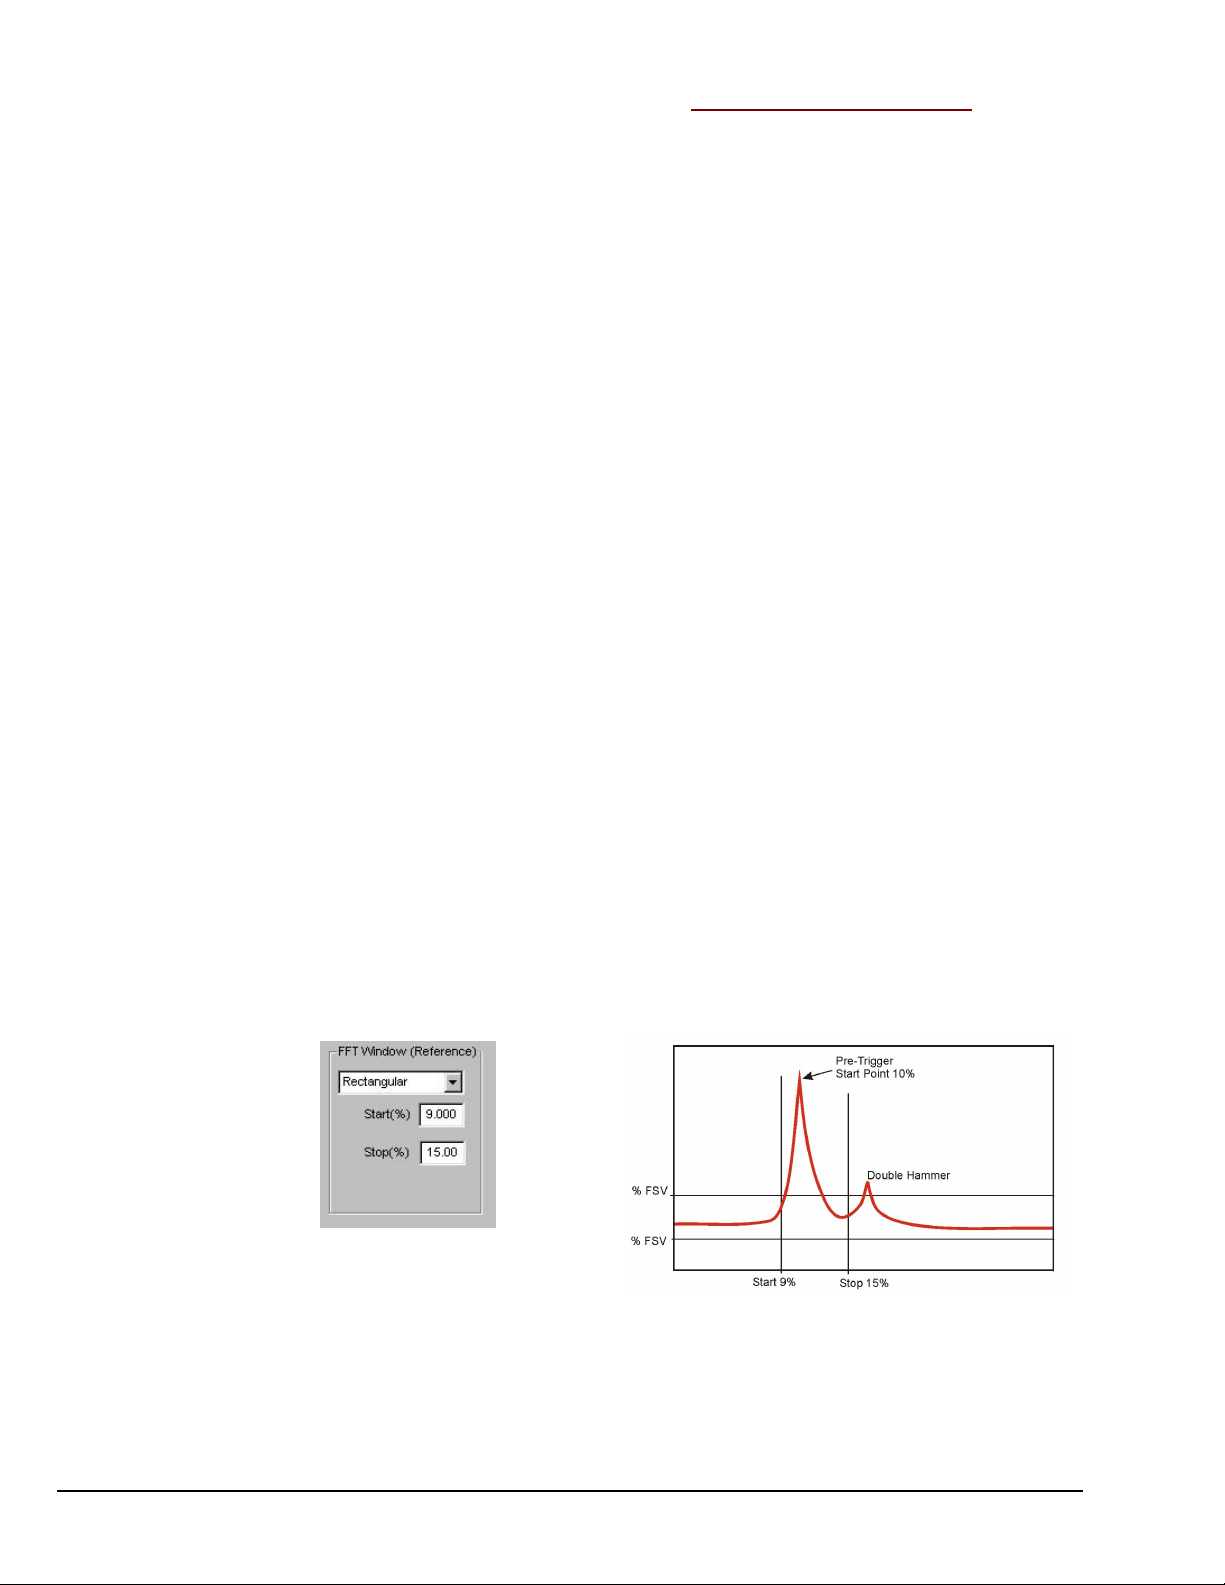
Edit Menu > Configuration >
Block Rejection Tab: Hammer Rejection Panel
This panel is used to define the acceptable range for a hammer signal. Any signal outside of the defined
range is detected as a double hammer. The acceptable range will appear as a rectangle whose boundaries are
defined by high and low limits for the blocksize, and by high and low limits for scale. Respectively, these
are x- and y- axis limits.
X-axis Limits (% of blocksize): Used to set a Low point and a High point along the x-axis, for which the
hammer impact must occur to be acceptable. An example setting is 5% to 15% (of blocksize).
Y-axis Limits (% of F(ull) S(cale): Used to set a Low point and a High point along the y-axis, for which the
hammer impact must occur to be acceptable. An example is –5.000 to + 5.000 (% of Full Scale).
Considerations Regarding Double Hammer Rejection
There are three major interrelated components to consider when setting up a double-hammer rejection
condition. These are:
• Trigger Mode and Delay
• Force Window
• Double Hammer Region
A trigger is used to ensure time synchronous measurements across all the active channels.
As indicated in the Trigger Panel section of this document (beginning on page 2-16), a pre-trigger indicates
that data captured before a trigger event [the amount of which is specified by the delay] will be prefixed to
the data following the trigger event. Also, a trigger delay [in reference to the Start Trigger Condition]
indicates that a specified amount of data after the start trigger [the amount of which is specified by the delay]
will be skipped (ignored) before a block of data is captured.
Double hammer reject is only meaningful with the pre-trigger specified. Double hammer rejection
protects the measurement from a bad hammering.
It is desirable to set the pre-trigger to fall within the hammer region, since it is a common practice to set the
trigger channel to an impact channel.
Example
In this example, a test engineer is looking for a trigger event that occurs somewhere after
10% of the data block, but before 15% of the block. Therefor:
(1) Pre-Trigger is set for 10% Delay, using the Trigger Panel (on the Analyzer Tab).
(2) A Rectangular Force Window is selected and set for a Start point of 9% and a Stop point of 15%. This
is done in the FFT Setup Tab’s FFT Window (Reference) Panel. Page 2-32 contains additional
information.
Selecting a Rectangular Force Window
and Setting Points for 9% and 15%
Selected and set in the FFT Setup Tab.
A Double Hammer Event
When impact testing we want to make sure that a double hammer does not occur. Through trial and error we
may start by setting the Double Hammer range at 12% and 14%, or 11% and 13% of the block. Typically
this range is fine tuned using sample acquisitions prior to starting a real test.
2-30 Menus and Windows
09-19-02
eZ-Analyst
Page 98
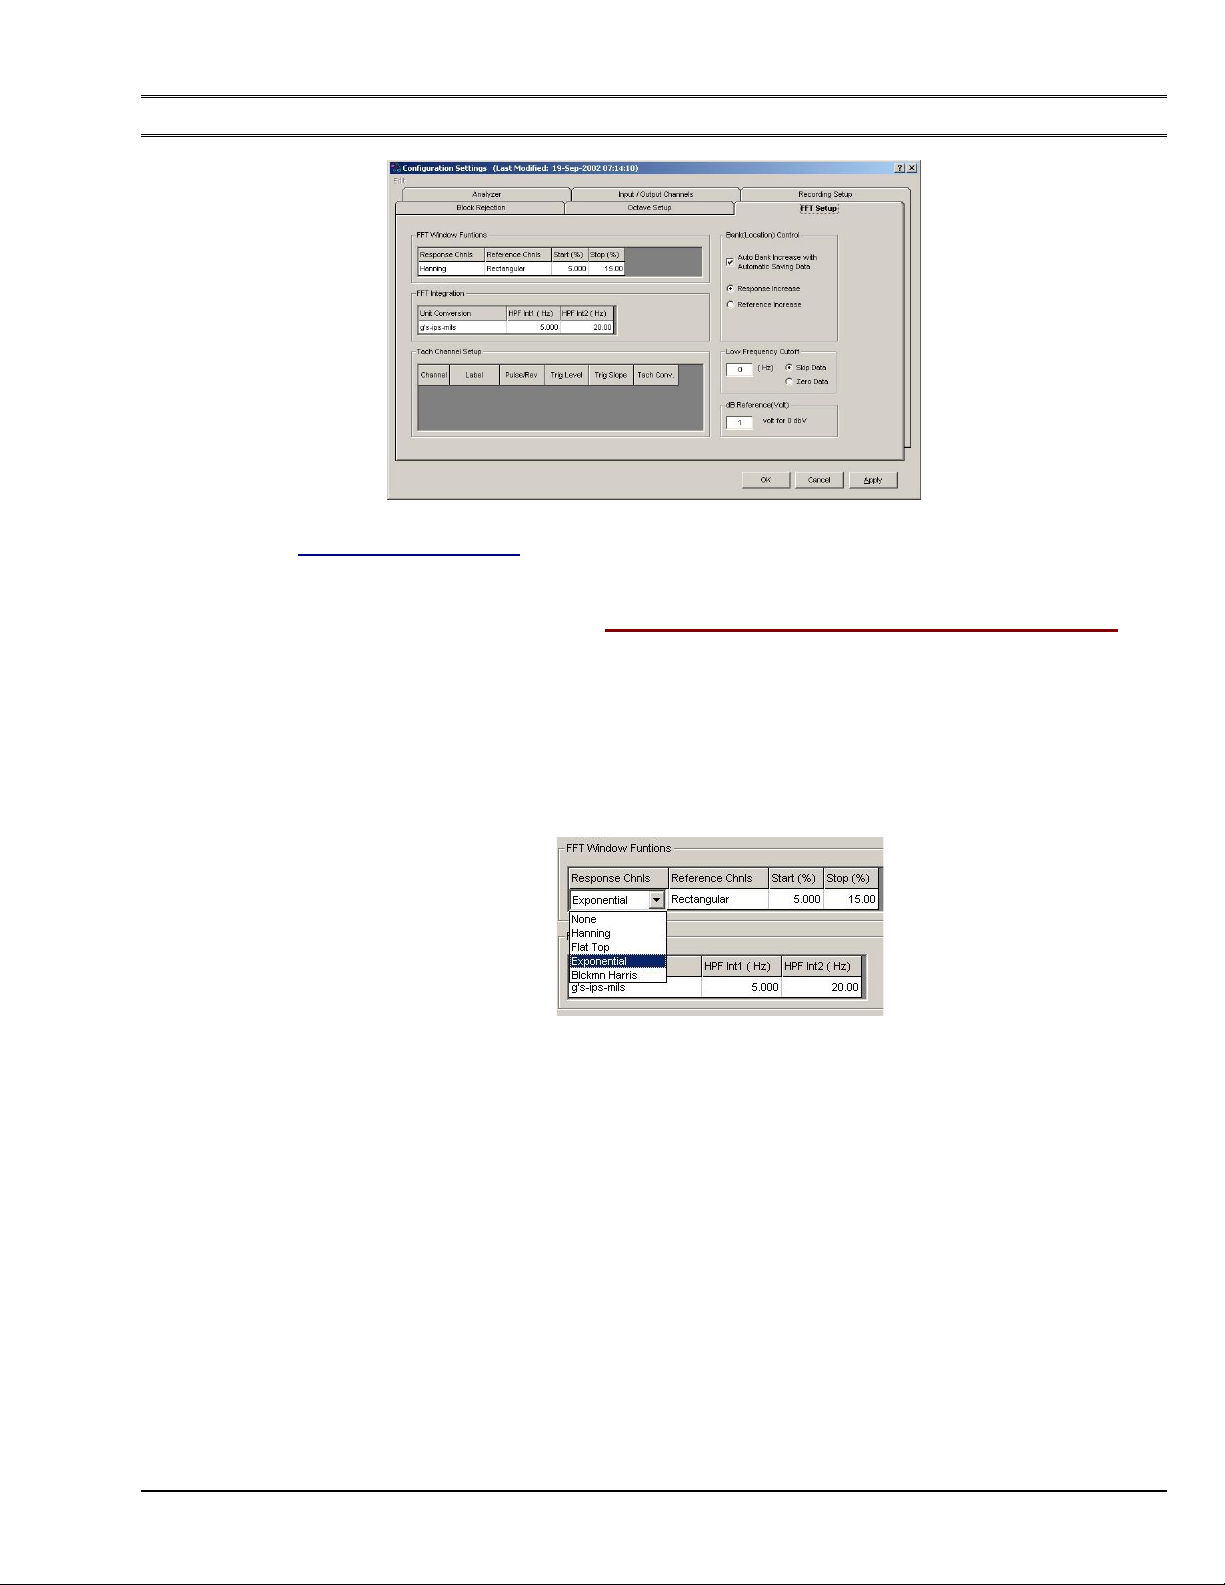
Edit Menu
> Configuration >
*eZ-FrequencyView User’s: The associated tab in eZ-FrequencyView is labeled “Miscellaneous”
and the layout differs. Appendix C includes a screen shot of the Miscellaneous tab.
FFT Setup Tab
FFT Setup Tab*
Applies to eZ-Analyst & eZ-FrequencyView*
Edit Menu > Configuration >
The FFT (Response) window is a time-domain, weighting window. A response window is usually applied to
data to reduce FFT leakage errors. FFT theory assumes that the signal being analyzed is periodic in the data
acquisition block. When this is not the case, energy from a signal at a specified frequency can leak into
nearby spectral bins causing spectral amplitude inaccuracies. Applying a windowing function controls, but
doesn’t completely eliminate, the error by multiplying each data frame by a suitable time-domain weighting
window. This calculation reduces the amplitude/magnitude of the data near the ends of each data frame prior
to performing the FFT and forces the data to be nearly periodic in the window, thus reducing leakage errors.
Response window options are as follows:
None:
Hanning:
FlatTop:
BlackmanHarris:
FFT Setup Tab: FFT Window Functions / Response Channels
FFT Window Functions, Response Channels Pull-down List
No weighting window is applied.
The Hanning window is typically used to analyze continuous signals. It offers a
reasonable trade-off of frequency accuracy versus amplitude accuracy.
Compared to the very similar 4-term “Max Flat Top,” this window also has a very low
peak amplitude error, and its frequency resolution is somewhat better. Its side lobes are
considerably higher. Its effective noise bandwidth is still almost twice that of the
Hanning window, therefore this window is used mainly to measure accurate peak
amplitudes of discrete spectral components that are known to be separated by several
spectral lines.
This window function was designed to provide the minimum side lobe level of any threeterm window. Compared with the very similar Hanning window, it has a slightly wider
main lobe but much better dynamic range. This window has the smallest 60 dB
bandwidth of any window listed. The Blackman-Harris window may be preferred over
the Hanning for measurements requiring better dynamic range.
eZ-Analyst
09-19-02
Menus and Windows 2-31
Page 99
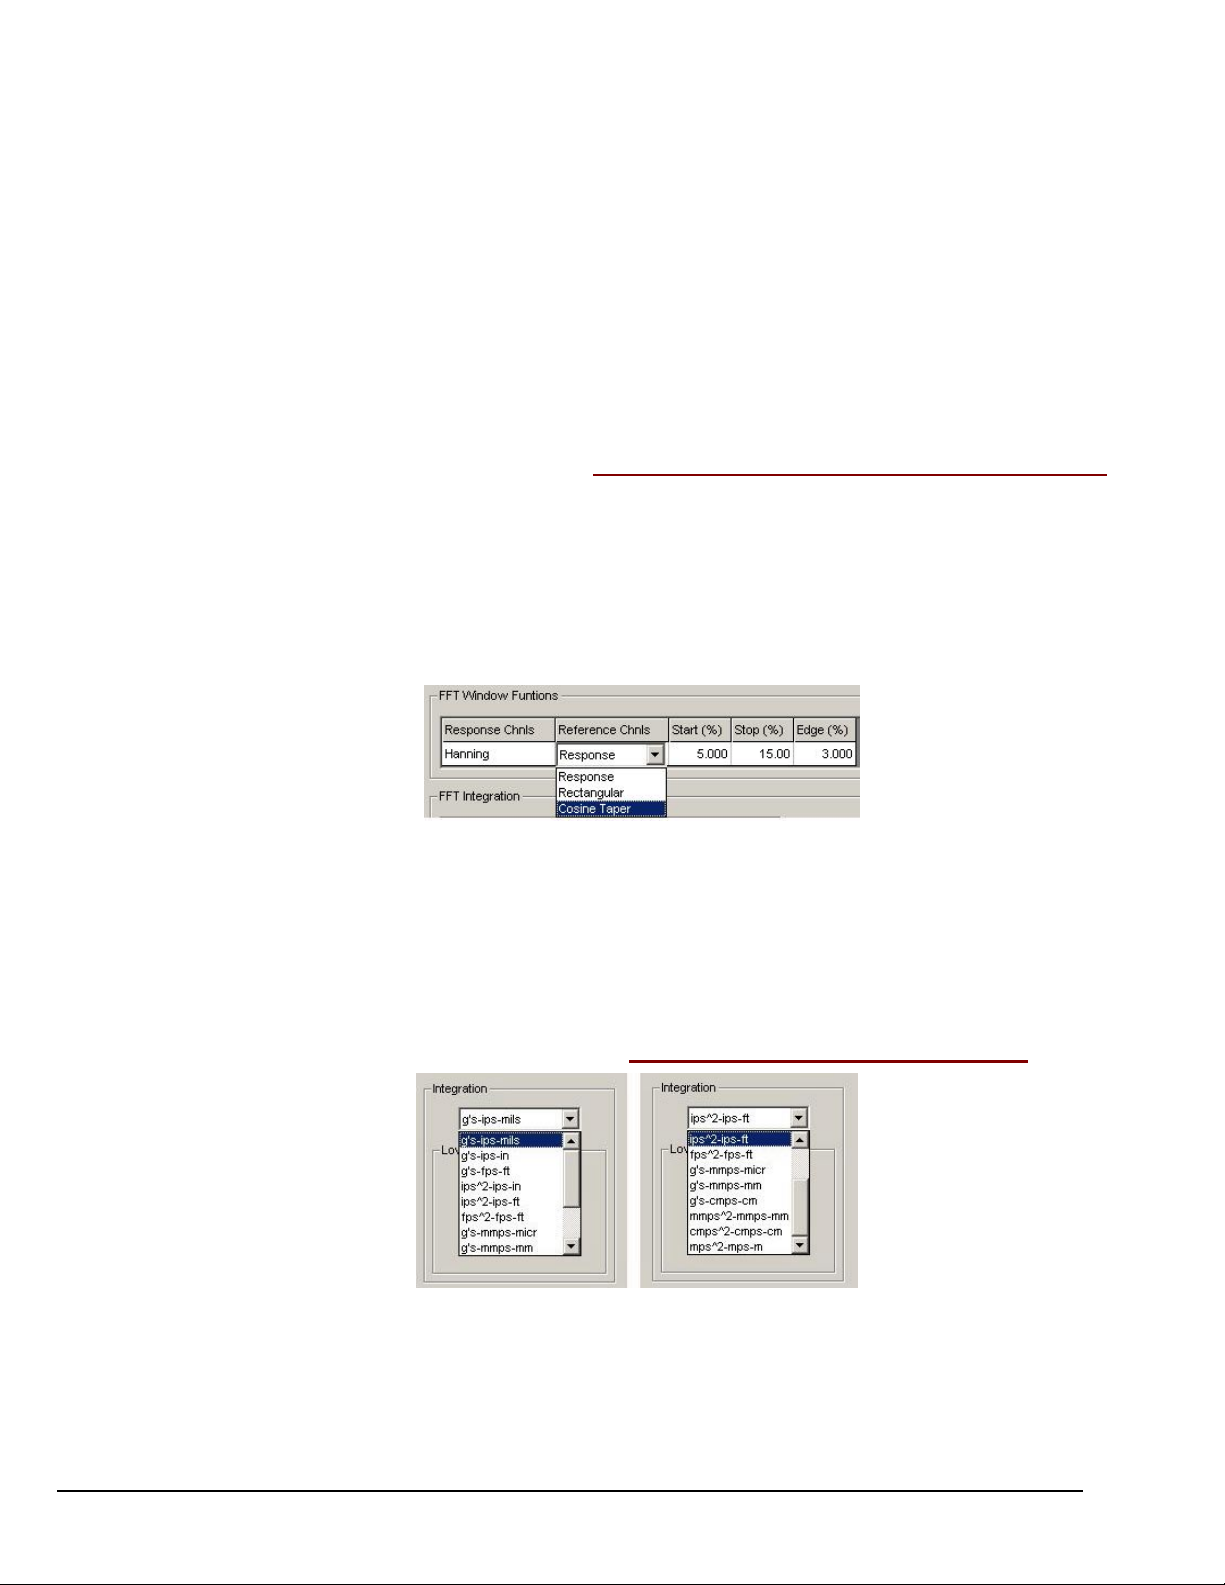
Exponential: An exponential weighting window is equal to 1.0 at the beginning of the block and
decays exponentially to a smaller value at the end of the block. Exponential is used only
with transient data that is captured with pre-trigger to assure that the initial values in all
data channels are very close to zero. Exponential can be used with all transient excitation
methods in order to force the signals to decay close to zero, (See Response Decay
Percent,) even if the block length is not sufficient to capture all of the naturally occurring
response. If the data decays naturally to a low amplitude within the block, so that
leakage is not significant, exponential windowing can improve the signal-to-noise ratio
by giving reduced weight to the very low-amplitude data at the end of the block.
Decay % :
Decay Percent is used when an Exponential Window is applied to the Response Channel.
It is the weighting factor present at the last block value. For example, a decay of 5%
means that the weighting factor at the beginning of block is 100% and that the weighting
factor of the last block is 5%. In other words, the weighting factor dropped (decayed) to
5% through the length of block.
Edit Menu > Configuration >
The FFT Reference Window is applied to the output of a transducer to avoid collecting extraneous signals
caused by an excitation device, such as an impulse hammer. Possible selections are: Response, Rectangular,
and Cosine Taper.
When Rectangular is selected, specify the Start(%) and End(%) of the rectangle as a percentage of the
Frame Period.
When Cosine Taper is selected, specify the Start(%), End(%), and Edge(%) the Cosine Taper as a
percentage of the Frame Period.
FFT Window Functions, Reference Channels Pull-Down List
Start (%):
The percent of the Frame Period at which the Rectangular
and Cosine Taper Windowing functions start.
Stop (%): The percent of the Frame Period at which the Rectangular
and Cosine Tape Windowing functions stop.
Edge (%): This is the percent of the Frame Period during which the
Cosine Taper Windowing function tapers up and down.
FFT Setup Tab: FFT Window Functions / Reference Channels
Edit Menu > Configuration >
Integration:
2-32 Menus and Windows
FFT Setup Tab: Integration Panel / Unit Conversion
Integration Panel – 2 Views
The left-hand view is with the scrollbar up, the right-hand view is with the scrollbar down.
Provides the means to select an integration, such as g’s-ips-mils or g’s-ips-in. Several
other possibilities exist, as can be seen in the above images of the Integration Panel.
09-19-02
eZ-Analyst
Page 100
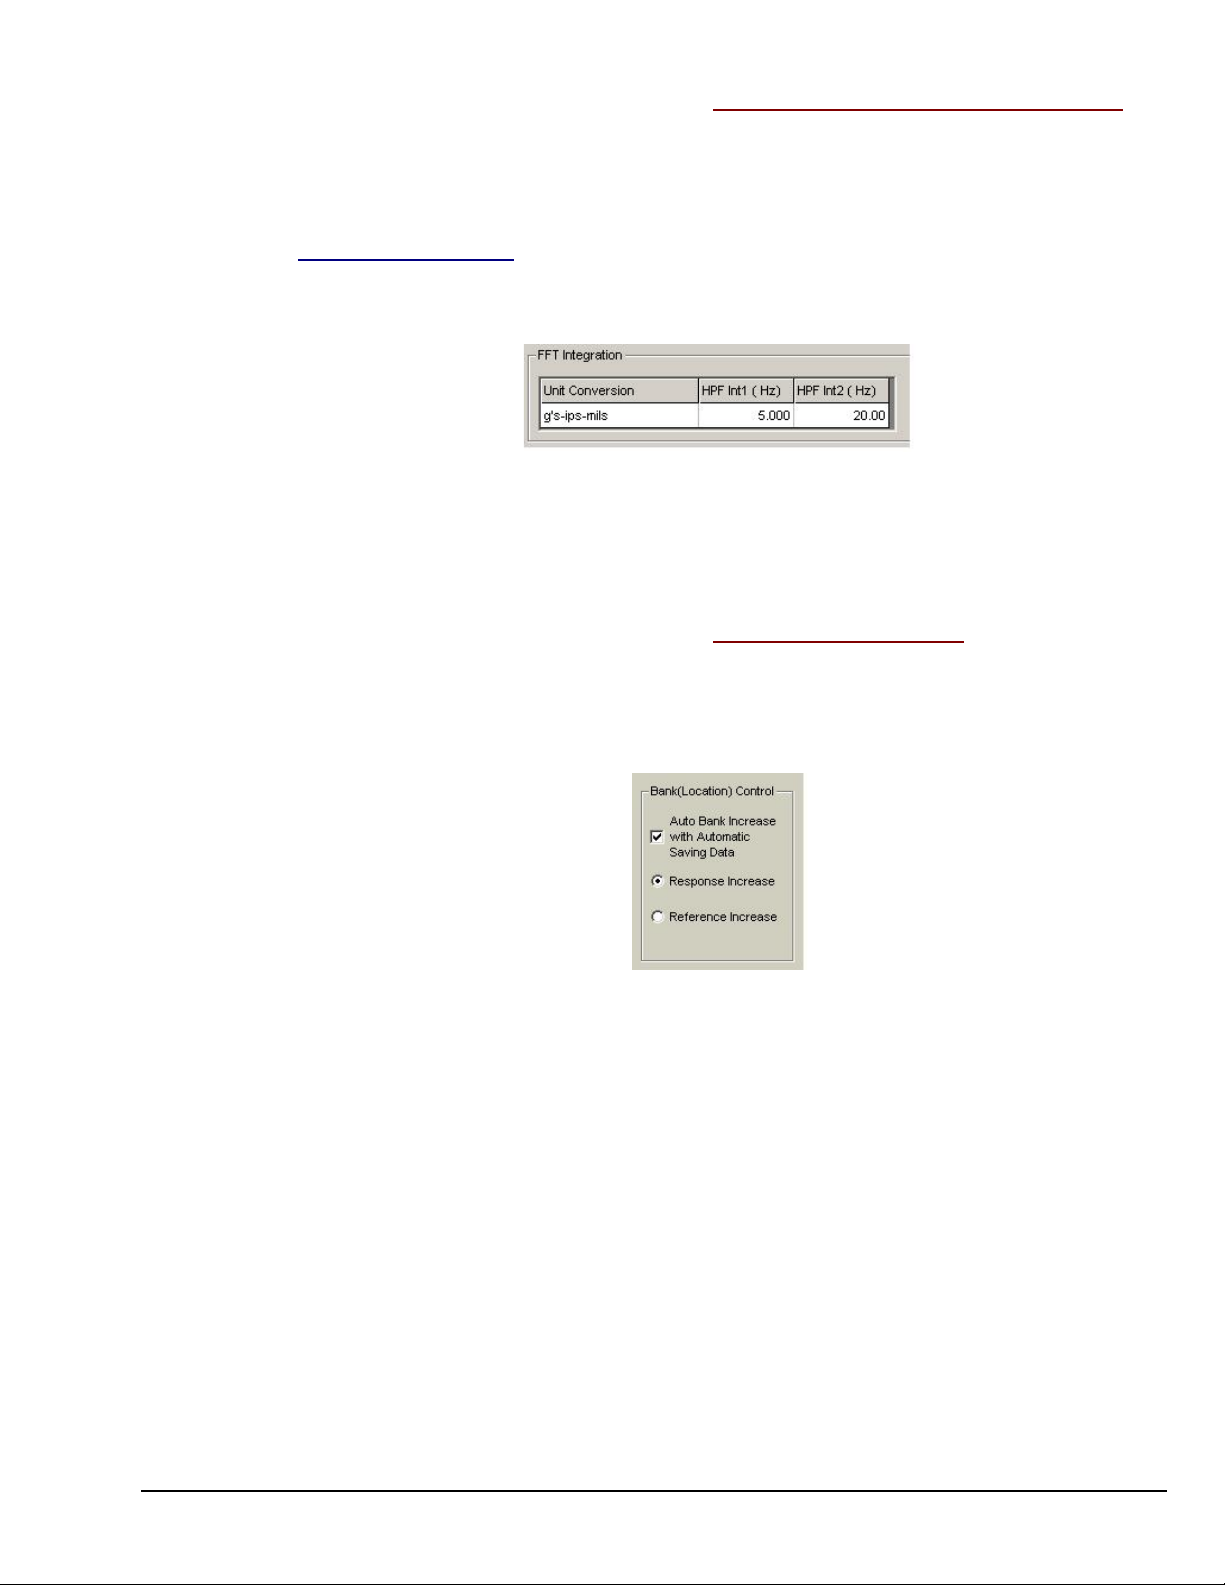
Edit Menu > Configuration >
FFT Setup Tab: Integration Panel / HPF Int1 and Int2*
The High Pass Filter Integration 1 (HPF Int1) and Integration 2 (HPF Int2) are used to remove the low
frequency effects of integration. All data points that exist below the specified value are set to zero. When
“Hz” is selected for the Acquisition Analysis Frequency via radio button on the Analyzer Tab, “Hz” is seen
as the units, when “CPM” is selected for the Acquisition Analysis Frequency via radio button on the
Analyzer Tab, “CPM” appears as the HPF units.
*eZ-FrequencyView Users: In eZ-FrequencyView, the associated panel is in the Miscellaneous Tab and
appears in a “Low Frequency Cutoff “ panel within an Integration panel. HPF Int1 is referred to as
“Single” for single-integration and HPF Int2 is referred to as “Double” for double-integration. See
Appendix C.
Low Frequency Cutoff Panel – 2 Views
HPF Int1 (Hz):
HPF Int2 (Hz):
Edit Menu > Configuration >
Enter a value for the cutoff amount for the first integration.
Enter a value for the cutoff amount for the second integration.
FFT Setup Tab: Bank (Location) Panel
Bank Location does not apply to eZ-PostView or to eZ-TimeView.
This panel relates to the Modal Locations window, which is accessed from eZ-Analyst Window’s pull-down
menu. The Bank (Location) Control Panel contains one check box and two radio buttons. Descriptions of
each follow.
Bank (Location) Control Panel
Note: This option is only effective when the averaging mode is used.
Auto Bank Increase with
Automatic Saving Data:
A Bank is a set of response channels. You can have eZ-Analyst increment
the banks automatically after each measurement, or you can manually
increment the banks. The number of active channels is used as the skip
factor for bank switching.
eZ-Analyst
If the Auto Bank Increase checkbox is checked, then the bank is
automatically incremented, but only when the automatic saving data option
is selected at Setup Export Function Data menu.
Response Increase:If the Response Increase radio-button is selected, the reference channel’s
location doesn’t change. The response’s location(s) are increased
[or decreased] for next available location numbers.
Reference Increase:
If the Reference Increase radio-button is selected, the response channel’s
location doesn’t change. The reference’s location(s) are increased
[or decreased] for next available location numbers.
Note: Decreasing location numbers are only available with the manual bank <Down> button on the Modal
Locations window. Modal Locations is accessed from eZ-Analyst Windows pull-down menu.
09-19-02
Menus and Windows 2-33
 Loading...