NXP MCUXpresso IDE SWO User Manual

MCUXpresso IDE SWO Trace
Guide
Rev. 11.3.0 — 2 April, 2021 User guide

NXP Semiconductors MCUXpresso IDE SWO Trace Guide
MCUXpresso IDE SWO Trace Guide -
User Guide
2 April, 2021
Copyright © 2021 NXP Semiconductors
All rights reserved.
All information provided in this document is subject to legal disclaimers
Rev. 11.3.0 — 2 April, 2021
© 2021 NXP Semiconductors. All rights reserved.
ii

NXP Semiconductors MCUXpresso IDE SWO Trace Guide
1. Trace Overview ............................................................................................................ 1
1.1. Debug Solution Differences ................................................................................ 1
1.1.1. LinkServer .............................................................................................. 1
1.1.2. PEmicro ................................................................................................. 2
1.1.3. SEGGER ................................................................................................ 2
1.2. Serial Wire Output (SWO) .................................................................................. 2
1.3. SWO Trace: Views ............................................................................................ 2
1.4. Starting SWO Trace .......................................................................................... 3
1.4.1. Target Clock Speed ................................................................................ 4
1.4.2. Part-Specific Configuration for SWO Trace ............................................... 4
1.4.3. SWO Trace Config View .................................................................... 4
2. Profiling ........................................................................................................................ 8
2.1. Overview ........................................................................................................... 8
2.2. SWO Profile View ........................................................................................ 8
3. ITM ............................................................................................................................ 10
3.1. Overview ......................................................................................................... 10
3.2. Using the ITM to Handle printf and scanf .......................................................... 10
3.3. SWO ITM Console View ............................................................................. 10
3.3.1. Toolbar ................................................................................................. 11
4. Interrupt Tracing ......................................................................................................... 12
4.1. Overview ......................................................................................................... 12
4.2. SWO Interrupts View (Statistics Tab) ................................................................ 12
4.3. SWO Interrupt View (Trace Tab) ...................................................................... 12
4.3.1. Zooming and Panning ........................................................................... 13
4.3.2. Time Axis ............................................................................................. 14
4.3.3. Interrupt Axis ........................................................................................ 14
4.3.4. Interpretation ......................................................................................... 14
4.3.5. Graph Buffer Depth ............................................................................... 14
4.4. SWO Interrupt Trace View (Table Tab) ............................................................. 15
4.4.1. Columns ............................................................................................... 15
5. Data Watch Trace ...................................................................................................... 17
5.1. Overview ......................................................................................................... 17
5.2. SWO Data Watch View ............................................................................... 17
5.2.1. Item Display .......................................................................................... 18
5.2.2. Trace Display ........................................................................................ 19
6. Performance Counters ................................................................................................ 20
6.1. Overview ......................................................................................................... 20
6.2. SWO Performance Counters View ............................................................... 20
6.2.1. Display features .................................................................................... 21
7. Bandwidth Considerations ........................................................................................... 22
7.1. Overview ......................................................................................................... 22
7.2. To Carry Out SWO Trace on LPC13xx ............................................................. 22
7.2.1. SWO Pin and Debug Connector ............................................................ 22
7.2.2. Enabling the Trace Clock ...................................................................... 22
7.2.3. SWO Pinmux Configuration ................................................................... 22
7.2.4. Example Setup Code for LPC1315/16/46/47 MCUs ................................. 23
7.2.5. Example Setup Code for LPC1311/13/42/43 MCUs ................................. 23
8. Appendix B – SWO Trace Setup for LPC15xx ............................................................. 24
8.1. To Carry Out SWO Trace on LPC15xx ............................................................. 24
8.1.1. SWO Pin and Debug Connector ............................................................ 24
8.1.2. Enabling the Trace Clock ...................................................................... 24
8.1.3. SWO Switch Matrix Configuration .......................................................... 24
9. Appendix C – SWO Trace Setup for LPC5410x ........................................................... 26
9.1. To Carry Out SWO Trace on LPC5410x ........................................................... 26
9.1.1. SWO Pin and Debug Connector ............................................................ 26
9.1.2. Debug Probe ........................................................................................ 26
MCUXpresso IDE SWO Trace Guide -
User Guide
All information provided in this document is subject to legal disclaimers
Rev. 11.3.0 — 2 April, 2021
© 2021 NXP Semiconductors. All rights reserved.
iii

NXP Semiconductors MCUXpresso IDE SWO Trace Guide
9.1.3. Enabling the Trace Clock ...................................................................... 26
9.1.4. SWO Pinmux Configuration ................................................................... 27
10. Appendix D – SWO Trace Setup for LPC5411x ......................................................... 28
10.1. To Carry Out SWO Trace on LPC5411x ......................................................... 28
10.1.1. SWO Pin and Debug Connector .......................................................... 28
10.1.2. Debug Probe ...................................................................................... 28
10.1.3. Enabling the Trace Clock .................................................................... 28
10.1.4. SWO Pinmux Configuration ................................................................. 29
11. Appendix E – SWO Trace Setup for LPC546xx .......................................................... 30
11.1. To Carry Out SWO Trace on LPC546xx ......................................................... 30
11.1.1. SWO Pin and Debug Connector .......................................................... 30
11.1.2. Enabling the Trace Clock .................................................................... 30
11.1.3. SWO Pinmux Configuration ................................................................. 30
MCUXpresso IDE SWO Trace Guide -
User Guide
All information provided in this document is subject to legal disclaimers
Rev. 11.3.0 — 2 April, 2021
© 2021 NXP Semiconductors. All rights reserved.
iv

NXP Semiconductors MCUXpresso IDE SWO Trace Guide
1. Trace Overview
There are two different kinds of tracing technologies available directly within MCUXpresso IDE.
• Instruction Trace - capturing an instruction stream within onboard RAM of the MCU. This
data can then be retrieved, decoded, and displayed within the IDE.
• SWO Trace - capturing events occurring on a running MCU in real time
The rest of this guide looks at SWO Trace. For information regarding Instruction Trace, see the
Instruction Trace Guide.
MCUXpresso IDE’s SWO Trace functionality can be used with all supported debug solutions,
however SWO requires connection to the target MCU using a compatible debug probe such as:
• LinkServer LPC-Link2 (stand alone or built into many LPCXpresso development boards and
some iMX RT EVK boards)
• SEGGER J-Link
• all stand alone versions but refer to SEGGER’s website for details
• PEmicro
• Multilink Universal RevD
• Multilink Universal FX Rev C
• Multilink ACP Rev B
Note: SWO cannot be used with other CMSIS-DAP based probes or with LPC-Link2 debug
probes using the non default Non Bridged (NB) or Serial (ser) firmware. Non LinkServer probes
may also provide SWO trace capabilities via other software – check the vendors' websites for
more details.
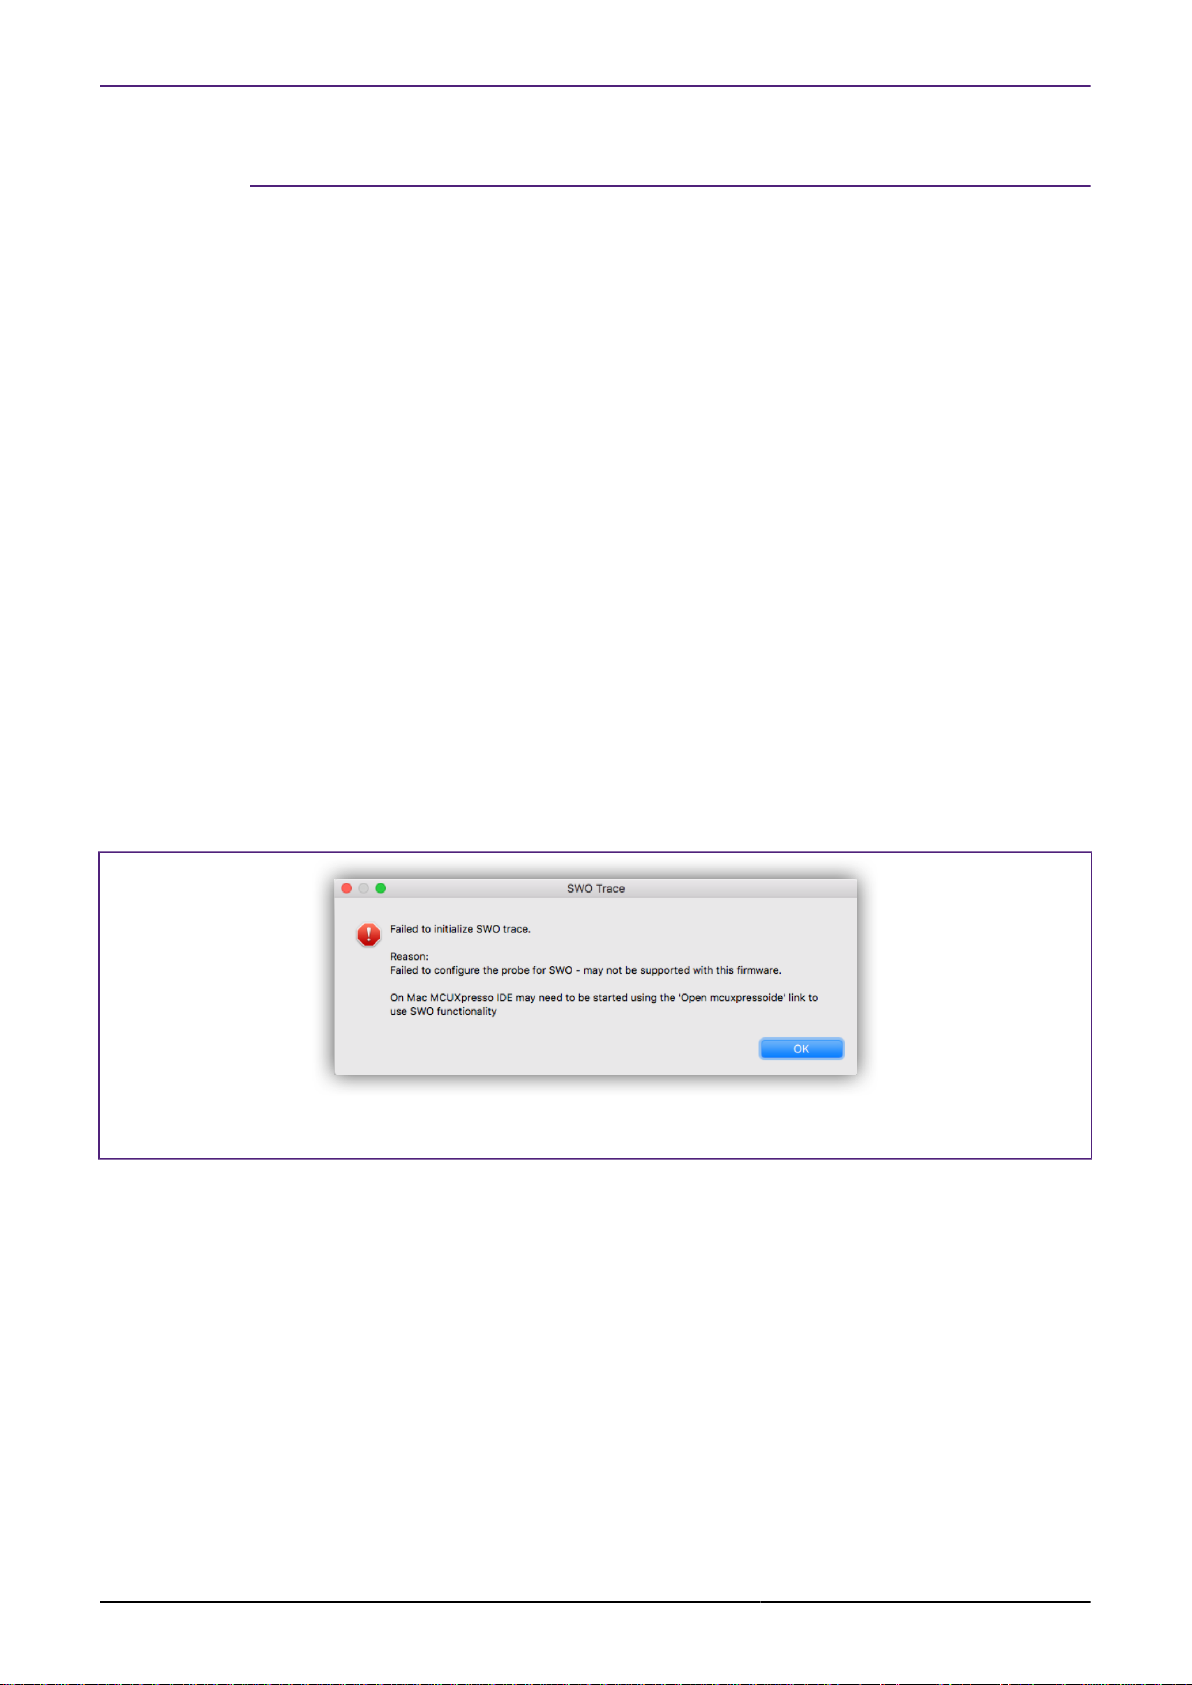
If SWO trace is used with a non compatible debug probe an error such as this will be issues:
Figure 1.1. Probe not Compatible
Important Note: SWO debug features will only be available if supported by the target MCU,
target board and the project being debugged has correct pin muxing and clock setup.
Note that SWO Trace may sometimes be referred to as SWV Trace (Serial Wire Viewer). Even
the ARM documentation uses the two terms interchangeably.
1.1 Debug Solution Differences
Although SWO trace will function in a very similar manner with all supported debug solutions (that
support SWO trace capture). There are some minor differences that will be discussed below.
1.1.1 LinkServer
LinkServer debug connections allow SWO trace capture to be started and stopped while the
target is running.
MCUXpresso IDE SWO Trace Guide -
User Guide
All information provided in this document is subject to legal disclaimers
Rev. 11.3.0 — 2 April, 2021
© 2021 NXP Semiconductors. All rights reserved.
1

NXP Semiconductors MCUXpresso IDE SWO Trace Guide
The correct Target clock speed must be sampled to allow the internal sampling rates to be
calculated correctly. Please see the section on SWO Trace Configuration [4] for further
information.
1.1.2 PEmicro
The target must be halted for SWO trace capture to be started or stopped.
The PEmicro debug chain will automatically calculate the target clock speed therefore this
configuration step is not required to establish trace capture. However, if MCUXpresso IDE doesn’t
know the target clock speed, certain calculated timing information will be inaccurate. Therefore
it is recommended that the target clock speed is sampled as for LinkServer debug connections.
1.1.3 SEGGER
The target must be halted for SWO trace capture to be started or stopped.
The correct Target clock speed must be sampled to allow the internal sampling rates to be
calculated correctly. Please see the section on SWO Trace Configuration [4] for further
information.
1.2 Serial Wire Output (SWO)
ARM’s Coresight debug architecture allows data to be sampled and streamed from the MCU to
the host completely non intrusively. This scheme allows events such as periodic PC sampling,
interrupts, etc. to be captured and transmitted by the debug probe with no effect on MCU
performance and without the need for any code instrumentation or changes.
The Serial Wire Output (SWO) tools provide access to the memory of a running target, and
facilitate Trace without needing to interrupt the target. Support for SWO is generally provided
by all Cortex-M3 and M4 based MCUs. It requires just one extra pin in addition to the standard
Serial Wire Debug (SWD) connection (but cannot be used if a JTAG debug connection is being
used). Cortex-M0 and Cortex-M0+ based MCUs do not have SWO capabilities.
MCUXpresso IDE presents target information collected using SWO from a Cortex-M3/M4 based
MCU in several different Views.
Table 1.1. SWO trace feature
Feature SWO Trace
Data watch yes
Profile yes
Interrupt Statistics yes
Graphical Interrupt Trace yes
ITM text console yes
Counters yes
Note : Introduced in MCUXpresso IDE version 10.2.0 – all trace features are available in the
‘Free Edition’. In earlier version of MCUXpresso IDE, certain features such as Graphical Interrupt
Trace were restricted to the ‘Pro’ edition.
1.3 SWO Trace: Views
SWO Trace can capture a range of target activities and these are controlled and displayed via
a set of views:
• SWO Trace Config - Contains 3 tabs and groups multiple informations:
MCUXpresso IDE SWO Trace Guide -
User Guide
• Configuration - Setting of the Trace Clock Speed and ITM Stimulus Ports
All information provided in this document is subject to legal disclaimers
Rev. 11.3.0 — 2 April, 2021
© 2021 NXP Semiconductors. All rights reserved.
2

NXP Semiconductors MCUXpresso IDE SWO Trace Guide
• Status - Shows the status of the SWO Trace connection
• Statistics - Displays Trace channel bandwidth usage and low-level debug information
related to the SWO Trace connection
• SWO Profile
• Provides a statistical profile of application activity
• SWO ITM Console
• A debug console for reading and writing text to and from your application
• SWO Interrupt – Contains 3 interpretations of captured Interrupt data
• Trace - Plots a time-line trace of interrupts
• Statistics - Provides counts and timing information for interrupts and interrupt handlers
• Table - Lists the raw entry, exit, and return SWO events for interrupt handlers
• SWO Data
• Monitors (and captures) up to four memory locations in real time, without stopping the CPU
• SWO Counters
• Displays the target’s performance counters
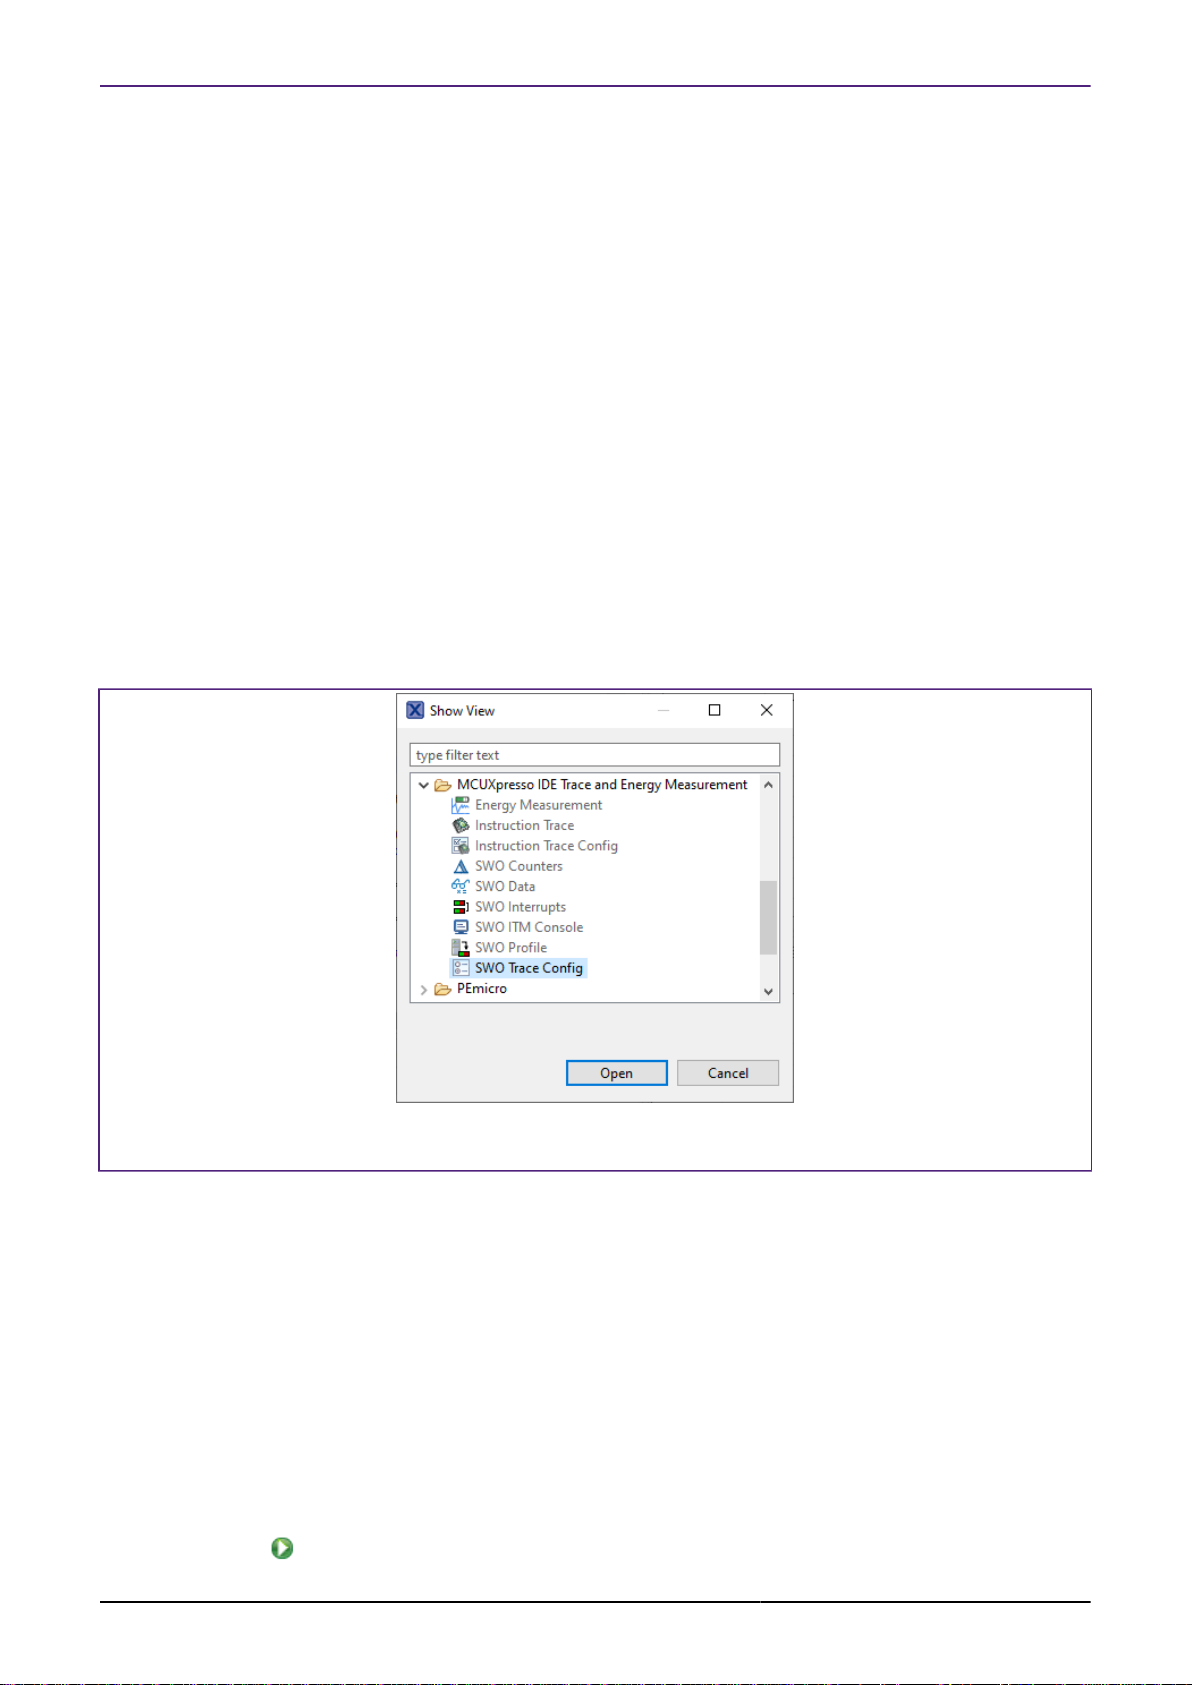
All the SWO views are presented within the Analysis Perspective by default. Trace Views that
are not required may be closed to simplify the user interface. They may also be opened using
the Window -> Show View -> Other... menu item.
Figure 1.2. Reopening a View
1.4 Starting SWO Trace
To use SWO Trace’s features, you must be debugging an application on a Cortex-M3/M4/M7/
M33 based MCU, connected via a supported debug probe using the SWD protocol.
You may start SWO Trace at any time while debugging your program. The program does not
have to be stopped at a breakpoint or paused (LinkServer only). Before the collection of data
commences, SWO Trace may prompt you to enter the target clock speed.
Note: Only LinkServer debug connections support starting and stopping trace while the target
is running.
Trace collection for each View is controlled by the buttons in its toolbar.
•
- starts Trace collection for that View
MCUXpresso IDE SWO Trace Guide -
User Guide
All information provided in this document is subject to legal disclaimers
Rev. 11.3.0 — 2 April, 2021
© 2021 NXP Semiconductors. All rights reserved.
3

NXP Semiconductors MCUXpresso IDE SWO Trace Guide
•
- stops Trace collection for that View
•
- deletes the collected Trace from the View
•
- opens the SWO Config View
More than one View may be configured to collect Trace at a time. However, the bandwidth of the
Trace channel is limited and may become saturated, resulting in data loss. Try disabling other
SWO Trace Views if you do not see Trace data coming through. The SWO Trace Config View
– Statistics Tab provides an overview of the SWO channel load.
1.4.1 Target Clock Speed
Due to the way the Trace data is transferred by the Cortex CPU within the MCU, setting the
correct clock speed within the SWO Trace interface is essential to determine the correct baud
rate for the data transfer. If the clock speed setting does not match the actual clock speed of
the processor then data will be lost and/or corrupted. This can result in no data being visualized,
or unexpected Trace data.
The first time Trace is used in a project you will be asked to enter the target clock speed.
SWO Trace attempts to read the clock speed from the SystemCoreClock global variable and will
suggest that value if found. The SystemCoreClock is usually set to the current clock speed of
the target. Take care to use it after the application has set the clock speed for normal operation,
otherwise it may provide an inappropriate value. If that variable does not exist or has not been
set to the core clock frequency you will need to manually enter the clock frequency.
Once set, the target core clock speed is saved in the project configuration. The saved value can
be viewed and changed from the SWO Trace Config View in Configuration tab.
1.4.2 Part-Specific Configuration for SWO Trace
Most MCUs should not need any special configuration to use SWO Trace. However, some may
require additional configuration to enable SWO output, for instance to set up the correct pin
muxing or to enable a Trace clock.
Parts that require extra configuration include the LPC13xx, LPC15xx, LPC541xx and LPC546xx
families.
Further details on the above parts can be found in the Appendices of this guide. However, it
is generally recommended to check the user or reference manual for the MCU being used for
details of any required SWO configuration details.
1.4.3
SWO Trace Config View
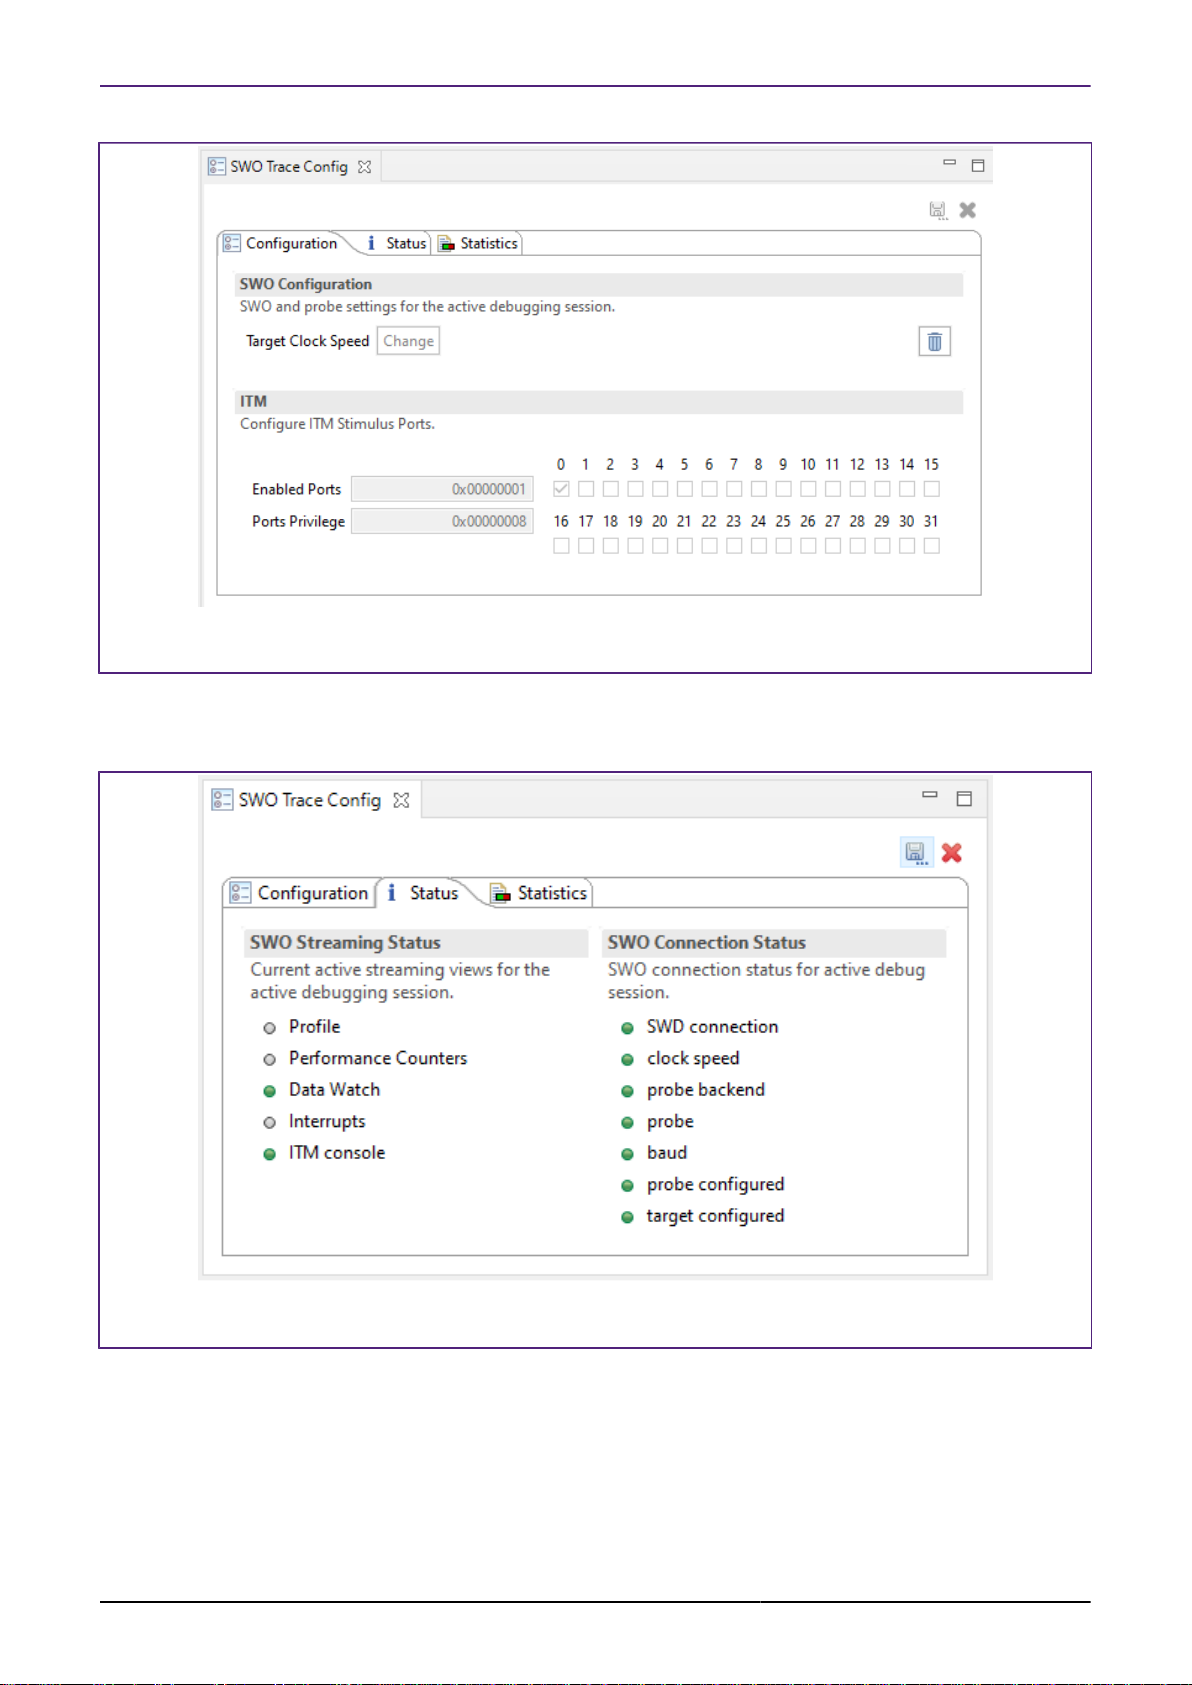
The SWO Trace Config View contains 3 different tabs and groups multiple information.
• Configuration Tab - Setting of the Trace Clock Speed and ITM Stimulus Ports
Note
If the clock speed is entered incorrectly you may see unexpected Trace data or no
Trace data. For a particular target clock speed, the maximum SWO link speed will
automatically be calculated for the attached debug probe (and highlighted as above).
Faster link speeds will enable the capture of more SWO trace information.
Important Note: A typical SDK project or example sets the target clock speed after main() is
called in a function of the form BOARD_BootClockRUN(), therefore it is important to run beyond
this function before sampling the current target clock speed.
MCUXpresso IDE SWO Trace Guide -
User Guide
All information provided in this document is subject to legal disclaimers
Rev. 11.3.0 — 2 April, 2021
© 2021 NXP Semiconductors. All rights reserved.
4

NXP Semiconductors MCUXpresso IDE SWO Trace Guide
Figure 1.3. SWO Trace Config View – Configuration Tab
• Status Tab - Shows the status of the SWO Trace connection. When SWO Trace is correctly
configured all lights will be green.
Figure 1.4. SWO Trace Config View – Status Tab
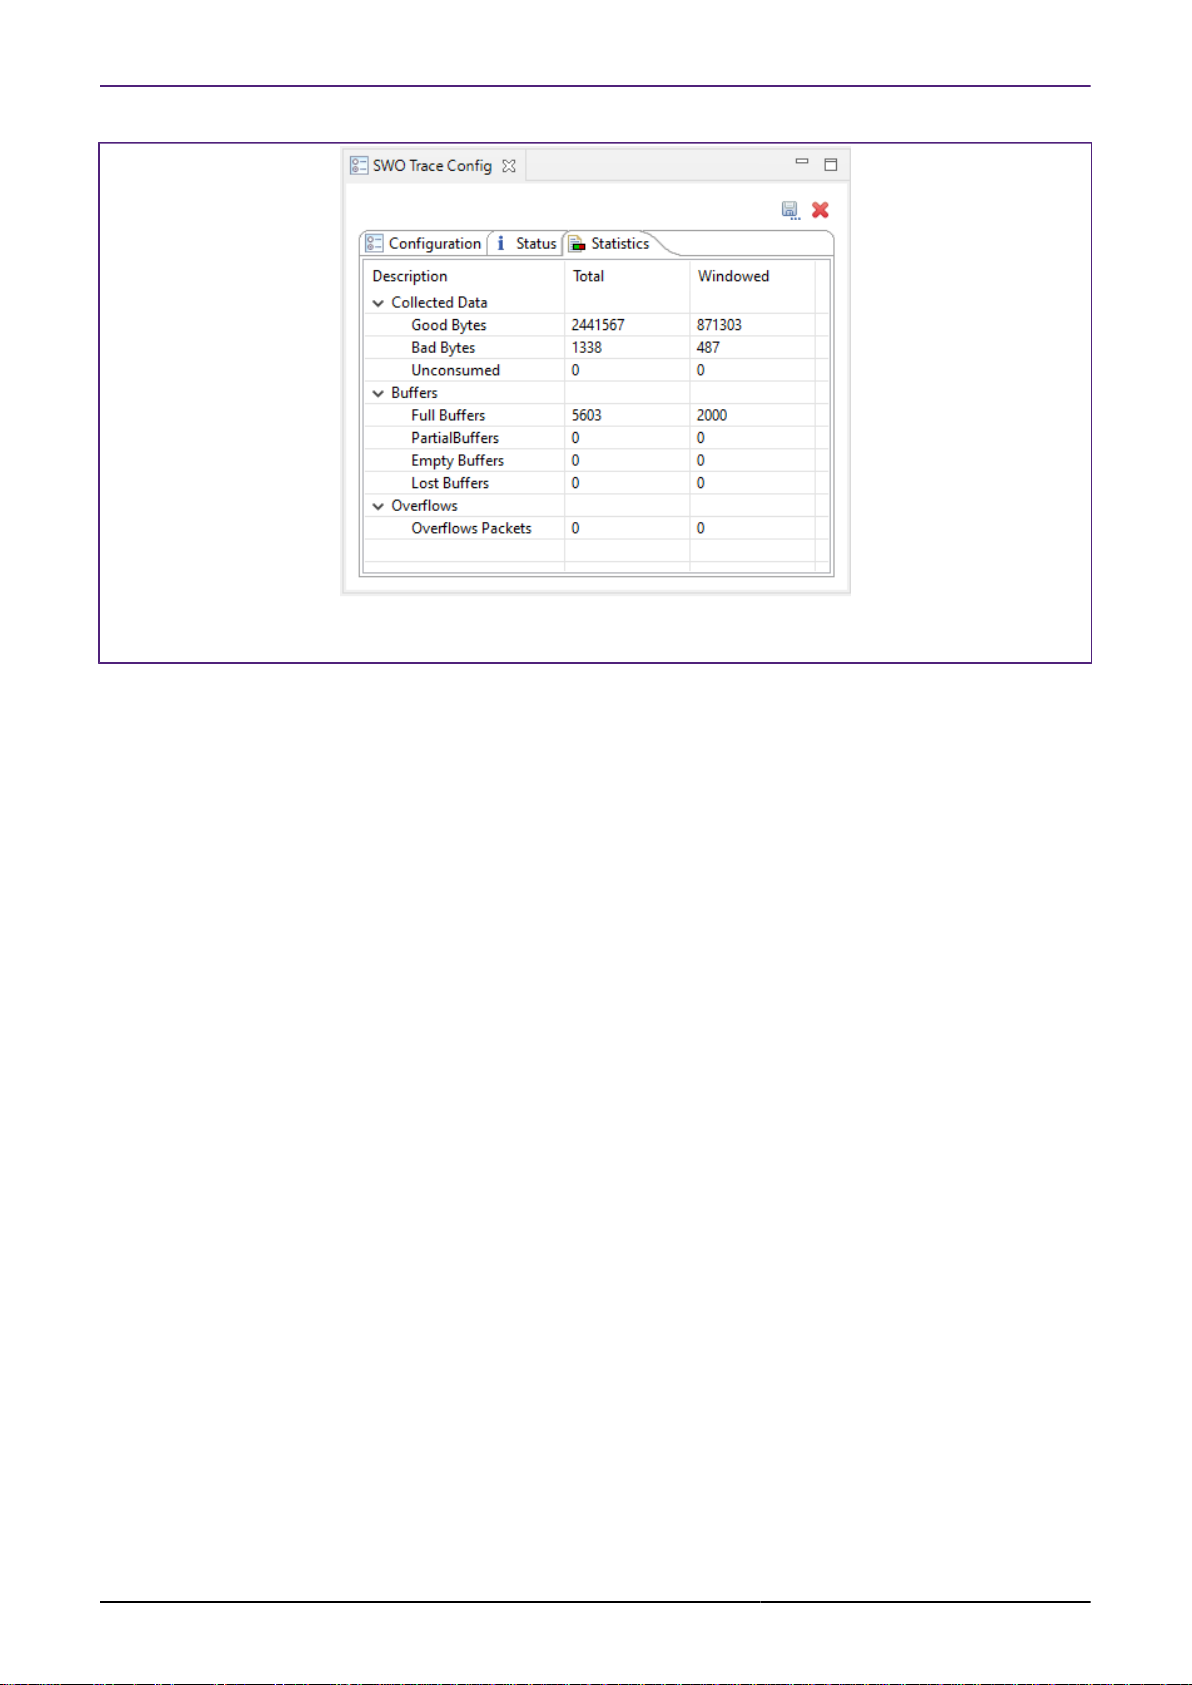
• Statistics Tab - Displays Trace channel bandwidth usage and low-level debug information
related to the SWO Trace connection
The SWO Statistics Tab View provides a low-level display of the utilization of the different parts
of the SWO pipeline. This View allows you to identify any bottlenecks in the SWO pipeline, which
may indicate that they are overloading the SWO channel. SWO data is collected into buffers and
sent, a buffer at a time, to the MCUXpresso IDE.
MCUXpresso IDE SWO Trace Guide -
User Guide
All information provided in this document is subject to legal disclaimers
Rev. 11.3.0 — 2 April, 2021
© 2021 NXP Semiconductors. All rights reserved.
5

NXP Semiconductors MCUXpresso IDE SWO Trace Guide
For metric two numbers are presented: the total for the entire SWO session in the “Total” column
and the data for the last 2000 collected buffers (corresponding to the last 2s) in the “Windowed”
column.
This list will help you interpret the presented statistics:
• Collected Data
• Shows how much of the data is being detected as valid, expected, SWO packets.
• A few bad bytes can be expected in normal operation.
• If the number of bad bytes is greater than or the same order of magnitude as good bytes it
suggests that the SWO stream is corrupted.
• This can often be caused when SWO Trace is configured with the wrong target clock
speed.
• Buffers
• This presents the USB utilization. The windowed statistics are most useful here.
• The more full buffers there are, relative to the empty buffers, the heavier the USB load is.
• The windowed statistics for the full and empty buffers add up to 2000.
• If full = 700 and empty = 1300 you have a lot of head room in the USB channel and should
not be losing data there
• If full = 1978 and empty = 22 the USB channel is nearly fully utilized, and bursts of data
may saturate the USB channel, resulting in lost data.
• Seeing the number of empty buffers increase but no full buffers, when you are expecting to
see data, implies that the target may not be configured correctly – your target may require
additional configuration. See “Overview of Trace support in MCUXpresso IDE” at https://
community.nxp.com/message/630730 for more information.
• Lost buffers
• This shows the number of buffers of SWO data that were collected by the probe from the
target, but were not sent over USB before being overwritten with new data.
• It is possible to lose buffers even if the USB channel is not fully saturated.
• A high number of lost buffers relative to full buffers indicates that the SWO channel is
overloaded.
• A small number of lost buffers is likely to occur in normal operation.
• Overflow packets
• When the trace hardware on the target generates more data than it can send out of the SWO
pin, it generates an Overflow packet.
• This indicates that the SWO channel is overloaded.
• Some Overflow packets can be expected, but most of the time you should aim to have 0
overflow packets in the windowed statistics.
MCUXpresso IDE SWO Trace Guide -
User Guide
All information provided in this document is subject to legal disclaimers
Rev. 11.3.0 — 2 April, 2021
© 2021 NXP Semiconductors. All rights reserved.
6

NXP Semiconductors MCUXpresso IDE SWO Trace Guide
Figure 1.5. SWO Trace Config View – Statictics Tab
MCUXpresso IDE SWO Trace Guide -
User Guide
All information provided in this document is subject to legal disclaimers
Rev. 11.3.0 — 2 April, 2021
© 2021 NXP Semiconductors. All rights reserved.
7
 Loading...