

Page 1

MCUXpresso IDE SWO Trace
Guide
Rev. 11.3.0 — 2 April, 2021 User guide
Page 2

NXP Semiconductors MCUXpresso IDE SWO Trace Guide
MCUXpresso IDE SWO Trace Guide -
User Guide
2 April, 2021
Copyright © 2021 NXP Semiconductors
All rights reserved.
All information provided in this document is subject to legal disclaimers
Rev. 11.3.0 — 2 April, 2021
© 2021 NXP Semiconductors. All rights reserved.
ii
Page 3

NXP Semiconductors MCUXpresso IDE SWO Trace Guide
1. Trace Overview ............................................................................................................ 1
1.1. Debug Solution Differences ................................................................................ 1
1.1.1. LinkServer .............................................................................................. 1
1.1.2. PEmicro ................................................................................................. 2
1.1.3. SEGGER ................................................................................................ 2
1.2. Serial Wire Output (SWO) .................................................................................. 2
1.3. SWO Trace: Views ............................................................................................ 2
1.4. Starting SWO Trace .......................................................................................... 3
1.4.1. Target Clock Speed ................................................................................ 4
1.4.2. Part-Specific Configuration for SWO Trace ............................................... 4
1.4.3. SWO Trace Config View .................................................................... 4
2. Profiling ........................................................................................................................ 8
2.1. Overview ........................................................................................................... 8
2.2. SWO Profile View ........................................................................................ 8
3. ITM ............................................................................................................................ 10
3.1. Overview ......................................................................................................... 10
3.2. Using the ITM to Handle printf and scanf .......................................................... 10
3.3. SWO ITM Console View ............................................................................. 10
3.3.1. Toolbar ................................................................................................. 11
4. Interrupt Tracing ......................................................................................................... 12
4.1. Overview ......................................................................................................... 12
4.2. SWO Interrupts View (Statistics Tab) ................................................................ 12
4.3. SWO Interrupt View (Trace Tab) ...................................................................... 12
4.3.1. Zooming and Panning ........................................................................... 13
4.3.2. Time Axis ............................................................................................. 14
4.3.3. Interrupt Axis ........................................................................................ 14
4.3.4. Interpretation ......................................................................................... 14
4.3.5. Graph Buffer Depth ............................................................................... 14
4.4. SWO Interrupt Trace View (Table Tab) ............................................................. 15
4.4.1. Columns ............................................................................................... 15
5. Data Watch Trace ...................................................................................................... 17
5.1. Overview ......................................................................................................... 17
5.2. SWO Data Watch View ............................................................................... 17
5.2.1. Item Display .......................................................................................... 18
5.2.2. Trace Display ........................................................................................ 19
6. Performance Counters ................................................................................................ 20
6.1. Overview ......................................................................................................... 20
6.2. SWO Performance Counters View ............................................................... 20
6.2.1. Display features .................................................................................... 21
7. Bandwidth Considerations ........................................................................................... 22
7.1. Overview ......................................................................................................... 22
7.2. To Carry Out SWO Trace on LPC13xx ............................................................. 22
7.2.1. SWO Pin and Debug Connector ............................................................ 22
7.2.2. Enabling the Trace Clock ...................................................................... 22
7.2.3. SWO Pinmux Configuration ................................................................... 22
7.2.4. Example Setup Code for LPC1315/16/46/47 MCUs ................................. 23
7.2.5. Example Setup Code for LPC1311/13/42/43 MCUs ................................. 23
8. Appendix B – SWO Trace Setup for LPC15xx ............................................................. 24
8.1. To Carry Out SWO Trace on LPC15xx ............................................................. 24
8.1.1. SWO Pin and Debug Connector ............................................................ 24
8.1.2. Enabling the Trace Clock ...................................................................... 24
8.1.3. SWO Switch Matrix Configuration .......................................................... 24
9. Appendix C – SWO Trace Setup for LPC5410x ........................................................... 26
9.1. To Carry Out SWO Trace on LPC5410x ........................................................... 26
9.1.1. SWO Pin and Debug Connector ............................................................ 26
9.1.2. Debug Probe ........................................................................................ 26
MCUXpresso IDE SWO Trace Guide -
User Guide
All information provided in this document is subject to legal disclaimers
Rev. 11.3.0 — 2 April, 2021
© 2021 NXP Semiconductors. All rights reserved.
iii
Page 4

NXP Semiconductors MCUXpresso IDE SWO Trace Guide
9.1.3. Enabling the Trace Clock ...................................................................... 26
9.1.4. SWO Pinmux Configuration ................................................................... 27
10. Appendix D – SWO Trace Setup for LPC5411x ......................................................... 28
10.1. To Carry Out SWO Trace on LPC5411x ......................................................... 28
10.1.1. SWO Pin and Debug Connector .......................................................... 28
10.1.2. Debug Probe ...................................................................................... 28
10.1.3. Enabling the Trace Clock .................................................................... 28
10.1.4. SWO Pinmux Configuration ................................................................. 29
11. Appendix E – SWO Trace Setup for LPC546xx .......................................................... 30
11.1. To Carry Out SWO Trace on LPC546xx ......................................................... 30
11.1.1. SWO Pin and Debug Connector .......................................................... 30
11.1.2. Enabling the Trace Clock .................................................................... 30
11.1.3. SWO Pinmux Configuration ................................................................. 30
MCUXpresso IDE SWO Trace Guide -
User Guide
All information provided in this document is subject to legal disclaimers
Rev. 11.3.0 — 2 April, 2021
© 2021 NXP Semiconductors. All rights reserved.
iv
Page 5
NXP Semiconductors MCUXpresso IDE SWO Trace Guide
1. Trace Overview
There are two different kinds of tracing technologies available directly within MCUXpresso IDE.
• Instruction Trace - capturing an instruction stream within onboard RAM of the MCU. This
data can then be retrieved, decoded, and displayed within the IDE.
• SWO Trace - capturing events occurring on a running MCU in real time
The rest of this guide looks at SWO Trace. For information regarding Instruction Trace, see the
Instruction Trace Guide.
MCUXpresso IDE’s SWO Trace functionality can be used with all supported debug solutions,
however SWO requires connection to the target MCU using a compatible debug probe such as:
• LinkServer LPC-Link2 (stand alone or built into many LPCXpresso development boards and
some iMX RT EVK boards)
• SEGGER J-Link
• all stand alone versions but refer to SEGGER’s website for details
• PEmicro
• Multilink Universal RevD
• Multilink Universal FX Rev C
• Multilink ACP Rev B
Note: SWO cannot be used with other CMSIS-DAP based probes or with LPC-Link2 debug
probes using the non default Non Bridged (NB) or Serial (ser) firmware. Non LinkServer probes
may also provide SWO trace capabilities via other software – check the vendors' websites for
more details.
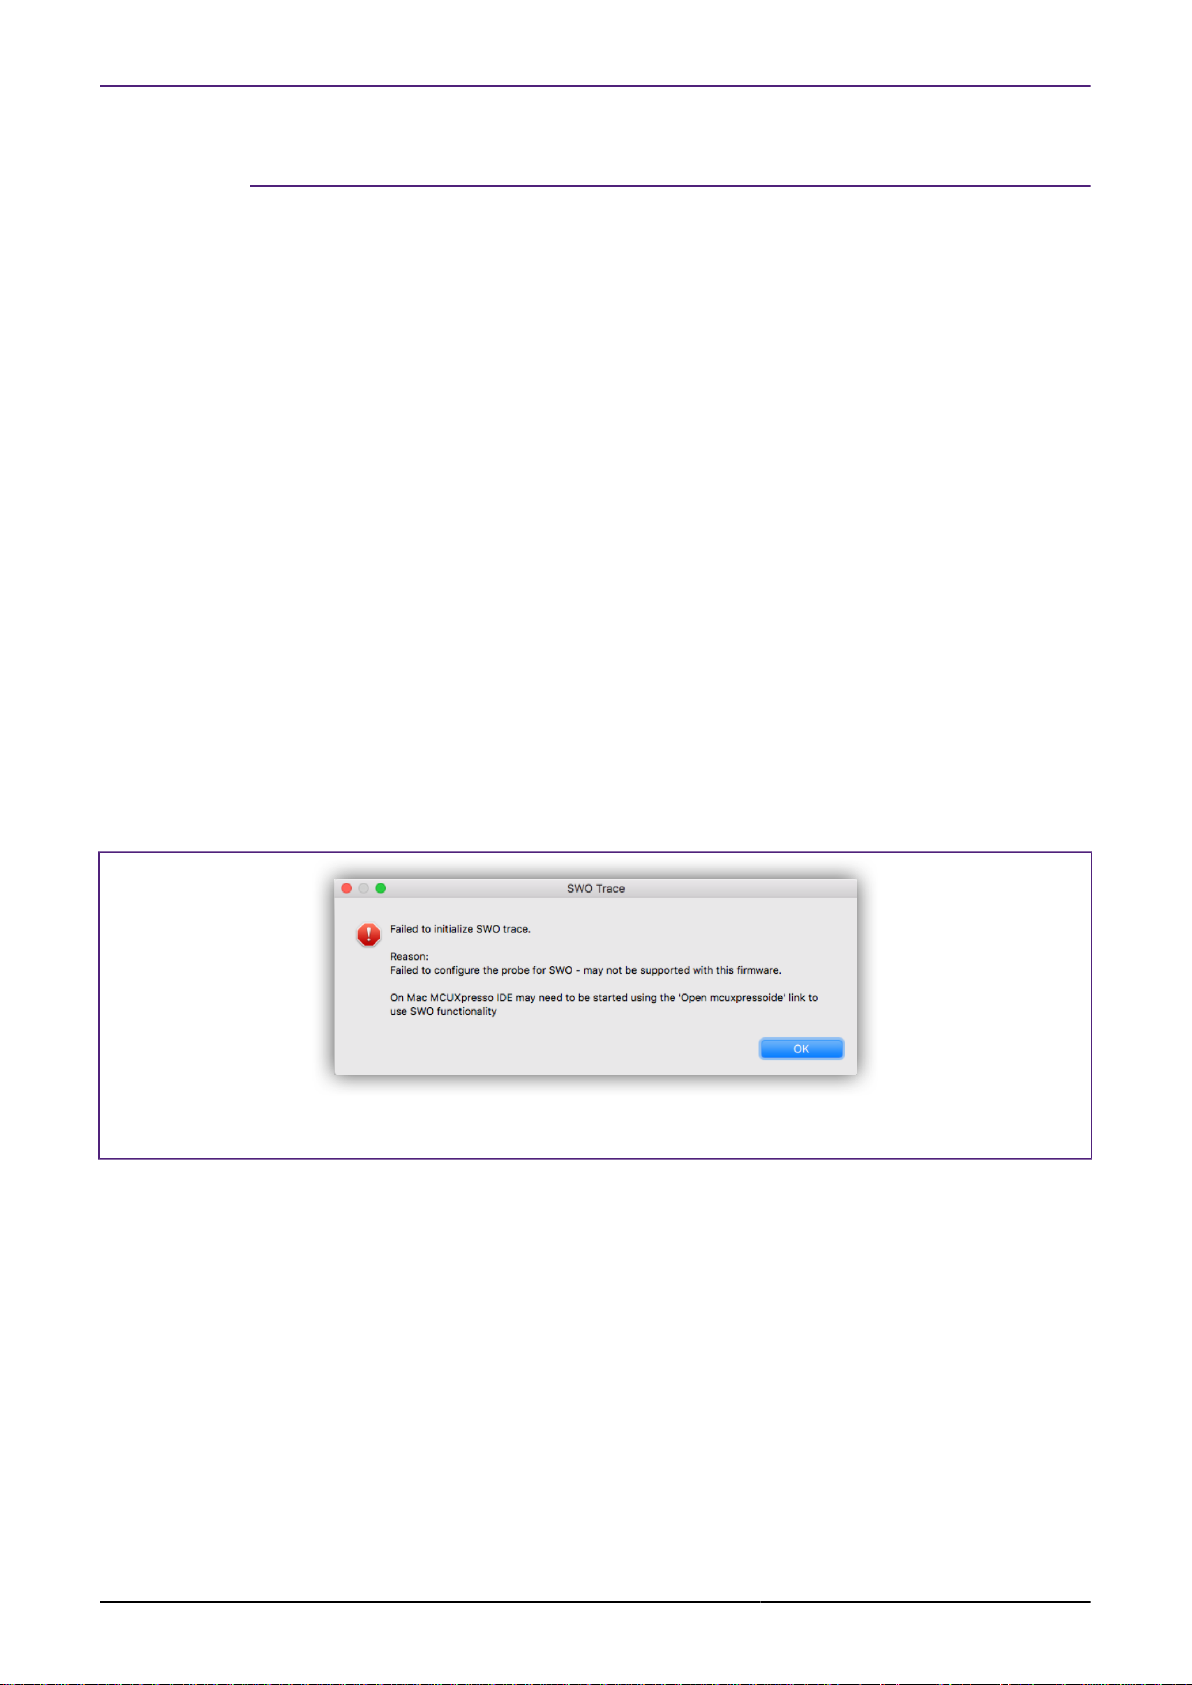
If SWO trace is used with a non compatible debug probe an error such as this will be issues:
Figure 1.1. Probe not Compatible
Important Note: SWO debug features will only be available if supported by the target MCU,
target board and the project being debugged has correct pin muxing and clock setup.
Note that SWO Trace may sometimes be referred to as SWV Trace (Serial Wire Viewer). Even
the ARM documentation uses the two terms interchangeably.
1.1 Debug Solution Differences
Although SWO trace will function in a very similar manner with all supported debug solutions (that
support SWO trace capture). There are some minor differences that will be discussed below.
1.1.1 LinkServer
LinkServer debug connections allow SWO trace capture to be started and stopped while the
target is running.
MCUXpresso IDE SWO Trace Guide -
User Guide
All information provided in this document is subject to legal disclaimers
Rev. 11.3.0 — 2 April, 2021
© 2021 NXP Semiconductors. All rights reserved.
1
Page 6

NXP Semiconductors MCUXpresso IDE SWO Trace Guide
The correct Target clock speed must be sampled to allow the internal sampling rates to be
calculated correctly. Please see the section on SWO Trace Configuration [4] for further
information.
1.1.2 PEmicro
The target must be halted for SWO trace capture to be started or stopped.
The PEmicro debug chain will automatically calculate the target clock speed therefore this
configuration step is not required to establish trace capture. However, if MCUXpresso IDE doesn’t
know the target clock speed, certain calculated timing information will be inaccurate. Therefore
it is recommended that the target clock speed is sampled as for LinkServer debug connections.
1.1.3 SEGGER
The target must be halted for SWO trace capture to be started or stopped.
The correct Target clock speed must be sampled to allow the internal sampling rates to be
calculated correctly. Please see the section on SWO Trace Configuration [4] for further
information.
1.2 Serial Wire Output (SWO)
ARM’s Coresight debug architecture allows data to be sampled and streamed from the MCU to
the host completely non intrusively. This scheme allows events such as periodic PC sampling,
interrupts, etc. to be captured and transmitted by the debug probe with no effect on MCU
performance and without the need for any code instrumentation or changes.
The Serial Wire Output (SWO) tools provide access to the memory of a running target, and
facilitate Trace without needing to interrupt the target. Support for SWO is generally provided
by all Cortex-M3 and M4 based MCUs. It requires just one extra pin in addition to the standard
Serial Wire Debug (SWD) connection (but cannot be used if a JTAG debug connection is being
used). Cortex-M0 and Cortex-M0+ based MCUs do not have SWO capabilities.
MCUXpresso IDE presents target information collected using SWO from a Cortex-M3/M4 based
MCU in several different Views.
Table 1.1. SWO trace feature
Feature SWO Trace
Data watch yes
Profile yes
Interrupt Statistics yes
Graphical Interrupt Trace yes
ITM text console yes
Counters yes
Note : Introduced in MCUXpresso IDE version 10.2.0 – all trace features are available in the
‘Free Edition’. In earlier version of MCUXpresso IDE, certain features such as Graphical Interrupt
Trace were restricted to the ‘Pro’ edition.
1.3 SWO Trace: Views
SWO Trace can capture a range of target activities and these are controlled and displayed via
a set of views:
• SWO Trace Config - Contains 3 tabs and groups multiple informations:
MCUXpresso IDE SWO Trace Guide -
User Guide
• Configuration - Setting of the Trace Clock Speed and ITM Stimulus Ports
All information provided in this document is subject to legal disclaimers
Rev. 11.3.0 — 2 April, 2021
© 2021 NXP Semiconductors. All rights reserved.
2
Page 7
NXP Semiconductors MCUXpresso IDE SWO Trace Guide
• Status - Shows the status of the SWO Trace connection
• Statistics - Displays Trace channel bandwidth usage and low-level debug information
related to the SWO Trace connection
• SWO Profile
• Provides a statistical profile of application activity
• SWO ITM Console
• A debug console for reading and writing text to and from your application
• SWO Interrupt – Contains 3 interpretations of captured Interrupt data
• Trace - Plots a time-line trace of interrupts
• Statistics - Provides counts and timing information for interrupts and interrupt handlers
• Table - Lists the raw entry, exit, and return SWO events for interrupt handlers
• SWO Data
• Monitors (and captures) up to four memory locations in real time, without stopping the CPU
• SWO Counters
• Displays the target’s performance counters
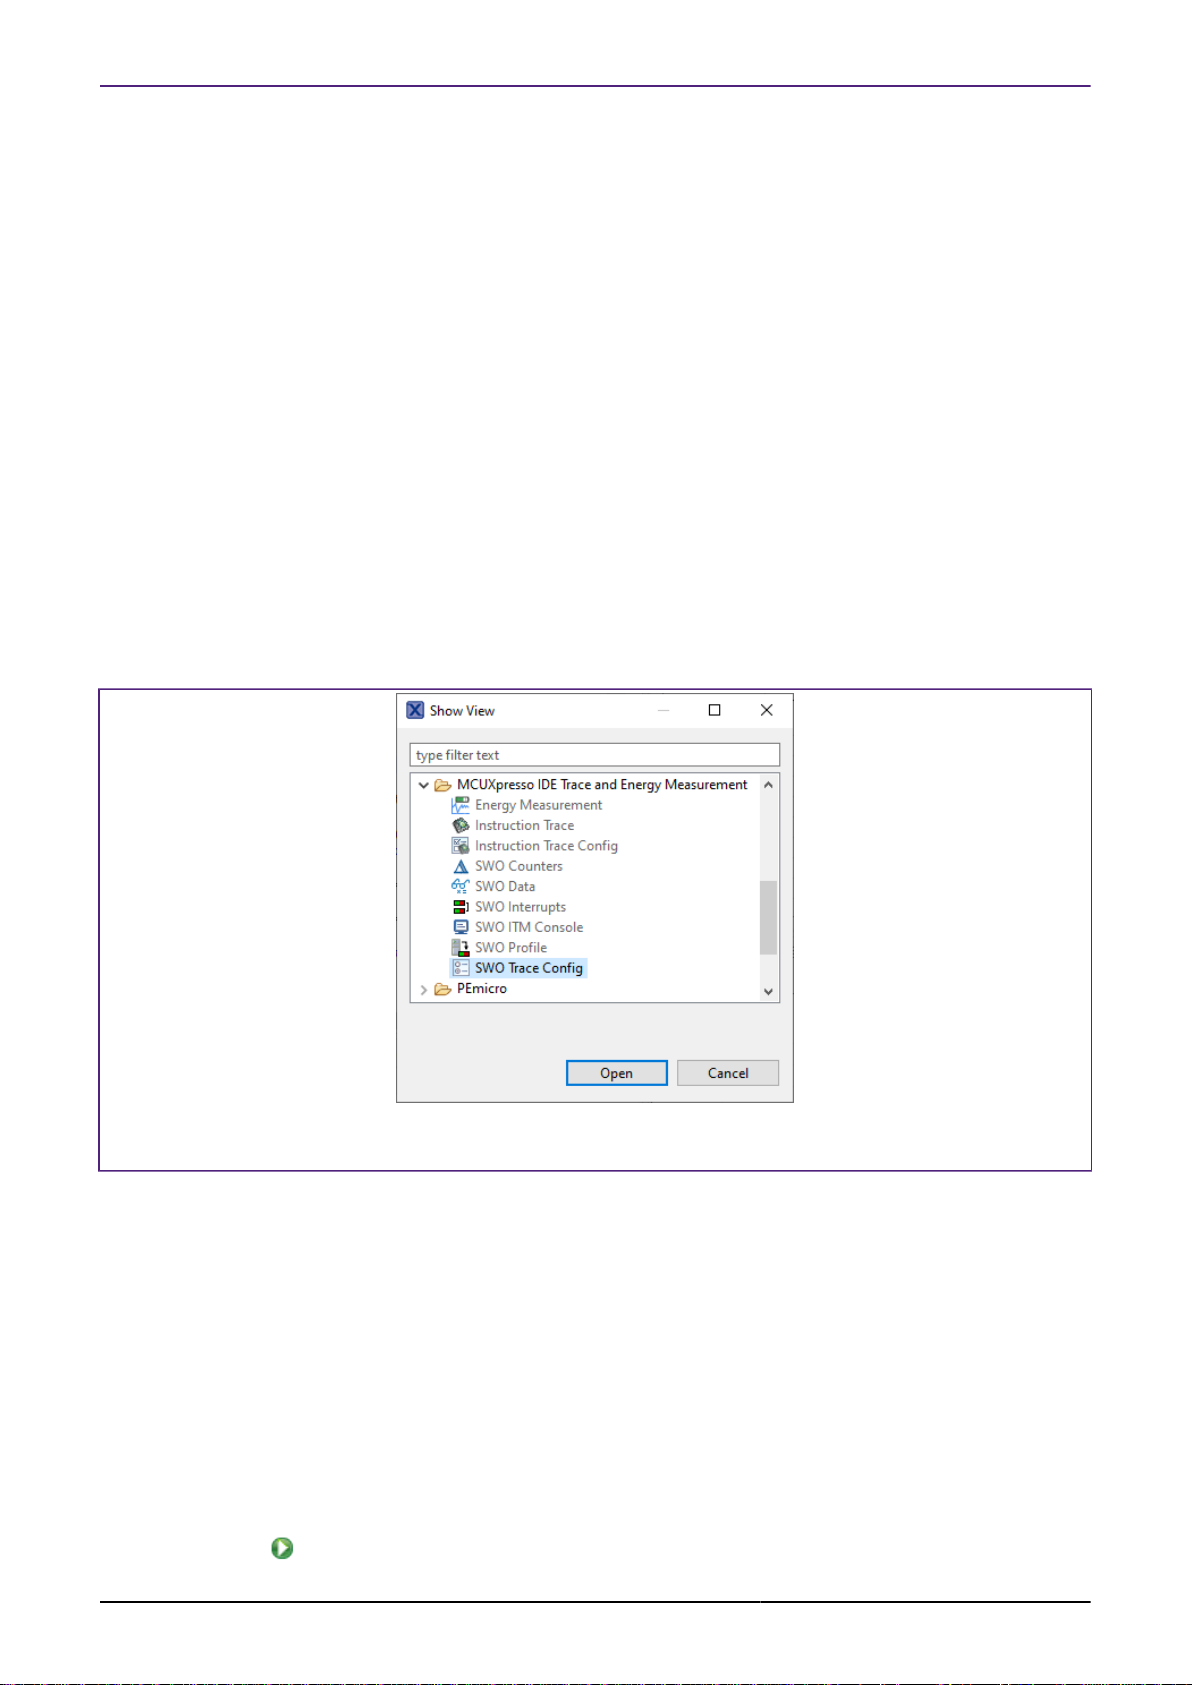
All the SWO views are presented within the Analysis Perspective by default. Trace Views that
are not required may be closed to simplify the user interface. They may also be opened using
the Window -> Show View -> Other... menu item.
Figure 1.2. Reopening a View
1.4 Starting SWO Trace
To use SWO Trace’s features, you must be debugging an application on a Cortex-M3/M4/M7/
M33 based MCU, connected via a supported debug probe using the SWD protocol.
You may start SWO Trace at any time while debugging your program. The program does not
have to be stopped at a breakpoint or paused (LinkServer only). Before the collection of data
commences, SWO Trace may prompt you to enter the target clock speed.
Note: Only LinkServer debug connections support starting and stopping trace while the target
is running.
Trace collection for each View is controlled by the buttons in its toolbar.
•
- starts Trace collection for that View
MCUXpresso IDE SWO Trace Guide -
User Guide
All information provided in this document is subject to legal disclaimers
Rev. 11.3.0 — 2 April, 2021
© 2021 NXP Semiconductors. All rights reserved.
3
Page 8

NXP Semiconductors MCUXpresso IDE SWO Trace Guide
•
- stops Trace collection for that View
•
- deletes the collected Trace from the View
•
- opens the SWO Config View
More than one View may be configured to collect Trace at a time. However, the bandwidth of the
Trace channel is limited and may become saturated, resulting in data loss. Try disabling other
SWO Trace Views if you do not see Trace data coming through. The SWO Trace Config View
– Statistics Tab provides an overview of the SWO channel load.
1.4.1 Target Clock Speed
Due to the way the Trace data is transferred by the Cortex CPU within the MCU, setting the
correct clock speed within the SWO Trace interface is essential to determine the correct baud
rate for the data transfer. If the clock speed setting does not match the actual clock speed of
the processor then data will be lost and/or corrupted. This can result in no data being visualized,
or unexpected Trace data.
The first time Trace is used in a project you will be asked to enter the target clock speed.
SWO Trace attempts to read the clock speed from the SystemCoreClock global variable and will
suggest that value if found. The SystemCoreClock is usually set to the current clock speed of
the target. Take care to use it after the application has set the clock speed for normal operation,
otherwise it may provide an inappropriate value. If that variable does not exist or has not been
set to the core clock frequency you will need to manually enter the clock frequency.
Once set, the target core clock speed is saved in the project configuration. The saved value can
be viewed and changed from the SWO Trace Config View in Configuration tab.
1.4.2 Part-Specific Configuration for SWO Trace
Most MCUs should not need any special configuration to use SWO Trace. However, some may
require additional configuration to enable SWO output, for instance to set up the correct pin
muxing or to enable a Trace clock.
Parts that require extra configuration include the LPC13xx, LPC15xx, LPC541xx and LPC546xx
families.
Further details on the above parts can be found in the Appendices of this guide. However, it
is generally recommended to check the user or reference manual for the MCU being used for
details of any required SWO configuration details.
1.4.3
SWO Trace Config View
The SWO Trace Config View contains 3 different tabs and groups multiple information.
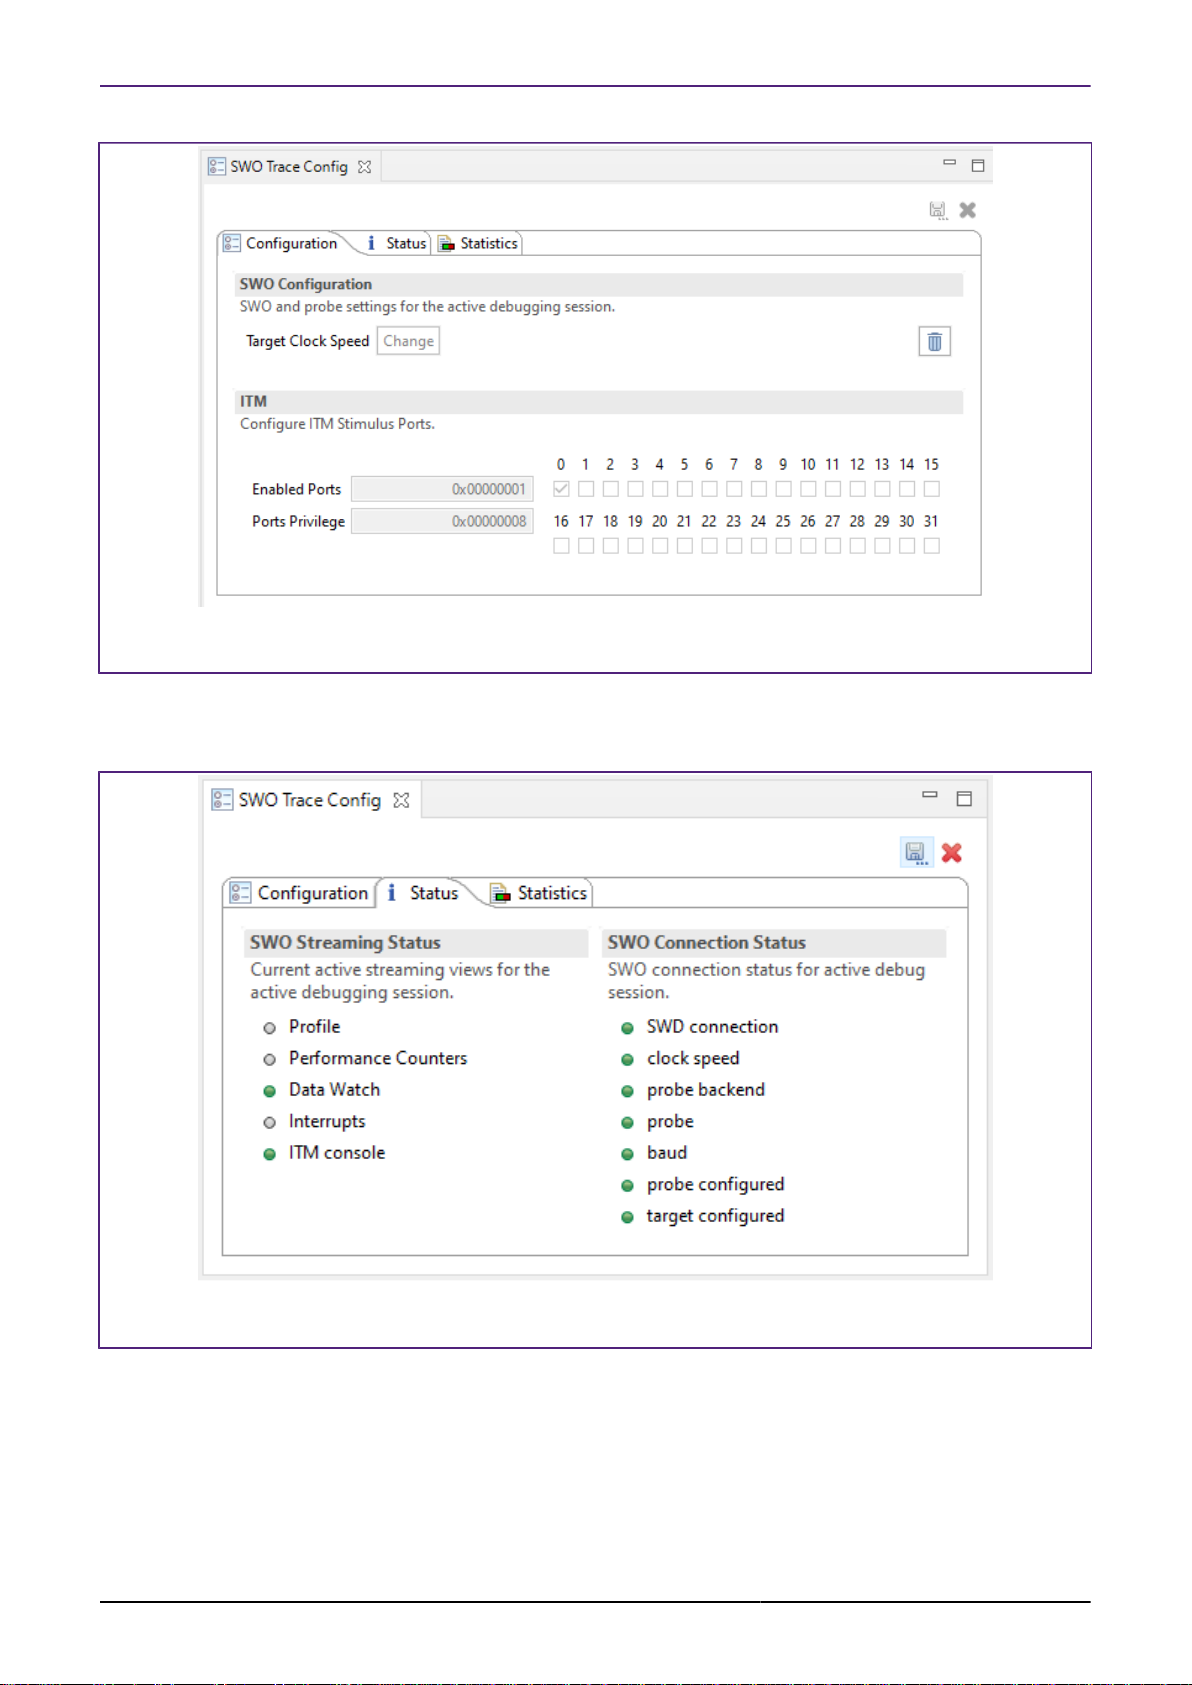
• Configuration Tab - Setting of the Trace Clock Speed and ITM Stimulus Ports
Note
If the clock speed is entered incorrectly you may see unexpected Trace data or no
Trace data. For a particular target clock speed, the maximum SWO link speed will
automatically be calculated for the attached debug probe (and highlighted as above).
Faster link speeds will enable the capture of more SWO trace information.
Important Note: A typical SDK project or example sets the target clock speed after main() is
called in a function of the form BOARD_BootClockRUN(), therefore it is important to run beyond
this function before sampling the current target clock speed.
MCUXpresso IDE SWO Trace Guide -
User Guide
All information provided in this document is subject to legal disclaimers
Rev. 11.3.0 — 2 April, 2021
© 2021 NXP Semiconductors. All rights reserved.
4
Page 9
NXP Semiconductors MCUXpresso IDE SWO Trace Guide
Figure 1.3. SWO Trace Config View – Configuration Tab
• Status Tab - Shows the status of the SWO Trace connection. When SWO Trace is correctly
configured all lights will be green.
Figure 1.4. SWO Trace Config View – Status Tab
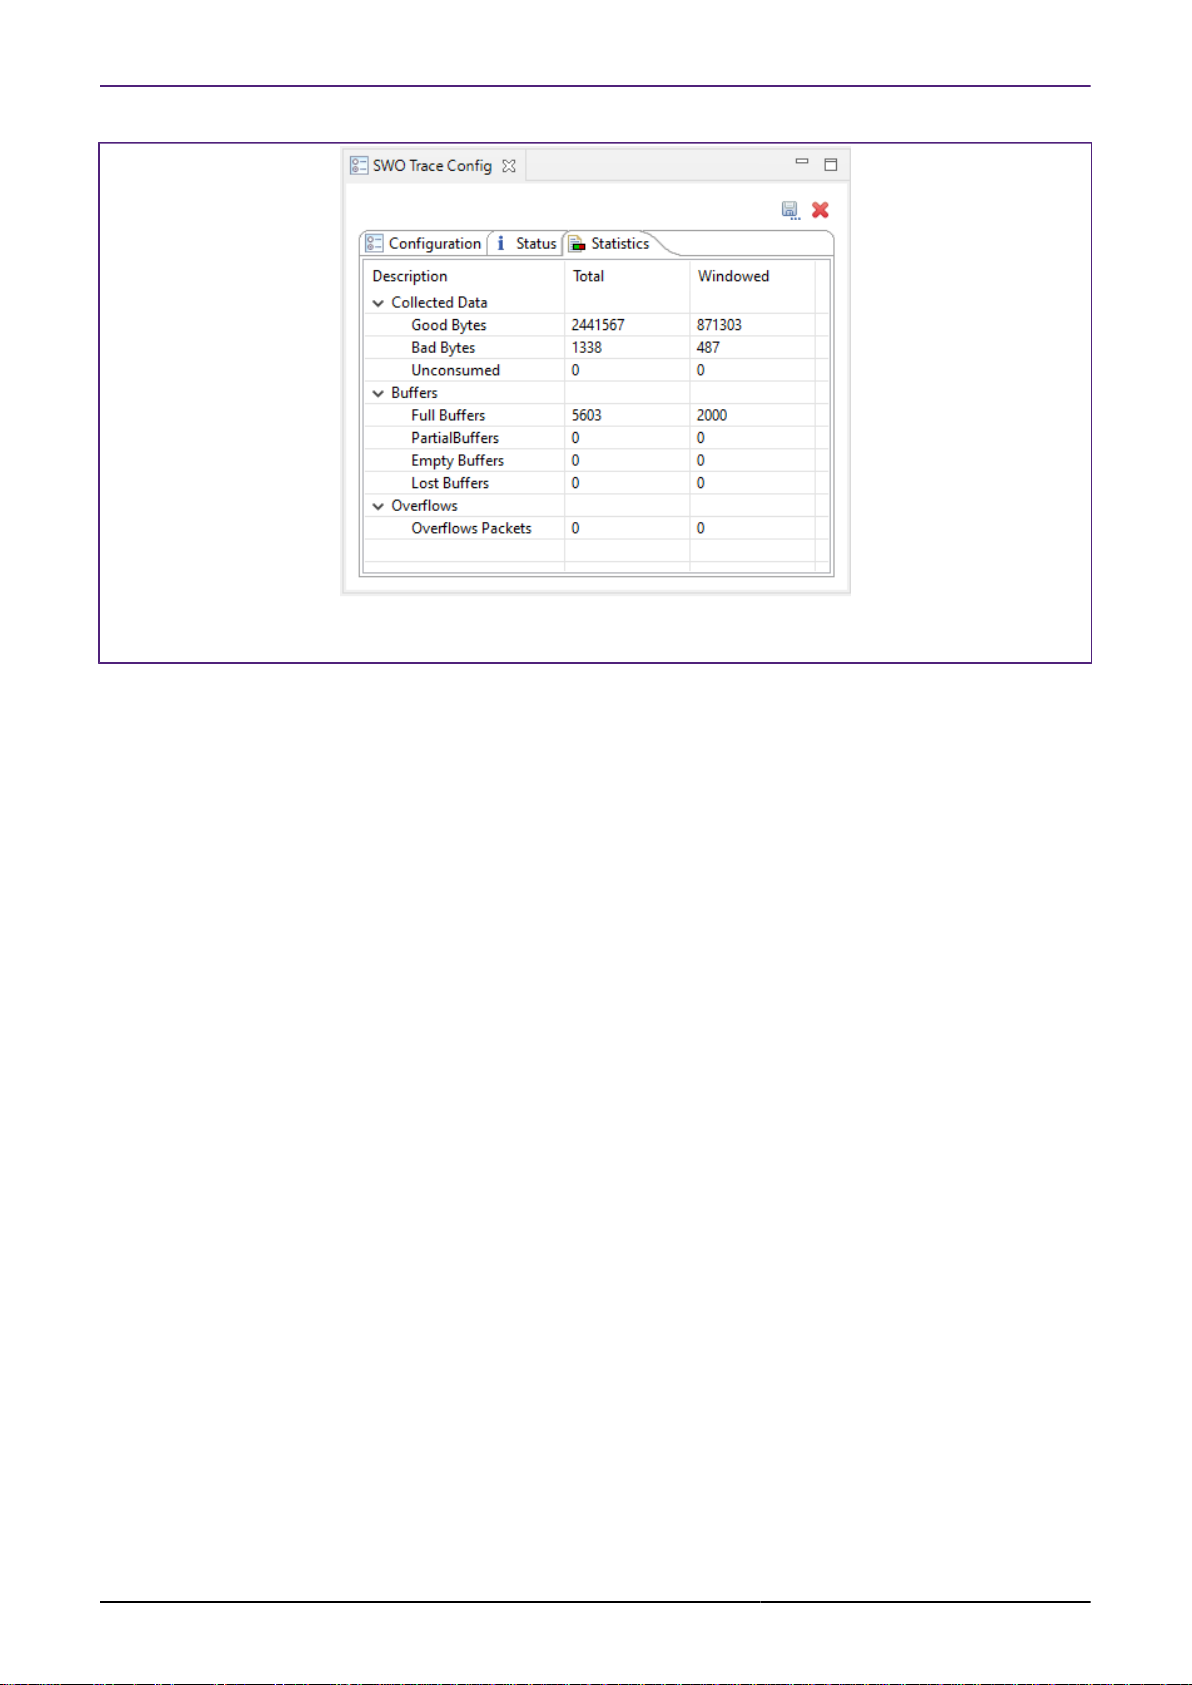
• Statistics Tab - Displays Trace channel bandwidth usage and low-level debug information
related to the SWO Trace connection
The SWO Statistics Tab View provides a low-level display of the utilization of the different parts
of the SWO pipeline. This View allows you to identify any bottlenecks in the SWO pipeline, which
may indicate that they are overloading the SWO channel. SWO data is collected into buffers and
sent, a buffer at a time, to the MCUXpresso IDE.
MCUXpresso IDE SWO Trace Guide -
User Guide
All information provided in this document is subject to legal disclaimers
Rev. 11.3.0 — 2 April, 2021
© 2021 NXP Semiconductors. All rights reserved.
5
Page 10

NXP Semiconductors MCUXpresso IDE SWO Trace Guide
For metric two numbers are presented: the total for the entire SWO session in the “Total” column
and the data for the last 2000 collected buffers (corresponding to the last 2s) in the “Windowed”
column.
This list will help you interpret the presented statistics:
• Collected Data
• Shows how much of the data is being detected as valid, expected, SWO packets.
• A few bad bytes can be expected in normal operation.
• If the number of bad bytes is greater than or the same order of magnitude as good bytes it
suggests that the SWO stream is corrupted.
• This can often be caused when SWO Trace is configured with the wrong target clock
speed.
• Buffers
• This presents the USB utilization. The windowed statistics are most useful here.
• The more full buffers there are, relative to the empty buffers, the heavier the USB load is.
• The windowed statistics for the full and empty buffers add up to 2000.
• If full = 700 and empty = 1300 you have a lot of head room in the USB channel and should
not be losing data there
• If full = 1978 and empty = 22 the USB channel is nearly fully utilized, and bursts of data
may saturate the USB channel, resulting in lost data.
• Seeing the number of empty buffers increase but no full buffers, when you are expecting to
see data, implies that the target may not be configured correctly – your target may require
additional configuration. See “Overview of Trace support in MCUXpresso IDE” at https://
community.nxp.com/message/630730 for more information.
• Lost buffers
• This shows the number of buffers of SWO data that were collected by the probe from the
target, but were not sent over USB before being overwritten with new data.
• It is possible to lose buffers even if the USB channel is not fully saturated.
• A high number of lost buffers relative to full buffers indicates that the SWO channel is
overloaded.
• A small number of lost buffers is likely to occur in normal operation.
• Overflow packets
• When the trace hardware on the target generates more data than it can send out of the SWO
pin, it generates an Overflow packet.
• This indicates that the SWO channel is overloaded.
• Some Overflow packets can be expected, but most of the time you should aim to have 0
overflow packets in the windowed statistics.
MCUXpresso IDE SWO Trace Guide -
User Guide
All information provided in this document is subject to legal disclaimers
Rev. 11.3.0 — 2 April, 2021
© 2021 NXP Semiconductors. All rights reserved.
6
Page 11
NXP Semiconductors MCUXpresso IDE SWO Trace Guide
Figure 1.5. SWO Trace Config View – Statictics Tab
MCUXpresso IDE SWO Trace Guide -
User Guide
All information provided in this document is subject to legal disclaimers
Rev. 11.3.0 — 2 April, 2021
© 2021 NXP Semiconductors. All rights reserved.
7
Page 12

NXP Semiconductors MCUXpresso IDE SWO Trace Guide
2. Profiling
2.1 Overview
Profile tracing provides a statistical profile of application activity. This works by sampling
the program counter (PC) at the configured sample rate. It is completely nonintrusive to the
application – it does not affect the performance in any way. As profile tracing provides a statistical
profile of the application, more accurate results can be achieved by profiling for as long as
possible. Profile tracing can be useful for identifying application behavior such as code hotspots.
2.2
SWO Profile View
The Profile View shows a profile of the code as it is running, providing a breakdown of time spent
in different functions. The information is grouped in two diffrent tabs:
• Samples % - Showing specific samples information like cumulative and current samples and
coverage
Figure 2.1. SWO Profile View – Samples% Tab
• Details - Providing all the detailed information as presented further
Figure 2.2. SWO Profile View – Details Tab
Examples screenshots are shown in Figure 2.1 and Figure 2.2. Double-clicking on a row will
jump to the corresponding function definition in the source code. Clicking on a column title will
sort by that column. Clicking a second time will reverse the sorting order.
MCUXpresso IDE SWO Trace Guide -
User Guide
All information provided in this document is subject to legal disclaimers
Rev. 11.3.0 — 2 April, 2021
© 2021 NXP Semiconductors. All rights reserved.
8
Page 13

NXP Semiconductors MCUXpresso IDE SWO Trace Guide
• Cumulative samples: This is the total number of PC samples that have occurred while
executing the particular function. A relatively high number of samples indicates a larger function
or more frequently executed functions.
• Cumulative samples (%): This is the same as above, but displayed as a percentage of total
PC samples collected.
• Current samples (%): This column is a legacy item. In SWO Trace it is identical to the
Cumulative samples(%).
• Coverage (%): Percentage of instructions in the function that have been seen to have been
executed.
• Coverage Bitmap: The coverage bitmap has one bit for each half-word in the function. The
bit corresponding to the address of each sampled PC is set. Most Cortex-M instructions are 16
bits (one half-word) in length. However, there are some instructions that are 32 bits (two halfwords). The bit corresponding to the second half-word of a 32-bit instruction will never be set.
• First: This is the first time (relative to the start time of tracing) that the function was sampled.
• Last: This is the last time (relative to the start time of tracing) that the function was sampled.
• Since: It is this long since you last saw this function (current – last).
• Avg Between: This is the average time between executions of this function.
The PC sampling rate is configured using the Rate button . The rate can be configured to be
from one in every 64 instructions to one in every 16384 instructions. Note, however, that at the
higher sample rates the SWO channel will be overwhelmed, resulting in data loss. See Figure 2.3.
Figure 2.3. PC sample rate
The summary of the PC count by function depends on being able to map a PC sample to a
function. The function name can only be determined if the source code is available (this may not
be the case for library code or ROM code, for example). If code is dynamically loaded the profile
will be inaccurate, as samples may get attributed to the wrong functions.
Note:
Coverage is calculated statistically – sampling the PC at the specified rate (e.g.
50Khz). It is possible for instructions to be executed but not observed. The longer
Trace runs for, the more likely a repeatedly executed instruction is to be observed.
As the length of the trace increases, the observed coverage will tend towards the
true coverage of your code. However, this should not be confused with full code
coverage.
MCUXpresso IDE SWO Trace Guide -
User Guide
All information provided in this document is subject to legal disclaimers
Rev. 11.3.0 — 2 April, 2021
© 2021 NXP Semiconductors. All rights reserved.
9
Page 14

NXP Semiconductors MCUXpresso IDE SWO Trace Guide
3. ITM
3.1 Overview
The ITM block provides a mechanism for sending data from your target to the debugger via
the SWO stream. This communication is achieved though a memory-mapped register interface.
Data written to any of 32 stimulus registers is forwarded to the SWO stream. Unlike other SWO
functionality, using the ITM stimulus ports requires changes to your code and so should not be
considered nonintrusive.
3.2 Using the ITM to Handle printf and scanf
The ITM stimulus registers facilitate printf style debugging. MCUXpresso IDE uses the CMSIS
standard scheme of treating any data written to stimulus port 0 (0xE0000000) as character data.
A minor addition to your project can redirect the output of printf to this port.
A special global variable is used to achieve scanf functionality, which allows the debugger to send
characters from the console to the target. The debugger writes data to the global variable named
ITM_RxBuffer to be picked up by scanf.
3.3
Inside the Examples/Misc subdirectory of your MCUXpresso IDE installation, you will find the file
retarget_itm.c, which can be used to provide the above functionality for the C library printf and
scanf functions. This provides better performance than the standard semihosting mechanism, as
the MCU does not have to temporarily drop into debug state and hence stop execution to transfer
the data. This code can also be automatically included in projects by selecting the appropriate
option on the Advanced project settings page of the SDK project wizards.
SWO ITM Console View
Data written to the ITM stimulus port 0 is presented in this View. An example screenshot is shown
in Figure 3.1. The View shows the ITM console for the active debug session. Once the target
is terminated, the View is cleared.
Text entered into this console is sent to the target if a suitable receiving buffer exists (specifically
the global int32_t ITM_RxBuffer).
MCUXpresso IDE SWO Trace Guide -
User Guide
All information provided in this document is subject to legal disclaimers
Rev. 11.3.0 — 2 April, 2021
© 2021 NXP Semiconductors. All rights reserved.
10
Page 15

NXP Semiconductors MCUXpresso IDE SWO Trace Guide
Figure 3.1. SWO ITM Console View
In addition to the standalone ITM Console View, the ITM console is also displayed as part of the
standard console viewer: see Figure 3.2. It can be displayed by selecting the “Display Selected
Console” button and choosing the console named "<your project> ITM Console". This View
persists after the target is terminated, unlike the standalone ITM Console View. Note that the
standard console viewer switches automatically between consoles to show consoles that are
being written to. This switching can be disorienting, as the ITM console is easily lost among the
other consoles displayed there. It is easier to keep track of the standalone ITM console.
Figure 3.2. SWO ITM Console shown in the standard Console View
3.3.1 Toolbar
•
•
•
•
The start and stop buttons in the ITM Console View enable and disable stimulus port 0.
MCUXpresso IDE SWO Trace Guide -
User Guide
Enable stimulus port 0 and start collecting data.
Disable stimulus port 0.
Switch to the SWO config View.
Clear the ITM data and console.
All information provided in this document is subject to legal disclaimers
Rev. 11.3.0 — 2 April, 2021
© 2021 NXP Semiconductors. All rights reserved.
11
Page 16
NXP Semiconductors MCUXpresso IDE SWO Trace Guide
4. Interrupt Tracing
4.1 Overview
Interrupt tracing provides information on the interrupt performance of your application. This can
be used to determine time spent in interrupt handlers and to help optimize their performance.
SWO interrupt tracing provides precise timing for entry and exits of interrupt handlers without
any code instrumentation or processor overhead. The SWO stream reports three different events
and the times at which they occurred:
• Entry to i - when the handler for interrupt i is initially executed
• Exit from i - when the handler i finishes or is preempted by an interrupt of higher priority
• Return to i - when the handler for interrupt i is returned to after being preempted
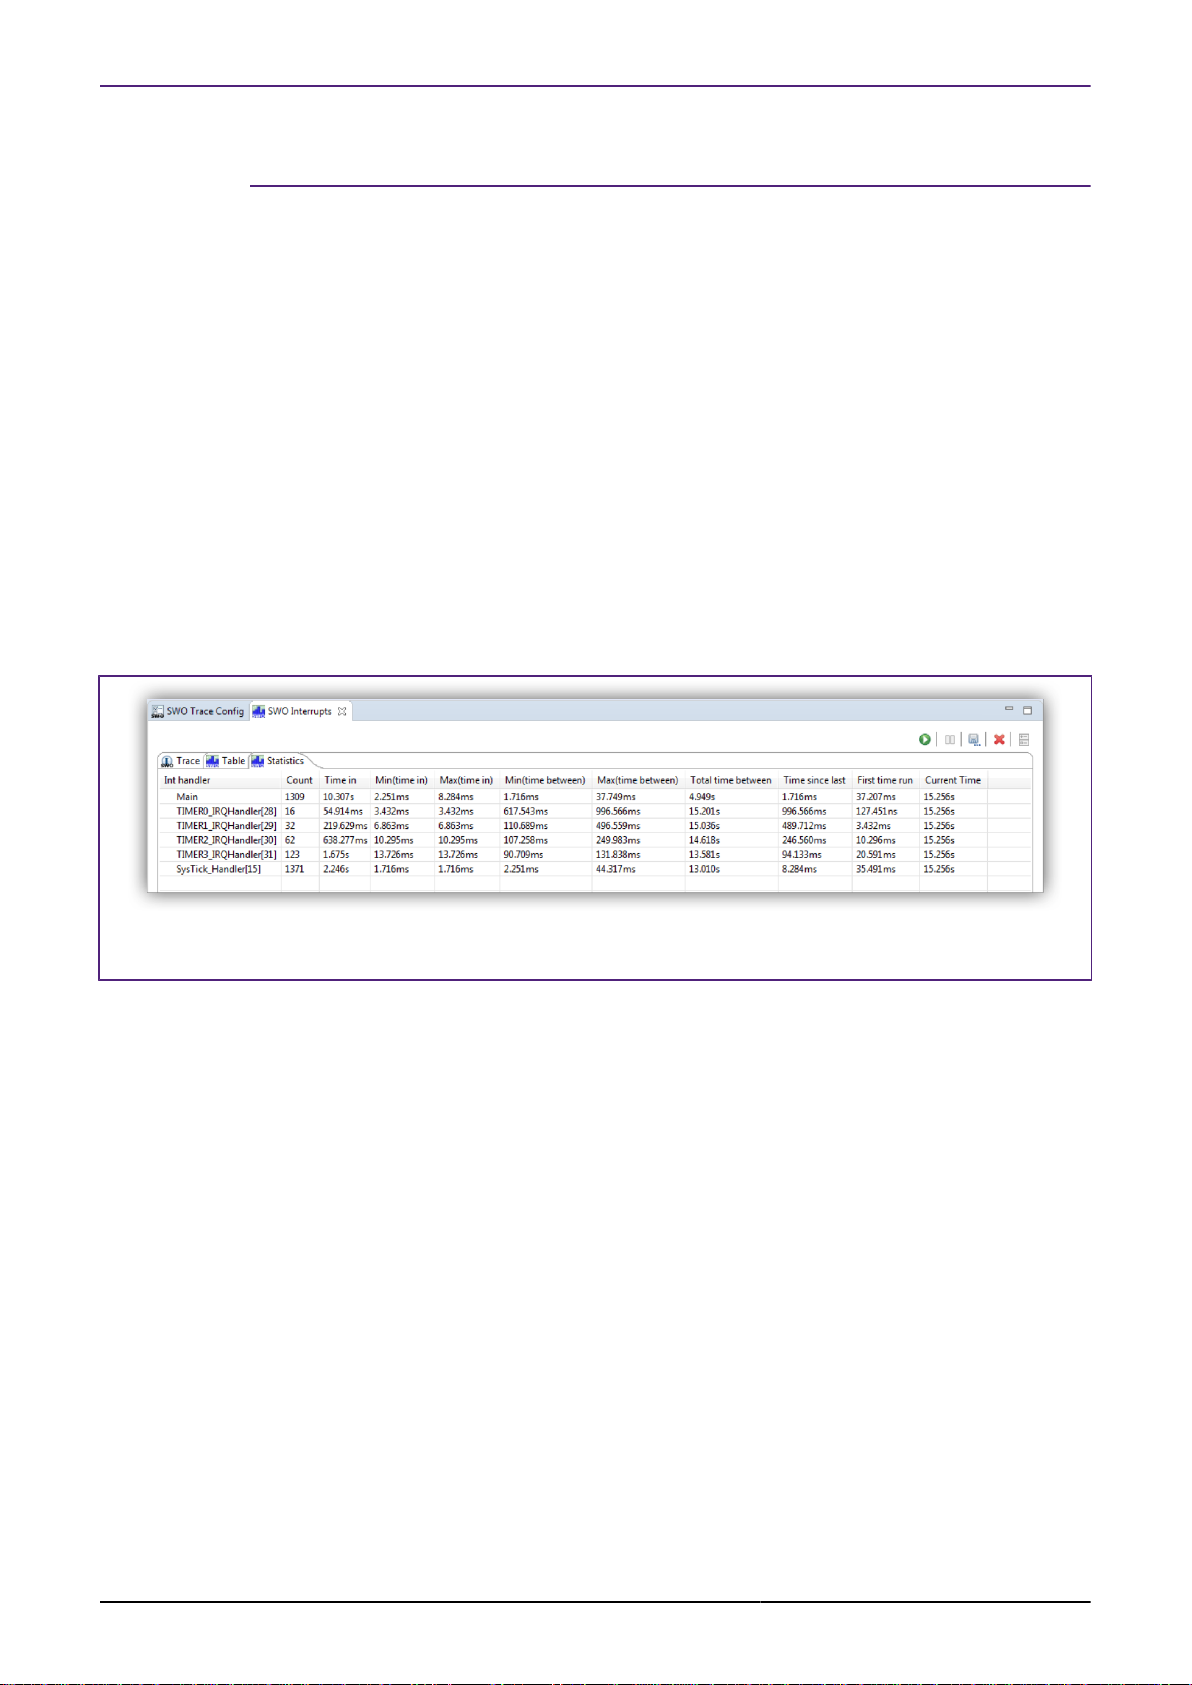
4.2 SWO Interrupts View (Statistics Tab)
The Interrupt Statistics tab displays counts and aggregated timing information for interrupt
handlers. An example screenshot is shown in Figure 4.1.
Figure 4.1. SWO Interrupts View – Statistics Tab
Information displayed includes:
• Count: The number of times the interrupt routine has been entered so far
• Time In: The total time spent in the interrupt routine so far
• Min (time in): Minimum time spent in the interrupt routine for a single invocation
• Max (time in): The Maximum time spent in a single invocation of the routine
• Min (time between): The minimum time between invocations of the interrupt
• Max (time between): The maximum time between invocations of the interrupt
• Total time between: The total time spent outside this interrupt routine
• Time since last: The time elapsed since the last time in this interrupt routine
• First time run: The time (relative to the start of Trace) that this interrupt routine was first run
• Current time: The elapsed time since Trace start
Also see the Overhead and Sleep performance counters.
4.3 SWO Interrupt View (Trace Tab)
The Interrupt Trace Tab plots a time line showing the entry, exit, and return events of interrupt
handlers. It is useful for debugging exception priorities and seeing how interrupts may be
interacting in your running code.
MCUXpresso IDE SWO Trace Guide -
User Guide
All information provided in this document is subject to legal disclaimers
Rev. 11.3.0 — 2 April, 2021
© 2021 NXP Semiconductors. All rights reserved.
12
Page 17

NXP Semiconductors MCUXpresso IDE SWO Trace Guide
An example screenshot is shown in Figure 4.2.
Figure 4.2. SWO Interrupt Trace View
4.3.1 Zooming and Panning
Once interrupt trace is captured, the controls associated with the graph display can be used via
the mouse to control how you can interact with the chart (via clicking and dragging):
Note: Trace capture must be paused before you can interact with the view.
Figure 4.3. SWO Interrupt Trace View Controls
Where:
1. Autoscale the display to show all of the data
2. Zoom In and Out: Select the desired button and then click into the area of the graph where
zoom is required
3. Zoom Horizontally: Select the button and then select and drag within the graph to perform
the desired zoom
MCUXpresso IDE SWO Trace Guide -
User Guide
All information provided in this document is subject to legal disclaimers
Rev. 11.3.0 — 2 April, 2021
© 2021 NXP Semiconductors. All rights reserved.
13
Page 18

NXP Semiconductors MCUXpresso IDE SWO Trace Guide
4. Panning: Select Panning to click and drag a zoomed display. Select None to prevent
interaction with the graph
5. Preview Size: Click to increase or decrease the Preview time frame between 5 and 100ms
• This controls the time frame of the live view of captured interrupt trace
6. None: Select to prevent mouse actions interacting with the display
7. Undo and Redo: Click these button to cycle through previous actions
8. Add a Legend to show colouring for Interrupts, Overhead and Overflow
9. Add and remove Annotations. Annotations can be named and will snap to a plotted point and
display its value
10.(A) Measure Horizontally: Click and drag to snap between plotted points to measure the value
of their separation
11.(B) Save the graph as a png file
4.3.2 Time Axis
Time is plotted along the x-axis at the bottom of the graph. It is labelled relative to the origin of
the chart t0. The value of t0 is plotted in the top left of the chart.
When the chart is panned, by dragging the chart using the mouse, the grid lines will not appear
to move but you will see t0 changing as the plot moves along.
4.3.3 Interrupt Axis
Each observed interrupt is listed on the vertical axis. The labels consist of the name of the handler
with the number of the interrupt prepended to it. For example SysTick_Handler[15] refers to interrupt
15, which is handled by the function SysTick_Handler. The special entry Main represents all code
executed outside of the Handler mode.
4.3.4 Interpretation
Each row in the chart represents the execution state of the labelled interrupt handler. No
horizontal line indicates that the interrupt handler is not being executed.
4.3.5 Graph Buffer Depth
Trace data is captured into a fixed buffer – when this buffer is filled, trace capture will stop and
a warning will be displayed (as shown highlighted red below). To explore the captured trace the
view must still be paused (highlighted blue). To clear the buffer click the X (highlighted green):
Figure 4.4. SWO Interrupt Trace Buffer Full
The buffer depth can be configured via the Trace Buffer size option in Preferences ->
MCUXpresso IDE -> SWO Trace.
MCUXpresso IDE SWO Trace Guide -
User Guide
All information provided in this document is subject to legal disclaimers
Rev. 11.3.0 — 2 April, 2021
© 2021 NXP Semiconductors. All rights reserved.
14
Page 19

NXP Semiconductors MCUXpresso IDE SWO Trace Guide
Figure 4.5. SWO Interrupt Trace Buffer Preference
Note: Large buffer depths may result in the UI becoming very slow when plotting all points. This
limitation may be addressed in later releases.
4.4 SWO Interrupt Trace View (Table Tab)
The SWO Interrupt Trace Table tab shows the collected interrupt events and their corresponding
time stamps – see Figure 4.6.
Figure 4.6. SWO Interrupt Trace Table View
4.4.1 Columns
• Index
• Sequential ID for each event
MCUXpresso IDE SWO Trace Guide -
User Guide
All information provided in this document is subject to legal disclaimers
Rev. 11.3.0 — 2 April, 2021
© 2021 NXP Semiconductors. All rights reserved.
15
Page 20

NXP Semiconductors MCUXpresso IDE SWO Trace Guide
• ID
• Interrupt handler ID if greater than zero; or:
• 0 - Out of Handler mode (i.e. normal execution)
• -1 - Unknown ID
• -2 - Inconsistent state (data corruption)
• -3 - SWO packet formatter FIFO overflow
• -4 - Break in data stream (dropped buffer(s))
• Event
• ENTRY - execution of the associated interrupt handler begins
• EXIT - execution of the associated interrupt handler ends
• RETURN - re-entry into executing handler after preemption
• OVERFLOW - data lost (see ID code for more info)
• Handler
• The assigned interrupt handler, or the interrupt handler ID if no source for the handler can
be located
• Time
• The time stamp associated with the event, expressed in seconds
• May be a range – if so, it will have a +/- term
• Ticks
• The time stamp expressed as a number of CPU clock ticks
• For time stamps representing a range, this is the start of the range
MCUXpresso IDE SWO Trace Guide -
User Guide
All information provided in this document is subject to legal disclaimers
Rev. 11.3.0 — 2 April, 2021
© 2021 NXP Semiconductors. All rights reserved.
16
Page 21

NXP Semiconductors MCUXpresso IDE SWO Trace Guide
5. Data Watch Trace
5.1 Overview
This View provides the ability to monitor (and update) any memory location in real time, without
stopping the processor. Up to four memory locations can be traced simultaneously allowing
all accesses to the traced locations to be captured. Information that can be collected includes
whether data is read or written, the value that is accessed, and the PC of the instruction causing
the access.
This information can be used to help identify “rogue” memory accesses, to monitor and analyze
memory accesses, or to profile data accesses.
Real-time memory access is also available, allowing any memory location to be read or written
without stopping the processor. This can be useful in real-time applications where stopping the
processor is not possible, but you wish to view or modify in-memory parameters. Any number
of memory locations may be accessed in this way, and modified by simply typing a new value
into a cell in the Data Watch Trace View.
Note: MCUXpresso IDE’s Global Variable View also offers Live Variables functionality when
used via a LinkServer non-stop debug connection. This provides similar functionality to SWO
data watch, in that a recent value for a variable is displayed, and can be modified. Live Variables
cannot provide a full trace of updates and accesses. However, the Live Variables functionality
can also be used with Cortex-M0/M0+ based MCUs – which SWO Data Watch Trace cannot.
5.2
Figure 5.1. SWO Data Watch View
SWO Data Watch View
The View is split into two sections, with the item display on the left and the Trace display on
the right, as shown in Figure 5.1.
Use the Add Datawatch items button to display a dialog to allow the memory locations that
will be presented to be chosen, as per Figure 5.2.
MCUXpresso IDE SWO Trace Guide -
User Guide
All information provided in this document is subject to legal disclaimers
Rev. 11.3.0 — 2 April, 2021
© 2021 NXP Semiconductors. All rights reserved.
17
Page 22

NXP Semiconductors MCUXpresso IDE SWO Trace Guide
Figure 5.2. Add datawatch items
These locations may be specified by selecting global variables from a list; by entering a C
expression; or by entering an address and data size directly. Trace may be enabled for each
new item. If Trace is not enabled, the value of the data item will be read from memory.
Data Watch Trace works by setting an address into a register on the target chip. This address
is calculated at the time that you choose an item to watch in the Add datawatch items dialog.
Thus, while you can use an expression, such as buffer[bufIndex+4], the watched address will not
be changed should bufIndex subsequently change. This behavior is a limitation of the hardware.
The format dropdown box provides several format strings to choose from for displaying an item’s
value. The format string can be customized in this box, as well as in the item display.
With Trace enabled, the options for tracing the item’s value, the PC of the instruction accessing
the variable, or its address can be set. Additionally, the option to trace reads, writes, or both can
be set when adding a variable. These settings can be subsequently updated in the item display.
Note:
It is not possible to add some kinds of variables when the target is running.
Suspending the execution of the target with the button before adding these
variables will overcome this limitation.
Pressing Finish adds the current data watch item to the item display and returns to the Data
Watch View. Pressing Next adds the current data watch item, and displays the dialog to allow
another item to be added.
5.2.1 Item Display
As shown in Figure 5.1, the item display lists the data watch items that have been added. The
following information is presented:
MCUXpresso IDE SWO Trace Guide -
User Guide
All information provided in this document is subject to legal disclaimers
Rev. 11.3.0 — 2 April, 2021
© 2021 NXP Semiconductors. All rights reserved.
18
Page 23

NXP Semiconductors MCUXpresso IDE SWO Trace Guide
• Enable Trace - Tracing of this item may be enabled or disabled using the checkbox. A
maximum of four items may be traced at one time. Each traced item is given a color code, so
that it may be picked out easily on the Trace display.
• Value - shows the current value of the item and may be edited to write a new value to the
target. If the current value has changed since the last update, then it will be shown highlighted
in yellow.
• Format - shows the printf-style expression used to format the value, and may be edited.
• Type - shows the trace type, which may be edited while Trace is disabled:
• Value - just trace the value transferred to/from memory
• PC only - just trace the PC of the instruction making the memory access
• PC and value - trace the value and the PC
• Address - trace the address of memory accessed
• Address and value - trace the address and value
• Access - shows the access type, which may be edited while Trace is disabled:
• Write - just trace writes to the memory location
• Read - just trace reads to the memory location
• Read & Write - trace both reads and writes
5.2.2 Trace Display
The Trace display shows the traced values of the memory locations.
MCUXpresso IDE SWO Trace Guide -
User Guide
All information provided in this document is subject to legal disclaimers
Rev. 11.3.0 — 2 April, 2021
© 2021 NXP Semiconductors. All rights reserved.
19
Page 24

NXP Semiconductors MCUXpresso IDE SWO Trace Guide
6. Performance Counters
6.1 Overview
There are several counters available in the Cortex-M3 and Cortex-M4 processors to help analyze
the performance of the target application.
6.2
Figure 6.1. SWO Performance Counters View
SWO Performance Counters View
The Performance Counter View displays the target’s Performance Counters as shown below:
The performance counters are described here as follows:
• Cycle counter (CYCCNT)
• Increments on each clock cycle when the processor is not halted in debug state.
• Folded Instruction Counter (FOLDCNT)
• Cycles saved by instructions which execute in zero cycles.
• Load-Store Counter (LSUCNT)
• increments on each additional cycle required to execute a multi-cycle load-store instruction.
It does not count the first cycle required to execute any instruction.
• Sleep Overhead Counter (SLEEPCNT)
• increments on each cycle associated with power saving, whether initiated by a WFI or WFE
instruction, or by the sleep-on-exit functionality.
• Exception Overhead Counter (EXCCNT)
• increments on each cycle associated with exception entry or return. That is, it counts the
cycles associated with entry stacking, return unstacking, preemption, and other exceptionrelated processes.
• CPI (CPICNT)
• increments on each additional cycle required to execute a multi-cycle instruction, except for
those instructions recorded by Load-store count. It does not count the first cycle required
to execute any instruction. The counter also increments on each cycle of any instruction
fetch stall.
The number of instructions can be calculated as:
number of instructions = CYCCNT – CPICNT – EXCCNT – SLEEPCNT – LSUCNT +
FOLDCNT
Various other calculations and inferences can be made using these counters. For example, the
time spent spent executing instructions vs the time sleeping will give an indication of the how
hard the CPU is working.
MCUXpresso IDE SWO Trace Guide -
User Guide
All information provided in this document is subject to legal disclaimers
Rev. 11.3.0 — 2 April, 2021
© 2021 NXP Semiconductors. All rights reserved.
20
Page 25

NXP Semiconductors MCUXpresso IDE SWO Trace Guide
% time awake = ((CYCCNT – SLEEPCNT)/CYCCNT) x 100
6.2.1 Display features
Whenever the CPU is running, the performance counters will be continuously updated internally.
However, with trace enabled within the Performance Counters view, an individual counter will
only be sampled when it check box is ticked. When this is done the initial value of all counters
held within the debugger will be set to count up from zero.
The total value for any displayed counter is calculated by adding two components: - the current
value of the counter within the CPU plus any accumulated overflow value
These counters change very rapidly so all counters apart from the Cycle counter will only display
their total values when the target is paused.
MCUXpresso IDE SWO Trace Guide -
User Guide
All information provided in this document is subject to legal disclaimers
Rev. 11.3.0 — 2 April, 2021
© 2021 NXP Semiconductors. All rights reserved.
21
Page 26

NXP Semiconductors MCUXpresso IDE SWO Trace Guide
7. Bandwidth Considerations
7.1 Overview
SWO Trace allows you to use multiple SWO Views at the same time. For example, the Interrupt
Trace and Profile Trace can be running at the same time. The SWO pipeline is composed of five
parts that get the trace data from the target into MCUXpresso:
1. The trace hardware on the target generates the data.
2. The probe reads this data from the target via the SWO pin.
3. The probe caches the data read to be sent to MCUXpresso IDE.
4. MCUXpresso IDE requests data from the probe over USB.
5. MCUXpresso IDE decodes the SWO stream and displays it to users.
Data loss can occur at any of these steps when they become overloaded. This can happen if the
target is configured to generate more Trace data than can be handled. When the SWO channel
becomes overloaded it is recommended that Trace be reconfigured to reduce the load. You could
stop using a component altogether, or reduce the sample rate in profile, for example.
Data loss can result in inaccurate timing information and the introduction of corrupted data. It is
therefore generally a good idea to adjust your SWO settings to minimize data loss. h1. Appendix
A – SWO Trace Setup for LPC13xx
7.2 To Carry Out SWO Trace on LPC13xx
1. Ensure that your board has SWO pinned out to the debug connector.
2. Turn on the trace clock within the MCU, as this is not enabled by default.
3. Configure the MCU pinmuxing, so that the SWO signal is accessible on the appropriate pin
of the MCU.
This should typically be done within each of your application projects (or library projects that your
projects link against).
7.2.1 SWO Pin and Debug Connector
On LPC13xx parts, the SWO signal is accessible via pin P0_9 of the MCU. Thus, you will need
to check the schematic for your board to ensure that SWO is connected to the debug connector.
7.2.2 Enabling the Trace Clock
The startup code generated by the new project wizards for LPC13xx parts in MCUXpresso IDE
(and later versions of LPCXpresso IDE) contains codes to turn on the trace clock. By default this
code will be enabled by the new project wizard, but if not required it can be removed by defining
the compiler symbol DONT_ENABLE_SWVTRACECLK.
7.2.3 SWO Pinmux Configuration
On LPC13xx parts, the SWO signal is accessible via pin P0_9 of the MCU.
Thus, the pinmux settings for your project need to ensure that this pin is configured to use the
SWO function. In particular, this means that this pin is no longer available for use as the MOSI0
for the SSP0 peripheral. Example code to do this is given below.
Note that the default LPCOpen packages for LPC1343 and LPC1347 set up P0_9 as MOSI0 in
board_sysinit.c of their board library project.
MCUXpresso IDE SWO Trace Guide -
User Guide
All information provided in this document is subject to legal disclaimers
Rev. 11.3.0 — 2 April, 2021
© 2021 NXP Semiconductors. All rights reserved.
22
Page 27

NXP Semiconductors MCUXpresso IDE SWO Trace Guide
7.2.4 Example Setup Code for LPC1315/16/46/47 MCUs
Adding the following code to your main() function, after the call to Board_Init() if using LPCOpen,
should allow SWO trace to function:
volatile unsigned int *TRACECLKDIV = (unsigned int *) 0x400480AC;
volatile unsigned int *IOCON_PIO_0_9 = (unsigned int *) 0x40044024;
// Write 1 to TRACECLKDIV – Trace divider
*TRACECLKDIV = 1;
// Write 0x93 to I/O configuration for pin PIO0_9 to select ARM_TRACE_SWV
*IOCON_PIO_0_9 = 0x93;
7.2.5 Example Setup Code for LPC1311/13/42/43 MCUs
Adding the following code to your main() function, after the call to Board_Init() if using LPCOpen,
should allow SWO trace to function:
volatile unsigned int *TRACECLKDIV = (unsigned int *) 0x400480AC;
volatile unsigned int *IOCON_PIO_0_9 = (unsigned int *) 0x40044064;
// Write 1 to TRACECLKDIV – Trace divider
*TRACECLKDIV = 1;
// Write 0x93 to I/O configuration for pin PIO0_9 to select ARM_TRACE_SWV
*IOCON_PIO_0_9 = 0x93;
MCUXpresso IDE SWO Trace Guide -
User Guide
All information provided in this document is subject to legal disclaimers
Rev. 11.3.0 — 2 April, 2021
© 2021 NXP Semiconductors. All rights reserved.
23
Page 28

NXP Semiconductors MCUXpresso IDE SWO Trace Guide
8. Appendix B – SWO Trace Setup for LPC15xx
8.1 To Carry Out SWO Trace on LPC15xx
1. Ensure that your board has SWO pinned out to the debug connector.
2. Turn on the trace clock within the MCU, as this is not enabled by default.
3. Configure the switch matrix, so that the SWO signal is accessible on an appropriate pin of
the MCU.
This should typically be done within each of your application projects (or library projects that your
projects link against).
8.1.1 SWO Pin and Debug Connector
The first revisions of the LPCXpresso1549 board did not provide for connecting the SWO pin on
the debug connector. You will need a revision C (or later) of this board to carry out SWO Trace.
To identify which revision of board you have, look in the top right of the back of the board which
should be marked:
LPCXpresso1549
OM13056 v2 Rev C
If you are using a different board, you will need to check the schematics to identify if SWO is
connected to the debug connector.
8.1.2 Enabling the Trace Clock
The startup code generated by the new project wizards for LPC15xx in MCUXpresso IDE (and
later versions of LPCXpresso IDE) contains code to optionally turn on the trace clock. By default
this code will be enabled by the new project wizard, but if it is not required it can be removed by
defining the compiler symbol DONT_ENABLE_SWVTRACECLK.
If you are using different startup code (for instance, as provided in the projects in the LPCOpen
v2.08c package for the LPCXpresso1549 board), then you can add the following code to your
project to turn on the trace clock (for example, right at the start of main() or in the startup file
before the call to main() ):
volatile unsigned int *TRACECLKDIV = (unsigned int *) 0x400740D8;
*TRACECLKDIV = 1;
Note that later versions of the LPCOpen package for LPC15xx should contain appropriate trace
clock setup code within the startup file.
8.1.3 SWO Switch Matrix Configuration
The SWO signal from the Cortex CPU is not assigned to a fixed pin on the LPC15xx MCU. You
therefore need to configure the switch matrix correctly.
For example, if you are using LPCOpen v2.08c package for the LPCXpresso1549 board
(and have a revision C or later board), then you will need to modify board_sysinit.c in the
lpc_board_nxp_lpcxpresso_1549 project to add SWO to the switch matrix setup, thus:
MCUXpresso IDE SWO Trace Guide -
User Guide
STATIC const SWM_GRP_T swmSetup[] = {
/* USB related */
{(uint16_t) SWM_USB_VBUS_I, 1, 11}, /* PIO1_11-ISP_1-AIN_CTRL */
All information provided in this document is subject to legal disclaimers
Rev. 11.3.0 — 2 April, 2021
© 2021 NXP Semiconductors. All rights reserved.
24
Page 29

NXP Semiconductors MCUXpresso IDE SWO Trace Guide
/* UART */
{(uint16_t) SWM_UART0_RXD_I, 0, 13}, /* PIO0_13-ISP_RX */
{(uint16_t) SWM_UART0_TXD_O, 0, 18}, /* PIO0_18-ISP_TX */
// == ADD THE BELOW PINMUX ==
/* SWO signal */
{(uint16_t) SWM_SWO_O, 1, 2}, /* PIO01_2-SWO */
};
Note that later versions of the LPCOpen package for LPC15xx should contain appropriate SWO
switch matrix setup code for the LPCXpresso1549 board in the board library.
MCUXpresso IDE SWO Trace Guide -
User Guide
All information provided in this document is subject to legal disclaimers
Rev. 11.3.0 — 2 April, 2021
© 2021 NXP Semiconductors. All rights reserved.
25
Page 30

NXP Semiconductors MCUXpresso IDE SWO Trace Guide
9. Appendix C – SWO Trace Setup for LPC5410x
9.1 To Carry Out SWO Trace on LPC5410x
1. Ensure that your board has SWO pinned out to the debug connector.
2. If using the built-in LPC-Link2 debug probe of an LPCXpresso54102 board, ensure that the
probe is configured for DFU booting.
3. Turn on the trace clock within the MCU, as this is not enabled by default.
4. Configure the MCU pinmuxing, so that the SWO signal is accessible on the appropriate pin
of the MCU.
This should typically be done within each of your application projects (or library projects that your
projects link against).
Note that SWO Trace on LPC5410x MCUs can only be carried out for debug sessions connected
to the Cortex-M4 CPU, not to the Cortex-M0+.
9.1.1 SWO Pin and Debug Connector
On LPCXpresso54102 boards, pin P0_15 is connected to SWO of the debug connector.
If you are using a different board, you will need to check the schematics to identify if SWO is
connected to the debug connector (and on which pin from the MCU).
9.1.2 Debug Probe
The LPCXpresso54102 board may be shipped with an old version of CMSIS-DAP firmware
installed into the built-in LPC-Link2 debug probe, which does not provide the necessary channels
for SWO Trace data transfer back to the host debugger. You need to configure your board so that
the MCUXpresso IDE can softload the latest version of firmware. This is done by fitting a jumper
on JP5 (also called DFU Link) and located between the USB connections, and then repowering
the board. On the next debug connection, the latest firmware will be softloaded automatically.
For more details, please see https://www.nxp.com/pages/:LPCXPRESSO-BOARDS
9.1.3 Enabling the Trace Clock
The startup code generated by the new project wizards for LPC5410x in MCUXpresso IDE (and
later versions of LPCXpresso IDE) contain code to optionally turn on the trace clock. By default
this code will be enabled by the new project wizard, but if it is not required it can be removed by
defining the compiler symbol DONT_ENABLE_SWVTRACECLK.
If you are using different startup code (for instance, as provided in the projects in the LPCOpen
v2.14.1 package for the LPCXpresso5410x board), then you can add the following code to your
project to turn on the trace clock (for example, right at the start of main() or in the startup file
before the call to main() ) :
Note that later versions of the LPCOpen package for LPC5410x should contain appropriate trace
clock setup code in the startup file.
MCUXpresso IDE SWO Trace Guide -
User Guide
volatile unsigned int *TRACECLKDIV = (unsigned int *) 0x400000E4;
volatile unsigned int *SYSAHBCLKCTRLSET = (unsigned int *) 0x400000C8;
// Write 0x00000001 to TRACECLKDIV (0x400000E4) – Trace divider
*TRACECLKDIV = 1;
// Enable IOCON peripheral clock (for SWO on PIO0-15 or PIO1_1)
// by setting bit13 via SYSAHBCLKCTRLSET[0] (0x400000C8)
*SYSAHBCLKCTRLSET = 1 << 13; // 0x2000
All information provided in this document is subject to legal disclaimers
Rev. 11.3.0 — 2 April, 2021
© 2021 NXP Semiconductors. All rights reserved.
26
Page 31

NXP Semiconductors MCUXpresso IDE SWO Trace Guide
9.1.4 SWO Pinmux Configuration
On LPCXpresso54102 boards, pin P0_15 is connected to SWO of the debug connector. This
needs configuring in the pinmux settings for your project.
If you are using the examples from the LPCOpen v2.14.1 package for the LPCXpresso5410x
board, then you need to modify the pinmux settings in board_sysinit.c of the
lpc_board_lpcxpresso_54102 library project, so that the SWO settings are not commented out
by the #if 0 ... #endif clause (as they are by default). Thus, after modifying the code, it should
look like:
{0, 15, (IOCON_FUNC2 | IOCON_MODE_INACT | IOCON_DIGITAL_EN)}, /* SWO */
#if 0 /* Debugger signals, do not touch */
{0, 16, (IOCON_FUNC5 | IOCON_MODE_INACT | IOCON_DIGITAL_EN)}, /* SWCLK_TCK */
{0, 17, (IOCON_FUNC5 | IOCON_MODE_INACT | IOCON_DIGITAL_EN)}, /* SWDIO */
#endif
Note that later versions of the LPCOpen package for LPC5410x should contain appropriate SWO
pinmux setup code for the LPCXpresso54102 board in the board library.
MCUXpresso IDE SWO Trace Guide -
User Guide
All information provided in this document is subject to legal disclaimers
Rev. 11.3.0 — 2 April, 2021
© 2021 NXP Semiconductors. All rights reserved.
27
Page 32

NXP Semiconductors MCUXpresso IDE SWO Trace Guide
10. Appendix D – SWO Trace Setup for LPC5411x
10.1 To Carry Out SWO Trace on LPC5411x
1. Ensure that your board has SWO pinned out to the debug connector.
2. If using the built-in LPC-Link2 debug probe of a LPCXpresso54114 board, ensure that the
probe is configured for DFU booting.
3. Turn on the trace clock within the MCU, as this is not enabled by default.
4. Configure the MCU pinmuxing, so that the SWO signal is accessible on the appropriate pin
of the MCU.
This should typically be done within each of your application projects (or library projects that your
projects link against).
Note that SWO Trace on LPC5411x MCUs can only be carried out for debug sessions connected
to the Cortex-M4 CPU, not to the Cortex-M0+.
10.1.1 SWO Pin and Debug Connector
On LPCXpresso54114 boards, pin P0_15 is connected to SWO of the debug connector.
If you are using a different board, you will need to check the schematics to identify if SWO is
connected to the debug connector (and on which pin from the MCU).
10.1.2 Debug Probe
The LPCXpresso54114 board may ship with an old version of CMSIS-DAP firmware installed into
the built-in LPC-Link2 debug probe, which does not provide the necessary channels for SWO
Trace data transfer back to the host debugger. You need to configure your board so that the
MCUXpresso IDE can softload the latest version of firmware. This is done by fitting a jumper on
JP5 (also called DFU Link) and located between the USB connections, and then re-powering the
board. On the next debug connection, the latest firmware will be softloaded automatically.
For more details, please see https://www.nxp.com/pages/:LPCXPRESSO-BOARDS
10.1.3 Enabling the Trace Clock
Preinstalled Part Support for LPC5411x
The startup code generated by the new project wizards for LPC5411x in MCUXpresso IDE (and
LPCXpresso IDE) contains code to optionally turn on the trace clock. By default this code will
be enabled by the new project wizard, but if it is not required it can be removed by defining the
compiler symbol DONT_ENABLE_SWVTRACECLK.
This should also be included in the startup code provided as part of LPCOpen packages for
LPC5411x.
SDK Installed Part Support for LPC5411x
The startup code for LPC5411x from the SDK for these parts contains similar clock code setup
to the preinstalled part support given above.
MCUXpresso IDE SWO Trace Guide -
User Guide
volatile unsigned int *TRACECLKDIV = (unsigned int *) 0x40000304;
volatile unsigned int *SYSAHBCLKCTRLSET = (unsigned int *) 0x40000220;
// Write 0x00000000 to TRACECLKDIV – Trace divider
*TRACECLKDIV = 0;
// Enable IOCON peripheral clock (for SWO on PIO0-15 or PIO1_1)
// by setting bit13 via SYSAHBCLKCTRLSET[0]
*SYSAHBCLKCTRLSET = 1 << 13; // 0x2000
All information provided in this document is subject to legal disclaimers
Rev. 11.3.0 — 2 April, 2021
© 2021 NXP Semiconductors. All rights reserved.
28
Page 33

NXP Semiconductors MCUXpresso IDE SWO Trace Guide
10.1.4 SWO Pinmux Configuration
On LPCXpresso54114 boards, pin P0_15 is connected to SWO of the debug connector. This
needs configuring in the pinmux settings for your project.
Preinstalled Part Support for LPC5411x
If you are using LPCOpen, this will normally have already been done in the pinmux settings in
board_sysinit.c of the lpc_board_lpcxpresso_54114 library project, so that the SWO settings are
not commented out by the #if 0 ... #endif clause, thus:
{0, 15, (IOCON_FUNC2 | IOCON_MODE_INACT | IOCON_DIGITAL_EN)}, /* SWO */
#if 0 /* Debugger signals, do not touch */
{0, 16, (IOCON_FUNC5 | IOCON_MODE_INACT | IOCON_DIGITAL_EN)}, /* SWCLK_TCK */
{0, 17, (IOCON_FUNC5 | IOCON_MODE_INACT | IOCON_DIGITAL_EN)}, /* SWDIO */
#endif
SDK Installed Part Support for LPC5411x
The file /board/pin_mux.c needs modifying to configure the pinmux settings for SWO. The can be
done by adding the following code to the end of BOARD_InitPins():
/* PORT0 PIN15 (coords: 50) is configured as SWO */
IOCON_PinMuxSet(IOCON, PORT0_IDX, PIN15_IDX, port0_pin15_config);
Note that this change may have been already made in some of the SDK supplied examples (for
example the demo_apps), but not for all of them. So do check before attempting to carry out
SWO Trace whether the pinmux for your project has been configured for SWO or not.
MCUXpresso IDE SWO Trace Guide -
User Guide
All information provided in this document is subject to legal disclaimers
Rev. 11.3.0 — 2 April, 2021
© 2021 NXP Semiconductors. All rights reserved.
29
Page 34

NXP Semiconductors MCUXpresso IDE SWO Trace Guide
11. Appendix E – SWO Trace Setup for LPC546xx
11.1 To Carry Out SWO Trace on LPC546xx
1. Ensure that your board has SWO pinned out to the debug connector.
2. Turn on the trace clock within the MCU, as this is not enabled by default.
3. Configure the MCU pinmuxing, so that the SWO signal is accessible on the appropriate pin
of the MCU.
11.1.1 SWO Pin and Debug Connector
On LPCXpresso54608 boards, pin P0_10 is connected to SWO of the debug connector. The
pinmuxing needs to set this pin up for FUNC6 to connect SWO.
If you are using a different board, you will need to check the schematics to identify if SWO is
connected to the debug connector (and on which pin from the MCU).
11.1.2 Enabling the Trace Clock
This should typically be done within each of your application projects. For instance, the following
code could be added to your startup code:
volatile unsigned int *TRACECLKDIV = (unsigned int *) 0x40000304;
volatile unsigned int *SYSAHBCLKCTRLSET = (unsigned int *) 0x40000220;
// Write 0x00000000 to TRACECLKDIV / Trace divider
*TRACECLKDIV = 0;
// Enable IOCON peripheral clock
// by setting bit13 via SYSAHBCLKCTRLSET[0]
*SYSAHBCLKCTRLSET = 1 << 13; // 0x2000
When using the SDK, this is generally implemented in the function SystemInit() in CMSIS/
system_LPC54608.c, which will normally be called by the startup code.
SYSCON->ARMTRCLKDIV = 0;
11.1.3 SWO Pinmux Configuration
The file /board/pin_mux.c needs modifying to configure the pinmux settings for SWO. The can be
done by adding the following code to the end of BOARD_InitPins():
IOCON_PinMuxSet(IOCON, 0, 10, IOCON_MODE_INACT | IOCON_FUNC6 |
IOCON_DIGITAL_EN | IOCON_INPFILT_OFF);
Note that some of the SDK supplied examples may already have the pinmuxing set up for SWO
(for example, the demo_apps). But typically not all do. So do check before attempting to carry
out SWO Trace whether the pinmuxing for your project has been configured for SWO or not.
MCUXpresso IDE SWO Trace Guide -
User Guide
All information provided in this document is subject to legal disclaimers
Rev. 11.3.0 — 2 April, 2021
© 2021 NXP Semiconductors. All rights reserved.
30
 Loading...