

Page 1

MCUXpresso IDE FreeRTOS
Debug Guide
Rev. 11.3.0 — 2 April, 2021 User guide
Page 2

NXP Semiconductors MCUXpresso IDE FreeRTOS Debug Guide
MCUXpresso IDE FreeRTOS Debug Guide -
User Guide
2 April, 2021
Copyright © 2021 NXP Semiconductors
All rights reserved.
All information provided in this document is subject to legal disclaimers
Rev. 11.3.0 — 2 April, 2021
© 2021 NXP Semiconductors. All rights reserved.
ii
Page 3

NXP Semiconductors MCUXpresso IDE FreeRTOS Debug Guide
1. Introduction .................................................................................................................. 1
2. LinkServer FreeRTOS Thread Aware Debugging ........................................................... 2
2.1. Behavior when thread aware debugging ............................................................. 4
2.2. Required Source Code Changes ........................................................................ 5
2.2.1. Modify – File tasks.c ................................................................................ 5
2.2.2. Modify – File FreeRTOSConfig.h ................................................................... 6
2.2.3. Create – New File freertos_tasks_c_additions.h ........................................... 6
2.3. Detection and placement of FreeRTOS Debug Config block ................................. 6
2.3.1. Debugger Messages ............................................................................... 6
2.3.2. Placement of Config block ....................................................................... 7
2.4. Switching between all-stop and non-stop debug modes ....................................... 8
3. FreeRTOS Task Aware Debug Views ........................................................................... 9
3.1. Showing the FreeRTOS TAD Views ................................................................... 9
3.2. Task List View ................................................................................................... 9
3.3. Queue List View .............................................................................................. 10
3.4. Timer List View ................................................................................................ 11
3.5. Heap Usage View ............................................................................................ 12
3.5.1. Memory Scheme in Use ........................................................................ 12
3.5.2. Heap Usage View Functionality ............................................................. 12
3.6. Timeouts ......................................................................................................... 13
4. Thread Aware Debugging with Other Debug Probes ..................................................... 14
4.1. PEmicro Probes ............................................................................................... 14
4.2. SEGGER J-Link Probes ................................................................................... 14
MCUXpresso IDE FreeRTOS Debug Guide -
User Guide
All information provided in this document is subject to legal disclaimers
Rev. 11.3.0 — 2 April, 2021
© 2021 NXP Semiconductors. All rights reserved.
iii
Page 4

NXP Semiconductors MCUXpresso IDE FreeRTOS Debug Guide
1. Introduction
Many of the examples provided as part of MCUXpresso SDK and LPCOpen packages are built
around the FreeRTOS real time operating system. FreeRTOS is also a popular choice when
developing MCU software applications for real products.
For more information on FreeRTOS please visit http://www.freertos.org
This guide examines some of the functionality included in MCUXpresso IDE to assist you
in debugging applications built around FreeRTOS. It does not provide any information on
FreeRTOS itself or on developing applications that use FreeRTOS.
MCUXpresso IDE FreeRTOS Debug Guide -
User Guide
All information provided in this document is subject to legal disclaimers
Rev. 11.3.0 — 2 April, 2021
© 2021 NXP Semiconductors. All rights reserved.
1
Page 5
NXP Semiconductors MCUXpresso IDE FreeRTOS Debug Guide
2. LinkServer FreeRTOS Thread Aware Debugging
When debugging via LinkServer debug probes, the MCUXpresso IDE debugger can provide
FreeRTOS thread aware debug if :
1. Minor modifications are made to the application, so that configuration information required by
the debugger is present in the image file.
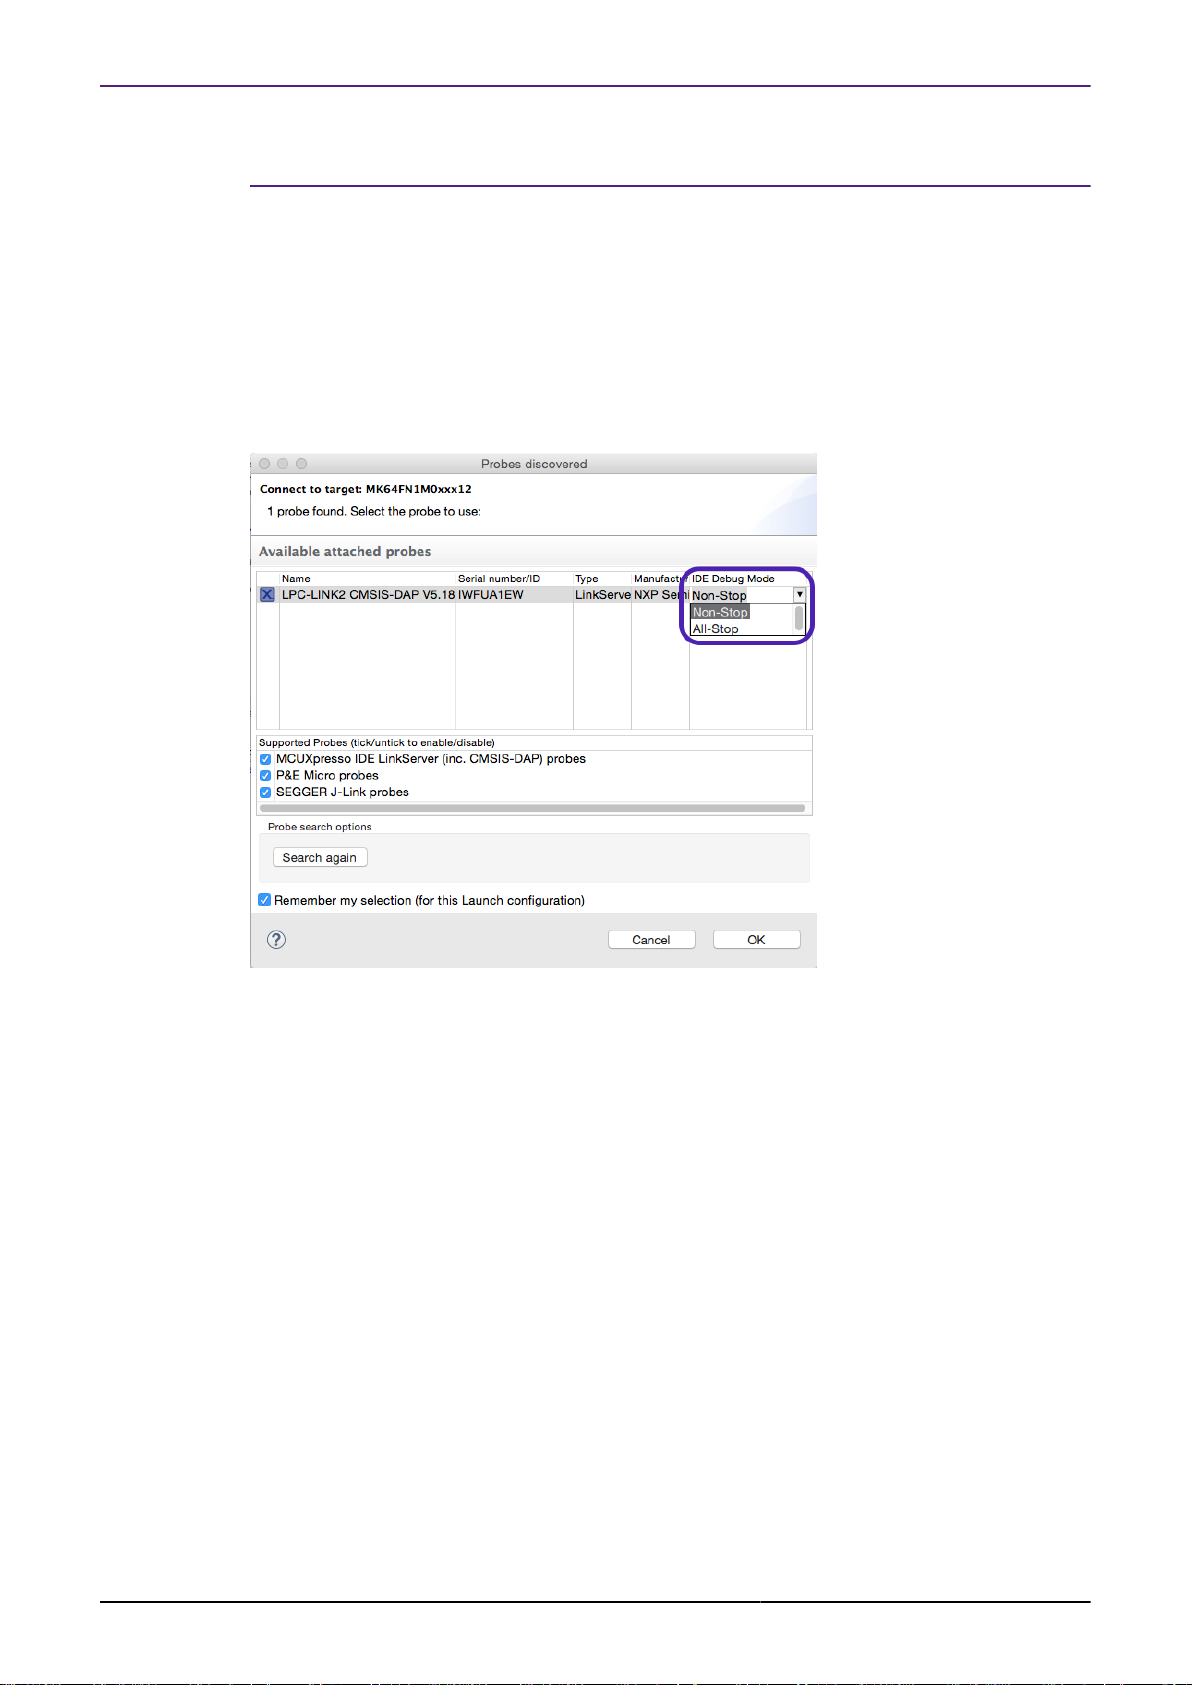
2. Debugging is carried out in All-Stop mode (rather than the default Non-Stop mode). This
selection is made when first making a debug connection for a particular project (or after
deleting an existing launch configuration). For more details, please see the MCUXpresso IDE
User Guide.
The source code modifications required are described in Required Source Code
Changes [5].
Note: Example projects supplied as part of MCUXpresso IDE compatible SDK packages should
already have had these changes made to them.
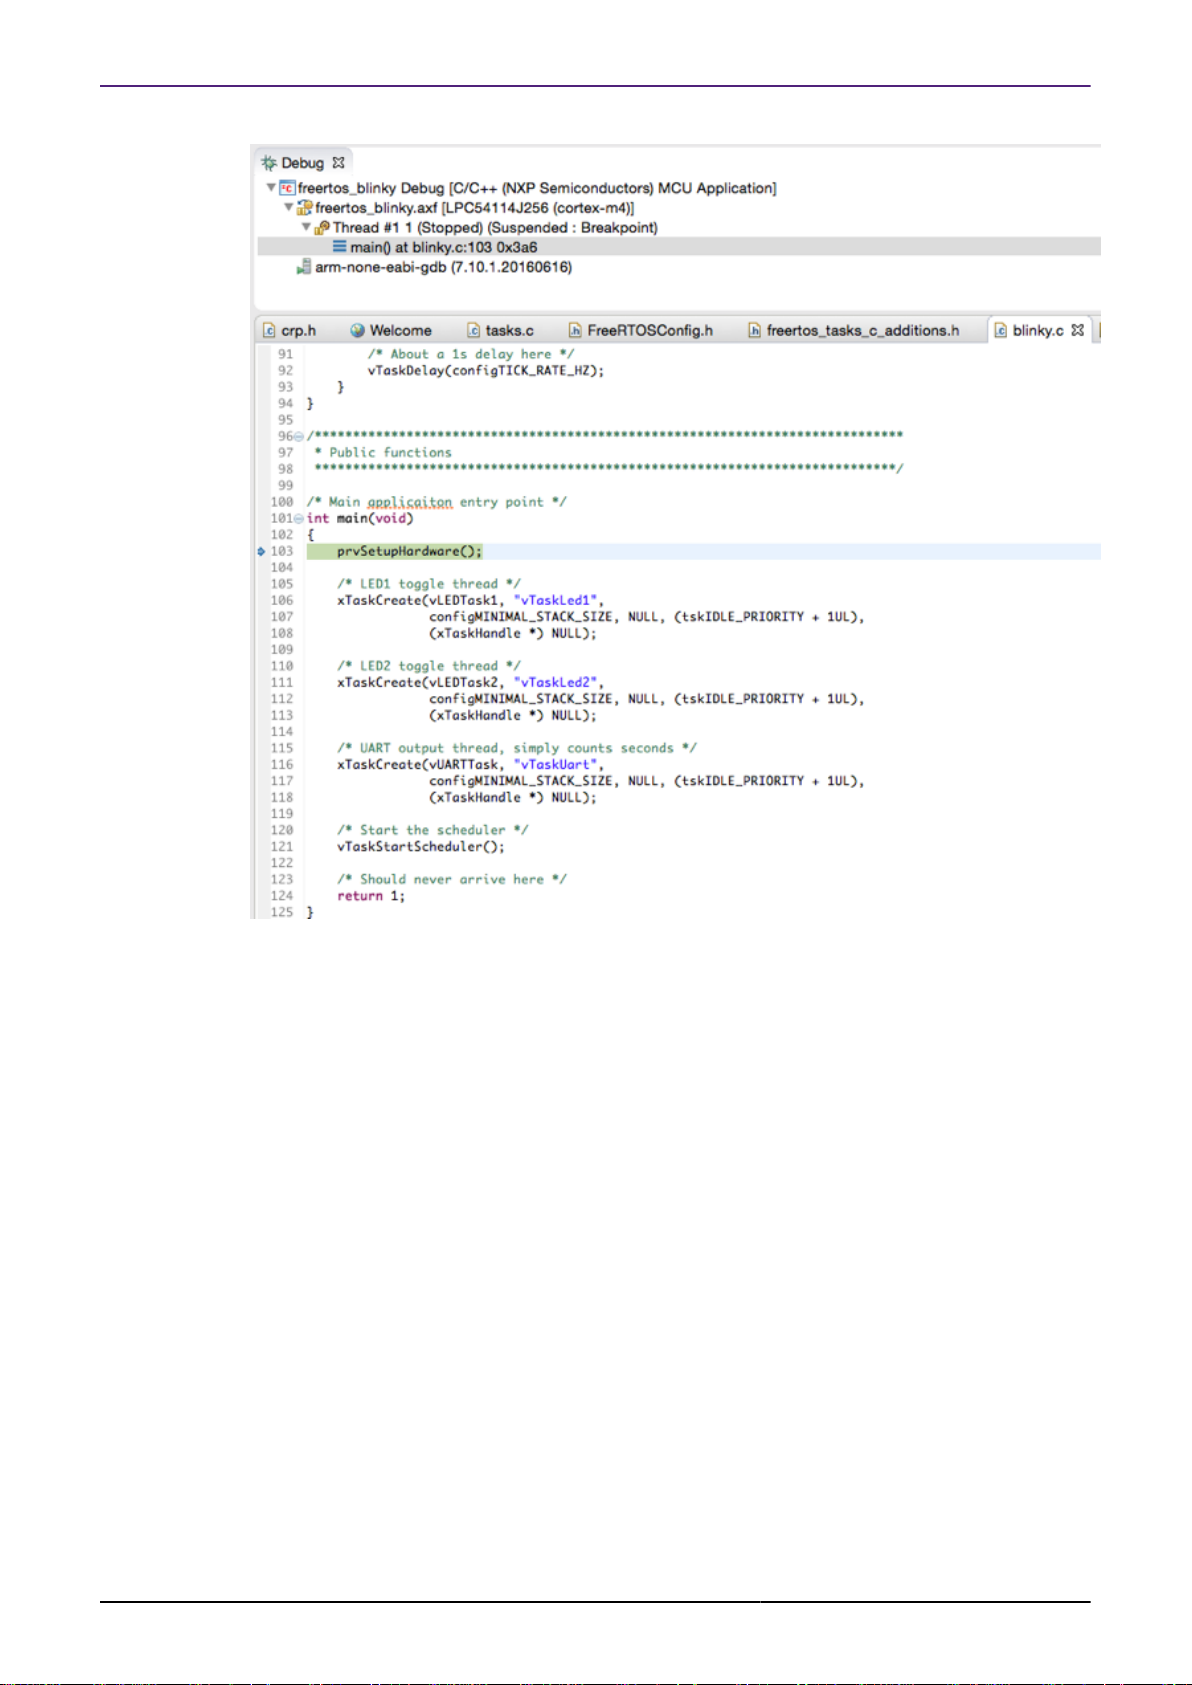
Without these changes, or if Non-Stop debug mode is used, only the current thread will be seen
in the Debug View, as shown in the below screenshot:
MCUXpresso IDE FreeRTOS Debug Guide -
User Guide
All information provided in this document is subject to legal disclaimers
Rev. 11.3.0 — 2 April, 2021
© 2021 NXP Semiconductors. All rights reserved.
2
Page 6
NXP Semiconductors MCUXpresso IDE FreeRTOS Debug Guide
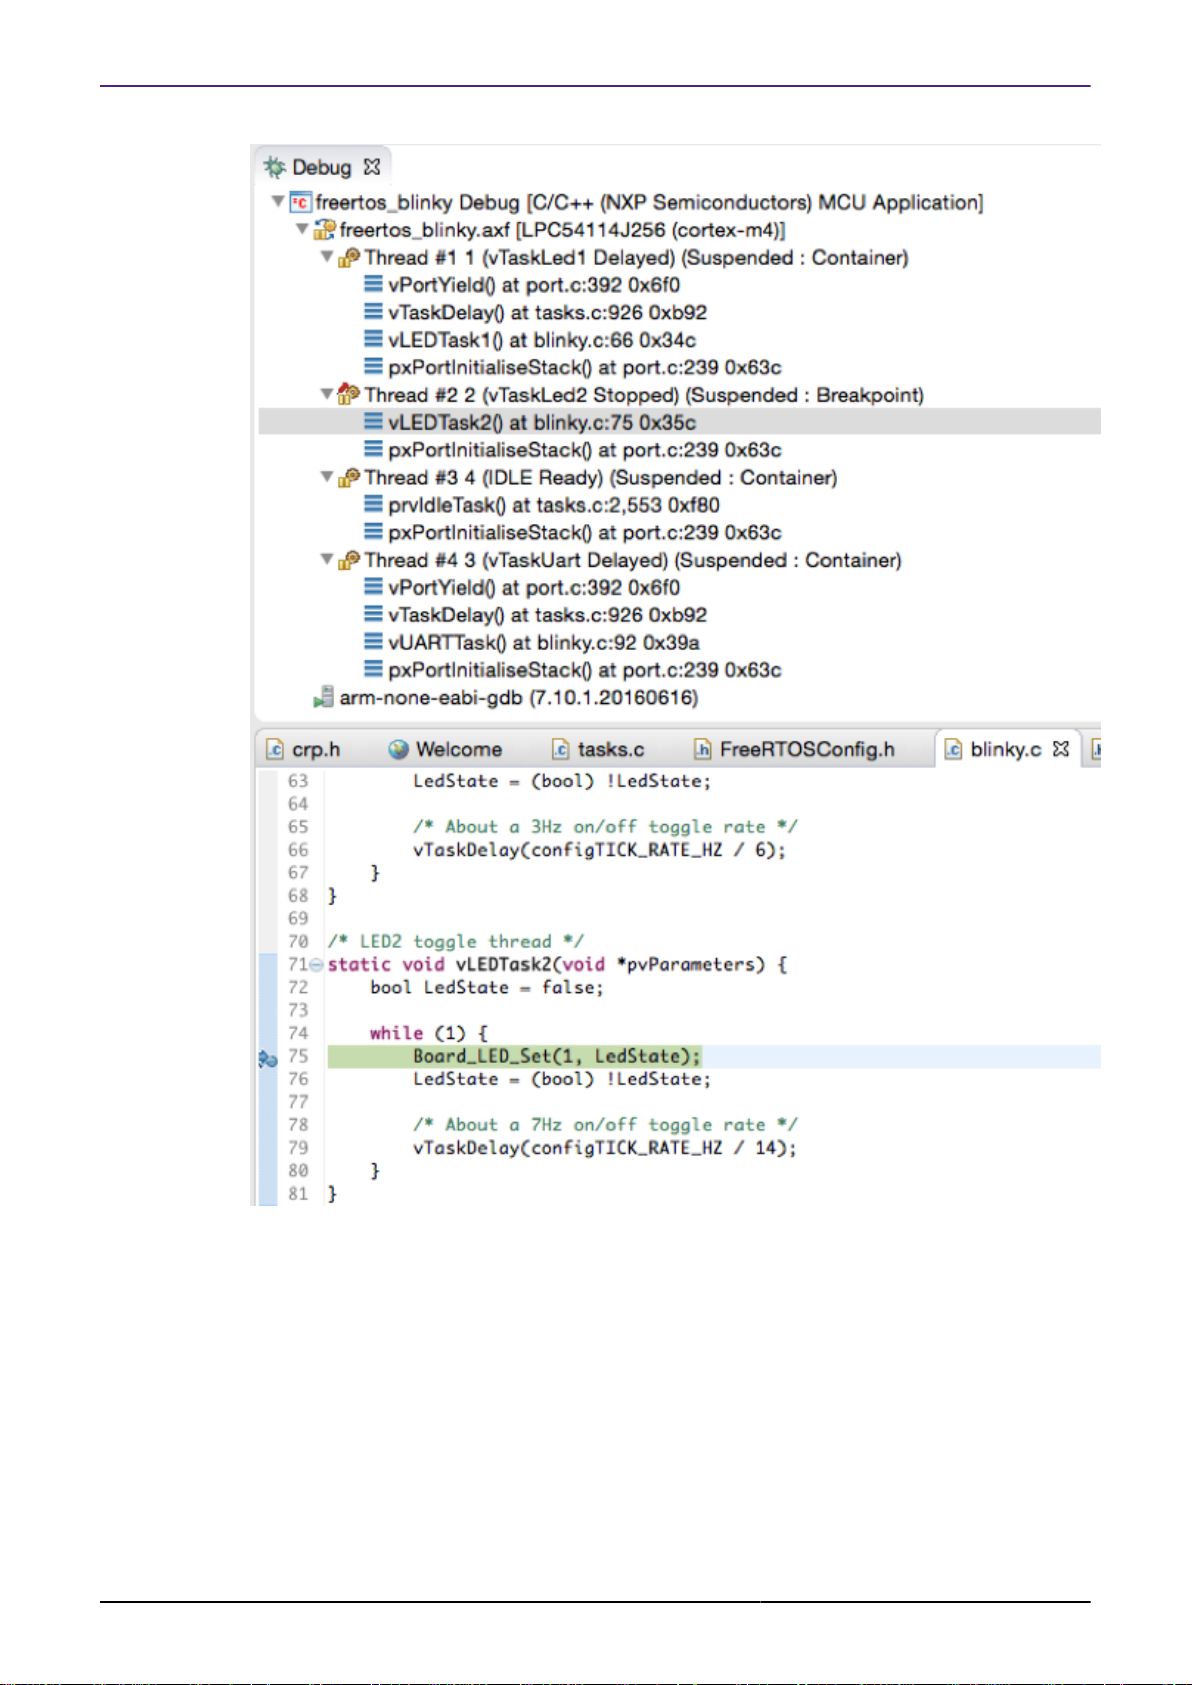
However, once the necessary changes are made to the application source, and All-Stop debug
mode is used, the Debug View will display each thread separately, as shown in the next
screenshot:
MCUXpresso IDE FreeRTOS Debug Guide -
User Guide
All information provided in this document is subject to legal disclaimers
Rev. 11.3.0 — 2 April, 2021
© 2021 NXP Semiconductors. All rights reserved.
3
Page 7
NXP Semiconductors MCUXpresso IDE FreeRTOS Debug Guide
Note: MCUXpresso IDE v10.0.0 provided a limited form of thread aware debugging in Non-
Stop debug mode. However due to restrictions in the way GDB’s Non-Stop debug functionality
operates, this has been removed in MCUXpresso IDE v10.0.2 and later. This means that it is no
longer possible to make use of Live Variables functionality within the Global Variables View at
the same time as LinkServer FreeRTOS thread aware debug.
2.1 Behavior when thread aware debugging
MCUXpresso IDE LinkServer FreeRTOS thread aware debugging is available once the
FreeRTOS scheduler has started (so will not appear straight after loading the application when
the default breakpoint on main() is reached). Debug works in stop mode. In other words, if
execution of a user task is halted either through a user action (halt) or a debug event (breakpoint,
MCUXpresso IDE FreeRTOS Debug Guide -
User Guide
All information provided in this document is subject to legal disclaimers
Rev. 11.3.0 — 2 April, 2021
© 2021 NXP Semiconductors. All rights reserved.
4
Page 8

NXP Semiconductors MCUXpresso IDE FreeRTOS Debug Guide
watchpoint, fault, etc.), the stopped thread is current and no application thread executes in
the background. The register context for any thread is available in the register window. For
suspended or blocked threads, the register context is the context in effect when the thread was
swapped out, regardless of which thread stack level is examined within the traceback window.
In the below example, the MCU is halted in Thread #2, but a backtrace for Thread #1 is also
opened up (and backtrace information for Threads #3, #4, and #5 is also available):
2.2 Required Source Code Changes
MCUXpresso IDE debug is implemented via a GDB remote console application (i.e. a stub). A
“remote debug stub” underneath GDB has access to symbolic information (through GDB), but
has no direct knowledge of symbol data types. Thread aware debug for FreeRTOS requires
16 bytes of configuration data (symbol FreeRTOSDebugConfig) be added to the application to
describe the as-built kernel configuration for a given FreeRTOS project.
The following notes describe the FreeRTOS project modifications required to enable thread
aware debug.
Note: Example projects supplied as part of MCUXpresso IDE compatible SDK packages should
already have had these changes made to them. And future releases of FreeRTOS are also
expected to include the same changes. Thus these changes are generally only required for LPC
preinstalled parts with LPCOpen FreeRTOS using projects.
2.2.1 Modify – File tasks.c
The MCUXpresso IDE FreeRTOS thread aware debug requires the addition of the following
conditional include, and function definition, to the end of the tasks.c source file. This code can be
placed after the FREERTOS_MODULE_TEST conditional include, if it exists:
#if ( configINCLUDE_FREERTOS_TASK_C_ADDITIONS_H == 1 )
#include "freertos_tasks_c_additions.h"
static void freertos_tasks_c_additions_init( void )
{
#ifdef FREERTOS_TASKS_C_ADDITIONS_INIT
FREERTOS_TASKS_C_ADDITIONS_INIT();
#endif
}
#endif
Note that the function freertos_tasks_c_additions_init() will be called by vTaskStartScheduler() in
future releases of FreeRTOS, but is not currently used by the MCUXpresso IDE.
MCUXpresso IDE FreeRTOS Debug Guide -
User Guide
All information provided in this document is subject to legal disclaimers
Rev. 11.3.0 — 2 April, 2021
© 2021 NXP Semiconductors. All rights reserved.
5
Page 9

NXP Semiconductors MCUXpresso IDE FreeRTOS Debug Guide
2.2.2 Modify – File FreeRTOSConfig.h
The FreeRTOSConfig.h header file is included in the FreeRTOS source distribution. To enable a
FreeRTOS project for thread aware debug, add the following macro definition to this file:
#define configINCLUDE_FREERTOS_TASK_C_ADDITIONS_H 1
Next, ensure the configUSE_TRACE_FACILITY macro is set to 1.
#define configUSE_TRACE_FACILITY 1
2.2.3 Create – New File freertos_tasks_c_additions.h
A copy of this file can also be found within the MCUXpresso IDE product installation at:
<install dir>/ide/Examples/Misc
For convenience, the freertos_tasks_c_additions.h header file can be placed in the same folder as
the FreeRTOSConfig.h header file.
There is also one edit to freertos_tasks_c_additions.h itself that may be required for a particular
FreeRTOS project configuration. The macro configFRTOS_MEMORY_SCHEME describes the project heap
mechanism using a value 1 – 5 according to the following:
1. heap_1 : The very simplest; does not permit memory to be freed
2. heap_2 : Permits memory to be freed, but not does coalesce adjacent free blocks
3. heap_3 : Simply wraps the standard malloc() and free() for thread safety
4. heap_4 : Coalesces adjacent free blocks to avoid fragmentation. Includes absolute address
placement option
5. heap_5 : As per heap_4, with the ability to span the heap across multiple non-adjacent
memory areas
Note: Future versions of FreeRTOS may incorporate the configFRTOS_MEMORY_SCHEME macro as a
configuration parameter in FreeRTOSConfig.h.
2.3 Detection and placement of FreeRTOS Debug Config block
2.3.1 Debugger Messages
LinkServer FreeRTOS Thread Aware Debugging requires that a data block containing the
configuration information required by the debugger is present in the image. It also requires that
the debug session is carried out in All-Stop mode.
If both of these criteria are met, then when you start your debug session, confirmation that
LinkServer FreeRTOS Thread Aware Debugging is active is recorded in the “Debug Messages”
log inside the IDE’s Console view:
...
GDB nonstop mode disabled (using allstop mode)
FreeRTOS stack backtrace is enabled
...
as shown in the screenshot below:
MCUXpresso IDE FreeRTOS Debug Guide -
User Guide
All information provided in this document is subject to legal disclaimers
Rev. 11.3.0 — 2 April, 2021
© 2021 NXP Semiconductors. All rights reserved.
6
Page 10

NXP Semiconductors MCUXpresso IDE FreeRTOS Debug Guide
If the image is debugged in Non-Stop mode, then the log will indicate that thread aware debugging
will not be available:
...
GDB nonstop mode enabled
FreeRTOS stack backtrace is disabled in Non-stop mode (use All-stop)
...
If the image does not contain the FreeRTOS Debug Config block, at all, then this section of the
Debug Messages log will make no reference to FreeRTOS thread awareness:
...
GDB nonstop mode enabled
...
or
...
GDB nonstop mode disabled (using allstop mode)
...
2.3.2 Placement of Config block
In MCUXpresso IDE v11.1.0 and later, the IDE’s managed linker script mechanism will now
attempt to ensure that the FreeRTOS Debug Config block is more reliably placed into the image
by explicitly keeping the .rodata* sections from the FreeRTOS tasks.c file (actually pulled in from
the freertos_tasks_c_additions.h file).
This is done in the freertos_debugconfig.ldt linker script template file, which attempts to determine
if the project is a FreeRTOS-using one . This is done based on the FreeRTOS component being
included in the project (for SDK-based projects,) or from the pathname (for non-SDK projects,
based on pre-installed parts).
This will cause a FreeRTOS line, similar to the one in the following snippet, to be placed in the
main generated linker script (.ld) file inside your project’s Debug (or Release) folder:
.text : ALIGN(4)
{
*(.text*)
KEEP(*freertos*/tasks.o(.rodata*)) /* FreeRTOS Debug Config */
*(.rodata .rodata.* .constdata .constdata.*)
. = ALIGN(4);
MCUXpresso IDE FreeRTOS Debug Guide -
User Guide
All information provided in this document is subject to legal disclaimers
Rev. 11.3.0 — 2 April, 2021
© 2021 NXP Semiconductors. All rights reserved.
7
Page 11

NXP Semiconductors MCUXpresso IDE FreeRTOS Debug Guide
} > PRPROGRAM_FLASH
If this FreeRTOS check within the managed linker script mechanism fails for some reason, then
you can force the inclusion of the FreeRTOS Debug Config blog in your project by adding a
folder to root directory of your project called “linkscripts” and adding a file to it called “user.ldt”
containing the following:
<#assign force_freertos=true>
For more details of linker script template files, please see the MCUXpresso IDE User Guide.
2.4 Switching between all-stop and non-stop debug modes
When debugging a project for the first time using a LinkServer debug connection (or when you
have deleted any existing launch configuration files), you can select whether to debug in Non-
Stop or All-Stop mode (so that you can choose whether or not you wish to use FreeRTOS thread
awareness).
However, you can also easily modify an existing launch configuration file to switch between All-
Stop and Non-Stop as follows.
• Open the project up in the Project Explorer view and double click on the appropriate launch
configuration file (typically “projname LinkServer Debug.launch”)
• Switch to the GDB Debugger tab
• Tick / Untick the " Non-Stop mode" option, as required.
• Click on Apply to save, then Continue
Any further debug sessions of your project will now use the newly selected debug mode.
MCUXpresso IDE FreeRTOS Debug Guide -
User Guide
All information provided in this document is subject to legal disclaimers
Rev. 11.3.0 — 2 April, 2021
© 2021 NXP Semiconductors. All rights reserved.
8
Page 12

NXP Semiconductors MCUXpresso IDE FreeRTOS Debug Guide
3. FreeRTOS Task Aware Debug Views
MCUXpresso IDE includes several additional Views to further simplify FreeRTOS application
debugging, known collectively as the FreeRTOS TAD (Task Aware Debugger for GDB):
• Task List : shows list of tasks with status information
• Queue List : shows currently active queues, semaphore, and mutex
• Timer List : lists the RTOS software timers
• Heap Usage : shows current heap usage and memory block allocation
Note: These Views are independent of the debug probe being used, as they just use GDB
commands to receive information from the target.
3.1 Showing the FreeRTOS TAD Views
The FreeRTOS Views can be opened using the “FreeRTOS” main menu in the MCUXpresso IDE.
The Views are “stop mode” Views: with the target halted or stopped, the Views will query the
device under debug and read the necessary information through the debug connection.
This will also happen during single stepping, so to improve stepping performance it is advisable
to:
1. Only have the needed Views in the foreground/visible, or close the Views if they are not used.
2. Make use of the Pause View feature, allowing you to single step without the Views constantly
reloading data.
3.2 Task List View
This View shows the tasks in a table:
TCB#
• Task Control Block. configUSE_TRACE_FACILITY needs to be set to 1
Task Name
• Name of task. configMAX_TASK_NAME_LEN needs to be greater than zero
Task Handle
MCUXpresso IDE FreeRTOS Debug Guide -
User Guide
All information provided in this document is subject to legal disclaimers
Rev. 11.3.0 — 2 April, 2021
© 2021 NXP Semiconductors. All rights reserved.
9
Page 13

NXP Semiconductors MCUXpresso IDE FreeRTOS Debug Guide
• Address of the task handle
Task State
• Current task state: blocked, running, ready
Priority
• Task base priority and current task priority
Stack Usage
• Graphical view of current stack usage, with current allocation and stack size available to the
task
Event Object
• Lists the object a blocked task is waiting for. Use vQueueAddToRegistry() to assign a symbolic
name to semaphore, mutex, and queues with configQUEUE_REGISTRY_SIZE greater than zero
Runtime
• Task runtime with percentage value. Both configUSE_TRACE_FACILITY and
configGENERATE_RUN_TIME_STATS need to be set to 1
Unfolding a task line item shows the following items:
Stack base
• Stack start address
Stack Top
• Stack end address
Stack High Water Mark
• Highest address used by stack at task context switch time
3.3 Queue List View
This View shows the queues, semaphore, and mutex in a table:
The meanings of the columns are as follows.
#
• Number of queue
MCUXpresso IDE FreeRTOS Debug Guide -
User Guide
All information provided in this document is subject to legal disclaimers
Rev. 11.3.0 — 2 April, 2021
© 2021 NXP Semiconductors. All rights reserved.
10
Page 14

NXP Semiconductors MCUXpresso IDE FreeRTOS Debug Guide
Queue Name
• Name of queue. Use configQUEUE_REGISTRY_SIZE greater than zero and vQueueAddToRegistry() to
assign a name to a queue, semaphore, or mutex
Address
• Address of queue handle
Length
• Length of queue. The first number indicates the number of elements in the queue, followed by
the maximum number of elements possible
Item Size
• Size of an individual element in the queue
# Tx Waiting
• Number of tasks waiting on a queue until it is not empty
# Rx Waiting
• Number of tasks waiting until an element is placed into the queue
Queue Type
• Type of queue, either Queue, semaphore, or mutex
Unfolding a queue line item shows the following information:
Head
• Address of queue head item (first item in the queue)
Tail
• Address of queue tail item (last item in the queue)
Read from
• Address of current reading element
Write to
• Address of next empty item in the queue
Clicking on an element in the queue shows details about it.
3.4 Timer List View
This View shows the software timers in a table:
ID
• ID of timer, assigned by vTimerSetTimerID().
Timer Name
• Name of timer
MCUXpresso IDE FreeRTOS Debug Guide -
User Guide
All information provided in this document is subject to legal disclaimers
Rev. 11.3.0 — 2 April, 2021
© 2021 NXP Semiconductors. All rights reserved.
11
Page 15
NXP Semiconductors MCUXpresso IDE FreeRTOS Debug Guide
Period (ticks)
• Period of timer in ticks
Auto reload?
• Whether the timer is automatically restarted after expiration
Timer Number
• Number of timer
Timer callback
• Address and name of callback function
3.5 Heap Usage View
This View provides information about the heap memory used.
3.5.1 Memory Scheme in Use
The Heap Usage View determines the used memory scheme (heap type) from:
1. The value of the configFRTOS_MEMORY_SCHEME in the FreeRTOSDebugConfig structure (as described in
Required Source Code Changes [5] above)
2. Else, the value of the user-defined variable freeRTOSMemoryScheme
3. Else from the details contained in the available FreeRTOS heap related variables ( ucHeap,
xHeapStructSize and heapSTRUCT_SIZE).
If the freeRTOSMemoryScheme variable is to be used, then this can be defined as follows, but you must
ensure that there is a reference to this symbol, so that it is not removed by the linker.
static const uint8_t freeRTOSMemoryScheme = 2; /* memory scheme 2 used */
3.5.2 Heap Usage View Functionality
The Heap Usage View provides the following information.
Type
• Memory scheme number
Heap Base
• Start address of heap
Heap End
• End address of the heap memory
MCUXpresso IDE FreeRTOS Debug Guide -
User Guide
All information provided in this document is subject to legal disclaimers
Rev. 11.3.0 — 2 April, 2021
© 2021 NXP Semiconductors. All rights reserved.
12
Page 16

NXP Semiconductors MCUXpresso IDE FreeRTOS Debug Guide
Heap Usage
• Amount of memory used with the total amount of memory
Free Space
• Amount of free memory with percentage
Heap Usage Graph
• Graphical view of percentage used
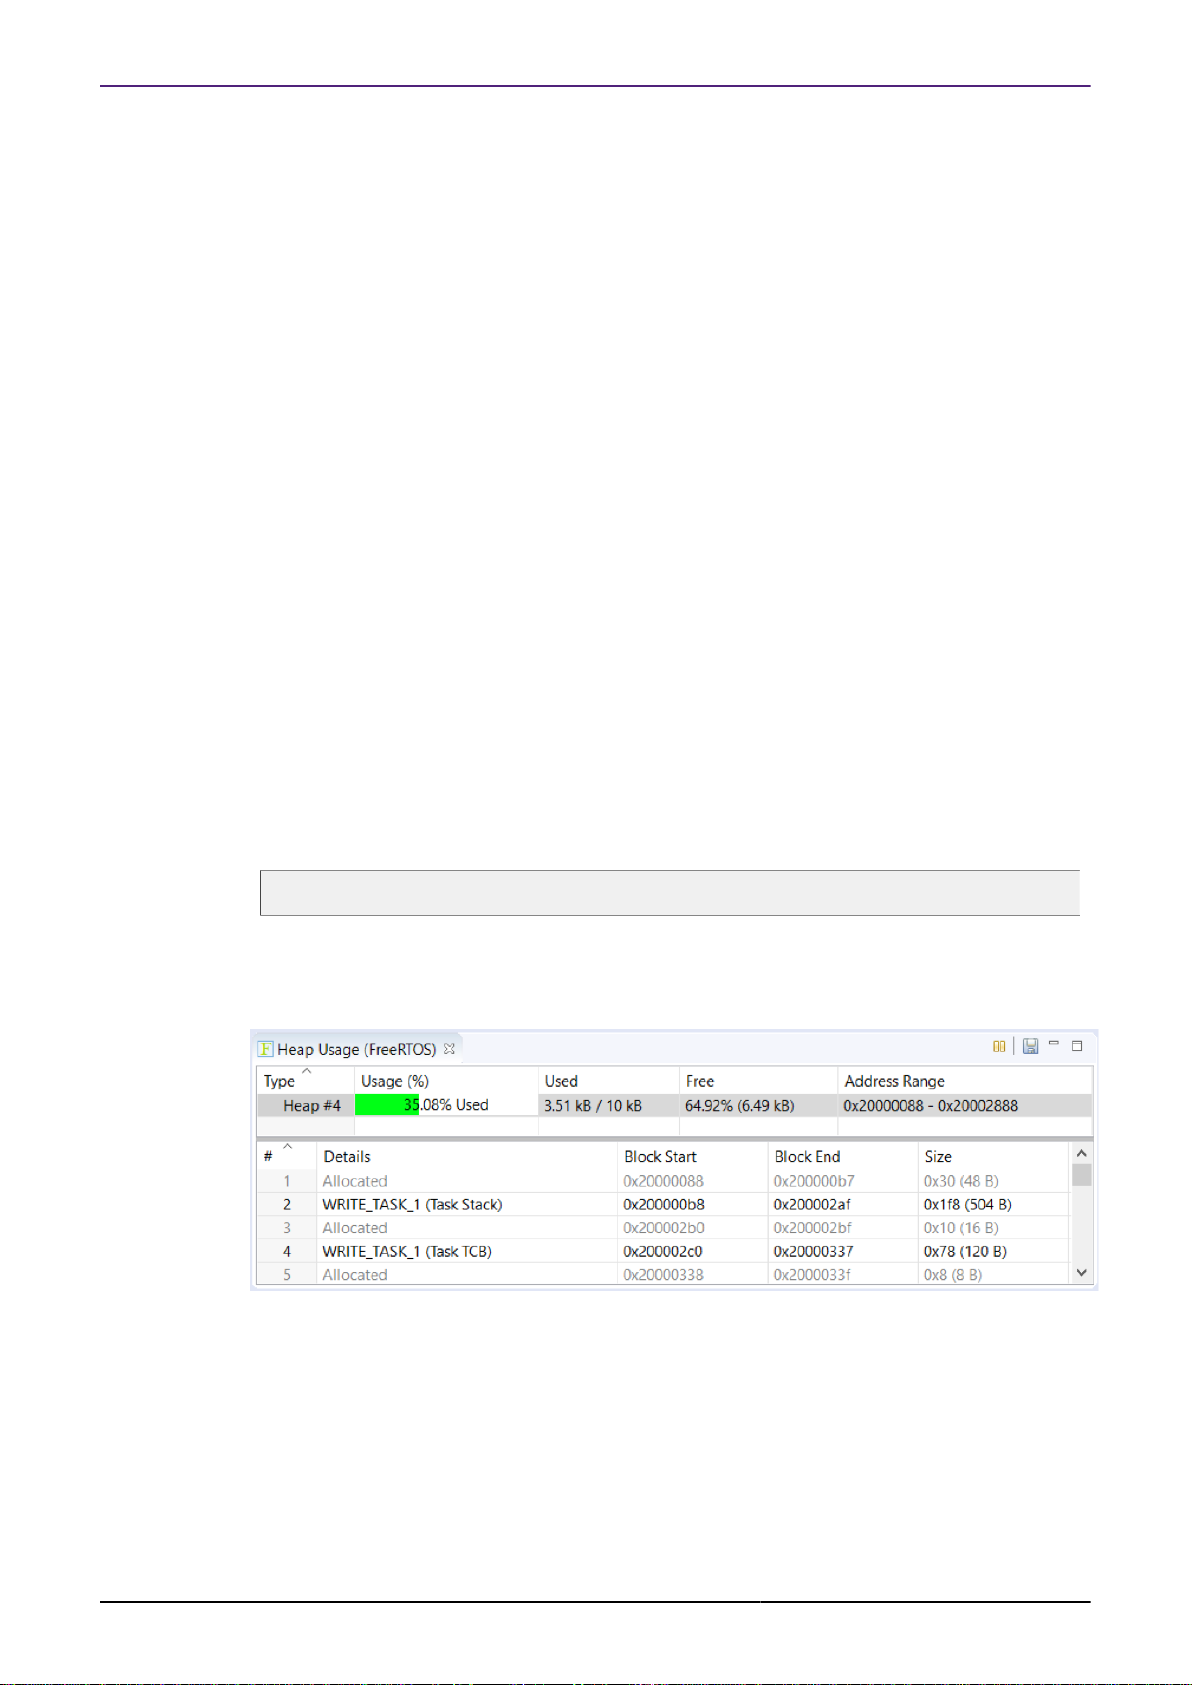
In the lower part of the View there is information about the heap memory blocks:
#
• Block number
Details
• Allocated, Free or the Task Stack or Task TCB
Block Start
• Start address of memory
Block End
• End address of memory
Size
• Size of memory
3.6 Timeouts
When using slow debug probes such as the OpenSDA debug probes fitted to many FRDM
boards, it is possible that timeouts will be reported within the IDE.
The timeout period can be extended if this occurs using the Workspace preference as shown
below:
MCUXpresso IDE FreeRTOS Debug Guide -
User Guide
All information provided in this document is subject to legal disclaimers
Rev. 11.3.0 — 2 April, 2021
© 2021 NXP Semiconductors. All rights reserved.
13
Page 17
NXP Semiconductors MCUXpresso IDE FreeRTOS Debug Guide
4. Thread Aware Debugging with Other Debug Probes
4.1 PEmicro Probes
FreeRTOS thread aware debugging with PEmicro debug probes is automatically supported
without any special option.
However on odd occasions this can cause problems and it is possible to turn it off using the
launch configuration server parameter:
-kernel=none
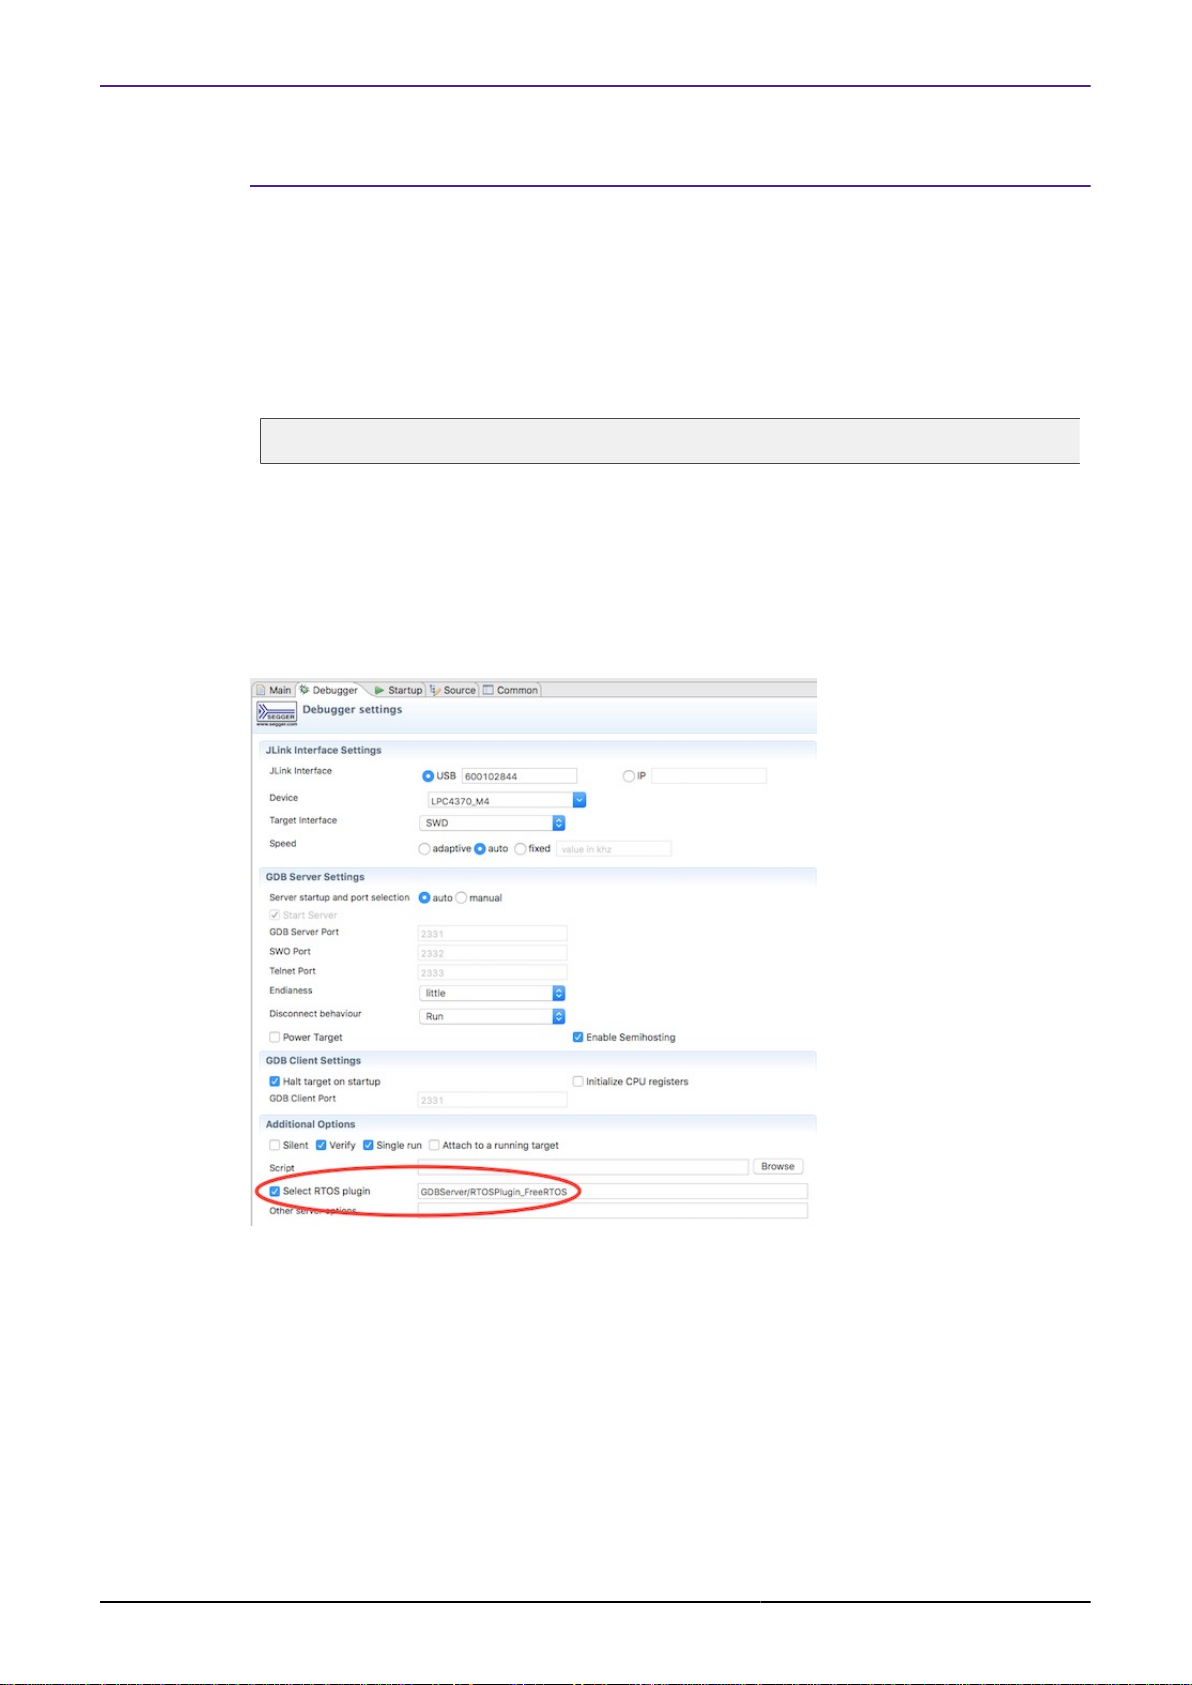
4.2 SEGGER J-Link Probes
FreeRTOS thread aware debugging for SEGGER J-Link debug probes is disabled by default.
To turn it on, enable the “Select RTOS plugin” option for “GDBServer/RTOSPlugin_FreeRTOS”
in the J-Link Launch Configuration for your project:
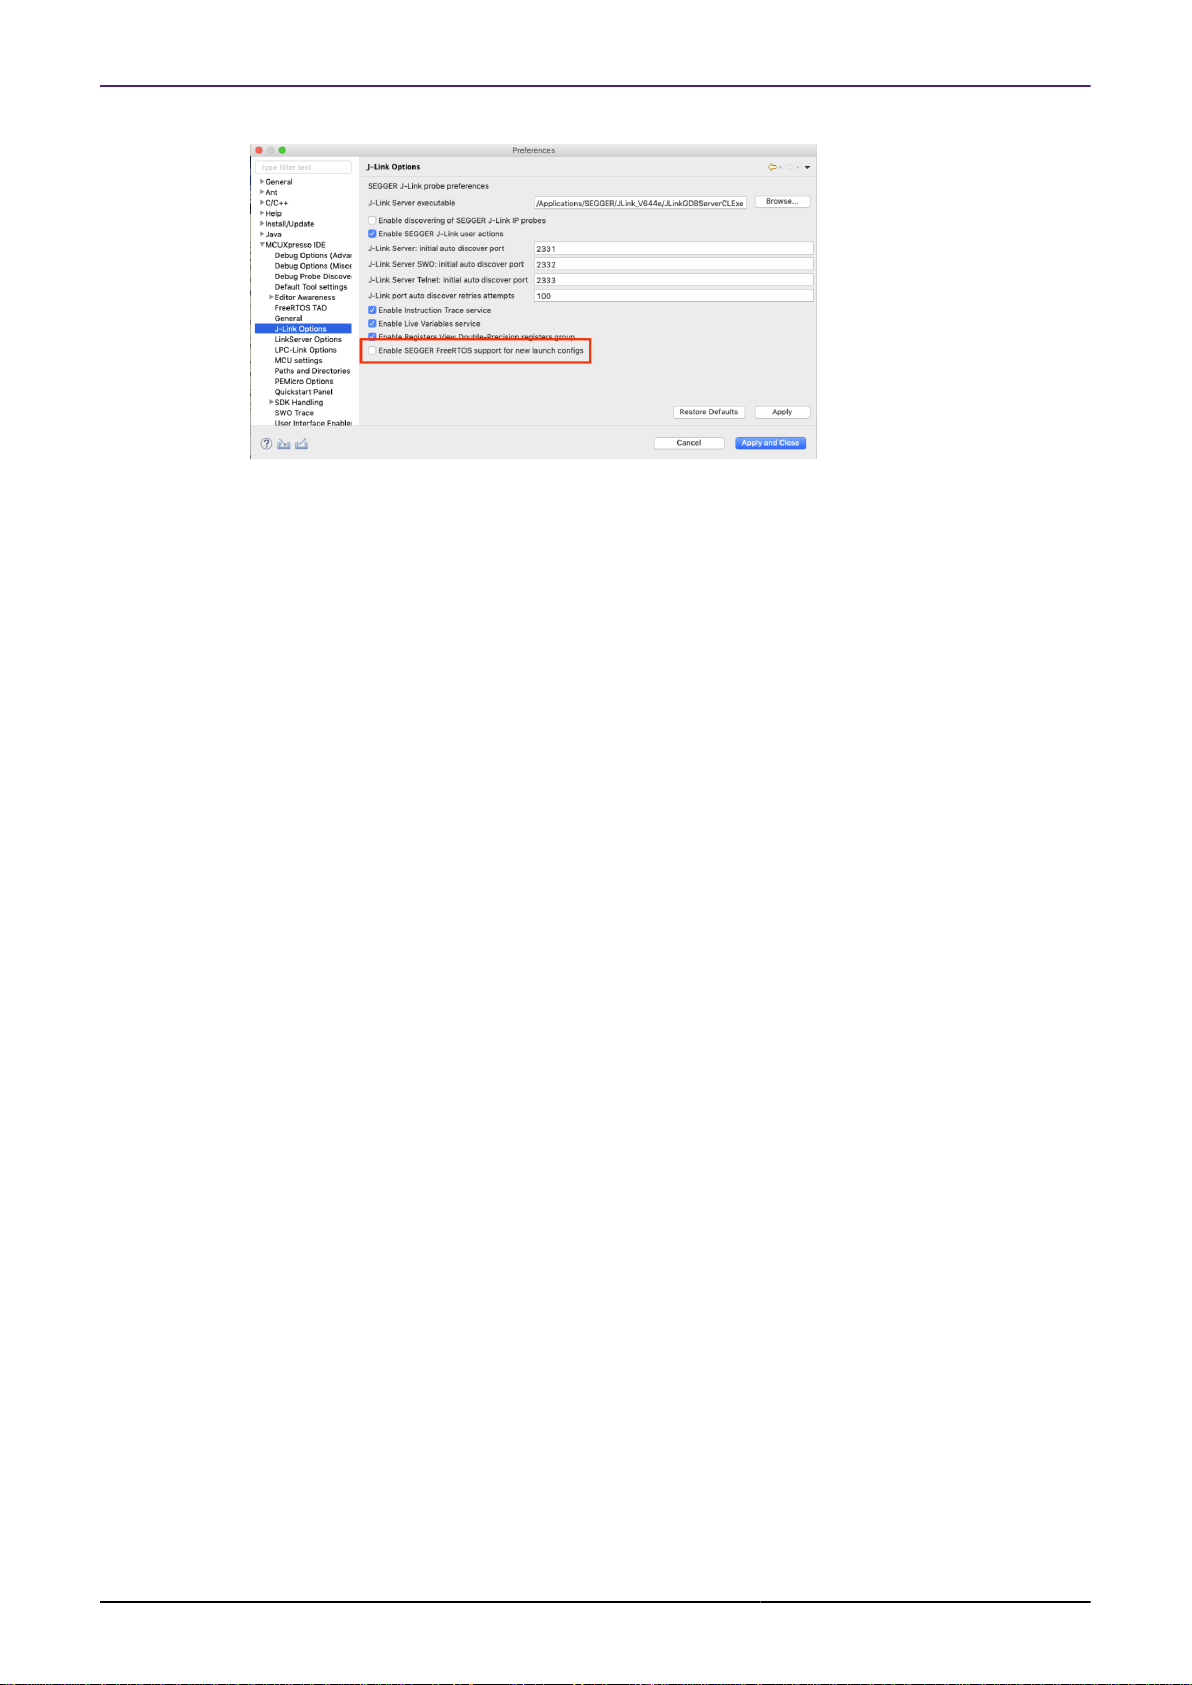
Alternatively, this default can be changed for new launch configurations via an IDE Workspace
J-Link preference as show below:
MCUXpresso IDE FreeRTOS Debug Guide -
User Guide
All information provided in this document is subject to legal disclaimers
Rev. 11.3.0 — 2 April, 2021
© 2021 NXP Semiconductors. All rights reserved.
14
Page 18
NXP Semiconductors MCUXpresso IDE FreeRTOS Debug Guide
MCUXpresso IDE FreeRTOS Debug Guide -
User Guide
All information provided in this document is subject to legal disclaimers
Rev. 11.3.0 — 2 April, 2021
© 2021 NXP Semiconductors. All rights reserved.
15
 Loading...