

Page 1

NXP Semiconductors Document identifier: MCUXIDECTUG
User's Guide Rev. 0, 1/2021
MCUXpresso Config Tools User's Guide (IDE)
Page 2

NXP Semiconductors
Contents
Chapter 1 Introduction........................................................................................... 5
1.1 Versions.....................................................................................................................................5
Chapter 2 User Interface ......................................................................................7
2.1 Creating, saving, and opening a configuration.......................................................................... 7
2.1.1 Creating a new configuration...................................................................................................... 7
2.1.2 Saving a configuration.................................................................................................................7
2.1.3 Importing sources........................................................................................................................7
2.1.3.1 Importing configuration.................................................................................................................. 8
2.1.3.2 Importing registers......................................................................................................................... 9
2.1.4 Restoring configuration from source code................................................................................ 11
2.2 Toolbar.................................................................................................................................... 11
2.2.1 Eclipse project selection............................................................................................................12
2.2.2 Config Tools Overview.............................................................................................................. 12
2.2.3 Show Problems View................................................................................................................ 12
2.2.4 Update code..............................................................................................................................12
2.2.5 Functional groups......................................................................................................................15
2.2.5.1 Functional group properties......................................................................................................... 15
2.2.6 Undo/Redo actions....................................................................................................................16
2.2.7 Selecting the tools.....................................................................................................................16
2.3 Status bar................................................................................................................................ 16
2.4 Preferences............................................................................................................................. 17
2.5 Configuration preferences....................................................................................................... 18
2.6 Problems view......................................................................................................................... 19
2.7 Registers view......................................................................................................................... 20
2.8 Log view.................................................................................................................................. 22
2.9 Config tools overview.............................................................................................................. 22
Chapter 3 Pins Tool............................................................................................. 24
3.1 Pins routing principle............................................................................................................... 24
3.1.1 Beginning with peripheral selection...........................................................................................24
3.1.2 Beginning with pin/internal signal selection...............................................................................25
3.1.3 Routing of peripheral signals.....................................................................................................25
3.2 Example workflow....................................................................................................................30
3.3 User interface.......................................................................................................................... 33
3.3.1 Pins view................................................................................................................................... 34
3.3.2 Package view............................................................................................................................ 35
3.3.3 Peripheral Signals view.............................................................................................................37
3.3.3.1 Filtering in the Pins and Peripheral Signals views....................................................................... 39
3.3.4 Routing Details view..................................................................................................................40
3.3.4.1 Labels and identifiers................................................................................................................... 41
3.3.5 Expansion Header.....................................................................................................................42
3.3.5.1 Expansion Board..........................................................................................................................46
3.3.6 Highlighting and color coding.................................................................................................... 48
3.4 Errors and warnings................................................................................................................ 50
3.4.1 Incomplete routing.....................................................................................................................50
3.5 Code generation......................................................................................................................51
3.6 Using pins definitions in code..................................................................................................52
MCUXpresso Config Tools User's Guide (IDE), Rev. 0, 1/2021
User's Guide 2 / 136
Page 3

NXP Semiconductors
Contents
Chapter 4 Clocks Tool......................................................................................... 54
4.1 Features.................................................................................................................................. 54
4.2 User interface.......................................................................................................................... 54
4.3 Clock configuration..................................................................................................................55
4.4 Global settings.........................................................................................................................55
4.5 Clock sources..........................................................................................................................55
4.6 Setting states and markers......................................................................................................56
4.7 Frequency settings.................................................................................................................. 56
4.7.1 Pop-up menu commands.......................................................................................................... 57
4.7.2 Frequency precision..................................................................................................................57
4.8 Dependency arrows.................................................................................................................57
4.9 Details view............................................................................................................................. 58
4.10 Clocks diagram......................................................................................................................59
4.10.1 Mouse actions in diagram....................................................................................................... 59
4.10.2 Color and line styles................................................................................................................60
4.10.3 Clock model structure............................................................................................................. 61
4.11 Clocks menu..........................................................................................................................62
4.12 Troubleshooting problems.....................................................................................................62
4.13 Code generation....................................................................................................................63
4.13.1 Working with the code.............................................................................................................64
4.14 Clock Consumers view..........................................................................................................64
Chapter 5 Peripherals Tool.................................................................................. 66
5.1 Features.................................................................................................................................. 66
5.2 Basic terms and definitions......................................................................................................66
5.3 Workflow..................................................................................................................................66
5.4 User interface.......................................................................................................................... 67
5.4.1 Toolbar (Peripherals)................................................................................................................ 68
5.4.1.1 Object Missing............................................................................................................................. 68
5.4.2 Components view......................................................................................................................68
5.4.3 Peripherals view........................................................................................................................71
5.4.4 Settings Editor...........................................................................................................................71
5.4.4.1 Quick selections...........................................................................................................................72
5.4.4.2 Settings........................................................................................................................................ 72
5.4.4.3 Settings Editor header................................................................................................................. 74
5.4.5 Documentation view..................................................................................................................75
5.5 SEMC Validation tool...............................................................................................................76
5.5.1 Validation view.......................................................................................................................... 76
5.6 Problems................................................................................................................................. 77
5.7 Code generation......................................................................................................................77
Chapter 6 Device Configuration Tool...................................................................80
6.1 Device Configuration Data (DCD) view................................................................................... 80
6.1.1 Device Configuration Data (DCD) view actions........................................................................ 80
6.2 Code generation......................................................................................................................82
Chapter 7 Trusted Execution Environment Tool.................................................. 83
7.1 AHB with security extension-enabled devices.........................................................................84
7.1.1 User Memory Regions view...................................................................................................... 84
7.1.2 Security Access Configuration view.......................................................................................... 88
7.1.2.1 SAU..............................................................................................................................................88
7.1.2.2 Interrupts......................................................................................................................................89
MCUXpresso Config Tools User's Guide (IDE), Rev. 0, 1/2021
User's Guide 3 / 136
Page 4

NXP Semiconductors
7.1.3 Memory attribution map............................................................................................................ 97
7.1.4 Access Overview.....................................................................................................................100
7.1.5 Code generation......................................................................................................................101
7.2 RDC-enabled devices............................................................................................................102
7.2.1 User Memory Regions view.................................................................................................... 102
7.2.2 Security Access Configuration view........................................................................................ 103
7.2.3 Memory Attribution Map.......................................................................................................... 116
7.2.4 Access Overview.....................................................................................................................118
7.2.5 Domains Overview.................................................................................................................. 119
7.2.6 Code generation......................................................................................................................120
Contents
7.1.2.3 Secure/Non-secure MPU............................................................................................................. 90
7.1.2.4 MPC............................................................................................................................................. 92
7.1.2.5 Masters/Slaves............................................................................................................................ 93
7.1.2.6 Pins.............................................................................................................................................. 95
7.1.2.7 Miscellaneous.............................................................................................................................. 97
7.1.3.1 Core 0.......................................................................................................................................... 97
7.1.3.2 Other masters.............................................................................................................................. 98
7.2.1.1 Access templates.......................................................................................................................102
7.2.2.1 RDC........................................................................................................................................... 103
7.2.2.1.1 RDC Masters.............................................................................................................. 103
7.2.2.1.2 Memory Regions.........................................................................................................105
7.2.2.1.3 Peripherals..................................................................................................................106
7.2.2.2 XRDC2 Domains view............................................................................................................... 107
7.2.2.2.1 MPU............................................................................................................................ 107
7.2.2.2.2 Domains......................................................................................................................109
7.2.2.2.3 Masters....................................................................................................................... 109
7.2.2.2.4 Peripherals..................................................................................................................111
7.2.2.2.5 Memory Regions.........................................................................................................113
7.2.2.2.6 Memory Slots.............................................................................................................. 114
7.2.2.3 Miscellaneous............................................................................................................................ 115
Chapter 8 Advanced Features........................................................................... 122
8.1 Switching the processor ....................................................................................................... 122
8.2 Exporting the Pins table.........................................................................................................123
8.3 Tools advanced configuration................................................................................................124
8.4 Generating HTML reports......................................................................................................124
8.5 Exporting sources..................................................................................................................124
8.6 Exporting registers.................................................................................................................126
8.7 Command line execution.......................................................................................................126
8.7.1 Command line execution - Pins tool........................................................................................128
8.7.2 Command line execution - Clocks Tool...................................................................................129
8.7.3 Command line execution - Peripherals tool............................................................................ 130
8.7.4 Command line execution - Project Cloner...............................................................................131
8.8 Managing data and working offline........................................................................................132
8.8.1 Working offline........................................................................................................................ 132
8.8.2 Downloading data................................................................................................................... 132
8.8.3 Exporting data......................................................................................................................... 133
8.8.4 Importing data......................................................................................................................... 133
8.8.5 Updating data..........................................................................................................................133
Chapter 9 Support..............................................................................................135
MCUXpresso Config Tools User's Guide (IDE), Rev. 0, 1/2021
User's Guide 4 / 136
Page 5

NXP Semiconductors
Chapter 1
Introduction
The MCUXpresso Config Tools set is a suite of evaluation and configuration tools that help you from initial evaluation to production
software development. Following tools are included:
Table 1. MCUXpresso Config Tools
Name Description
Pins Tool
Clocks Tool
Peripherals Tool Enable you to configure the initialization for the MCUXpresso SDK drivers.
Device
Configuration Tool
TEE Tool Enables you to configure security policies of memory areas, bus masters, and peripherals, in order to
Enables you to configure the pins of a device. Pins tool enables you to create, inspect, change, and modify
any aspect of the pin configuration and muxing of the device.
Enables you to configure initialization of the system clock (core, system, bus, and peripheral clocks) and
generates the C code with clock initialization functions and configuration structures.
Enables you to generate a Device Configuration Data (DCD) image using the format and constrains
specified in the Boot ROM reference manual.
isolate and safeguard sensitive areas of your application.
1.1 Versions
The suite of these tools is called MCUXpresso Config Tools. These tools are provided as an online Web application or as a desktop
application or as integrated version in MCUXpresso IDE.
NOTE
The desktop version of the tool contacts the NXP server and fetches the list of the available processors. Once used,
the processors data is retrieved on demand.
TIP
To use the desktop tool in the offline mode, create a configuration for the given processor while online. The tool will
then store the processors locally in the user folder and enable faster access and offline use. Otherwise, it is possible
to download and export the data using the Export menu.
MCUXpresso Config Tools User's Guide (IDE), Rev. 0, 1/2021
User's Guide 5 / 136
Page 6
NXP Semiconductors
Introduction
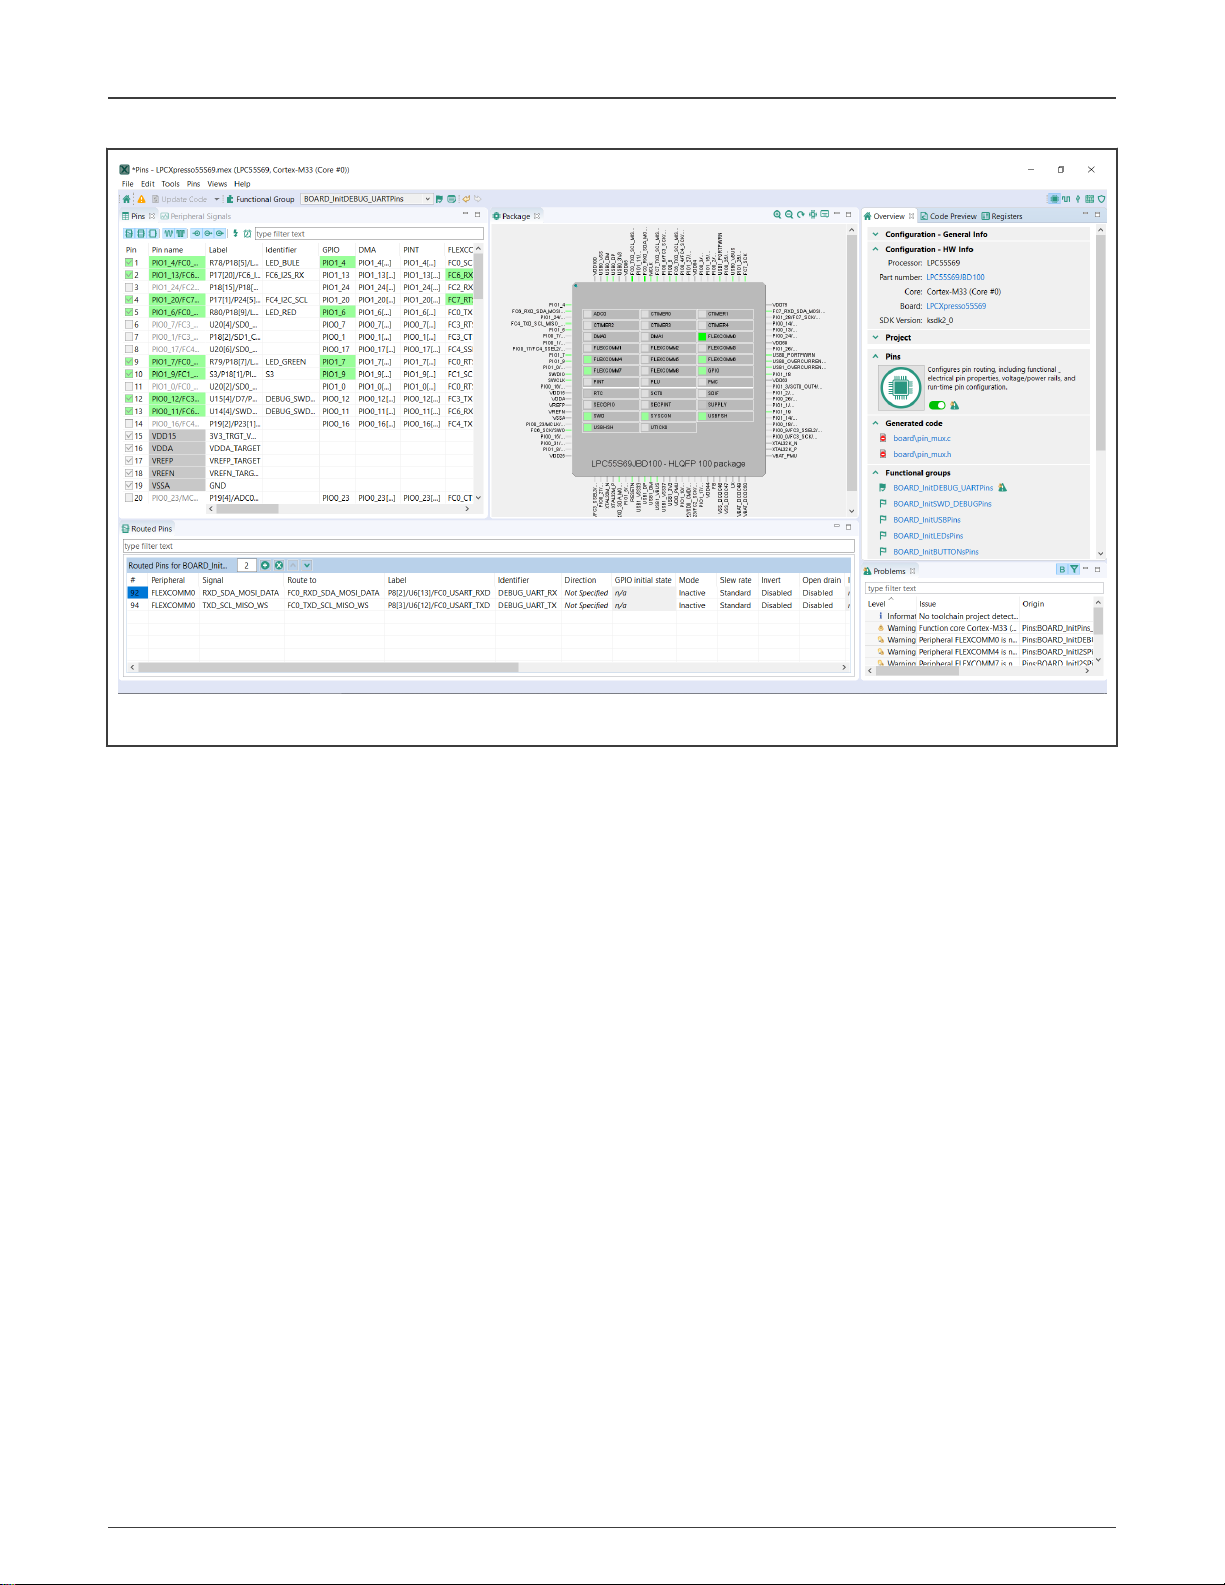
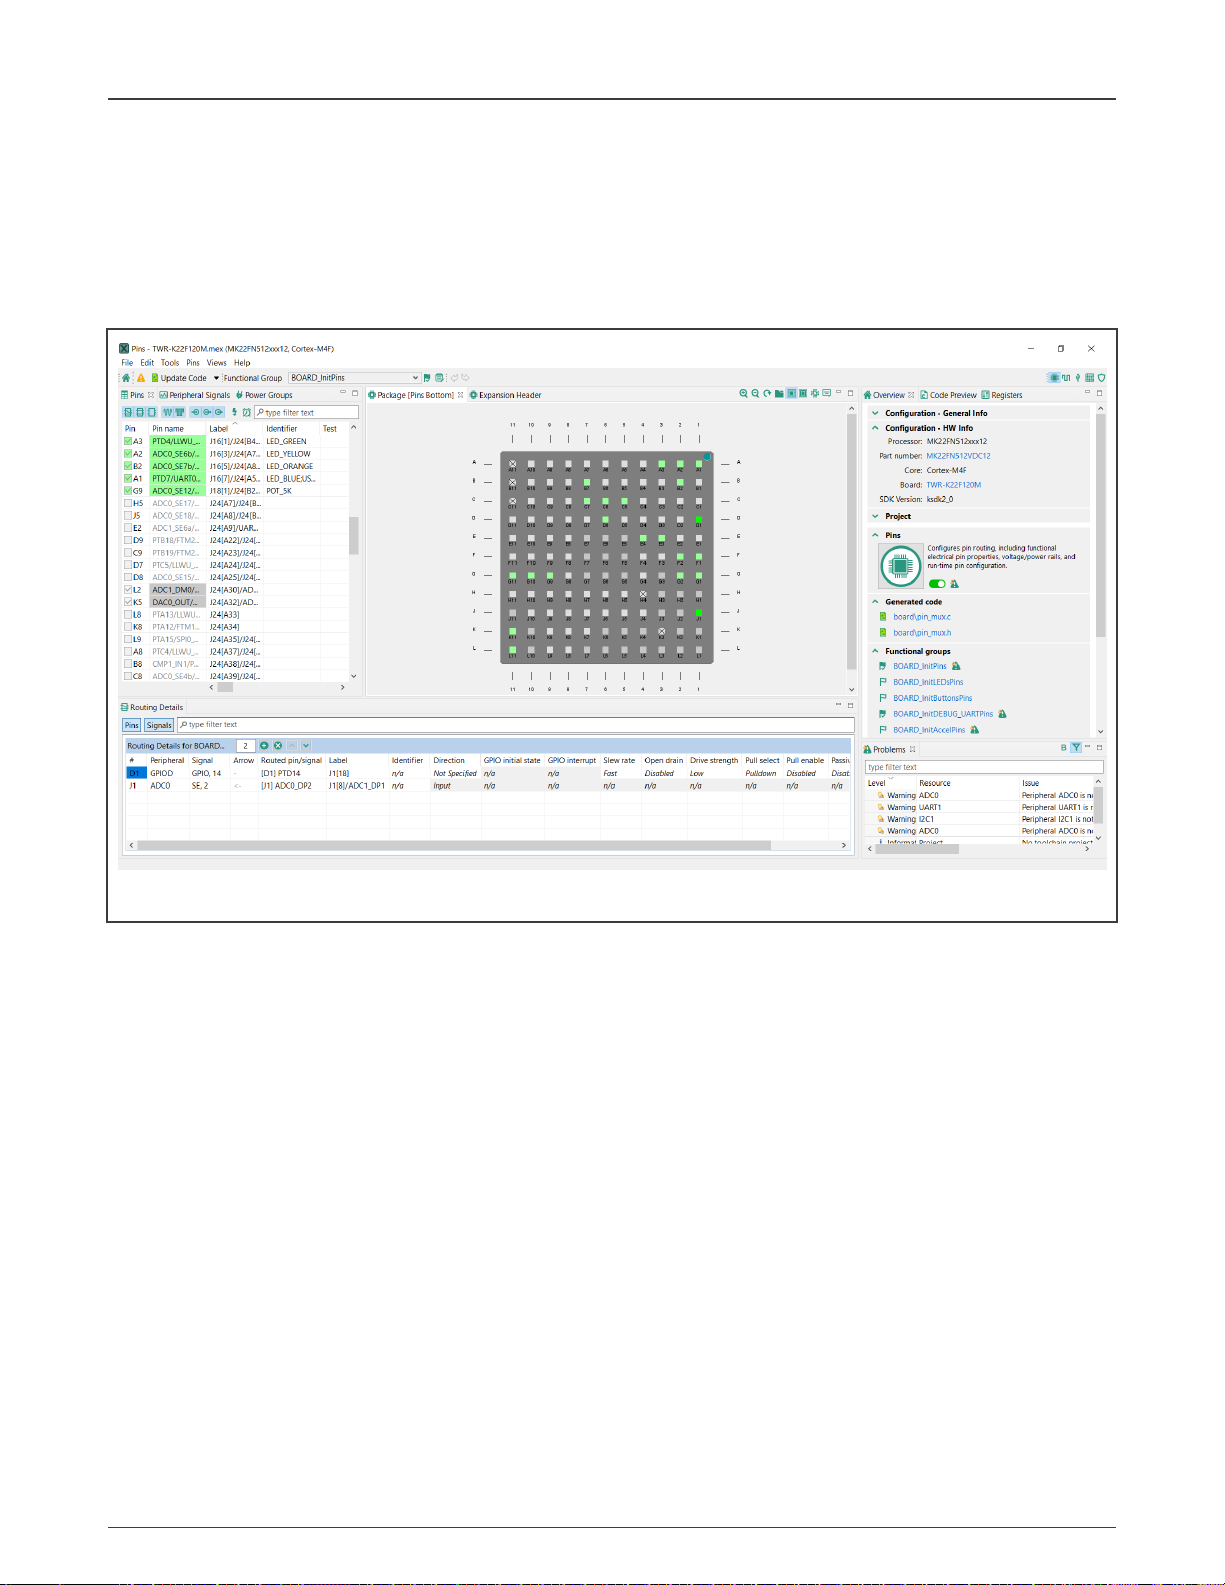
Figure 1. Desktop version of Pins tool
MCUXpresso Config Tools User's Guide (IDE), Rev. 0, 1/2021
User's Guide 6 / 136
Page 7

NXP Semiconductors
Chapter 2
User Interface
2.1 Creating, saving, and opening a configuration
In this context, configuration stands for common tools settings stored in an MEX (Microcontrollers Export Configuration) file. This
file contains settings of all available toolsand can be used in both web and desktop versions.
The folder with the saved MEX file must contain exactly one project file to be able to parse the toolchain project. The file type
depends on the toolchain of the project and can be one of the following:
Table 2. Supported toolchain project files
Toolchain Project file
IAR EW EWP
MDK μVision UVPROJX
ARM GCC CMakeLists.txt
2.1.1 Creating a new configuration
In Project Explorer, right-click the Eclipse project based on MCUXpresso SDK, and select MCUXpresso Config Tool > Open Pins.
One of the following actions takes place:
• If the project contains an MEX file in the root folder, the file is opened.
• If the project contains any source file with tool configuration (pin_mux.c, clock_config.c and/or peripheral.c), the tool
configuration is imported from this file.
• Otherwise, an empty/default configuration for selected processor is created.
NOTE
The same command can be invoked also from popup menu on the MEX file or from toolbar in Project Explorer view.
2.1.2 Saving a configuration
You can save your configuration by clicking the Save button on the toolbar or selecting File>Save from the Main Menu. The
command is enabled only if the configuration is dirty (unsaved) and one of MCUXpresso Config Tool perspective is opened. The
configuration is always saved into an MEX file stored in the project root folder. If file doesn't exist, new one is created using current
project name.
NOTE
Configuration is also saved when you select Update Code in the toolbar.
2.1.3 Importing sources
To import source code files, do the following:
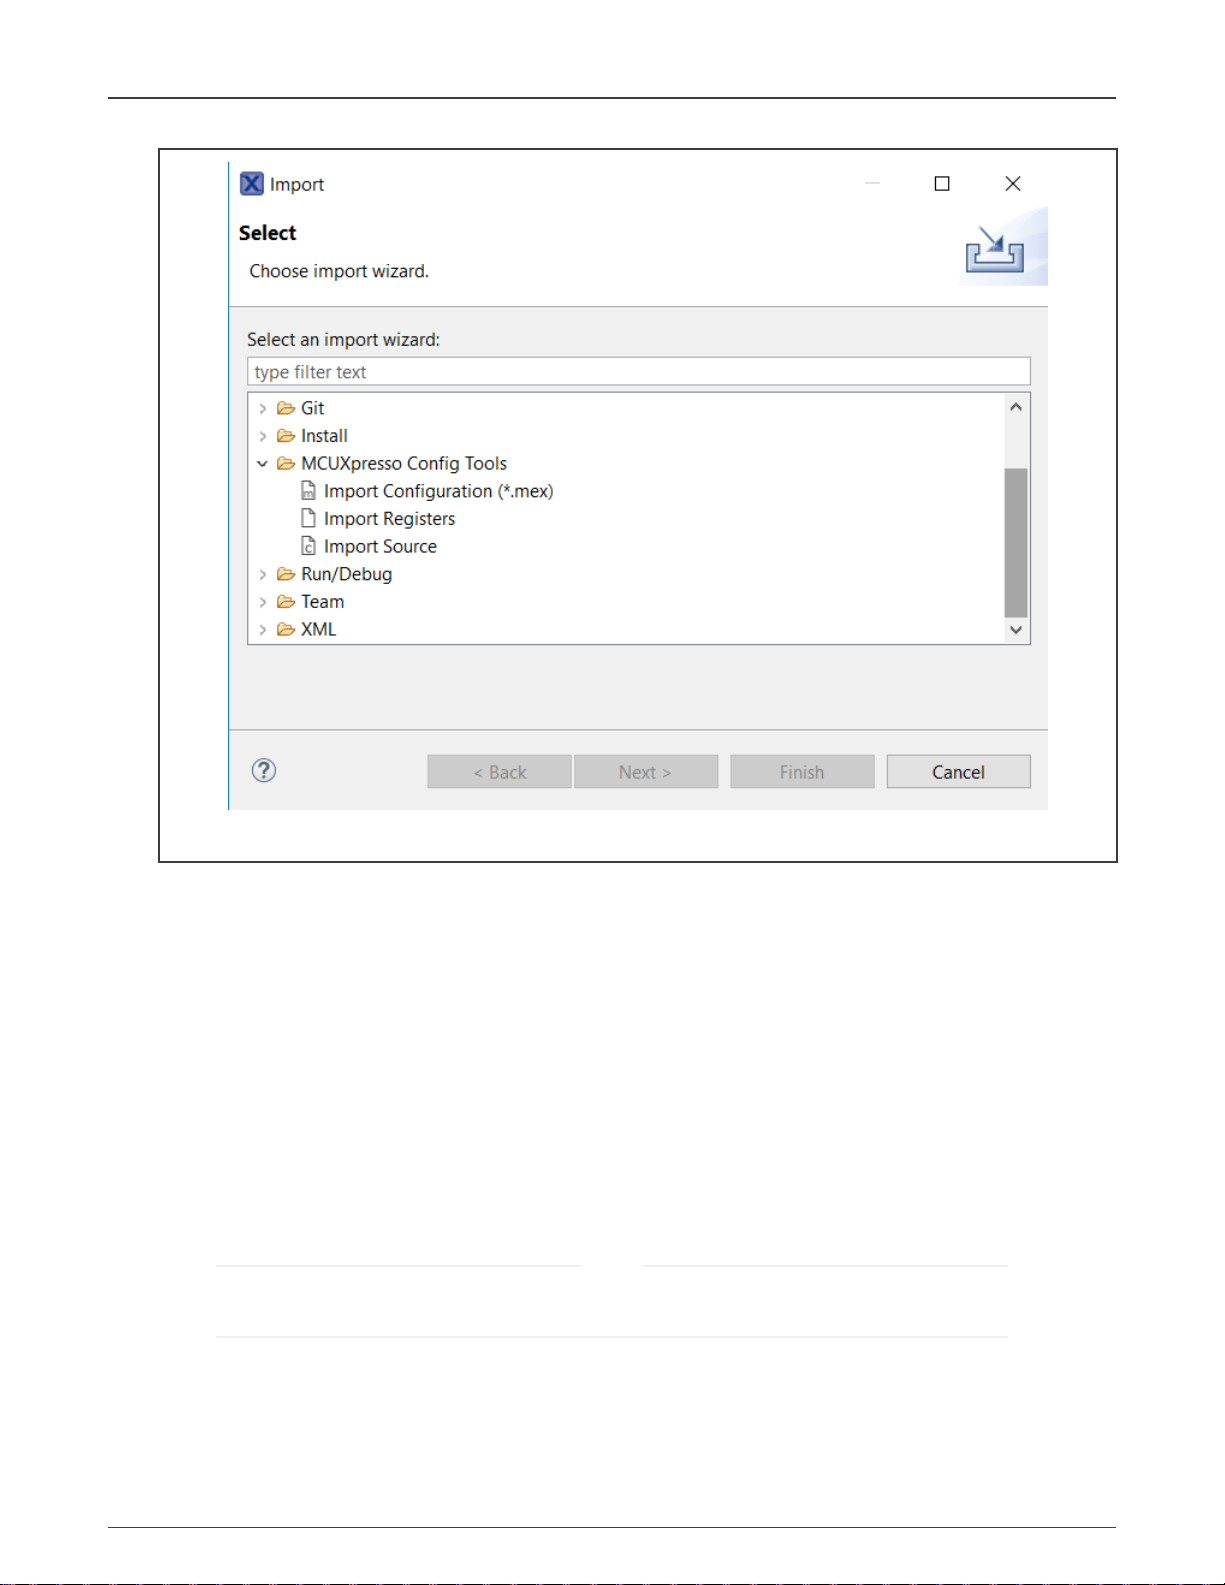
1. In the Menu bar, select File > Import....
2. From the list, select MCUXpresso Config Tools>Import Source.
MCUXpresso Config Tools User's Guide (IDE), Rev. 0, 1/2021
User's Guide 7 / 136
Page 8
NXP Semiconductors
User Interface
Figure 2. Import Source wizard
3. Click Next.
4. On the next page, click Browse to specify the location of the source file.
5. Select the source file you wish to import and click Open.
6. On the next page, select which functional groups to import (based on tools) by selecting the checkbox in the left column.
7. Define how to import the functional groups by selecting one of the two available options in the dropdown menu in the
right column:
• Rename – All files are merged into the current configuration. It imports all the functions only. If the imported
function has the same name as an existing one, it is automatically renamed to the indexed one. For example, if
BOARD_InitPins already exists in the configuration then the imported function is renamed to BOARD_InitPins1.
• Overwrite – All files are merged into the current configuration. It imports all the functions only. If the imported
function has the same name as an existing one, then the existing one is replaced with the imported one.
8. Click Finish.
NOTE
Only C files with valid YAML configuration can be imported. It imports the configuration only, then the whole C file
is re-created based on this setting. The rest of the C and DTSI files are ignored.
2.1.3.1 Importing configuration
MCUXpresso Config Tools User's Guide (IDE), Rev. 0, 1/2021
User's Guide 8 / 136
Page 9
NXP Semiconductors
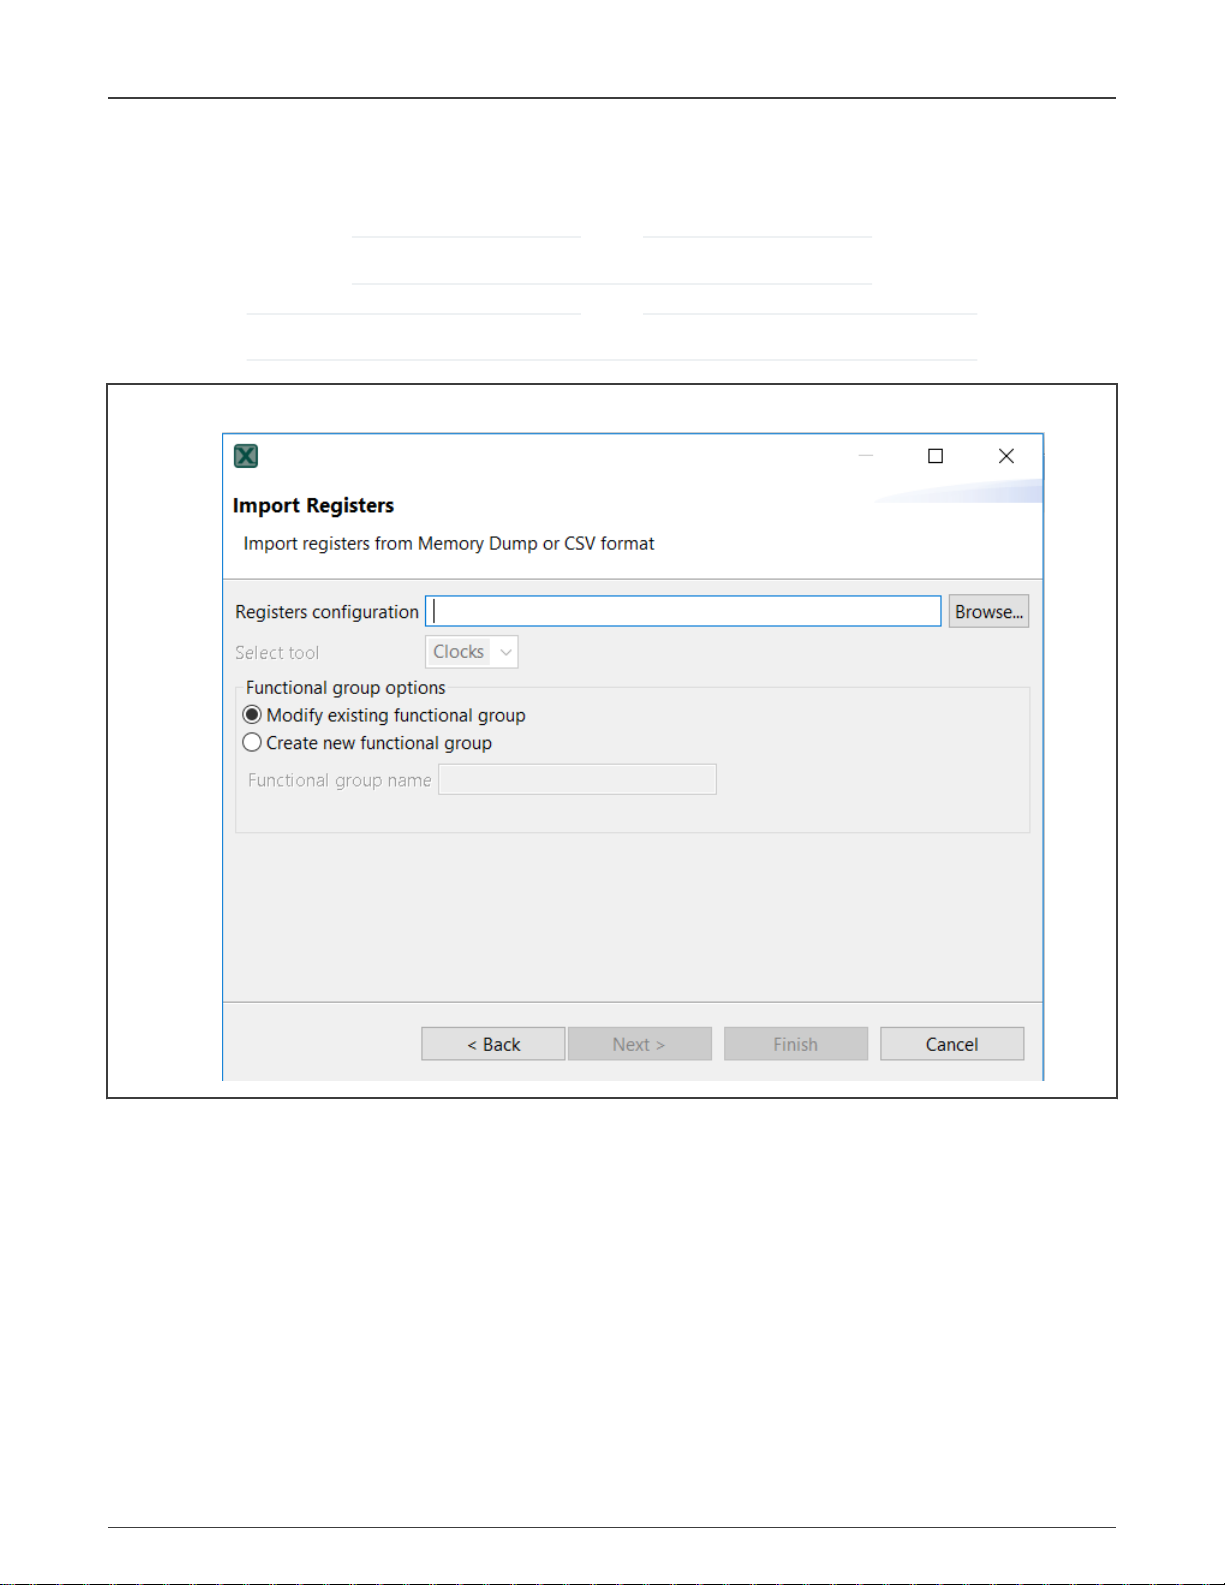
2.1.3.2 Importing registers
You can import register configuration from a processor memory dump.
NOTE
Currently, register configuration can be imported into the Clocks tool only.
NOTE
A processor memory-dump file in the CSV or S19 format is required for importing register configuration.
Figure 3. Import Registers
User Interface
To import register configuration, do the following:
MCUXpresso Config Tools User's Guide (IDE), Rev. 0, 1/2021
User's Guide 9 / 136
Page 10
NXP Semiconductors
User Interface
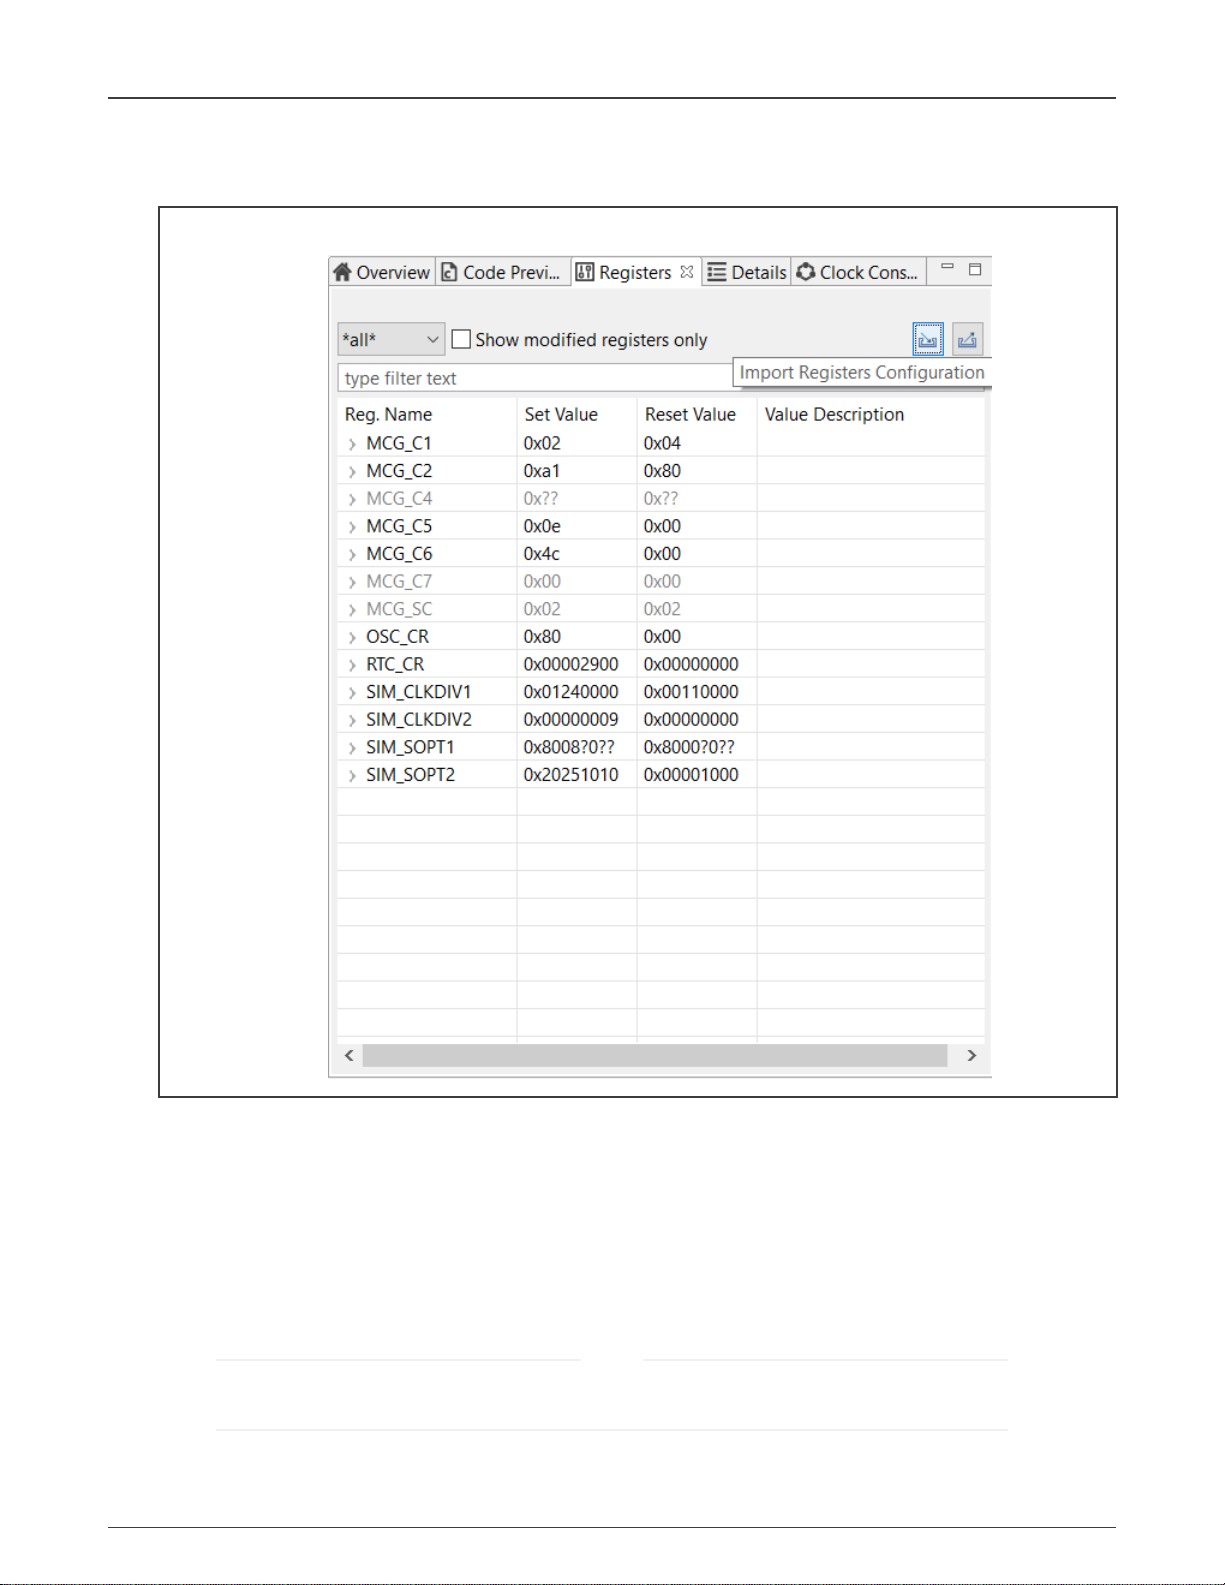
1. In the Menu bar, select File > Import…. Alternatively, click the Import Registers Configuration button in the Registers view,
or drag-and-drop the memory dump file anywhere in the Registers view area.
Figure 4. Import Registers Configuration
2. In the Import wizard, select MCUXpresso Config Tools > Import Registers.
3. Click Next.
4. On the next page, click Browse to specify the location of the registers configuration.
5. Select the registers file you wish to import, and click OK.
6. By default, the imported register configuration will overwrite the existing functional group. If you want a new functional group
to be created instead, select the Create new functional group option button, and specify the functional group name.
7. Click Finish.
NOTE
All registers are imported from the dump file regardless of their relevance to clock configuration, therefore, the list
can contain registers not needed by the Clocks tool.
MCUXpresso Config Tools User's Guide (IDE), Rev. 0, 1/2021
User's Guide 10 / 136
Page 11
NXP Semiconductors
User Interface
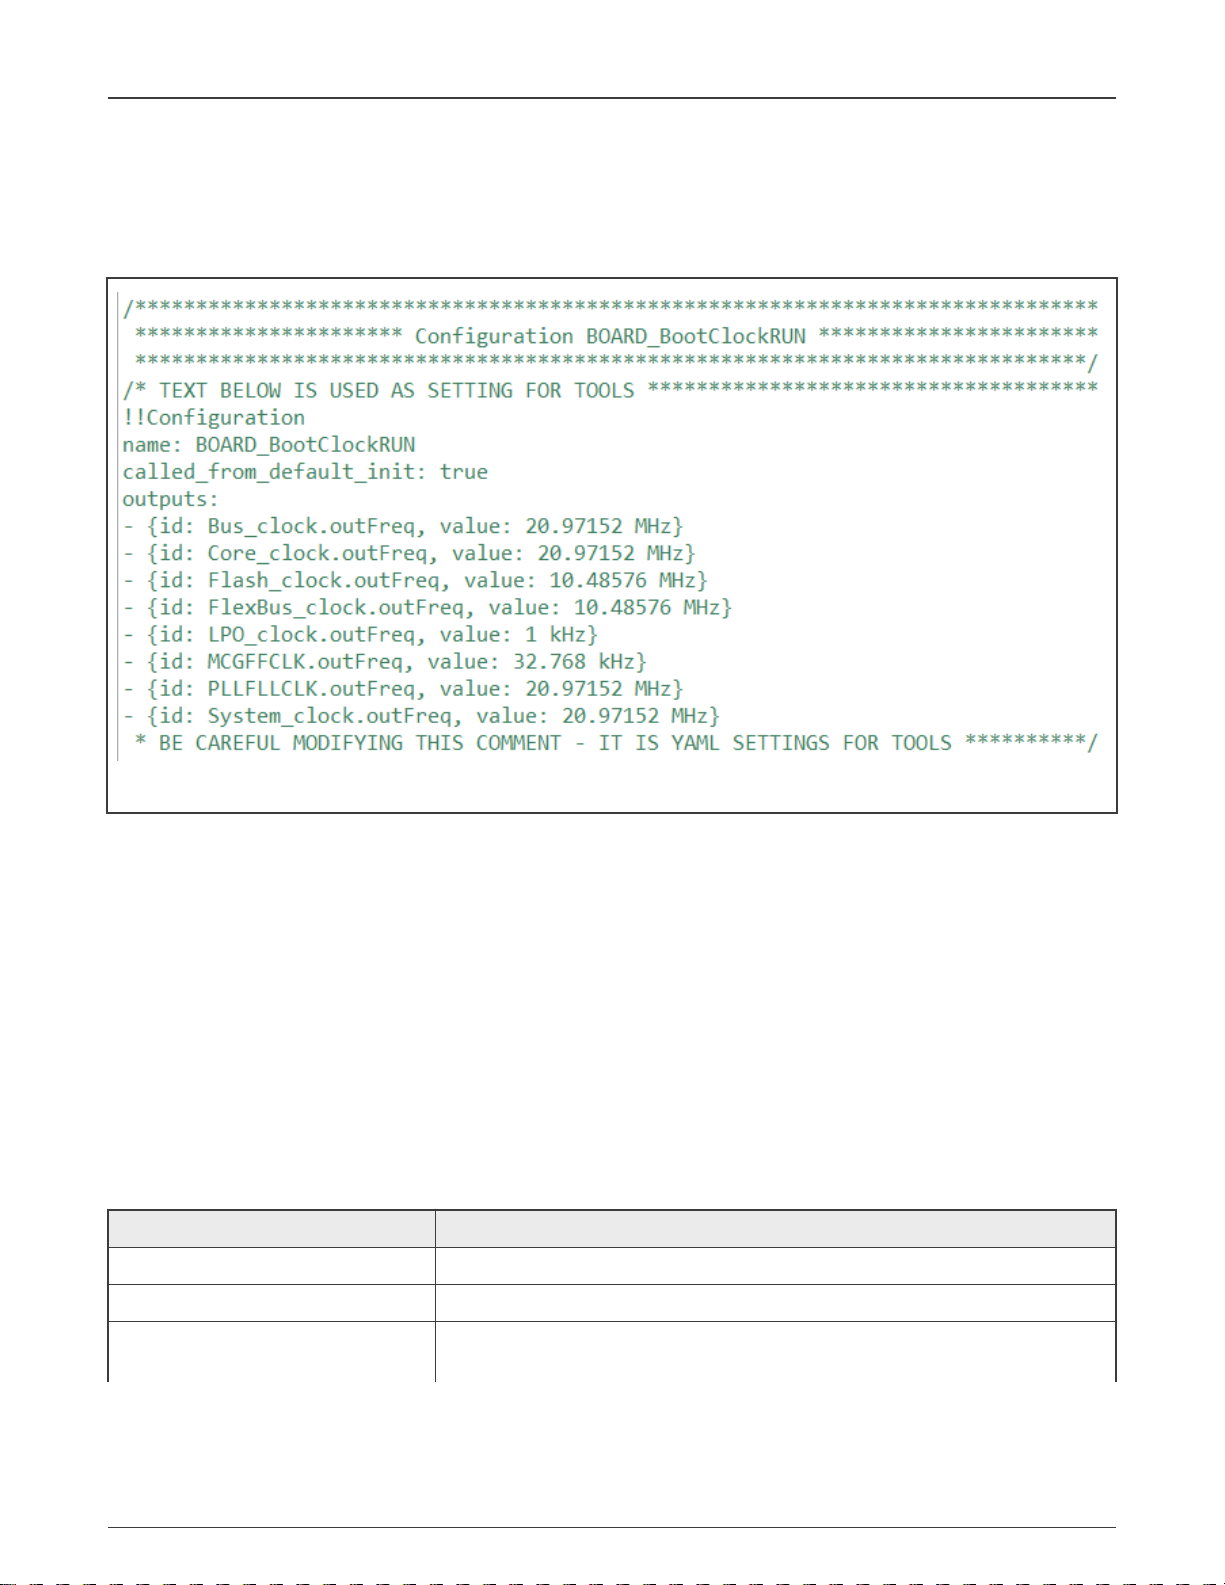
2.1.4 Restoring configuration from source code
The generated code contains information about the Clocks tool settings that are used in the tool (block within a comment in
YAML format).
The following is an example of the settings information in the generated source code.
Figure 5. Setting Information in the source code
If this information is not corrupted, it's possible to re-import the clock settings into the tool using the following steps.
1. In the Menu bar, select File > Import….
2. From the list, select MCUXpresso Config Tools > Clocks Tool > Import Source Files.
3. Click Next.
4. Click Browse.
5. Navigate and select the
6. If the settings parse successfully, clock configurations are added into the current global configuration.
clock_config.c
file previously produced by the Clocks tool.
2.2 Toolbar
The toolbar is located on the top of the window and includes buttons/menus of frequently used actions common to all tools. See
the following sections for more information.
Table 3. Toolbar
Item Description
Config Tools Overview Open the Overview dialog with information about currently-used tools.
Show Problems View Open the Problems view.
Update Code Open the update dialog allowing you to update generated peripheral initialization code
directly within specified toolchain project.
Table continues on the next page...
MCUXpresso Config Tools User's Guide (IDE), Rev. 0, 1/2021
User's Guide 11 / 136
Page 12
NXP Semiconductors
User Interface
Table 3. Toolbar (continued)
Item Description
Functional group selection Select functional group. Functional group in the Peripherals tool represents a group
of peripherals that are initialized as a group. The tool generates a C function for each
function group that contains the initialization code.
Call from default initialization Set the current functional group to be initialized by the default initialization function.
Functional group properties Open the Functional group properties dialog to modify name and other properties of
the function group.
Tool selection Display icons of individual tools. Use them to switch between tools.
Undo/Redo Undo/Redo last action.
In addition, the toolbar may contain additional items depending on the selected tool. See the chapters dedicated to individual tools
for more information.
2.2.1 Eclipse project selection
You can use the Eclipse project drop-down menu to switch between projects.
2.2.2 Config Tools Overview
Click the Config Tools Overview button to open Config Tools Overview and inspect information about the configuration, hardware,
and project. For more information, see the Config Tools Overview section.
2.2.3 Show Problems View
Click the Show Problems View to open/highlight the Problems view and inspect any errors in your configuration. See Problems
view for more information.
Button color depends on issue type. Red indicates the presence of at least one error, yellow indicates the presence of at least
one warning.
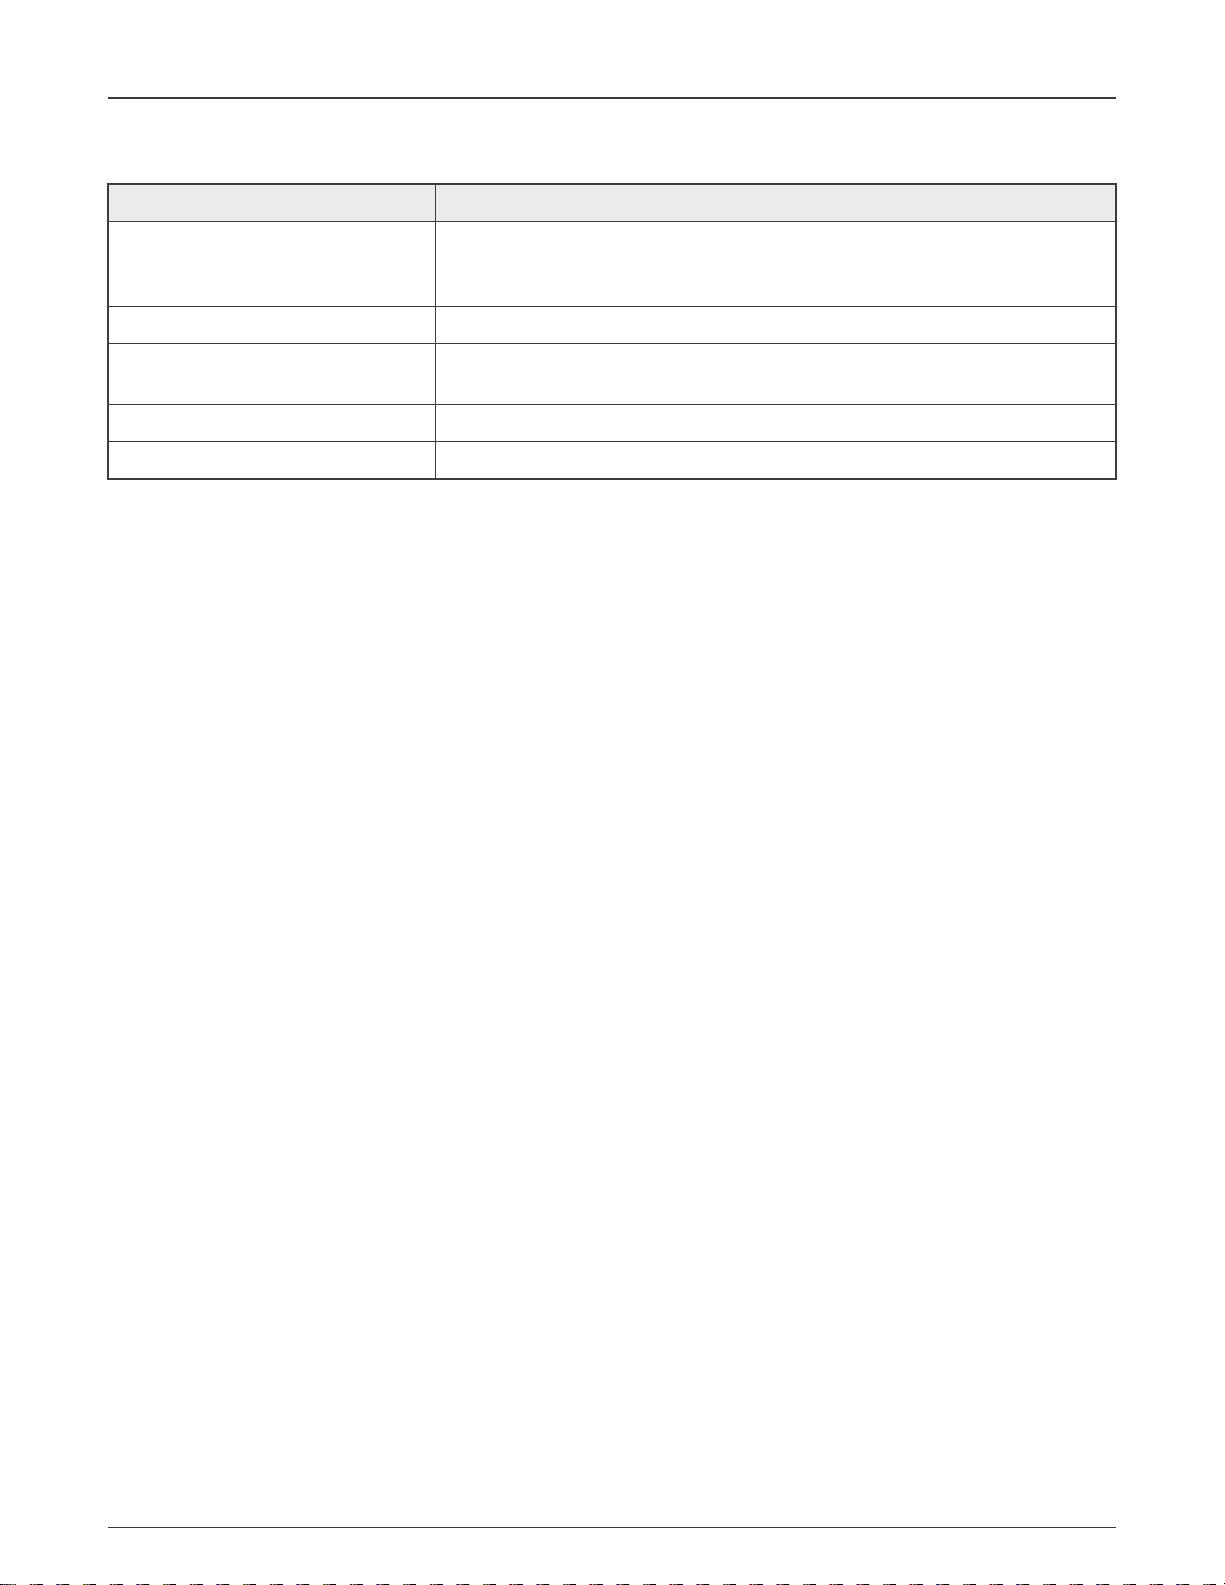
2.2.4 Update code
To update the generated code in the related toolchain project, click the Update Code button. In the window, select the tools or files
you want to update. If the file is updated automatically, the button is filled with a black square. The reason is displayed in the tooltip.
MCUXpresso Config Tools User's Guide (IDE), Rev. 0, 1/2021
User's Guide 12 / 136
Page 13
NXP Semiconductors
User Interface
Figure 6. Update Files window
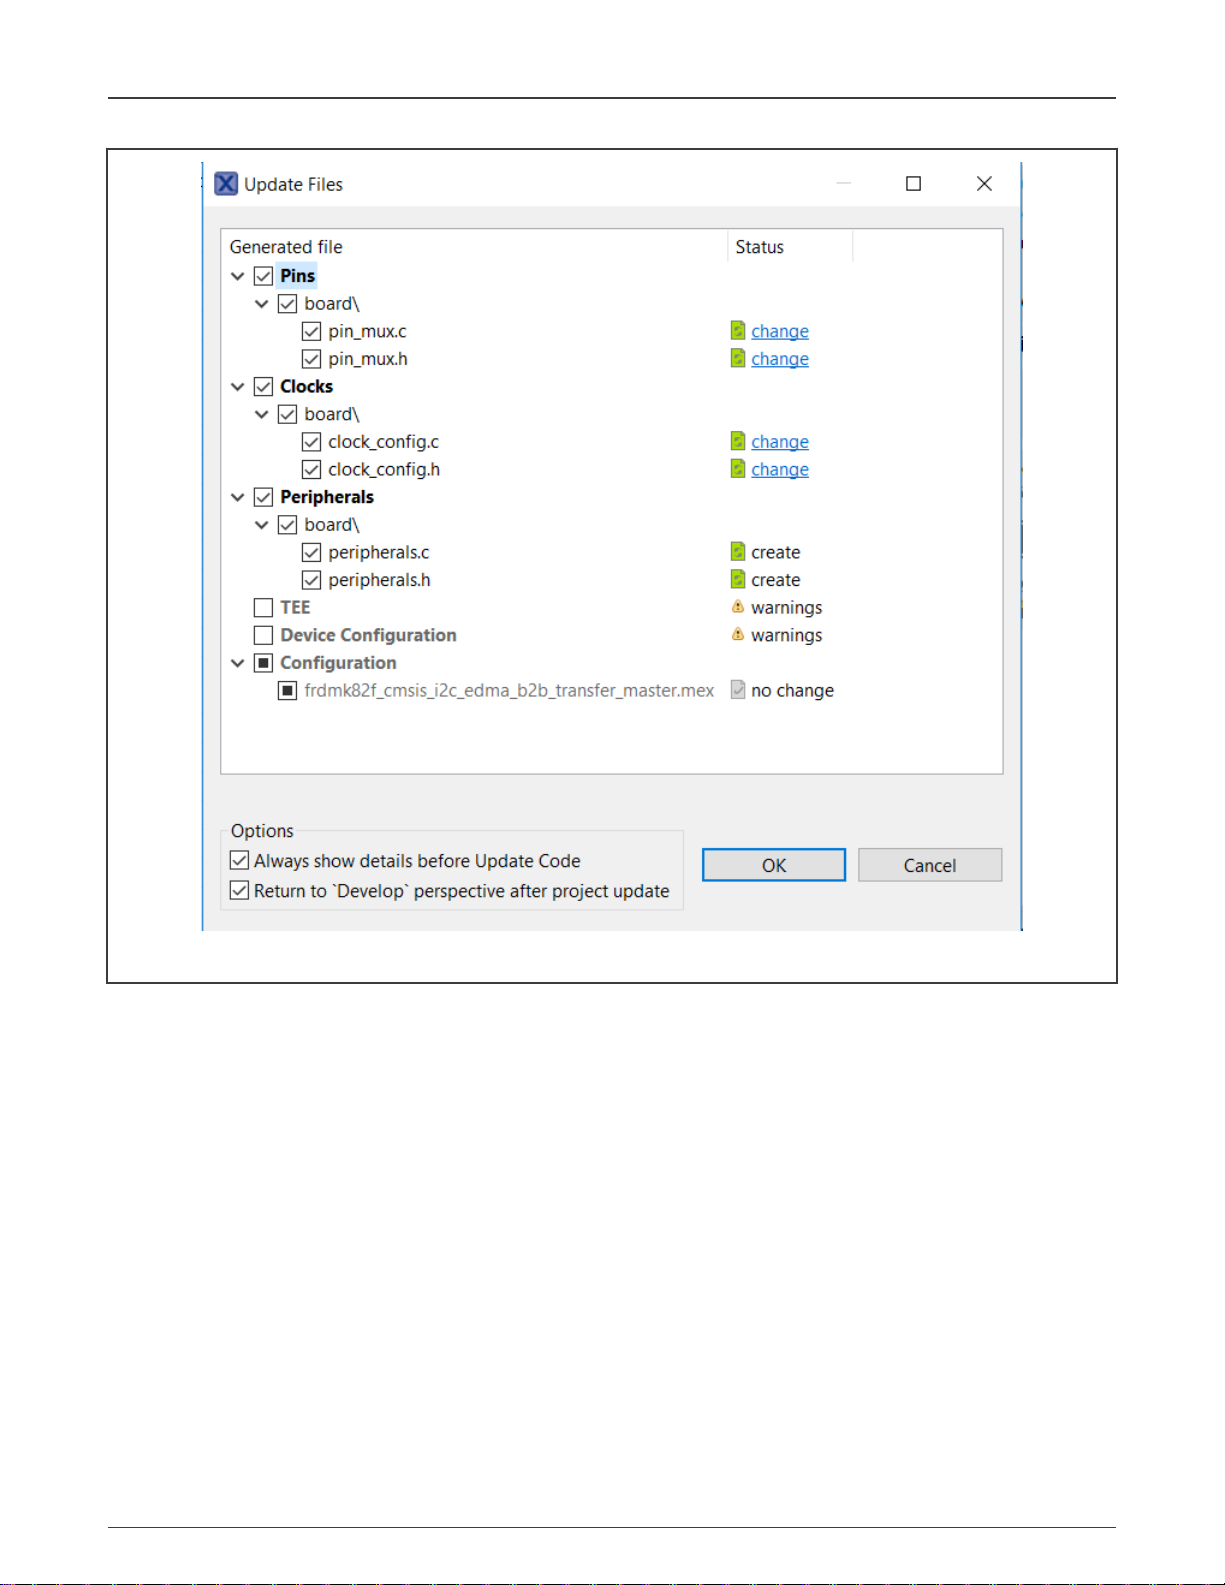
To inspect the code difference between the versions, click the change link.
MCUXpresso Config Tools User's Guide (IDE), Rev. 0, 1/2021
User's Guide 13 / 136
Page 14
NXP Semiconductors
User Interface
Figure 7. Show differences
To update the project without opening the Update Files dialog, deselect the Always show details before Update Code checkbox.
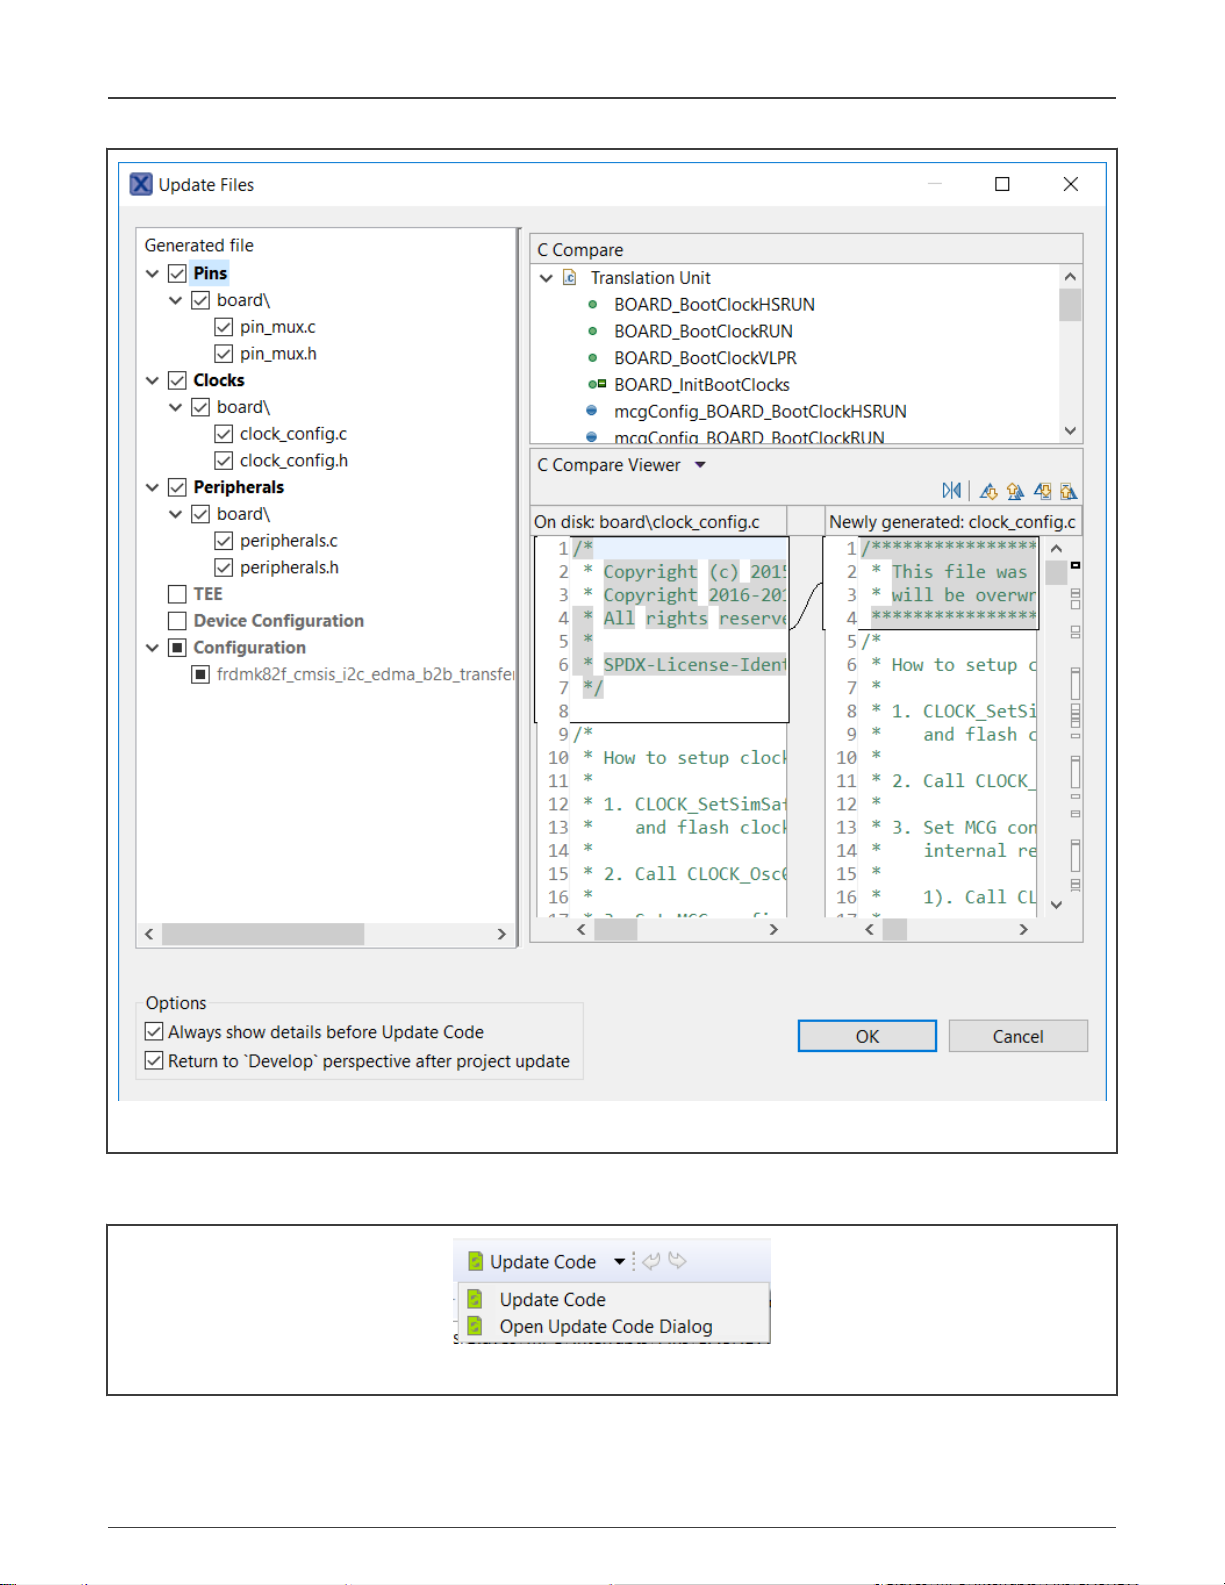
To access the Update Code dialog from the Update Code dropdown menu, select Open Update Code Dialog.
Figure 8. Update Code dropdown menu
MCUXpresso Config Tools User's Guide (IDE), Rev. 0, 1/2021
User's Guide 14 / 136
Page 15
NXP Semiconductors
User Interface
NOTE
The generated code is always overwritten.
NOTE
Previous version of the file can be retrieved from Eclipse local history.
The Update Code action is enabled under following conditions:
• If the MEX configuration is saved in a toolchain project, the processor selected in the tool matches with processor selected
in the toolchain project
• Core is selected (for multicore processors)
2.2.5 Functional groups
Every Pins/Clocks/Peripherals configuration can contain several functional groups.
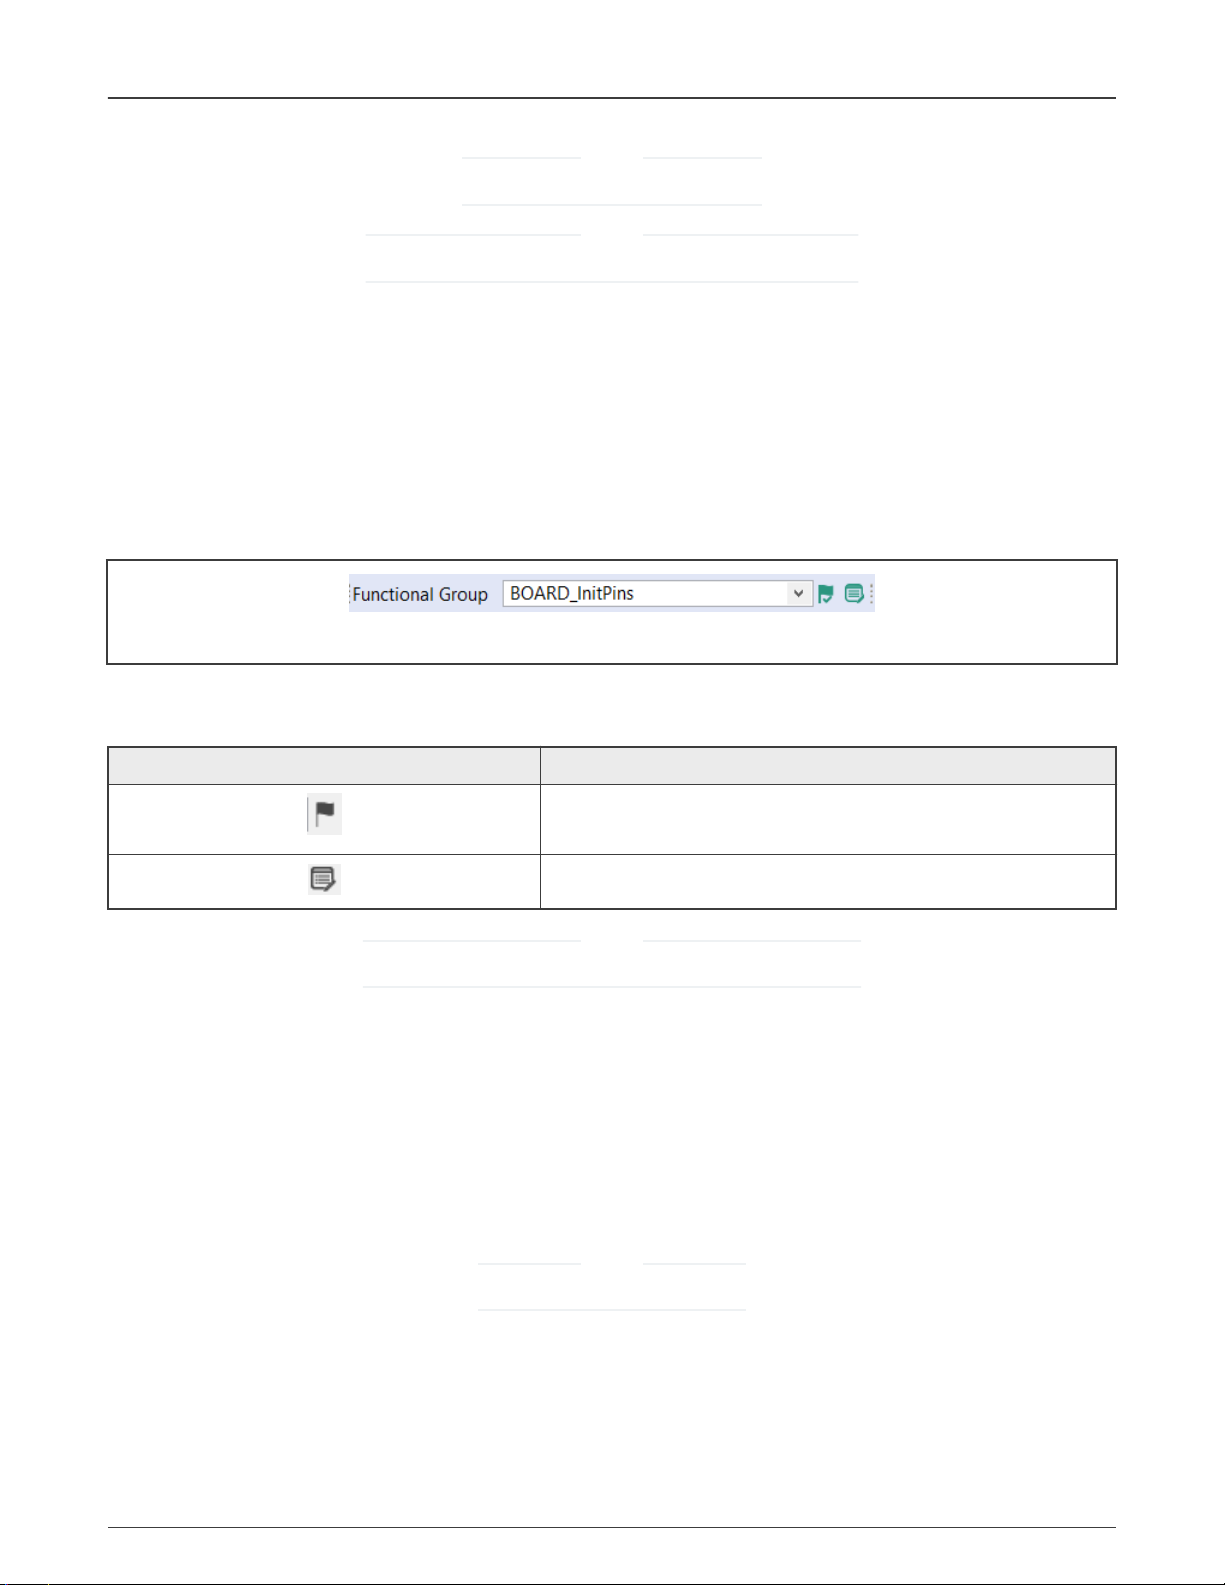
These groups represent functions which will be generated into source code. Use the dropdown menu to switch between functional
groups and configure them.
Figure 9. Functional groups
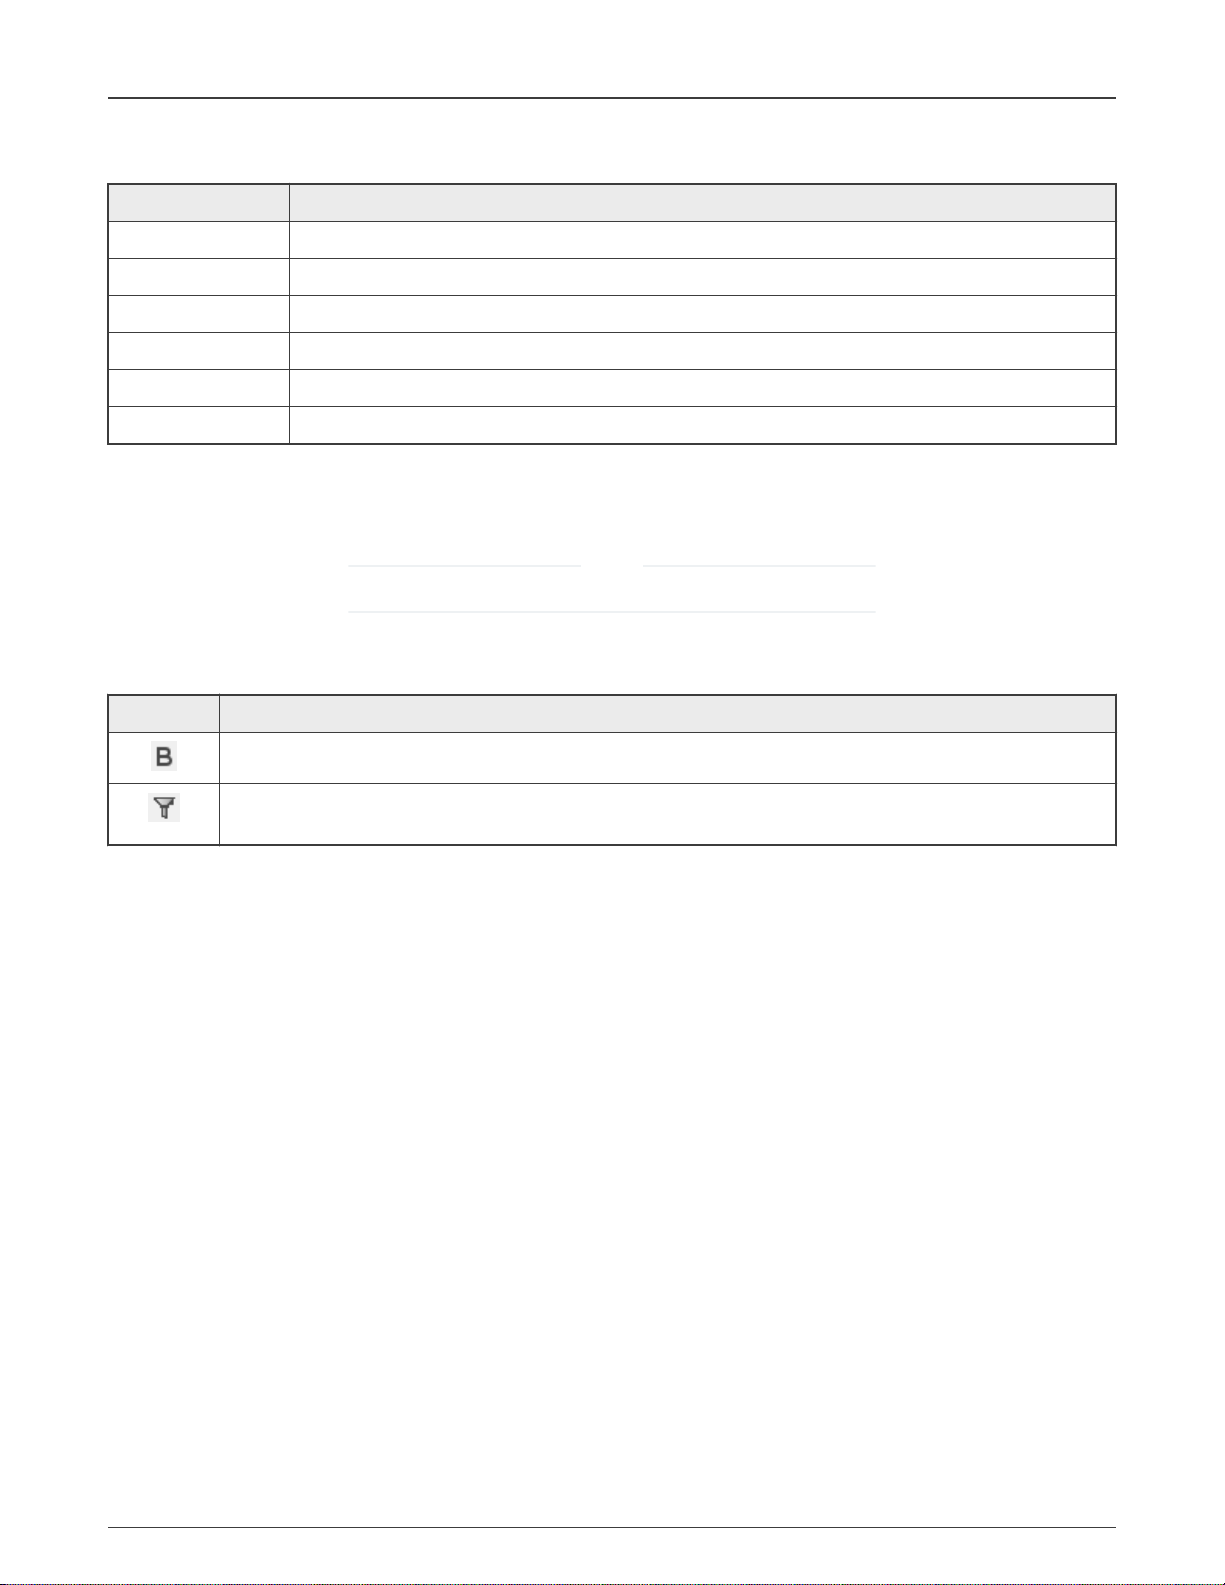
You can use two additional buttons to further configure functional groups:
Table 4. Functional Groups
Icon Description
Toggle "Called from default initialization function" feature (in
source code)
Opens the Functional group properties window
NOTE
Red/orange background indicates errors/warnings in the configuration.
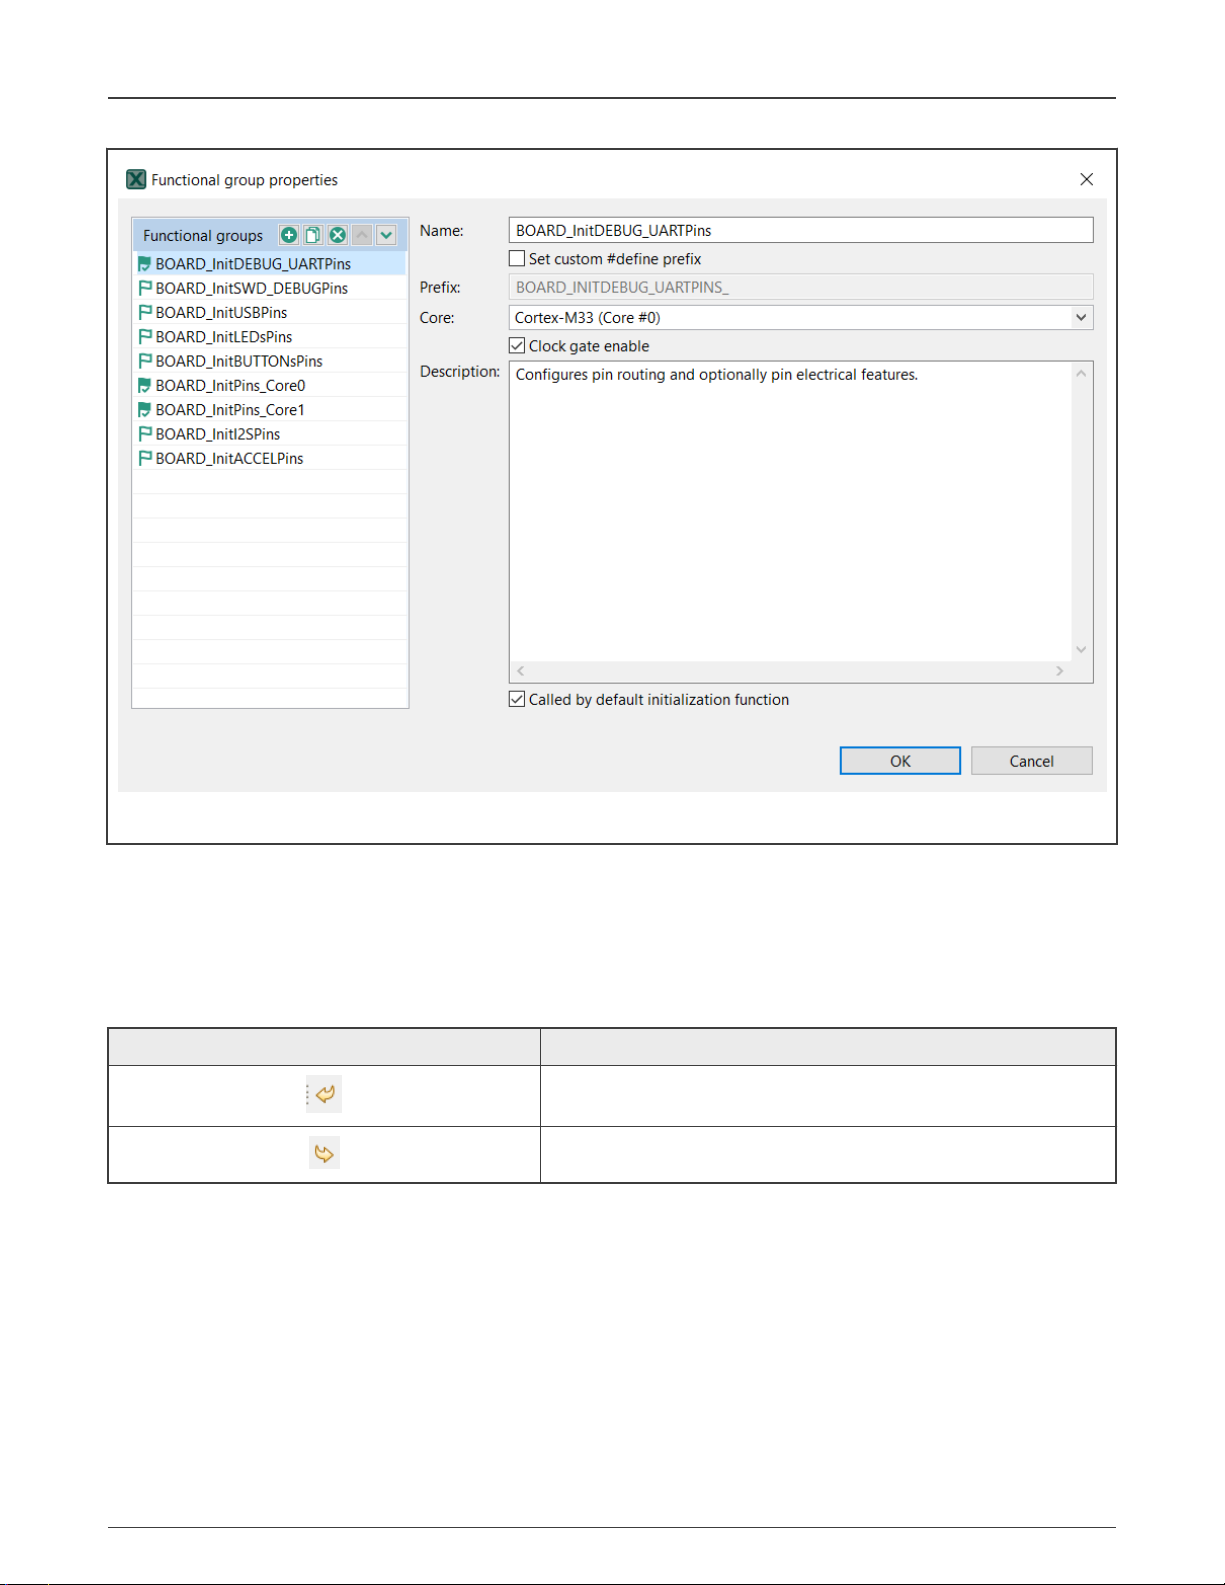
2.2.5.1 Functional group properties
In the Functional Group Properties window, you can configure several options for functions and code generation. Each settings
is applicable for the selected function. You can specify generated function name, select core (for multicore processors only) that
is affecting the generated source code, or write function description (this description will be generated in the C file). You can also
add, copy, and remove functional groups as needed.
Aside from name and description, you can choose to set the following parameters for selected functional groups:
• Set custom #define prefix - Enable to use the specified prefix for the identifiers in the source code. You can also modify
the functions order (on the left), the order is applied in the generated code.
NOTE
Not all processors support this option.
• Called from default initialization function - Enable to call the function is called from the default initialization function.
• Clock gate enable
MCUXpresso Config Tools User's Guide (IDE), Rev. 0, 1/2021
User's Guide 15 / 136
Page 16
NXP Semiconductors
User Interface
Figure 10. Functional group properties for the Pins tool
2.2.6 Undo/Redo actions
You can reverse your actions by using Undo/Redo buttons available in the Toolbar. You can also perform these actions from the
Edit menu in the Menu bar.
Table 5. Undo/reto actions
Icon Description
Cancels the previous action
Cancels the previous undo action
2.2.7 Selecting the tools
Buttons on the extreme right-hand side of the toolbar represent available tools. Click the icons to quickly navigate between .
2.3 Status bar
The status bar is visible at the bottom part of the GUI. Status bar indicates error and warning state of the currently selected
functional group.
MCUXpresso Config Tools User's Guide (IDE), Rev. 0, 1/2021
User's Guide 16 / 136
Page 17
NXP Semiconductors
User Interface
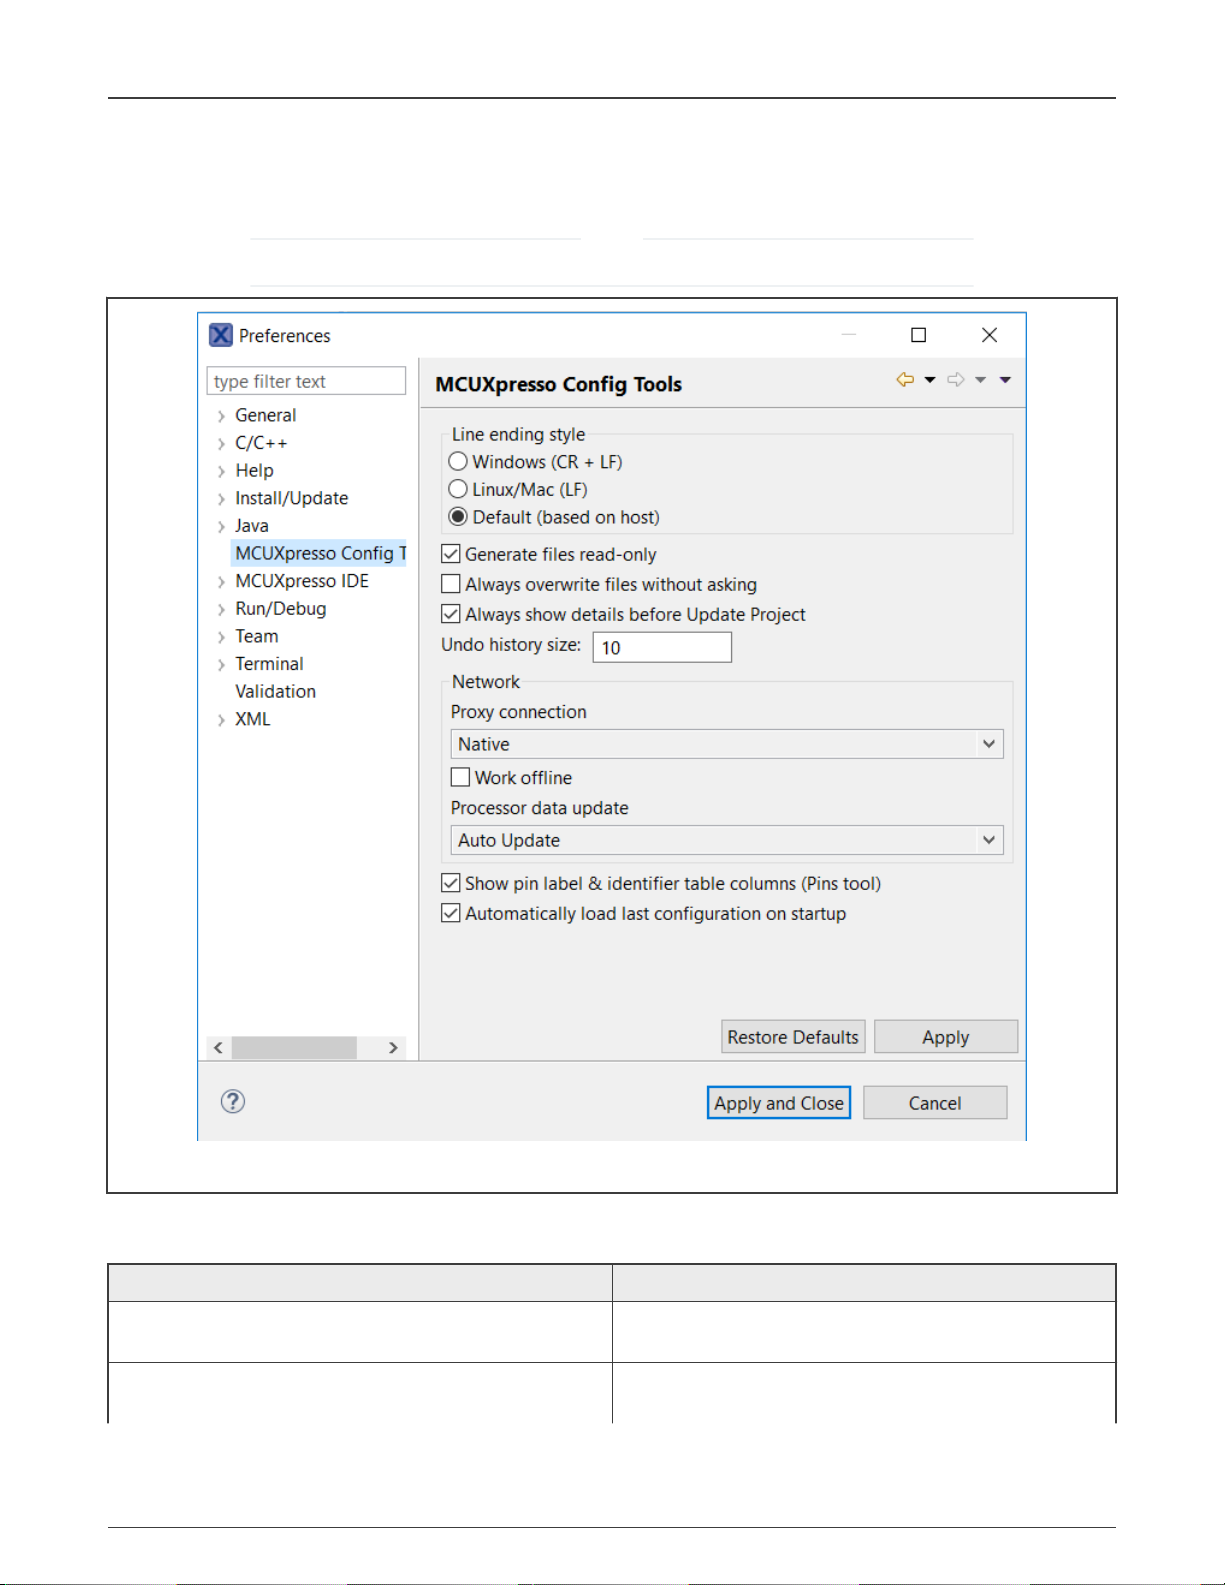
2.4 Preferences
To configure preferences in the Preferences dialog, select Window>Preferences>MCUXpresso Config Tools from the Menu bar.
NOTE
You can restore settings to default by selecting Restore Defaults in the lower right corner of the dialog.
Figure 11. Preferences
Several settings are available.
Table 6. Preferences
Item Description
Line ending style Select between Windows (CR + LF), Linux/Mac (LF), or Default
(based on host).
Generate files read-only Prevent modifying the source files unintentionally. Generated
source files are marked as read-only.
Table continues on the next page...
MCUXpresso Config Tools User's Guide (IDE), Rev. 0, 1/2021
User's Guide 17 / 136
Page 18

NXP Semiconductors
User Interface
Table 6. Preferences (continued)
Item Description
Generate source folder At build time, automatically create a folder including
source files.
Create empty configuration if no yaml is available Generates a configuration even if no yaml is present.
Always overwrite files without asking Update existing files automatically, without prompting.
Always show details before Update Code Review changes before the project is updated.
Undo history size Enter the maximum number of steps that can be undone. Enter
0 to disable.
Proxy connection
• Direct – Connect directly and avoid a proxy connection.
• Native – Use system proxy configuration for
network connection.
NOTE
The proxy settings are copied from operating
system settings. In case of error, you can specify
proxy information in the tools.ini file, located in the
<install_dir>/bin/ folder. Make sure the file contains
the following lines:
— Djava.net.useSystemProxies=true (already
present by default)
— Dhttp.proxyHost=<somecompany.proxy.net>
— Dhttp.proxyPort=80
NOTE
Authentication is
not supported.
Work Offline Disable both the connection to NXP cloud and the download of
processor/board/kit data.
Processor data update Select from the following options:
• Auto Update – Update the processor data automatically.
• Manual – Update processor data after confirmation.
• Disabled – Disable processor data update.
Show pin label & identifier table columns (Pins tool) Select to show the pin label and the label identifier in the
relevant views.
Show Overview window on opening configuration for the
first time
Open the Overview dialog on opening configuration for the
first time.
Automatically load last configuration on startup Avoid the startup window and load the last used
configuration instead.
2.5 Configuration preferences
In the Configuration preferences window, you can set your preferences for to the configuration storage file (MEX).
MCUXpresso Config Tools User's Guide (IDE), Rev. 0, 1/2021
User's Guide 18 / 136
Page 19
NXP Semiconductors
User Interface
To configure the preferences related to the configuration, uses popup menu on the Eclipse project, select Properties and then
MCUXpresso Config Tools in the left pane.
Figure 12. Configuration Preferences
Several preferences are available.
•
Table 7. Configuration Preferences
Item Description
Validate boot init only Validate tools' dependencies only against ‘boot init’ function
group.When selected, dependencies from all functional groups
of all tools must be satisfied in the functional groups marked for
default initialization. Clearing this option hides warnings in case
the user is using complex scenarios with alternating functional
groups within the application code.
Generate YAML Generate YAML into C sources files.
Generate extended information into header file Generate extended information into the header file. For
projects created in earlier MCUXpresso versions, this option is
selected by default.
Custom source file copyright header Add a custom copyright header to generated source files that
don't already contain copyright.
Generate code only for registers that are different from the
after-reset state
Generate code only for registers that are different from the
after-reset state. For projects created in earlier MCUXpresso
versions, this option is selected by default.
WARNING
When the source does not contain YAML code, it can't be imported.
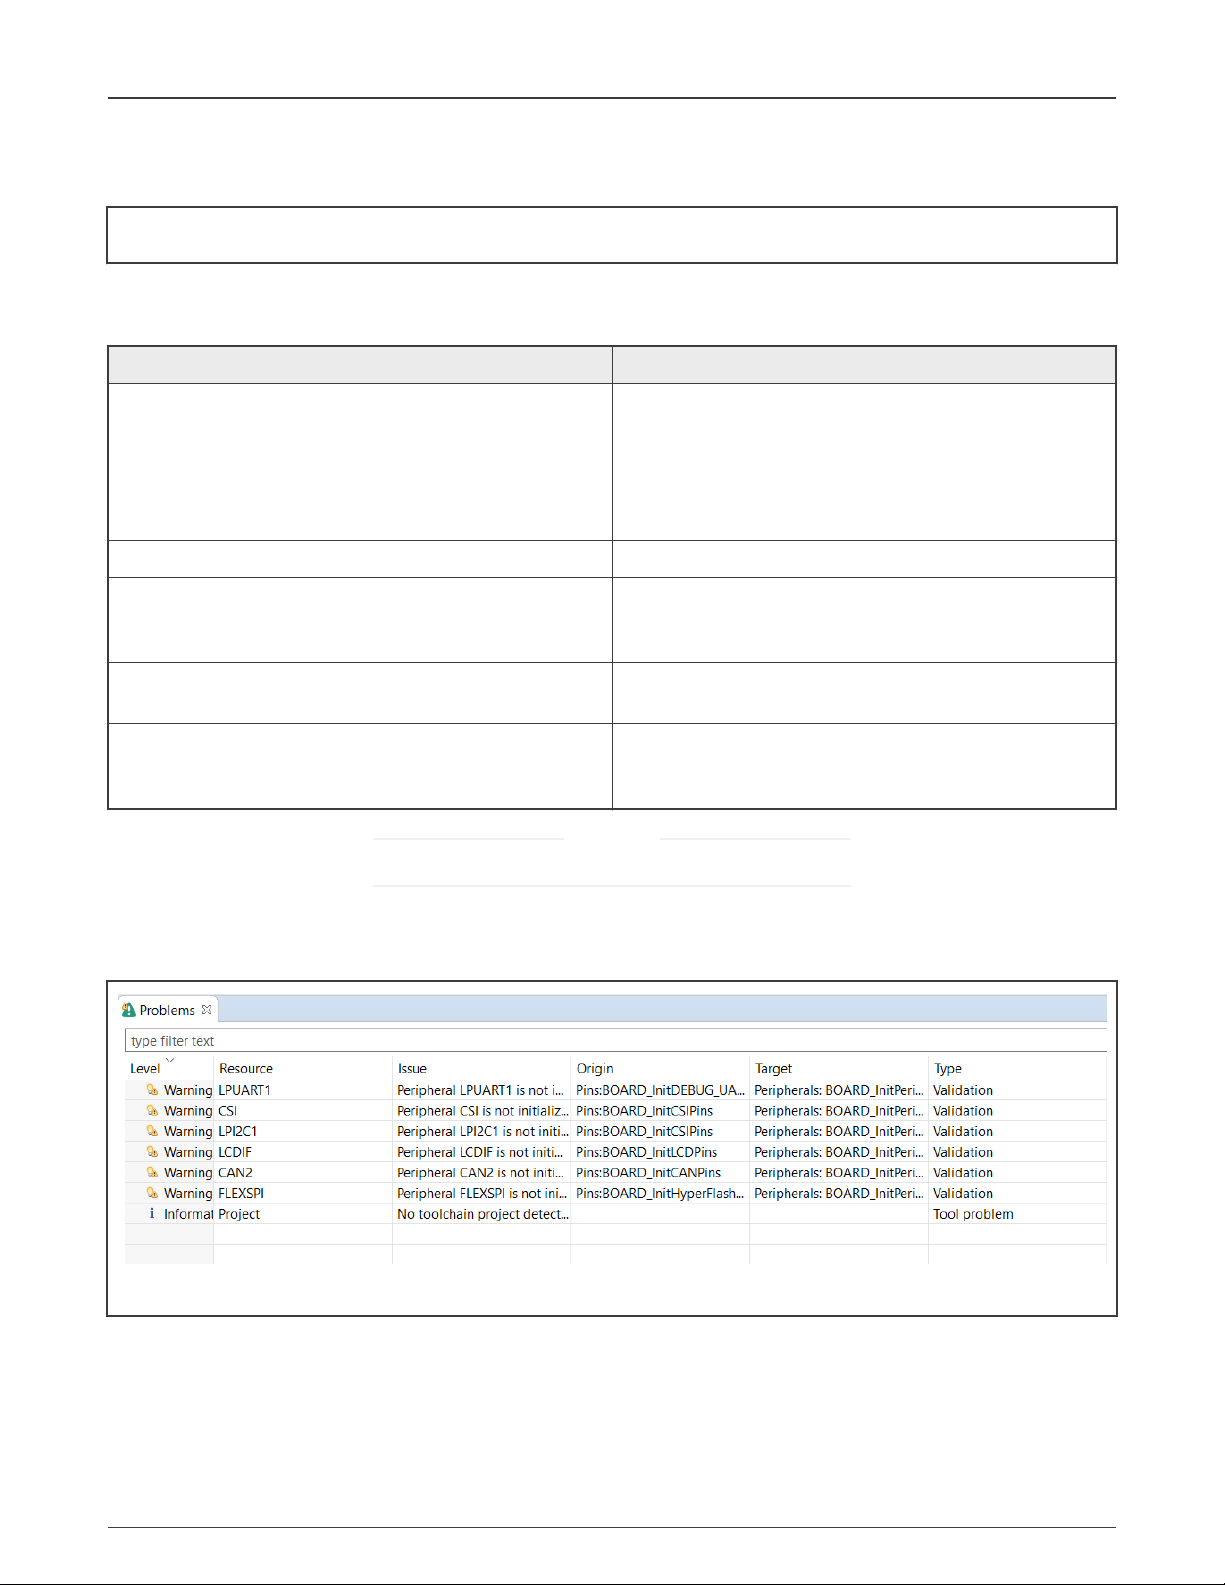
2.6 Problems view
The Problems view displays issues in individual tools and in the inter-dependencies between the tools.
Figure 13. Problems view
To open the Problems view, click the Show Problems view button in the Toolbar, or select Views > Problems from the Menu bar.
The Problems table contains the following information:
MCUXpresso Config Tools User's Guide (IDE), Rev. 0, 1/2021
User's Guide 19 / 136
Page 20
NXP Semiconductors
User Interface
Table 8. Problems view
Item Description
Level Severity of the problem: Information, Warning, or Error.
Resource Resource related to the problem, such as signal name, the clock signal, and so on.
Issue Description of the problem.
Origin Information on the dependency source.
Target Tool that handles the dependency and its resolution.
Type Type of the problem. It's either the validation checking dependencies between tools, or a single tool issue.
Every issue comes with a context menu accessible by right-clicking the table row. Use this menu to access information about the
problem or to apply a quick fix where applicable. You can also copy the rows for later use by right-clicking the row and selecting
Copy or by using the Ctrl+C shortcut. You can use the Ctrl+left-click shortcut to add additional rows to the selection.
NOTE
Quick fix is only available for problems highlighted with the "lightbulb" icon.
Filter buttons are available on the right side of the Problems view ribbon.
Table 9. Filter buttons
Button Description
Enables the Validate boot init only preference. See Configuration preferences section for details.
Filters messages in the Problems view. If selected, only problems for the active tool are displayed. See
Configuration preferences section for details.
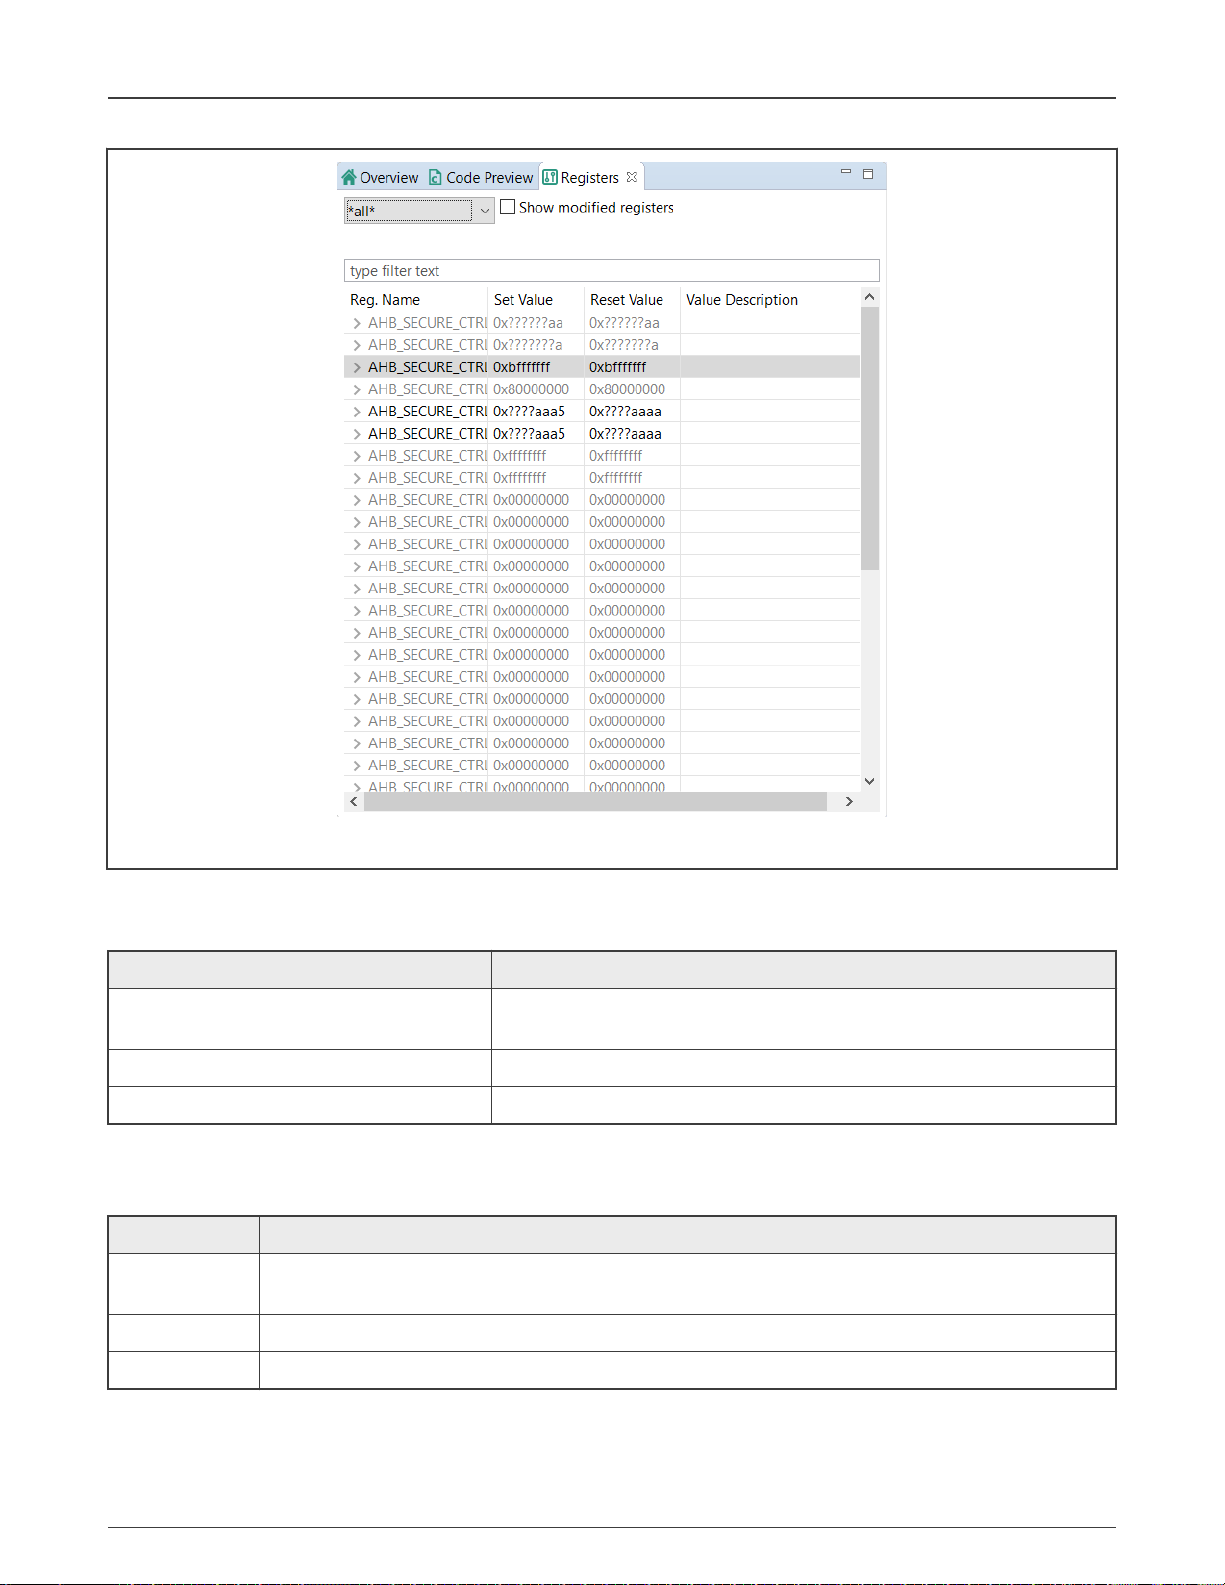
2.7 Registers view
The Registers view lists the registers handled by the tool models. You can see the state of the processor registers that correspond
to the current configuration settings and also the state that is in the registers by default after the reset. The values of the registers
are displayed in the hexadecimal and binary form. If the value of the register (or bit) is not defined, an interrogation mark "?" is
displayed instead of the value.
MCUXpresso Config Tools User's Guide (IDE), Rev. 0, 1/2021
User's Guide 20 / 136
Page 21
NXP Semiconductors
User Interface
Figure 14. Registers view
The Registers view contains several items.
Table 10. Registers
Item Description
Peripheral filter drop-down list List the registers only for the selected peripheral. Select all to list registers for
all the peripherals.
Show modified registers only chekbox Hide the registers that are left in their after-reset state or are not configured.
Text filter Filter content by text.
The following table lists the color highlighting styles used in the Registers view.
Table 11. Color codes
Color Description
Yellow
Indicates that the bit-field has been affected by the last change made in the tool.
background
Gray text color Indicates the bit-field is not edited and the value is the after-reset value.
Black text Indicates the bit-fields that the tool modifies.
MCUXpresso Config Tools User's Guide (IDE), Rev. 0, 1/2021
User's Guide 21 / 136
Page 22
NXP Semiconductors
User Interface
NOTE
This view contains registers for the seleted tool. The view uses registers as internal parameters but it might not
handle all the register writes needed in the code. The register writes are done inside the SDK functions that are
called by the generated code. There might be additional registers accessed in the SDK code during the setup
process, and such register writes are not known to the tool and are not displayed in the registers view.
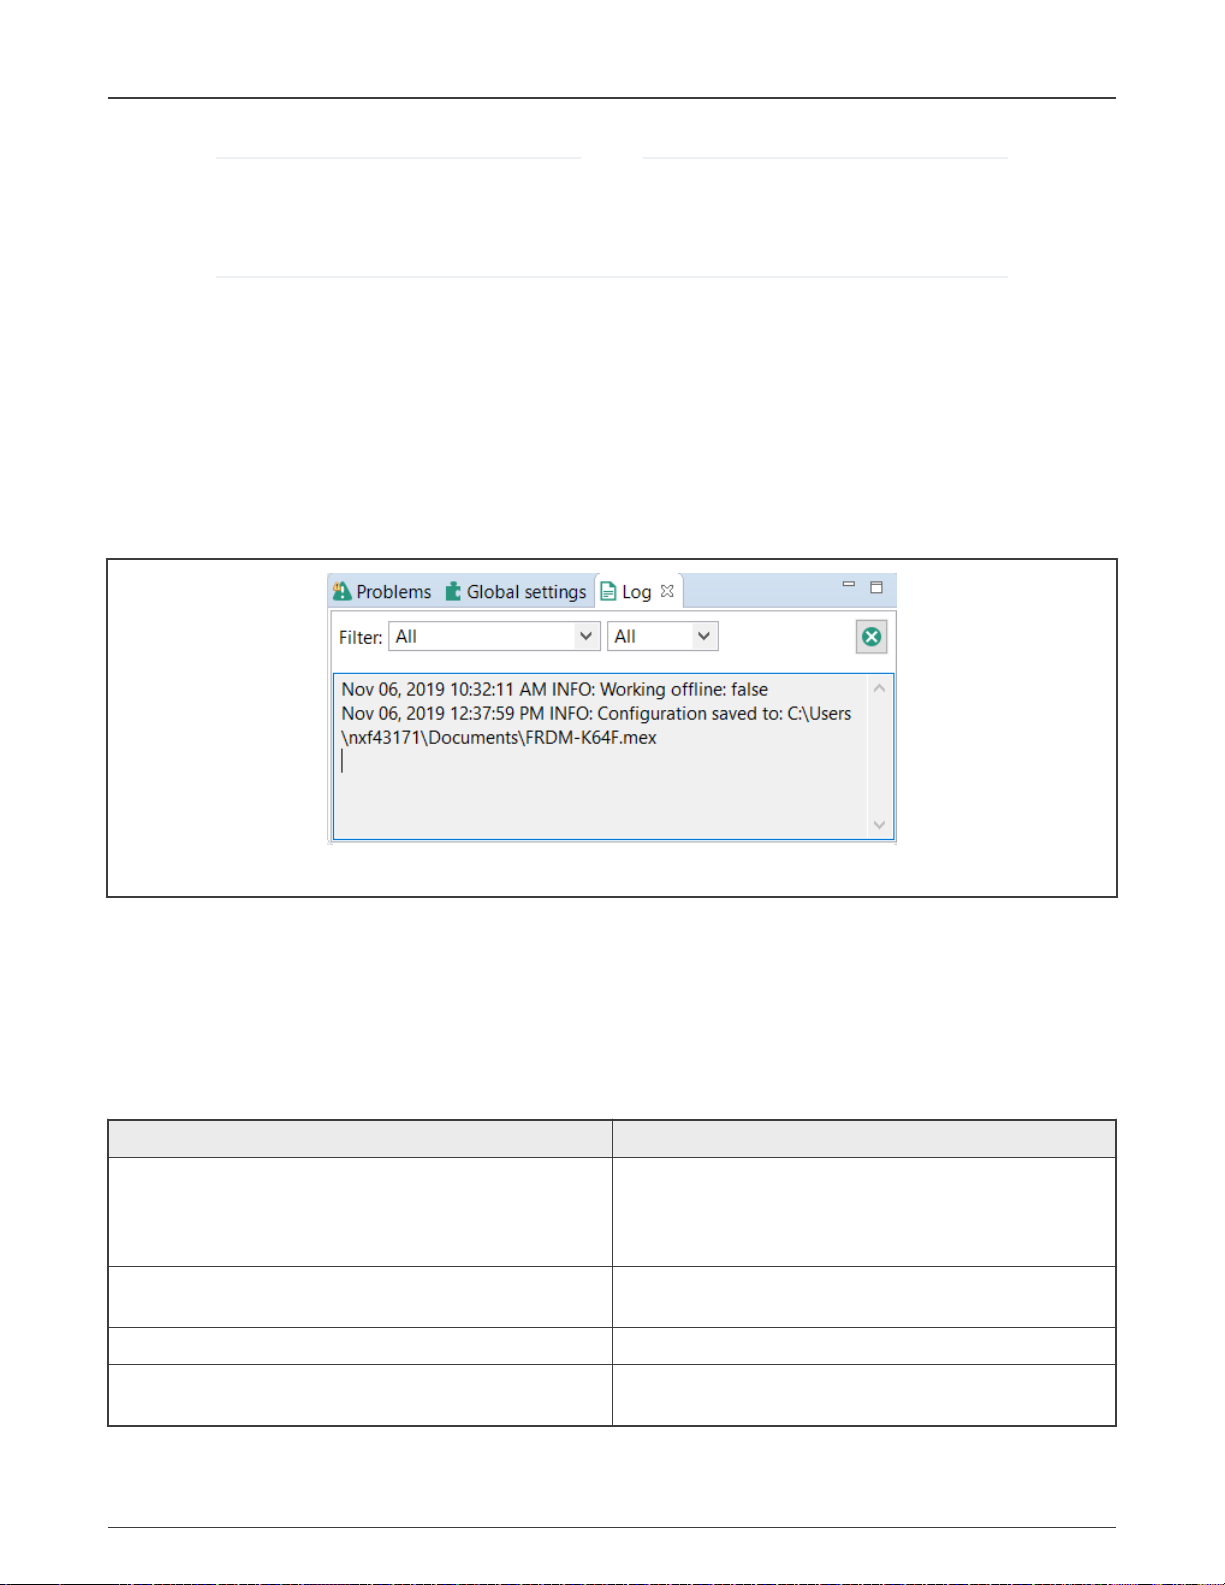
2.8 Log view
The Log view shows user-specific information about MCUXpresso Config Tools operations. The Log view can show up to 100
records across all tools in chronological order.
Each log entry consists of a timestamp, the name of the tool responsible for the entry, severity level, and the actual message. If
no tool name is specified, the entry was triggered by shared functionality.
You can filter the content of the Log view using the combo boxes to display only specific tool and/or severity level information.
Filters in different tools can be set independently.
Buffered log records are cleared using the clear button. This affects Log views across all tools.
Figure 15. Log view
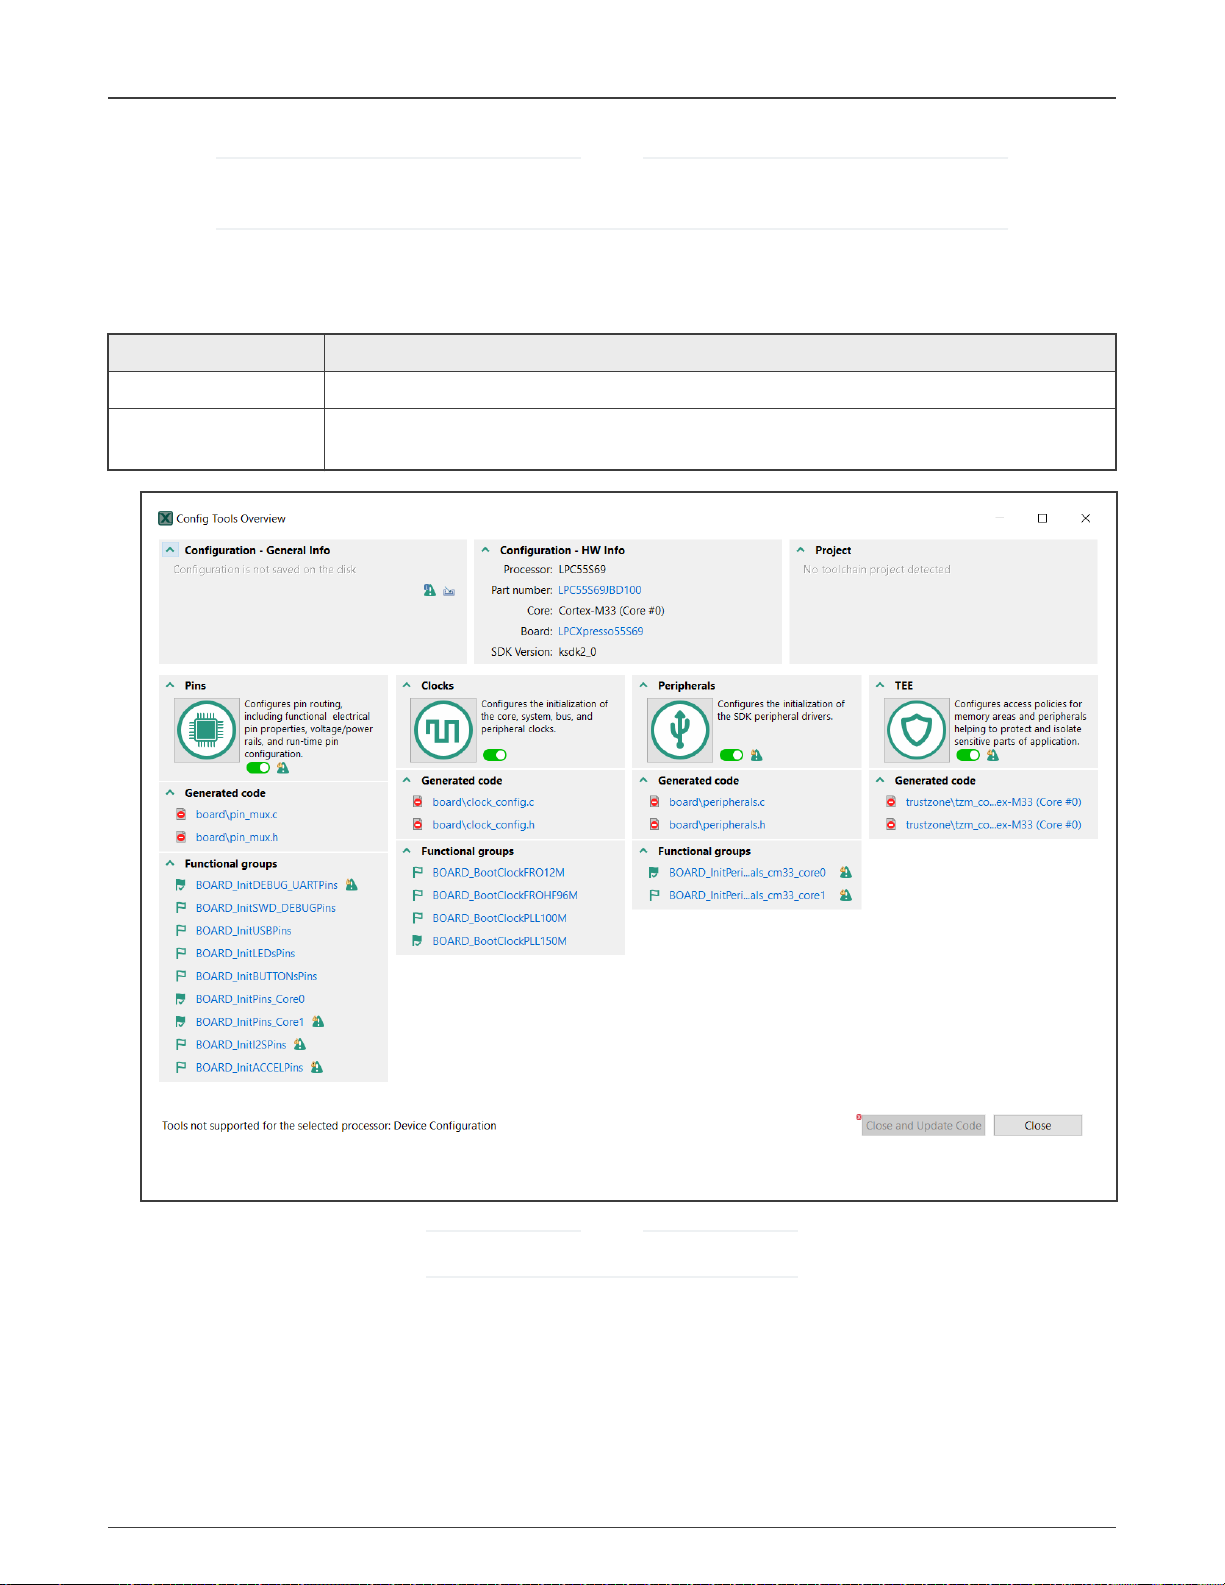
2.9 Config tools overview
The Config Tools Overview provides you with general information about your currently active configuration, hardware, and project.
It also provides a quick overview of the used/active and unused/inactive tools, generated code, and functional groups. By default,
the Config Tools Overview icon is located on the left side of the toolbar.
Config Tools Overview contains several items.
Table 12. Config Tools Overview
Item Description
Configuration – General Info Displays the name of and the path to the MEX file of the current
configuration. Click the link to open the folder containing
the MEX file. To import additional settings, click the Import
additional settings into current configuration button.
Configuration – HW Info Displays the processor, part number, core, and SDK-version
information of the current configuration.
Project Displays toolchain project information.
Pins/Clocks/Peripherals/TEE/Device Configuration Displays basic information about the Pins, Clocks, Peripherals,
TEE and Device Configuration tools.
MCUXpresso Config Tools User's Guide (IDE), Rev. 0, 1/2021
User's Guide 22 / 136
Page 23
NXP Semiconductors
User Interface
NOTE
If you have disabled a tool and want to reopen it, click the tool icon in the upper right corner or select it from the
Main Menu. The Config Tools Overview opens automatically.
To enable/disable the tools, click the toggle button. You can navigate to the tools by clicking their icons. Following information
about the tools is also available:
Table 13. Config Tools Overview
Item Description
Generated code Contains the list of source-code files. Click the links to open the files in the Code Preview view.
Functional groups Contains the list of the currently active functional groups. To select the groups in the Functional
groups tab in the toolbar, select the relevant links.
•
Figure 16. Config Tools Overview
NOTE
Unsupported tools are not displayed in the overview.
MCUXpresso Config Tools User's Guide (IDE), Rev. 0, 1/2021
User's Guide 23 / 136
Page 24
NXP Semiconductors
Chapter 3
Pins Tool
Pins tool is an easy-to-use tool for configuration of device pins. The Pins tool software helps create, inspect, change, and modify
any element of pin configuration and device muxing.
Figure 17. Pins tool
3.1 Pins routing principle
The Pins tool is designed to configure routing peripheral signals either to pins or to internal signals.
Internal signal is an interconnection node which peripheral signals can be connected to (without any pin interaction). Connecting
two peripheral signals to internal signal makes an interconnection of these two peripheral signals.
This routing configuration can be done in the following views:
• Pins
• Peripheral Signals
• Package
• Routing Details
Following two sections describe the two methods you can use to define the routing path.
3.1.1 Beginning with peripheral selection
You can select the peripheral in the Routing Details view and the Peripheral Signals view.
1. Select the Peripheral.
2. In Routing Details view, select one of the available Signals or expand the peripheral in Peripheral Signals view.
3. Selected the desired pin/internal signal.
MCUXpresso Config Tools User's Guide (IDE), Rev. 0, 1/2021
User's Guide 24 / 136
Page 25

NXP Semiconductors
Items (pins/internal signals) in the Routed pin/signal column in the Routing Details view have following decorators:
• Exclamation mark and default text color indicates that such item selection causes a register conflict or the item cannot
be routed to the selected peripheral signal (some other peripheral signal can be).
• Exclamation mark and gray text color indicates that the item cannot be routed to any signal of the selected peripheral.
The item is available for different peripheral using the same signal.
NOTE
Route to field in Routing details view contains items that are connectable to the selected signal (without its
channel if applicable). So when selected signal is “GPIO, 6” then the Routed pin/signal provides items connectable
to “GPIO”.
3.1.2 Beginning with pin/internal signal selection
You can select a pin or an internal signal in the Routing Details view.
1. Select the pin/internal signal (Routed pin/signal).
2. Select one of the available Peripherals. In the Pins view, see all available peripherals/signals by selecting the checkbox in
the first column or scroll down to the required peripheral type.
3. For the selected peripheral, select one of the available Signals.
Pins Tool
Items in Peripheral column in Routing Details view have the following symbols:
• Exclamation mark and default text color indicates that such item selection can cause a register conflict or the item does
not support selected signal.
• Exclamation mark and gray text color indicates that the item cannot be routed to the selected pin/internal signal. The
item is available for different pin/internal signal using the same signal.
NOTE
In the Pins view and the Package view you can configure only pins and not internal signals.
3.1.3 Routing of peripheral signals
Peripheral signals representing on-chip peripheral input or output can be connected to other on-chip peripherals or to a pin through
an inter-peripheral crossbar. You can configure this connection in the Routing Details view.
Three types of peripheral signal routing are available:
1. Routing the signal from the output of an internal peripheral (A) into the input of another internal peripheral (B)
The signal leads from the output of one internal peripheral (A) to the input node of another internal peripheral (B). In other
words, signal leads from A to B (A > B). To configure a signal in this way, perform the following steps (PWM triggering ADC
(PWM > ADC) used as example):
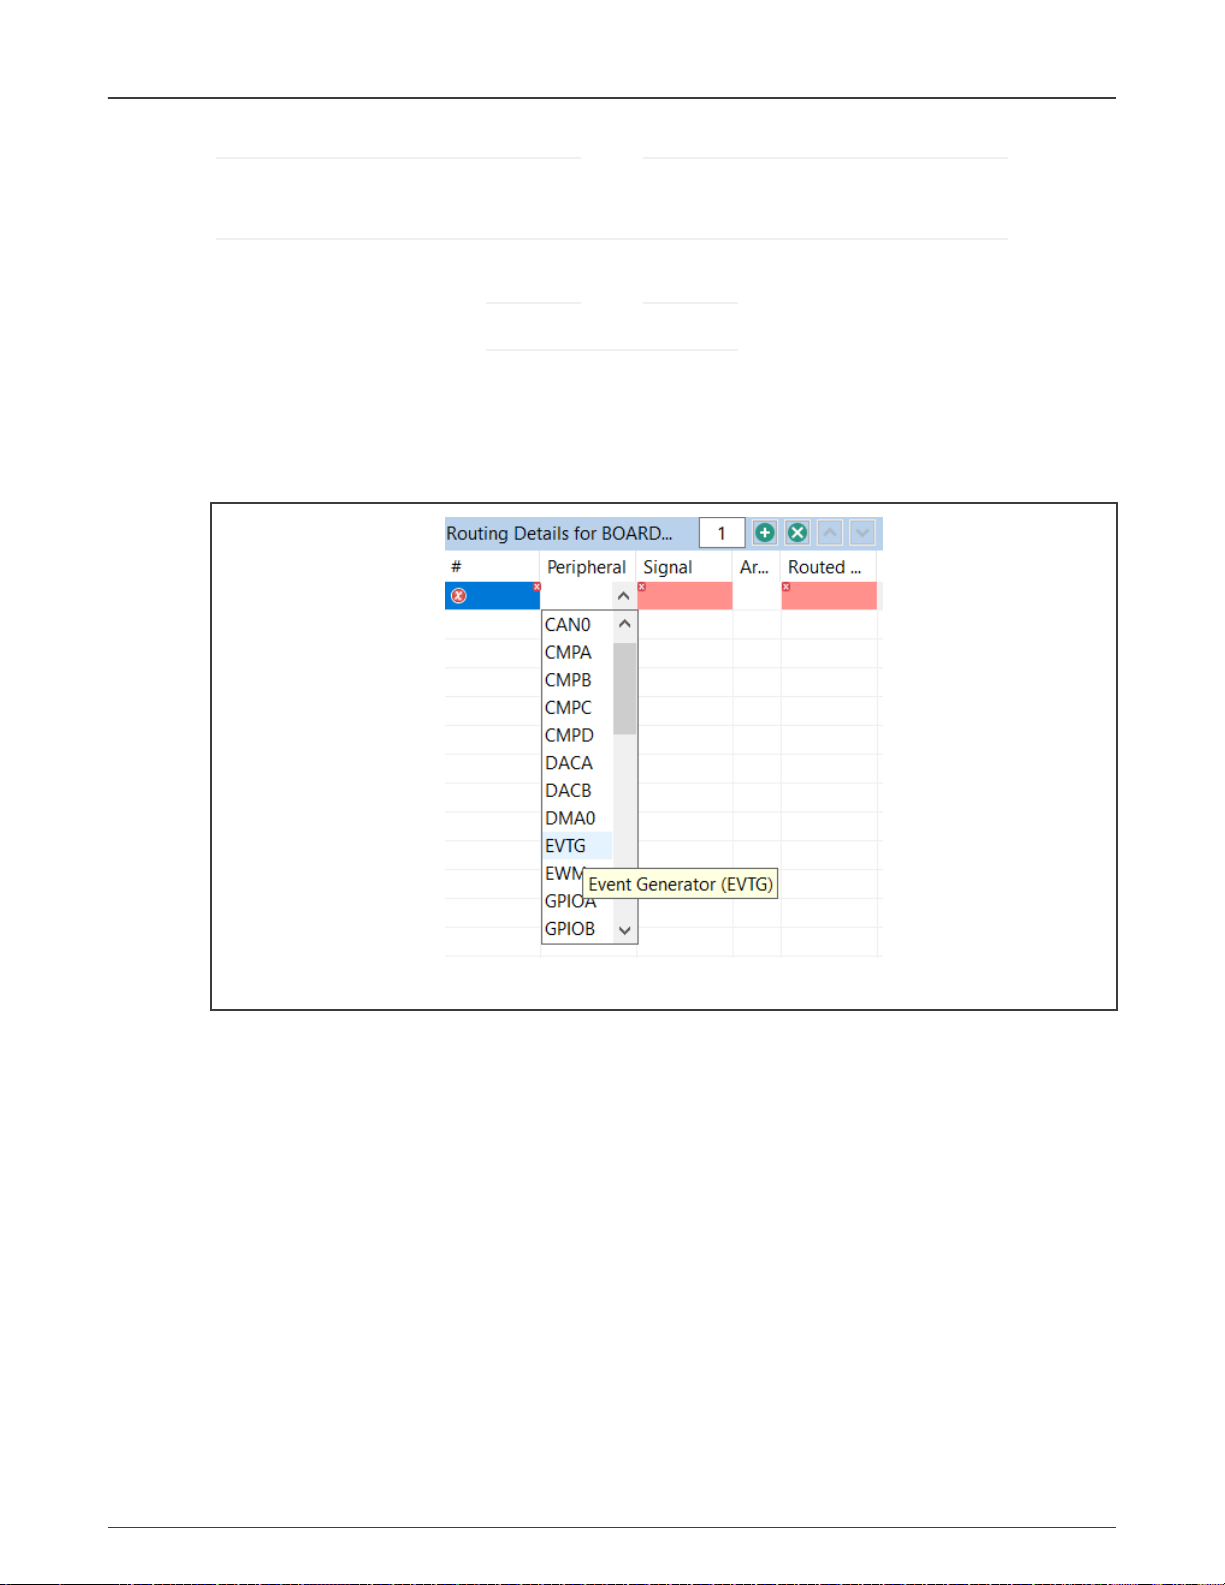
a. Add a new row in the Routing Details view.
b. Select peripheral B from the drop-down list in the Peripheral column.
MCUXpresso Config Tools User's Guide (IDE), Rev. 0, 1/2021
User's Guide 25 / 136
Page 26

NXP Semiconductors
Figure 18. Selecting the peripheral (B)
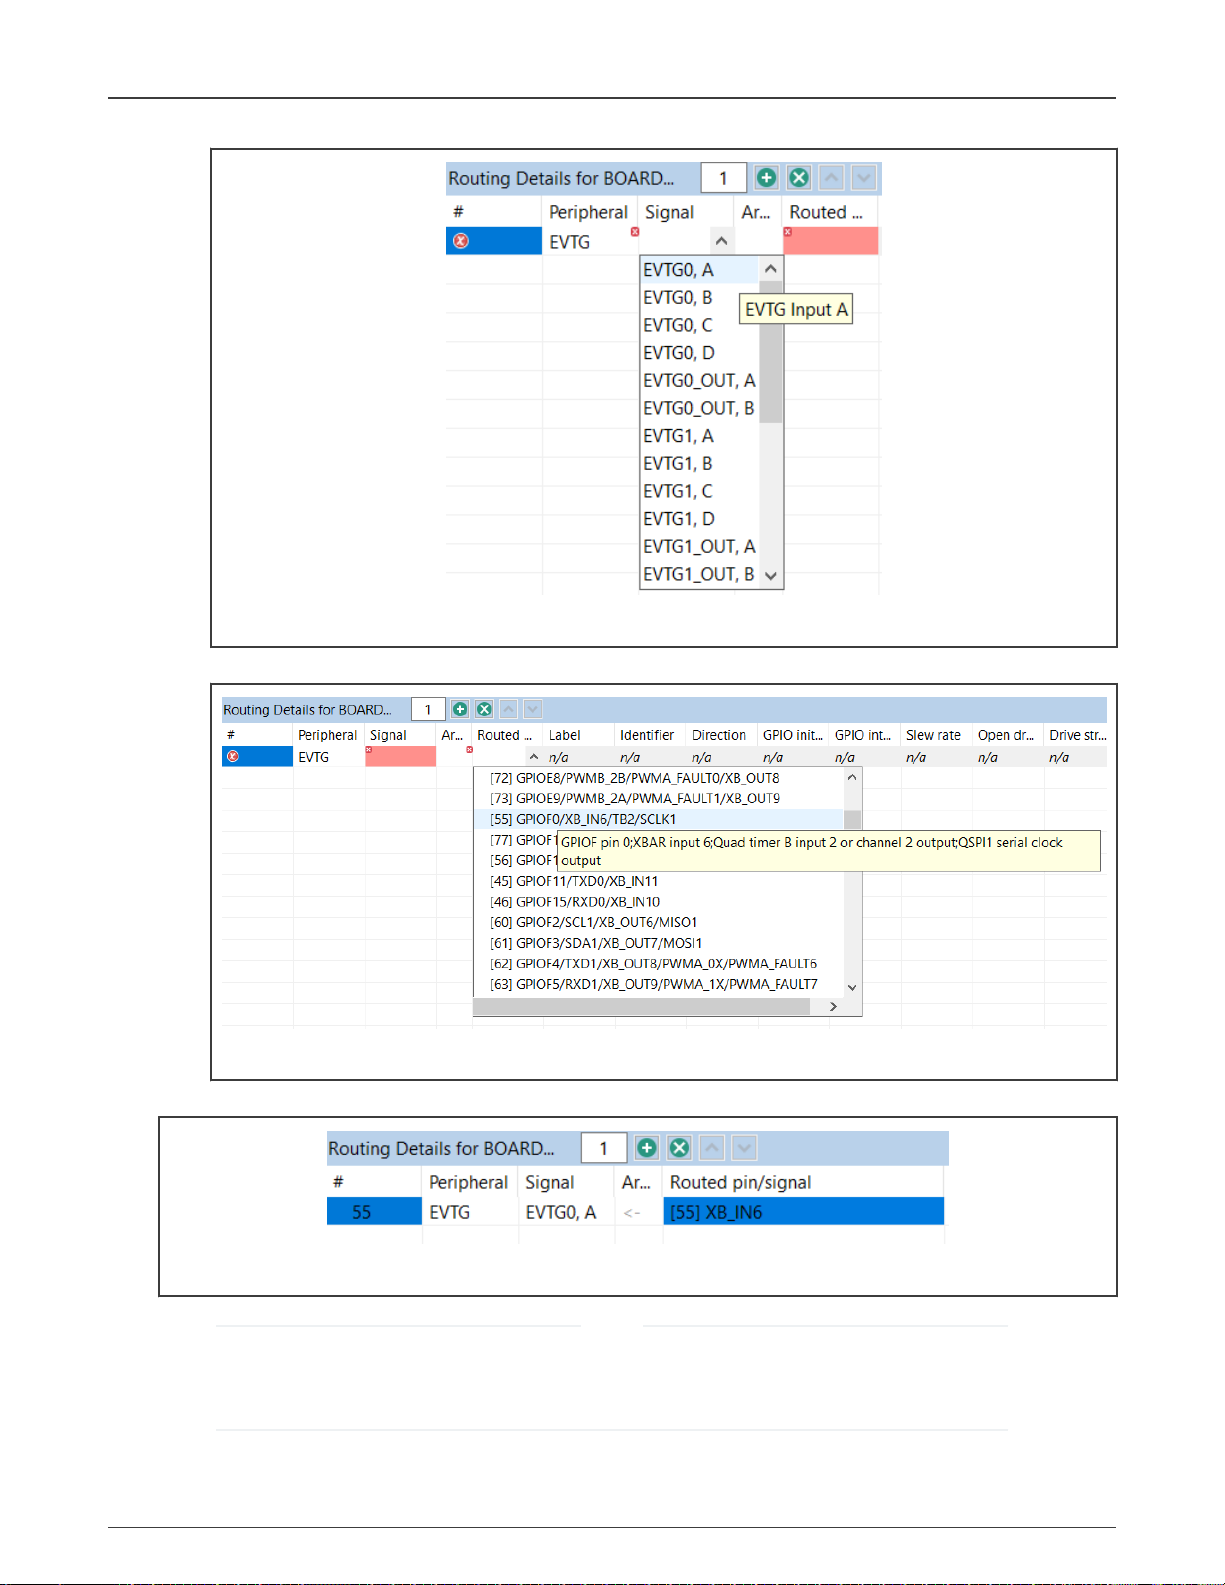
c. Select the input node of peripheral B from the drop-down list in the Signal column.
Pins Tool
Figure 19. Selecting the input node (B)
d. Select the output signal of peripheral A from the drop-down list in the Routed pin/signal column.
Figure 20. Selecting the output signal
Once the configuration is done, the row will look like this:
Figure 21. Result
MCUXpresso Config Tools User's Guide (IDE), Rev. 0, 1/2021
User's Guide 26 / 136
Page 27
NXP Semiconductors
NOTE
It’s necessary to select the ADC peripheral where the signal leads to (input in ADC). It’s a limitation of the Pins tool
that the signal is not listed for the PWM peripheral (output). Notice the direction of the signal in the Arrow column.
2. Routing the signal from a pin on the package to internal peripheral input signal through an inter-peripheral crossbar
NOTE
Only if a crossbar switch is present.
The signal leads from a pin on the package (XB_IN) connected through an inter-peripheral crossbar, to an internal
peripheral (B) input node. In other words, the signal leads from XB_IN to B (XB_IN > B). To configure a signal in this way,
perform the following steps (routing pin 55 using XB_IN6 to EVTG0 input A (XB_IN6 > EVTG0) used as example):
a. Add a new row in the Routing Details view.
b. Select peripheral B from the drop-down list in the Peripheral column.
Pins Tool
Figure 22. Selecting the peripheral (B)>
c. Select the input node of peripheral B from the drop-down list in the Signal column.
MCUXpresso Config Tools User's Guide (IDE), Rev. 0, 1/2021
User's Guide 27 / 136
Page 28
NXP Semiconductors
Figure 23. Selecting the input node (B)
Pins Tool
d. Select the XB_IN pin from the drop-down list in the Routed pin/signal column.
Figure 24. Selecting the pin
Once the configuration is done, the row will look like this:
Figure 25. Result
NOTE
In this example, GPIOF0 is multiplexed with XB_IN6, QTimerB channel 2 output/input and QSPI1 SCLK signal. In
this case, the tool will automatically pick XB_IN6 for the pin as XB_IN6 is the only option to be routed to EVTG0
input A.
3. Routing the signal from internal peripheral (A) output to a pin via inter-peripheral crossbar
MCUXpresso Config Tools User's Guide (IDE), Rev. 0, 1/2021
User's Guide 28 / 136
Page 29
NXP Semiconductors
NOTE
Only if a crossbar switch is present.
The signal leads from internal peripheral (A) output to a pin connected through an inter-peripheral crossbar on the package
(XB_OUT). In other words, the signal leads from A to XB_OUT (A > XB_OUT). To configure a signal in this way, perform
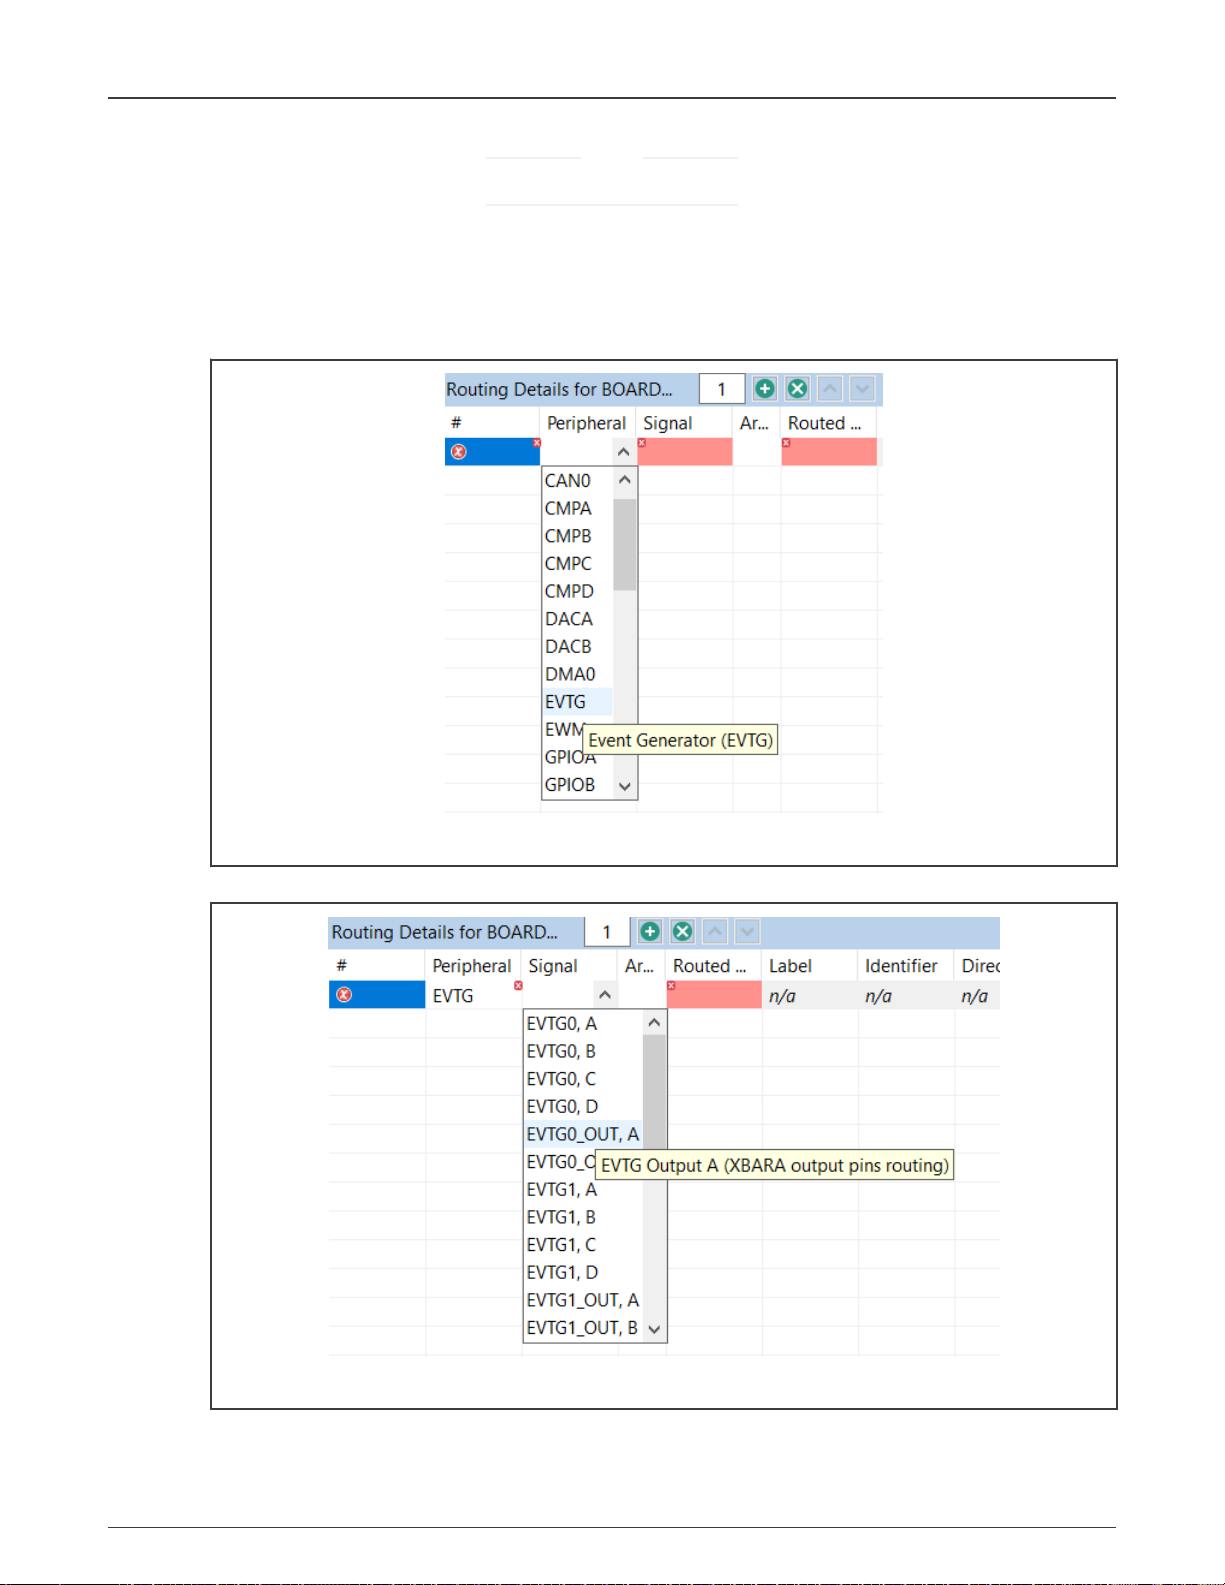
the following steps (routing EVTG0 output to a pin 87 using XB_OUT4 used as an example):
a. Add a new row in the Routing Details view.
b. Select peripheral A from the drop-down list in the Peripheral column.
Pins Tool
Figure 26. Selecting the peripheral (A)
c. Select the input node of peripheral A from the drop-down list in the Signal column.
Figure 27. Selecting the output signal (A)
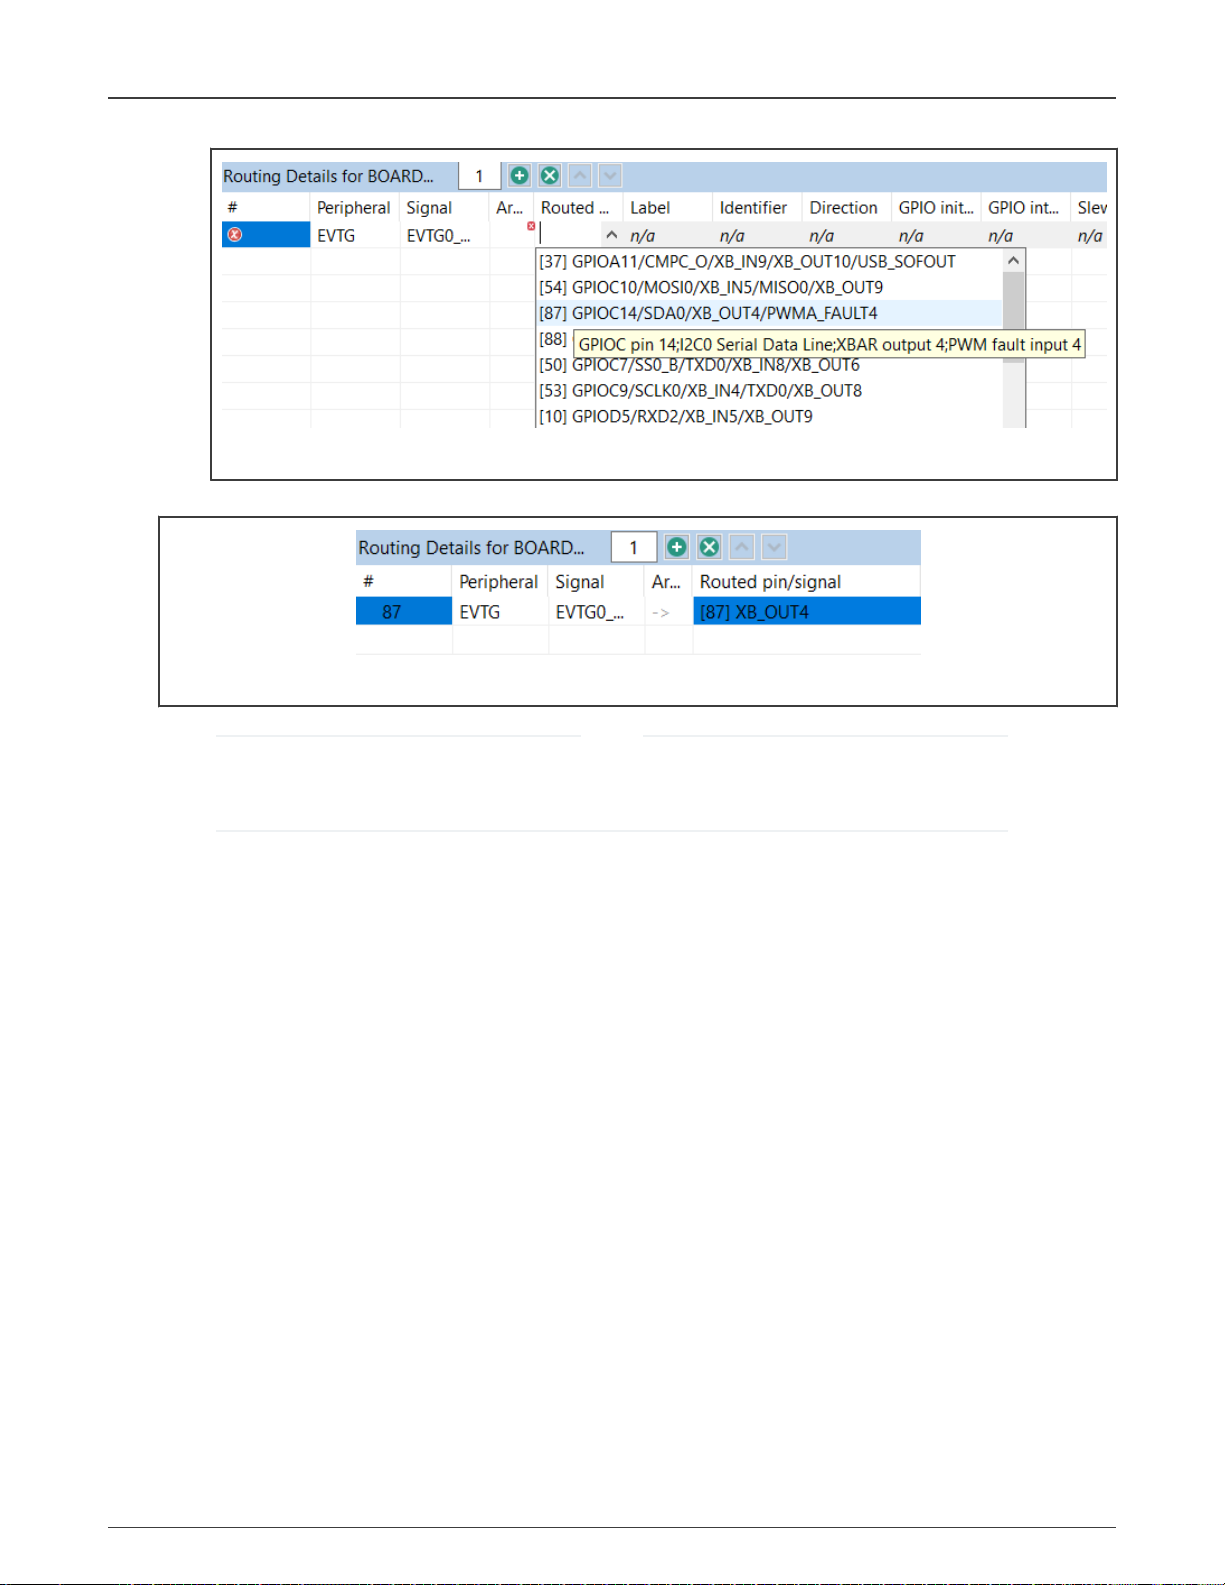
d. Select the XB_OUT pin from the drop-down list in the Route to column.
MCUXpresso Config Tools User's Guide (IDE), Rev. 0, 1/2021
User's Guide 29 / 136
Page 30
NXP Semiconductors
Figure 28. Selecting the pin
Once the configuration is done, the row will look like this:
Pins Tool
Figure 29. Result
NOTE
In this example, GPIOC14 is multiplexed with XB_OUT4, SDA of I2C0 and fault4 of eFlexPWMA. In this case, the
tool will automatically configure XB_OUT4 for the pin GPIOC14 (pin 87) as XB_OUT4 is the only option for EVTG0
output A.
3.2 Example workflow
This section lists the steps to create an example pin configuration, which can then be used in a project.
In this example, three pins (UART3_RX, UART3_TX and PTB20) on a board are configured.
You can use the generated files with the application code.
1. In the Pins view on the left, select the UART3_RX and TX signals. For this, you can click into the cells to make them ‘green’.
MCUXpresso Config Tools User's Guide (IDE), Rev. 0, 1/2021
User's Guide 30 / 136
Page 31

NXP Semiconductors
Pins Tool
Figure 30. Configuring signals in the Pins view
2. In the Routing Details view, select the Output direction for the TX and PTB20 signals.
Figure 31. Selecting direction
NOTE
For GPIO peripherals, you can set the Direction by clicking the cell and selecting from the drop-down menu. If you
select Output you can also set GPIO initial state by clicking the cell in the GPIO initial state column. If you select
Input you can also set GPIO interrupt by clicking the cell in the GPIO interrupt column.
3. The Pins tool automatically generates the source code for pin_mux.c and pin_mux.h on the right panel of Code Preview.
MCUXpresso Config Tools User's Guide (IDE), Rev. 0, 1/2021
User's Guide 31 / 136
Page 32

NXP Semiconductors
Pins Tool
Figure 32. Generated code
4. You can now copy-paste the content of the source(s) to your application and IDE. Alternatively, you can export the
generated files or update the code with the Update Code button in Toolbar. To export the files, select File > Export (in the
desktop version) or select the menu Pins > Export menu (in the Web version). In the Export dialog expand the tree control
for the tool you want to export sources for and select the Export Source Files option. Export, select the Export Source
Files option.
MCUXpresso Config Tools User's Guide (IDE), Rev. 0, 1/2021
User's Guide 32 / 136
Page 33

NXP Semiconductors
Pins Tool
Figure 33. Export
5. Click Next and specify the directory for each respective core (in multicore configuration) where you want to store the
exported files for each individual core (in case of multicore configuration).
6. Click Finish to export the files.
7. Integrate and use the exported files in your application as source files.
3.3 User interface
The Pins tool consists of several views.
MCUXpresso Config Tools User's Guide (IDE), Rev. 0, 1/2021
User's Guide 33 / 136
Page 34

NXP Semiconductors
Figure 34. Pins tool user interface
Pins Tool
Figure 35. Selecting power group
NOTE
Power Groups are not supported for all processors.
3.3.1 Pins view
The Pins view shows all the pins in a table format.
MCUXpresso Config Tools User's Guide (IDE), Rev. 0, 1/2021
User's Guide 34 / 136
Page 35

NXP Semiconductors
Pins Tool
Figure 36. Pins table view
This view shows the list of all the pins available on a given device. The Pin name column shows the default name of the pin, or
if the pin is routed. The pin name is changed to show appropriate function for selected peripheral if routed. The next columns of
the table shows peripherals and pin name(s) on given peripheral. Peripherals with few items are cumulated in the last column.
To route/unroute a pin to the given peripheral, select the relevant cell in the Pin column. Routed pins are highlighted in green. If
a conflict in routing exists, the pins are highlighted in red.
Every routed pin appears in the Routed pins table.
When multiple functions are specified in the configuration, the Pins view shows pins for selected function primarily. Pins for
different functions are shown with light transparency and cannot be configured until switched to this function.
Select a row to open a drop-down list that offers the following options:
• Route/Unroute the pin.
• Highlight the pin in the Package view.
• Set the label and identifier for the pin.
• Add a comment to the pin. You can later inspect the comment in the Code Preview view.
TIP
The option to route more signals to a single pin is indicated by an ellipsis (...). Select the cell to open a dialog to
choose from multiple available signals. The dialog also displays which signals are routed by default.
3.3.2 Package view
The Package view displays the processor package. The processor package provides an overview of the package including
resource allocation.
MCUXpresso Config Tools User's Guide (IDE), Rev. 0, 1/2021
User's Guide 35 / 136
Page 36

NXP Semiconductors
Pins Tool
Figure 37. Processor package
This view shows package overview with pins location. In the center are the peripherals.
To highlight the pin/peripheral configuration in the Pins and Routing Details views, right-click the pin or peripheral and
select Highlight.
For BGA packages, use the Resources icon to see them.
• Green color indicates the routed pins/peripherals.
• Gray color indicates that the pin/peripheral is not routed.
• Dark Gray color indicates that the pin/peripheral is dedicated. It is routed by default and has no impact on generated code.
The view also shows the package variant and the description (type and number of pins).
The following icons are available in the toolbar:
MCUXpresso Config Tools User's Guide (IDE), Rev. 0, 1/2021
User's Guide 36 / 136
Page 37

NXP Semiconductors
Table 14. Toolbar options
Icon Description
Zoom in package image.
Zoom out package image.
Rotate package image.
Show pins as you can see it from the bottom. This option is available on BGA packages only.
Show pins as you can see it from the top. This option is available on BGA packages only.
Show resources. This option is available on BGA packages only.
Switch package.
Package legend.
Pins Tool
NOTE
Depending on the processor package selected, not all views are available.
The Switch package for the Processor window shows list of available processor packages, showing package type and number
of pins.
3.3.3 Peripheral Signals view
The Peripheral Signals view shows a list of peripherals and their signals. Only the Peripheral Signals and Pins view show the
checkbox (allocated) with status.
Table 15. Status codes
Color code Status
Error
Configured
Not configured
Warning
Dedicated: Device is routed by default and has no impact on the generated code.
MCUXpresso Config Tools User's Guide (IDE), Rev. 0, 1/2021
User's Guide 37 / 136
Page 38

NXP Semiconductors
Pins Tool
Figure 38. Peripheral Signals view
Use the checkbox to route/unroute the pins.
To highlight the pin/routing configuration about the peripheral in the Package and Routing Details views, right-click the signal and
select Highlight.
To route/unroute multiple pins, click the peripheral and select the options in the Select signals dialog.
MCUXpresso Config Tools User's Guide (IDE), Rev. 0, 1/2021
User's Guide 38 / 136
Page 39

Show pins not routed
Show dedicated pins
Show routed pins
Show pins with
analog signals
Show pins with low leakage power mode
wake-up capability
Show pins with
digital signals
Show pins with input signals
Show only pins with
interrupt capability
Show pins with
output signals
Show pins with
input/output signals
NXP Semiconductors
Pins Tool
Figure 39. Select signals dialog
3.3.3.1 Filtering in the Pins and Peripheral Signals views
The following image illustrates the filtering controls in the Pins and Peripheral Signals views.
Figure 40. Filtering Controls
Type any text to search across the table/tree. It will search for the pins/peripheral signals containing the specified text. You can
also use wildcards "*" and "?" to help you filter results you want. Use "space" to search for multiple strings at the same time.
User's Guide 39 / 136
MCUXpresso Config Tools User's Guide (IDE), Rev. 0, 1/2021
Page 40

NXP Semiconductors
Pins Tool
3.3.4 Routing Details view
In the Routing Details view, you can inspect and configure routed pins and internal signals. You can also configure the electrical
properties of pins and view them. It displays the pad configuration available in a configuration where each pin is associated with
the signal name and the function.
NOTE
The electrical features are configured only for pins in the table. For example, the routed pins.
The table is empty when a new configuration is created, which means no pin is configured. Each row represents configuration of
a single pin and if there are no conflicts, then the code is immediately updated. For Boards/Kits the pins are routed already.
Figure 41. Routing Details
Add a new row with the Add new row button in the view toolbar.
Configure the pin/signal by selecting the Peripheral first, then the required Signal, and finally, the pin to Route to.
Use the columns in the right side of the table to configure the electrical features.
You can also use the Pins and Peripheral Signals views to route pins and peripheral signals and view/modify the configuration in
the Routing Details view. If the feature is not supported,
n/a
is displayed.
To highlight peripheral/pin information in the Package and Pins views, right-click the row and select Highlight.
To filter rows, type the text or the search phrase in the filter area in the view toolbar.
NOTE
When you enter the search text, it also searches the text in the full pin names displays rows that contain the
search text.
To display pins or signals only, use the Pins and Signals buttons in the view toolbar.
To add a new row to the end of table, click on the Add new row button.
To remove the selected row, click on the Delete the selected row button.
To delete a specific row or insert a new row at a given position, right-click and use the dropdown list commands.
To add a specific number of rows, enter the number in the field.
To clear the table, type 0.
To change the order of the rows, use the arrow icons to move one row up or down.
To filter table entries by text, enter the text string in the type filter text field.
To copy the row, right-click any cell in the row and select Copy. You can later paste the copied row into the Routing Details view
of another functional group or configuration by right-clicking the table and choosing Paste.
The gray background indicates read-only items.
The italic value indicates that the value is not configured and it shows the after-reset value and no code is generated, so the
configuration relies on the after reset value or the values configured from the different functions.
MCUXpresso Config Tools User's Guide (IDE), Rev. 0, 1/2021
User's Guide 40 / 136
Page 41
NXP Semiconductors
Pins Tool
TIP
• The value shown using italic indicates the after-reset value. The real value may be different from the after reset
value, if configured in other functions.
Use the drop-down menu to select the required value.
• If you select the same value as the after-reset value, the tool will always generate code to set this feature.
Use the drop-down "Reset" value to reset the value to its after-reset state.
• If an item does not support reset to after reset value, the Reset menu is not available.
• The first row shows pin number or coordinate on BGA package.
3.3.4.1 Labels and identifiers
You can define the label of any pin that can be displayed in user interface for ease of identification.
Boards and kits have pre-defined labels. However, it's also possible to define a pin label listed in the Pins and Routing
Details views.
To set\update the Labels and Identifier columns visibility, select Edit > Preferences from the Menu bar, and select the Show pin
label & identifier table columns (Pins tool) checkbox.
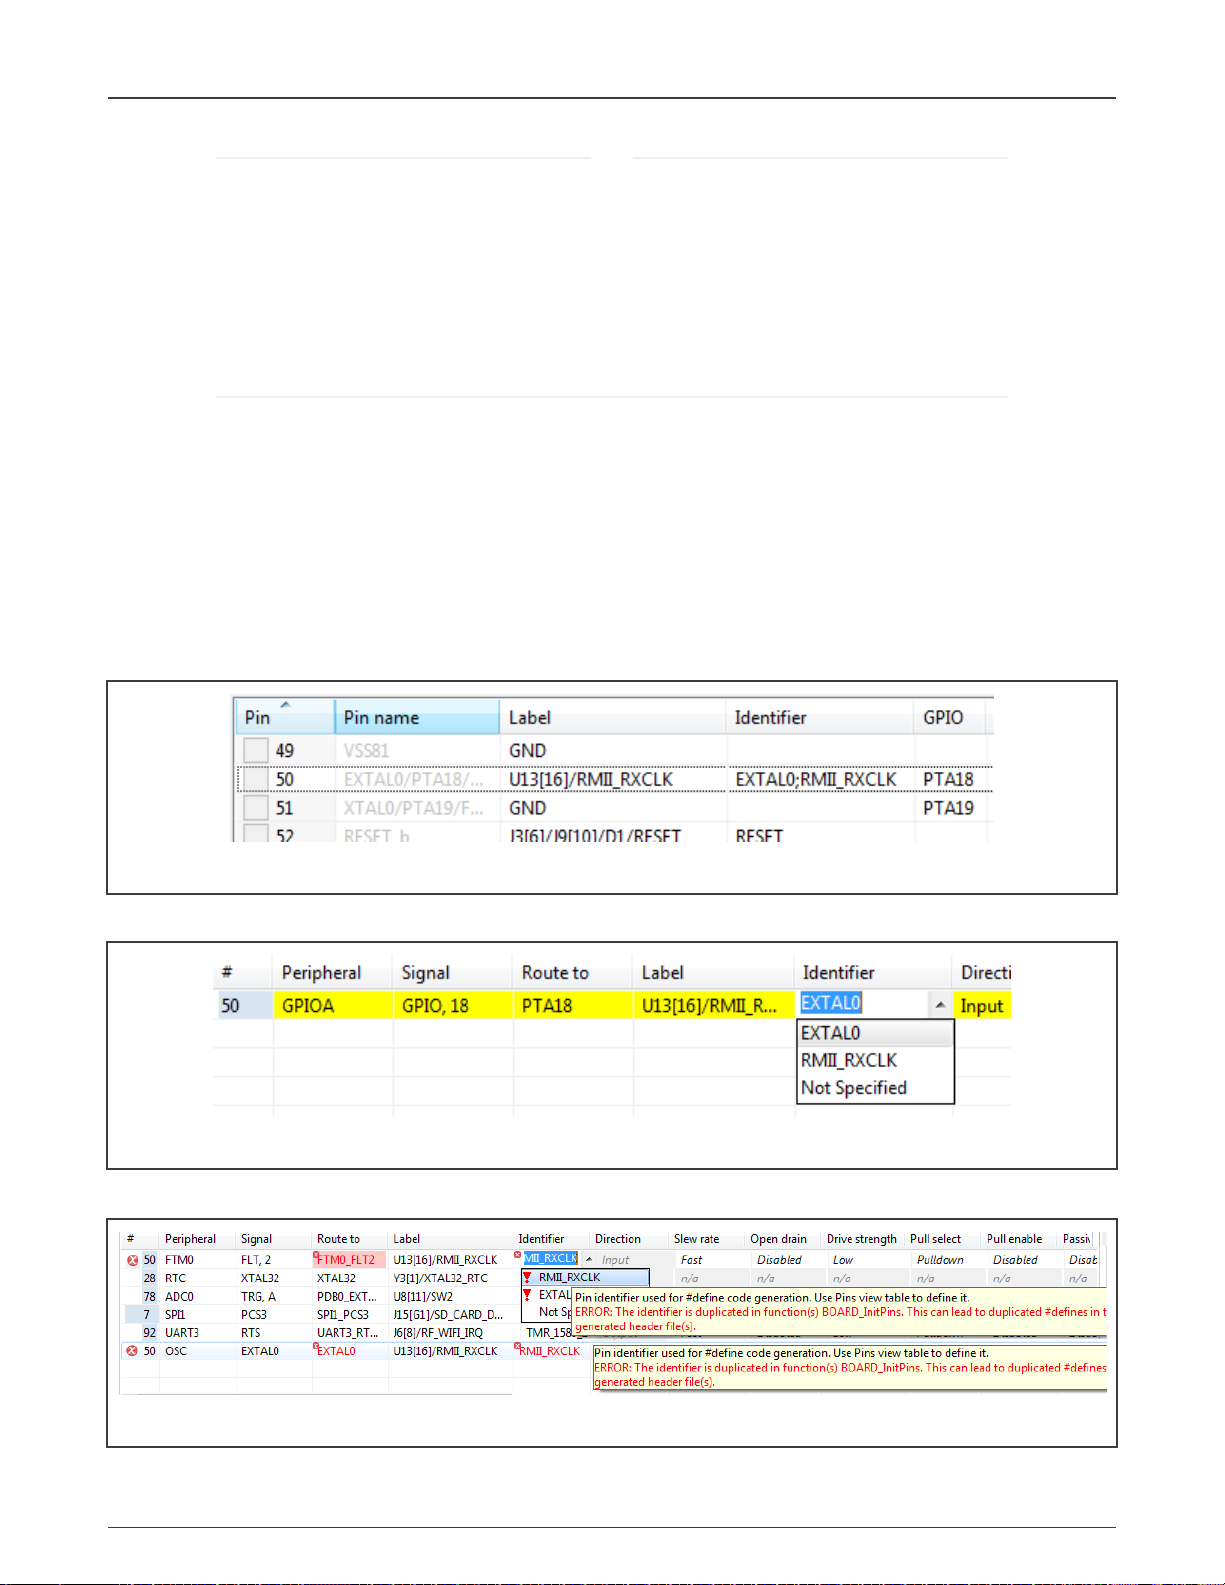
The pin identifier is used to generate the #define in the pin_mux.h file. However, it's an optional parameter. If the parameter is
not defined, the code for #define is not generated. Additionally, you can define multiple identifiers, using the “;” character as a
separator. You can also set the identifier by typing it directly into the cell in the Identifier column in the Routing Details views.
Figure 42. Pin identifier
In this case it's possible to select from values if the pin is routed. See Routing Details.
Figure 43. Identifier in Routing Details table
A check is implemented to ensure whether the generated defines are duplicated in the pin_mux.h file. These duplications are
indicated in the identifier column as errors. See Identifier errors.
Figure 44. Identifier errors
MCUXpresso Config Tools User's Guide (IDE), Rev. 0, 1/2021
User's Guide 41 / 136
Page 42

NXP Semiconductors
Pins Tool
You can also select the pin to use in a given routing from the Routing Details view. However, the identifier must be a valid C
identifier and should be used in the source code.
Figure 45. Pins macros prefix
If multiple functions are used, each individual function can include a special prefix. Check the Pins > Functional Group Properties
> Set custome #define prefix checkbox to enter prefix of macros in particular function used in the generated code of the pin_mux.h
file. Entered prefix text must be a C identifier. If unchecked, the Function name is used as a default prefix.
3.3.5 Expansion Header
In the Expansion Header view, you can add and modify an expansion header configuration, map the connectors, and route the
pin signals. You can also import and apply an expansion board to the header.
Certain boards, such as LPCXpresso55S69, come with preconfigured expansion headers.
Figure 46. Expansion header
The expansion header is not automatically preset for every supported device. If the header is not preconfigured, follow these steps
to create and modify an expansion header configuration:
1. Open the view by selecting Views>Expansion Header from the Toolbar.
MCUXpresso Config Tools User's Guide (IDE), Rev. 0, 1/2021
User's Guide 42 / 136
Page 43

NXP Semiconductors
2. Add a new header by selecting the Add button in the view toolbar.
3. In the Add New Expansion Header window, select the Header type from the drop-down list.
Pins Tool
Figure 47. Adding new expansion header
4. Name the header and map the connectors.
Figure 48. Adding new expansion header
5. Select OK.
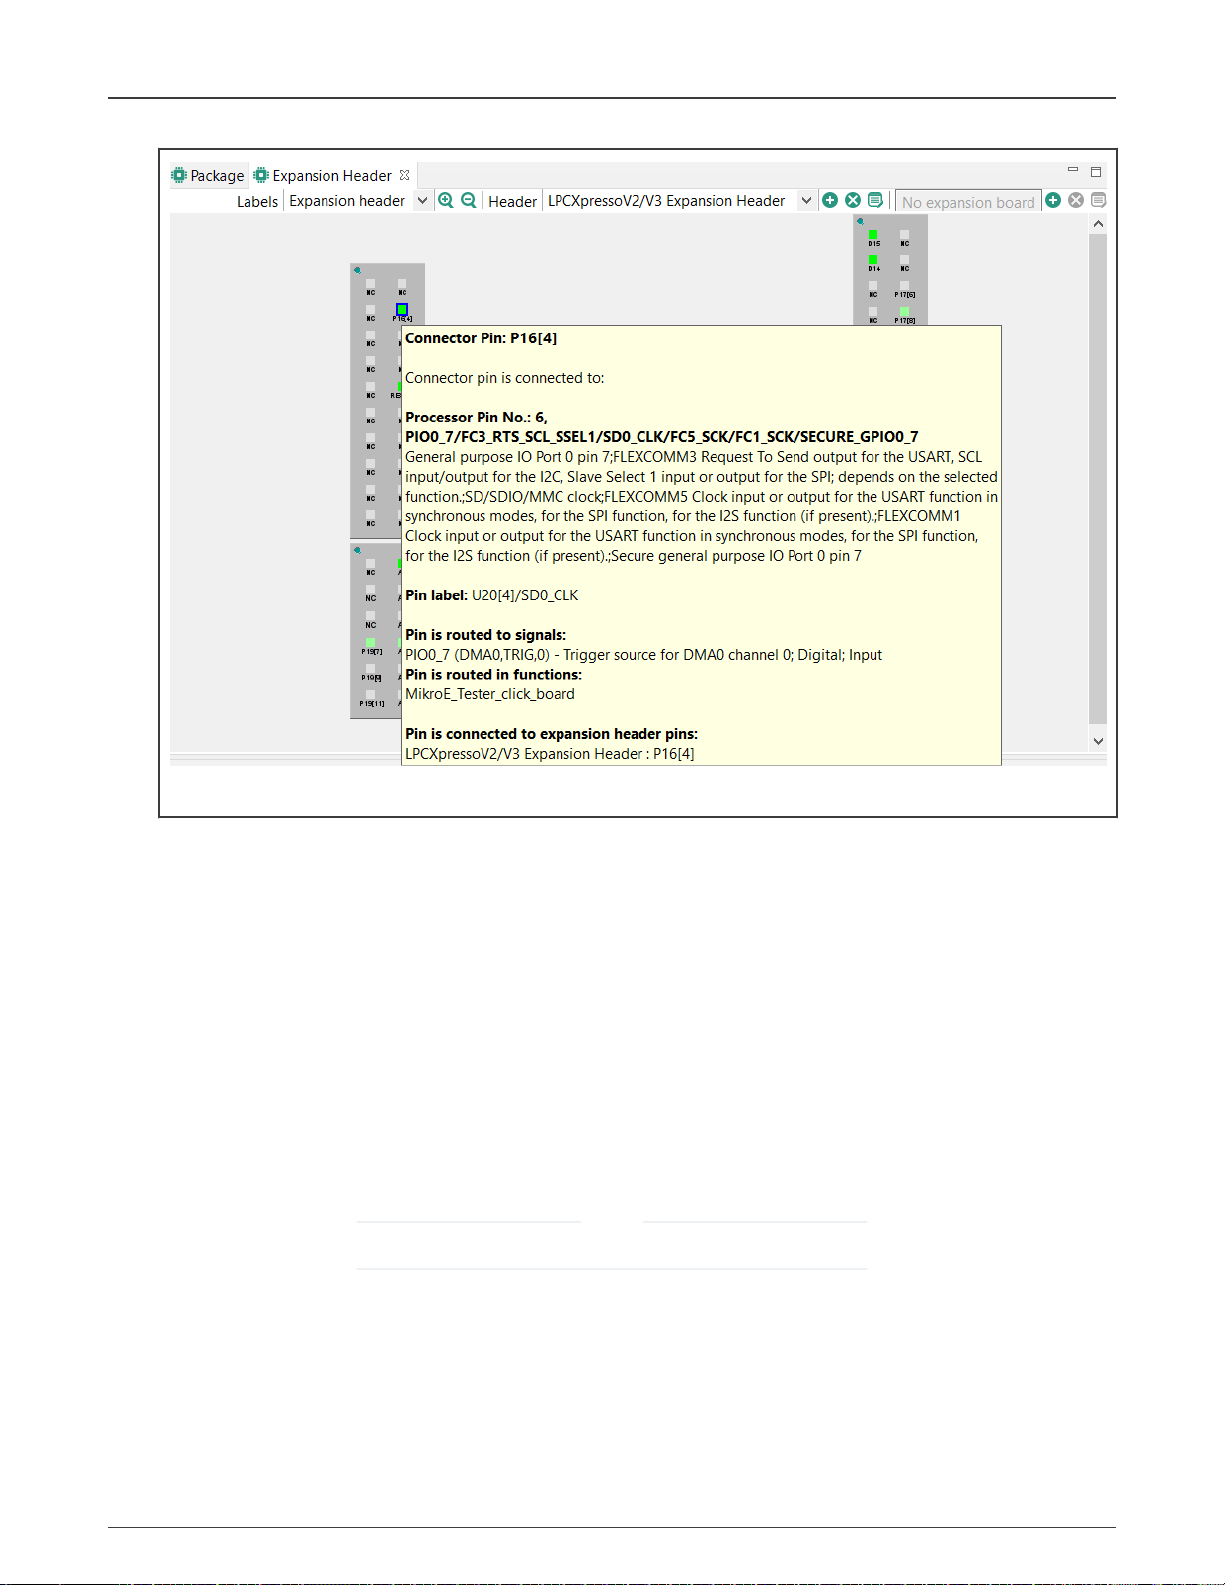
Expansion Header view now displays the connector layout. You can point your cursor over the pins to display additional
information. Right-click the pin to display a shortcut menu of additional options.
MCUXpresso Config Tools User's Guide (IDE), Rev. 0, 1/2021
User's Guide 43 / 136
Page 44

NXP Semiconductors
Pins Tool
Figure 49. Expansion header
6. To map the header pin to processor pin, right-click the header pin and select Connect.
7. In the Connector Pin dialog, select the processor pin/external signal from the list and click OK.
MCUXpresso Config Tools User's Guide (IDE), Rev. 0, 1/2021
User's Guide 44 / 136
Page 45

NXP Semiconductors
Pins Tool
Figure 50. Connected pin
8. To route the pin, right-click the header pin and select Route.
9. In the Pin dialog, select the signal from the list and click OK.
The connector pin is now routed.
MCUXpresso Config Tools User's Guide (IDE), Rev. 0, 1/2021
User's Guide 45 / 136
Page 46
NXP Semiconductors
Pins Tool
Figure 51. Routed pin
You can create more than one expansion header configuration. Switch between the configurations in the view's
drop-down list.
To highlight the pin/routing configuration in the Pins and Routing Details views, right-click the connector pin and
select Highlight.
Modify the configuration parameters at any time by selecting the Edit button. Information in the Pins view is
updated automatically.
Remove a configuration by selecting the Remove button.
Use the Label drop-down list to switch between display information for header, board, and routing.
3.3.5.1 Expansion Board
In the Expansion Header view, you can also apply an expansion board to an already created expansion header. The expansion
board configuration can be imported into Pins tool in the form of an XML file. Based on the chosen processor, the tool will then
recommend adequate routing.
NOTE
Only a single expansion board can be configured per expansion header.
1. In the Expansion Header view, click the Apply expansion board to the selected header. Alternatively, select Pins>Apply
expansion board from the Menu bar.
2. In the Apply expansion board dialog, click Browse to locate the XML file with expansion board information and click OK.
MCUXpresso Config Tools User's Guide (IDE), Rev. 0, 1/2021
User's Guide 46 / 136
Page 47

NXP Semiconductors
Figure 52. Apply expansion board
3. Click OK to apply the expansion board.
Pins Tool
4. On the next page, choose if you want to create a new functional group for the expansion board, or modify an existing
functional group. In the latter case, use the dropdown list to select from available functional groups.
5. In the Expansion Board Routing table, inspect the suggested routing of expansion board pins. If you want to change the
route of a pin, click the pin cell in the Route column and select the signal in the Connector pin dialog and click Done.
MCUXpresso Config Tools User's Guide (IDE), Rev. 0, 1/2021
User's Guide 47 / 136
Page 48

NXP Semiconductors
Pins Tool
Figure 53. Expansion board routing
6. Choose how you want to populate identifiers for code. Following options are available:
• Expansion header names
• Expansion board names
• None
7. Click Apply to apply the settings.
You can change the expansion board signal routing at any time by clicking the Configure routing for expansion board button
in the Expansion Header view.
3.3.6 Highlighting and color coding
You can easily identify routed pins/peripherals in the package using highlighting. By default, the current selection (pin/peripheral)
is highlighted in the Package view.
• The pin/peripheral is highlighted by yellow border around it in the Package view. If the highlighted pin/peripheral is selected
then it has a blue border around it.
MCUXpresso Config Tools User's Guide (IDE), Rev. 0, 1/2021
User's Guide 48 / 136
Page 49

Highlighted
peripheral
Unallocated
peripheral
Peripheral
with error
Routed pin
Unrouted pin
Highlighted
unrouted pin
Pin with error
Dedicated pin
Dedicated
peripheral
Allocated
peripheral
NXP Semiconductors
• Red indicates that the pin has an error.
• Green indicates that the pin is muxed or used.
• Light grey indicates that the pin is available for mux, but is not muxed or used.
• Dark gray indicates that the pin/peripheral is dedicated. It is routed by default and has no impact on generated code.
Pins Tool
Figure 54. Highlighting and color coding
Figure 55. Pins conflicts
MCUXpresso Config Tools User's Guide (IDE), Rev. 0, 1/2021
User's Guide 49 / 136
Page 50

NXP Semiconductors
Figure 56. Warnings
• Package view
— Click on the peripheral or use the pop-up menu to highlight peripherals:
◦ and all allocated pins (to selected peripheral).
◦ or all available pins if nothing is allocated yet.
— Click on the pin or use the pop-up menu to highlight the pin and the peripherals.
— Click outside the package to cancel the highlight.
• Peripherals / Pins view
— The peripheral and pin behaves as described above image.
3.4 Errors and warnings
Pins Tool
The Pins Tool checks for any conflict in the routing and also for errors in the configuration. Routing conflicts are checked only
for the selected function. It is possible to configure different routing of one pin in different functions to allow dynamic pins
routing re-configuration.
Figure 57. Error and warnings
If an error or warning is encountered, the conflict in the Routing Details view is represented in the first column of the row
and the error/warning is indicated in the cell, where the conflict was created. The first two rows in the figure above show the
peripheral/signal where the erroneous configuration occurs. The fourth row shows the warning on the unconfigured identifier while
specifying a direction. The detailed error/warning message appears as a tooltip.
For more information on error and warnings color, see the Highlighting and Color Coding section.
3.4.1 Incomplete routing
A cell with incomplete routing is indicated by a red background. To generate proper pin routing, click on the drop down arrow and
select the suitable value. A red decorator on a cell indicates an error condition.
MCUXpresso Config Tools User's Guide (IDE), Rev. 0, 1/2021
User's Guide 50 / 136
Page 51

NXP Semiconductors
Pins Tool
Figure 58. Incomplete routing
The tooltip of the cell shows more details about the conflict or the error, typically it lists the lines where conflict occurs.
You can also select Pins > Automatic Routing from the Main menu to resolve any routing issues.
NOTE
Not all routing issues can be resolved automatically. In some cases, manual intervention is required.
3.5 Code generation
If the settings are correct and no error is reported, the code generation engine instantly re-generates the source code. You can
view the resulting code the Code Preview view of the Pins tool.
Code Preview automatically highlights differences between the current and immediately preceding iteration of the code. You
can choose between two modes of highlighting by clicking the Set viewing style for source differences. You can also disable
highlighting altogether from the same dropdown menu.
For multicores, the sources are generated for each core. Appropriate files are shown with @Core #{number} tag.
NOTE
The tag name may be different depending on the selected multi-core processor family/type.
You can also copy and paste the generated code into the source files. The view generates code for each function. In addition to
the function comments, the tool configuration is stored in a YAML format. This comment is not intended for direct editing and can
be used later to restore the pins configuration.
MCUXpresso Config Tools User's Guide (IDE), Rev. 0, 1/2021
User's Guide 51 / 136
Page 52

NXP Semiconductors
Pins Tool
Figure 59. Generated code
YAML configuration contains configuration of each pin. It stores only non-default values.
TIP
For multicore processors, it will generate source files for each core. If processor is supported by SDK, it can
generate BOARD_InitBootPins function call from main by default. You can specify "Call from BOARD_InitBootPins"
for each function, in order to generate appropriate function call.
3.6 Using pins definitions in code
The Pins tool generates definitions of named constants that can be leveraged in the application code. Using such constants based
on user-specified identifiers allows you to write code which is independent of configured routing. In the case you change the pin
where the signal is routed, the application will still refer to the proper pin.
For example, when the
the pin_mux.h:
#define BOARD_LED_RED_GPIO GPIOB /*!<@brief GPIO device name: GPIOB */
#define BOARD_LED_RED_PORT PORTB /*!<@brief PORT device name: PORTB *'/
User's Guide 52 / 136
LED_RED
is specified an identifier of a pin routed to
MCUXpresso Config Tools User's Guide (IDE), Rev. 0, 1/2021
PTB22
, the following defines are generated into
Page 53

NXP Semiconductors
Pins Tool
#define BOARD_LED_RED_PIN 22U /*!<@brief PORTB pin index: 22 */
The name of the define is composed from function group prefix and pin identifier. For more details. see Functional groups and
Labels and identifiers sections.
To write to this GPIO pin in application using the SDK driver (fsl_gpio.h), you can for example use the following code referring to
the generated defines for the pin with identifier
GPIO_PinWrite(BOARD_LED_RED_GPIO, BOARD_LED_RED_PIN, true);
LED_RED
:
MCUXpresso Config Tools User's Guide (IDE), Rev. 0, 1/2021
User's Guide 53 / 136
Page 54

NXP Semiconductors
Chapter 4
Clocks Tool
The Clocks Tool configures initialization of the system clock (core, system, bus, and peripheral clocks) and generates the C code
with clock initialization functions and configuration structures.
4.1 Features
The Clocks tool allows you to perform various actions related to the Clock initialization, among them the following:
• Inspect and modifies element configurations on the clock path from the clock source up to the core/peripherals.
• Validate clock elements settings and calculates the resulting output clock frequencies.
• Generate a configuration code using the SDK.
• Modify the settings and provides output using the table view of the clock elements with their parameters.
• Navigate, modify, and display important settings and frequencies easily in Diagram view.
• Edit detailed settings in Details view.
• Inspect the interconnections between peripherals and consuming clocks in Module Clocks view.
• Find clock elements settings that fulfills given requirements for outputs.
• Fully integrated in tools framework along with other tools.
• Shows configuration problems in Problems view and guides the user for the resolution.
4.2 User interface
The Clocks tool is integrated and runs within the MCUXpresso Config Tools framework.
Figure 60. User interface
MCUXpresso Config Tools User's Guide (IDE), Rev. 0, 1/2021
User's Guide 54 / 136
Page 55

NXP Semiconductors
Clocks Tool
4.3 Clock configuration
Each clock configuration (functional group) lists the settings for the entire clock system and is a part of the global configuration
stored in the MEX file. Initially, after the new clock configuration is created, it's set to reflect the default after-reset state of
the processor.
There can be one or more clock configurations handled by the Clocks tool. The default clock configuration is created with the name
“
BOARD_BootClockRUN
All clock settings are stored individually for each clock configuration so that each clock configuration is
configured independently.
Clocks configurations (functional groups) are presented at the top of the view. You can switch between them by selecting them
from the dropdown menu.
Figure 61. Default clock configuration
The code generation engine of the tool generates function with the name derived from the Clock
configuration name.
”. Multiple configurations means multiple options are available for the processor initialization.
NOTE
NOTE
4.4 Global settings
Global settings, such as Run Mode and MCG mode, influence the entire clock system. It's recommended to set them first. Global
settings can be modified in Clock Table, Clock Diagram, and Details views.
NOTE
Global settings can be changed at any time.
Figure 62. Global settings
4.5 Clock sources
The Clock Sources table is located in the Clocks Table view. You can also edit the clock sources directly from the Diagram view
or from the Details view.
You can configure the availability of external clock sources (check the checkbox) and set their frequencies. Some sources can
have additional settings available when you unfold the node.
If the external crystal or the system oscillator clock is available, check the checkbox in the clock source row and specify
the frequency.
Figure 63. External clock source configuration
MCUXpresso Config Tools User's Guide (IDE), Rev. 0, 1/2021
User's Guide 55 / 136
Page 56

NXP Semiconductors
Clocks Tool
NOTE
Some clock sources remain inactive even though the checkbox is checked. This is because the clock sources
functionality depends on other settings like power mode or additional enable/disable setting options. You can hover
the cursor on the setting to see a tooltip with information on the element and possible limitations/options.
4.6 Setting states and markers
The following states, styles, and markers reflect the information shown in the settings’ rows in the settings tables (clock sources,
output, details or individual).
Table 16. Setting states and markers
State/Style/
Icon Description
Marker
Error marker Indicates that there is an error in the settings or something related to it. See the tooltip of the
setting for details.
Warning marker Indicates that there is a warning in the settings or something related to it. See the tooltip of
the setting for details.
Lock icon Indicates that the settings (that may be automatically adjusted by the tool) are locked
to prevent any automatic adjustment. If the setting can be locked, they are automatically
locked when you change the value. To add/remove the lock manually, use the pop-up menu
command Lock/Unlock.
NOTE
The clock element settings that cannot be automatically adjusted by the tool
keep their value as is and do not allow locking. These are: clock sources, clock
selectors and configuration elements.
Yellow
Indicates that the field is directly or indirectly changed by the previous user action.
background
Gray text Indicates that the value of setting does not actively influence the clock. It is disabled or
relates to an inactive clock element. For example, on the clock path following the unavailable
clock source or disabled element. The frequency signal also show the text “inactive” instead
of frequency. The value is also gray when the value is read-only. In such a state it is not
possible to modify the value.
4.7 Frequency settings
The Clocks tool instantly re-calculates the state of the entire clock system after each change of settings from the clock source up
to the clock outputs.
The current state of all clock outputs is listed in the Clock Outputs view located on the right side of the clock sources. The displayed
value can be:
• Frequency – Indicates that a clock signal is active and the output is fed with the shown frequency. The tool automatically
chooses the appropriate frequency units. In case the number is too long or has more than three decimal places, it's shortened
and only two decimal places are shown, followed by an ellipsis (‘…’), indicating that the number is longer.
• “Inactive” text – Indicates that no clock signal flows into the clock output or is disabled due to some setting.
If you have a specific requirement for an output clock, click on the frequency you would like to set, change it, and press Enter.
Figure 64. Setting the core clock frequency
MCUXpresso Config Tools User's Guide (IDE), Rev. 0, 1/2021
User's Guide 56 / 136
Page 57

NXP Semiconductors
Clocks Tool
In case the tool has reached/attained the required frequency, it appears locked and is displayed as follows:
Figure 65. Tool attains the required frequency
In case the tool is not able to reach/attain the required frequency or some other problem occurs, it's displayed as follows:
Figure 66. Tool encounters problem
The frequency value in square brackets [ ] indicates the value that the tool is actually using in the calculations instead of the value
that has been requested.
NOTE
You can edit or set requirements only for the clock source and the output frequencies. The other values can be
adjusted only when no error is reported.
4.7.1 Pop-up menu commands
• Lock/Unlock – Removes a lock on the frequency which enables the tool to change any valid value that satisfies all other
requirements, limits, and constraints.
• Find Near Valid Value – Tries to find a valid frequency that lies near the specified value, in case the tool failed in reaching the
requested frequency.
Figure 67. Pop-up menu commands
4.7.2 Frequency precision
For locked frequency settings (where user requests a specific value) the frequency precision value is also displayed. By default,
the value is 0.1% but can be individually adjusted by clicking the value.
Figure 68. Frequency precision
4.8 Dependency arrows
In the Clocks Table view, the area between the clock sources and the clock output contains arrows directing the clock source to
outputs. The arrows lead from the current clock source used for the selected output into all outputs that are using the signal from
the same clock source. This identifies the dependencies and the influences when there is change in the clock source or elements
on a shared clock path.
MCUXpresso Config Tools User's Guide (IDE), Rev. 0, 1/2021
User's Guide 57 / 136
Page 58

NXP Semiconductors
Figure 69. Dependency arrows
4.9 Details view
The Details view displays and allows you to change clock-element settings information.
The information is also updated in real-time based on any changes in the Clocks Diagram and Clocks Table.
Clocks Tool
Figure 70. Details view
In the Details view, you can perform the following actions:
MCUXpresso Config Tools User's Guide (IDE), Rev. 0, 1/2021
User's Guide 58 / 136
Page 59

NXP Semiconductors
Clocks Tool
• Display clock-element information - Point the mouse cursor at the clock element to display general clock-element information.
• View the clock-element in Clocks Diagram or Clocks Table - Left-click on a clock element to highlight it in the Clocks Diagram
or Clocks Table views, depending on which is currently active.
• View detailed clock-element information - Double-click on a clock element to display element details, as well as highlight the
element in Clocks Diagram or Clocks Table, depending on which is currently active. You can also view element details by
clicking the Open in new window button in the upper right corner of the Details view.
• Modify clock-element settings - Left-click in the Value column to change clock element value, such as frequency, or select an
option from the dropdown menu.
• Lock/unlock clock elements - Right-click on a clock element to lock/unlock the element.
• Filter for active/locked/erroneous clock elements - Use the buttons in the upper-right corner of the Details view to filter for
active/locked/erroneous clock elements, or to remove all current filters.
4.10 Clocks diagram
The clocks diagram shows the structure of the entire clock model, including the clock functionality handled by the tool. It visualizes
the flow of the clock signal from clock sources to clock output. It's dynamically refreshed after every change and always reflects
the current state of the clock model.
At the same time it allows you to edit the settings of the clock elements.
Figure 71. Clocks diagram
4.10.1 Mouse actions in diagram
You can perform the following actions in the Clock diagram view.
• Position the mouse cursor on the element to see the tooltip with the information on the clock element such as status,
description, output frequency, constraints, and enable/disable conditions.
MCUXpresso Config Tools User's Guide (IDE), Rev. 0, 1/2021
User's Guide 59 / 136
Page 60

NXP Semiconductors
• Single-click on output frequency or scale to change output frequency or scale.
• Single-click on lock to remove the lock.
• Double-click on the element to show its settings in the Details view (force to open the view if closed or not visible).
• Single-click on the element to show its settings in the Details view.
• Single-click on a selected Clock source to display a dropdown menu for enabling or disabling the source.
• Single-click on a selected Clock selector to display selector input options.
Clocks Tool
Figure 72. Clocks mouse actions in diagram
• Right-click on the element, component, or clock output to see a pop-up menu with the following options.
— Edit settings of: {element} – Invokes the floating view with the settings for a single element.
— Edit all settings – Invokes the floating view with all the settings for an element.
— Edit settings on the path to: {clock output} – Invokes the floating view with the settings for all elements on the clock
path leading to the selected clock output.
Figure 73. Floating view
4.10.2 Color and line styles
Different color and line styles indicate different information for the element and clock signal paths.
The color and line styles can indicate:
• Active clock path for selected output
• Clock signal path states - used/unused/error/unavailable
• Element states – normal/disabled/error
To inspect colors and style appearance, select Help > Show diagram legend from the main menu.
MCUXpresso Config Tools User's Guide (IDE), Rev. 0, 1/2021
User's Guide 60 / 136
Page 61
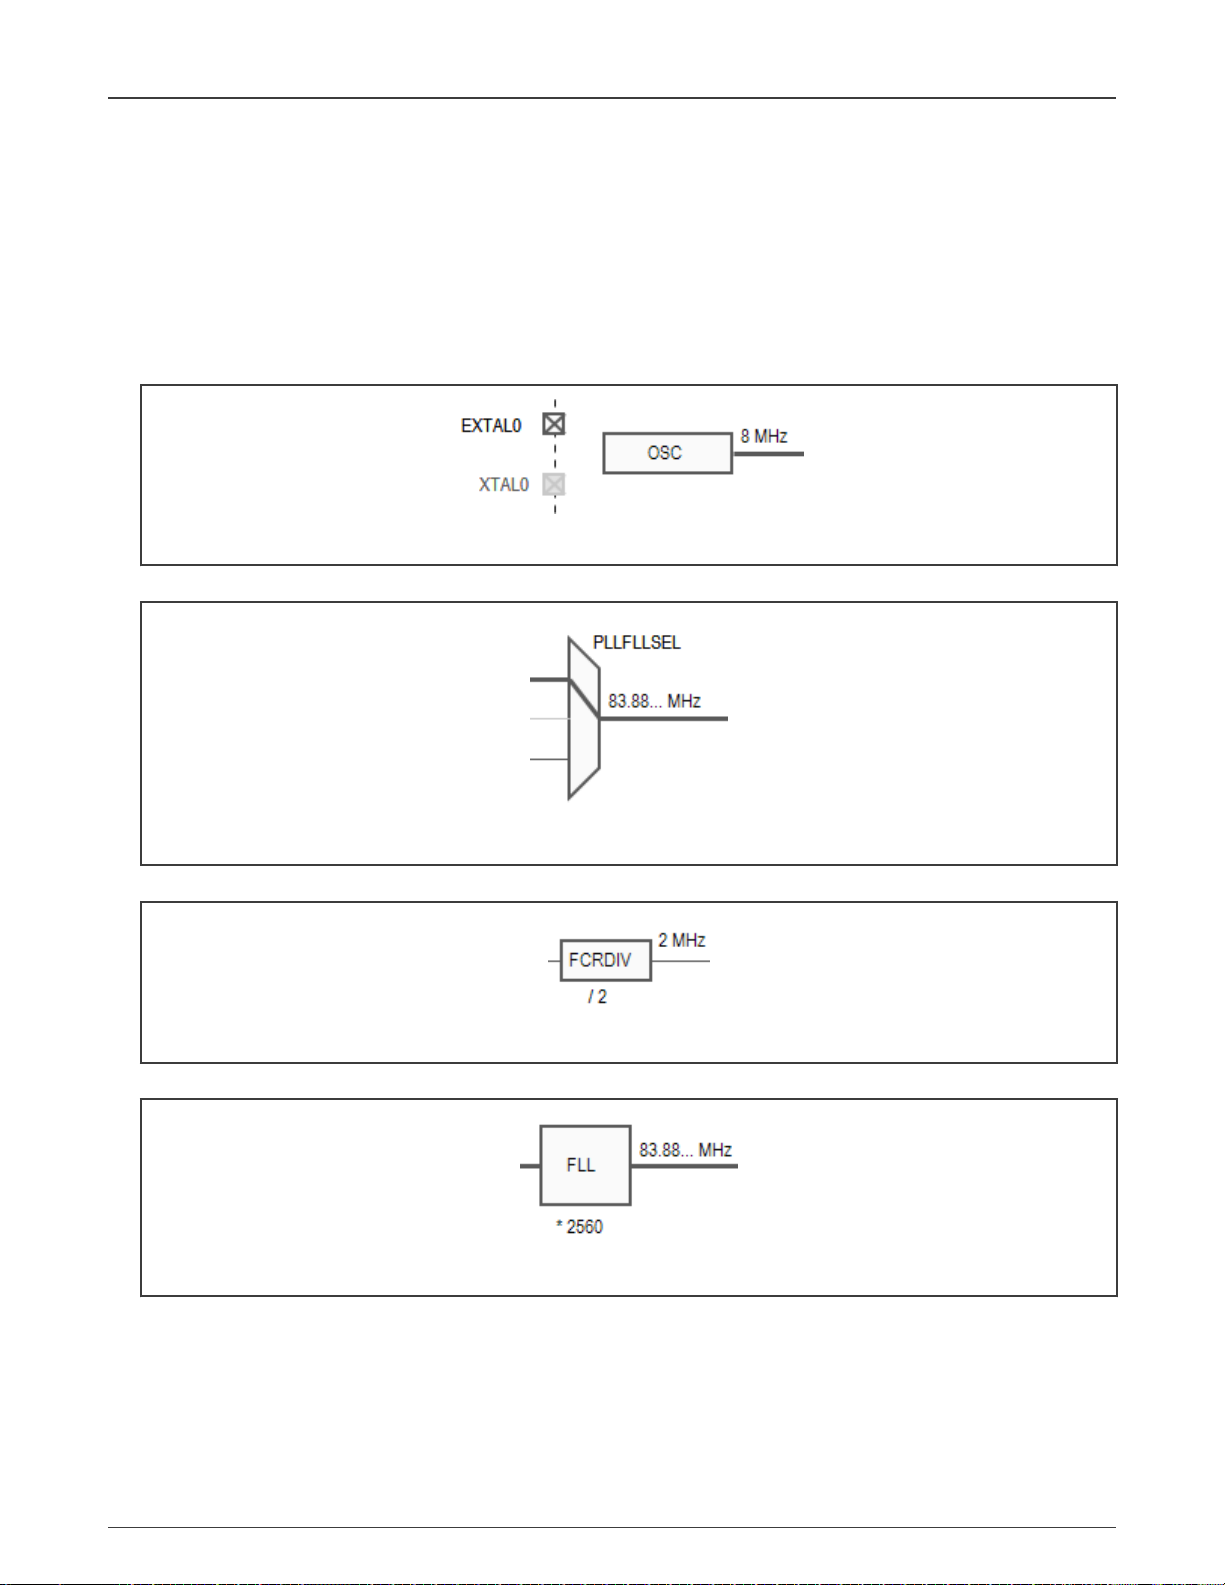
NXP Semiconductors
Clocks Tool
4.10.3 Clock model structure
The clock model consists of interconnected clock elements. The clock signal flows from the clock sources through various clock
elements to the clock outputs. The clock element can have specific enable conditions that can stop the signal from being passed
to the successor. The clock element can also have specific constraints and limits that are watched by the Clocks Tool. To inspect
these details, position the cursor on the element in the clock diagram to display the tooltip.
The following are the clock model elements.
• Clock source – Produces a clock signal of a specified frequency. If it's an external clock source, it can have one or more
related pins.
Figure 74. Clock source
• Clocks selector (multiplexer) – Selects one input from multiple inputs and passes the signal to the output.
Figure 75. Clocks selector
• Prescaler – Divides or multiplies the frequency with a selectable or fixed ratio.
Figure 76. Prescaler
• Frequency Locked Loop (FLL) – Multiplies an input frequency with given factor.
Figure 77. Frequency Locked Loop
• Phase Locked Loop (PLL) – Contains pre-divider and thus is able to divide/multiply with a given value.
MCUXpresso Config Tools User's Guide (IDE), Rev. 0, 1/2021
User's Guide 61 / 136
Page 62

NXP Semiconductors
Clocks Tool
Figure 78. Phase Locaked Loop
• Clock gate – Stops the propagation of incoming signal.
• Clock output – Marks the clock signal output that has some name and can be further used by the peripherals or other parts
of the processor. You can put a lock and/or frequency request.
Figure 79. Clock output
• Clock component – Group of clock elements surrounded with a border. The clock component can have one or more outputs.
The clock component usually corresponds to the processor modules or peripherals. The component output may behave like
clock gates, allowing or preventing the signal flow out of the component.
Figure 80. Clock component
• Configuration element – Additional setting of an element. Configuration elements do not have graphical representation in the
diagram. They are shown in the setting table for the element or the clock path the element is on.
4.11 Clocks menu
Options related to the Clocks tool can be found in the Clocks menu in the Menu bar.
Table 17. Clocks menu
Menu item Description
Functional groups Open the Functional group properties dialog.
Refresh Refresh each clocks configuration with explicit invocation of code generation.
Reset To Board Defaults Reset the clock model to board defaults.
Reset To Processor Defaults Resets the clock model ito processor defaults.
Unlock All Settings Unlocks all locks in all settings.
Unlock Settings on the Active Path Unlocks all locks in the settings that are on the active path.
4.12 Troubleshooting problems
It's possible that problems or conflicts occur while working with the Clocks Tool. Such problems and the overall status are indicated
in red on the central status bar of the Clocks Tool. The status bar displays global information on the reported problem.
MCUXpresso Config Tools User's Guide (IDE), Rev. 0, 1/2021
User's Guide 62 / 136
Page 63

NXP Semiconductors
Clocks Tool
You may encounter any of the following problems:
1. Requirement(s) not satisfiable: Indicates that there are one or more locked frequency or frequency constraints for which
the tool is not able to find a valid settings and satisfy those requirements.
2. Invalid settings or requirements: [
element list
] – Indicates that the value of a settings is not valid. For example: The current
state of settings is beyond the acceptable range.
The following are some tips to troubleshoot encountered problems.
1. Find the elements and settings with marked errors in the diagram or tables and see the details in the tooltip.
2. Start with only one locked frequency and let the tool find and calculate other ones. After you are successful you can
add more.
3. Go through the locked outputs, if there are any, and verify the requirements (possible errors in the required frequency,
wrong units, and so on).
4. If you are OK to have a near around of the requested value, right-click and from the pop-up menu select Clock output > Find
near value.
5. If you cannot reach the values you need, see the clock paths leading to the clock output you want to adjust and check the
selectors if it's possible to switch to another source of clock.
6. Try to remove locks by selecting Clocks > Unlock All Settings. In case many changes are required, you can simply reset
the model to the default values and start from the beginning. To reset, select Clocks > Reset to processor defaults.
You can resolve most of the reported problems using the Problems view. Each problem is listed as a separate row. The following
options appear when you right-click on a selected row in the Problems view.
• Show problem - Shows the problem in the Clocks Diagram view If one the solutions are possible then the pop up is
extended by:
— Remove lock - Removes the lock from erroneous element.
— Find Near value - Finds the nearest value.
Figure 81. Find Near Value Dialog
◦ Unlock settings active path and try again - unlocks all elements that lead to selected output and tries to recompute.
◦ Unlock settings and try again - unlocks all locked values and tries to recompute. If automatic value computation fails,
nothing will be changed.
◦ Cancel - cancels the modifications.
4.13 Code generation
If the settings are correct and no error is reported, the tool’s code generation engine instantly re-generates the source code. The
resulting code is found in the Code Preview view.
Code Preview automatically highlights differences between the current and immediately preceding iteration of the code. You
can choose between two modes of highlighting by clicking the Set viewing style for source differences. You can also disable
highlighting altogether from the same dropdown menu.
MCUXpresso Config Tools User's Guide (IDE), Rev. 0, 1/2021
User's Guide 63 / 136
Page 64

NXP Semiconductors
Clocks Tool
Figure 82. Code Preview
4.13.1 Working with the code
The generated code is aligned with the SDK. To use the code with the SDK project it's necessary to transfer the code into your
project structure.
To transfer the code into your project, do the following in the Code Preview:
• Copy the content using the COPY command, either by pressing the CTRL+C keys or the pop-up menu after the whole text
is selected.
• Use export command.
• Click the Export button in Code Preview view.
• Click Update Code in the toolbar.
4.14 Clock Consumers view
The Clock Consumers view provides an overview of peripheral instances. It also provides information on clock-clock instance
pairing. This view is not editable and is for information only.
MCUXpresso Config Tools User's Guide (IDE), Rev. 0, 1/2021
User's Guide 64 / 136
Page 65

NXP Semiconductors
Information about which peripherals are consuming which output clock is available in the clock output tooltip.
NOTE
Clocks Tool
Figure 83. Clock Consumers view
MCUXpresso Config Tools User's Guide (IDE), Rev. 0, 1/2021
User's Guide 65 / 136
Page 66

NXP Semiconductors
Chapter 5
Peripherals Tool
5.1 Features
The Peripherals tool features:
• Configuration of initialization for SDK drivers
• User friendly user interface allowing to inspect and modify settings
• Smart configuration component selection along the SDK drivers used in toolchain project
• Instant validation of basic constraints and problems in configuration
• Generation of initialization source code using SDK function calls
• Multiple functional-group support for initialization alternatives
• Configuration problems are shown in the Problems view and marked with decorators in other views
• Integration in MCUXpresso Config Tools framework along with other tools
• Middleware configuration support (USB)
5.2 Basic terms and definitions
Table 18. Terms and definitions
Term Definition
Functional group Represents a group of peripherals that are initialized as a group. The tool generates
a C function for each functional group that contains the initialization code for the
peripheral instances in this group. Only one functional group can be selected as default
initialization, the others are treated as alternatives that are not initialized by default.
Peripheral instance Occurrence of a peripheral (device) of specific type. For example, UART peripheral
has three instances on the selected processor, so there are UART0, UART1 and
UART2 devices.
Configuration component Provides user interface for configuring SDK software component (for example,
peripheral driver) and generates code for its initialization.
Component instance Configuration component can have multiple instances with different settings. (for
example, for each peripheral instance like UART0, UART1).
Component mode Specific use-case of the component instance (for example, TRANSFER mode of DSPI,
or interrupt-based mode of communication.
5.3 Workflow
The following steps briefly describe the basic workflow in the Peripherals tool.
1. In the Peripherals view, select the peripheral instance you would like to configure (use the checkbox).
2. In case more components are available for use by the peripheral, the Select component dialog appears. The dialog
displays the list of suitable configuration components for the selected peripheral matching the SDK driver for the
selected processor.
3. Select the component you want to use and click OK.
MCUXpresso Config Tools User's Guide (IDE), Rev. 0, 1/2021
User's Guide 66 / 136
Page 67

NXP Semiconductors
Peripherals Tool
4. In the settings editor that automatically opens, select the Component mode that you would like to use and configure
individual settings.
NOTE
The selection of the component mode may impact appearance of some settings. Therefore, the selection of the
mode should be always the first step.
5. Open the Code Preview and see the output source code.
NOTE
Note: The source code preview is automatically generated after each change if no error is reported.
6. You can use the Update Code button from the toolbar. Alternatively, you can export the source code by selecting
File>Export... from the Menu bar.
NOTE
Note: To export the source code, you can also click the Export button in the Code Preview view.
7. Settings can be saved in a MEX format (used for all settings of all tools) by selecting File>Save from the Menu bar.
5.4 User interface
Figure 84. User interface
Figure 85. Peripheral view
Figure 86. Components view
MCUXpresso Config Tools User's Guide (IDE), Rev. 0, 1/2021
User's Guide 67 / 136
Page 68

NXP Semiconductors
Peripherals Tool
5.4.1 Toolbar (Peripherals)
In addition to general items available to all tools, the Toolbar of the Peripherals tool contains additional items unique to it:
Table 19. Toolbar
Item Description
Global settings Open a tab aggregating global settings of all configuration sets.
Initialization order Open a dialog for customization of peripheral initialization order.
NOTE
For details on other items, refer to the Toolbar chapter.
5.4.1.1 Object Missing
This object is not available in the repository.
5.4.2 Components view
The components view shows a list of configuration components, sorted by category into groups such as Middleware, Peripheral
drivers and others.
The view highlights configuration components based on their status.
Table 20. Component status
Status Color highlighting
Enabled Light gray.
Enabled/with warning Light gray with the alert symbol.
Table continues on the next page...
MCUXpresso Config Tools User's Guide (IDE), Rev. 0, 1/2021
User's Guide 68 / 136
Page 69

NXP Semiconductors
Table 20. Component status (continued)
Status Color highlighting
Enabled/with error Red with the error symbol.
Disabled Dark gray.
Peripherals Tool
Figure 87. Components view
In the Components view, you can perform several actions.
Table 21. Components view actions
Display configuration-component information Point the mouse cursor at the configuration component to
display general configuration-component information.
Open the Settings Editor of the configuration component Left-click the configuration component to open its
Settings Editor.
Add new configuration components Left-click the + button and select from the list to add a
new component. In the Select component dialog, you can
filter the list to show only toolchain-project-relevant, or latest
version components. You can also click the + buttons next
to Middleware/Peripheral drivers/Other categories to add new
components in them directly.
Table continues on the next page...
MCUXpresso Config Tools User's Guide (IDE), Rev. 0, 1/2021
User's Guide 69 / 136
Page 70

NXP Semiconductors
Peripherals Tool
Table 21. Components view actions (continued)
Filter configuration components by name Type a text string to filter configuration component names in the
search bar.
Right-click the the configuration component to open a shortcut menu. Several options are available in the shortcut menu.
Table 22. Shortcut menu options
Option Description
Open Open the configuration component in the Settings Editor.
Open in another view Duplicates the configuration component in the Settings Editor.
Edit comment Create/Edit custom notes for the configuration component.
Lock/Unlock editing of component instance Lock/Unlock the editing of the component instance.
Documentation Display the documentation of the configuration component, if available.
Remove Remove the component from configuration.
NOTE
If the component has any global settings, a dialog
appears prompting you to confirm the removal. If
the component doesn't have any global settings,
the component is deleted after removing the
last instance.
Migrate Migrate the component to a different component type or to a
component with a newer driver version.
Enable/Disable Enable/Disable the configuration component
Move to Choose from available functional groups to move the configuration
component to.
Copy to Choose from available functional groups to copy the configuration
component to.
MCUXpresso Config Tools User's Guide (IDE), Rev. 0, 1/2021
User's Guide 70 / 136
Page 71

NXP Semiconductors
Peripherals Tool
5.4.3 Peripherals view
The Peripherals view contains a table showing a list of available peripherals on the currently selected processor that can be
configured by the Peripherals tool. In case of multicore processors, the displayed peripherals are also core-specific.
Each instance of a peripheral (for example, UART0) occupies one row. First column contains peripheral name and a checkbox
indicating whether the peripheral is used by any component instance.
Second column contains a name of component instance handling the peripheral. This name is customizable in the settings editor
and it is used in generated code. The name of the component instance can't contain spaces.
You can enable an instance by selecting the checkbox, or by clicking the switch in the settings editor of the component instance.
Disable a component instance by deselecting it.
Double-click on the second column to open the Settings Editor for the component instance.
Right-click the the peripheral to open a shortcut menu. Several options are available in the shortcut menu.
Table 23. Shortcut menu options
Option Description
Open Open the component instance in the Settings Editor.
Open in another view Duplicate the component instance in the Settings Editor.
Add Add a component instance to the peripheral.
Edit comment Create/Edit custom notes for the component instance.
Lock/Unlock editing of component instance Lock/Unlock the editing of the component instance.
Documentation Display the documentation of the component instance, if available.
Remove Remove the component instance from configuration. If more instances
are in use, a confirmation window will allow you to select which
instance you want to remove.
Migrate Migrate the component to a different component type or to a
component with a newer driver version.
Enable/Disable Enable/Disable the component instance.
Move to Choose from available functional groups to move the component
instance to.
Copy to Choose from available functional groups to copy the component
instance to.
Initialized in user code
Mark the peripheral as configured by user code (available on not
configured peripherals).
5.4.4 Settings Editor
You can edit peripheral component settings in the Settings Editor. Open editors are shown in the central area of the screen,
each with its own tab. Multiple editors can be opened at the same time. Changes done in the editor are immediately applied and
kept even if the settings editor is closed. Settings that are disabled are highlighted in gray. In case that a component instance
is disabled, all settings are highlighted in gray. Tooltips are displayed for all enabled settings when the mouse cursor is placed
at settings.
To open Settings Editor, do the following:
• Double-click the component instance in the Peripherals or Components view to display component instance settings.
• Left-click the component in the Components view to display global settings of the component.
MCUXpresso Config Tools User's Guide (IDE), Rev. 0, 1/2021
User's Guide 71 / 136
Page 72

NXP Semiconductors
Peripherals Tool
5.4.4.1 Quick selections
Settings are grouped to larger groups (config sets) that may provide presets with typical values. You can use these presets to
quickly set the desired typical combination of settings or return to the default state.
Figure 88. Quick selection example
5.4.4.2 Settings
Following setting types are available in the Settings Editor
• Boolean – Two state setting (yes/no, true/false).
Figure 89. Boolean setting example
• Integer, Float – Integer or float number.
Figure 90. Integer/Float setting example
• String – Textual input. More than a single entry can be supported.
Figure 91. String setting example
• Enumeration – Selection of one item from list of values.
MCUXpresso Config Tools User's Guide (IDE), Rev. 0, 1/2021
User's Guide 72 / 136
Page 73

NXP Semiconductors
Peripherals Tool
Figure 92. Enumeration setting example
• Set – List of values, multiple of them can be selected.
Figure 93. Set setting example
• Structure – Group of multiple settings of different types, may contain settings of any type including nested structures.
Figure 94. Structure setting example
• Array – Array of multiple settings of same type – you can add/remove items. The array of simple structures may also be
represented as a table grid, master-detail, and as radio buttons.
Figure 95. Array
The ‘+’ button adds a new item at the end of array. To rearrange the position or delete an item, right-click the item and select
one of the following options: Move up, Move down, Move to top, Move to bottom, or Remove. You can also copy-paste an array
from one instance to another by right-clicking the array label and choosing Copy. You can then navigate to another instance
array, right-click the table and choose Paste to add it.
NOTE
System clipboard is not used for this purpose.
MCUXpresso Config Tools User's Guide (IDE), Rev. 0, 1/2021
User's Guide 73 / 136
Page 74

NXP Semiconductors
Figure 96. Array setting example
• Info – Read-only information for the user.
Figure 97. Array setting example
• File setting - Link/import an external settings file.
Peripherals Tool
5.4.4.3 Settings Editor header
All components share the Settings Editor header. In the header, you can view and change component information, enable or
disable the component, and view component documentation (where applicable).
Figure 98. Settings Editor header
Table 24. Settings Editor header
Header item Description
Description Displays the configuration component title.
Name Displays the component instance name. This name is used in the
generated code in constants and function identifiers and is derived from
the peripheral name. You can change it at any time by clicking the Custom
name button and editing the field.
Mode Displays the required usage for the component instance and influences
available settings. Use the dropdown menu to change the mode
(where applicable).
Peripheral Displays the name of the peripheral to be associated with the component
instance. Use the dropdown menu to change it.
Documentation Click the button to view configuration component-specific documentation
in the Documentation view. Note that not all configuration components
are documented, therefore not all setting headers contain the
Documentation icon.
Table continues on the next page...
MCUXpresso Config Tools User's Guide (IDE), Rev. 0, 1/2021
User's Guide 74 / 136
Page 75

NXP Semiconductors
Peripherals Tool
Table 24. Settings Editor header (continued)
Header item Description
Lock editing Click the button to lock/unlock component editing. Source code will still
be generated.
Enable/disable component instance switch Use the switch to enable or disable selected component instance. Note that
by disabling the instance, you don’t remove it from the tools configuration,
but prevent its inclusion in the generated code.
5.4.5 Documentation view
You can display component-specific documentation by opening the Documentation view.
NOTE
Not all components might have this option enabled.
Figure 99. Documentation view
MCUXpresso Config Tools User's Guide (IDE), Rev. 0, 1/2021
User's Guide 75 / 136
Page 76

NXP Semiconductors
Peripherals Tool
You can open the Documentation view in several ways:
• In the Peripherals view, right-click the peripheral checkbox and choose Documentation from the list.
• In the Components view, right-click the component and choose Documentation from the list.
• In the Settings Editor, click the Documentation button next to component name.
• In the Settings Editor, click the question mark next to the settings label.
5.5 SEMC Validation tool
If you are developing hardware with external memory, you can validate the memory settings with the Memory Validation tool. The
tool is available for all SEMC, FlexSPI/NOR, and FCB peripherals and can be used after selecting these peripheral from the list
in the Peripherals view.
Click the Validation button in the Settings Editor to open the Validation view and run validation scenarios for SEMC
memory settings.
NOTE
The Memory Validation tool requires Python 2.7 to run. You must manually install the latest Python 2.7 from
https://www.python.org/downloads and make sure arm-none-eabi-gdb-py starts without error. It's possible that
Windows requires that python27.dll is installed.
Should the settings prove valid, you can click the Sync with DCD button to synchronize the memory settings with the DCD tool.
You need to manually update the existing sdram configuration from the DCD tool with the one generated by clicking Apply to DCD.
Also, if a configuration is not defined in the DCD tool, the configuration generated by clicking Apply to DCD will not work as it is,
and additional configuration will need to be added in the Clocks or Pins tools.
5.5.1 Validation view
Use the Validation view to run validation scenarios for your memory settings and analyse the results. You can choose scenarios,
tests to run in these scenarios, and view the test results, logs, and summary.
To run validation tests, do the following:
1. Select the correct connection type and COM port in the Connections area. Alternatively, scan for available COM ports by
clicking the Scan for available COM ports button.
2. Choose a scenario you wish to test in the Scenarios sub-view.
a. To test the Phy configuration:
i. Select Firmware Init > Firmware Init test.
b. To perform a basic memory check by running Write-Read-Compare/Walking Ones/Walking Zeros:
i. Select Operational > Operational tests.
ii. Select Choose Tests.
iii. Select the tests to perform and set the test parameters.
c. To run stress tests:
i. Select Stress Tests > Stress tests.
ii. Select Choose Tests and set the test parameters.
d. To run diags tests:
i. Select Diags and choose between Diags margin state/Diag Write Margin/Diag Read Margin.
ii. Select Choose Tests and set the test parameters.
3. To start validation, click the Start Validation button.
4. Observe the results in real-time in the Results sub-view.
MCUXpresso Config Tools User's Guide (IDE), Rev. 0, 1/2021
User's Guide 76 / 136
Page 77

NXP Semiconductors
Peripherals Tool
5. Inspect the results in the Summary and Logs sub-views.
6. View the U-boot-compatible code in Core Preview. You can export the generated code for importing into U-boot by selecting
the Export button.
7. Download DDRV reports using the Configure and generate DDRV reports button.
5.6 Problems
The tool validates the settings and problems and errors are reported in the Problems view.
If there is an error related to the setting or component an error decorator is shown next to the element containing an error.
Figure 100. Error decorators
In the case of a dependency error, a quick-fix button is displayed.
Figure 101. Quick fix 1
Right-click the button to display a list of issues, then left-click the issue to display possible solutions.
Figure 102. Quick fix 2
5.7 Code generation
If the settings are correct and no error is reported, the tool’s code generation engine instantly re-generates the source code. You
can view the resulting code the Code Preview view of the Peripherals tool.
Code Preview automatically highlights differences between the current and immediately preceding iteration of the code. You
can choose between two modes of highlighting by clicking the Set viewing style for source differences. You can also disable
highlighting altogether from the same dropdown menu.
The Peripherals tool produces the following C files:
• peripherals.c
• peripherals.h
NOTE
For multicore processors the peripherals.c/.h are generated for each core, containing functional groups associated
with that core. This can be configured in functional group properties.
MCUXpresso Config Tools User's Guide (IDE), Rev. 0, 1/2021
User's Guide 77 / 136
Page 78

NXP Semiconductors
Peripherals Tool
NOTE
Some components, such as the USB or FlexSPI, may generate additional output files.
These files contain initialization code for peripherals produced by selected configuration components including:
• Constants and functions declaration in header file.
• Initialized configuration structures variables (constants).
• Global variables for the user application that are used in the initialization. For example, handles and buffers.
• Initialization function for each configuration component.
• Initialization function for each functional group. The name of the function is the same as the functional group name. These
functions include execution of all assigned components’ initialization functions.
• Default initialization function containing call to the function initializing the selected functional group of peripherals.
NOTE
The prefixes of the global definitions (defines, constants, variables and functions) can be configured in the
Properties of the functional group.
MCUXpresso Config Tools User's Guide (IDE), Rev. 0, 1/2021
User's Guide 78 / 136
Page 79

NXP Semiconductors
Peripherals Tool
Figure 103. Code Preview
MCUXpresso Config Tools User's Guide (IDE), Rev. 0, 1/2021
User's Guide 79 / 136
Page 80

NXP Semiconductors
Chapter 6
Device Configuration Tool
Device Configuration tool allows you to configure the initialization of memory interfaces of your hardware. Use the Device
Configuration Data (DCD) view to create different types of commands and specify their sequence, define their address, values,
sizes, and polls.
Figure 104. Device Configuration tool
6.1 Device Configuration Data (DCD) view
The Device Configuration Data (DCD) view displays memory initialization commands of your currently active configuration. Here,
you can create new command groups and commands and specify their parameters.
Commands in the Device Configuration Data (DCD) can be synchronised from the SEMC Validation tool in the Peripherals tool.
6.1.1 Device Configuration Data (DCD) view actions
The following is a list of command and command group-relevant actions you can perform in the Device Configuration Data
(DCD) view:
• Create a new command group - Right-click the table and choose Add Group from the context menu.
• Re/Name a command group - Left-click the command group cell and enter the required name.
• Disable a command group - Right-click the command group row and choose Disable Group from the context menu.
• Remove a command group - Right-click the command group row and choose Remove Group from the context menu.
• Collapse all command groups - Right-click the the table and choose Collapse All Groups from the context menu.
• Expand all command groups - Right-click the table and choose Expand All Groups from the context menu.
MCUXpresso Config Tools User's Guide (IDE), Rev. 0, 1/2021
User's Guide 80 / 136
Page 81

NXP Semiconductors
Device Configuration Tool
• Add a command to a group - Right-click the table and choose Add Command from the context menu. Alternatively, click the
Add Command button in the tool's toolbar.
• Specify command type - Left-click the row's Command cell and choose from the dropdown menu.
• Specify register address for a command - Left-click the row's Address cell and choose from the dropdown menu.
• Specify a value or a mask for a command - Left-click the row's Value(s) / Mask(s) cell to open the mask window. Enter the
value into the field and select OK. Alternatively, select Cancel to cancel the operation, or Reset to reset the value.
Figure 105. Mask
• Specify the size of write/read data for a command - Left-click the row's Size cell and choose from the dropdown menu.
• Specify the number of polls of a command - Left-click the row's Poll cell and enter the required value.
• Add a comment to a command - Left-click the row's Comment cell.
• Remove a command - Right-click the command row and choose Remove Command from the context menu. Alternatively,
click the Remove Command button in the tool's toolbar.
• Cut a command - Right-click the command row and choose Cut from the context menu.
• Copy a command - Right-click the command row and choose Copy from the context menu.
• Paste a command - Right-click the command row and choose Paste from the context menu.
NOTE
You can remove all commands by clicking Device Configuration in the Menu bar and choosing Clear All Commands
from the dropdown menu.
Basic cell selection shortcuts are applicable.
• Select additional commands - Ctrl+Left-click the command row.
MCUXpresso Config Tools User's Guide (IDE), Rev. 0, 1/2021
User's Guide 81 / 136
Page 82

NXP Semiconductors
Device Configuration Tool
6.2 Code generation
If the settings are correct and no error is reported, the code generation engine instantly re-generates the source code. You can
view the resulting code the Code Preview view of the Device Configuration tool.
Code Preview automatically highlights differences between the current and immediately preceding iteration of the code. You
can choose between two modes of highlighting by clicking the Set viewing style for source differences. You can also disable
highlighting altogether from the same dropdown menu.
Device Configuration source code can be generated in a C array (default) or binary format.
The code in a C array format is generated in two files:
• dcd.c
• dcd.h
The code in a binary format is generated in a single file:
• dcd.bin
To change the code format, choose the required option from the dropdown menu in the Device Configuration Data (DCD) view.
Figure 106. Code Preview
MCUXpresso Config Tools User's Guide (IDE), Rev. 0, 1/2021
User's Guide 82 / 136
Page 83

NXP Semiconductors
Chapter 7
Trusted Execution Environment Tool
In the Trusted Execution Environment, or TEE tool, you can configure security policies of memory areas, bus masters, and
peripherals, in order to isolate and safeguard sensitive areas of your application.
You can set security policies of different parts of your application in the Security Access Configuration and its sub-views, and
review these policies in the Memory Attribution Map, Access Overview. and Domains Overview views. Use the User Memory
Regions view to create a convenient overview of memory regions and their security levels.
You can also view registers handled by the TEE tool in the Registers view, and inspect the code in the Code Preview tool.
NOTE
In order for your configuration to come into effect, make sure you have enabled the relevant enable secure check
option in the Miscellaneous sub-view of the Security Access Configuration view.
Figure 107. TEE tool user interface (SAU+IDAU)
MCUXpresso Config Tools User's Guide (IDE), Rev. 0, 1/2021
User's Guide 83 / 136
Page 84

NXP Semiconductors
Trusted Execution Environment Tool
Figure 108. TEE tool user interface (RDC)
7.1 AHB with security extension-enabled devices
The features and appearance of the TEE tool are based on the security model of the loaded device.
This section describes the features and appearance of the tool for devices with ARM TrustZone and AHB with security extension
Currently, following devices of this type are supported:
• LPC55Sxx
— LPC55S69, LPC55S66
— LPC55S16, LPC55S14
— LPC55S06, LPC55S04
• RT6xx, RT5xx
— MIMXRT685S, MIMXRT633S
— MIMXRT595S, MIMXRT555S, MIMXRT533S
NOTE
Pre-production only.
7.1.1 User Memory Regions view
In the User Memory Regions view, you can create and maintain a high-level configuration of memory regions and their security
levels. You can create the regions, name them, specify their address, size, security level, and provide them with a description. You
can then fix any errors in the settings with the help of the Problems view.
Create a new memory region by clicking the Add new memory region button in the view's header.
Enter/change the memory region's parameters by clicking the row's cells. In the Security Level column, you have these options
to choose from:
MCUXpresso Config Tools User's Guide (IDE), Rev. 0, 1/2021
User's Guide 84 / 136
Page 85

NXP Semiconductors
Trusted Execution Environment Tool
• NS-User - Non-secure user
• NS-Priv - Non-secure privileged
• S-User - Secure user
• S-Priv - Secure privileged
• NSC-User - Non-secure callable user
• NSC-Priv - Non-secure callable privileged
• Any
Errors in configuration are highlighted by a red icon in the relevant cell. In the case the issue is easily fixed, you can right-click the
cell to display a dropdown list of offered solutions.
Remove the memory region by selecting the table row and clicking the Remove selected memory region(s) button in the
view's header.
MCUXpresso Config Tools User's Guide (IDE), Rev. 0, 1/2021
User's Guide 85 / 136
Page 86

NXP Semiconductors
Trusted Execution Environment Tool
Figure 109. User Memory Regions
MCUXpresso Config Tools User's Guide (IDE), Rev. 0, 1/2021
User's Guide 86 / 136
Page 87
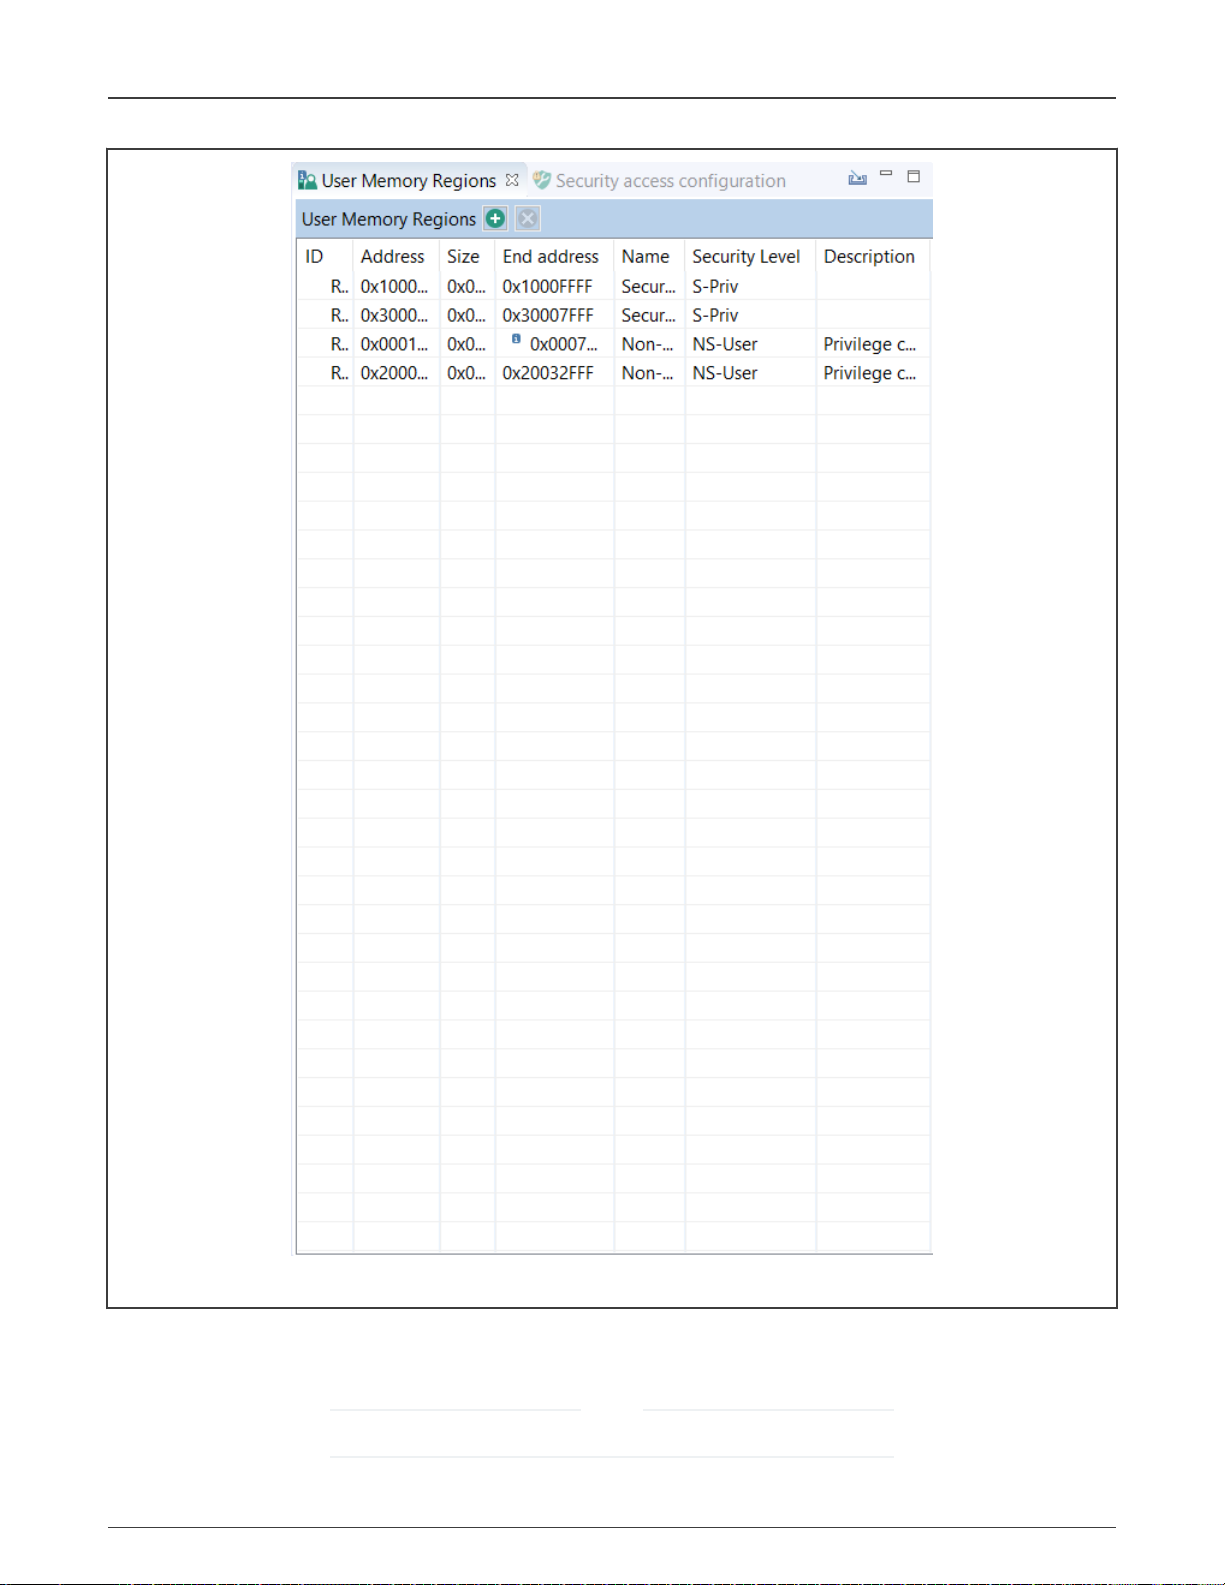
NXP Semiconductors
Trusted Execution Environment Tool
Figure 110. User Memory Regions
You can import memory region configuration from other IDE projects by clicking the Import memory regions configuration from the
IDE project(s) button in the view toolbar. Select the project you want from the list to import its memory regions settings into your
current project.
NOTE
After the import, you might have to correct some of the security levels manually.
MCUXpresso Config Tools User's Guide (IDE), Rev. 0, 1/2021
User's Guide 87 / 136
Page 88
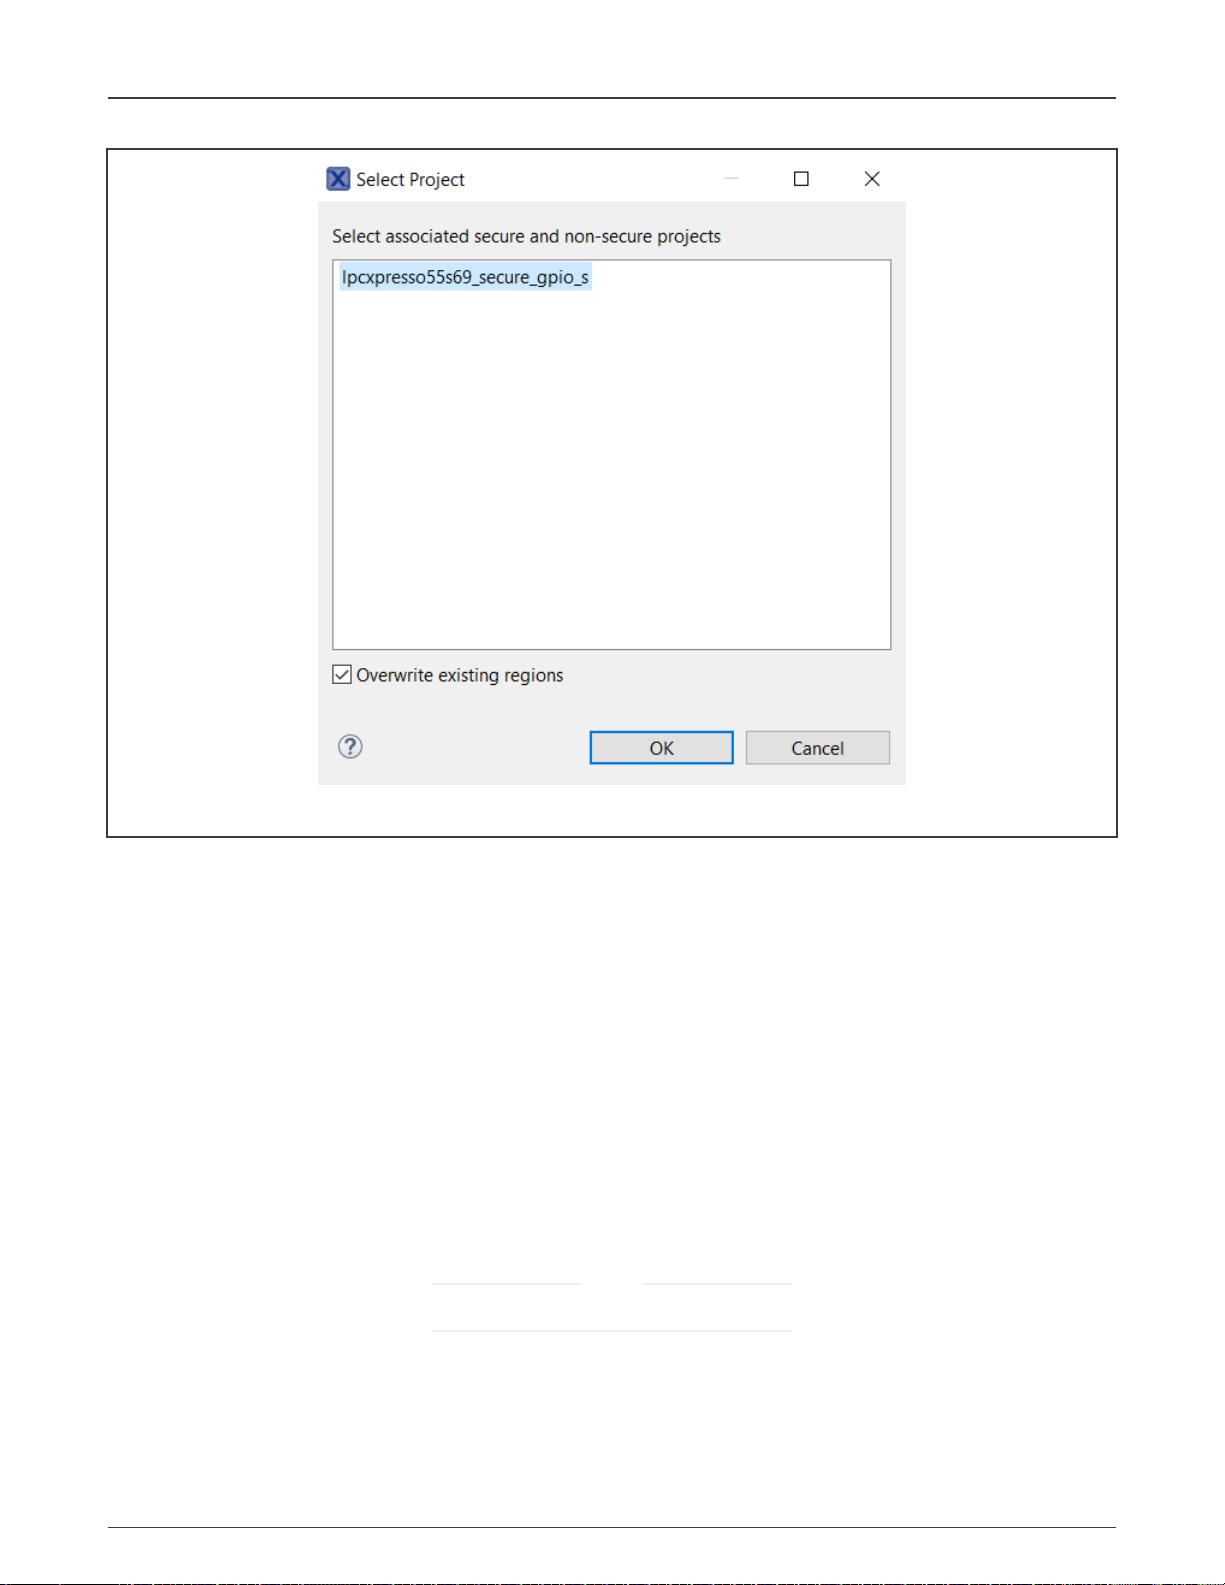
NXP Semiconductors
Trusted Execution Environment Tool
Figure 111. Select Project
7.1.2 Security Access Configuration view
In the Security Access Configuration view, you can configure your application's security policies in a number of ways. See the
following sections for more details.
7.1.2.1 SAU
In the SAU sub-view, you can enable and configure SAU (Security attribution unit).
When enabled, you can set up SAU memory regions, specify their start and size or end address, and specify their security level.
SAU automatically sets the entire memory space to a secure severity level when disabled. It also sets the entire memory space
to a secure security level when enabled but without set memory regions.
You can choose between two security levels:
• NS - Non-secure
• NSC - Non-secure callable
Alternatively, you can set all the SAU memory regions to non-secure security level by selecting the All Non-Secure.
NOTE
This option is only available when SAU is disabled.
You can also decide to generate code even for disabled memory regions by selecting the option Generate sources for
disabled regions.
MCUXpresso Config Tools User's Guide (IDE), Rev. 0, 1/2021
User's Guide 88 / 136
Page 89

NXP Semiconductors
Trusted Execution Environment Tool
Figure 112. SAU/IDAU
7.1.2.2 Interrupts
In the Interrupts sub-view, you can set security designation for device's peripheral interrupts. In case that the processor contains
more than a single core or processing unit, additional Handling by Core tables might appear. In these tables, you can specify if
the interrupts coming from the peripheral can be handled by the core or processing unit.
All interrupts are set to Secure by default. If you want to change the interrupt source's security designation, left-click the Secure cell
of the interrupt and choose from the dropdown menu. Alternatively, right-click the interrupt's Name cell and choose the security
designation from the context menu. To select multiple entries, use the Ctrl+Left-click shortcut, then right-click the selected area
for the context menu.
MCUXpresso Config Tools User's Guide (IDE), Rev. 0, 1/2021
User's Guide 89 / 136
Page 90

NXP Semiconductors
Trusted Execution Environment Tool
Figure 113. Interrupts
7.1.2.3 Secure/Non-secure MPU
In the Secure MPU and Non-secure MPU sub-views, you can enable and configure MPU (Memory Protection Unit). You can
create regions, specify their address, size, and other parameters. Use the Secure MPU sub-view for the configuration of the
secure, and Non-secure MPU for the configuration of the non-secure security level.
MCUXpresso Config Tools User's Guide (IDE), Rev. 0, 1/2021
User's Guide 90 / 136
Page 91

NXP Semiconductors
Trusted Execution Environment Tool
Figure 114. MPU
MPU is disabled by default and must be enabled by selecting the Enable MPU option.
NOTE
Not every device supports MPU.
MCUXpresso Config Tools User's Guide (IDE), Rev. 0, 1/2021
User's Guide 91 / 136
Page 92

NXP Semiconductors
Trusted Execution Environment Tool
Use the MPU Memory Attributes table to name and configure MPU memory attribute sets. Click the cells of the Memory Type and
Device Attributes columns to display the available choices.
Use the MPU Memory Regions table to enable and configure MPU memory regions.
1. Enable the region.
2. Specify the Address.
3. Specify either the Size or the End Address.
4. Set the Exec option if you want the region to be able to run code.
5. Set the Permissions (Read Only or Read/Write).
6. Set the Privileges.
NOTE
Privileged access can be set by default for all memory regions not handled by MPU by selecting the Enable
privileged software access to the default memory map option.
7. Set the Shareability, or the caching options.
8. Allocate one of the sets from the MPU Memory Attributes table in Mem.Attr.. Sets can be allocated to more than one region.
7.1.2.4 MPC
In the MPC (Memory Protection Checker) sub-view, you can set security policies on entire memory sectors as defined by
physical addresses.
Set the memory sector security level by left-clicking the relevant cell in the Security level column and choosing from the dropdown
list. Alternatively, you can right-click the relevant cell in the Sector column and choose the security level from the context menu.
To select multiple entries, use the Ctrl+Left-click shortcut, then right-click the selected area for the context menu.
You have four security levels to choose from, in ascending order of security:
• NS-User - Non-secure user
• NS-Priv - Non-secure privileged
• S-User - Secure user
• S-Priv - Secure privileged
MCUXpresso Config Tools User's Guide (IDE), Rev. 0, 1/2021
User's Guide 92 / 136
Page 93

NXP Semiconductors
Trusted Execution Environment Tool
Figure 115. MPC
7.1.2.5 Masters/Slaves
In the Masters/Slaves sub-view, you can configure security levels for bus masters and slaves.
Set the bus master/slave security level by left-clicking the relevant cell in the Security level column and choosing from the
dropdown list. Alternatively, you can right-click the relevant cell in the Master and Slave column and choose from the security
MCUXpresso Config Tools User's Guide (IDE), Rev. 0, 1/2021
User's Guide 93 / 136
Page 94

NXP Semiconductors
Trusted Execution Environment Tool
level from the context menu. To select multiple entries, use the Ctrl+Left-click shortcut, then right-click the selected area for the
context menu.
You have four security levels to choose from, in ascending order of security:
• NS-User - Non-secure user
• NS-Priv - Non-secure privileged
• S-User - Secure user
• S-Priv - Secure privileged
You can further specify the interrelation between master and slave security levels by selecting the following options:
• Simple Master in Strict Mode - Select to allow simple bus master to read and write on same level only. De-select to allow to
read and write on same and lower level.
• Smart Master in Strict Mode - Select to allow smart bus master to execute, read, and write to memory at same level only.
De-select to allow to execute on same level only, read and write on same and lower level.
NOTE
Instruction-type bus master security level must be equal to bus slave security level. Data and others security level
must be equal or higher than bus slave security level.
MCUXpresso Config Tools User's Guide (IDE), Rev. 0, 1/2021
User's Guide 94 / 136
Page 95

NXP Semiconductors
Trusted Execution Environment Tool
Figure 116. Masters/Slaves
7.1.2.6 Pins
In the Pins sub-view, you can specify if the reading GPIO state is allowed or denied.
All pins' reading GPIO state is set to Allow by default. If you want to change the pins reading GPIO state, left-click the Reading
GPIO state cell of the pin and choose from the dropdown menu. Alternatively, right-click the pin's Name cell and choose the
MCUXpresso Config Tools User's Guide (IDE), Rev. 0, 1/2021
User's Guide 95 / 136
Page 96
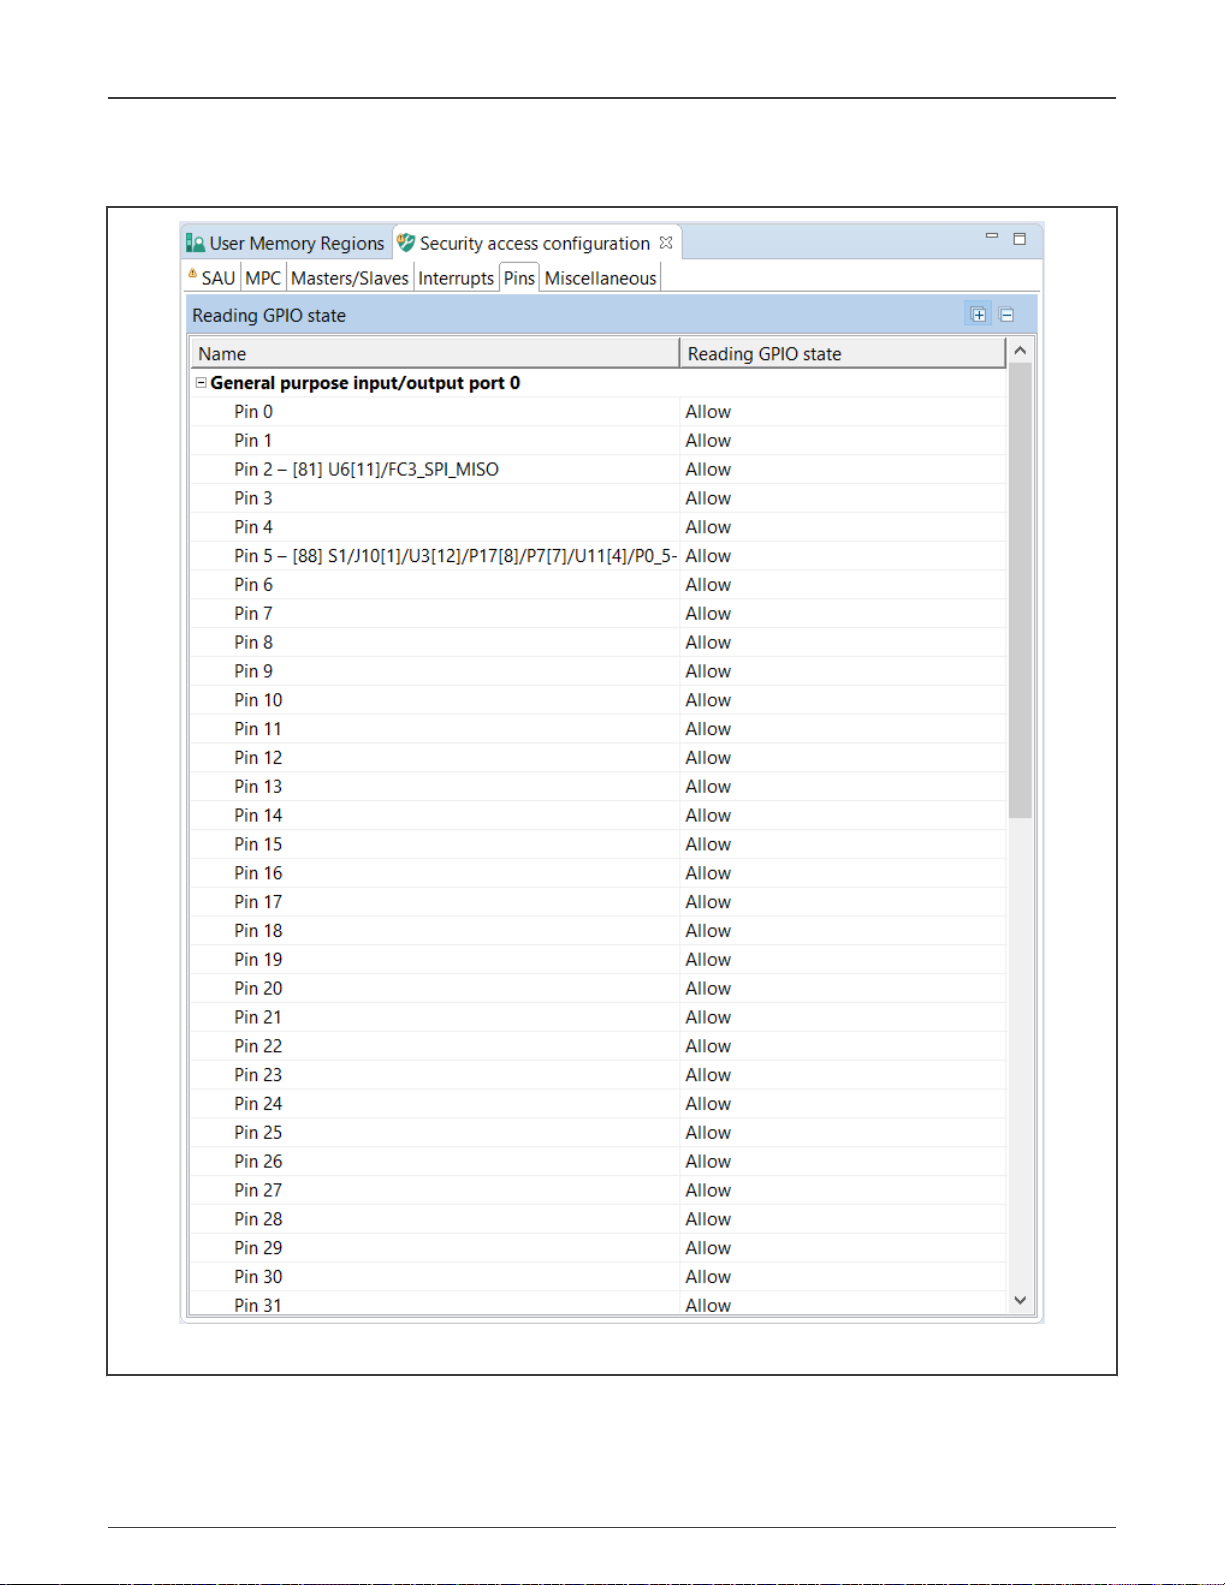
NXP Semiconductors
Trusted Execution Environment Tool
reading GPIO state from the context menu. To select multiple entries, use the Ctrl+Left-click shortcut, then right-click the selected
area for the context menu.
Figure 117. Pins
MCUXpresso Config Tools User's Guide (IDE), Rev. 0, 1/2021
User's Guide 96 / 136
Page 97

NXP Semiconductors
Trusted Execution Environment Tool
7.1.2.7 Miscellaneous
In the Miscellaneous sub-view, you can set various configuration options. The list of these options depends on processor data,
and varies greatly. All the options influence your register settings, and can be inspected in the Register view. Only some of the
options directly influence configuration you have made in the Security Access Configuration view. Point your cursor over individual
options to display a tooltip explaining the function of each option.
Figure 118. Miscellanous (RDC)
7.1.3 Memory attribution map
In the Memory attribution map, you can view security levels set for memory regions. This view is read-only.
7.1.3.1 Core 0
In the Core 0 sub-view, you can review security levels set for Core 0 to the code, data, and peripherals memory regions. The table
is read-only.
The Access by Master table displays MSW or SAU+IDAU, MPC (Memory Protection Checker) security level, and Resulting
Security Level status of listed code, data, and peripherals memory regions, alongside their physical addresses.
To set the display options, do the following:
1. Click the Filter access for checkbox to enable filtering options.
2. Select the master security access you want to review by choosing from the Master dropdown menu.
3. Optionally, set the security level of the selected master by choosing from the Security mode dropdown menu. This setting
has no effect on the configuration.
4. Optionally, customize the output by de-selecting the Show details and Merged SAU+IDAU options.
5. Optionally, filter displayed memory regions in the Filter area.
Point your cursor over the color-coded cells to display a tooltip with information about the security level combination.
Double-click the cell to open the pertinent settings in Security Access Configuration.
MCUXpresso Config Tools User's Guide (IDE), Rev. 0, 1/2021
User's Guide 97 / 136
Page 98

NXP Semiconductors
Trusted Execution Environment Tool
Figure 119. Core 0
7.1.3.2 Other masters
In the Other Masters sub-view, you can review security attributes of memory in relation to access rights by master other than Core
0. The table is read-only.
To set the display options, do the following:
MCUXpresso Config Tools User's Guide (IDE), Rev. 0, 1/2021
User's Guide 98 / 136
Page 99

NXP Semiconductors
Trusted Execution Environment Tool
1. Click the Filter access for checkbox to enable filtering options.
2. Select the master type security access you want to review by choosing from the Master dropdown menu.
3. Optionally, customize the output by de-selecting the Show Details, Show Code, Show Data, and Show Peripherals options.
4. Optionally, filter displayed memory regions in the Filter area.
Point your cursor over the color-coded fields to display a tooltip with information about the security level combination.
Double-click the cell to open the pertinent settings in Security Access Configuration.
MCUXpresso Config Tools User's Guide (IDE), Rev. 0, 1/2021
User's Guide 99 / 136
Page 100

NXP Semiconductors
Trusted Execution Environment Tool
Figure 120. Other masters
7.1.4 Access Overview
In Access Overview, you can review security policies you have set in Security Access Configuration view.
The vertical axis displays all masters, divided into color-coded groups by their security settings.
MCUXpresso Config Tools User's Guide (IDE), Rev. 0, 1/2021
User's Guide 100 / 136
 Loading...