

Page 1
ProSafe Network Management Software NMS200
User Guide
350 East Plumeria Drive
San Jose, CA 95134
USA
January 2012
202-10838-04
v1.1
Page 2

ProSafe Network Management Software NMS200
©2012 NETGEAR, Inc. All rights reserved
No part of this publication may be reproduced, transmitted, transcribed, stored in a retrieval system, or translated
into any language in any form or by any means without the written permission of NETGEAR, Inc.
Tech nic al Suppo rt
Thank you for choosing NETGEAR. T o register your product, get the latest product updates, get support online, or
for more information about the topics covered in this manual, visit the Support website at
http://support.netgear.com .
Phone (US & Canada only): 1-888-NETGEAR
Phone (Other Countries): Check the list of
http://support.netgear.com/app/answers/detail/a_id/984
phone numbers at
Trademarks
NETGEAR, the NETGEAR logo, and Connect with Innovation are trademarks and/or registered trademarks of
NETGEAR, Inc. and/or its subsidiaries in the United States and/or other countries. Information is subject to change
without notice. Other brand and product names are registered trademarks or trademarks of their respective
holders. © 2011 NETGEAR, Inc. All rights reserved.
Statement of Conditions
To improve internal design, operational function, and/or reliability, NETGEAR reserves the right to make changes
to the products described in this document without notice. NETGEAR does not assume any liability that may occur
due to the use, or application of, the product(s) or circuit layout(s) described herein.
Revision History
Publication Part Number Version Publish Date Comments
202-10838-01 v1.1 May 2011 First publication
202-10838-04 v1.1 January 2012 Second publication
2
Page 3

Contents
Chapter 1 Introduction
Chapter 2 Getting Started
Why NMS200? . . . . . . . . . . . . . . . . . . . . . . . . . . . . . . . . . . . . . . . . . . . . . . .7
Key Features . . . . . . . . . . . . . . . . . . . . . . . . . . . . . . . . . . . . . . . . . . . . . .7
Networks with NMS200 . . . . . . . . . . . . . . . . . . . . . . . . . . . . . . . . . . . . . .8
Additional Products. . . . . . . . . . . . . . . . . . . . . . . . . . . . . . . . . . . . . . . . . .9
Online Help / Filter . . . . . . . . . . . . . . . . . . . . . . . . . . . . . . . . . . . . . . . . . .9
Expand / Collapse options . . . . . . . . . . . . . . . . . . . . . . . . . . . . . . . . . . .10
A Note About Performance. . . . . . . . . . . . . . . . . . . . . . . . . . . . . . . . . . . . .10
System Basics . . . . . . . . . . . . . . . . . . . . . . . . . . . . . . . . . . . . . . . . . . . .11
Network Basics. . . . . . . . . . . . . . . . . . . . . . . . . . . . . . . . . . . . . . . . . . . .13
Authentication. . . . . . . . . . . . . . . . . . . . . . . . . . . . . . . . . . . . . . . . . . . . .14
Updating Your License. . . . . . . . . . . . . . . . . . . . . . . . . . . . . . . . . . . . . .14
Getting Started . . . . . . . . . . . . . . . . . . . . . . . . . . . . . . . . . . . . . . . . . . . . . .15
Installation and Startup. . . . . . . . . . . . . . . . . . . . . . . . . . . . . . . . . . . . . . . .16
Starting Web Client. . . . . . . . . . . . . . . . . . . . . . . . . . . . . . . . . . . . . . . . .16
Control Panel . . . . . . . . . . . . . . . . . . . . . . . . . . . . . . . . . . . . . . . . . . . . . . .17
Portal > Users. . . . . . . . . . . . . . . . . . . . . . . . . . . . . . . . . . . . . . . . . . . . .18
Portal > Communities. . . . . . . . . . . . . . . . . . . . . . . . . . . . . . . . . . . . . . .19
Database Aging Policies (DAP) . . . . . . . . . . . . . . . . . . . . . . . . . . . . . . . . .19
Aging Policies Editor. . . . . . . . . . . . . . . . . . . . . . . . . . . . . . . . . . . . . . . .20
Aging Policies Options . . . . . . . . . . . . . . . . . . . . . . . . . . . . . . . . . . . . . .21
Sub-Policies . . . . . . . . . . . . . . . . . . . . . . . . . . . . . . . . . . . . . . . . . . . . . .22
Repositories . . . . . . . . . . . . . . . . . . . . . . . . . . . . . . . . . . . . . . . . . . . . . .23
Quick Navigation . . . . . . . . . . . . . . . . . . . . . . . . . . . . . . . . . . . . . . . . . . . .24
License Viewer. . . . . . . . . . . . . . . . . . . . . . . . . . . . . . . . . . . . . . . . . . . . . .25
Discovery . . . . . . . . . . . . . . . . . . . . . . . . . . . . . . . . . . . . . . . . . . . . . . . . . .26
Managed Resources . . . . . . . . . . . . . . . . . .
Common Setup Tasks . . . . . . . . . . . . . . . . . . . . . . . . . . . . . . . . . . . . . . . .28
SMTP Configuration . . . . . . . . . . . . . . . . . . . . . . . . . . . . . . . . . . . . . . . .28
Netrestore File Servers. . . . . .
. . . . . . . . . . . . . . . . . . . . . . . . . . . . . . . .30
. . . . . . . . . . . . . . . . . . . . . . .28
Chapter 3 Portal Conventions
Help / Tooltips. . . . . . . . . . . . . . . . . . . . . . . . . . . . . . . . . . . . . . . . . . . . .32
Refresh. . . . . . . . . . . . . . . . . . . . . . . . . . . . . . . . . . . . . . . . . . . . . . . . . .32
The Back Butt
Show Versions . . . . . . . . . . . . . . . . . . . . . . . . . . . . . . . . . . . . . . . . . . . .33
The Dock . . . . . . . . . . . . . . . . . . . . . . . . . . . . . . . . . . . . . . . . . . . . . . . . . .33
on. . . . . . . . . . . . . . . . . . . . . . . . . . . . . . . . . . . . . . . . . . .32
3
Page 4

ProSafe Network Management Software NMS2 00
Status Bar Messaging . . . . . . . . . . . . . . . . . . . . . . . . . . . . . . . . . . . . . . . . 34
Chat / Conferencing . . . . . . . . . . . . . . . . . . . . . . . . . . . . . . . . . . . . . . . . 34
Menu Bar . . . . . . . . . . . . . . . . . . . . . . . . . . . . . . . . . . . . . . . . . . . . . . . .35
Graphs . . . . . . . . . . . . . . . . . . . . . . . . . . . . . . . . . . . . . . . . . . . . . . . . . . 36
Portlets . . . . . . . . . . . . . . . . . . . . . . . . . . . . . . . . . . . . . . . . . . . . . . . . . . 37
Common Menu Items. . . . . . . . . . . . . . . . . . . . . . . . . . . . . . . . . . . . . . . . .42
Import / Export . . . . . . . . . . . . . . . . . . . . . . . . . . . . . . . . . . . . . . . . . . . .42
Sharing. . . . . . . . . . . . . . . . . . . . . . . . . . . . . . . . . . . . . . . . . . . . . . . . . .43
View as PDF. . . . . . . . . . . . . . . . . . . . . . . . . . . . . . . . . . . . . . . . . . . . . . 44
Audit Trail / Jobs Screen . . . . . . . . . . . . . . . . . . . . . . . . . . . . . . . . . . . . 45
Audit Trail Viewer . . . . . . . . . . . . . . . . . . . . . . . . . . . . . . . . . . . . . . . . . .46
Audit Trail Portlet . . . . . . . . . . . . . . . . . . . . . . . . . . . . . . . . . . . . . . . . . .46
Schedules. . . . . . . . . . . . . . . . . . . . . . . . . . . . . . . . . . . . . . . . . . . . . . . . . .48
Schedules Portlet . . . . . . . . . . . . . . . . . . . . . . . . . . . . . . . . . . . . . . . . . .49
Chapter 4 NMS200 Portlets
Alarms . . . . . . . . . . . . . . . . . . . . . . . . . . . . . . . . . . . . . . . . . . . . . . . . . . . . 51
Event History . . . . . . . . . . . . . . . . . . . . . . . . . . . . . . . . . . . . . . . . . . . . . . . 56
Event Processing Rules. . . . . . . . . . . . . . . . . . . . . . . . . . . . . . . . . . . . . . . 58
Rule Editor Example. . . . . . . . . . . . . . . . . . . . . . . . . . . . . . . . . . . . . . . . 59
Rule Editor . . . . . . . . . . . . . . . . . . . . . . . . . . . . . . . . . . . . . . . . . . . . . . .61
File Servers . . . . . . . . . . . . . . . . . . . . . . . . . . . . . . . . . . . . . . . . . . . . . . . .74
File Server Editor . . . . . . . . . . . . . . . . . . . . . . . . . . . . . . . . . . . . . . . . . .76
OS Images . . . . . . . . . . . . . . . . . . . . . . . . . . . . . . . . . . . . . . . . . . . . . . . . .77
OS Image Editor. . . . . . . . . . . . . . . . . . . . . . . . . . . . . . . . . . . . . . . . . . .78
Deploy OS . . . . . . . . . . . . . . . . . . . . . . . . . . . . . . . . . . . . . . . . . . . . . . . . . 80
Contacts. . . . . . . . . . . . . . . . . . . . . . . . . . . . . . . . . . . . . . . . . . . . . . . . . . . 81
Contacts Editor. . . . . . . . . . . . . . . . . . . . . . . . . . . . . . . . . . . . . . . . . . . .82
Locations . . . . . . . . . . . . . . . . . . . . . . . . . . . . . . . . . . . . . . . . . . . . . . . . . . 83
Visualize My Network. . . . . . . . . . . . . . . . . . . . . . . . . . . . . . . . . . . . . . . . .85
Control and Styles . . . . . . . . . . . . . . . . . . . . . . . . . . . . . . . . . . . . . . . . . 87
Data / Node Finder. . . . . . . . . . . . . . . . . . . . . . . . . . . . . . . . . . . . . . . . .89
Layout. . . . . . . . . . . . . . . . . . . . . . . . . . . . . . . . . . . . . . . . . . . . . . . . . . . 91
OVERVIEW . . . . . . . . . . . . . . . . . . . . . . . . . . . . . . . . . . . . . . . . . . . . . .95
Alarms in Topology. . . . . . . . . . . . . . . . . . . . . . . . . . . . . . . . . . . . . . . . .95
Vendors . . . . . . . . . . . . . . . . . . . . . . . . . . . . . . . . . . . . . . . . . . . . . . . . . . . 95
Chapter 5 Monitoring
Resource Monitors . . . . . . . . . . . . . . . . . . . . . . . . . . . . . . . . . . . . . . . . . . .97
Monitor Editor. . . . . . . . . . . . . . . . . . . . . . . . . . . . . . . . . . . . . . . . . . . . . 99
Monitor Options Type-Specific Panels . . . . . . . . . . . . . . . . . . . . . . . . .106
Scheduling Refresh Monitor Targets . . . . . .
Top [Asset] Monitors . . . . . . . . . . . . . . . . . . . . . . . . . . . . . . . . . . . . . . . . 113
Top Configuration Backups . . . . . . . . . . . . . . . . . . . . . . . . . . . . . . . . .114
Dashboard Views . . . . . . . . . . . . . . . . . . . . . . . . . . . . . . . . . . . . . . . . . . .115
Performance Dashboard . . . . . . . . . . . . . . . . . . . . . . . . . . . . . . . . . . . 116
Dashboard Editor . . . . . . . . . . . . . . . . . . . . . . . . . . . . . . . . . . . . . . . . .117
4
. . . . . . . . . . . . . . . . . . . .113
Page 5

ProSafe Network Management Software NMS200
Key Metric Editor . . . . . . . . . . . . . . . . . . . . . . . . . . . . . . . . . . . . . . . . . . .118
Chapter 6 Resource Management
Authentication. . . . . . . . . . . . . . . . . . . . . . . . . . . . . . . . . . . . . . . . . . . . . .121
Resource Discovery . . . . . . . . . . . . . . . . . . . . . . . . . . . . . . . . . . . . . . . . .123
Discovery Profiles. . . . . . . . . . . . . . . . . . . . . . . . . . . . . . . . . . . . . . . . . . .124
Managed Resource Groups . . . . . . . . . . . . . . . . . . . . . . . . . . . . . . . . . . .130
Static Group . . . . . . . . . . . . . . . . . . . . . . . . . . . . . . . . . . . . . . . . . . . . .131
Dynamic Group. . . . . . . . . . . . . . . . . . . . . . . . . . . . . . . . . . . . . . . . . . .132
Managed Resources . . . . . . . . . . . . . . . . . . . . . . . . . . . . . . . . . . . . . . . .133
File Management . . . . . . . . . . . . . . . . . . . . . . . . . . . . . . . . . . . . . . . . .138
Configuration Files . . . . . . . . . . . . . . . . . . . . . . . . . . . . . . . . . . . . . . . .143
New Link. . . . . . . . . . . . . . . . . . . . . . . . . . . . . . . . . . . . . . . . . . . . . . . .144
Link Discovery . . . . . . . . . . . . . . . . . . . . . . . . . . . . . . . . . . . . . . . . . . .145
Equipment Details . . . . . . . . . . . . . . . . . . . . . . . . . . . . . . . . . . . . . . . . . .146
Performance Indicators. . . . . . . . . . . . . . . . . . . . . . . . . . . . . . . . . . . . .147
Interfaces . . . . . . . . . . . . . . . . . . . . . . . . . . . . . . . . . . . . . . . . . . . . . . .147
Alarms. . . . . . . . . . . . . . . . . . . . . . . . . . . . . . . . . . . . . . . . . . . . . . . . . .149
Ports . . . . . . . . . . . . . . . . . . . . . . . . . . . . . . . . . . . . . . . . . . . . . . . . . . .149
Details. . . . . . . . . . . . . . . . . . . . . . . . . . . . . . . . . . . . . . . . . . . . . . . . . .152
Live Details. . . . . . . . . . . . . . . . . . . . . . . . . . . . . . . . . . . . . . . . . . . . . .154
Scheduling Actions. . . . . . . . . . . . . . . . . . . . . . . . . . . . . . . . . . . . . . . .154
Direct Access . . . . . . . . . . . . . . . . . . . . . . . . . . . . . . . . . . . . . . . . . . . . . .155
MIB Browser. . . . . . . . . . . . . . . . . . . . . . . . . . . . . . . . . . . . . . . . . . . . .156
Terminal . . . . . . . . . . . . . . . . . . . . . . . . . . . . . . . . . . . . . . . . . . . . . . . .157
Ports. . . . . . . . . . . . . . . . . . . . . . . . . . . . . . . . . . . . . . . . . . . . . . . . . . . . .158
Reports. . . . . . . . . . . . . . . . . . . . . . . . . . . . . . . . . . . . . . . . . . . . . . . . . . .161
Branding Reports . . . . . . . . . . . . . . . . . . . . . . . . . . . . . . . . . . . . . . . . .163
Chapter 7 File Server / File Management
File Servers . . . . . . . . . . . . . . . . . . . . . . . . . . . . . . . . . . . . . . . . . . . . . . .165
File Server Editor . . . . . . . . . . . . . . . . . . . . . . . . . . . . . . . . . . . . . . . . .167
File Management . . . . . . . . . . . . . . . . . . . . . . . . . . . . . . . . . . . . . . . . . . .168
Configuration Files . . . . . . . . . . . . . . . . . . . . . . . . . . . . . . . . . . . . . . . .171
Image Repository . . . . . . . . . . . . . . . . . . . . . . . . . . . . . . . . . . . . . . . . . . .173
Firmware Image Editor . . . . . . . . . . . . . . . . . . . . . . . . . . . . . . . . . . . . .173
Configuration Image Editor. . . . . . . . . . . . . . . . . . . . . . . . . . . . . . . . . .174
Deploy Firmware . . . . . . . . . . . . . . . . . . . . . . . . . . . . . . . . . . . . . . . . . . .175
Deploy Configuration . . . . . . . . . . . . . . . . . . . . . . . . . . . . . . . . . . . . . . . .176
Chapter 8 Storage Arrays
Storage Array Portlet . . . . . . . . . . . . . . . . . . . . . . . . . . . . . . . . . . . . . . . .178
Storage Array Portlet Expanded. . . . . . . . . . . . . . . . . . . . . . . . . . . . . .179
General. . . . . . . . . . . . . . . . . . . . . . . . . . . . . . . . . . . . . . . . . . . . . . . . .182
5
Page 6

ProSafe Network Management Software NMS2 00
Appendix A Glossary
Index
6
Page 7

1. Introduction
NMS200 can give you automated, consolidated configuration and control of your network’s
resources.
NMS200’s Administration Guide describes some of the runtime features supporting these
applications. The NMS200 Installation Guide and Administration Guide discuss licensing.
Consult Release Notes for information about changes not covered in this Synergy User Guide.
Why NMS200?
NMS200’s benefits:
1
• Productive. Discove
installing NMS200, you can monitor your network.
• Easy. NMS20
capabilities with minimal configuration overhead.
• V
aluable. NMS200 often costs less to use and maintain than most other solutions.
• Scalab
ility. You can scale NMS200 to almost any size.
0 provides the network information you need, and offers advanced
ry and wizard-driven configuration features within minutes of
Key Features
The following are some key features of NMS200:
• Automate
database and begins network analysis. You can also create network discovery schedules
to automatically run Discovery whenever you need them.
• Op
• T
• Alarms. Y
en Integration. NMS200 supports industry standards. It comes with an open-source
MySQL database. It also uses industry-standard MIBs and protocols.
opology. The NMS200 topology screen lets you create multi-layered, fully
customizable, web-based maps of your network to track devices wherever they are in
your network in real time.
scenarios, including multiple condition checks. NMS200’s alarms help you recognize
issues before your network users experience productivity losses. Alarms can also trigger
and Schedule Device Discovery. Device discovery populates NMS200’s
ou can configure custom alarms to respond to hundreds of possible network
7
Page 8

ProSafe Network Management Software NMS200
actions like email, paging, SNMP traps, Syslog messaging, and external application
execution.
• T
raps and Syslog. NMS200 lets you investigate network issues with traps and Syslog
messages. You can use NMS200 to set up events / alarms and then receive, process,
forward, and send syslog and trap messages.
• Report
display data from its database. You can archive and compare reports, or automate
creating them with NMS200’s scheduler.
s and Graphs. NMS200 comes with many pre-configured reports and graphs to
Networks with NMS200
The beginning of network management with NMS200 is Discovery of the resources on a
network. After that occurs, you can configure Visualize My Network , Resource Monitors and
Performance Dashboards.
Once you have done these initial steps, NMS200 helps you understand and troubleshoot
your network. For example: Suppose a NMS200 Performance Dashboard displays
something you want troubleshoot. You can right-click the impacted device in the Visualize My
Network to access configuration and actions. The color of the icon in topology indicates the
highest severity alarm on the device or its sub-components. For example, read indicates a
Critical alarm.
Displays include right-click access to the Details screen (see Equipment Details on
page 146), where you can examine each section of device information and right-click to see
further applicable actions. For example right-click to Show Performance, and edit and/or save
that view of performance as another Performance Dashboard. Performance can also display
portlets that Show Top Talkers (the busiest devices) or Show Key Metrics.
From looking at Performance Dashboards or Top [Asset] Monitors you may conclude some
configuration changes made memory consumption spike. Right-click to access resource
actions under File Management that let you see the current configuration files on devices,
and compare current to previous. You can also back up devices (see How To Backup on
page 141) and restore previously backed up files (see How To Restore on page 142). Finally,
you may simply want to Resync (another right-click menu item) to insure the device and your
management system are up-to-date.
Tip: Alternatively
Actions.
You can right click for Direct Access – Telnet or Di
command line telnetting to the device, or an SNMP MIB browser to examine SNMP
possibilities for it.
The Managed Resources portlet can display the anatomy of a Resource with its right-click
actions (see Equipment Details on page 146). Click the plus in the upper right corner to see
Managed Resources Expanded. This displays detail or “Snap-in” panels with additional
information about a selected resource.
, the Alarms portlet also lets you right-click to expose Alarm
rect Access – MIB Browser to display a
Introduction
8
Page 9

ProSafe Network Management Software NMS200
Reports let you take snapshots of network conditions to aid in analysis of trends, and Audit
Trail Portlets track message traffic between NMS200 and devices.
Additional Products
The following describes how to increase the power of your NMS200 installation. While the
documents mentioned above describe everything available with NMS200, your installation
may provide only a limited subset of those features.
Updating Your License
If you have a limited license — for example NMS200 may limit discovery t o a certain number
of devices— then your application does not function outside those licensed limits.
You can purchase additional capabilities, and can update your license for NMS200 by putting
the updated license file in a convenient directory. Then click License Management in the
Quick Navigation portlet item to open a screen with a button leading to a file browser
(Register License: Select File). Locate the license file, and click the Register License button.
Your updated license should be visible in the License Viewer (See License Viewer on
page 25 for details.)
Note: If you update your installation from a previous one where you
upgraded license, you must also re-register those licenses.
You must restart application server or wait up to 15 minutes before a license modification
takes effect. If you import a license that, for example, changes the application’s expiration
date, it does not immediately take effect. You must restart application server or wait at least
15 minutes.
Online Help / Filter
You can access online help for each portlet by clicking the question mark icon at the bottom
of each portlet.
Introduction
9
Page 10
ProSafe Network Management Software NMS200
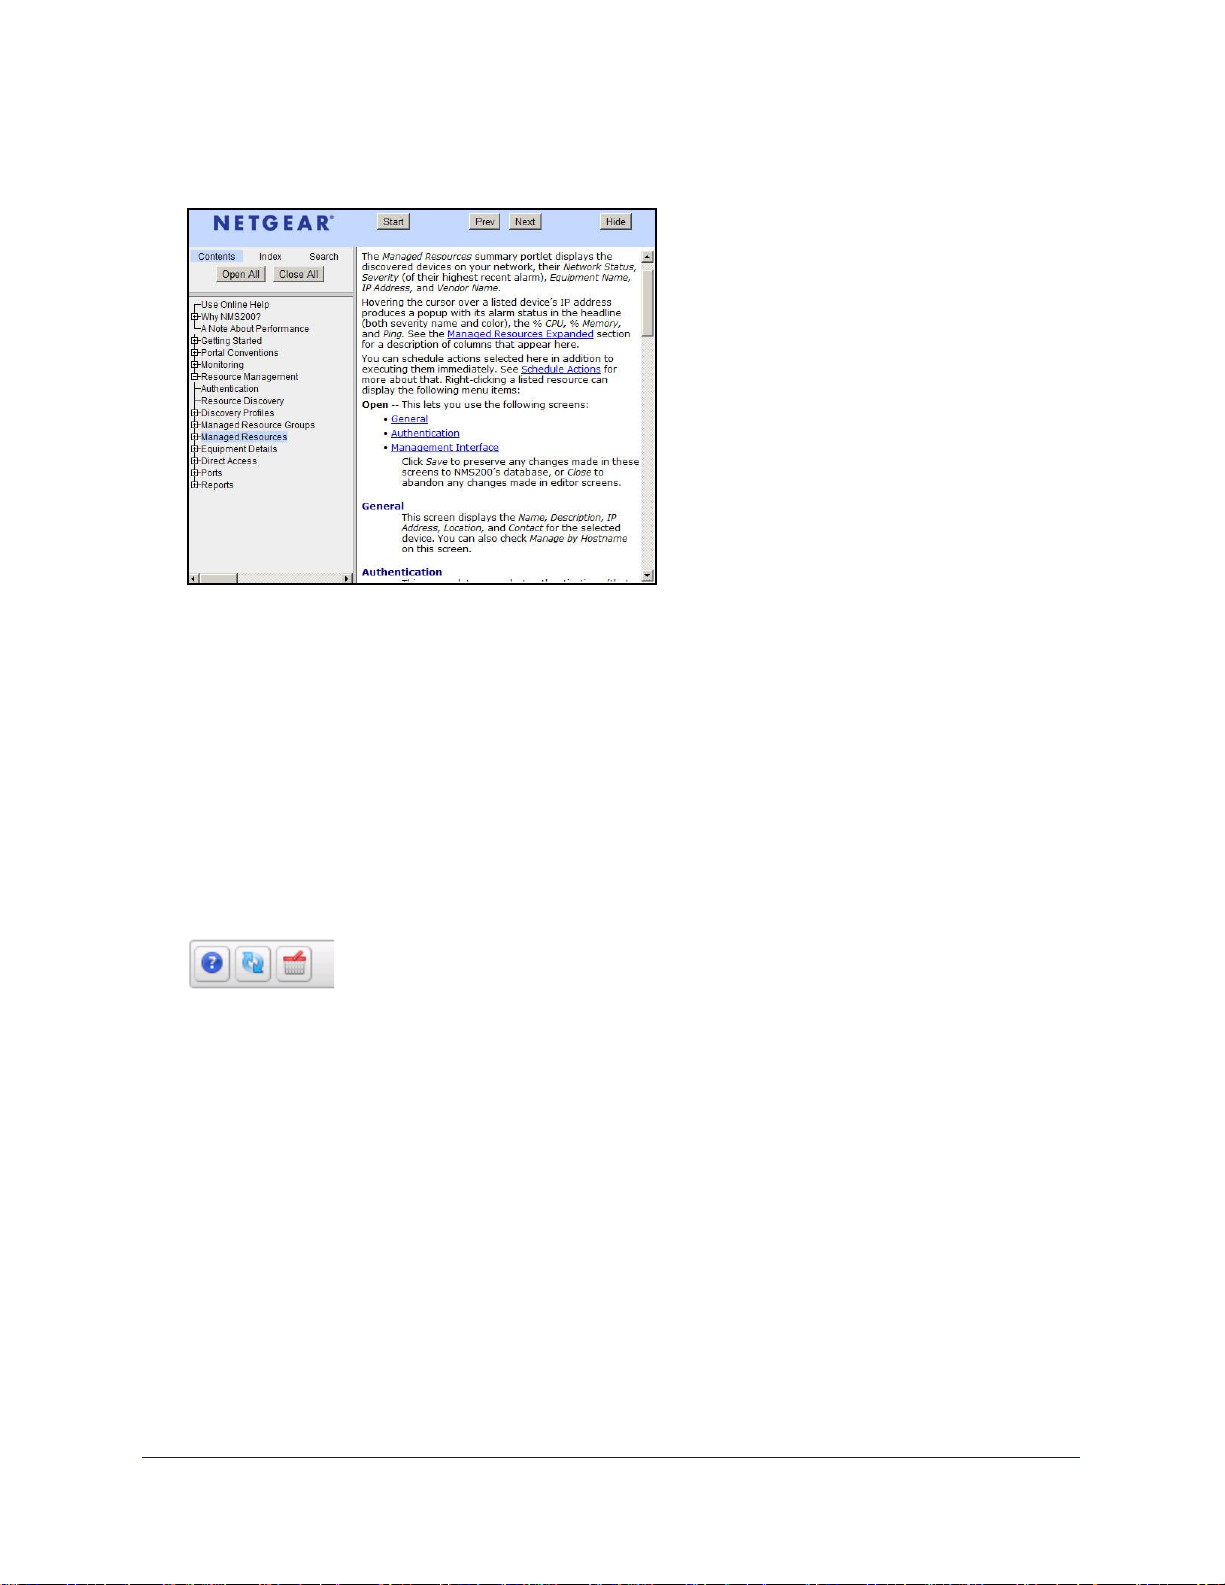
This opens an online help screen with information about the portlet in which you click.
By default, this opens a separate browser window. You can arrange the display so the help
screen does not conceal the portlet it describes. By default it also appears without the table of
contents, index and search tabs. Click the Show button to display those tabs (Hide conceals
them again), and the Prev / Next buttons, or clicking table of contents topics moves to
different topics within the helpset.
Expand / Collapse options
Clicking the Expand / Collapse options button to the right of the question mark expands the
display of buttons so you can click to Refresh Data for the current portlet, or toggle the
display filter and number of items to display, for example. Clicking Expand / Collapse options
again returns to the original display.
A Note About Performance
These applications are designed to help you manage your network with alacrity.
Unfortunately , the devices they manage or the networks that communicate with those devices
are not always as fast as this software. If discovery takes a long time (it can), often network
and device latency is the culprit. You can also optimize installations to be faster (see the
recommendations in the installation and administration guides), and limit device queries with
filters, but device and network latency limit how quickly your system can respond.
Tip: If yo
u use management systems other than this one, you must perform a
device level resync before performing configuration actions. Best
practice is to use a single management tool whenever possible.
Introduction
10
Page 11

2. Getting Started
This chapter describes how to install and start NMS200 for basic network monitoring and
management.
If you are sure your hardware, software and network is correct and just want to get started
immediately, go to Getting Started on page 15.
The NMS200 portal delivers powerful solutions to network problems, and, in addition to the
NMS200 technology documented in the following pages, NMS200 offers the following
capabilities:
• Message Boards, Blogs, Wikis
2
• Shared
• Enterp
• RSS Feeds
• T
Calendars
rise Chat / Messaging
agging, Ratings, Comments
System Basics
System requirements depend on how you use the application and the operational
environment. Your specific network and devices may require something different from the
recommendations for typical installations.
Generally, base the minimum configuration of any system on its expected peak load. Your
installation should spend 95% of its time idle and 5% of its time trying to keep pace with the
resource demands.
Supported Operating System Versions
The following are supported operating system versions:
• Mi
crosoft Windows® — This application supports most Windows operating systems
from Windows XP forward, with their latest service packs. The supported operating
systems are: Windows 2003 (Standard, Enterprise and Web), Windows XP (Pro) SP3 or
later, Windows Vista (Business or Ultimate), Windows Server 2008, Enterprise Edition,
and Windows 7 (Business or better). This is a 32-bit application, however it has been
tested for Windows on both 32- and 64-bit operating system versions, and supports both
in the supported Windows versions.
11
Page 12

ProSafe Network Management Software NMS200
Note: Windows Terminal Server is not supported. The installer becomes
non-responsive with Data Execution Prevention enabled. This option
is disabled by default on Windows Server 2008, but is enabled on a
Windows Server 2008 machine running Terminal Server.
- You must disable User Account Control if you are installing on Vista or Windows
Server 2008.
- In V
ista, you must either to disable User Account Control or run application server as
service. Another option is to run as administrator on startapp server . In V ista, right click
the startappserver icon and select run as administrator.
- Inst
aller may halt when pre-existing bash sessions or cmd sessions left are open.
Close all such sessions.
Supported Web Browsers
Supported web browsers include:
• Chrome (v 6 and
• Safa
ri (v 5 and above)
• Firefox (v 3.
ternet Explorer (v 8 and above)
• In
Note: Internet Explorer has some minor alignment issues, slower
JavaScript and flash processing. Overall page processing is slower
and some transparencies do not work. You will also see other
anomalies like non-rounded corners, no alpha rendering and others.
above)
6 and above)
You can download and install updates if your browser or version varies from those supported.
To have all NMS200 functionality, you must also install the latest version of Adobe’s Flash™
and Adobe’s Acrobat® that works with these browsers. Flash for 64-bit browsers is currently
a preliminary version, but you can typically run a 32-bit browser even in a 64-bit operating
system, so Flash features will still be available even if you do not want to run Adobe’s beta
software.
Note: If Flash is installed, but the screen still request s it, reload the page in
the browser. Also: Your screen must be at least 1250 pixels wide.
Tip: When no cursor or focus is onscreen, some browsers interpret
backspace as the Previous button.
Getting Started
12
Page 13

ProSafe Network Management Software NMS200
Hardware Recommendations
NMS200 contains an Application Server that runs continuously in the background, and a
Client (the user interface you actually see). The stand-alone installation runs a Web Serve r in
addition to the application server. Minimum hardware recommendations are based on the
different types of installation available:
ull Installation (Application server + W eb Server) — 2.8 GHz dual core CPU, 4G RAM
• F
(8G for 64-bit operating systems), and 20G available disk space.
• W
eb Server Installation —2.8 GHz dual core CPU, 4G. If you want to serve more than
10 web clients, upgrade your hardware.
You can start and stop the client portion of the software without impacting the application
server. Device monitoring stops when you stop the application server or turn off its host
machine. The client can also be on a different machine than the application server.
Note: See Starting Web Client on page 16 for more information about
using web access to this software.
Network Basics
NMS200 communicates over a network. In fact, the machine where you install it must be
connected to a network for the application to start successfully. Firewalls, or even SNMP
management programs using the same port on the same machine where this software is
installed can interfere with communication with your equipment.
Dealing with any network barriers to communicating with NMS200, any required initial device
configuration to accept management, and managing security measures or firewalls—all are
outside the scope of these instructions. Consult with your network administrator to ensure
this software has access to the devices you want to manage with the Protocols described
below.
Tip: One simple way
device is to open a command shell with S tart > Run
[device IP address]
connected to the network. If not, consult your network administrator to
correct this. No useful information comes from disconnected or
powered-down devices.
Name Resolution
NMS200 server and client require resolution of equipment names to work completely,
whether by host files or domain name system (DNS). The application server cannot respond
to hosts with IP addresses alone. The application server might not even be in the same
network and therefore the host would be unable to connect.
to check connectivity from a Windows machine to a
cmd
. Then, type
at the command line. If the device responds, it is
ping
Getting Started
13
Page 14

ProSafe Network Management Software NMS200
If your network does not have DNS, you can also assign hostnames in
%windir%\system32\drivers\etc\hosts
hostname in addition to an IP address somewhere in the system. Here are some example
hosts file contents (including two commented lines where you would have to remove the #
sign to make them effective):
# 102.54.94.97 rhino.acme.com # source server
# 38.25.63.10 x.acme.com # x client host
127.0.0.1 localhost
on Windows. Here, you must assign a
Protocols
NMS200 uses the following protocols: TCP/IP, SNMP, HTTP/S, UDP Multicast.
Fixed IP Address
NMS200 includes a web server and application server which must be installed to hosts with
fixed IP addresses or permanently assigned Dynamic Host Control Protocol (DHCP) leases.
For trial purposes, you can rely on a dynamic IP address assignment with a long lease, but
this is not recommended for production installations.
If you do change your host’s IP address
To accommodate a changed IP address, first delete the contents of
your local IP address anywhere it appears in
\owareapps\installprops\lib\installed.properties
Alternatively, in a shell, after running
ipaddresschange -n
If you do change your server’s IP address, you must also change the URL for web client
access in your browser.
followed by the new IP address.
oware
to set the environment, you can run
\oware\temp
. Then restart your machine.
. Change
Authentication
For successful discovery of the resources on your network, this software requires
authenticated management access to the device. To get this access, you must provide the
correct SNMP community strings, and any other command-line (Telnet / SSH) or browser
(HTTP/HTTPS) authentication, and SNMP must be turned on, if that is not the device’s
default. Some devices require pre-configuration to recognize this management software.
Consult your network administrator or the device’s manuals for instructions about how to
enable those.
Updating Your License
If you have a limited license then your application does not function outside those licensed
limits. If you purchase additional licenses, put the updated license file in a convenient
directory, then click License Management in the Quick Navigation menu item. Click Select
Getting Started
14
Page 15

ProSafe Network Management Software NMS200
File and choose the file. Your updated license should be visible in the License Viewer. See
License Viewer on page 25 for details.
Note: You must also re-register licenses if you have updated your
installation from a previous version where you previously upgraded
licenses. In any case, you must restart application server or wait up
to 15 minutes before a license modification is effective. If you import
a license that, for example, changes the application’s expiration
date, it does not immediately take effect. You must restart
application server or wait at least 15 minutes. If you license new
features, restart the application server and client.
Getting Started
The following section outlines the steps in a typical installation and subsequent first use.
Because the software described here is both flexible and powerful, this section does not
exhaustively describe all the details of available installations. Instead, this Guide refers to
those descriptions elsewhere in the NMS200 Installation Guide, Ad min istra tion Guide, User
Guide or online help.
A typical installation means doing the following:
• Installation and Startup— Installation and Startup on
instructions for a basic installation. If you have a large network, or anticipate a large
umber of web clients, then best practice is to install NMS200 as the Installation Guide
n
guide instructs.
• Discovery — After you first install the application, you mu
want to manage. See Discovery on p
• Resource Management — See Managed Resources on p
Guide.
• Configuration
configuration files. See Top Configuration Backups on
• Pro
• Netwo
• Reports — Run reports to clarify the state of your network and devices. See Reports on
• Real-time
blem Diagnosis — See Alarms on page 51 for information about Fault Management.
rk Troubleshooting — See Alarms on page 51, and Chapter 5 for details of
NMS200’s performance management capabilities.
page 161 for details.
issues, both by sending them messages that display the device conditions of concern,
and with online chat within NMS200. See Sharing o
on page 34 for details.
Management — Use NMS200 to backup, restore, and compare
Diagnosis thru Collaboration — Collaborate with others about network
age 26.
page 16 below includes
st discover the equipment you
age 28, and Chapter 6 in this
page 114.
n page 43, and St atus Bar Messaging
Getting Started
15
Page 16
ProSafe Network Management Software NMS200
CAUTION:
• Unified View — You can scale your NMS200 installation to handle the largest, most
complex environments with distributed deployment. Consult the Installation Guide for
more about installing distributed, and even high availability systems.
• Finally do not n
eglect what Common Setup Tasks on page 28 describes.
Installation and Startup
Application server produces the NMS200 information for web clients. It monitors devices, and
produces the output which the web server then makes available for those web clients.
To manage Windows systems—in single server deployments, you must
install this application on a Windows host. In distributed deployments, a
mediation server installed on Windows must communicate to managed
Windows systems.
Windows installation also installs Internet Information Services (IIS)—
formerly called Internet
IIS on by default. Do not enable IIS on the host(s) running NMS200.
Also: do not install if you are logged in as user “admin.”
Information Server. That installation does not turn
Installation and startup include:
• Running the installer, responding to its prompts.
•
•
• Starting the Client.
• Start using NMS200 as summarized in Getting S
Starting application server. In Windows, you can use the Start button (Start >
Redcell > Start application server), or type
right-click the server manager tray icon and select Start if you have installed NMS200 as
a service and that icon is red, not green.
Starting web server. You can use the Start button (Start > Redcell > Synergy
Manager), or right click th
icon and automate web server startup.
address
application server (or it’s IP address).
hostname:8080
e web server’s tray icon to start it. Y ou can also double-click this
After starting the web server, open a browser and go to the web
where
hostname
startappserver
is the name of the machine running
tarted on page 15, or below.
in a command shell, or
Starting Web Client
You can also open the client user interface in a browser. See Supported Web Browsers on
page 12. The URL is
http://[application server hostname or IP address]:8080
Getting Started
16
Page 17

ProSafe Network Management Software NMS200
The default login user is netgear, with a password of netgear.
The application server hostname is the name of the system where NMS200 is installed.
A Printer Management - Web layout also comes with the application. Use this for better
performance from web clients.
HTTPS
You can connect to application server securely b
y configuring the included Apache Tomcat
server for secure access. See http://tomcat.apache.org/tomcat-6.0-doc/ssl-howto.html,
among other resources.
The following sections discuss typical administrative steps in getting started, once you have
installed NMS200. See Getting S t arted on p age 15 for a list of, and links to, other initial t asks
once you have installed NMS200.
Changing the Session Timeout Period
You must modify two
controls the overall server and the other is the push servers for Async-based views. These
web.xml
files are in the following directories:
/dorado/oware/synergy/tomcat-XX/webapps/ROOT/WEB-INF/web.xml
And
/dorado/oware/synergy/tomcat-xx/webapps/netview/WEB-INF/web.xml
The xml element that contains the session timeout is
<session-config>
<session-timeout>30</session-timeout>
</session-config>
web.xml
files with the same values to alter the session timeout. One
The
portal.properties
file is in
/portal/portal-impl/classes
. The property
containing the session timeout (in minutes) is:
session.timeout=30
Control Panel
To configure access to NMS200, you must be signed in as a user with the Administrator role’s
permissions. (The default admin user has such permissions.) The Manage > Control Panel
menu item opens a screen with the tabs of interest.
Tooltips describing these screens and fields appear when you hover the cursor over fields, or
the blue circle surrounding a question mark next to them.
Getting Started
17
Page 18

ProSafe Network Management Software NMS200
CAUTION:
When you create users with less-than-Administrator permissions, those
users may not see all of the features described in this guide.
Portal > Users
Add users with the following steps:
1. Click Manage
2. Click the Ad
3. Enter th
4. Af
e details of the new user (Name, Job Title, and so on).
ter you click Save notice that the right panel expands to include additional information.
> Control Panel > Portal Users.
d tab under the Users heading at the top of the page.
Make sure you specify a Password. Organizations, Communities, and Roles let you
specify those for the new user.
5. Af
ter clicking the Portal > Users item on the left, click Actions > Manage Pages to the right
of the user to specify which pages this user will see.
6. Y
ou can also click Action > Permissions to configure
ou can also specify contact information and Instant Messenger information. The built-in
7. Y
instant messaging is available to users in NMS200 in addition to such instant messaging.
8. Fin
ally, notice the Miscellaneous information that specifies Announcements to which this
user subscribes, Display Settings and Comments.
Once you have configured a user
, you can click the View All tab and use the Action > menu to
the right of the user listed in Portal > Users on the Control Panel page to do the following:
• Edit — Re-configure the selected user.
• Permis
• Manage Pa
sions — Manage the user’s access to and control over various parts of the portal.
ges — Configure the Public or Private pages for a user, depending on the
selected tab. Possible actions here include changing the look and feel of pages (for
computers and mobile browsers), adding pages and child pages, and importing or
exporting page configurations. Notice that you can configure meta t ags, and javascript on
these pages too.
Exports are in
you are using. The export screen lets you select specific features, and the date range of
pages to export.
• Deac
click the Deactivate button above the listed users.
.lar
format, and go to the download location configured in the browser
Tip: If
you want to set up several pages already configured elsewhere for
another user, or even for an entire community of users, export those
pages from their origin, then Manage Pages from the Action menu for the
user or community.
tivate — Retires a user configured on your system. You can also check users and
Getting Started
18
Page 19
ProSafe Network Management Software NMS200
Your organization has a number of geographic locations and you plan to manage the network
infrastructure for all these locations using RC7 Synergy. You can define the geographic
locations to which devices can be associated. This will help you manage and view your
network, grouped by location or branches. See Locations on page 83 for the specifics about
the portlet where you can set up locations.
Tip: To edit your own information as a signed-in user, simply click your login
name in the upper right corner of the portal screen.
Portal > Communities
Add Communities with the following steps:
1. Click Man
2. Click the Add t
3. Ente
4. By clicking Actio
permissions, viewable pages and so on.
age > Control Panel and navigate to Portal > Communities.
ab under the Communities heading at the top of the page.
r the details of the new community (Name, Description).
ns to the right of any listed Community, you can also select its membership,
Database Aging Policies (DAP)
Database Aging Policies prevent the NMS200 database from filling up by saving designated
contents to an archive file on a specified cycle. Database Aging Policies configure which
contents to archive, the archive location, and the configuration of that archive file.
To view and manage such policies, right click an item with them (for example, an alarm), and
under Redcell click Database Aging Policies.
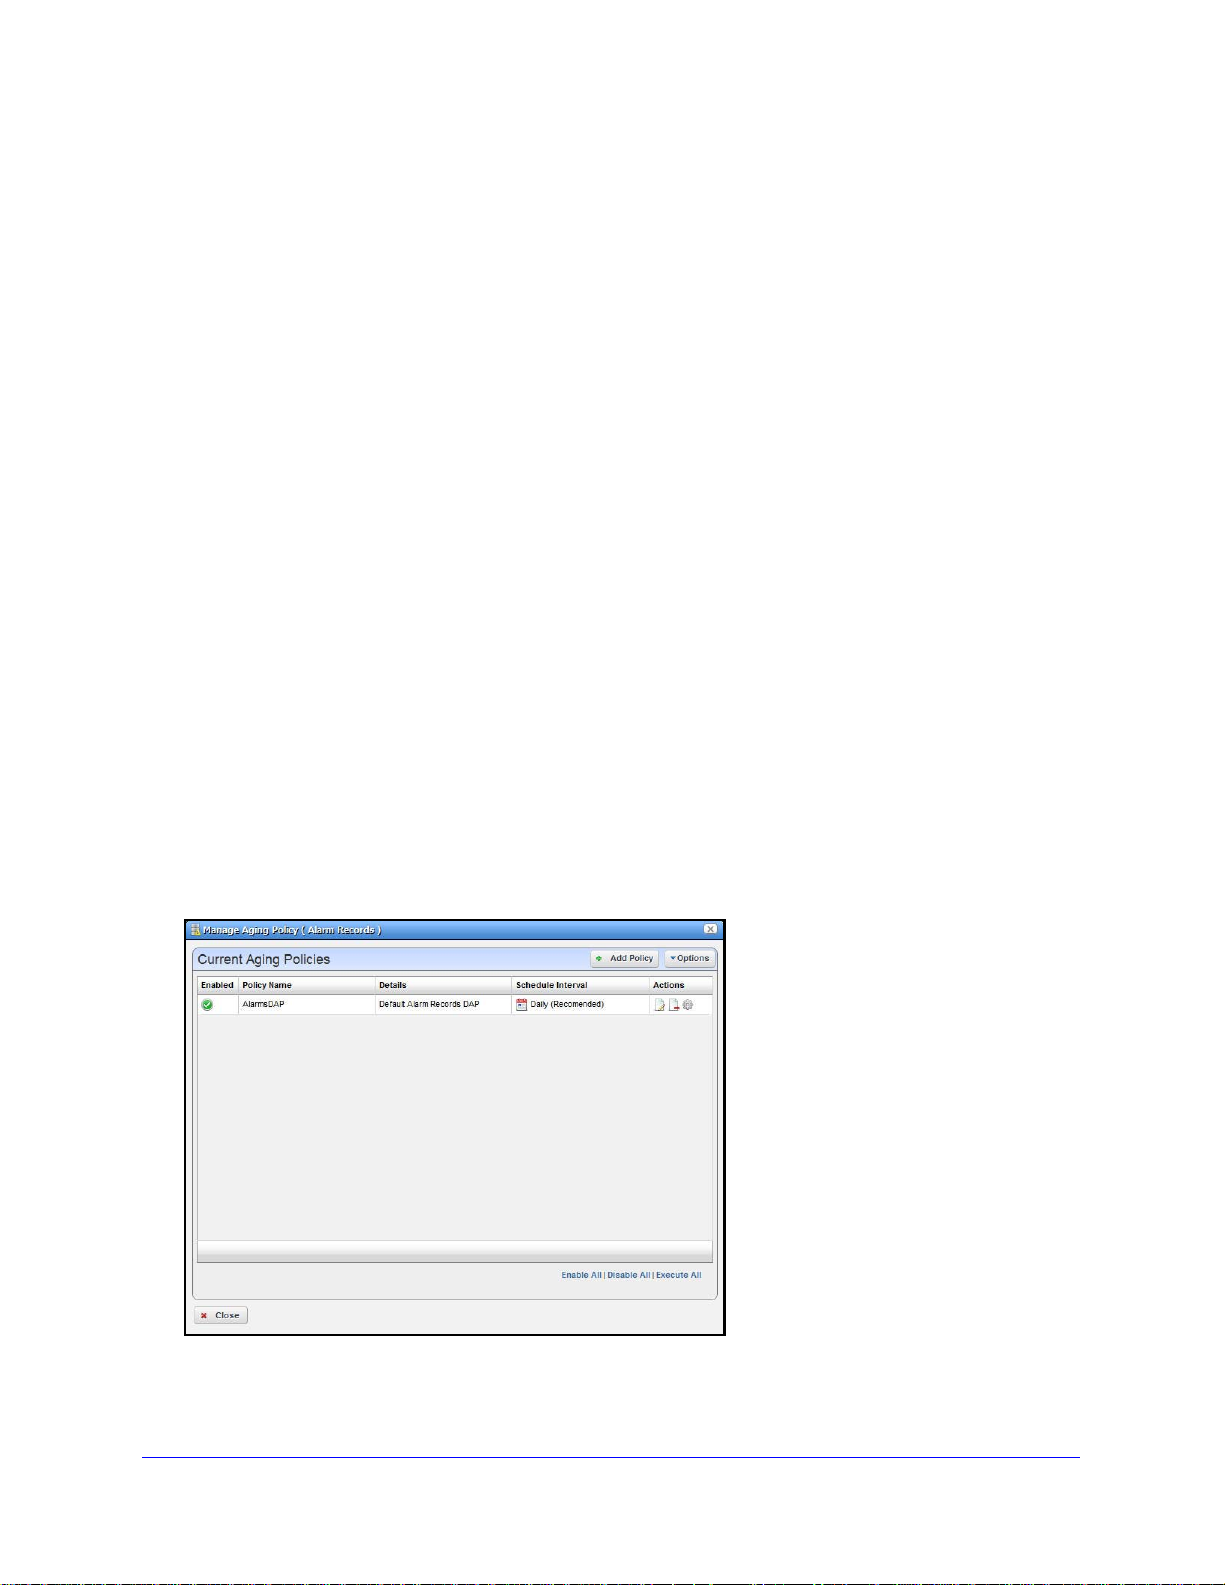
Policies appear in the Aging Policies tab of this screen, with columns that indicate whether
the policy is Enabled, the Policy Name, Details (description), Scheduled Intervals and icons
Getting Started
19
Page 20
ProSafe Network Management Software NMS200
triggering three Actions (Edit, Delete and Execute). Notice that the bottom right corner of this
page also lets you Enable / Disable / Execute All policies listed.
DAP Workflow
The following are steps typical for implementing DAP:
1. From the screen list
ing Database Aging Policies (DAP), click Add Policy, and select a
policy from the displayed list of alternatives.
2. Th
3. In
is opens Aging Policies Editor.
the Aging Policies > General tab, specify the name, schedule interval, whether this policy
is Enabled, and so on.
pecify the Archive Location. Those listed are the Repositories listed on the Repositories
4. S
tab. You can manage those on tha t tab.
5. In
the Aging Policies Options tab, specify either the archiving and retention you want, or
further specify Sub-Policies that refine the items archived, and specify archiving and
retention for those sub-policy elements. Which one you can specify depends on t he type of
DAP you
6. Click Apply
are configuring.
until the displayed screen is the DAP manager.
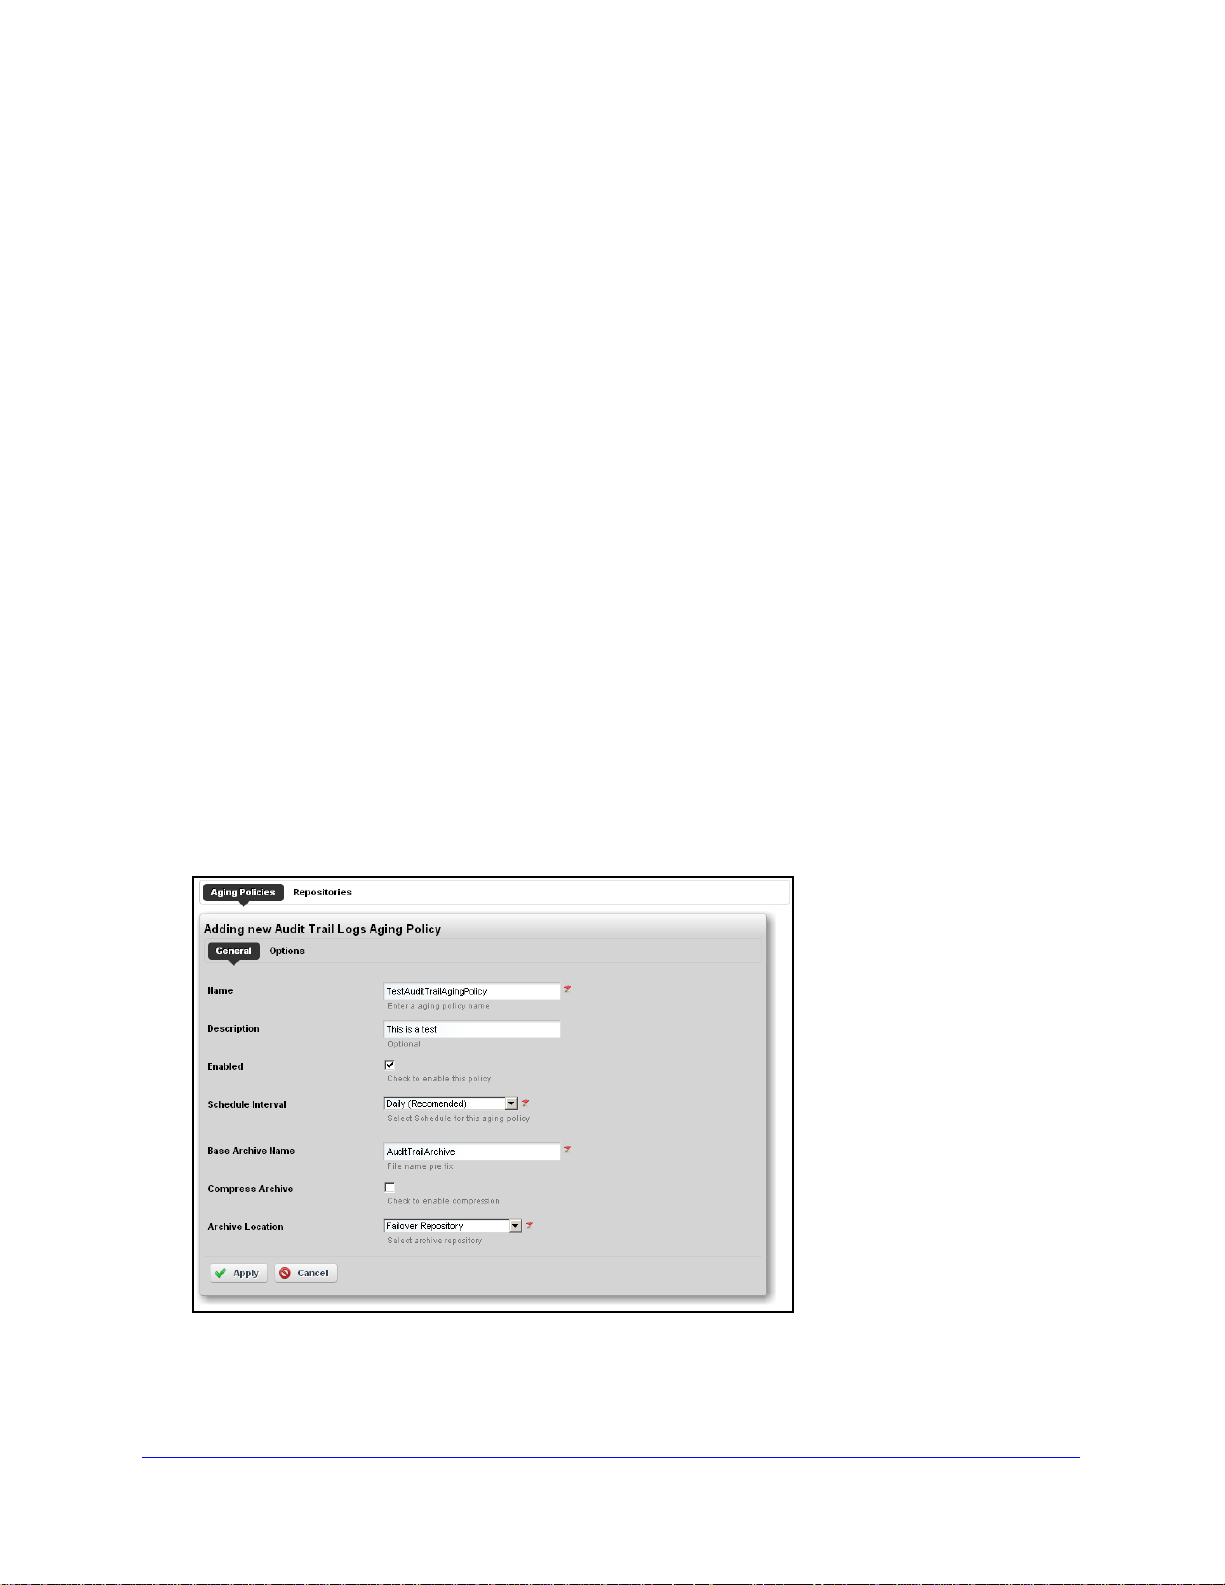
Aging Policies Editor
When you click Add Policy in the upper right corner of the Database Aging Policies (DAP)
screen, first a selector appears where you can click on the kind of policy you want to create,
then the editor appears. If you click the Edit icon to the right of a listed policy, the Aging
Policies Editor appears with that policy’s information already filled out, ready to modify.
The General screen has the following fields:
• Name — An identifier for the policy
Getting Started
20
Page 21
ProSafe Network Management Software NMS200
• Description — A text description of the policy
• Enabled — Check to enable the policy.
• Sc
• Base Archive
• Compress Archiv
hedule Interval — Use the pick list to select an interval. Once you have configured an
interval here, you can re-configure it in the Schedules Portlet.
Name — The prefix for the archived file.
e — Check to compress the archive file.
• Arc
hive Location — Select from the available Repositories in the pick list.
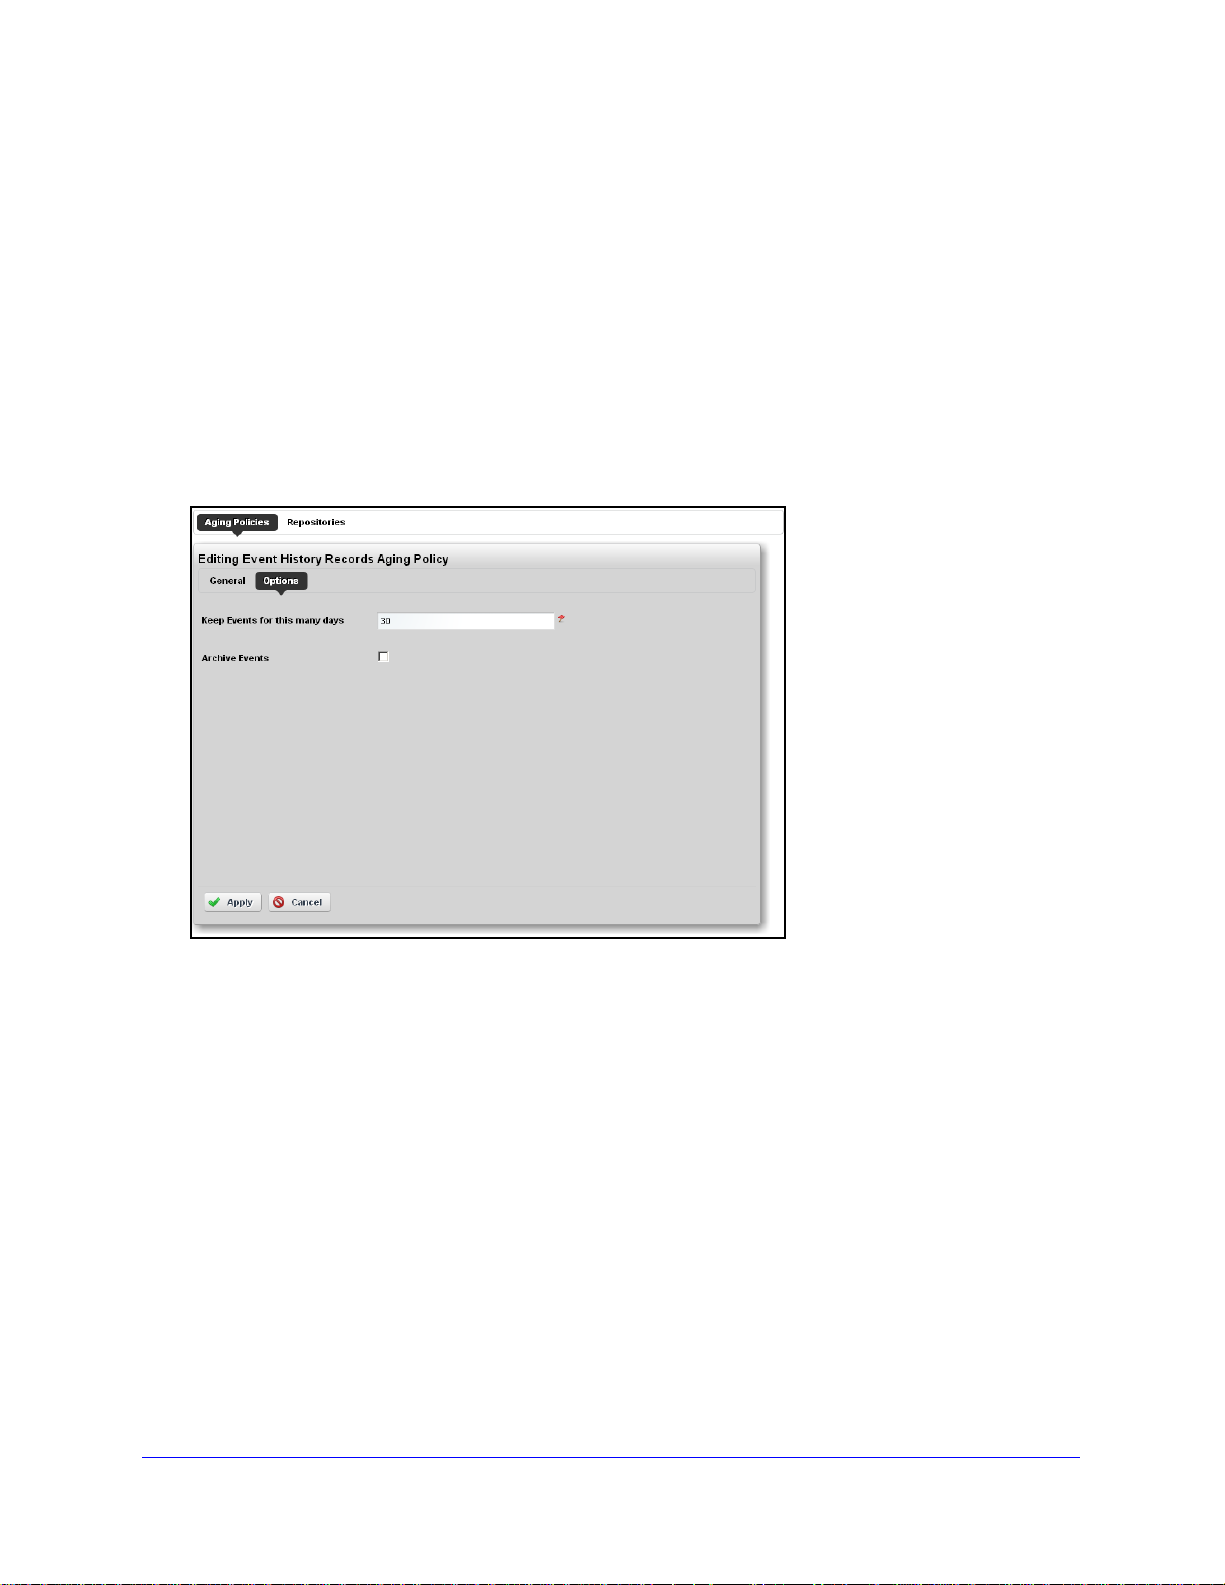
Aging Policies Options
The Options tab in this editor can vary, depending on the type of policy.
Typical fields can include the following:
• Keep [Aged
before archiving it.
• Arc
hive [Aged Item] — Check this to activated archiving according to this policy.
Item] for this many days — The number of days to keep the aged item
Getting Started
21
Page 22
ProSafe Network Management Software NMS200
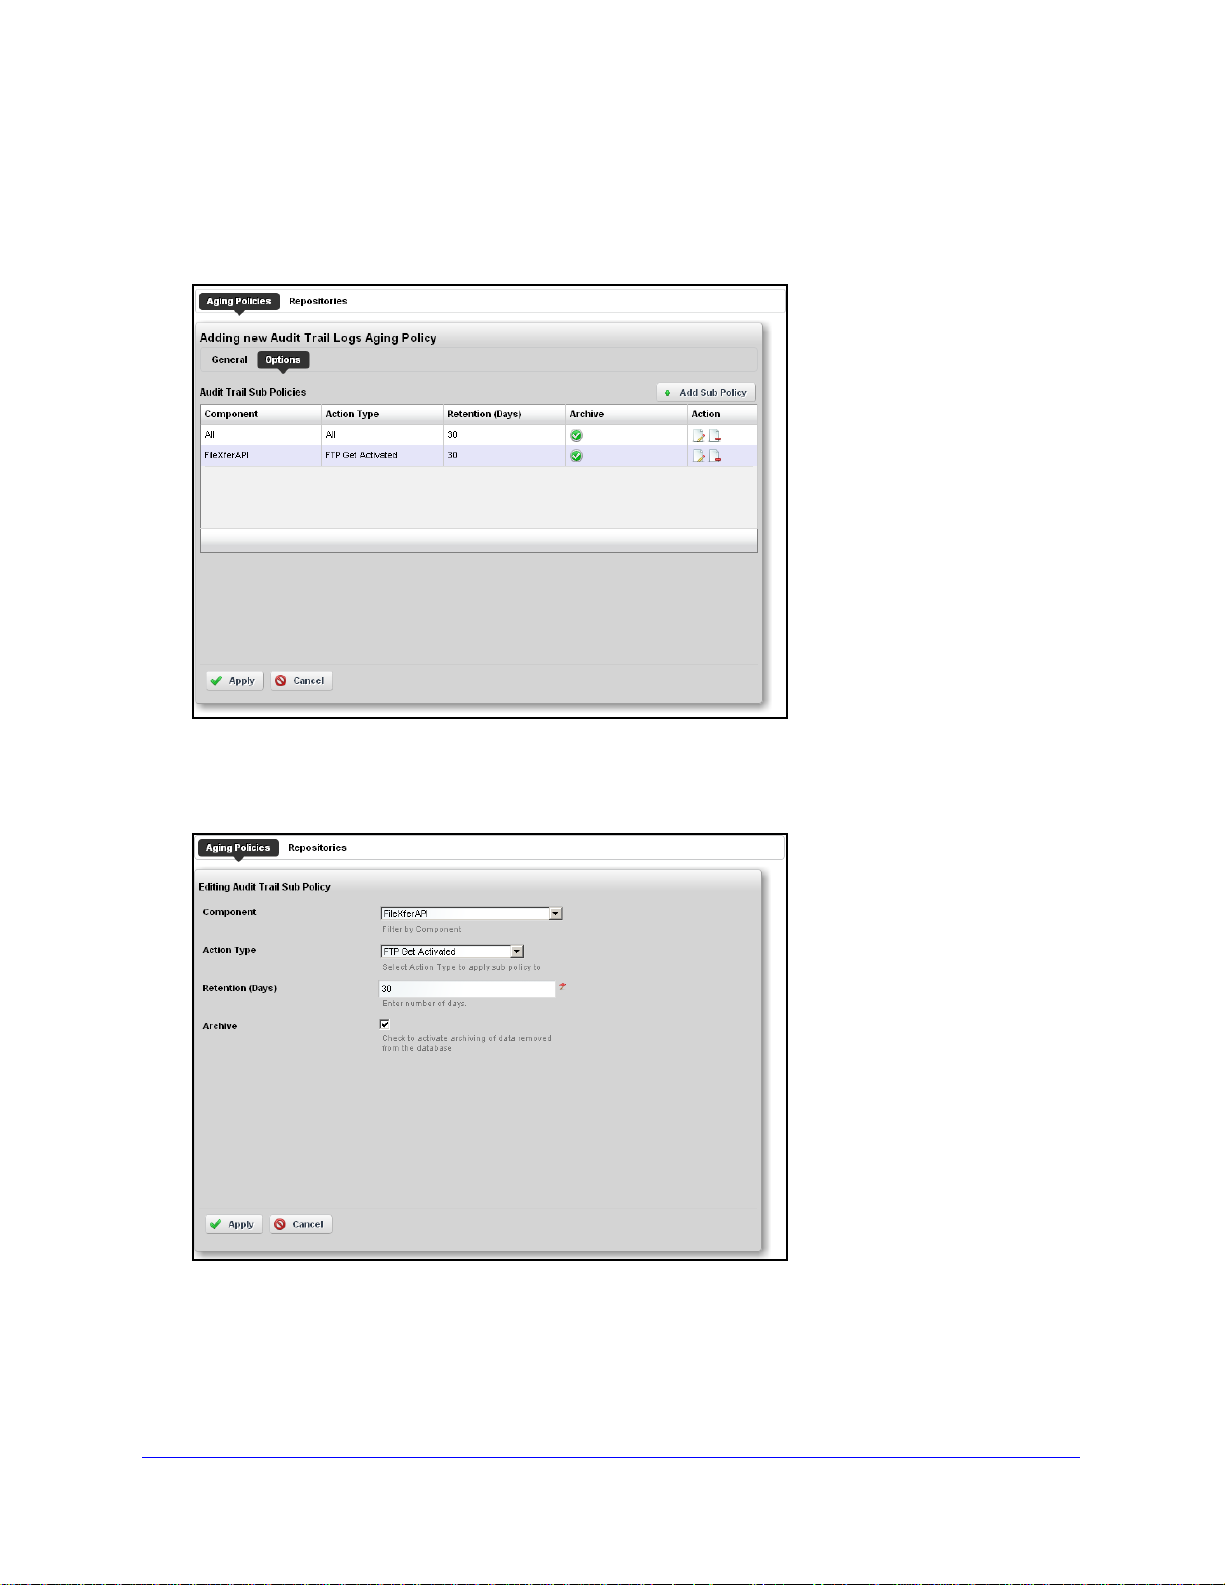
Sub-Policies
Some types of Database Aging Policies can have sub-policies that further refine the aging f or
their type of contents.
These appear listed in the Aging Policies Options tab. Click Add Sub Policy to create them.
Notice that you can Edit or Delete listed policies with the icons in the far-right Action column
in this list.
Such sub-policies contain the following types of fields:
• Compo
• Action
• Reten
nent — Select the component for the sub-policy from the pick list.
Type — This further sub-classifies the Component.
tion (Days) — The number of days to keep the aged item before archiving it.
Getting Started
22
Page 23
ProSafe Network Management Software NMS200
• Archive — Check this to activated archiving according to this policy.
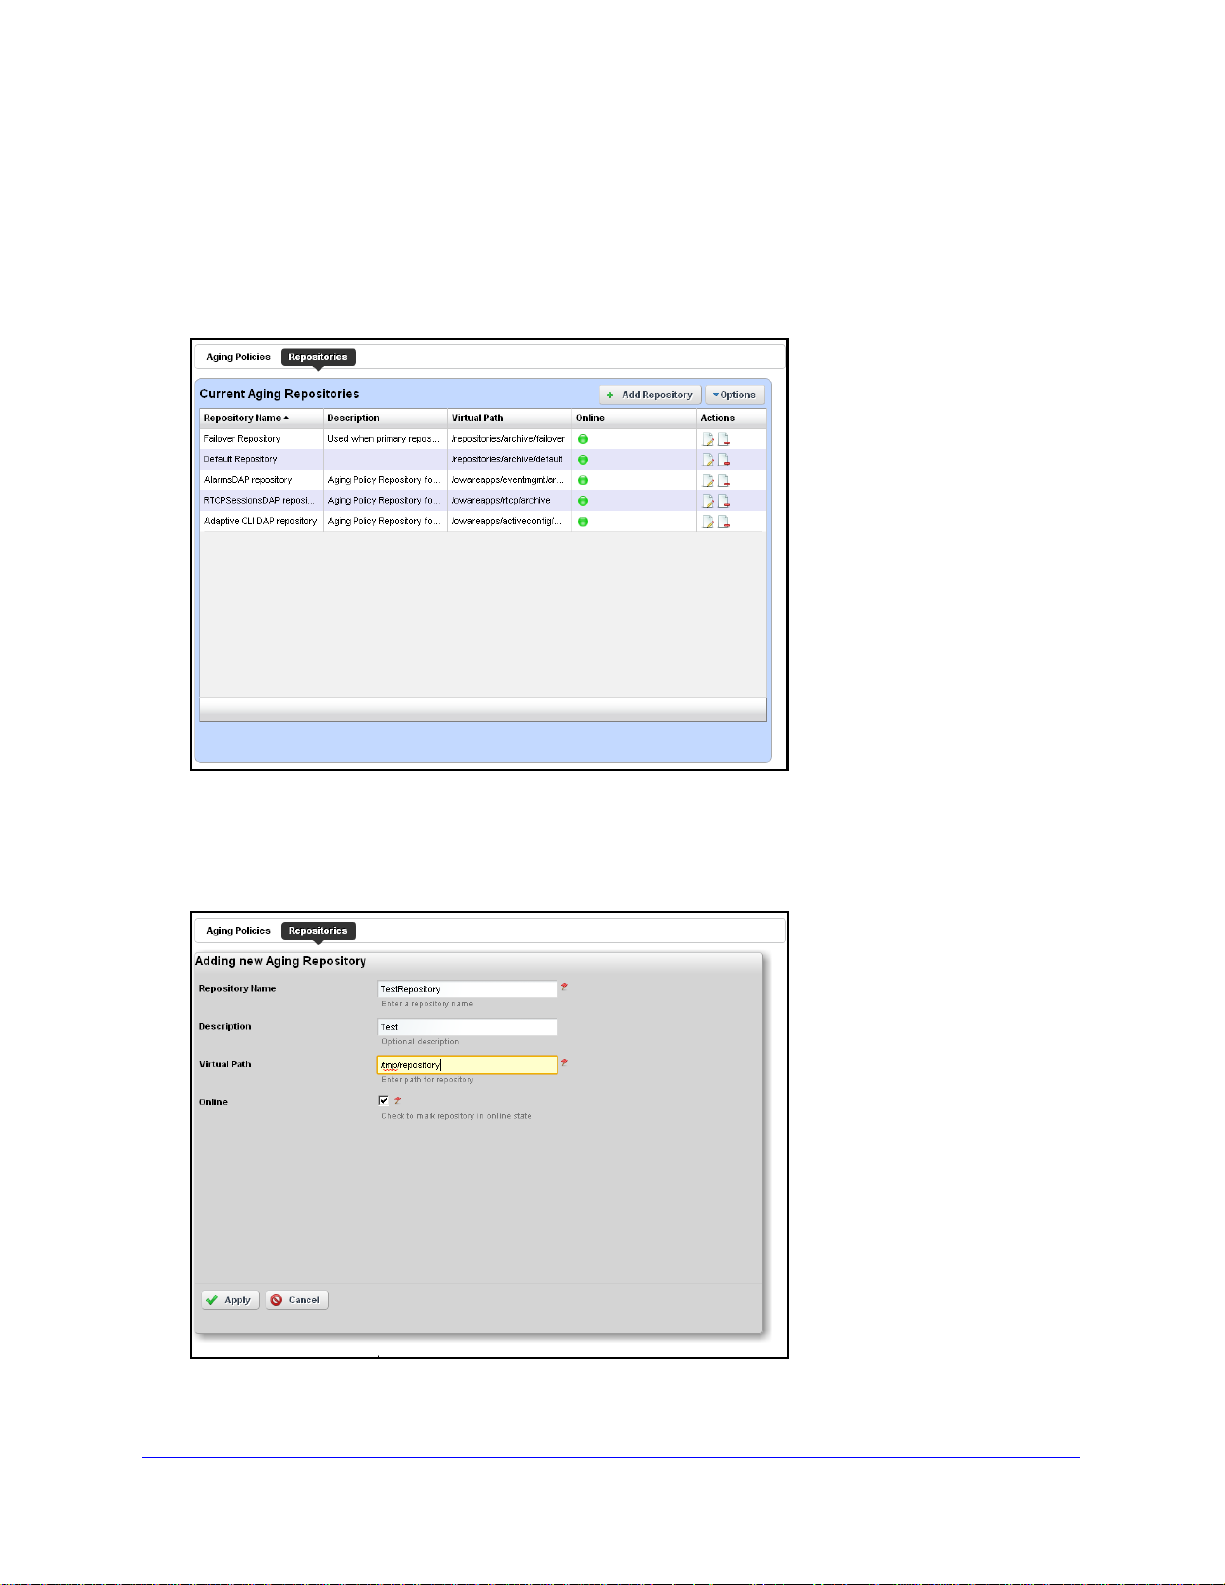
Repositories
When you select a repository in the Aging Policies Editor, the available policies come from
what is configured in this tab of the editor.
Available repositories appear listed in the initial screen. Like the Aging Policies Editor, you
can click Add Repository to create a new repository, and Edit or Delete selected, listed
policies with the icons in the Action column. Notice the listed policies indicated whether the
archiving destination is Online with a green icon (this is red, when the destination is offline).
When you Add Repository or Edit an existing one, the following fields appear in the editor:
Getting Started
23
Page 24
ProSafe Network Management Software NMS200
• Repository Name — An identifier for the archiving destination.
• Desc
• Vi
• Online — Check this to put this repository online.
ription — A text comment.
rtual Path — This is the path relative to the installation root directory.
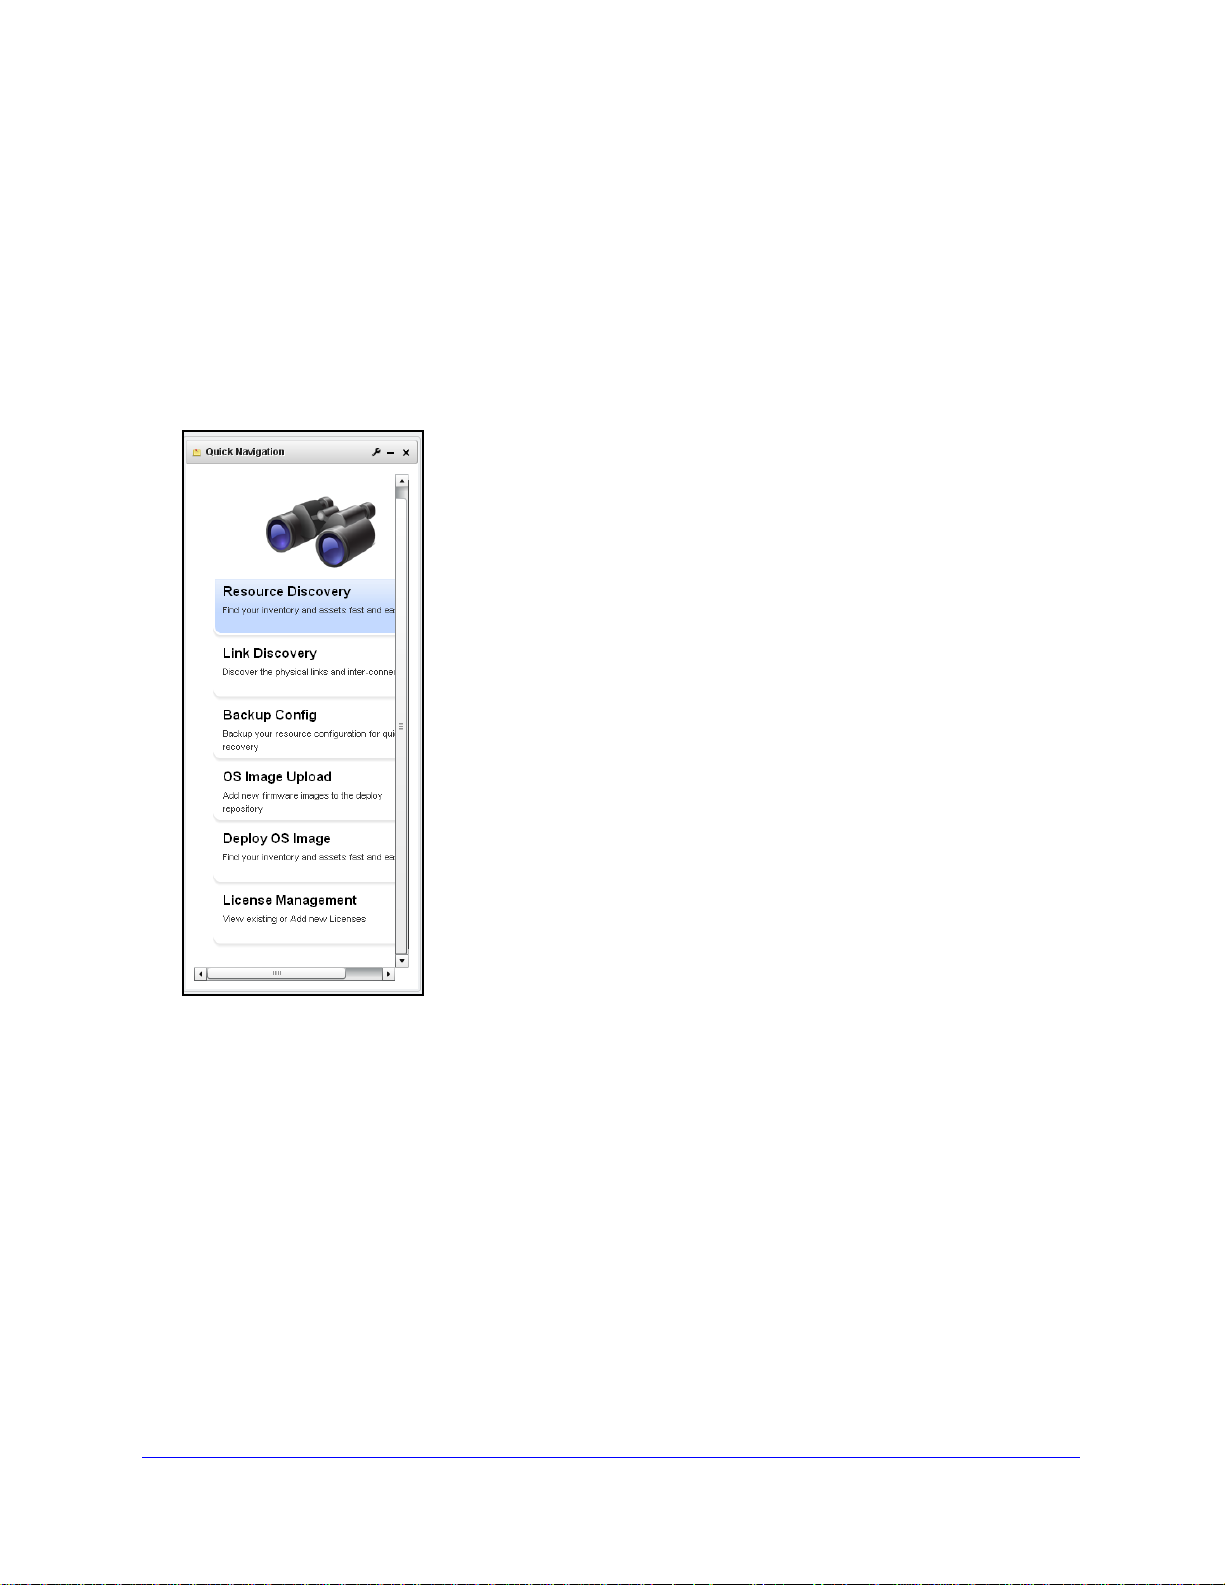
Quick Navigation
The Quick Navigation portlet lets you quickly perform some basic tasks:
• Resource Discovery—Discover devices in your network with the Quick Discovery
defaults, or lets you construct a Quick Discove
Discovery on
• Link Discovery — After you have discovered resources, this discovers their connections.
See Link Discovery on p
• Back
• OS Image
• Deplo
up Config Files — This lets you back up discovered devices’ configuration files.
Before you can use this feature, you must have servers configured as described in
Netrestore File Servers on p
Management on
page 78 for more about these capabilities.
y OS Image — This deploys firmware updates. To deploy images, you must have
File Servers configured, as described above for Backup. See Deploy OS on p
page 123 for details.
age 145.
age 30 and/or File Servers on page 74. See also File
page 138.
Upload — Upload firmware updates for devices. See OS Image Editor on
Getting Started
24
ry profile if none exists. See Resource
age 80.
Page 25
ProSafe Network Management Software NMS200
• View / Add Licenses — This lets you see and manage the licensed capabilities of
NMS200. See License Viewer below for details.
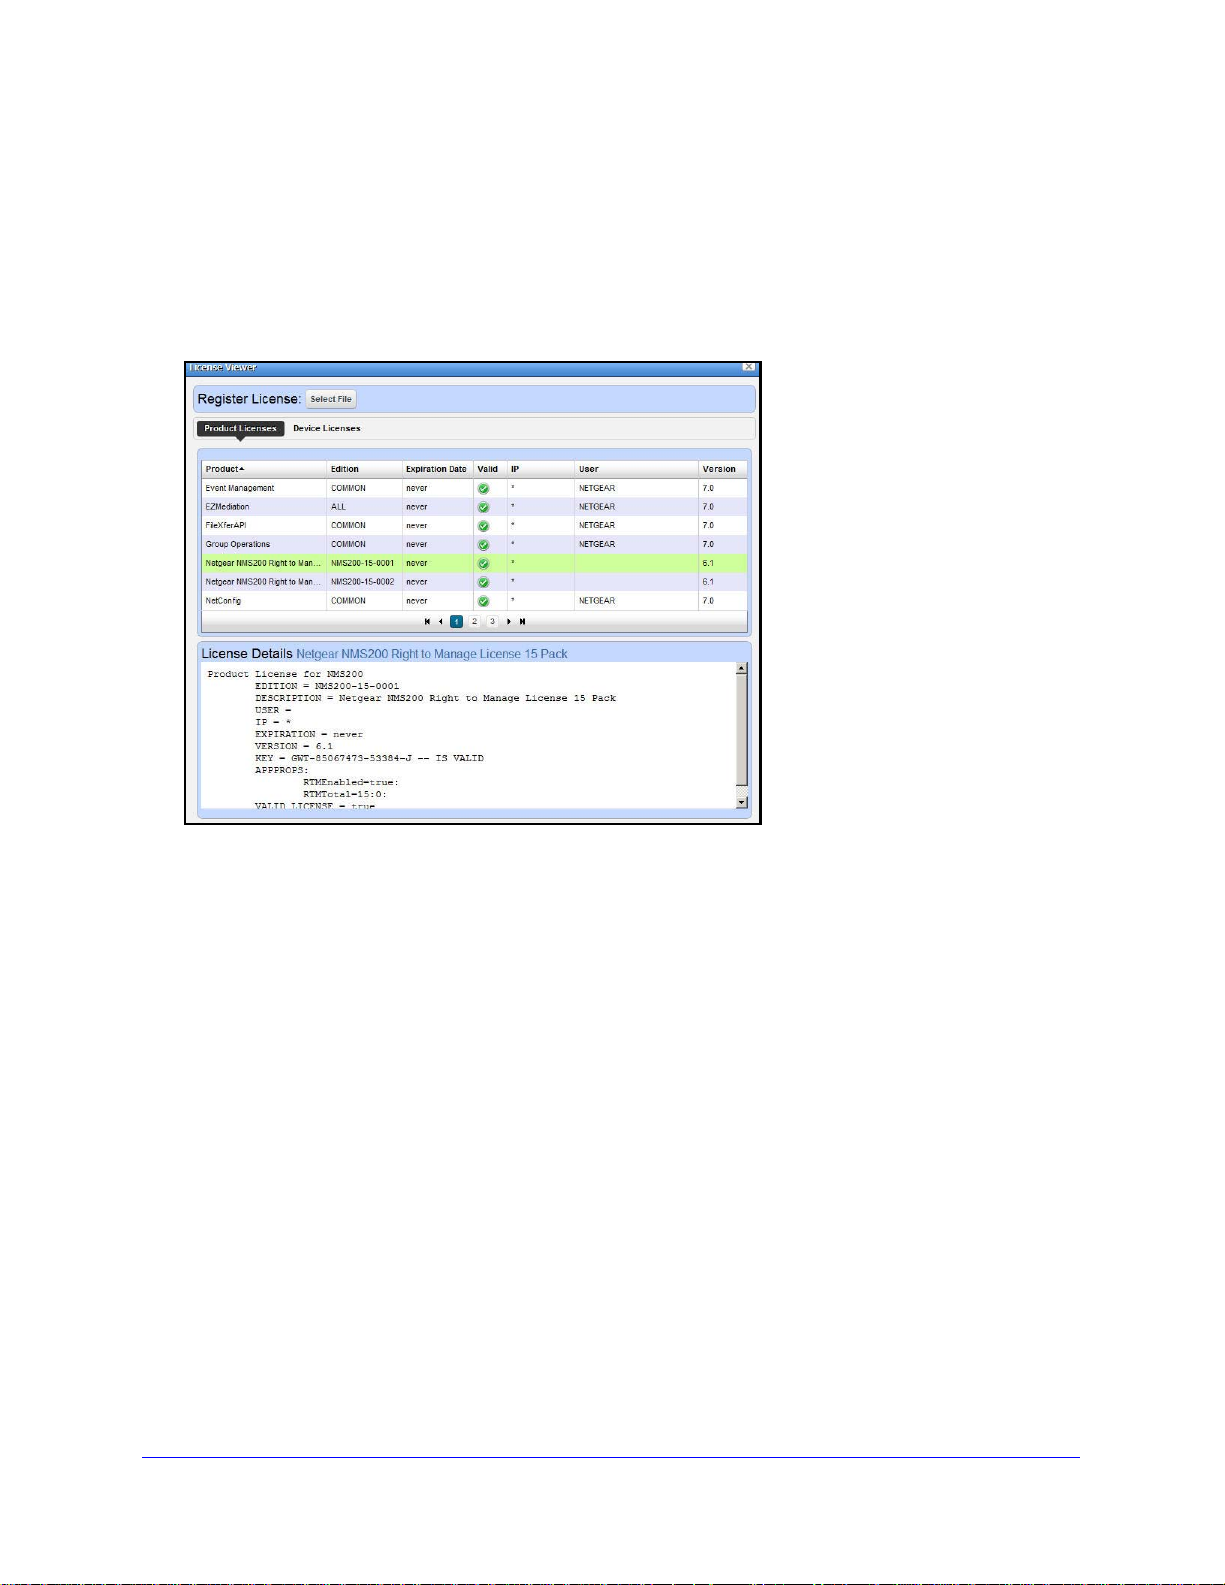
License Viewer
This screen appears when you click View / Add Licenses in the Quick Navigation portlet.
Register License
To register a license click the Sele
select a license file.
You must restart application server or wait up to 15 minutes before a license modification
takes effect. If you import a license that, for example, changes the application’s expiration
date, it does not immediately take effect. You must restart application server or wait at least
15 minutes.
Product Licenses
This portion of the License Viewer lists the
displaying the Product, Edition, Expire Date, whether the license is Valid, any IP restrictions,
the User who installed the product and/or license, and the Version of product for which the
license is valid.
License Details: [Product]
This portion of the screen displays the details of a license selected in the Registered Prod uct
Licenses portion of the License Viewer screen. It is blank if you have not select ed a license in
the list above this panel.
ct File button at the top, and use the subsequent screen to
products for which you have licenses already,
Getting Started
25
Page 26
Device Licenses
ProSafe Network Management Software NMS200
This tab displays the M
the Variance between maximum and managed, and Type of license.
aximum Allowed number of licenses for devices, the Count Managed
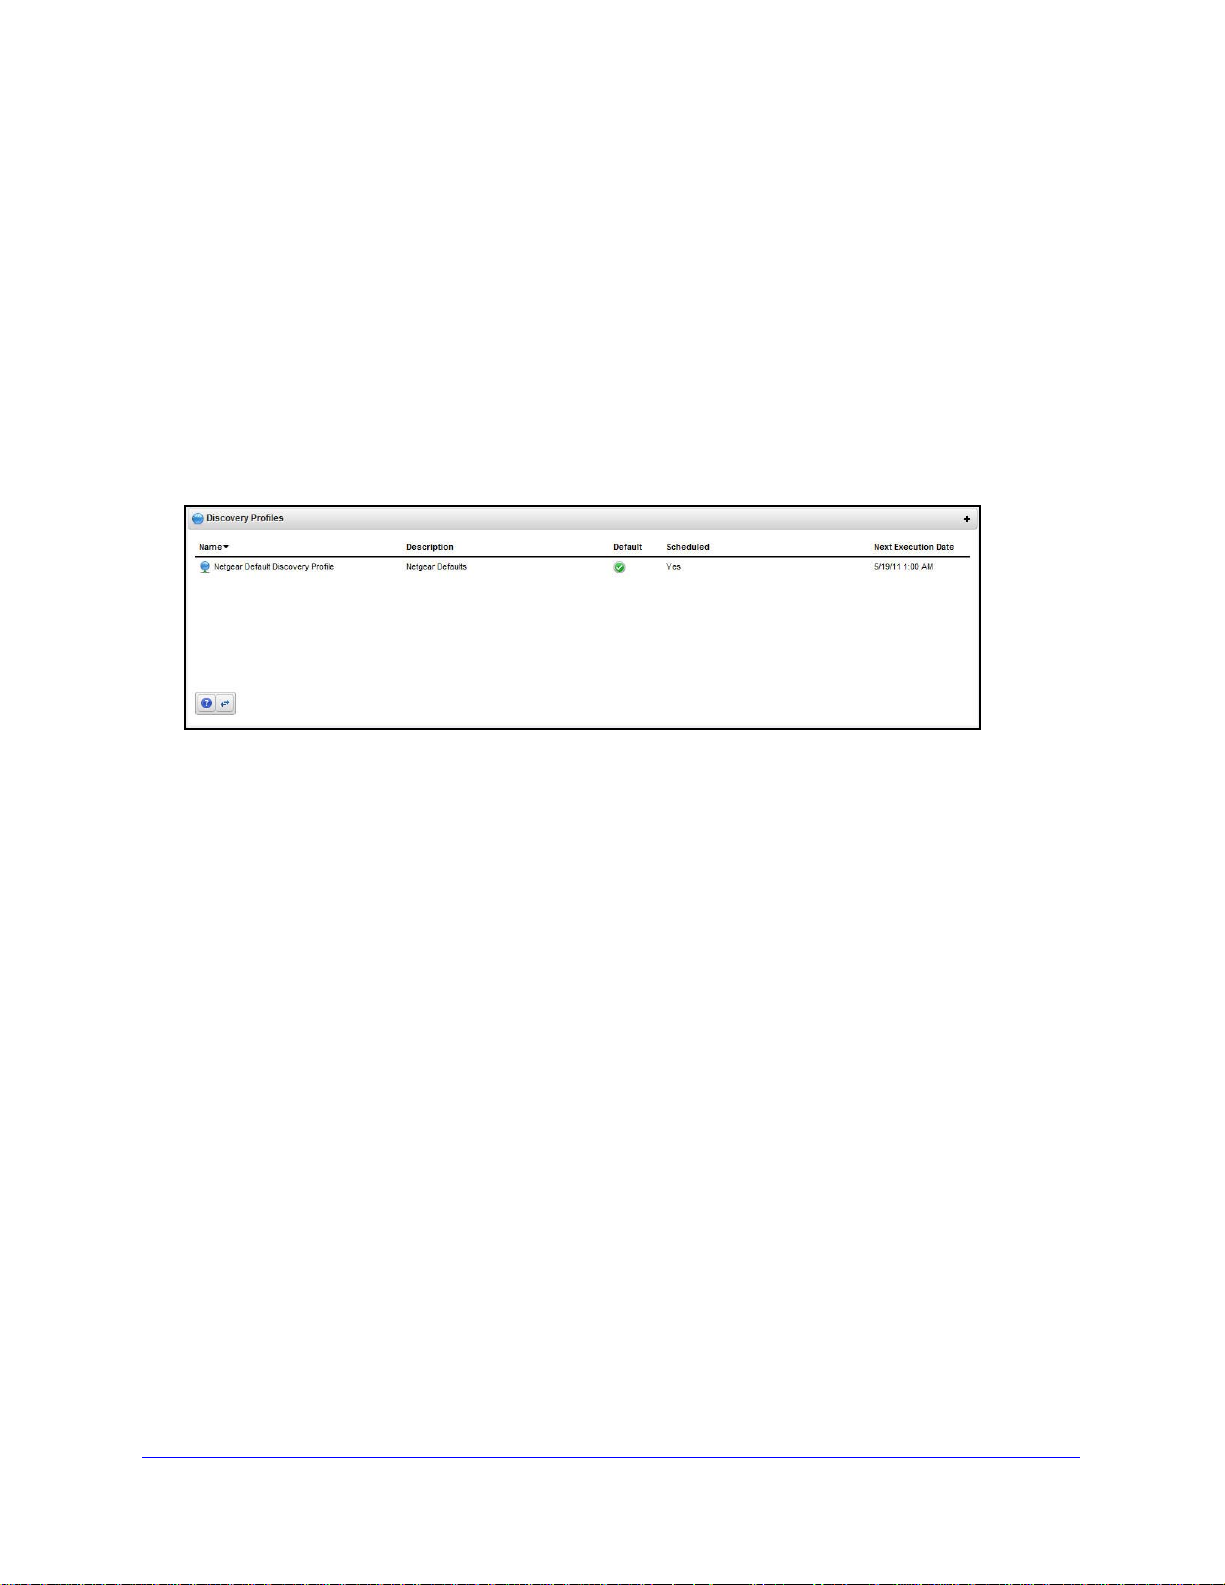
Discovery
To begin managing resources in your network, you must discover them to store their
information in the application database. This begins with Discovery Profiles portlet. By
default, this appears in the Admin page.
Discovery profiles configure equipment discovery for NMS200.
The summary view displays the Name, Description, Default (the green check indicates the
default profile), whether the profile is Scheduled and Next Execution Date for scheduled
discovery.
To Begin
1. Right click th
2. Th
e Discovery Profile Editor appears, with a step-by-step set of screens to configure
resource discovery. You can navigate through it by clicking the screen tab names at the top,
by clicking the Next button at the bottom of the page.
or
e Discovery Profiles list and select New.
Discovery Profile Editor
Use this editor to configure discovery . Baseline discovery is the initial discovery to compare to
later discoveries. Follow these steps to discover equipment on your network:
3. General Par
default.
4. Profile Options — Select the Device Naming Fo
discovered), whether to Manage by IP address or hostname, and check whether to Resolve
Hostname(s), ICMP Ping Device(s), Manage ICMP-only Device(s), or Manage
Unclassified Device(s). This last checkbox determines whether NMS200 attempts to
manage devices that have no device driver installed. Management may be possible, but
more limited than for devices with drivers installed, provided this capability is one you have
licensed.
ameters — Set the Name, Description and whether this profile is the baseline
rmat (how the device appears in lists, once
Getting Started
26
Page 27

ProSafe Network Management Software NMS200
Network
5. Af
ter you click Next, the Network screen appears.
• Network
Type and Addresses — Select the type of entry in the pick list (IP
Address(es), CIDR Address, Hostname, SNMP Broadcast, Subnet).
Tip: Y
ou can specify an IP Address range by separating the beginning and
end with a dash. For example: 192.168.1.1 - 192.168.1.240.
The tooltips in the data entry field describe what valid entries look like.
6. Authenticati
on — You can create new, or add existing authentications. See for details.
Notice that authentications appear with Edit / Delete icons and Up / Down arrows on their
right. The Edit icon opens the authentication editor. Click the arrows to arrange the order in
which credentials are tried (top first). Ordering only applies when two credentials are of the
same type.
Inspect
7. Inspe
ct — This screen lets you preview the discovery profile’s actions and access to
devices. If you clicked Next rather than Inspect at the bottom of the previous screen, click
Start Inspection in the top right corner of this screen to begin the inspection process that
validates the device’s credentials.
Notice that the I
nspection Status fields at the bottom of the screen indicate the success or
failure of Ping, Hostname resolution, and Authentications.
If the device does not match all required authentications, you can click the Fix it icon
left) to edit them for the selected device.
When authentications are unsuccessful, yo
u can click Previous to go to the Network
screen and remove or edit them.
(far
8. Save — Click Save to preserve the pro
file. You can then right -click it to select Execute and
begin discovery. If you select Execute from the profile editor, NMS200 does not save the
profile to execute later.
Results
9. Execu
te — Clicking Execute begins discovery, and the message traffic between NMS200
and the device appears on the Results screen.
This is a standard Audit screen.
See Audit Trail / Jobs Screen on page 45 for more about
it.
10. A message
(Discovery Profile Execute is complete) appears in the Messages at the
bottom left of the status bar.
Tip: Y
ou can also schedule discovery profiles to run periodically, updating
your NMS200 database with any network changes. For more, see
Schedules on p
age 48.
Getting Started
27
Page 28
ProSafe Network Management Software NMS200
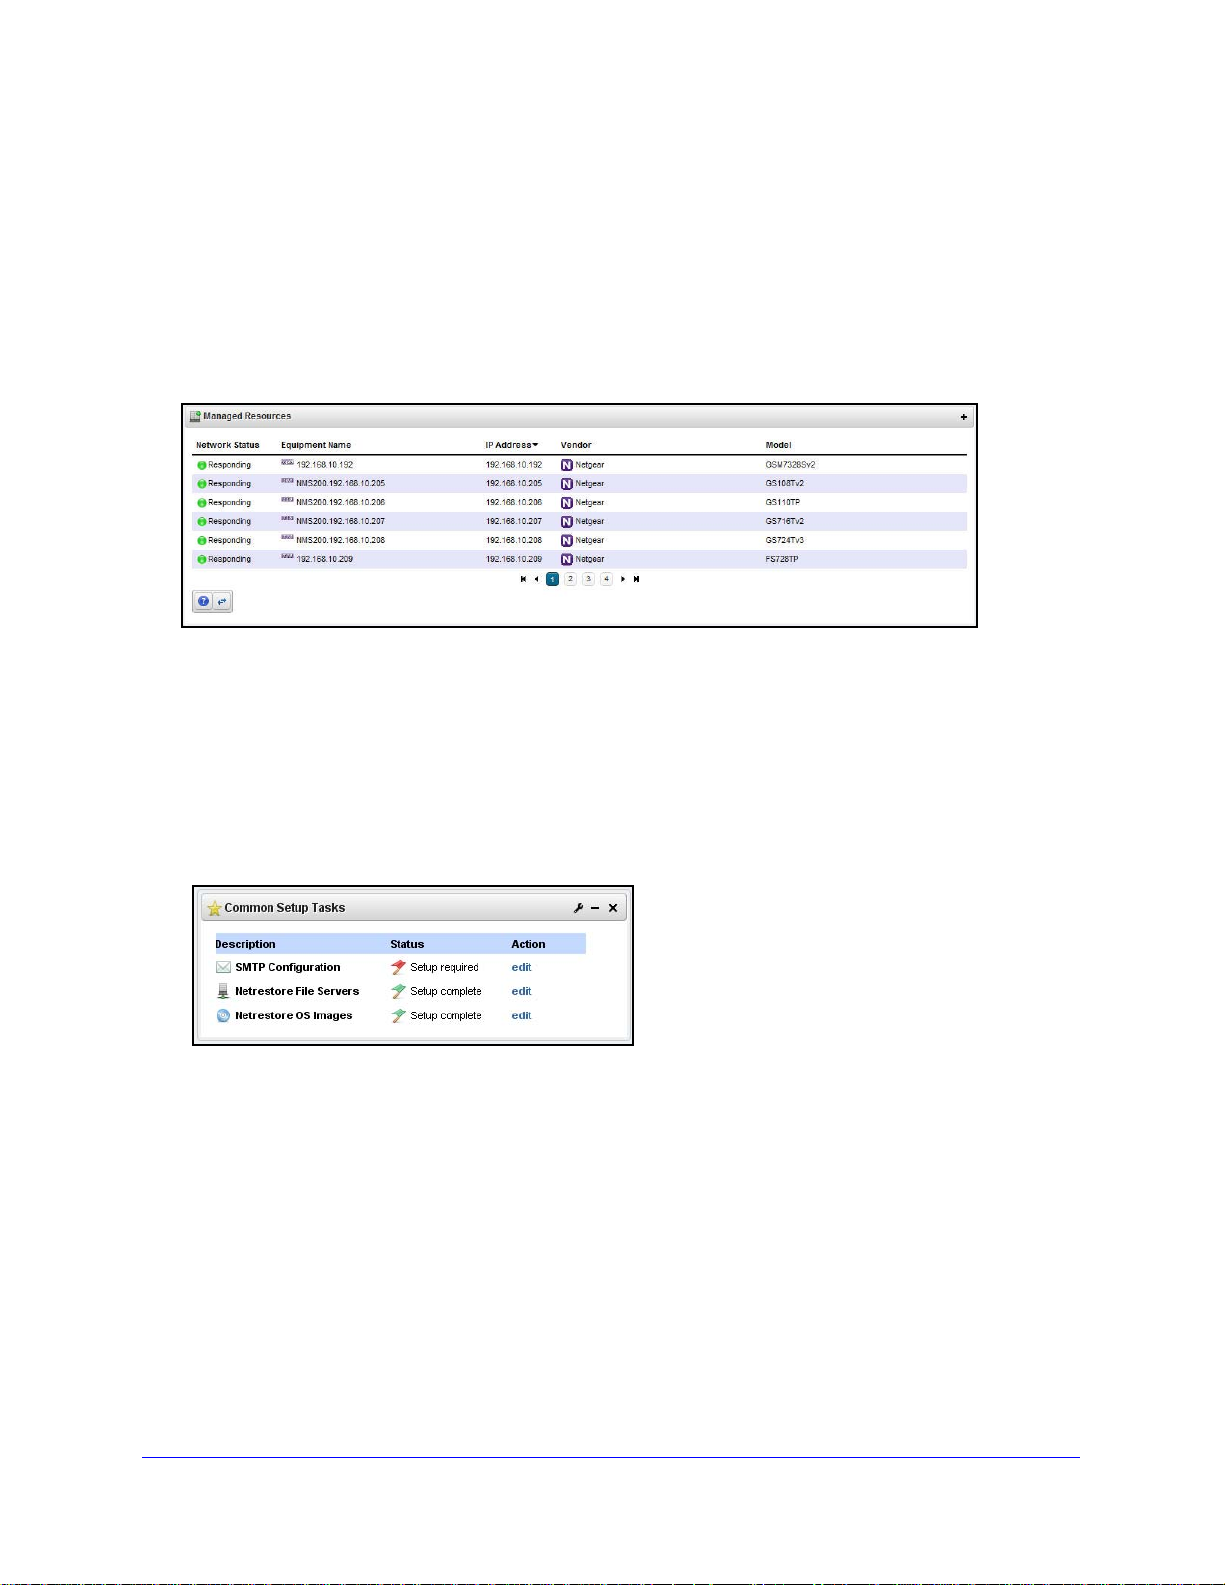
11. The devices in your network now appear in the Managed Resources portlet, and elsewhere
(in Topology, for example).
See Discovery Pro
files on page 124 for more details about this process.
Managed Resources
This portlet displays all the devices you have discovered.
See Managed Resources on page 133 for the details of this screen’s capabilities.
See also Managed Resource Groups on page 130.
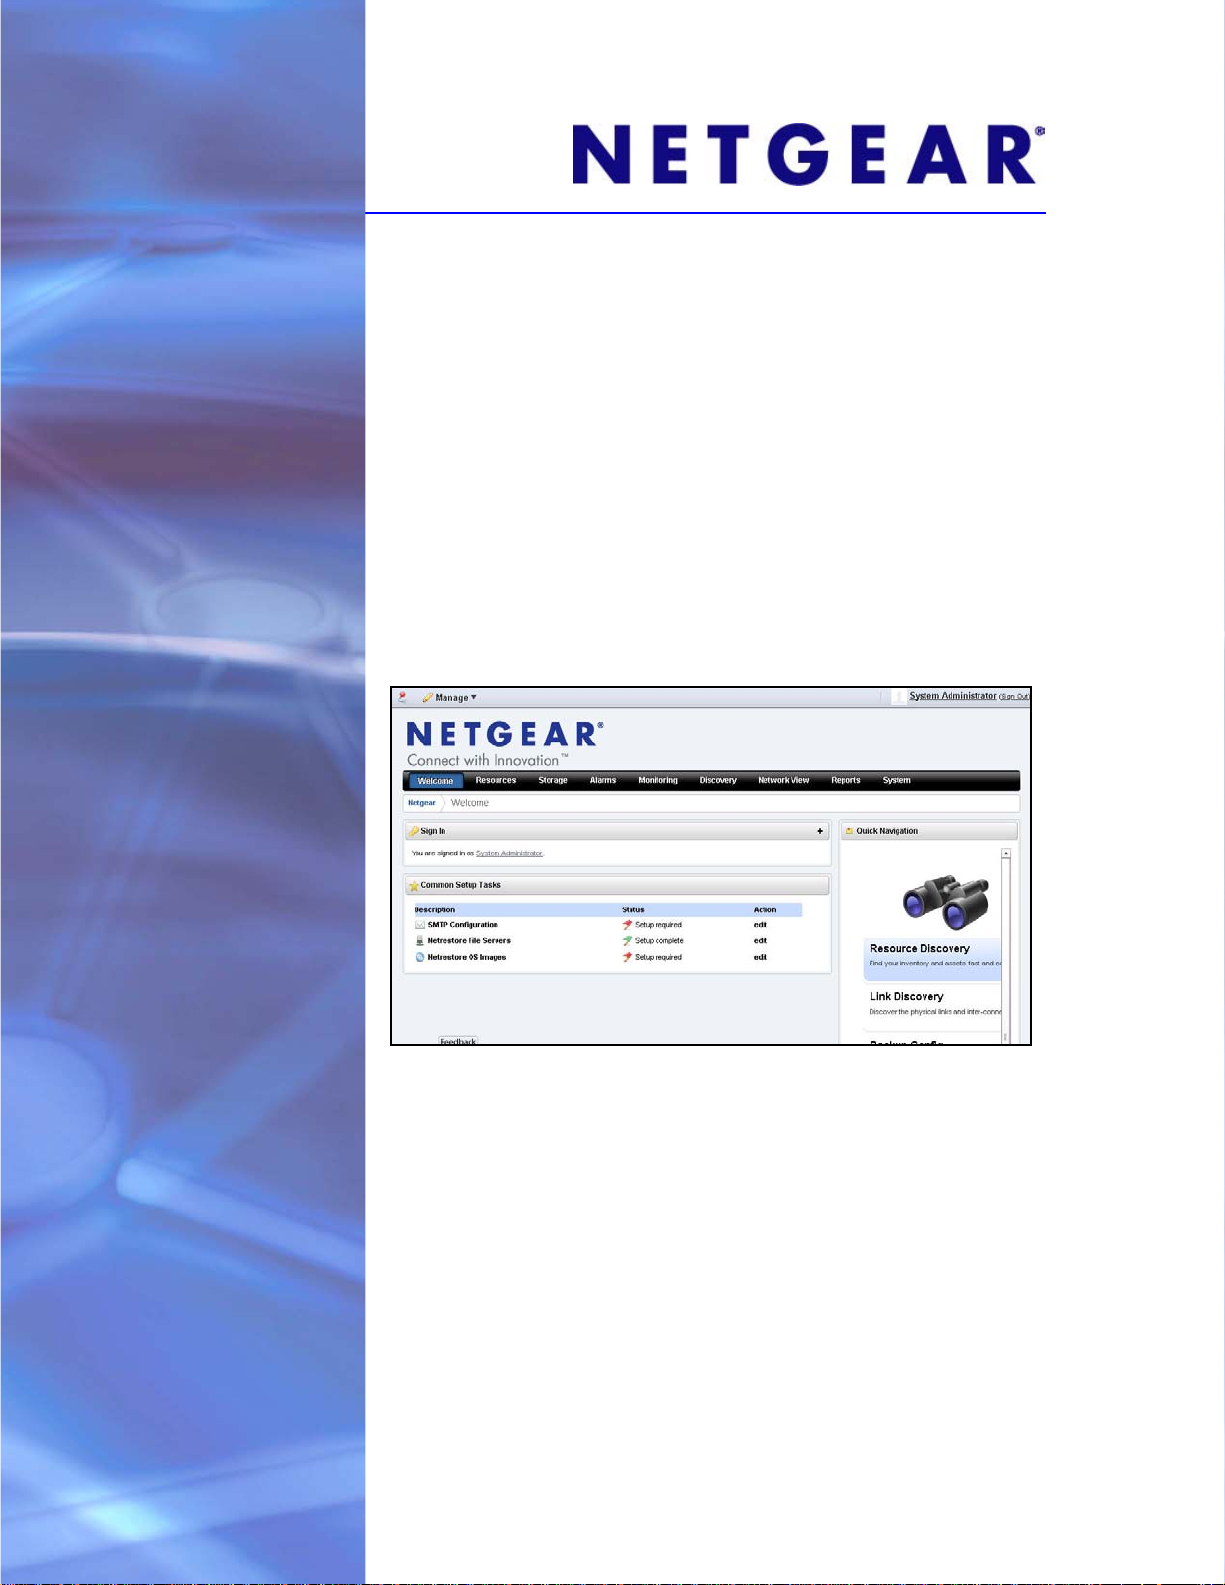
Common Setup Tasks
By default this portlet appears on the first page after you sign in, and reminds you of the
following common tasks:
• SMTP Configuration
• Netrestore File Servers
• Netre
A red flag appears with the “Setup required” message in the S
not configured. Configuring them displays a green flag with the “Setup complete” message.
Click the edit link in the Action column to open editors for each of these.
store OS Images
tatus column when these are
SMTP Configuration
You can use NMS200’s messaging capabilities to communicate with other users, but if you
want to receive e-mails automated by actions like configuration file backups, NMS200 must
Getting Started
28
Page 29
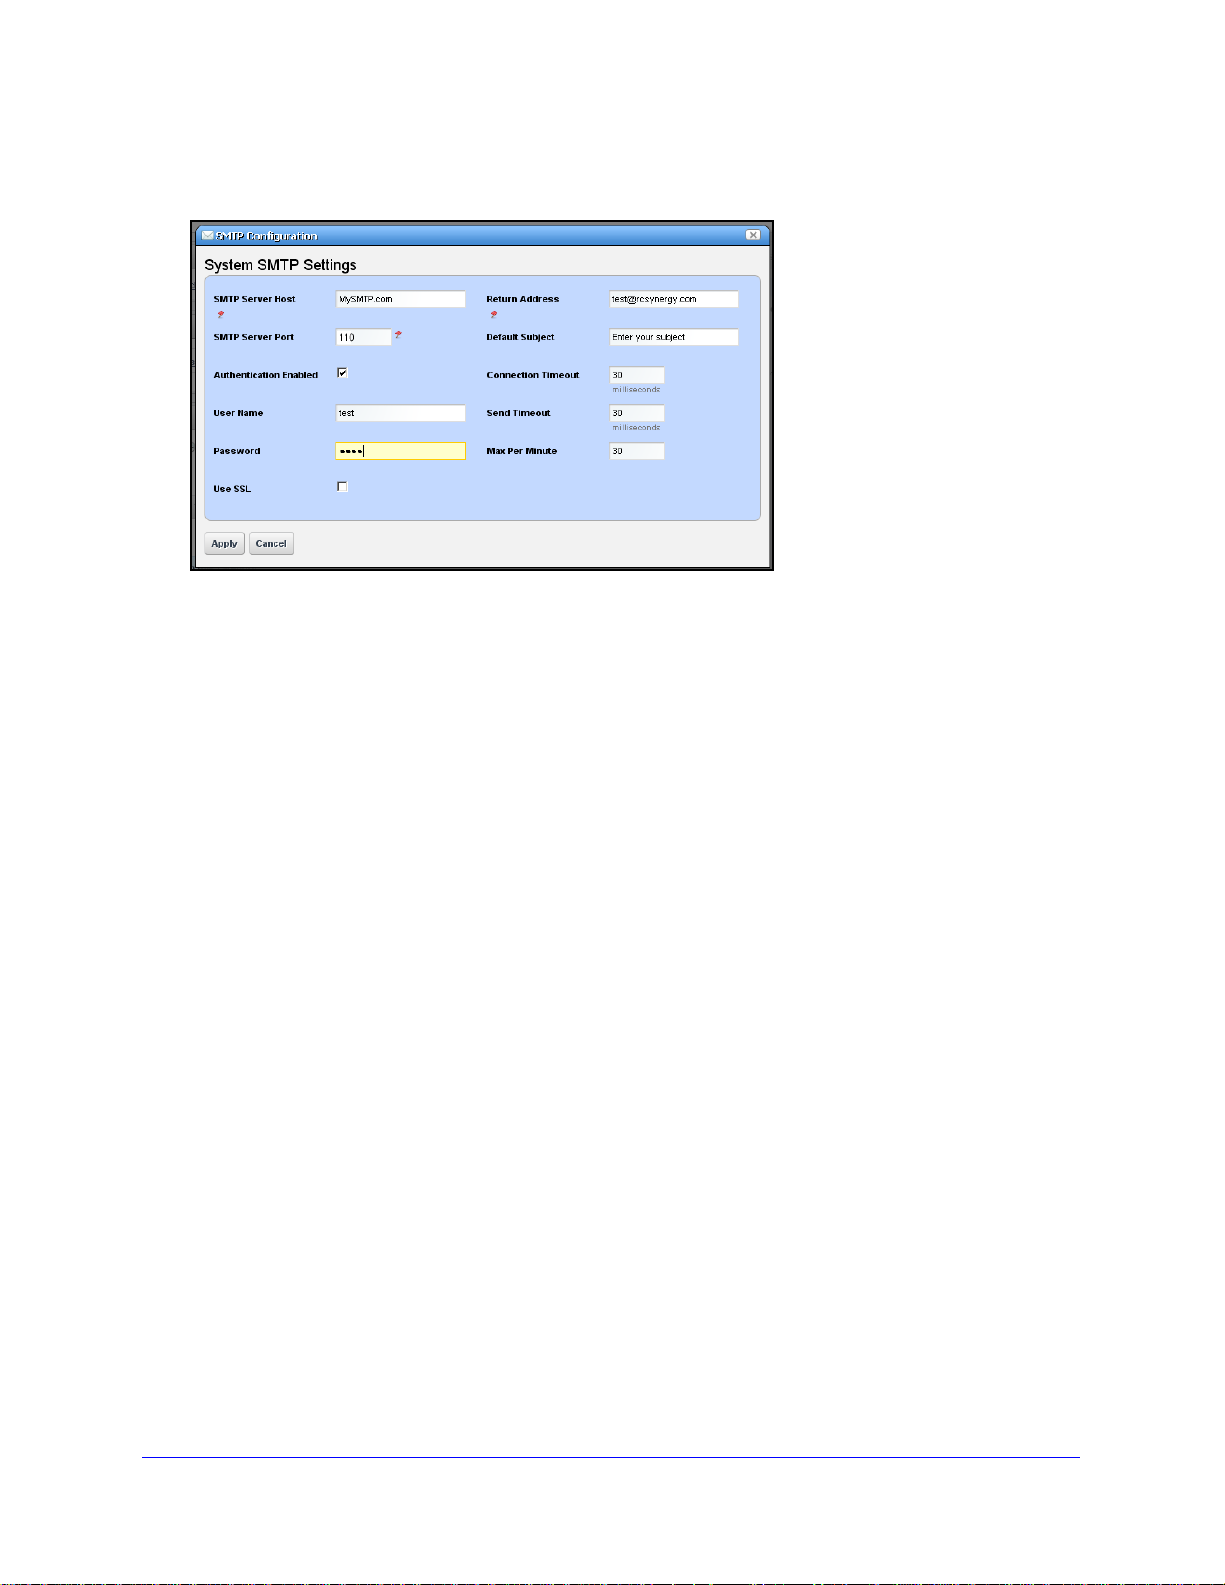
ProSafe Network Management Software NMS200
have a mail account. This screen configures the e-mail server so NMS200 can send such
automated e-mails.
This screen contains the following fields:
• SMTP Server Host — The IP address or hostname of your SMTP server.
• SMTP Server Port — The port for your SMTP server (110 is typical).
• Authentic
ation Enabled — Check this to enable authentication for this server. Checking
enables the next two fields.
• User Name — The login ID for the SMTP server, if authentication is enabled.
• Password — The password for the SMTP server, if authentication is enabled.
• Use SSL — Enable Secure Sockets Layer protocol to in
teract with your SMTP server.
• Return Address — The return address for mail sent from NMS200.
• Default Subj
ect — Text that appears by default in the subject line of mail sent by
NMS200.
• Connectio
• Max
Per Minute — The maximum number of e-mails NMS200 can send per minute.
n / Send Timeout — The time-outs for mail sent by NMS200.
• SMTP Server Host — The IP address or hostname of your SMTP server.
• SMTP Server Host — The IP address or hostname of your SMTP server.
Two settings for e-mail servers appear in Control Panel, one in the Control Panel > Portal >
Settings Mail Host Names edit screen, and another in Control Panel > Server Administration
> Mail. The Portal-based e-mail settings help Administrators limit signups to e-mails only
existing in their organization. The screen in that panel provides a list of allowed domain
names, if that feature is enabled.
Control Panel > Server Administration > Mail is where to configure the Main server and
authentication for routing mail
Getting Started
29
Page 30
ProSafe Network Management Software NMS200
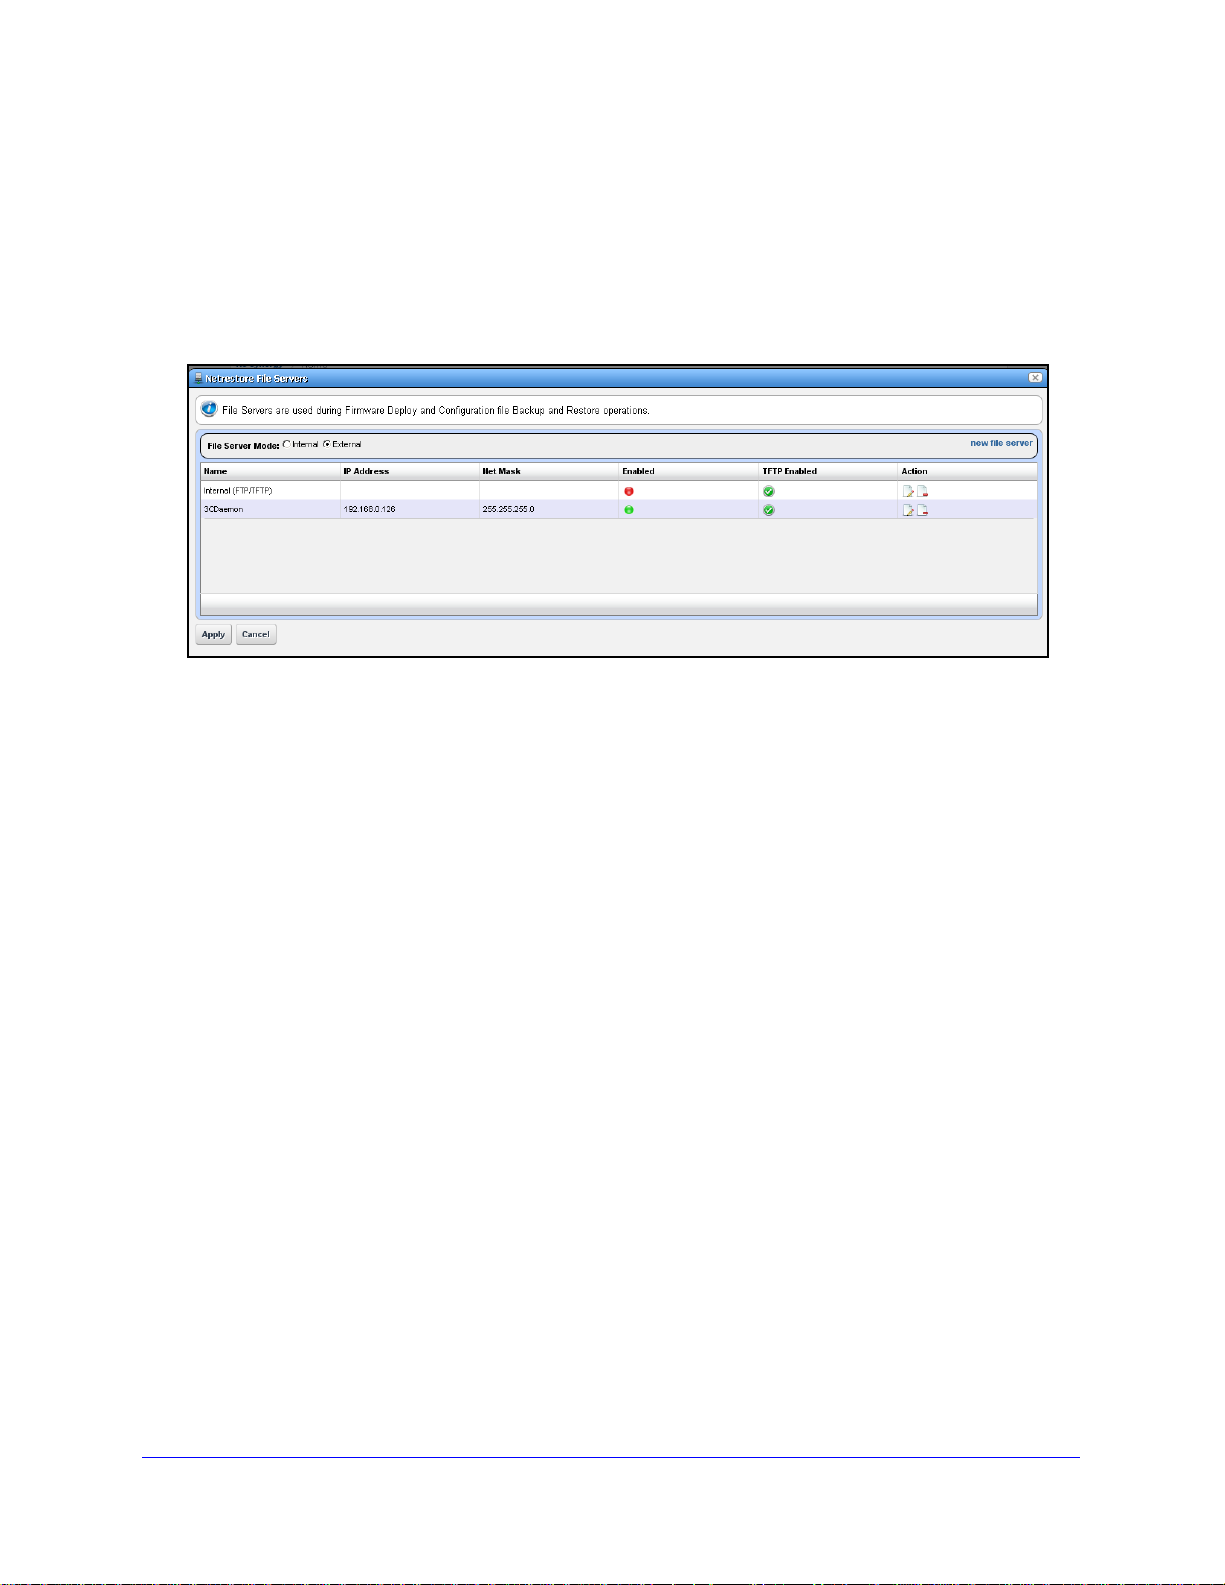
Netrestore File Servers
The Netrestore file servers provide FTP connections for retrieving and deploying devices’
configuration files, and for deploying firmware updates to devices on your network. See File
Servers on page 74 for a description of the portlet that manages file servers. If you want to
configure servers from the Common Setup Tasks portlet, a slightly different screen appears
when you click Edit.
This displays configured file servers. Configure new servers by clicking the new file server
link in the upper right corner. The editing process after that is as described in File Server
Editor on page 76.
Getting Started
30
Page 31

3. Portal Conventions
This section explains how to navigate and configure the NMS200 web portal. Because this
portal is based on open source features, and can be so flexible, this is not a comprehensive
catalog of all its features. The following discusses only features significant for using
NMS200.
The application’s web Portal contains the following common elements:
• The Dock
• Status Bar Messaging
• Menu Bar
• Portlets
3
Because the elements that manage the Web portal a
only NMS200’s most important, or most-frequently-used features appear documented below.
Tip: Cli
Because they are so fundamental to NMS200’s functioning, th
following portlets:
• Audit Trail Portlet
• Schedules
cking Go to in the Dock and selecting My Private Pages to open
pages not shared with others, unless you configure sharing. (See
Sharing on p
age 43.)
re so flexible, and can be very detailed,
is section also describes the
31
Page 32

ProSafe Network Management Software NMS200
Help / Tooltips
In NMS200, the far right menu item is typically a Help page, with links to this document and
others, but the whole application has extensive tooltips that appear when you the cursor over
the blue circle with a question mark (the help icon).
Tooltips also display the full content for most fields in portlets. If the screen does not allow a
full field to appear, you can still find out what is in a field by letting the tooltip re-state what it
contains.
Refresh
You may have to refresh your browser to see screen updates. One way to refresh without
re-loading the entire window, however, is to change the Max items displayed number for a
portlet.
The Back Button
Although browsers have a Back button, this is not always the best way to return to a previous
screen within the portal. If it is available, the Return to previous button in the upper right
corner of a screen provides the most dependable way to return to a previous screen. It
typically goes back to a page rather than a maximized view of a portlet.
Portal Conventions
32
Page 33

ProSafe Network Management Software NMS200
Show Versions
To see which products are installed, and what versions, select the Manage > Show Versions
menu item.
This can be critical information if you request support for your NMS200 installation. The
Application Software Versions screen appears with the product versions listed in the bottom.
Device drivers list supported devices and their operating systems. This can be important for
troubleshooting, and is vital information for support.
The Dock
This bar appears at the top of portal pages. Its exact appearance depends on your package.
With it, you can navigate to portal pages and content.
Click the down arrow to see menus for items on the dock. Here are its functions
• Pin — The “push pin” on the left side of this bar keeps the dock at the top of the screen
n the page is large enough to scroll past it.
whe
• Man
age — This menu lets you alter the following:
- Co
The NMS200 elements include Show Versions on
ntrol Panel — Lets you manage your account, and communities throughout the
portal. See Control Panel o
n page 17 for instructions about this.
page 33.
• Go T
o — Makes the selected screen type appear. Select My Public Pages or My Private
Pages, for example. When you add a new Community, its configured pages appear in this
menu too.
Portal Conventions
33
Page 34

ProSafe Network Management Software NMS200
CAUTION:
NMS200 does not support multiple tab browsing as a reliable way to see
its screens. Pages overcome that limitation.
• [User Name] (sign out)— Opens the My Account screen in Control Panel, where you can
configure your name, job title, image, and so on. The Sign out link lets you log out of
NMS200.
Status Bar Messaging
The Message bar appears at the bottom of the portal. On the left, it catalogs messages and
notifications you have received, including generated reports. Click the magnifying glass to the
right of reports and Job Status notifications to open a separate viewing window. The panel
includes Current and Archived messages tabs.
Chat / Conferencing
This portion of the message bar lets you send and receive messages to colleagues who are
online at the same time you are.
This has the following fields and other possibilities for you to configure:
• [Sayi
ng] — Configure this text in the menu produced by the Settings icon (the next item).
Portal Conventions
34
Page 35

ProSafe Network Management Software NMS200
• (Settings) — This configures your user settings for any online chat with your
colleagues, including the saying, whether your online presence appears, and whether to
ay a sound when messages arrive.
pl
Tip: When you
on the status bar to the left of this icon.
•
• Colleagues (n) —
Click the minus icon in the top right corner of these screens to close the
(Conferences) — This configures your user settings for any online chat with multiple
colleagues. The Create t
message and check to make a private conference that only invites can attend. The Join
tab becomes active when you are invited to a conference. An online chat window appears
after you join.
and n is the number of colleagues online. Click to open the chat screen. Click on a
colleague and enter text at the bottom of the popup that appears to send messages.
Previous chat history also appears above any current text on that chat popup.
have a message from another user, that user’s name appears
ab lets you edit to invite colleagues, configure an invitation
A green dot indicates others are online (it’s red when you are alone),
m.
Menu Bar
The Menu Bar appears below the The Dock, and any icon you have selected. It consists of
Menu items that lead to separate pages you have configured with Manage > Add Page.
Notice that a “breadcrumb” trail describing an access path to the page you have selected
appears beneath the Menu Bar. The pages that appear on this bar can vary, depending on
which NMS200 package you purchase
Tip: You can drag and drop the menu bar labels to different positions, and
can click a
label to rename the page, or delete it (with the “x”).
Portal Conventions
35
Page 36

ProSafe Network Management Software NMS200
Graphs
Graphs appear in alarm and performance portlets functions. These display the real-time
division of total alarms or performance metrics, and you can change their appearance, or
associated data lists display.
For example, clicking the Critical alarms slice means only Critical alarms appear listed in the
portlet. Notice also that the graph “explodes” to highlight the selected slice. Hover the cursor
over a portion of the graph and a tooltip with information about that slice also appears.
Hovering the cursor over a listed item in the column where a question mark appears indicates
a “tooltip” with more information is available for this item. An informational popup screen
appears after a brief wait to query the application server. These pop-ups can include graphs
of recent activity too.
Graphs can appear as lines, bars or pie graphs, depending on the portlet, device and activity
monitored.
Note: Install the latest Adobe Flash for graph functionality.
Portal Conventions
36
Page 37

ProSafe Network Management Software NMS200
Portlets
Portlets are the elements of any page within the NMS200 web client. Initially, they appear in a
small, summary screen format. Click Add > More... to add a portlet to a page you have
created.
For a more specific look at available portlets, see the chapters following this one. The
following describe common portlet features.
One of the first portlets typical users see is Discovery Profiles.
To act on listed items, right-click. A menu appropriate to the portlet appears.
The title bar for the portlet displays its name. To rename it, click on the name, and the field
becomes editable. You can make changes, then click the green checkbox to accept them (or
the red “X” to abandon them). The right portion of the title bar contains several editing
controls. Clicking on the wrench icon produces a menu that leads to editors for the
Configuration of this portlet (user permissions to view and configure, Sharing, and so on).
The plus or minus (+ or -) icons Minimize, Maximize lead to Expanded Portlets.
Tip: T
o see information about listed items in a portlet, hover your cursor over
the row until a question mark appears. A mini-query about the selected
item appears in a large tooltip. See Online Help / Filter on p
Expand / Collapse options o
the bottom of portlets.
n page 10 for a description of the buttons at
age 9 and
Expanded Portlets
Some portlets appear with a plus (+) icon in their upper-right corner, and can expand to
display more information. Return to the smaller portlet by clicking Return to Previous in the
expanded portlet’s upper right corner.
Tip: If you want
expand it.
to multi-select within listed items in a portlet, you must
User permissions may limit access to the expanded portlets. For example, NMS200 can have
many communities and limit users’ memberships. Such users can lightly browse other
communities’ screens without full privileges.
Portal Conventions
37
Page 38

ProSafe Network Management Software NMS200
Note: Screen size limitations may require you to expand the browser to
see expanded screens correctly. You must have at least 1250 pixels
in width.
You can right-click to act on listed elements as in the basic, smaller portlet, but here you can
also see details about a selected row in the Snap Panels below the table list items in an
expanded portlet.
Tip: Best practices uses the “b
readcrumb” trail of links at the top pages to
navigate. This lets you precisely “drill out” to previously seen screens.
The browser’s Back button is not supported, and produces unpredictable
behavior
Snap Panels
The snap panels that appear below the expanded portlet’s list can “stack” on top of each
other, so
several can appear simultaneously in each slot for Snap Panels. Click the title bar of
Portal Conventions
38
Page 39

ProSafe Network Management Software NMS200
the panel to toggle its expansion o r collapse. In the Ref erence T ree snap p anel, click the plus
(+) to expand the tree of connections.
Filters
Filters typically appear at the top of expanded portlets. You can pick from already-configured
filters with the drop-down on the left, or you can click Advanced Filter to create one of your
own.
After you click the green plus (+), select and or or on the left to comb ine more than o ne filter.
Click Apply Filter to see the list after the filter acts on it. Click Reset to return the list to its
original state.
Click Save As to preserve a filter you have configured for future use. The pick list in the up per
left corner of this filter panel is where you would select it.
Create a name and description, then click Save on the next screen to preserve your filter
configuration.
Note: When using a filter you must click the refresh icon to the right of the
drop down list to populate it.
Portal Conventions
39
Page 40

Rows and Search
ProSafe Network Management Software NMS200
The “basket” icon midscreen on the left opens Ro
ws per Page and Max Items selectors,
along with a Go button to activate any changes you make there.
For performance reasons, these are set to relatively low defaults.
You can search by clicking the magnifying glass icon. This opens a search field where you
can enter search terms for all the fields that appear in the list at the top of the portlet. The
search is for what you enter, no wildcards are supported.
Click the icon again to close the row configuration or search field.
Tip: Sort
on a column by clicking on that column’s heading. Reverse the sort
order by clicking it again.
Add / Remove Columns
Often when you right-click a list in an expanded portlet, a menu item appears that lets you
add o
r remove columns. When you select this, a screen showing the available columns
appears with Show / Hide buttons to the right of the column name. Click the appropriate
buttons (they change color), and click Apply to change th e columns that appear on screen by
default. You can also Reset to Defaults or abandon any changes and Close this screen. The
changes appear instantaneously when you return to the expanded portlet.
Pages
Most portlets use the “recorder” icons to page through a list that occupies more than one
screen. The right/left arrows go forward and back one page. The icons at either end go to the
beginning or end of the pages.
Portal Conventions
40
Page 41

ProSafe Network Management Software NMS200
Exports
At the bottom right corner of the list, appear an Excel and Acrobat icon. Click these to export
t
he list contents as either an Excel spreadsheet (.xls), or a pdf file. These download to the
default download location you have configured on your browser.
Snap Panels (Reference Tree)
These vary, depending on the portlet, but the convention of displaying a Refere
nce Tree
panel is common. This displays items related to the selected list item in tree form. Click the
plus (+) to expand a node on the tree.
Click Return to previous in the upper right corner of the exp anded portlet to retu rn to the p age
where you started, with the smaller portlet. If th e page you are on has a “breadcrumb trail” of
intervening detail pages (for example), you can click an intervening page’ s breadcrumb if you
do not want to return to the previous screen
Mandatory Fields
Some portlets include editors. These appear after you select an item, right-click, and select
either New or Open. Mandatory fields in these editors appear with a red flag icon to their
right.
Sorting
Sorting tables that list items occurs when you click a column heading. The arrow to the right
of that heading’s text displays the direction of the sort (ascending or descending). When the
arrow appears in a heading, the selected column is the basis for sorting.
Portal Conventions
41
Page 42

ProSafe Network Management Software NMS200
Common Menu Items
Several menu items appear in multiple portlets. In addition to editing commands (New,
Open), such menus let you:
• Import / Export
• Share
• View as PDF
with User (see Sharing on page 43).
Note: You can also export or import page configurations as well as items
NMS200 manages like equipment, discovery profiles, locations and
so on.
Import / Export
Menus often contain these options:
• Im
• Export Selection — Export a file with a text or XML description
• Expo
Export / Import Page Configurations
Export / Import also appears as a tab in screens that manage pages (Manage > Page and
Manage > Control Panel screens display these tabs). For example, click Manage > Settings
in the Dock. Use the checkboxes on the Export / Import page to select exactly what element s
to export. The automated file name includes your login identity, the date, and the
extension. The file itself is a compressed collection of XML file configuration settings for the
Pages / Portlets you have elected export. Its destination is the browser’s default download
location.
port — Retrieve a file with an XML description of the listed items in the manager . Some
imports can come from a URL.
of the selected item(s) in
the manager
rt All — Export a file with a text or XML descriptions of all listed items in the
manager.
Tip: Printing manage
or Excel format and print from there.
r contents: You can Export a full size manager into PDF
lar
Portal Conventions
42
Page 43

ProSafe Network Management Software NMS200
Note: Use the More Options link at the bottom of the Export screen to
expose more export options.
Use this same page to import, if it is enabled.
Sharing
You can share elements within NMS200 with colleagues, and consult with them using the
texting described in Status Bar Messaging on page 34. To share an something, first select it
where it appears listed in the appropriate portlet. Right click and select Share Asset.
In the subsequent screen, select a user with whom you want to share, type any message you
want to include and click Share Asset. The chat message to the selected user includes your
text and a link that opens to display the Snap Panels for the selected item. Cancel aborts
sharing.
Portal Conventions
43
Page 44

ProSafe Network Management Software NMS200
View as PDF
This displays the selected asset’s information as a PDF.
You can search, print or save this to file, and use any of the other Acrobat capabilities.
Clicking the acrobat logo docks the floating / disappearing Acrobat toolbar within this screen.
Tip: T
You can also create PDF reports containing descriptions of multiple selected assets, but you
must open an expanded portlet to multi-select.
o search the PDF produced, click the binocular icon in the docked
toolbar.
Portal Conventions
44
Page 45

ProSafe Network Management Software NMS200
Audit Trail / Jobs Screen
When you execute an action, for example discovering network resources, an audit trail
screen appears with a tree displaying the message traffic between NMS200 and the
device(s) the action addresses.
To see the details of any message, click on it, and those details appear in the lowest panel of
this screen. If you click on a summary message (not a “leaf” on the tree), a graph appears
displaying the time for its component messages. Hover your cursor over each portion of the
graph for more details.
Tip: The
For many activities, you can close the audit trail viewer any time. The action, for example,
discovery, continues to run on the application server in the background, and the audit trail is
archived. See Audit T rail Portlet o n page 46 for more about retrieving archived audit trails and
other screen details as they appear in that portlet.
time for messages and logged in user initiating the action appear on
the bar between the upper and lower screen.
Portal Conventions
45
Page 46

ProSafe Network Management Software NMS200
Audit Trail Viewer
Some portlets also offer an Audit Trail menu item that displays Audit Trail / Jobs Screens for
the selected item.
The top of this screen contains a list of Audit Records. Click one of this list to see the Job
details as you would in the Audit Trail / Jobs Screen.
Audit Trail Portlet
The audit trail summary displays an archive of the message traffic between NMS200 and
monitored devices, as well as NMS200’s reaction to failed message transmission.
The Creation Date, Component, Action (the summary message of the audit trail), User ID
(the login ID of the user whose actions resulted in this trail), and Status of the messages
appear in the table (hover the cursor over the icon for a text message describing status).
Portal Conventions
46
Page 47

ProSafe Network Management Software NMS200
Right click to Delete a message, View job (see the message traffic archived) or Share with
User.
Tip: To see the audit trail for recently completed processing, open the
Messages tab in the lower left corner of the portal, and click the
magnifying glass to the right of the appropriate message.
Expanded Audit Trail Portlet
When you click the plus (+) in the upper right corner of the summary screen, t
he expanded
portlet appears. You can right click to Add / Remove Columns in this screen, and, as always,
filter the appearance of the screen with the filter capabilities at its top.
In addition to the summary screen’s columns, the following are available in this screen:
• User IP — The IP address of the user who created this audit trail.
• Subject — The equipment at the origin of the message traffic with NMS200.
You can right-click a selected item and either Delete it, or View Job. This last option displays
a screen with the details of the job itself.
Portal Conventions
47
Page 48

View Job
ProSafe Network Management Software NMS200
The Aud
individual message that appears in the upper panel, select it and view its contents in the
bottom panel. The divider has the binoculars in the left corner, and the Refresh icon in the
right. Click Refresh to clear an old message so you can view a new one.
Click the binocular icon to check (info, warning, error) filters that limit the types of visible
messages. Notice that the date and time of the message appears to the right of the binocular
icon.
it Job Viewer displays the audit trail messages in tree form. To see the contents of an
Schedules
To schedule an action, for example using a discovery profile, right click and select Schedule.
The Schedule panel appears, where you can create a new schedule, entering a Starting On
date and time, and Stopping On date and time or o ccurrence number. You can also configure
recurrence in this screen.
Once you save the schedule, the action (for example Discovery Profile) it also appears in th e
Schedules Portlet as a scheduled item.
Portal Conventions
48
Page 49

ProSafe Network Management Software NMS200
Schedules Portlet
You can view and modify schedules in the Schedules portlet, or the Expanded Schedules
Portlet
This displays the Enabled status, a Description, the Type of schedule, its Next Execution and
Recurrence in columns. You can do the following by right-clicking a scheduled item, and
selecting the appropriate menu item:
• Delete — Deletes the selected scheduled item, displaying a confirming dialog box.
• Enable
its status. To enable the schedule, you can also edit it and check the Enabled check box.
• Disable Sc
• Execute — Executes the scheduled item. If the scheduled item is an activity-based or
di
item.
For other types of scheduled actions, a dialog appears saying The scheduled item(s) has
been sent to the application server for immediate execution. You can monitor its progress
in the audit trail portlet. (see Audit Trail / Jobs Screen on pa
• New — This lets you initiate new schedules for a variety of actions. The subsequent
screen’
page 133 for more about available actions.
• Ope
and lets you modify the activity’s data/properties and schedule parameters.
Schedu
scovery-profile based scheduled item, an audit viewer appears progress of the selected
s appearance depends on the action selected. See Managed Resources on
n — Th
le — Appears on an already disabled scheduled item so you can change
hedule — Appears on an already enabled scheduled item.
ge 45)
is appears for an activity-based scheduled items. It opens the activity editor,
To edit an existing schedule for an already scheduled action
right click the item in its portlet and select Schedule. This displays the schedule
information for the discovery profile and lets you make modifications.
Portal Conventions
49
like a Disco
very Profile, just
Page 50

ProSafe Network Management Software NMS200
Tip: Schedule new actions from the portlet that ordinarily executes them, for
example Resource Discovery on p
age 123.
Expanded Schedules Portlet
When you expand this portlet, the additional columns that appear include Submission Date,
Start Date, whether the schedule is still active (Scheduled), and the Execution Count.
If a green icon appears in the Scheduled column, it means the schedule will be executed on
next start date. If the schedule has exceeded execution count or passed stop date (if
specified), then a red icon appears there.
Portal Conventions
50
Page 51

4. NMS200 Portlets
This section describes the available NMS200 portlets. You may not have access to all of
these with the user permissions you have been assigned by the portal administrator.
Alarms
In its summary form, this portlet displays alarms and a graph that summarizes them.
4
To filter the listed alarms that appear on this screen to a particular severity, click a slice of the
graph or on a color in the legend to its right. The graph “explodes” to highlight the selected
slice, and the alarms that appear are of that severity only. Click the color again to restore the
slice to its place in the circle. After you click the graph, click [reset] to view all alarms, not just
those for the selected slice.
Note: The alarms that appear when using the slices as a filter only include
those within the selected Max items returned.
See Menu on page 54 for details about menu items available when you right-click in the
summary and expanded portlets.
51
Page 52

ProSafe Network Management Software NMS200
The alarm display includes the following columns:
• Severity — The alarm severity indicated by the color of the leftmost icon. The severity
only has meaning for Alarms and Security Alarms. Informational Alarms get a severity
level of Indeterminate.
• Date Opened
— The date the alarm appeared.
• Entity Name — The entity emitting this alarm (often within the Equipment).
• DeviceIP — Th
• Event Name —
Tip: If you hover
e IP address of the equipment where the alarm appeared.
The event associated with the alarm.
the cursor over a row in the portlet display, a tooltip appears
with information about the alarm. This can include the alarm’ s Notification
OID, Date Opened, the Entity Name and type, its Impact Propagation, its
status as Service Effecting), Event Name, Equipment, Severity, any
alarm Message, whether the alarm was Suppressed, or Acknowledged
and the Device IP.
If an alarm is Service Effecting, (reflect an impact on a service) it can propagate to appear
as components of service- and link-related alarms. Service-effecting alarms are of
indeterminate or greater severity.
See Alarms in Topology on page 95 for a description of how alarms appear in the topology
portlet.
NMS200 Portlets
52
Page 53

ProSafe Network Management Software NMS200
Expanded Alarm Portlet
The expanded Alarm portlet appears when you click the plus (+) in the top rig ht corner of the
smaller screen.
This displays listed alarms and Snap Panel details of a selected alarm. The colored icons at
the top of this screen display a count of the open alarms in each severity category (hover the
cursor over the icon to see which severity it represents), and a total.
By default this screen adds the first of the following columns to those visible in the Event
History ’s summary screen view. To add the others listed here, right click, and select Add
Columns to change the screen appearance.
• Entity T
• Mes
• Alarm S
ype — The type of monitored entity.
sage — Any message that accompanies the alarm / event.
tate — The state (open / closed) of the alarm.
• Date Cleared — The date and time that the alarm was closed.
• Up
dateDate Time— The time stamp for when this alarm was updated (for an additional
count, the time the last duplicate was received).
• Notificatio
• Equipme
n OID— The identifier of the notification displayed as an alarm.
nt — The name for the entity emitting the alarm.
• Acknowledged — True or False.
• Assigne
d User — The user who has been assigned this alarm (right click or click Action
to do this).
• Date Assig
• Ack T
ned — The date and time that the alarm was assigned.
ime — The time the alarm was acknowledged.
• Cleared By — The user who cleared the alarm.
• MIB T
ext — The alarm’s MIB Text.
NMS200 Portlets
53
Page 54

ProSafe Network Management Software NMS200
Rather than filtering with the pie graph, the expanded portlet lets you either the pick list at the
top left, or create custom filtering by clicking Advanced Filters.
Menu
Right clicking an alarm lets you select from the following menu items:
• Acknowledge / Unacknowledge Alarm —
Acknowledges the selected Alarm(s). The
current date and time appear in the Ack Time field. Unacknowledges previously
acknowledged alarm(s), and clears the entries in the Ack By and Ack Time fields. The red
“unacknowledged” icon appears in the expanded portlet and turns to a green check
“acknowledged” icon the alarm has been acknowledged.
• Assign User — Assig
n this alarm to one of the users displayed in the sub-menu by
selecting that user. An icon also appears in the expanded portlet indicating the alarm has
been assigned to someone.
• Clear Alarm — Clearing the alarm removes the alarm from the default alarm view and
marks it as a ca
ndidate for the database archiving process (DAP). Essentially it is an
indication to the system that the alarm has been resolved/addressed. If your system has
enabled propagation policies, clearing recalculates dependent alarms.
• Email Alarm — E-mail the alarm. Enter a subject an e-mail address to which you want to
mail the alarm’s
content, and click the + to add to the list of addresses (the minus deletes
them). Then click Send Email. Clicking Cancel ends this operation without sending
e-mail. See SMTP Configuration on p
NMS200. You can also consult the NMS200 Administration Guide for inst
how to set up application server e-mails. See Alarm Email on page 55
age 28 for instructions about setting up e-mail from
ructions about
for an example of
what the content looks like.
• Show Performance — The columns that appear by default in this expanded
NMS200 Portlets
54
Page 55

ProSafe Network Management Software NMS200
• Aging Policy — This lets you select a policy that determines how long this alarm remains
in the database. See Database Aging Policies (DAP) on p
age 19 for information about
configuring such policies.
• View as PDF —
• Share with Us
Create an Acrobat PDF document containing this portlet’s contents.
er — Selecting this opens a screen where you can select the user you want
to send the selected alarm, and can enter a message you want to send with it. See
Sharing on page 43. Clicki
ng Share Asset sends a chat message to the selected user
with a link that opens to display the Alarm Snap Panels for the selected item.
• Add / Remove Columns — The columns that appear by default in this expanded portlet
ar
e not all the ones available. The screen that appears after you select this menu item
lets you configure what shows, and what is hidden.
Tip: Hover your cursor over the De
appears with information about the alarm source’s Model, Vendor,
Discovery Date, and a Ping Rate bar graph. This can also include other
device-dependent items. For example: bar graphs to display the % CPU
[utilization], % Memory, and Description.
The convention indicating such tooltips
mark that appears next to the cursor when you hover it over the
displayed field.
Alarm Snap Panels
These include the following:
• Alarm Deta
• MIB Deta
ils — The source, Severity, Message, Date Opened, and so on.
ils—The Notification OID, and MIB Text for the selected alarm.
vice IP Address column, and a tooltip
are available is the question
• Reference T r
ee — The connection between the alarm and its source in tree form.
• Graph — Total occurrences of this alarm, by date.
Alarm Email
The e-mail sent by right-clicking an alarm has the subject specified when you send it, and
contains the information within the alarm. For example:
Alarm: monitorIntervalSkip
Alarm Attributes:
===============================
NMS200 Portlets
55
Page 56

ProSafe Network Management Software NMS200
Device IP =
Message =
Alarm State = Open
Severity = 5 - Major
Count = 1
Date Opened = Tue Dec 14 22:01:30 PST 2010
Update Date/Time = Tue Dec 14 22:01:36 PST 2010
Entity Name =
Entity Type =
Entity Description =
Equipment =
Region = SUPDEMOPartition
Location =
Assigned By = OWSystem
Date Assigned = Thu Dec 16 10:40:24 PST 2010
Assigned User = qatester
Acknowledged = false
Ack By =
Ack Time =
Cleared By =
Date Cleared =
MIB Text = Monitor session was skipped due to resource constraints.
Typicall
This may also be caused by a large number of timeouts which force executions
to take longer to complete than normal.
Advisory Text =
y, this implies one or more monitors should run less frequently.
Event History
Not all events appear as alarms. Event History preserves all event information for your
system.
The initial portlet view displays an icon whose color reflects any alarm state associated with
the event. It also displays the Receive Time, Entity Name, Device IP, and Event Name. You
can right-click to Share with User in this screen.
NMS200 Portlets
56
Page 57

ProSafe Network Management Software NMS200
Tip: Hovering the cursor over the DeviceIP column produces a tooltip that
lets you know the device’s current state (up / down) and that contains
Model, Vendor, Discovery Date, Ping Rate (ms), and the device’s
Description information.
Expanded Event History Portlet
Clicking the plus (+) in the upper right corner of the initial portlet view displa
ys the expanded
Event History . As in other exp anded portlets, you can use the filte ring capabilities at the top of
the screen to further limit the default view of all events.
This screen has many of the columns described in Alarms on page 51 or Expanded Alarm
Portlet on page 53. Configure these as visible or hidden with a right-click to select Add /
Remove columns. The following are some additional columns available.
• Receive T
• Event Name —
• Location — Th
• SubType —
• Protocol —
ime — The date the event was received.
The event identifier.
e location of the equipment emitting the event.
A classification for the event. For example: Trap.
The protocol that delivered the event. Frequently: System, indicating
NMS200 itself delivered it.
• Notification OID—
• Instance ID —
The instance identifier for the event.
The object identifier (OID) for the event type.
NMS200 Portlets
57
Page 58

ProSafe Network Management Software NMS200
Event History Snap Panels
Click a listed alarm to display its details in the Snap Pa nels. The Reference T
event’s relationship to any alarms, and to the source device. Click the plus (+) next to an item
in the tree to unpack it.
The Bindings Snap Panel displays the event’s varbind information, including the trap OID, the
device’s IP address, and other event-specific information.
You can right-click the listed events and Share with User (see Sharing on page 43), or Add /
Remove Columns.
ree displays the
Event Processing Rules
This portlet manages NMS200’s response to event s. By default it appears with seeded r ules,
but you can create your own (New), copy or modify (Copy or Open) or delete (Delete)
existing rules by right-clicking in the portlet. You can also Import and Export rules to files.
The Rule Type column indicates whether rules are Pre-Processing (Correlation) or
Post-Processing (Automation).
Icons in the Enabled and System columns indicate whether the rule is enabled—green is
enabled, red is not—and whether it is a System rule, or a non-system (user-created) rule.
Modifying or creating rules opens Rule Editor . See Rule Editor Example for steps to create
these rules.
When you Copy an event processing rule, NMS200 generates a new name, but you must
change that name before you save the event processing rule.
NMS200 Portlets
58
Page 59

ProSafe Network Management Software NMS200
Expanded Event Processing Rules Portlet
The expanded portlet displays additional columns. Details abo ut selected rules appear in the
snap-in panels a
t the bottom of this screen.
The Reference Tree panel displays the selected rule’s connection to events. The Rule
Actions list any configured actions associated with the rule. The Event Filter Summary
summarizes any configured filter(s) for the selected rule.
Rule Editor Example
To create a rule, follow these steps:
1. Right-click and sele
(correlation) or Post-Processing (automation) rules.
If Pre-Processing is your selection, Device Access, Frequency, Reject Event, Set
Severity, State Flutter, Suppress Alarm, and Syslog are the types available. See Filtering
/ Settings on page 61, Syslog Escalation Criteria on p
more about the differences available between rule types.
ct New, then select a rule type. These can be Pre-Processing
age 64, and Actions on page 65 for
NMS200 Portlets
59
Page 60

ProSafe Network Management Software NMS200
2. For this example, we select Pre-Processing > Device Access. The Rule Editor screen
appears. Enter a Name to identify
the rule, an optional Description, and check Enabled if
you want this rule to begin working immediately.
3. Click Next to open the Filtering
/ Settings tab.
Specify Event Filtering
In this panel select the Event Definition. Click pick list to
find available events. Typing a letter
goes to that letter in the list. You can then click to select from the pick list.
Click Add Filter to further filter the selected events. Se e Filters on p age 39 for more about this
feature.
Specify Settings for: [Selected Rule Type]
This panel’s appearance depends on the type of rule you select
ed when you clicked New.
When you are editing an existing rule, it defaults to that rule’s screen. For more about the
available alternatives, see Filtering / Settings on page 61.
4. The D
evice Access example creates a specific device access event for user login, logout,
login failure or configuration change. Select the Access Type (Config Change, Login
Failure, User Login, User Logout) from the pick list for that field.
5. Enter the User Name V
ariable and/or User Name RegEx match string in those fields. This
confines rule response to the selected users.
6. Check Suppress Correlated
events if you do not want to see events correlated with this
one.
7. Click Save to
preserve the event processing rule.
NMS200 Portlets
60
Page 61

ProSafe Network Management Software NMS200
Rule Editor
After you select between pre- and post-processing rules for new rules, the following screens
manage the event processing described in brief in the Rule Editor Example on page 59. The
following screens and fields appear in this editor.
• General
• Filtering / Settings
• Syslog Escalation Criteria (for pre-processing Syslog rules)
• Actions (for post-processing, automation rules)
The following sections describe these in detail.
General
The General screen is common to all rule types.
It contains the following fields:
• Name — A text identifier for the rule.
• Description — An optional text description of the rule
• Alarm Only — This is visible only in post-processing r
only if an alarm is generated, not suppressed.
• Enabled — Check this to enable the rule.
ules. Check this to enable the rule
Filtering / Settings
For all rule types, select the Event Definition. Click Add to open a screen where you can
select events to include in the event you are creating. This incudes a filter at the top that you
can use to search for specific events. For example: Event Name Contains ________. You
can then click Add Selection to include selected items in this filter, or Add All to include all
NMS200 Portlets
61
Page 62

ProSafe Network Management Software NMS200
displayed events. After you finish event selection, click Done at the bottom of this selection
screen.
Click Add Filter to further filter the selected events. Se e Filters on p age 39 for more about this
feature. After you Add Filter the button changes to Clear Filter so you can remove any filter
from the event rule.
Tip: NMS200 supports multiple IP addresses per resource. During event
processing, filters that include IP address criteria may behave incorrectly
when NMS200 evaluates the filter. Best practice is using resource
name(s) instead of IP addresses.
The following are processing rule types, and
• Pre-Process
ing — These rules either override the event definition, change the behavior
a description of their properties.
of an event or generate another event. The following are the different subtypes. These
are also called Correlation rules. See the descriptions below for additional information
about the available types.
• Pos
t-Processing — Also called Automation rules, these execute specified actions for the
rule after the event processing occurs.
The following are Pre-Processing/ Correlation rule subtypes:
NMS200 Portlets
62
Page 63

ProSafe Network Management Software NMS200
• Device Access — The Device Access example creates a specific device access event for
user login, logout, login failure or configuration change. Select the Access Type (Config
Change, Login Failure, User Login, User Logout) from the pick list for that field.
Enter the User Name Variable and/or User Name RegEx match string in those fields. This
confines rule response to the selected users.
Check Su
ppress Correlated
events if you do not want to see events correlated with this
one.
y
• Frequenc
— This rule type changes event behavior based on the frequency of the
selected event’s occurrence frequency.
Enter the Duration (seconds) and Threshold Count for the event, then select an Action
(Reject or Suppress the event) and check Publish Event if you want it to register for
NMS200. If you Reject an event, it does not appear in Event history; if you Publish it,
however, listeners for that event will “hear” it.
• Reject Even
t — This screen presents the Specify Event Filtering portion of the screen
without any Settings in the lower screen. Specify events to reject with this selection and
filtering.
• Set Severity — This rule overrides the default alarm severity of an event selected and
f
red in the upper screen.
ilte
• State Flutter — This type of rule changes event behavior on transient state change
events like a series of LinkUp and LinkDown events for the same interface.
NMS200 Portlets
63
Page 64

ProSafe Network Management Software NMS200
After you select the event and filtering, enter the Interval (seconds), the Action (Reject or
Suppress the event) and check Publish Event if you want it to register for NMS200. If you
Reject an event, it does not appear in Event history; if you Publish it, however, listeners
for that event will “hear” it.
• Su
ppress Alarm — This screen presents the Specify Event Filtering portion of the screen
without any Settings in the lower screen. Specify events/alarms to suppress with this
selection and filtering.
• Sysl
og —This screen presents the Specify Event Filtering portion of the screen without
any Settings in the lower screen. Specify events to select. Then click Next to go to the
Escalation tab.
Post-processing (automation) rules let you modify the Specify Event Filtering po
rtion of the
screen without any Settings in the lower screen. Specify events to select. Then click Next to
go to the Actions tab. See Actions on page 65 for more about that feature.
Syslog Escalation Criteria
This tab of Syslog Event Rules lets you manage events based on matching text, and
configure messages in response to such matches.
Criteria: Syslog Match Text
In this tab, enter the Syslog Match Text. Click the plus to add matching text to the list below
the Message Match Text field. Check the Match Any to match any or all of the entered match
text, rather than one or more specific strings.
NMS200 Portlets
64
Page 65

ProSafe Network Management Software NMS200
Criteria: Syslog Event Setup
This portion of the Criteria screen sets up the event emitted when matching occurs. Here are
the fields:
• Category — The syslog category varbind value.
• Event Sev
• Me
ssage Pattern — An optional regular expression for the text to retrieve an d transmit in
erity — Select the alarm severity of the event emitted when a match occurs.
the created event’s message.
• Mes
sage Template — The configuration of the message when sent. For example: the
template
%1 occurred on %3 for %2
creates a message with the first message
pattern retrieved, followed by the third, then the second within the specified text.
Message Test
This screen lets you test your message against the pattern and/or template. Click the Te
st
button to the right of the top field to activate this testing.
est Message — Enter a message to test.
• T
est Message Result — The text extracted for the event as it appears in the template.
• T
Click Apply to a
ccept these escalation criteria, or Cancel to abandon them without saving.
Actions
This screen catalogs the actions configured for the Post-Processing (Automation) rule you
have configured in previous screens.
Click Add Action to create anew action in the editor. The Actions column lets you revise (Edit
this entry) or Delete entries in this table. Click Save to preserve the action(s) configured here,
or Cancel to abandon any edits.
Clicking Add Action lets you select from the following:
• Forward Northbound
• Email
NMS200 Portlets
65
Page 66

• Custom
ProSafe Network Management Software NMS200
Click Apply t
o accept configured actions, or Cancel to abandon their editor and return to this
screen.
Tip: Actions available
here are like those for Discovery Profiles on page 124.
Forward Northbound
When you want to forward an SNMP v2 event (trap) to another host, then configure
automation in
this screen to do that.
Enter the following fields:
• Desti
• Desti
• Comm
• Send
nation Address — The IP address of the northbound destination.
nation Port — The port on the northbound destination.
unity String — The SNMP community string for the northbound destination.
as Proxy — When checked, this sends the IP address of the application server as
the source of the event. Unchecked, it sends the IP address of the source device.
NMS200 Portlets
66
Page 67

ProSafe Network Management Software NMS200
Email
Email actions configure destinations and messages for e-mail and SMS recipients. You can
include fields that are part of the event by using the variables described in Email Action
Variables on page 69.
The SMS tab is similar to the e-mail tab, but limits the number of characters you can enter
with a field at its bottom.
Note: You must send SMS to the destination phone carrier’s
e-mail-to-SMS address. For example sending text to 916-555-1212
when Verizon is the carrier means the destination address is
9165551212@vtext.com.
This screen has the following fields:
• Recipie
nt Addresses — Enter an e-mail address in the field below this label, then click
the plus (+) sign to add it to the list of recipients. The minus (-) removes selected
recipients.
• Subject — The e-mail subject.
• Email Hea
der / Footer — The e-mail’s heading and footing.
• SMS Body — The e-mail contents to be sent as text.
• SMS Max Leng
th — The maximum number of characters to send in the SMS. Typically
this is 140, but the default is 0, so be sure to set to your carrier’s maximum before saving.
Here is what Email looks like when it arrives:
Sent: Wednesday, March 02, 2011 2:37 PM
To: techpubs@doradosoftware.com
Subject: Web Test
NMS200 Portlets
67
Page 68

ProSafe Network Management Software NMS200
Notification: redcellInventoryAttribChangeNotification
Notification Attributes:
===============================
sysUpTime.0 = 5 hours, 16 mins, 43 secs
snmpTrapOID.0 = 1.3.6.1.4.1.3477.2.2.1
redcellInventoryAttrName.0 = RedCell.Config.EquipmentManager_Notes
redcellInventoryAttrChangedBy.0 = admin
redcellInventoryAttrNewValue.0 = hello
world
severity
auto
redcellInventoryAttrOldValue.0 = hello
world
severity
Custom
This screen lets you configure Action based on Adaptive CLI actions available in the system.
Notice that you can select by most common or by keyword search, depending on which of the
links in the upper right corner of the screen is selected.
The most common actions include those you have used most recently. To search for actions,
either enter a keyword, or click the search icon (the magnifying glass) to produce a pick list
below the Action field. Select an action by clicking on its appearance in that list.
Select the device target of the custom action by selecting from the Target pick list. If you do
not specify an explicit target, NMS200 uses the default entity for the event as the target.
NMS200 Portlets
68
Page 69

ProSafe Network Management Software NMS200
CAUTION:
If you select an action with additional parameters, those parameters appear in the screen
below the Target field. To see definitions for such parameters, hover the cursor over the field
and a tooltip describing the field appears.
Click Apply to accept your edits, or Cancel to abandon them.
Email Action Variables
The following are the Email Action variables you can use in customizing the content of action
e-mail. These appear classified as follows:
• Basic Variables
• Managed Equipment Variables
• Entity Type: Port
• Entity Type: Interface, Logical interface
To successfully retrieve Custom attributes, you must first enable them in
the Inventory Config manager screen.
You can also configure more limited variables that are slightly more efficient in performance,
if not as detailed as those described in the following section.
For example, you can retrieve the following attributes:
{RedCell.Config.EquipmentManager_Custom1}
{RedCell.Config.EquipmentManager_Custom2}
{RedCell.Config.EquipmentManager_LastBackup}
{RedCell.Config.EquipmentManager_LastConfigChange} and
{RedCell.Config.EquipmentManager_HealthStatus}
Note: If the entity does not contain/return these values, then the message
[No data for <attribute name>] appears in the email instead.
NMS200 Portlets
69
Page 70

ProSafe Network Management Software NMS200
Basic Variables
Attribute Description Email Action Variable
Name The event / alarm name {Name}
Message Description from the event {Message}
Entity Name The entity (interface, card...) name {EntityName}
Equipment Manager Name The name of the equipment, parent or chassis. {EquipMgrName}
Device IP address the IP of the device in alarm {DeviceIP}
Entity Type Type of entity (Router, and so on) {EntityType}
Instance ID An identifier for the event {InstanceID}
Protocol Type Of originating alarm (
Protocol Sub Type Inform, Trap, [blank] (for internal events) {ProtocolSubType}
Receive Time {RecvTime}
Region The mediation server partition name. {Region}
Severity 0 - cleared, through 6 - critical, from Alarm Definition {Severity}
Source IP address The IP of the component sending the alarm {SourceIP}
SNMP, syslog, etc.) {ProtocolType}
The following section describe variables whose use may have a performance impact.
NMS200 Portlets
70
Page 71

ProSafe Network Management Software NMS200
Managed Equipment Variables
Attribute Description Email Action Variable
Custom 1 Note that although you can re-nam e
ny Custom attribute, you must use
a
the variable’s original name. For
example here, that is
{RedCell.Config.EquipmentManage
r_Custom1}
Custom 2 {RedCell.Config.EquipmentManager_Custom2}
Custom 3 {RedCell.Config.EquipmentManager_Custom3}
Custom 4 {RedCell.Config.EquipmentManager_Custom4}
Custom 5 {RedCell.Config.EquipmentManager_Custom5}
Custom 6 {RedCell.Config.EquipmentManager_Custom6}
Custom 7 {RedCell.Config.EquipmentManager_Custom7}
Custom 8 {RedCell.Config.EquipmentManager_Custom8}
Custom 9 {RedCell.Config.EquipmentManager_Custom9}
Custom 10 {RedCell.Config.EquipmentManager_Custom10
Custom 1 1 {RedCell.Config.EquipmentManager_Custom11
{RedCell.Config.EquipmentManager_Custom1}
}
}
Custom 12 {RedCell.Config.EquipmentManager_Custom12
}
Custom 13 {RedCell.Config.EquipmentManager_Custom13
}
Description Description of the equipment {RedCell.Config.EquipmentManager_DeviceDe
scription}
DNS Hostname Hostname of equipment {RedCell.Config.EquipmentManager_Hostname
}
Equipment Type Equipment Type {RedCell.Config.EquipmentManager_Common
pe}
Ty
Firmware Version Version of the equipment’s firmware {RedCell.Config.EquipmentManager_Firmware
rsion}
Ve
Hardware Version Version of the equipment’s
are
hardw
Last Backup Last Backup {RedCell.Config.EquipmentManager_LastBack
Last Configuration
ge
Chan
Last Configuration Change {RedCell.Config.EquipmentManager_LastConfi
{RedCell.Config.EquipmentManager_Hardware
Version}
up
}
gChange}
NMS200 Portlets
71
Page 72

ProSafe Network Management Software NMS200
Attribute Description Email Action Variable
Last Modified Timestamp of Last Modified {RedCell.Config.EquipmentManager_LastModifi
ed}
Model Model number of the equipment {RedCell.Config.EquipmentManager_Model}
Name Component name {RedCell.Config.EquipmentManager_Name}
Network Status Network Status {RedCell.Config.EquipmentManager_HealthStat
us}
Notes Equipment Notes {RedCell.Config.EquipmentManager_Notes}
OSVersion OSVersion {RedCell.Config.EquipmentManager_OSVersio
n}
Serial Number Unique identifier for the equipment {RedCell.Config.EquipmentManager_SerialNu
er}
mb
Software Version Version of the equipment’s software {RedCell.Config.EquipmentManager_SoftwareV
ersion}
System Object Id SNMP based system object
entifier
id
{RedCell.Config.EquipmentManager_SysObject
ID}
NMS200 Portlets
72
Page 73

ProSafe Network Management Software NMS200
Entity Type: Port
Attribute Description Email Action Variable
Custom 1 Note that although you can re-nam e
y Custom attribute, you must use
an
the variable’s original name. For
example here, that is
{RedCell.Config.EquipmentManage
r_Custom1}
Custom 2 {RedCell.Config.Port_Custom2}
Custom 3 {RedCell.Config.Port_Custom3}
Custom 4 {RedCell.Config.Port_Custom4}
Encapsulation Encapsulation {RedCell.Config.Port_Encapsulation}
Hardware Version Versio n of th e po rt’s hardware {RedCell.Config.Port_HardwareVersion}
If Index SNMP If Index {RedCell.Config.Port_IfIndex}
MAC Address “Typically a MAC Address, with the
t
s separated by a space, colon
octe
or dash depending upon the device.
Note that the separator is relative
when used as part of a query.”
Model Model number of the port {RedCell.Config.Port_Model}
MTU Maximum Transmission Unit {RedCell.Config.Port_Mtu}
{RedCell.Config.Port_Custom1}
{RedCell.Config.Port_UniqueAddress}
Name Port name {RedCell.Config.Port_Name}
Notes Port Notes {RedCell.Config.Port_Notes}
Port Description Description of the port {RedCell.Config.Port_DeviceDescription}
Port Number Port Number {RedCell.Config.Port_PortNumber}
Slot Number Slot Number {RedCell.Config.Port_SlotNumber}
Speed Speed {RedCell.Config.Port_Speed}
Subnet Mask SubMask {RedCell.Config.Port_SubMask}
NMS200 Portlets
73
Page 74

ProSafe Network Management Software NMS200
Entity Type: Interface, Logical interface
Attribute Description Redcell Email Action variable
Custom 1 Note that although you can re-name
any Custom attribute, you must use
the variable’s original name. For
example here, that is
{RedCell.Config.EquipmentManage
r_Custom1}
Custom 2 {RedCell.Config.Interface_Custom2}
Custom 3 {RedCell.Config.Interface_Custom3}
Custom 4 {RedCell.Config.Interface_Custom4}
Encapsulation Encapsulation {RedCell.Config.Interface_Encapsulation}
IfIndex SNMP Interface Index {RedCell.Config.Interface_IfIndex}
Interface Description Description of the Interface {RedCell.Config.Interface_DeviceDescription}
Interface Number Interface Number {RedCell.Config.Interface_InterfaceNumber}
Interface Type Common Interface Type {RedCell.Config.Interface_CommonType}
MTU Maximum Transmission Unit {RedCell.Config.Interface_Mtu}
Name Interface name {RedCell.Config.Interface_Name}
Notes Interface Notes {RedCell.Config.Interface_Notes}
{RedCell.Config.Interface_Custom1}
Port Number Port Number {RedCell.Config.Interface_PortNumber}
Slot Number Slot Number {RedCell.Config.Interface_SlotNumber}
Subnet Mask Subnet Mask of the Interface {RedCell.Config.Interface_SubMask}
Best practice is to clarify such attributes by combining them with others that spell out their
source.
File Servers
You must configure FTP and/or TFTP file servers to push and pull configuration files to and
from devices, or to deploy firmware updates. With this portlet you can switch between internal
and external file server mode, and Show or Hide not applicable File Servers depending on
NMS200 Portlets
74
Page 75

ProSafe Network Management Software NMS200
CAUTION:
the file server mode by checking/unchecking the Show All Servers check box. When this is
un-checked, only the relevant file server(s) appear onscreen.
Right clicking a file server, or the empty list space lets you do the following:
• Delete — Removes the selected file server from the list. This appears for External File
Servers only.
• Disable — Disables the selected file server. When file servers are disabled, they are not
u
sed in a Backup, Restore or Deploy operation. This too appears only for External File
Servers.
• Enable — Activates the selected file server. Again, exposed for External file Servers only.
• New — Displays the File Server Editor screen.
• Ope
• T
n — Displays the selected File Server in the File Server Editor screen.
est — Tests the selected file server by sending and retrieving a file.
Note: You can select whether NMS200 is in Internal or External File
Server Mode with the radio buttons at the top of this portlet.
Checking Show All Servers displays the internal file server.
Port conflicts prevent having an external file server and internal file server
operate on the same machine.
Columns in this manager identify the server, and describe whether it is enabled, and has
TFTP enabled.
NMS200 Portlets
75
Page 76

ProSafe Network Management Software NMS200
Note: The internal FTP/TFTP server is for testing only, not for production
use. For those concerned that the internal server provides some
insecure access to NMS200, it was designed to be ultra-secure. It
literally creates a separate authentication and virtual file system for
each file retrieved. It also responds only to Redcell’s internal
requests.
File Server Editor
This editor lets you configure new and existing file servers.
This is where you specify the Name, whether the server is Enabled, whether the connection
is secure (Secure FTP/SCP Server), supports TFTP, internal and external (optional) IP
addresses, and Net Masks, and the login and password for the file server. Once you have
configured a server, you can test the file server credentials by clicking on the Test button at
the bottom of the screen. Click Save to preserve your changes.
Tip: FT
P servers typically must be on the same side of the firewall as the
devices with which they communicate. If you have several such servers,
the specified Net Mask also determines which server communicates with
devices in which portion of the network.
NMS200 Portlets
76
Page 77

ProSafe Network Management Software NMS200
Notice that you can now configure an IP address used by NMS200, and another External IP
Address used by the devices. If you configure multiple file servers, NMS200 selects the
server with the Net Mask whose subnet is closest to the device(s) with which it
communicates.
OS Images
OS Images are typically the firmware updates you want to deploy to devices in your network.
You must add such software to your NMS200 system before you can deploy it. The summary
screen listing these images displays their Name, Description, File Name, Image Type and
Installed Date. Right-clicking this screen displays the following menu items:
• Delete — Removes the selected OS image from the list.
• Deploy — Deploys the selected file to devices you select in a subsequent selection
scre
en. For this to function, you must have enabled a server , as described in File Servers
on page 74.
• Download Firmware For — Some devices support a firmware download. These devices
a
ppear listed in a sub-menu. Select the type for which you want to download OS images,
and NMS200 automatically downloads them.
• New — Displays the OS Image Editor screen.
• Ope
• Share with User — See Sharing on p
n — Displays the selected image in the OS Image Editor screen.
age 43.
NMS200 Portlets
77
Page 78

ProSafe Network Management Software NMS200
Expanded OS Images portlet
When you click the plus, this portlet expands t
Reference tree of the connections to devices, and another panel listing the files within the
selected image.
o display the OS images list, a snap panel
OS Image Editor
When you open or create an OS image, its configuration appears in this editor. The General
Parameters tab contains its OS Image Name, Description, Version, and a Create Date. The
Image Files tab displays a selector that lets you create new OS Images, retrieving files from
the local file system (Import from Disk) or a URL (Import from URL). Because such images
NMS200 Portlets
78
Page 79

ProSafe Network Management Software NMS200
can consist of multiple files, you can import multiple files here. Finally, you can also import a
Readme File to accompany this image, and view it in that tab.
Click Save to preserve the OS Image you have configured, or Cancel to exit these screens
without saving.
NMS200 Portlets
79
Page 80

ProSafe Network Management Software NMS200
Deploy OS
This screen lets you configure a deployment, whether triggered from resource groups,
individual resources, or the OS Images screen. Deployment validates the selected image is
appropriate for the selected devices, or appropriate devices within a group.
To deploy an OS image, follow these steps:
1. Make su
page 74.
2. Right click a devic
File Management > Deploy.
3. Th
You can Sele
fields:
• OS Image — Select an image. It must already have been uploaded in the OS Images
• Desc
• Ve
• Devic
re you have an FTP / TFTP server correctly configured. See File Servers on
e in Managed Resources or the groups or OS Images pages and select
e Deploy Firmware screen appears.
ct OS Image in the top panel, and configure deployment with the following
manager.
ription — A text description of the image.
rsion — The image version.
e Driver — The device driver associated with this image.
NMS200 Portlets
80
Page 81

ProSafe Network Management Software NMS200
• Image Type — A read-only reminder of the type of image.
• Select T
defaults to the device right-clicked in Managed Resources to initiate this action, or
devices that match the selected file you want to deploy. You can then click the Add
Equipment button (again, restricted to devices that match the deploy file’s type). You
can also remove devices from the target list with the Remove All button. Notice the
Status column in the table of targets shows whether the OS deployment is supported
or not.
Note: You can also select devices, then change the OS selection so a
• Device Options — The appearance of the Device Options panel, at the bottom of this
screen, depends on the device selected in the Targets panel. These vendor-specific
fields let you fine-tune the deployment.
4. Click one of the butt
Add Schedule o
configured on a specified date, time, or repetition. See Scheduling Actions on p
Execute perfo
displaying the message traffic between NMS200 and the device(s). See Audit Trail Portlet
on page 46.
argets for Deployment — Select targets for deploying the image. This
potential mismatch will occur. This will likely trigger rejection of the
deployment by the device, but is not a recommended experiment.
ons at the bottom of the screen to initiate the next backup action.
pens the scheduling screen to let you automate the backup you have
age 154.
rms the backup immediately. The Results tab in this screen opens,
Save pre
Close
serves this configuration without scheduling or executing it.
closes this screen without saving the configured backup.
Contacts
The contact manager displays available contacts for your system. There is no expanded
version of this portlet.
Y ou can right-click to create, modify or remove (New , Open, Delete) the selected cont act. You
can also Import, Export All (see Import / Export on page 42) or Share with User (see Sharing
on page 43).
NMS200 Portlets
81
Page 82

ProSafe Network Management Software NMS200
New or Open displays the Contacts Editor.
Contacts Editor
This editor has two panels where you can enter contact information (Name, Address, Phone,
and so on). Click the tabs at the top of this screen to move between the panels. The Contact
ID, a unique identifier for the contact in your system, is a required field at the top of the first
page.
Click Save to preserve your new or modified contact information. Click Cancel to leave the
contact unmodified.
NMS200 Portlets
82
Page 83

ProSafe Network Management Software NMS200
Locations
In its summary form, the locations portlet displays configured locations in your system.
You can right-click to create, modify or remove (New, Open, Delete) the selected location.
You can also Share with User. See Sharing on page 43.
This screen has the following columns:
• [Icon] — The icon for this location.
• Name — The name for this location.
• Details —
• Type —
Location Editor
A description for this location.
A designated type for the location.
When you click New or Open, an editor appears. The Name field is mandatory.
• Name — A unique name for the Location. If you alter the name of a
already in use by existing equipment, the editor creates a new location. To change a
location name, you must delete the original location and the equipment using it then
re-make it. You can change the name of an unused location without deleting anything.
NMS200 Portlets
83
n existing location
Page 84

ProSafe Network Management Software NMS200
• Parent — The “parent” of this location (the location to which this location is subordinate).
Select a Parent Location from the pick list. The maximum number of levels supported is
15.
• T
ype — T ype of location, as selected from the drop-down menu. A vailable types a re: Area
Hub, Customer, National Hub, Other, Provider, Regional Hub, and State.
• Post
• Additio
Click Save save t
al Address — The Street, City/State, Zip address of the location.
nal — Any optional notes.
he Location, or any modifications you have made.
Expanded Location Portlet
The location portlet displays a list of all locations, with Snap Panels to display a selected
locatio
n’s connection to the network, and details.
The New menu option appears in the expanded location portlet and the Add / Remove
Columns item (see Add / Remove Columns on page 40). This has the same columns as
Locations on page 83.
Locations Snap Panels
Selecting a location row displays the Reference Tree Snap Panel, with that location’s
connection to equipment. Click the plus (+) icons to expand the tree. The Location Details
panel displays what has been configured in the Location Editor.
NMS200 Portlets
84
Page 85

ProSafe Network Management Software NMS200
CAUTION:
Visualize My Network
The Visualize My Network portlet displays discovered devices, mapping them in relationship
to each other. You can click and drag displayed portions of this screen to see other parts of
the topology. To move the display more, click in the OVERVIEW panel.
You can also expand / collapse the panels on the lef t of t he scree n by clicking t heir title ba rs.
(Figures below display them expanded.)
Hover the cursor over an icon or link between icons to see a small screen describing its
contents and alarm state. Click an icon to highlight it (or click its name in the GRAPH
INVENTORY tab list) and it s connections to the network. See Alarms in Topology on page 95
for more about the alarm states indicated by icons in topology.
If you have installed a firewall on t he application server, ports 80 and 8080
must both be open for topology to work.
Click the double arrows in the upper right corner to open the Legend for this screen, which
describes the link colors and their meaning. Hover the cursor over a link to see its type
described. See Icons on page 90 for an explanation of the icons that appear in these
screens.
The screen to the left of the map displays the following panels:
• Control and Styles
• Data / Node Finder
• Layout
• OVERVIEW
NMS200 Portlets
85
Page 86

ProSafe Network Management Software NMS200
Click on the title bars when these appear collapsed on the left of the screen to expand them.
Click the blue left arrow at the top of them to re-collapse them.
In addition to the screen components immediately displayed, you can right-click an icon or
component, and Drill in or Expand a device to see its subcomponen ts . If you expand, then it s
subcomponents appear onscreen with the rest of the topology. If you Expand w/o Filtering,
then any filtering you have applied in the Data / Node Finder tab does not apply to the
subcomponents that appear. If you drill in, other components do not appear. Finally, you can
select Actions to execute. The Layout selected in determines the arrangement of such
expansions or drill-ins.
When you drill in, the path back to the top level appears below the topology.
Click the level where you want to “drill out,” or click Home to go to the top level.
Right-clicking a device can also let you select available Adaptive CLI Actions to execute on
the selected device or component.
If you right click the blank area of the screen, you can Export it as either an image or GML
(graphic markup language), or print the displayed topology.
Note: Because Topology uses Adobe Flash, menu items appear for that
software when you right-click nodes. This includes Settings, Global
Settings and About Flash menu items. The text below does not
discuss these.
Actions
Available Node Actions mirror the kinds of menu items available in Managed Resources on
page 133.
NMS200 Portlets
86
Page 87

ProSafe Network Management Software NMS200
The Action Tree panel displays the available actions. The Action Search panel lets you enter
a desired action and search for it. Select an action and click Execute to implement it. Click
Cancel to dismiss this screen without running any action.
Control and Styles
• ZOOM
• DISPLAYED LEVELS
ZOOM
Click the + or - icons to zoom in or out. The 1 icon returns to the original default magnification
(100%). The Autofit icon zooms to fit all devices in the topology.
DISPLAYED LEVELS
Clicking 1 displays the top level. Clicking 2 displays the top level and the one below it.
Clicking All displays all discovered levels, from device to interface.
Tip: The
Clicking the Filter b
includes the following:
Level 1 Filters
Excluded Association Types (Cont
these are activated, the icons disappear.
Level 2 Filters
fewer levels displayed, the more quickly the display appears.
utton opens a screen that lets you further tune the Topology display. It
act, Vendor, Location) lets you turn off those icons. When
Select a Minimum Alarm Severity to display from the pick list. When you select a severity,
then only resources with that alarm level or greater appear in the topology display.
NMS200 Portlets
87
Page 88

Level 3 Filters
ProSafe Network Management Software NMS200
Select a Minimu
m Alarm Severity to display from the pick list. This restricts the display on a
lower level than Level 2.
Condition Override(s)
When active, this excludes level expands on nodes with links that do not match the severity
filters.
Click the Apply Filterin
g button to implement your configuration, or Cancel to dismiss this
screen without applying it.
STYLE OPTIONS
This tab’s options configure node and line appearance. It displays the following when you
click buttons in this panel. Notice the fist tw o have Tooltips tabs in addition to the first one you
see:
t
• Node S
yle Options — Configure how nodes appear in topology.
In the Label / Node View tab, you can elect to Enable Node Labels so labels appear next
to icons in topology. Select the attributes in the middle panel. You can also elect to Show
Labels for Problem Nodes Only, and Truncate Node Label Characters (and select the
maximum number of characters).
Click to move attributes from Attributes to
Display (all appear by default) to Available
Attributes to conceal attributes you do not want displayed.
The Nod
e Rendering pick list le
ts you select from several styles of icon that appear in
topology. These include two icon styles (Style 1, the default, and Style 2), colored Circles
(the color is the associated alarm color), and Labels Only. This last style overrides any
previous selection to display labels only for problem nodes.
NMS200 Portlets
88
Page 89

ProSafe Network Management Software NMS200
• Edge Style Options — This lets you configure the colors on connections between icons.
First, click to Enable Edge Labels. To have the edge reflect speeds, you can then elect
Layer 2 Speed Styling (enable Use Style Overrides). Select colors for speeds by clicking
the lower right corner of the colored boxes that appear next to speed range labels. You
can also configure the thickness of the edge next to that color selector. Click Apply to
enable your configuration, or Cancel to abandon it and close this options screen.
Note: Revising colors does not mean the revision appears in the legend
• Background Image — Click the + to select an image, typically a map, that you want to
appear in the background, or the - to remove an existing one. Click and drag icons to
locations on that image after it has appeared onscreen.
The selector looks for images on the machine where the browser is located. The size and
ppeara
a
page in the browser. For example, setting the screen to1280 by 1024 pixel resolution,
with a one-column layout for the page where topology appears, a background graphic
can be as large as 800 x 650 pixels.
nce of images depends on the resolution of the monitor and the layout of the
Data / Node Finder
This screen offers additional topology information to help you lo cate specific reso urces within
the visualization you have produced.
NMS200 Portlets
89
Page 90

GRAPH INVENTORY
ProSafe Network Management Software NMS200
This displays a legend of icon types followed by a co
unt (in parentheses) of how many of
each appear in the topology . The switch at the bottom of this panel centers the display around
the selected icon.
Click the plus (+) to the left of the inventory category icons to display a list of devices in that
category in the topology. Click on a list item to highlight that device and its network
connection in the topology view. A circle highlights the device and a colored glow highlights
its network connection(s). Notice that the listed inventory changes if you drill in.
Tip: T
o make sure the selection appears in your view, select Center view
around selected item at the bottom of this panel.
This tab also lets you Search for n
odes by Keyword. Search results highlight specific items
within the topology.
Icons
The the icons next to listed devices mean the following:
Icon Type Explanation
Alarm This shows the alarm state of the devices listed. In a composite list, like appears in
Inventory, it shows the highest alarm state.
Indeterminate No alarm information is available for this device.
NMS200 Portlets
90
Page 91

ProSafe Network Management Software NMS200
Icon Type Explanation
Status Green means the device is Onlin e, red means Offline, and yellow means
indeterminate.
Topology Alarm
Triangle
These appear next to the device icons. The upward pointing triangle indicates the icon
attached is a top-level device. The color in the circle is connection status color
described above. The color in the triangle the device’s alarm state. If the triangle points
down, it indicates the triangle’s alarm state color comes from a “child” component of
the node.
In the GRAPH INVENTORY tab (not the topology), the icons to the left of the devices are
alarm icons, and their color reflects the highest alarm state on that device. Icons that appear
on the right in the summary tree view displays the highest alarm severity for that type of
device.
Layout
The layout tab lets you select and configure the type of automated node layout that appears
in the topology display.
Under CURRENT LAYOUT, use the pick list to select the type of layout. The fields and
selectors that appear below depend on the selection. Here are the available layouts, and the
fields that go with them:
NMS200 Portlets
91
Page 92

Balloon
ProSafe Network Management Software NMS200
Balloon layouts display links between managed object
s in a balloon tree structure. The root is
typically whatever device you have expanded or drilled into.
You can specify the following in the settings for this layout:
• Minima
• Child
l nodes spacing – Use the slider to determine how close nodes are to each other.
/ Root angular sector (.o) – Use the slider to determine the angular sector. The
root sector determines how much of an arc around that root the child nodes fill, and the
child sector determines the orientation around the child nodes.
• Overlap a
• Even
• Cluste
voidance method – Select Approximate or Deterministic.
angle distribution – Enable even angle distribution of nodes.
r Policy – Select Vertical or Horizontal. This determines the (automated)
orientation of the topology. Remember, you can click and drag device icons.
• Cluste
r Spacing — Use the slider to determine the spacing between icons not in child /
parent hierarchy.
Orthogonal
Orthogonal connections include right angles. You can specify the following settings for such
s.
layout
• Minimal nodes
• Use p
seudo-orthogonal edges – Enable pseudo-orthogonal edges that have non-right
spacing – Use the slider to configure the node spacing.
angles.
• Cluste
r Policy – Select Vertical or Horizontal. This determines the (automated)
orientation of the topology. Remember, you can click and drag device icons.
• Cluste
r Spacing — Use the slider to determine the spacing between icons not in child /
parent hierarchy.
NMS200 Portlets
92
Page 93

ProSafe Network Management Software NMS200
Radial
Radial layouts arrange nodes in concentric rings.
• Min
imal concentric rings radius – Use the slider to determine the concentric ring
spacing.
• Min
• Angular se
• Ov
• Root node
imal nodes spacing – Use the slider to determine the nodes spacing.
ctor (.o) – Use the slider to determine the arc where child nodes appear.
erlap avoidance method – Select Approximate or Deterministic.
selection policy – Select Most weighted (for general graphs), Manual (for
general graphs) or Directed (only for tree graphs).
• Link d
rawing type – Select from Straight, Straight polyline, Curved polyline, Orthogonal
polyline, Orthogonal curved.
• Cluster Policy – Select Ve
rtical or Horizontal. This determines the (automated)
orientation of the topology. Remember, you can click and drag device icons.
• Cluster S
pacing — Use the slider to determine the spacing between icons not in child /
parent hierarchy.
Circular
Circular layouts arrange all
nodes in a circle.
• Min
• Min
• W
• Ov
• Root node
imal circle radius – Use the slider to determine the radius of the circle.
imal nodes spacing – Use the slider to determine the nodes spacing.
edge Angle – Use the slider to determine the arc where child nodes appear.
erlap avoidance method – Select Approximate or Deterministic.
selection policy – Select Most weighted (for general graphs), Manual (for
general graphs) or Directed (only for tree graphs).
NMS200 Portlets
93
Page 94

ProSafe Network Management Software NMS200
• Link drawing type – Select from Straight, Straight polyline, Curved polyline, Orthogonal
polyline, Orthogonal curved.
• Cluste
r Policy – Select Vertical or Horizontal. This determines the (automated)
orientation of the topology. Remember, you can click and drag device icons.
• Cluste
r Spacing — Use the slider to determine the spacing between icons not in child /
parent hierarchy.
Hierarchical-Cyclic
This arranges connections in a hierarchy. Use the following settings to alter its appearance.
• Dist
• Dist
• Orient
• Draw edges
• Lin
ance between levels – Use the slider to determine the distance between levels.
ance between nodes – Use the slider to determine the distance between nodes.
ation – Select from Top to Bottom, Bottom to Top, Left to Right or Right to Left.
from – Select from Node Center or Node Side.
k drawing type – Select from Straight, Straight polyline, Curved polyline, Orthogonal
polyline or Orthogonal curved.
• Cluste
• Cluste
r Policy – Select from Horizontal or Vertical.
r Spacing — Use the slider to determine the spacing between icons not in child /
parent hierarchy.
Basic Spring
Basic Spring is an alg orithm atte mpt s to produce a na
topology.
tural layout that optimizes a spread out
• Optimal Ed
• Cluste
• Cluste
r Policy – Select from Horizontal or Vertical.
r Spacing — Use the slider to determine the spacing between icons not in child /
parent hierarchy.
ge Length – Use the slider to determine the distance between nodes.
NMS200 Portlets
94
Page 95

ProSafe Network Management Software NMS200
OVERVIEW
This displays a thumbnail of the entire topology that appears in the larger screen to the right .
Click a location to move the larger view to center on it.
Alarms in Topology
Colored circles and triangles appear next to topology nodes to indicate its network status
(circles) or the alarm state of the device (triangles, apex points up) or the alarm state of its
child entities (off-center triangles, apex points down). For information about the alarm, hover
your cursor over the triangle, and a popup appears describing the device, whether the alarm
is on the device or a “child,” and what is its severity.
The alarms indicated are like alarms described in the portlet Alarms on page 51.
Vendors
In its summary form, this portlet displays the available vendors for network resources.
Right-clicking a row lets you Share with User, (See Sharing on page 43.) or use the Import /
Export common menu capabilities described in Import / Export on page 42.
This screen has the following columns:
endor Icon — The icon for this vendor.
• V
• Enterprise Number — The enterprise number for this vendor.
• V
endor Name — The name for this vendor.
NMS200 Portlets
95
Page 96

ProSafe Network Management Software NMS200
Expanded Vendor Portlet
When you expand the Vendor portlet, besides sharing you can also Add / Remove Columns
item (see Add / Remove Columns on page 40). This screen has the same columns available
as the summary screen.
Vendors Snap Panel
The snap panel displays the containers where the selected vendor is a member.
NMS200 Portlets
96
Page 97

5. Monitoring
This chapter describes Resource Monitors as they appears in NMS200’s web portal. For
more information about creating, managing and configuring such monitors, refer to
NMS200’s User Guide. The following describes these monitors:
• Resource Monitors
5
• Top [Asset] Monitors (pre-configured monitors that come with your
Finally , this chapter cont ains a reminder about schedu
See Scheduling Refresh Monitor Targets on page 113.
ling refreshes of monitor target groups.
installation by default.
Resource Monitors
This summary screen displays currently, active performance monitors in brief.
The Name column displays the identifier for each monitor instance, Enable displays a green
check if it is currently enabled, or a red minus if it is disabled.
The Monitor Type column typically displays what the monitor covers. Hover your cursor over
this column to see a popup with the selected monitor’s properties. The popup that appears
after this query displays the relevant information for the monitor, including whether it is
Enabled, Name, Description, Target Count, Retention Policy, and Polling Interval Value.
97
Page 98

ProSafe Network Management Software NMS200
The graph that appears to the right of the monitors displays the aggregate availability
information for the enabled monitors. Topics graphed include, Available, Not Available, No
Data and Not Applicable.
Right-click a listed monitor to do the following (not all menu items appear for all types of
monitors):
• Refresh Monitor — Re-query to update any targets for the current monitor. See
Scheduling Refresh Monitor Targets o
n page 113 for instructions about automating this.
• Enab
le / Disable Monitor — Enables or disables the monitor. Only one of these options
appears.
• New Monitor — Lets you create a new monitor of the type you select in the sub-menu.
See Monitor Editor on p
• Open Mon
itor — Opens the Monitor Editor, where you can modify the selected monitor’s
age 99 for details.
configuration.
• Delete — Removes the selected monitor.
Expanded Resource Monitor
This screen appears when you click the plus in the upper right corner of the su mmary screen.
As in mo
st expanded views, this one displays a list ordered by the Name of the monitor, and
adds Add / Remove Columns to the previously available menu. Available columns include
those on the summary screen (Name, Enabled, Monitor Type) as well as Description, Poling
Interval, Target Count and Retention Policy.
Resource Monitor Snap Panels
When you select a monitor , the Snap Panels at the bottom of the screen display det ails about
it. The Reference Tree shows the selected monitor’s connection to attributes, groups,
retention policies and its membership (the devices monitored).
Monitoring
98
Page 99

ProSafe Network Management Software NMS200
The Details Snap Panel displays the attributes the popup shows when you hover the cursor
over the Monitor Type column in the summary screen, and adds Emit Availability (events),
Retain Availability, Retain Polled Data, and Retain Calculated Data parameters.
The Monitor Status Summary Snap Panel displays the status of each individual member
(Target) of the monitor, showing the Last Polled time and date, and a title bar and icon
indicating Availability (green is available, red is not).
Hover the cursor over the Availability icon, and a popup appears with details about
availability. If the device is available, the RTT (round-trip time) for communication appears in
Avg (average), Max (maximum), and Min (minimum) amounts, along with the PacketCount. If
it is not, an Error Message appears instead of the RTT and PacketCount parameters.
To edit more performance settings and targets than are available here, use the features
described in Dashboard Views on page 115. You can create and display dashboards by
right-clicking items in Managed Resources, selecting Show Performance.
Monitor Editor
This editor lets you fine-tune the monitor you selected and right-clicked to open the editor. It
includes the following panels and fields:
• General
• Monitor Options
• Calculated Metrics
• Thresholds
• Inventory Mappings
Monitoring
99
Page 100

ProSafe Network Management Software NMS200
General
The General panel is common to all different monitor types.
• Name — The identifier for this monitor.
• Desc
• Pollin
• Reten
• Enab
• Emit A
• Ret
ription — A text description for this monitor.
g Interval — Use these fields to configure how often the monitor polls its target(s).
tion Policy — This configures how long NMS200 retains the monitor’s data.
led — Check to enable.
vailability Events — Check to activate emitting availability events.
ain Availability Dat a — Check to activate. You must Retain availability data to enable
alarms. If you define thresholds, you should retain availability data. Retain availability
data stores the Boolean values of whether availability data was in the range your defined
metrics.
• Ret
ain Polled Data — Check to activate. If you uncheck Retain polled data only
calculated data remains, you cannot view data retrieved from monitored entities. Turning
off Retain polled data discards the data as it arrives from the device.
• Ret
ain Calculated Data — Check to activate. Retain calculated data complements Retain
polled data. If checked, it stores the calculated result s wh ich came from the raw poll data
received from the device.
• Up
date Network Status — Check to activate a check of the monitored device’s network
status.
• #
of Unreachable Attempts before update — The number of attempts to reach the
device before NMS200 updates the displayed network status of the device. (1-100)
Click Save to preserve any edits you make, or Cancel to abandon them.
Monitoring
100
 Loading...