

Page 1
Programmable Launch Boost Controller
PN 7562
Parts Included In This Kit
1 - Controller
4 - Mounting Screws
1 - Wiring Harness
1 - Solenoid Valve Assembly, ASY25190
The MSD Programmable Launch Boost Controller allows you to program a boost pressure map
from the launch through a complete run from 12.5 to 100 seconds. You can also program a boost
limit during the burnout. The boost pressure is controlled through two PWM outputs that control
two normally closed 2-way, solenoid valves connected to the waste gate actuator. The actuator is
programmed through PID servo-control and can be tuned for the particular actuator response.
The Boost Controller also can record from 20 to 160 seconds of data including engine rpm, map
pressure, Boost Curve Pressure, Barometric Pressure, PWM output and the Launch and Overboost
input wires. This can all be saved and reviewed in the Launch History window of the MSD software.
All of the programming features can be set with the MSD Pro-Data+ software. This software is for
PCs running Windows 95, 98, 2000, NT, XP or ME. All of the parameters can be saved in the PC,
then uploaded to the Controller. There is also a Hand Held Programmer/Monitor, PN 7550, that is
available separately. This unit has an LCD display that will walk through the programming menus
for programming without a PC.
Parts Required but Not Supplied:
1 - MAP Sensor:
2 BAR Up to 30-psia, MSD PN 23121
3-BAR Up to 45-psia, MSD PN 23131
75-PSIA Up to 75-psia Absolute pressure
75-PSIG Up to 75-psia Gauge pressure
PROGRAMMABLE FEATURES
BURNOUT
This determines how the Light Blue Burnout wire is activated. It can either be activated by applying
12 volts or by switching it to ground. Default is 12 volts.
SwPWR 12 volts activation
SwGND Ground activation
BOOST
Program a boost map based on time from 12.5, 25, 50 or 100 seconds. Also, select a maximum
boost pressure for the burnout.
Launch: This is the map for the run. This program is made on the Boost Pressure Curve
graph. The Boost pressure can be plotted over time down to 0.01-second and 0.1-psia
increments. One to thirty-two points may be set in the graph.
Burnout: Select a maximum boost pressure that will be used during the burnout. Adjustable
from 0 - 75-psia.
Overboost: This selection lets you program a rampable boost value that is higher than the
programmed curve. Overboost is only activated when its activation wire (Orange) is switched
to 12 volts.
Max: This adjustment extends the time that you can program a boost curve. Adjustable in
12.5, 25, 50 or 100 seconds.
MSD IGNITION • 1490 HENRY BRENNAN DR., EL PASO, TEXAS 79936 • (915) 857-5200 • FAX (915) 857-3344
Page 2

2 INSTALLATION INSTRUCTIONS
SENSOR
Select the type of Manifold Absolute Pressure (MAP) sensor you will be using.
2 BAR Up to 30-psia
3-BAR Up to 45-psia (This is the default setting)
75-PSIA Up to 75-psia absolute pressure
75-PSIG Up to 75-psia gauge pressure
PID
These are the tuning functions of the Controller that manage the waste gate response. Proportional
Integral Derivative (PID) provides mathematical adjustments that you program in order to obtain
the optimum response and control of the waste gate. The defaults are 40 for each with a range of
0-255. Testing and tuning through the acquisition files is going to be key in setting the controller
properly. Page 8 goes into more detail in programming these settings.
GAIN
P This is determined by reviewing the maximum PWM value when boost is
being controlled.
I This value is used to correct the long term pressure error based on time.
D Increase this value when the PWM is too high or when the boost pressure
overshoots the target pressure.
ENABLE
This setting allows the user to set a target pressure window where the I Gain setting is allowed to correct
a pressure error. The default is set for 1.5-psi and can be programmed from 0 (no I) to 5-psi.
CYLINDER
Select the number of cylinders for your engine. Choose 4, 6 or 8-cylinders. Default is 8.
ACQUIRE
This setting allows you to select how and when the acquisition feature begins recording data.
RPM Set the rpm that the engine must reach to arm the acquisition feature. If this rpm is
not achieved, no data will be recorded.
ARM Select how the acquisition feature is armed prior to beginning to record.
RPM: Set an rpm that the engine must reach in order to arm the Acquisition feature.
If this rpm is not achieved, no data will be recorded. (The Launch wire must be
connected to 12 volts.)
Launch: The Acquisition feature will be armed when the Launch wire (Dark Blue) is
activated, only after the Light Blue wire has been activated.
Off: No data will be recorded.
Mpy: This allows you to multiply the amount of time that data can be acquired.
Twenty seconds multiplied by 2, 4 or 8 for a max aquire time of 160 seconds.
ALERT
Alerts are messages that can be viewed on the screen of the Hand Held Monitor. You can choose
to have the Alerts be displayed or skipped when they are active on single or multiple screens.
The Alert messages at this time include:
LampShort The remote indicator is shorted or overloading.
PSIOVer This indicates that the boost pressure is more than 2-psi over the target boost
pressure value for over two seconds. This could be caused from incorrectly
set PID values, a waste gate problem, a line is plugged or inoperative, or the
valves are not wired correctly.
ALERTS PER
Select the number of Alert Messages that will be displayed each time the display is interrupted. The
default is set to 0 to not show any alerts.
MSD IGNITION • 1490 HENRY BRENNAN DR., EL PASO, TEXAS 79936 • (915) 857-5200 • FAX (915) 857-3344
Page 3
INSTALLATION INSTRUCTIONS 3
LED
The LED on the side of the unit will verify at power up by turning on for one second (the remote
indicator will also light up). It will also blink steady when the launch sequence is active (the Dark
Blue wire is connected to 12 volts). Once the car launches, the LED will turn off.
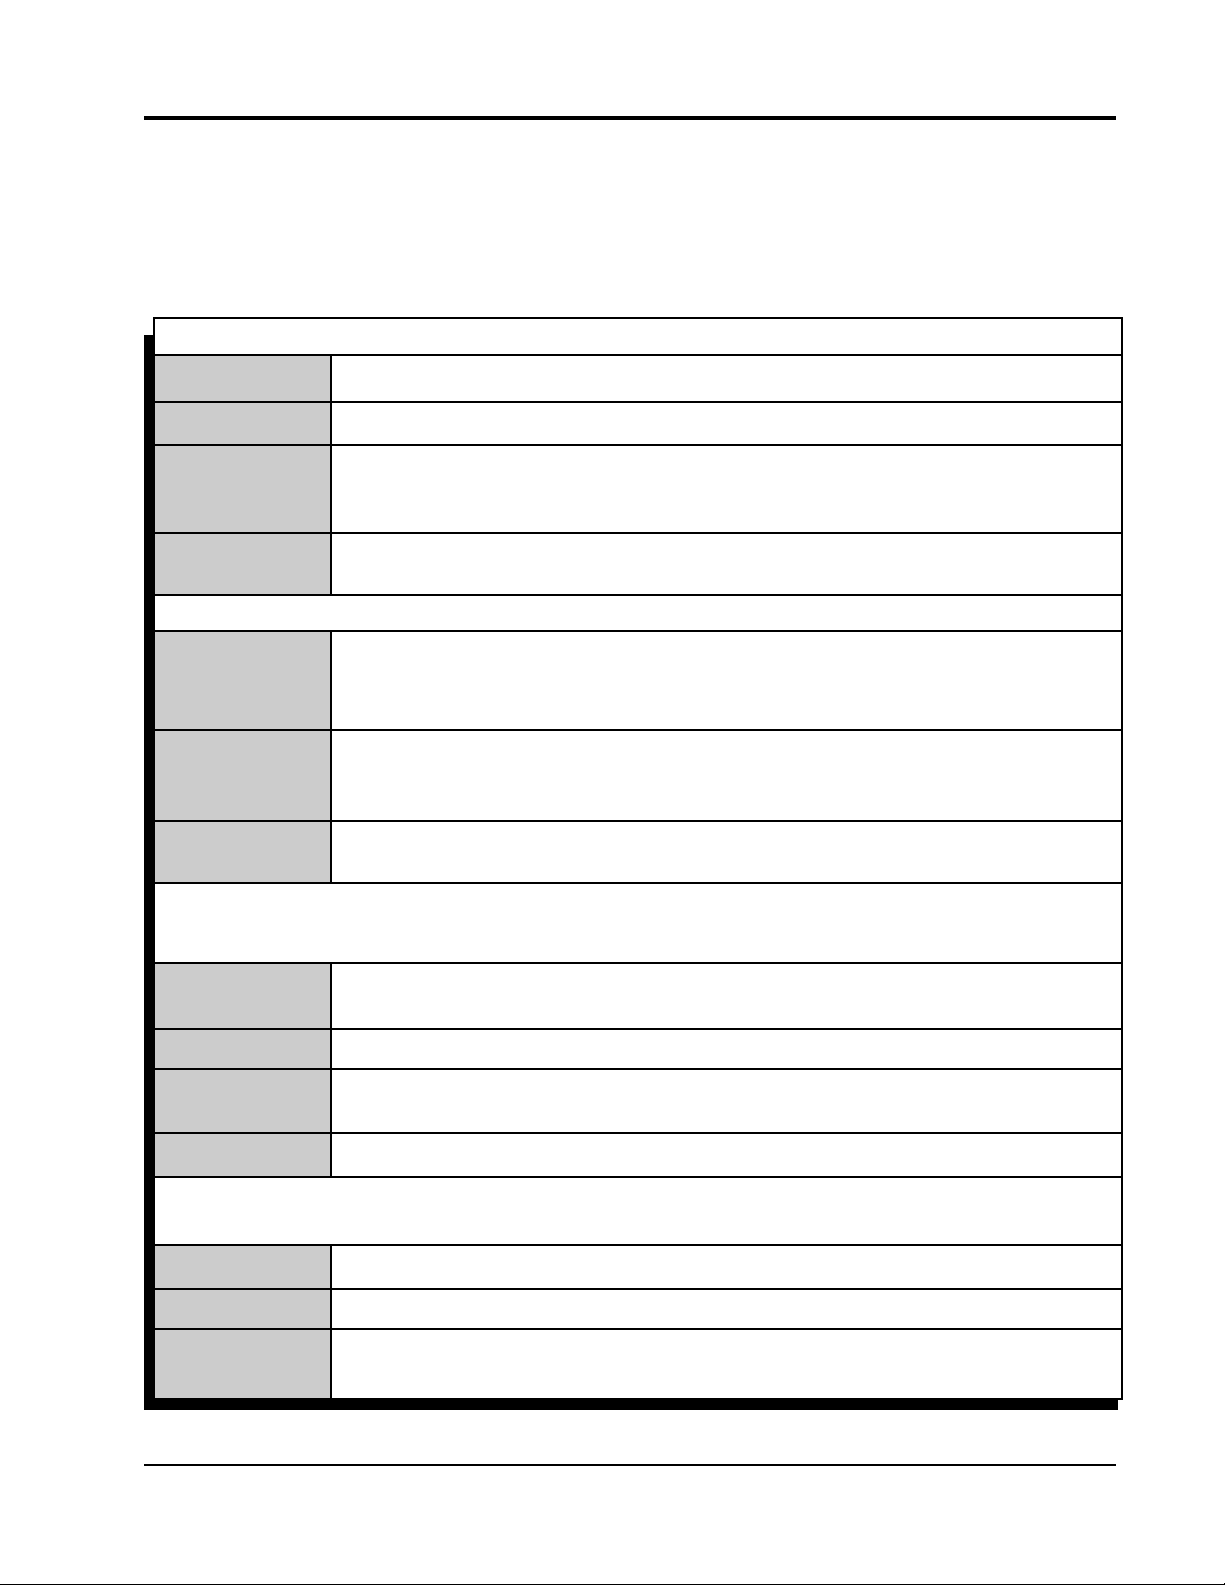
WIRING
VIOLET On/Off. Connect to a switched 12 volt supply.
BLACK Ground. Connect to battery negative or to engine ground.
BROWN Indicator Alert. Connect to a 12 volt LED or bulb that will alert the user that the
launch sequence has been properly initiated by flashing. It will turn off when
the car is launched (12 volts removed from the Dark Blue).
GRAY Tach input signal wire. Connect to the ignition tach output (12 volt square
wave).
CONTROL WIRES
DARK BLUE Launch wire. This wire is activated when switched to 12 volts. At that point,
the first time point of the boost pressure curve is selected and the time is reset
to zero. This wire overrides the burnout wire (Light Blue) when both are active.
LIGHT BLUE Burnout wire. This wire can be programmed to be active either with 12 volts,
or when connected to ground. When active, the Burnout boost pressure
value is activated, the acquisition record is stopped and armed for the launch.
ORANGE Over-boost control wire. When connected to 12 volts, this will activate the
over-boost ramped pressure value.
WASTE GATE CONTROL WIRES
These wires provide a self-protected driver with an output current load of up to 2 amps continuous.
YELLOW Provides a pulse width modulated ground to the waste gate solenoid valve.
Note that this wire is Normally Closed to Ground.
RED Provides 12 volts to the waste gate electric air valve.
GREEN Provides a pulse width modulated ground to the waste gate solenoid valve.
Note that this wire is Normally Open from ground.
RED Provides 12 volts to the waste gate electric air valve.
MAP SENSOR
3-pin connector goes to the external MAP or Gauge Pressure Sensor.
BROWN/WHITE Five volt supply wire.
BROWN MAP output signal
BROWN/
Ground
YELLOW
MSD IGNITION • 1490 HENRY BRENNAN DR., EL PASO, TEXAS 79936 • (915) 857-5200 • FAX (915) 857-3344
Page 4
4 INSTALLATION INSTRUCTIONS
Figure 1 Wiring the Boost Launch Controller.
OPERATION AND SET UP
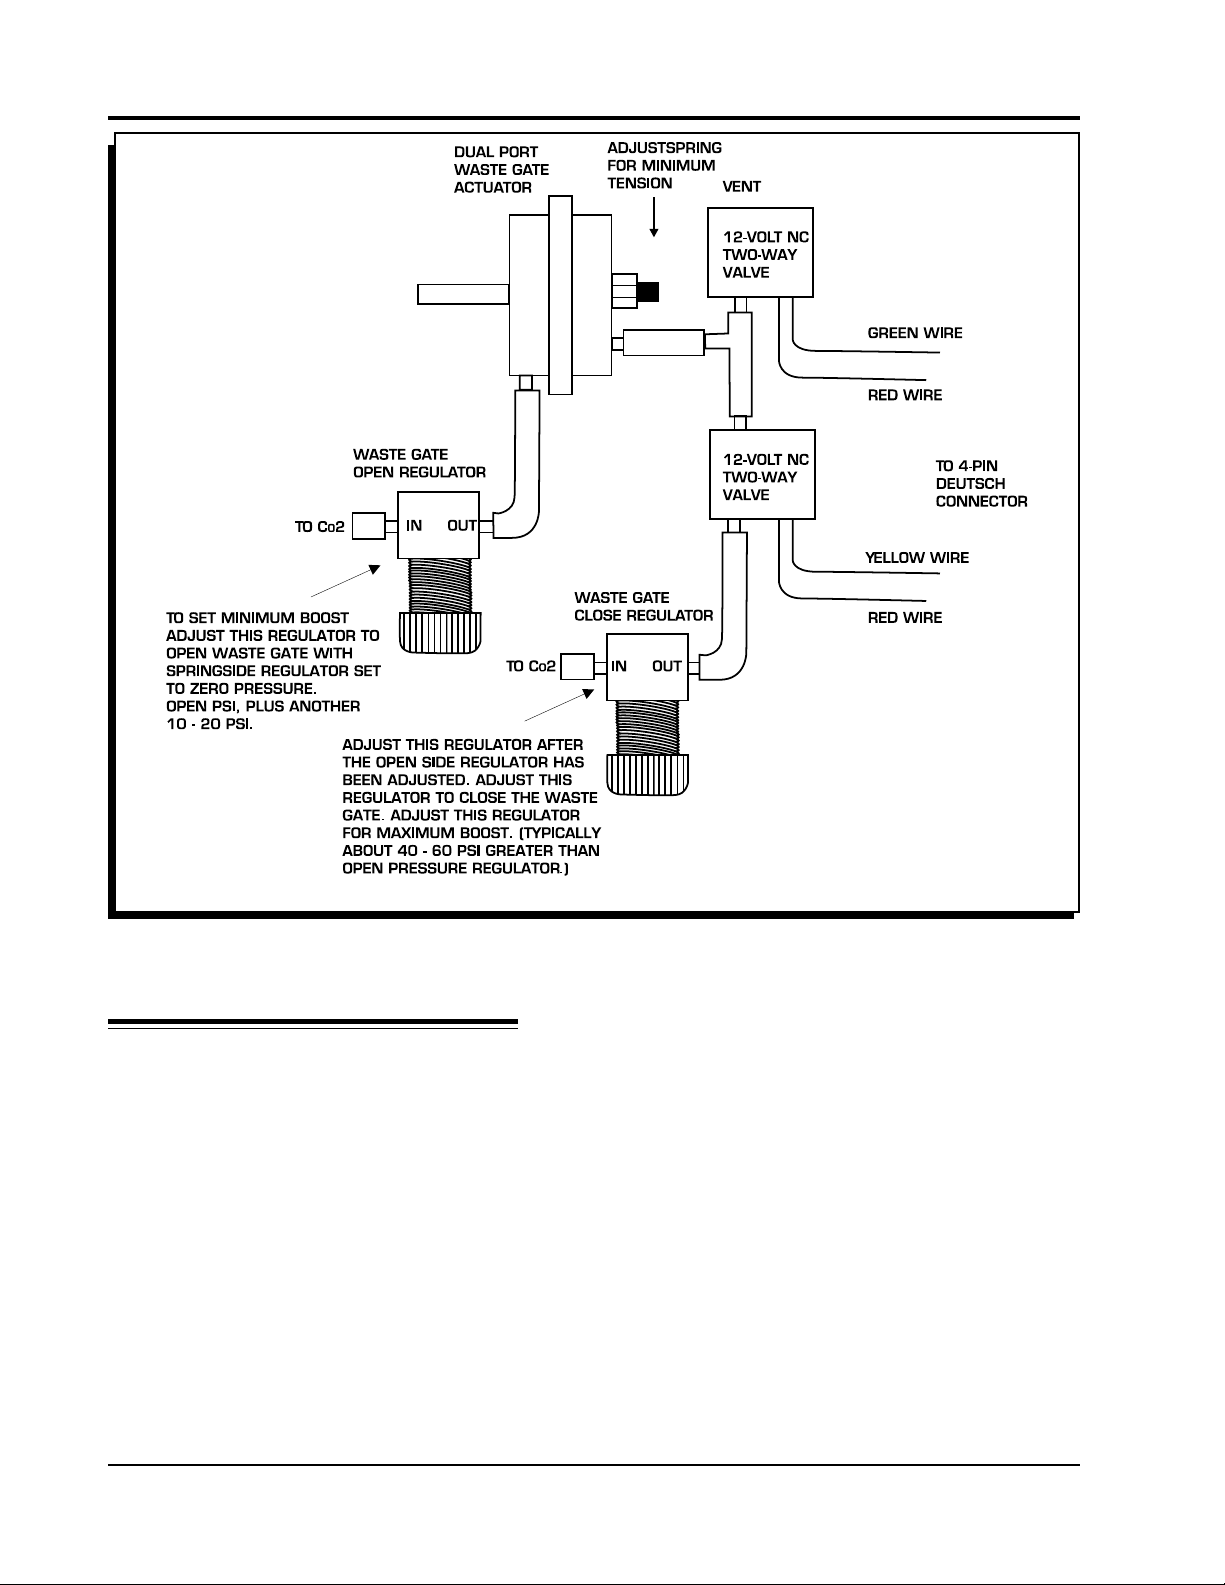
The spring in the waste gate must be the lowest rated spring available in order to achieve minimum
pressure. (Unless you are using CO2 to set a minimum and maximum boost.) The programmed
boost pressure will only be capable of increasing boost above the minimum boost pressure that is
set by the waste gate actuator spring value. There must be a pressure relief valve in the intake duct.
This should be set at the maximum desired pressure or 1-2-psi greater. Also, two Normally Closed,
12 volt solenoid valves with 3/32" orifice must be installed between the waste gate actuator and the
manifold (or CO2) on the spring side.
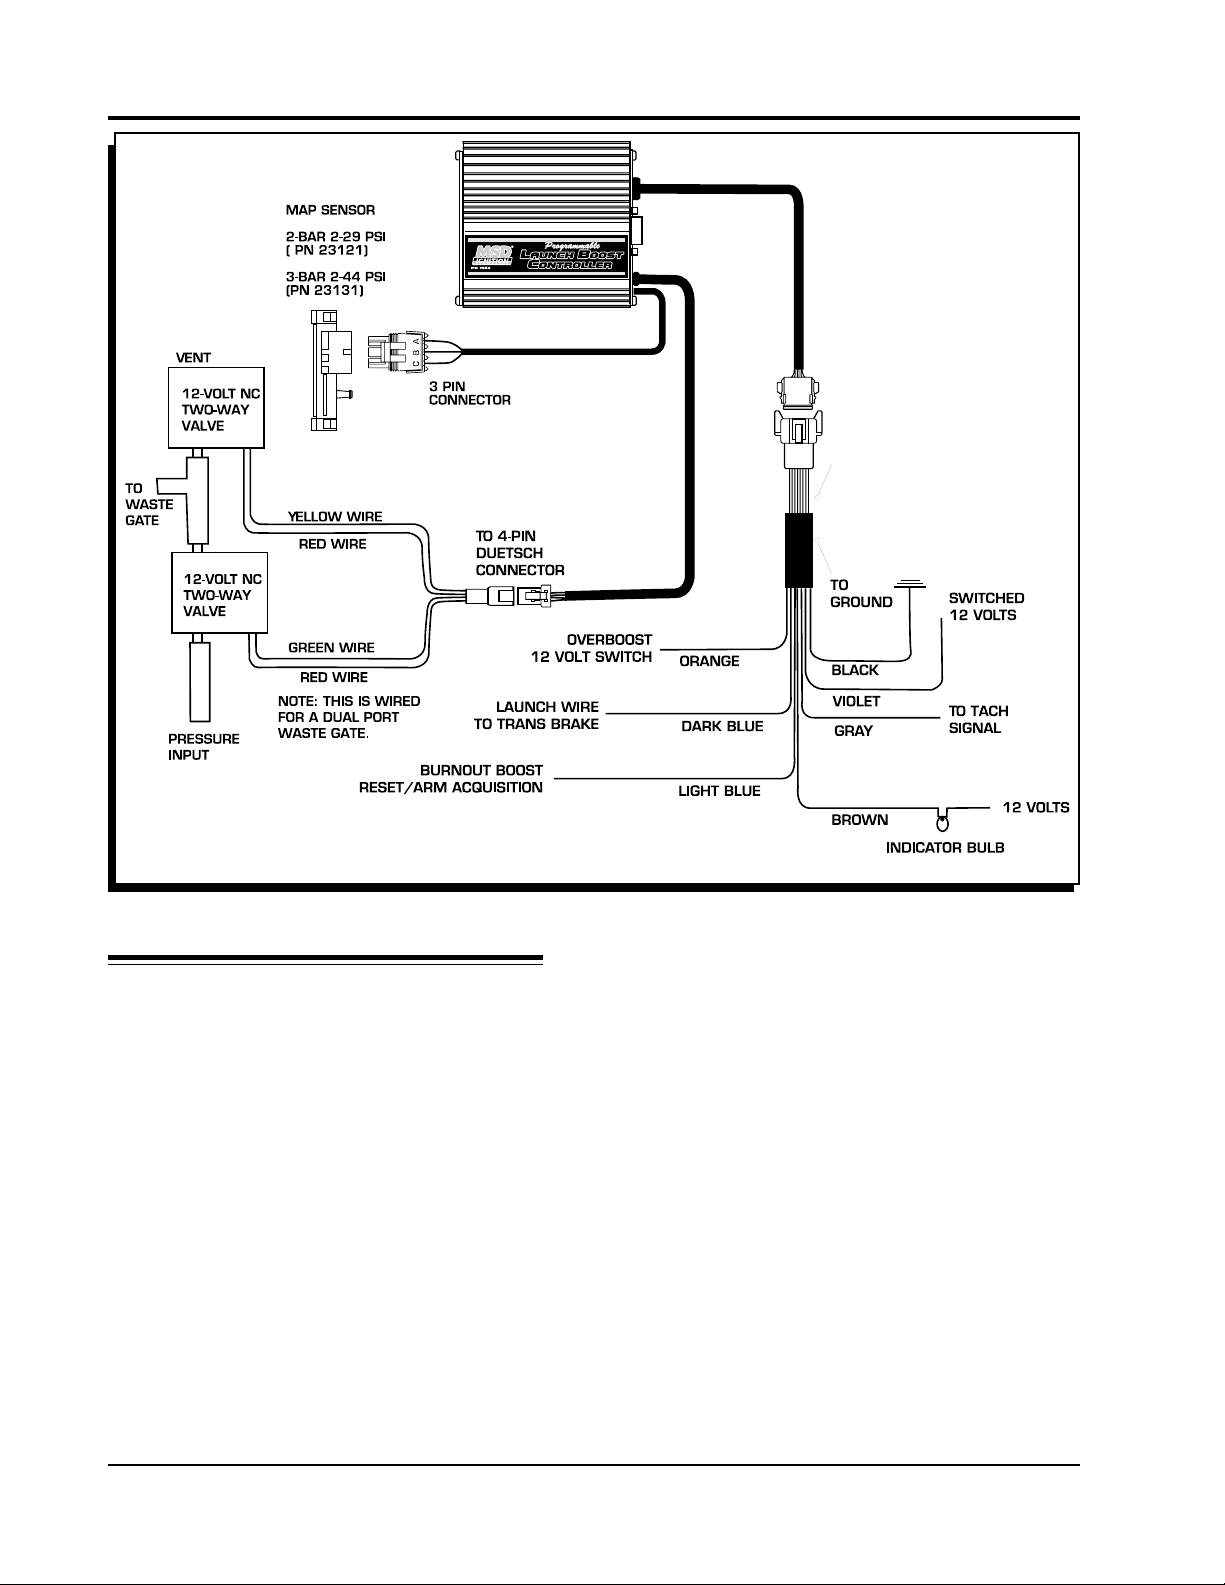
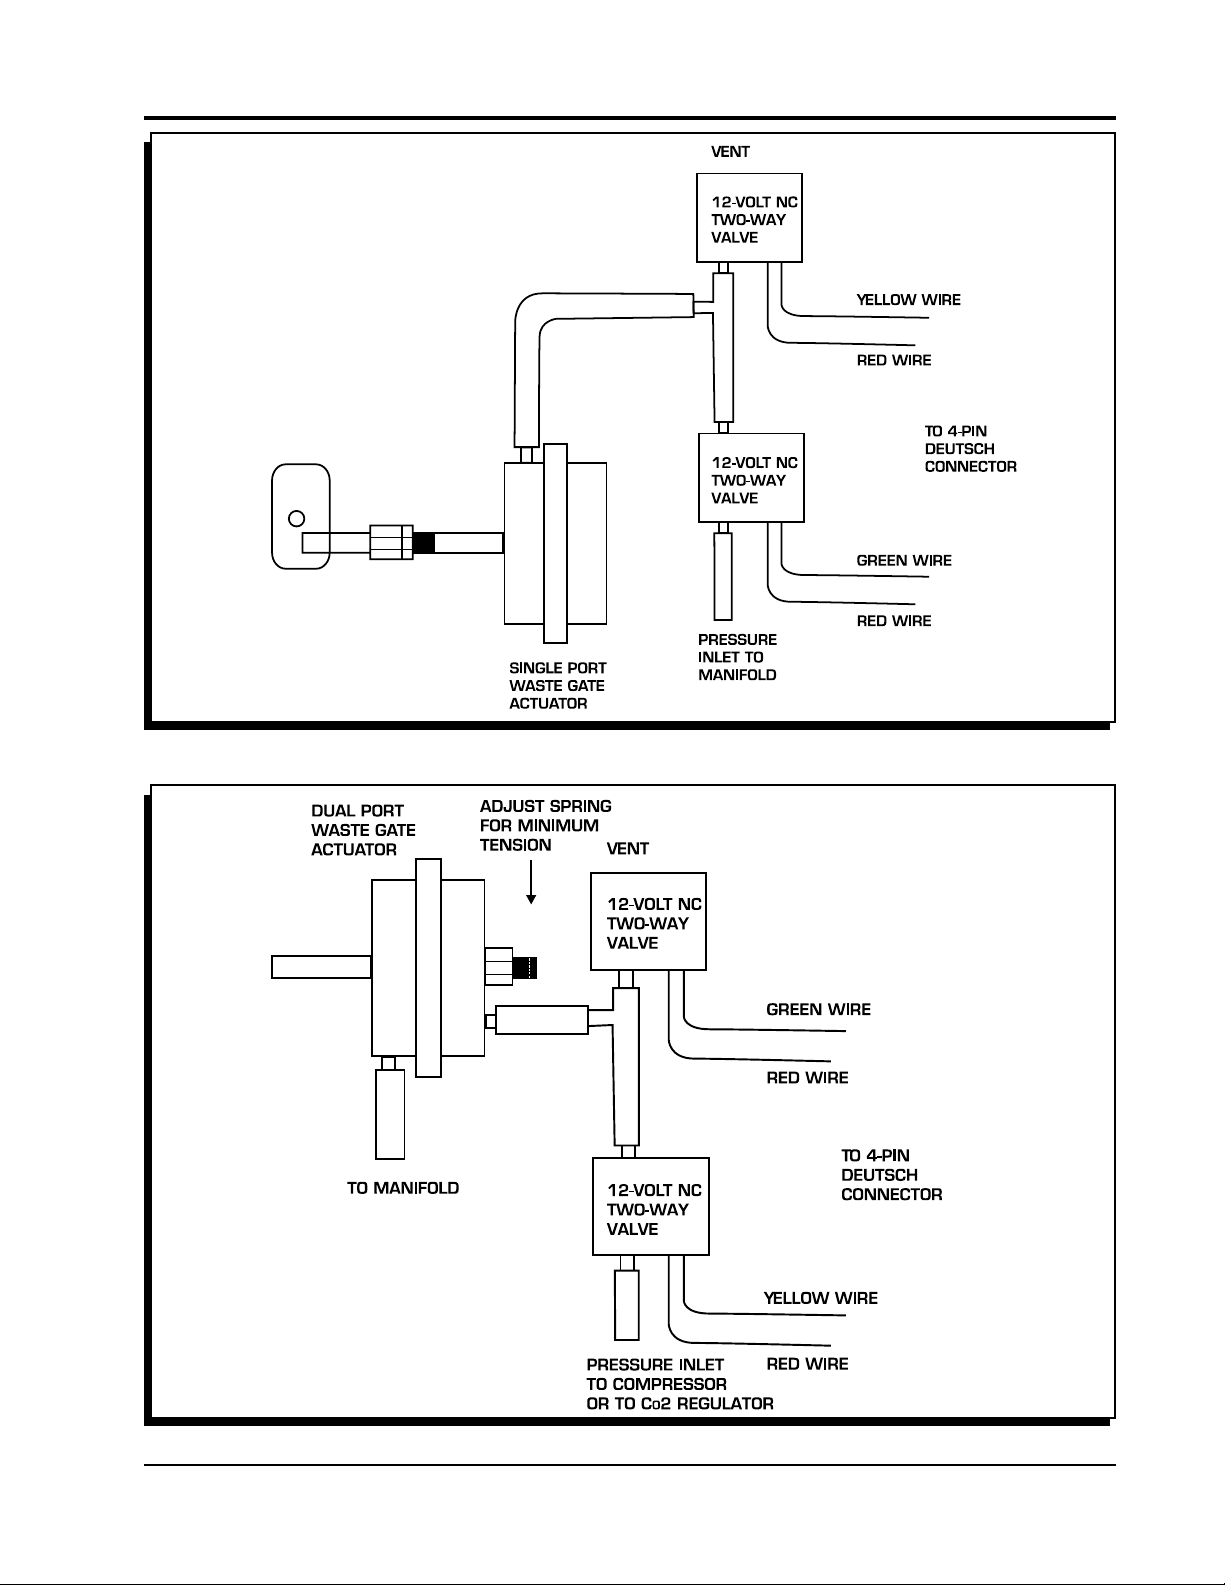
The MSD Controller can control both types of waste gate actuators with a single or dual pressure
ports. The control solenoids are always connected on the spring side of the waste gate actuator. If
your waste gate actuator has pressure control on both sides of the waste gate actuator refer to
Figure 3. If it has only one pressure port, refer to Figure 2. For optimum control, Figure 4 shows a
dual port actuator with a CO2 bottle giving it full adjustability.
The MSD Controller will regulate the waste gate actuator to maintain the desired boost pressure. The
boost pressure value is a clamp value, in that the turbo or blower must be developing at least the
programmed boost pressure value to open the control valve to open the waste gate. This allows you
to program a burnout boost pressure maximum, a launch maximum boost pressure and then to
provide a smooth pressure ramp up to the maximum boost pressure by plotting a pressure vs. time
curve with up to 32 points entered in .1 PSIA increments, and .01 second increments.
MSD IGNITION • 1490 HENRY BRENNAN DR., EL PASO, TEXAS 79936 • (915) 857-5200 • FAX (915) 857-3344
Page 5
INSTALLATION INSTRUCTIONS 5
Figure 2 Single Port Waste Gate Actuator.
Figure 3 Dual Port Waste Gate Actuator.
MSD IGNITION • 1490 HENRY BRENNAN DR., EL PASO, TEXAS 79936 • (915) 857-5200 • FAX (915) 857-3344
Page 6
6 INSTALLATION INSTRUCTIONS
Figure 4 Dual Port Waste Gate Actuator with CO2 Control.
SEQUENCE OF EVENTS
The sequence of the Boost Controller is controlled through the Burnout wire (Light Blue) and the
Launch Wire (Dark Blue). The Light Blue wire must be activated to arm the acquisition feature of
the controller followed by the activation of the Dark Blue wire (which overrides the Burnout setting).
When the 12 volts is removed from the Dark Blue wire the acquisition begins (with two seconds
prior) as does the boost map that you plotted.
It is recommended to connect the Light Blue wire to the brake switch and the Dark Blue to the trans
brake or clutch switch. As the car rolls into the lights, the Light Blue wire will be activated through
the brake switch to arm the acquisition. Once in, the trans brake is activated along with the Dark
Blue Launch wire which puts the Controller at zero time or the first value in the Launch boost curve
to control the boost pressure. When the transbrake is then released, the launch wire is deactivated
and the sequence begins.
Note:The Light Blue wire MUST be deactivated before the Dark Blue wire is deactivated in order to
set a proper launch and record sequence.
MSD IGNITION • 1490 HENRY BRENNAN DR., EL PASO, TEXAS 79936 • (915) 857-5200 • FAX (915) 857-3344
Page 7

INSTALLATION INSTRUCTIONS 7
When the brakes are applied at the end of a pass, the Light Blue wire is again activated, which
stops the recording process of the Controller. Do Not activate the Dark Blue wire until the acquisition
files have been downloaded. Doing so will reset and erase the previous run.
Note: The record function can be set for rpm to allow the record to begin at a programmed rpm.
(The Launch wire must be connected to 12 volts.)
Clutch Cars: For clutch car, the Light Blue wire should be connected to a momentary switch to
use the Burnout Boost and to arm the acquisition. The Dark Blue wire for the launch can go to the
clutch or brake switch to activate the boost map and acquisition when the car launches.
ACQUISITION
The Programmable Launch Boost Control can provide you with 20, 40, 80 or 160 seconds of
Controller data during each pass with 2 seconds leading to the launch. Samples are taken by the
microprocessor every 10, 20, 40 or 80-milliseconds. (This number can be averaged in the Analysis
Box by choosing Average.) After a pass, you can recall a variety of parameters to view as they
occurred during the pass including engine rpm, MAP, boost pressure, PWM output and the status
of the Launch and Overboost input wires. After each pass, the file can be saved so it can be stored
and reviewed with other runs.
With the laptop connected to the Controller after a pass, turn the ignition On and go to the Launch
History window. Click on the Transfer pull down menu then select Acq to Plot. This brings the
recorded information to the screen where it can be saved to the PC by clicking File, then Save As.
Note that the numbers on the left side of the screen are arbitrary and there to provide a division
between the spaces. The numbers that go across the top of the chart are seconds and begin at
two seconds prior to the launch.
After saving the file, it can only be opened and viewed in the History File 1-4 screen (there are four).
If this screen is not up, go to the View pull down menu on the Graph View chart and select History
File. Up to 32 data traces can be viewed in one trace box in a file window. Data traces can be
dragged from the Trace box to the Analysis box to view the data with averaging offsets for PSIG
and other functions.
There will be a window available in each Launch History screen; a combination History Analyze
and History Traces window. (If they are not there when you open the History chart, go to View and
select Trace/Analysis box.) There is a third window available called Notes that allow you to write
any important notes to that specific run. The MSD records all of the possible information then you
decide which ones you want to view and compare. This is done by grabbing each title by clicking,
and then dragging it under the Analyze title. After you select the desired traces you can select
Clear to delete the other traces to make room for other traces to compare.
TRACE /ANALYSIS BOX
This box allows you to select the traces that you want to view. The Trace section shows the different
traces you can monitor. The Analysis section allows you to pick and choose which traces you
want to place on the History Analyze graph. The entire list of items can be copied by clicking Copy
at the top of the window, or you can click-and-drag the traces you want from the Trace list to the
Analyze list. The order of the Traces can be changed by clicking and dragging each one to meet
your desired order. You can select the value that it represents or is measured in, its color on the
screen and when it appears. You can also open other acquisition files and bring their traces into
the same History Analyze graph to compare. Up to 64 traces can be shown on the graph, with 32
from the Analyze list and another 32 from the Trace list.
MSD IGNITION • 1490 HENRY BRENNAN DR., EL PASO, TEXAS 79936 • (915) 857-5200 • FAX (915) 857-3344
Page 8

8 INSTALLATION INSTRUCTIONS
Both boxes have an On and Tier button. Clicking On, brings all of the traces to the Window.
Selecting Tier positions each trace so they are not sitting atop each other. The Clear button will
remove all of the traces that are not turned on. The History Analyze section also has a copy button
which copies everything from the Trace section into its list.
HISTORY ANALYZE WINDOW
PSI Gauge Reference: Key in the atmospheric pressure so there will be a reference when viewing
the PSIg or InchHg values in the History Files.
Value Column: There is a Value column for each trace in the History Analyze window. This lets you
select how to view each trace. Note: Not all of the options will work with every trace.
Value Plot the trace data in the same units as the Trace Window data.
PSIg Pounds per Square Inch Gauge. Best used with the MAP trace. To use this trace, the
present atmospheric pressure must be put in to the Pressure Gauge Reference at
the top of the History Window.
Average Column: This column filters the data. The setting is defaulted to one, meaning that you
are viewing the raw data the same as in the History Trace Window. Increasing this number averages
the samples together for a cleaner, easier to read trace. This is done by averaging the trace data
which is 720° (crankshaft) average data. The Slope function requires an Average setting of 5 or
more while the RpmDiff trace is best if viewed with an average of 5-10. Note that too much filtering
will distort the data. The Map and Boost Traces are best viewed with an average value of 10 - 20.
Color Key: To change the color of a trace, click the pointer just to the right of the value column for
each trace in the Trace or Analyze section. This will bring up the color chart.
GETTING STARTED AND TUNING
At this point, the Controller should be installed, wired and plumbed to the turbo system. There are
several checks and steps required to set up the Controller for your application. The Controller will
take some time to tune to match your engine’s output. There are several examples with information
to assist you in setting up your Controller.
Tach Signal: The Controller requires a tachometer signal to enable the solenoid valves to operate.
The tach signal can be from an ECU output or ignition tach-output, typically a 12-volt pulse. On
some DIS equipped vehicles it is recommended to use the MSD 8913 DIS Tach Driver.
PSIA Pressure: Note that since a Manifold Absolute Pressure (MAP) sensor is used to measure
the boost pressure, the units of programming values are in PSIA. This means that the boost pressure
is a value of pressure greater than the atmospheric pressure. Atmospheric pressure is taken at
power on by the Controller and displayed as RefPsia on Pro-Data screen. Also note that the MAP
sensor should be installed close to the manifold with stiff tubing for accurate pressure measurements
and control.
Gauge Pressure: The Launch Controller can also be programmed to accept a 75PSIG sensor for
high boost applications. This means that all units would be in gauge units relative to atmospheric
pressure.
MSD IGNITION • 1490 HENRY BRENNAN DR., EL PASO, TEXAS 79936 • (915) 857-5200 • FAX (915) 857-3344
Page 9

INSTALLATION INSTRUCTIONS 9
CONFIRM OPERATION
Prior to starting the engine you can confirm your installation. Connect your PC to the Controller
and open the MSD Graphview software. Turn the ignition On and the Controller information should
load to the screen. The screen will display the monitored items on the left side, such as the PWM,
RPM, TargetPSI, RefPSia, and others (Figure 5). The Data Editor menu tree is accessed to change
any of the program values. When you eventually start the engine, the monitor shows the data in
real time at about 10 samples per second.
At this point, you can confirm that the Controller is wired correctly by cycling the Launch wires,
Light Blue and Dark Blue. The Light Blue wire is used to reset and arm the sequence and recording
function while the Dark Blue activates the two. Cycle the Light Blue to 12 volts then open, followed
by the Dark Blue wire to 12 volts, then open. You can confirm that the system is functioning properly
on the PC screen as the LaunMode will display Run.
Figure 5 The MSD Graphview Screen.
MSD IGNITION • 1490 HENRY BRENNAN DR., EL PASO, TEXAS 79936 • (915) 857-5200 • FAX (915) 857-3344
Page 10

10 INSTALLATION INSTRUCTIONS
SETTING MINIMUM BOOST
If you are using CO2 to control both sides of the wastegate actuator, you can skip this step. A
minimum boost pressure must be set in the Controller. To find this, you need to bring the engine
into boost conditions while the MSD Controller is disconnected from the solenoid valve (the 4-pin
connector) and the waste gate ports on the spring side are open. It is recommended to use the
record function of the Controller to help obtain a minimum boost pressure. With the PC to the
Controller open the MSD Graphview Software. Disconnect the solenoid valve connector(s) and
start the engine. Cycle the Light Blue and Dark Blue wires to begin the recording sequence and
bring the engine into boost pressure.
Once this procedure is done, the test record should be visible in the Launch History window. Click
on View, then select Trace Box followed by the Tier button. This will display the data traces in full
screen format in the History Trace box and you can find the minimum boost pressure. For example
if the record shows that the boost came up to 10psg (or 23psia with an atmospheric pressure
reference of 13psia), then the minimum controlled boost would be greater than 10psi boost. It is
recommended to use the lightest spring for the desired minimum boost that is to be programmed
and controlled.
Now that the minimum boost pressure is known, we can program a target pressure to be controlled.
For example if the minimum was measured at 10psi boost then set the BurnBoost to 11psi plus the
atmospheric reference pressure measured. In our example we saw that the atmospheric pressure
was 13psia. To develop 11psi of boost, add the desired pressure to the atmospheric value to program
the boost pressure in psia units, 11+13=24psia. Now also set the Boost Pressure Curve to this
same value 24psia.
Next, set the PID defaults for P=40, I=0, and D=40. This allows tuning the PID without any I term to
begin with. (These values were near optimum based on a Buick Grand National turbo testing.) At
this point, connect the 4-pin connector from Controller to the solenoid valves. (The valves will not
be powered on until the engine is running, by sensing the tachometer signal.) With the PC connected
and the power On, Graphview will display the monitor items. The RefPsia is the current atmospheric
pressure taken from the MAP sensor that is used to measure the manifold boost pressure. The
PWM should be displaying a value between 40 and 100, typically if you have programmed the
boost pressure correctly. If the PWM value stays above 100 then the pressure you have programmed
is at or below the atmospheric pressure and must be corrected before proceeding. Looking at the
TargetPsi value, it should be greater than the RefPsia or MapPsia values.
Before making the next boost test, verify that the TargetPsi value is the correct value for the minimum
controlled boost. Reset the Controller by cycling the Light Blue wire activated and have the Dark
Blue launch wire activated. Do not deactivate the Launch wire until the engine is ready to make
boost! Once ready, release the Launch wire to begin the record function. Build boost for at least 56 seconds or until the boost is steady. The LaunMode monitor item will display PRE while the
launch wire is at +12 volts then change to RUN when it begins recording.
After making a boost run, transfer and save the data in the Launch History window. Evaluate the
data and make changes to the PID values if needed for optimum controller response and pressure
regulation. Following are several test plots and information.
MSD IGNITION • 1490 HENRY BRENNAN DR., EL PASO, TEXAS 79936 • (915) 857-5200 • FAX (915) 857-3344
Page 11

INSTALLATION INSTRUCTIONS 11
TEST EXAMPLE 1 - FIGURE 6
This test shows near optimum PID values, with some improvement still possible. The TargetPsi was
programmed for 14psi boost and was able to reach this value and regulate within about +/-1/2psi
of the target pressure. Note this was at very low RPM of about 3,600 rpm. As rpm increases the
turbo becomes much more efficient and easier to control. The PWM values stayed out of saturation
(40-159) range, but since the rising edge of the boost pressure was little below target, the D term
could be reduced slightly.
Figure 6
MSD IGNITION • 1490 HENRY BRENNAN DR., EL PASO, TEXAS 79936 • (915) 857-5200 • FAX (915) 857-3344
Page 12

12 INSTALLATION INSTRUCTIONS
TEST EXAMPLE 2 - FIGURE 7
This example also shows very good PID values. The PWM values are below saturation levels (40
and 159) and the rise of pressure to the target pressure was very smooth. This test had a larger
value of I and caused slightly more ripple in the boost pressure. The P and D terms are first adjusted
until the response and control of the boost pressure is optimized then the I term can be added to
close the last part of the boost pressure error to the target boost pressure.
Figure 7
MSD IGNITION • 1490 HENRY BRENNAN DR., EL PASO, TEXAS 79936 • (915) 857-5200 • FAX (915) 857-3344
Page 13

INSTALLATION INSTRUCTIONS 13
TEST EXAMPLE 3 - FIGURE 8
The following examples illustrate PID values that are not optimized. Figure 8 shows a PID setup that
has large swings of the PWM value resulting in saturation of the PWM. The saturation occurs when
the PWM swings from full closed, increasing boost at PWM=40, to full open, decreasing boost at
PWM=159. Also the time that was spent at the extreme PWM values of 40 show that this PID setup
had too much P term. The P term should be lowered until the PWM does not reach the saturation
levels for more than instant during any part of the run. Here the P term needs to be changed about
–10 to –20 lower and then retested. If the PWM stays out of saturation the valves are quicker
responding and the pressure regulation will have less ripple. Note that when the P term is lowered
the D term will appear larger and may cause the rising edge of the boost pressure curve to step up
or slow down. With this, it is always best to decrease D term along with decreasing the P term.
Once the boost pressure is near optimum work on making adjustments to optimize D after P
changes have been made. Do not add any I term until the P and D terms have been optimized.
Figure 8
MSD IGNITION • 1490 HENRY BRENNAN DR., EL PASO, TEXAS 79936 • (915) 857-5200 • FAX (915) 857-3344
Page 14

14 INSTALLATION INSTRUCTIONS
TEST EXAMPLE 4 - FIGURE 9
The next test data shows the effect of too much D term in the PID setup. Note on the rising edge of
the boost pressure, the large swing in the PWM value and the slower ramping of the boost pressure.
The boost pressure actually has a small step at 2.9-seconds at 10.4psi, well below the TargetPsi of
12psi. The boost pressure hesitates at 3-seconds before continuing to climb to the target pressure
value. It eventually reaches the target pressure and overshoots then drops back down and is seen
regulating with about 1psi of ripple pressure. The D term here is too big for the size of the
programmed P term. The P term is nearly optimum as it does not show signs of saturation. Reducing
the D term will allow quicker pressure rise and reach the target pressure regulation much quicker.
Here the D term should be reduced about –10- to –20 and then retested.
Figure 9
MSD IGNITION • 1490 HENRY BRENNAN DR., EL PASO, TEXAS 79936 • (915) 857-5200 • FAX (915) 857-3344
Page 15
INSTALLATION INSTRUCTIONS 15
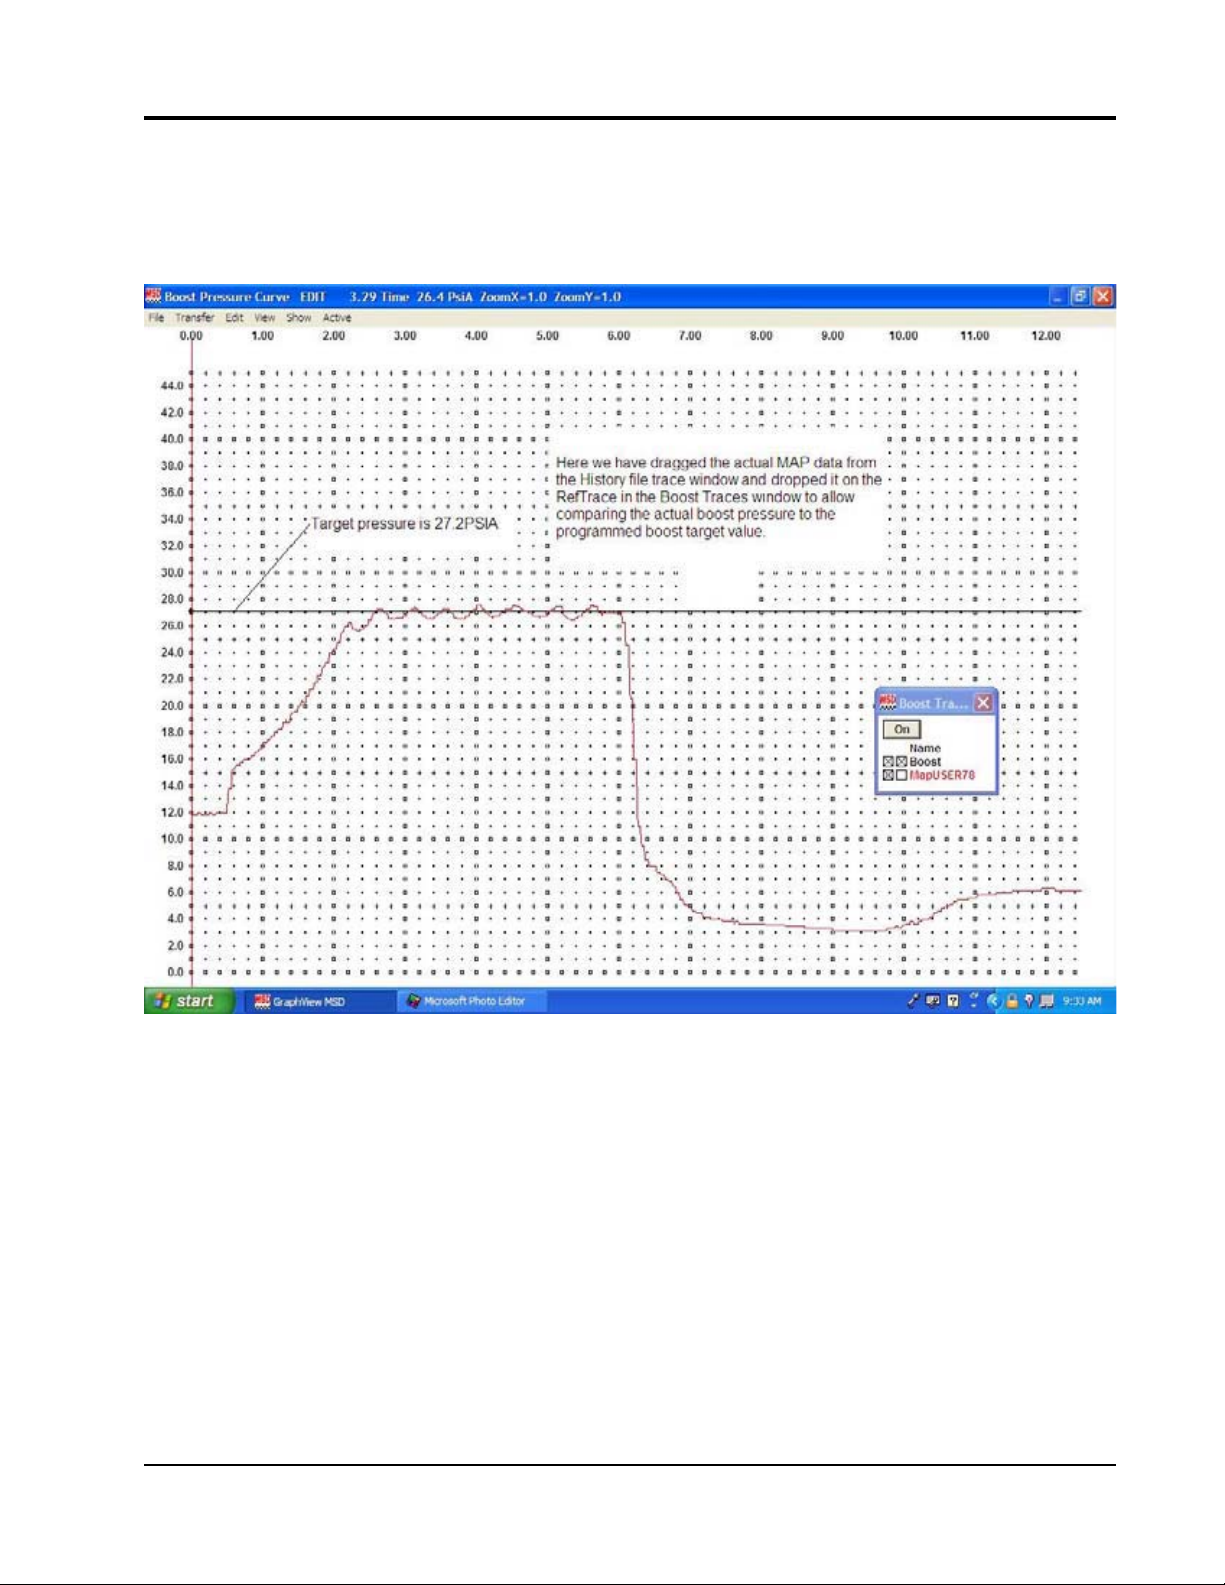
TEST EXAMPLE 5 - FIGURE 10
The MAP data trace curve can be dragged from the History Trace window into the Boost Trace
window and dropped on the RefTrace to allow analyzing or comparing the actual target pressure
curve to the measured boost value in PSIA units. Figure 10 shows the test plot of one of the near
optimum tuned PID test runs comparing the target curve to the actual test pressure.
Figure 10
MSD IGNITION • 1490 HENRY BRENNAN DR., EL PASO, TEXAS 79936 • (915) 857-5200 • FAX (915) 857-3344
Page 16

16 INSTALLATION INSTRUCTIONS
TEST EXAMPLE 6 - FIGURE 11
The next test plot was taken from a Buick Grand National on a chassis dyno. The Controller was
near optimum PID but this car had an ECU fuel problem after about 3-seconds under boost which
resulted in the engine running extremely rich and surging after about 4-seconds. The data up to
that point shows the response of the Boost Controller working very well. The boost pressure
TargetPSI was set at 14psi and the boost pressure data shows it rising quickly to about 14psi then
regulating at about 13.6psi with a very smooth PWM value slowly ramping with no saturation of the
PWM any where during boost operation.
Figure 11
MSD IGNITION • 1490 HENRY BRENNAN DR., EL PASO, TEXAS 79936 • (915) 857-5200 • FAX (915) 857-3344
Page 17

INSTALLATION INSTRUCTIONS 17
TEST EXAMPLE 7 - FIGURE 12
Figure 12 shows a high-speed test run on the chassis dyno with the target pressure set to 18psi of
boost. Here the turbo ramps the boost pressure to just under the target at 17.8PSI and then drops
slightly and continues ramping up to about 17psi at the end of the run. This car was not capable of
developing and maintaining the target pressure of 18psi on the dyno. The PWM values show that
at 4.3 seconds the waste gate was fully closed (PWM=40) and only climbed to 17psi by the end of
the run. The PID was tuned at the near optimum values on this run and if the target pressure were
set for about 17psi it would have regulated very good.
After the optimum P and D terms have been programmed, the I term can then be optimized.
Increase the I term from zero to about 10 and retest. When the P - D pressure ripple is minimized
the I term is optimum. Too much I will cause larger P - D variations with the boost pressure.
Figure 12
MSD IGNITION • 1490 HENRY BRENNAN DR., EL PASO, TEXAS 79936 • (915) 857-5200 • FAX (915) 857-3344
Page 18

18 INSTALLATION INSTRUCTIONS
TEST EXAMPLE 8 - FIGURE 13
This figure is a turbo car with a CO2 controlled waste gate, with a 16-pound spring and about 48psi
on the open side with 90psi on the spring side. This setup was for lowering the spring rate at
launch to about 10-11psi boost, but caused the waste gate to open from the exhaust pressure in
the 7,800-8,150 range when the volumetric efficiency of the engine was at its maximum. It can be
seen that the PWM value drops to near 40 when the pressure began falling but the MSD Controller
could not overcome the exhaust pressure with the combination of the open side pressure and the
spring side pressure. In this case, the spring should be replaced with a 10-pound spring and the
open side pressure lowered to about 30psi or connected to the manifold. The spring side pressure
can then be in the range of 80-90psi to keep the waste gate closed at all rpm. The PID was close to
optimum at 40-40-40 here. The D term could be lowered about 5 for better response and allow the
P to track the target better.
Figure 13
MSD IGNITION • 1490 HENRY BRENNAN DR., EL PASO, TEXAS 79936 • (915) 857-5200 • FAX (915) 857-3344
Page 19

INSTALLATION INSTRUCTIONS 19
TEST EXAMPLE 9 - FIGURE 14
In this figure we see the MAP value placed on the target pressure plot for comparison. The boost
pressure followed the target fairly close until the engine reached about 7,800 rpm. At that point, the
exhaust pressure began opening the waste gate until the RPM reached about 8,150.
Figure 14
MSD IGNITION • 1490 HENRY BRENNAN DR., EL PASO, TEXAS 79936 • (915) 857-5200 • FAX (915) 857-3344
Page 20

20 INSTALLATION INSTRUCTIONS
TEST EXAMPLE 10 - FIGURE 15
This is a Dyno run on a 287 cubic inch twin turbo motor with dual waste gates controlled with
manifold pressure. The springs gave a minimum of 18psi of boost. This shows the PID of the dyno
tuned very close and the PID of the PN 7562 very close to optimum also. Maximum boost on this
engine was about 33psi using manifold pressure for waste gate control. C
increase the boost pressure due to the high exhaust pressure making 1,650hp at 33psi. This run
produced about 1,550hp at 31psi boost.
O2 would be required to
Figure 15
MSD IGNITION • 1490 HENRY BRENNAN DR., EL PASO, TEXAS 79936 • (915) 857-5200 • FAX (915) 857-3344
Page 21

INSTALLATION INSTRUCTIONS 21
MSD IGNITION • 1490 HENRY BRENNAN DR., EL PASO, TEXAS 79936 • (915) 857-5200 • FAX (915) 857-3344
Page 22

22 INSTALLATION INSTRUCTIONS
TECH NOTES
________________________________________________________________________________________________________________________
________________________________________________________________________________________________________________________
________________________________________________________________________________________________________________________
________________________________________________________________________________________________________________________
________________________________________________________________________________________________________________________
________________________________________________________________________________________________________________________
________________________________________________________________________________________________________________________
________________________________________________________________________________________________________________________
________________________________________________________________________________________________________________________
________________________________________________________________________________________________________________________
________________________________________________________________________________________________________________________
________________________________________________________________________________________________________________________
________________________________________________________________________________________________________________________
________________________________________________________________________________________________________________________
________________________________________________________________________________________________________________________
________________________________________________________________________________________________________________________
________________________________________________________________________________________________________________________
________________________________________________________________________________________________________________________
________________________________________________________________________________________________________________________
________________________________________________________________________________________________________________________
________________________________________________________________________________________________________________________
________________________________________________________________________________________________________________________
________________________________________________________________________________________________________________________
________________________________________________________________________________________________________________________
________________________________________________________________________________________________________________________
________________________________________________________________________________________________________________________
________________________________________________________________________________________________________________________
________________________________________________________________________________________________________________________
________________________________________________________________________________________________________________________
________________________________________________________________________________________________________________________
________________________________________________________________________________________________________________________
________________________________________________________________________________________________________________________
________________________________________________________________________________________________________________________
________________________________________________________________________________________________________________________
________________________________________________________________________________________________________________________
________________________________________________________________________________________________________________________
________________________________________________________________________________________________________________________
MSD IGNITION • 1490 HENRY BRENNAN DR., EL PASO, TEXAS 79936 • (915) 857-5200 • FAX (915) 857-3344
Page 23

INSTALLATION INSTRUCTIONS 23
TECH NOTES
________________________________________________________________________________________________________________________
________________________________________________________________________________________________________________________
________________________________________________________________________________________________________________________
________________________________________________________________________________________________________________________
________________________________________________________________________________________________________________________
________________________________________________________________________________________________________________________
________________________________________________________________________________________________________________________
________________________________________________________________________________________________________________________
________________________________________________________________________________________________________________________
________________________________________________________________________________________________________________________
________________________________________________________________________________________________________________________
________________________________________________________________________________________________________________________
________________________________________________________________________________________________________________________
________________________________________________________________________________________________________________________
________________________________________________________________________________________________________________________
________________________________________________________________________________________________________________________
________________________________________________________________________________________________________________________
________________________________________________________________________________________________________________________
________________________________________________________________________________________________________________________
________________________________________________________________________________________________________________________
________________________________________________________________________________________________________________________
________________________________________________________________________________________________________________________
________________________________________________________________________________________________________________________
________________________________________________________________________________________________________________________
________________________________________________________________________________________________________________________
________________________________________________________________________________________________________________________
________________________________________________________________________________________________________________________
________________________________________________________________________________________________________________________
________________________________________________________________________________________________________________________
________________________________________________________________________________________________________________________
________________________________________________________________________________________________________________________
________________________________________________________________________________________________________________________
________________________________________________________________________________________________________________________
________________________________________________________________________________________________________________________
________________________________________________________________________________________________________________________
________________________________________________________________________________________________________________________
________________________________________________________________________________________________________________________
MSD IGNITION • 1490 HENRY BRENNAN DR., EL PASO, TEXAS 79936 • (915) 857-5200 • FAX (915) 857-3344
Page 24

TECH NOTES
________________________________________________________________________________________________________________________
________________________________________________________________________________________________________________________
________________________________________________________________________________________________________________________
________________________________________________________________________________________________________________________
________________________________________________________________________________________________________________________
________________________________________________________________________________________________________________________
________________________________________________________________________________________________________________________
________________________________________________________________________________________________________________________
________________________________________________________________________________________________________________________
________________________________________________________________________________________________________________________
________________________________________________________________________________________________________________________
________________________________________________________________________________________________________________________
________________________________________________________________________________________________________________________
________________________________________________________________________________________________________________________
________________________________________________________________________________________________________________________
________________________________________________________________________________________________________________________
Service
In case of malfunction, this MSD component will be repaired free of charge according to the terms of
the warranty. When returning MSD components for service, Proof of Purchase must be supplied for warranty
verification. After the warranty period has expired, repair service is charged based on a minimum and
maximum charge.
Send the unit prepaid with proof of purchase to the attention of: Customer Service Department, MSD
Ignition, 12120 Esther Lama, Suite 114, El Paso, Texas 79936.
When returning the unit for repair, leave all wires at the length in which you have them installed. Be sure
to include a detailed account of any problems experienced, and what components and accessories are
installed on the vehicle.
The repaired unit will be returned as soon as possible after receipt, COD for any charges. (Ground
shipping is covered by warranty). All units are returned regular UPS unless otherwise noted. For more
information, call the MSD Customer Service Line (915) 855-7123. MSD technicians are available from 8:00
a.m. to 5:00 p.m. Monday - Friday (mountain time).
Limited Warranty
M
SD IGNITION warrants MSD Ignition products to be free from defects in material and workmanship
under normal use and if properly installed for a period of one year from date of purchase. If found to be
defective as mentioned above, it will be replaced or repaired if returned prepaid along with proof of date
of purchase. This shall constitute the sole remedy of the purchaser and the sole liability of MSD Ignition. To
the extent permitted by law, the foregoing is exclusive and in lieu of all other warranties or representations
whether expressed or implied, including any implied warranty of merchantability or fitness. In no event
shall MSD Ignition be liable for special or consequential damages.
MSD IGNITION • 1490 HENRY BRENNAN DR., EL PASO, TEXAS 79936 • (915) 857-5200 • FAX (915) 857-3344
FRM25290 Created 07/04 Printed In U.S.A.
 Loading...